
Styrylpyridinium Derivatives for Fluorescent Cell Imaging

 ,
,  , , , , and
Abstract
:1. Introduction
2. Results and Discussion
2.1. Chemistry
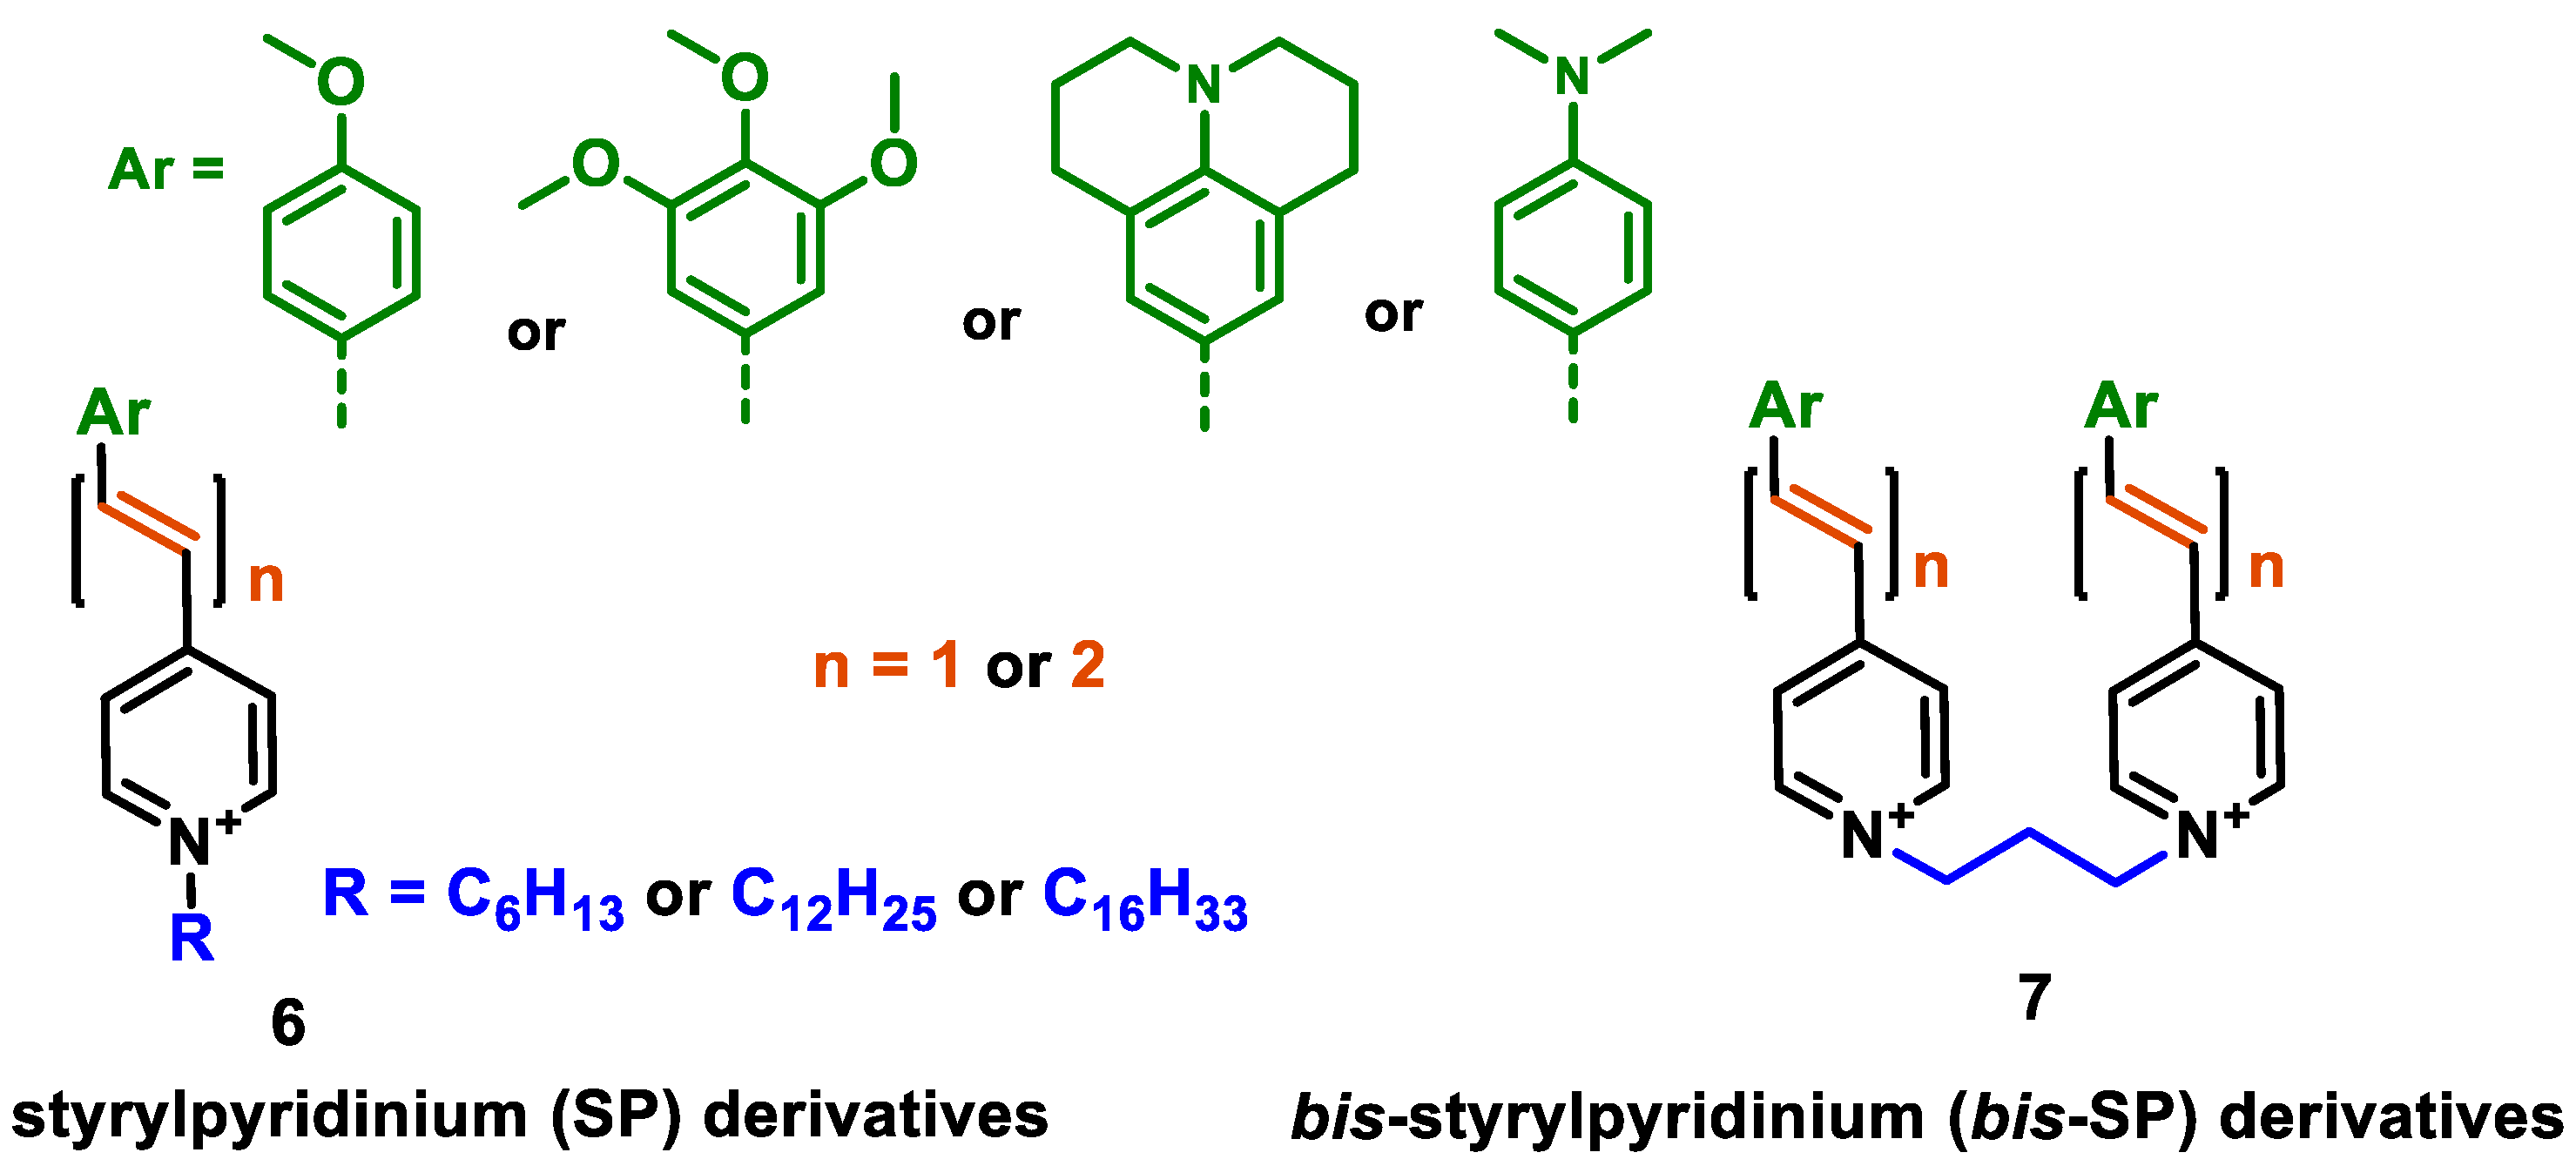
2.1.1. Design
- Modification of the electron-donating part (p-methoxyphenyl, 3,4,5-trimethoxyphenyl, p-dimethylaminophenyl or julolidine moieties);
- Modification of the conjugated linker (vinyl, divinyl);
- Modification of the electron-withdrawing N-alkylpyridinium part, introducing dodecyl or hexadecyl chains;
- Geminal or bis-SP derivatives with two styrylpyridinium moieties that are conjugated through the 1,3-trimethylene (propane) unit.
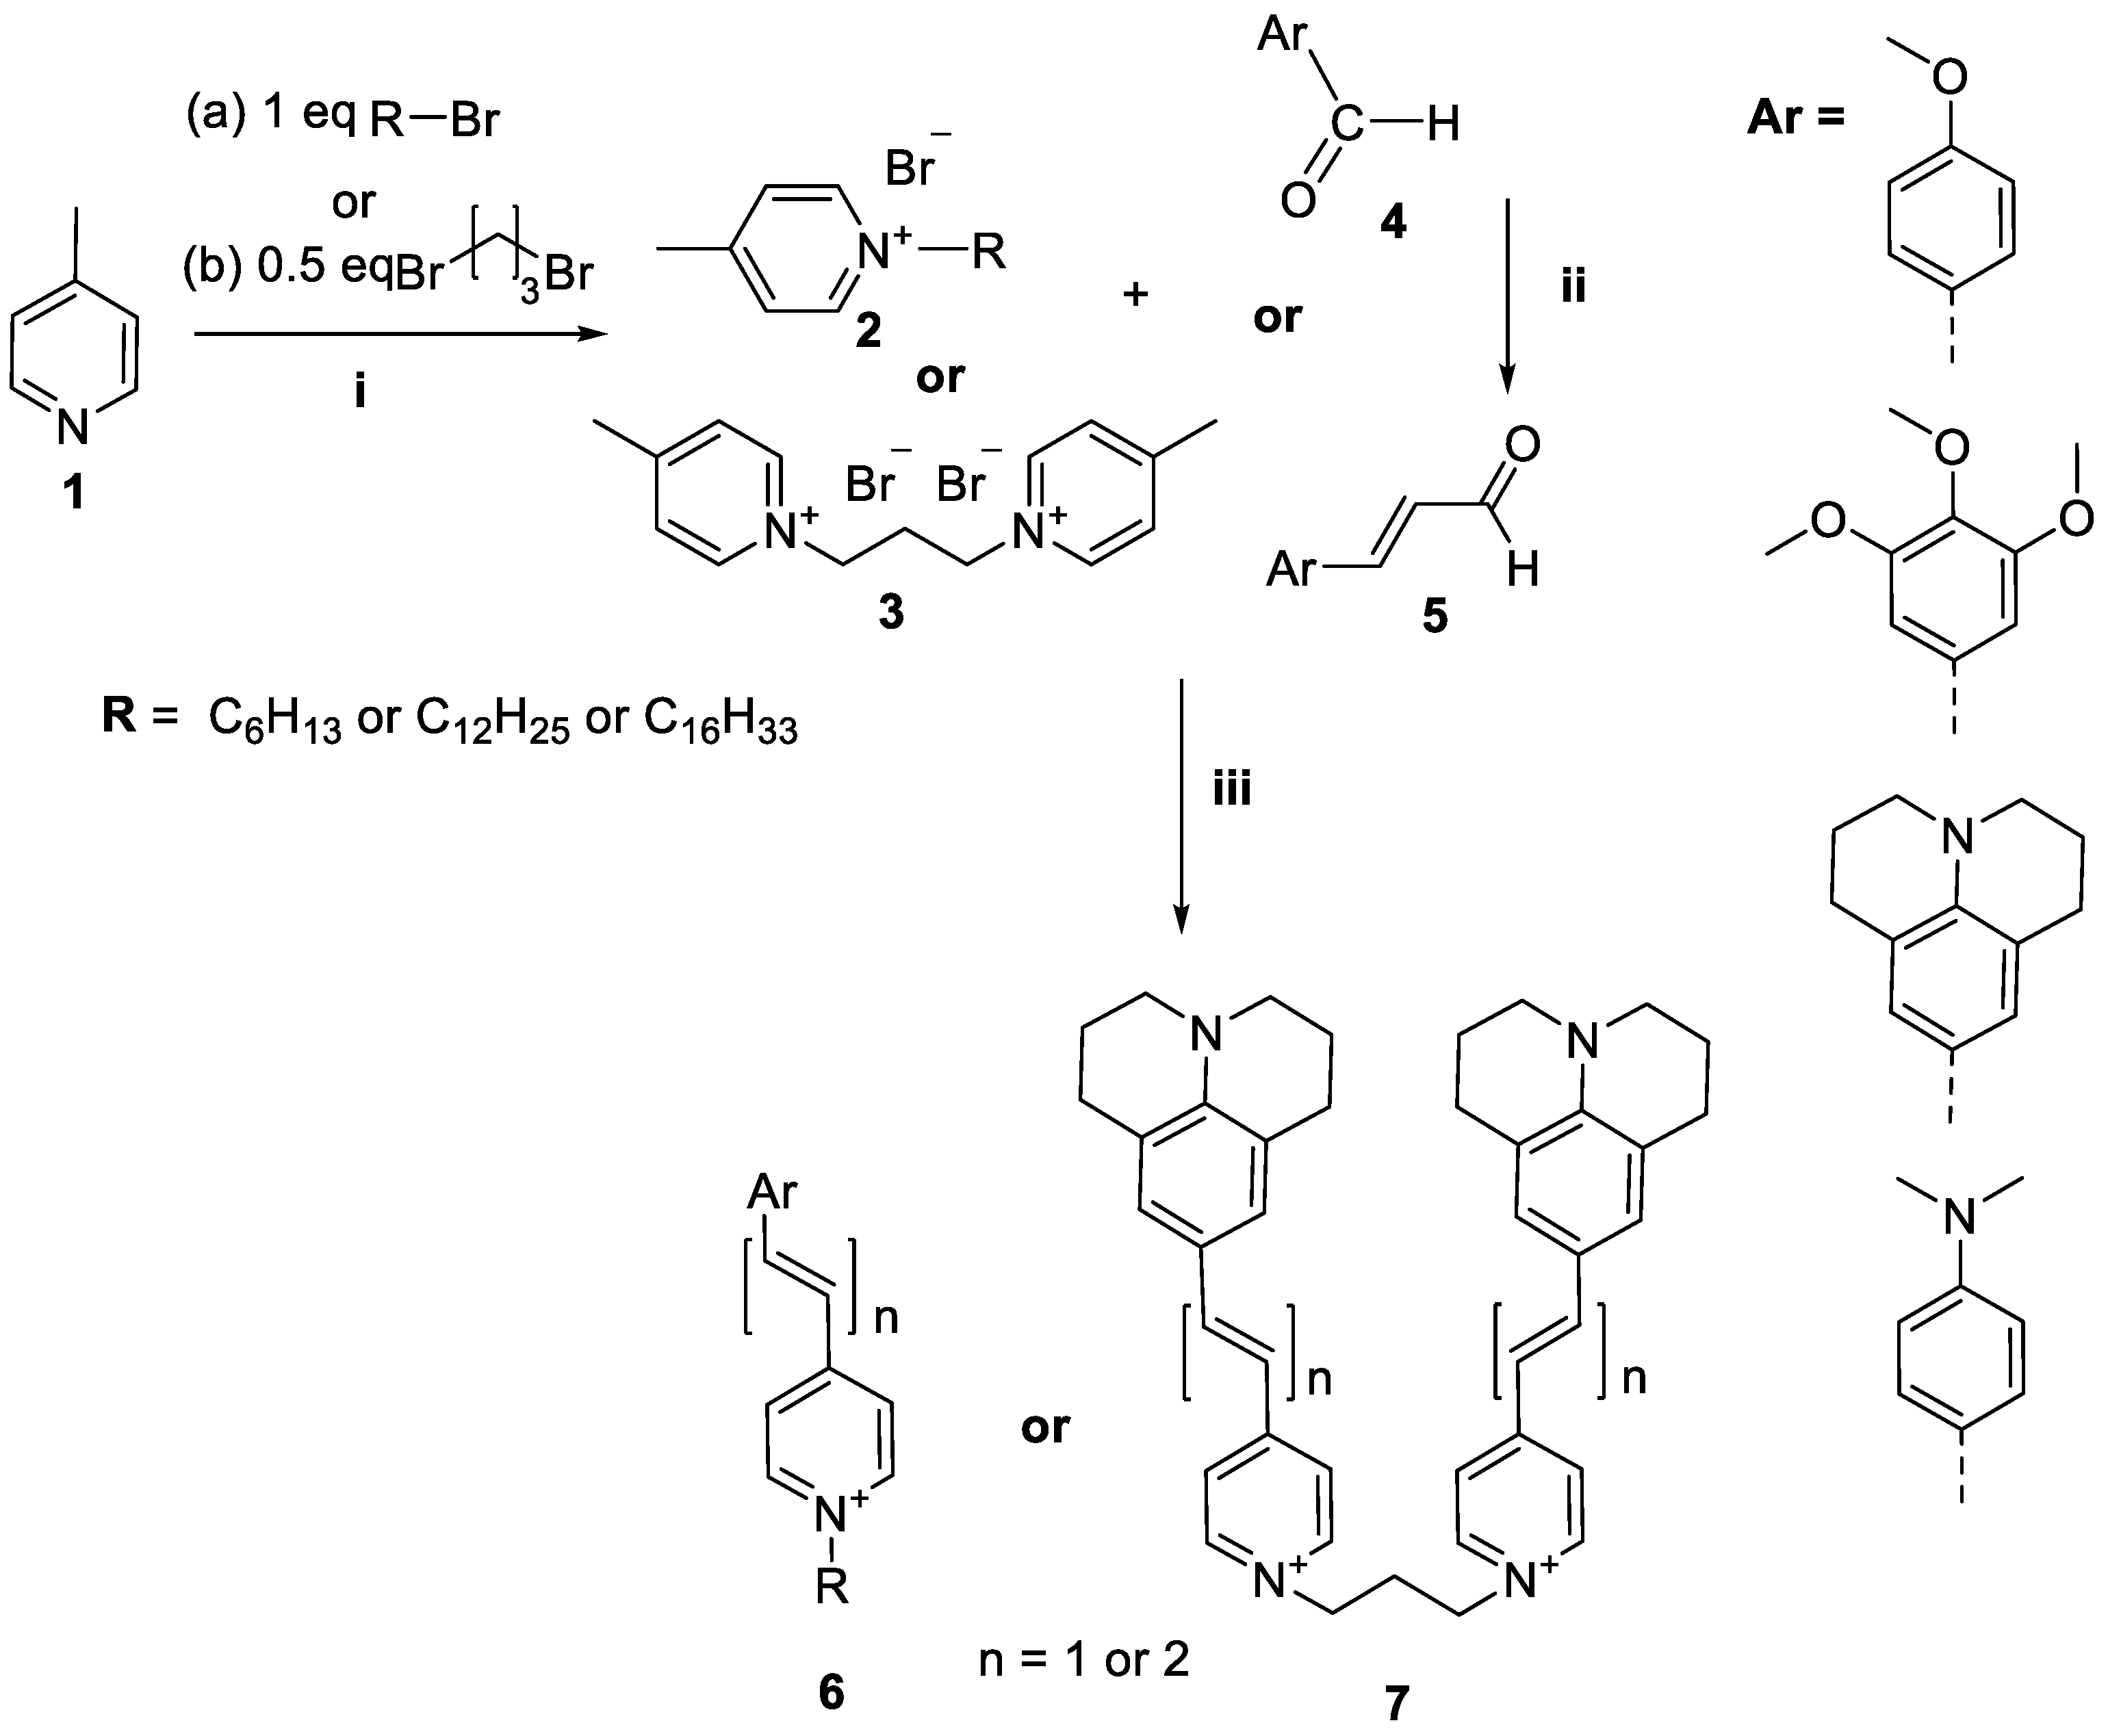
2.1.2. Synthesis-Modified Conjugated Chain (Incorporating One or Two Vinyl Groups)
2.2. Cytotoxicity
2.2.1. The Effect of Alkyl Chain Length
2.2.2. The Effect of the Electron-Donating (Ar) Group
2.2.3. The Effect on Different Cell Lines
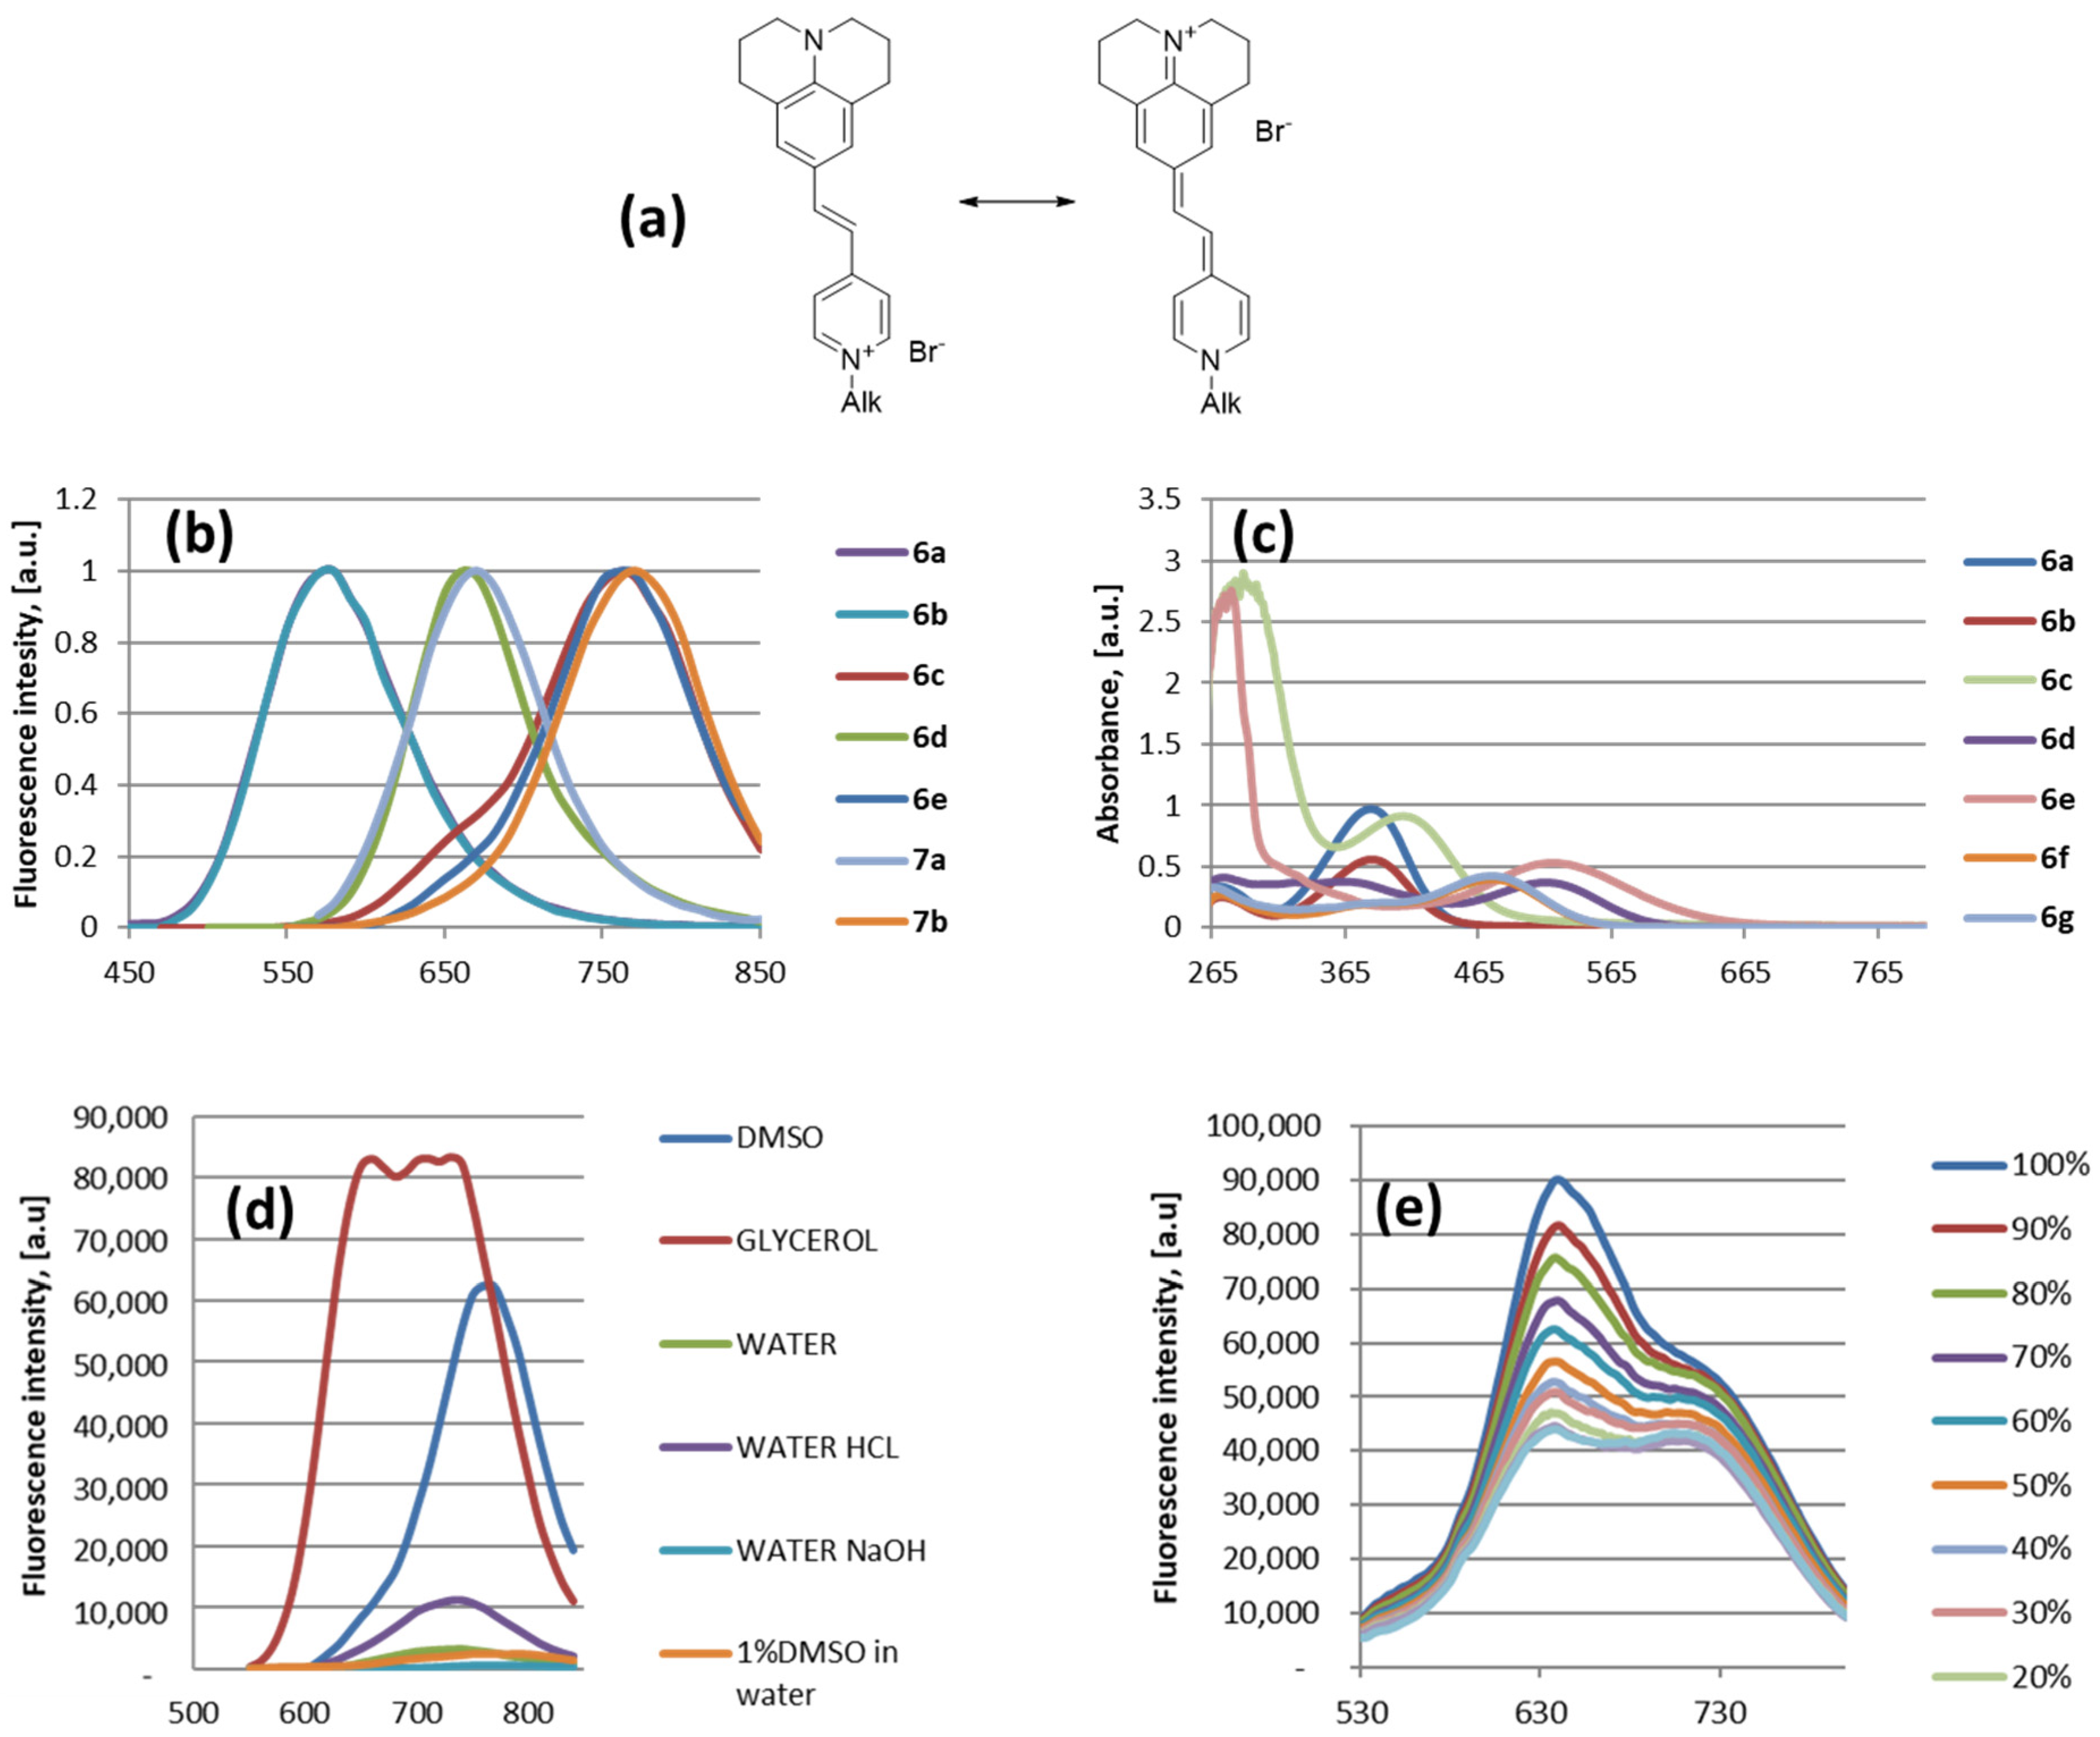
2.3. Fluorescence
2.4. Self-Assembling Properties
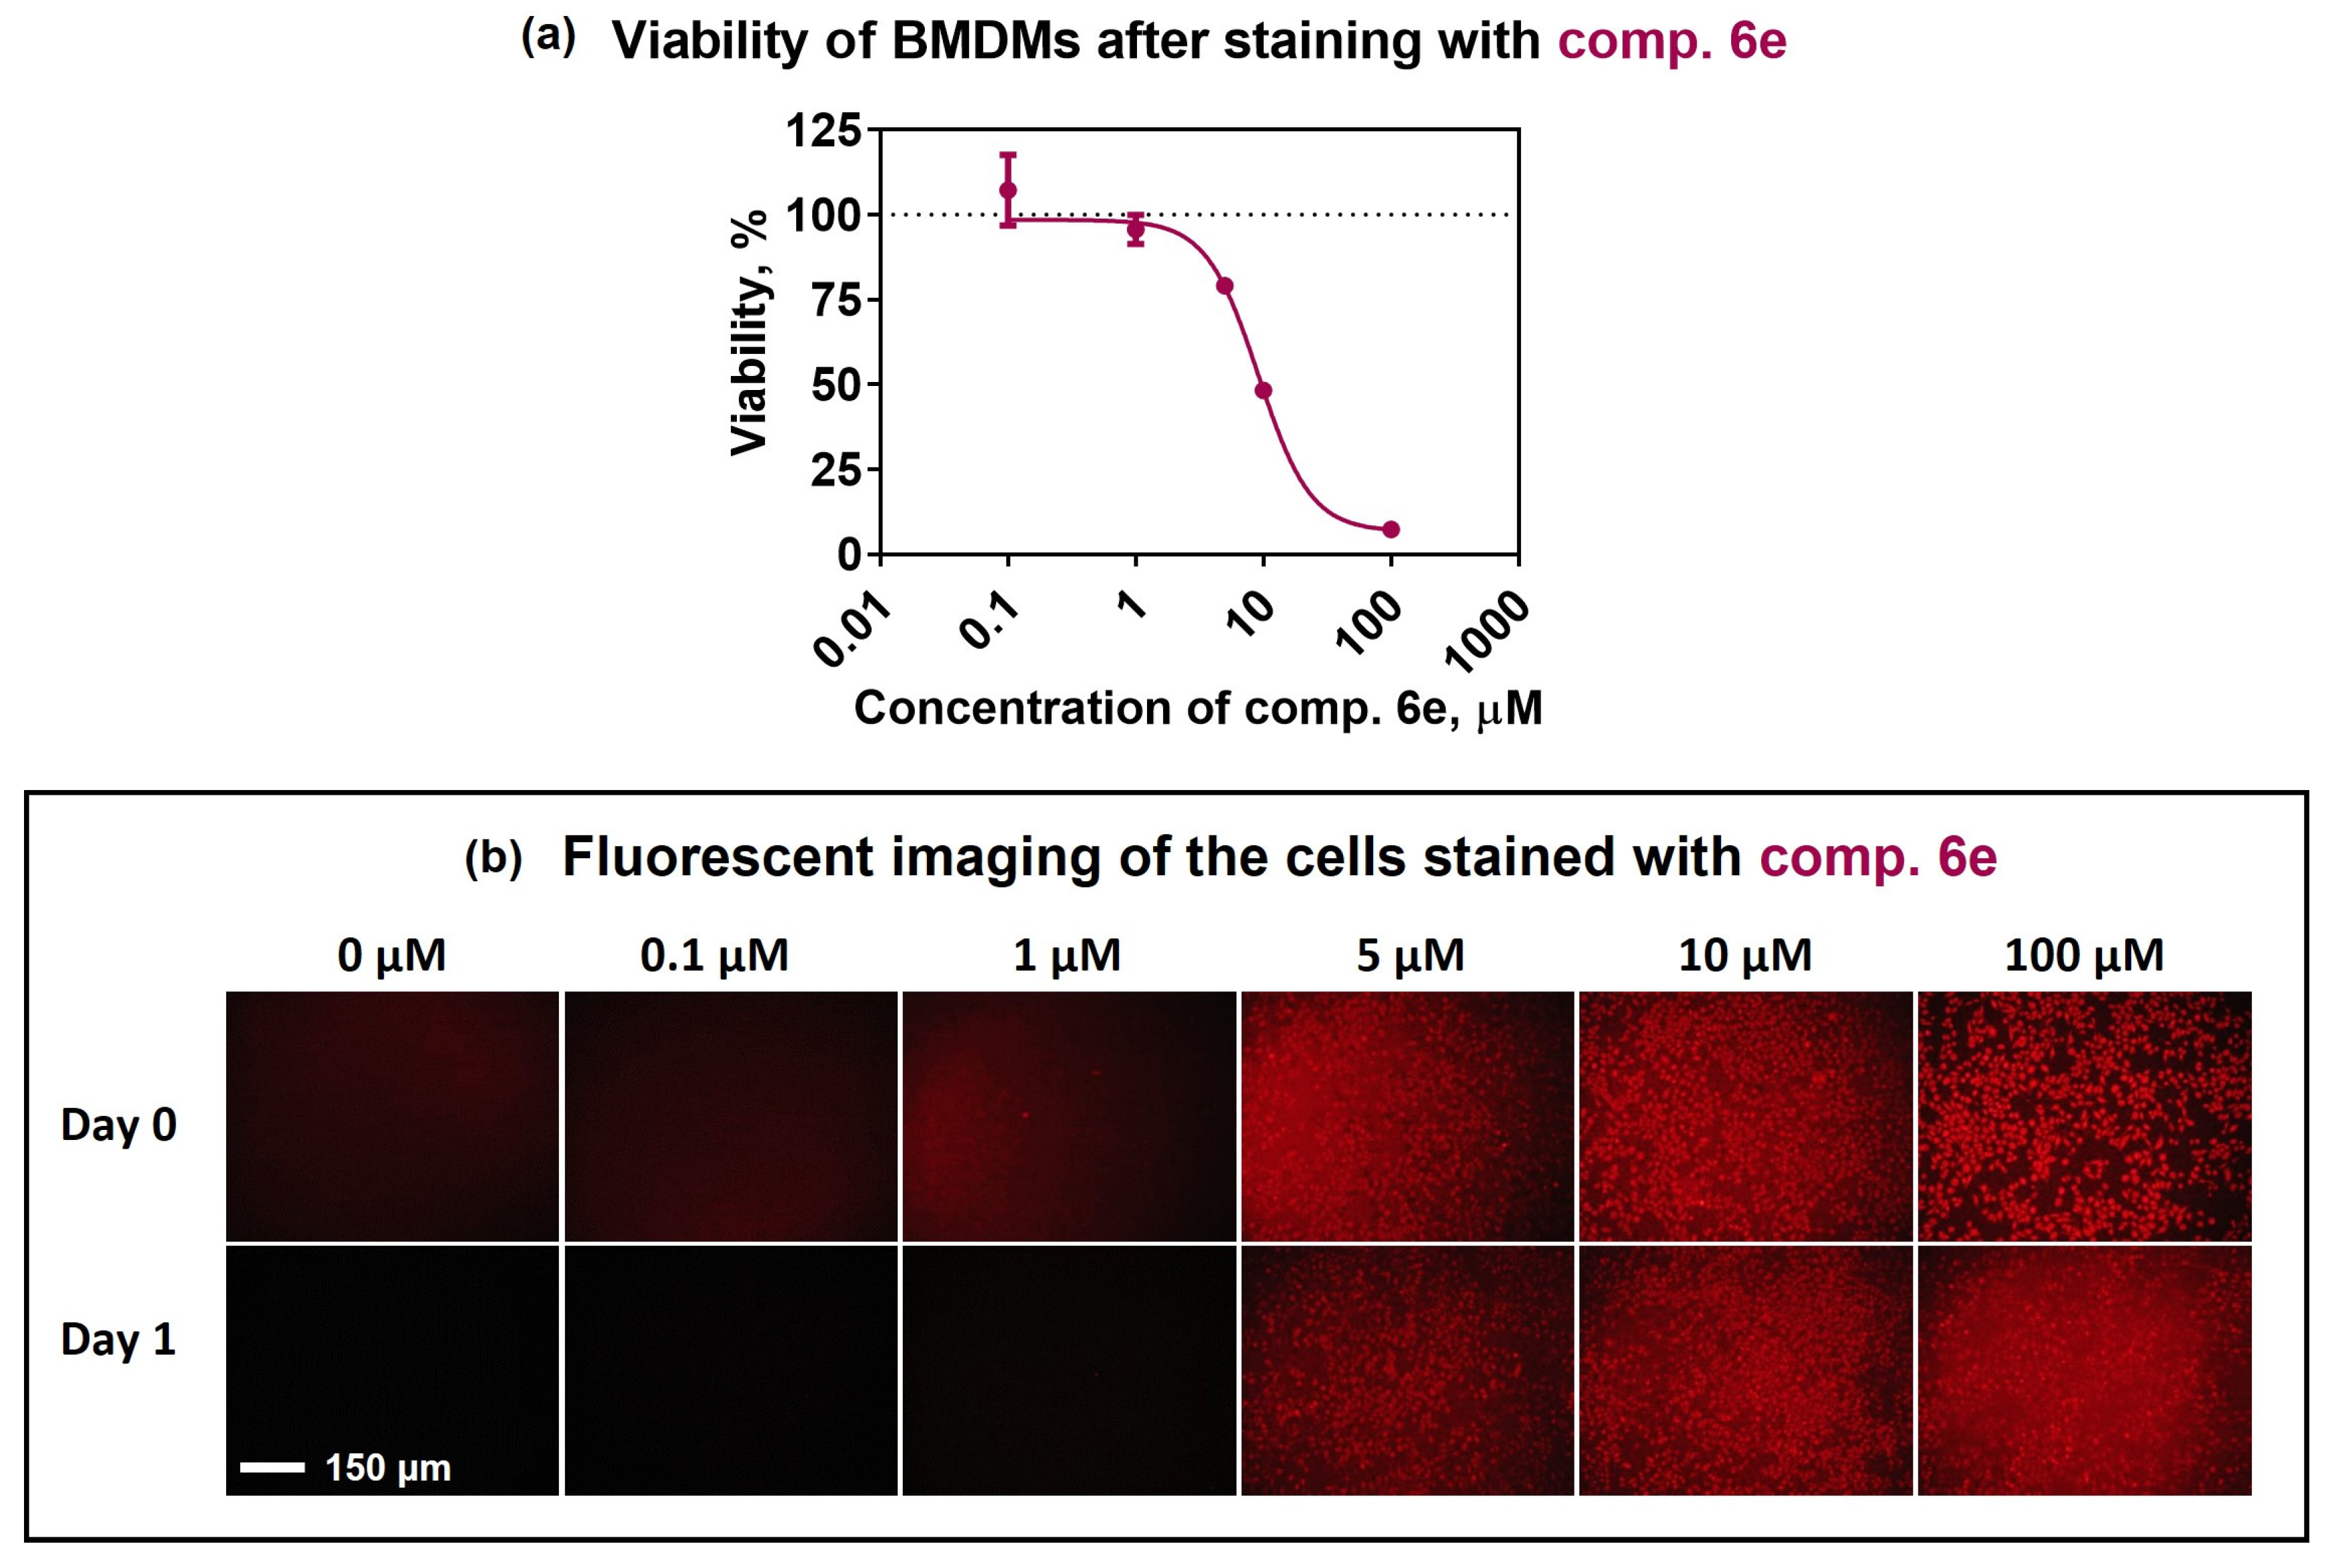
2.5. SP Compound 6e for Cell Staining
2.6. Staining of Primary Cells
3. Materials and Methods
3.1. Chemistry
3.2. Cell Culture and Measurement of Cell Viability
3.3. Evaluation of Basal Cytotoxicity
3.4. Estimation of LD50 from IC50 Values
3.5. Excitation/Emission Fluorescence Spectra Measurements
3.6. Assessment of the Self-Assembling Properties of Compounds 6 and 7 Using Dynamic Light Scattering (DLS) Measurements
3.7. Stability of Dye during Cell Washing Steps
3.8. Cell Passaging Assay
3.9. Isolation of Bone-Marrow-Derived Macrophages (BMDMs)
3.10. BMDMs’ Viability Assay
3.11. Staining of Macrophages with SP Compound 6e
3.12. Polarisation of Pre-Stained Macrophages to M1 Phenotype
3.13. BMDM Co-Cultivation with Cancer Cells
3.14. Statistical Analysis
4. Concluding Remarks
Supplementary Materials
Author Contributions
Funding
Institutional Review Board Statement
Informed Consent Statement
Data Availability Statement
Acknowledgments
Conflicts of Interest
References
- Bhurta, D.; Bharate, S.B. Styryl Group, a Friend or Foe in Medicinal Chemistry. ChemMedChem 2022, 17, e202100706. [Google Scholar] [CrossRef]
- Ulrik, C.S.; Lange, P. Targeting small airways in asthma: Improvement in clinical benefit? Clin. Respir. J. 2011, 5, 125–130. [Google Scholar] [CrossRef] [PubMed]
- Putra, A.U.; Çakmaz, D.; Seferoǧlu, N.; Barsella, A.; Seferoǧlu, Z. Styryl-based new organic chromophores bearing free amino and azomethine groups: Synthesis, photophysical, NLO, and thermal properties. Beilstein J. Org. Chem. 2020, 16, 2282–2296. [Google Scholar] [CrossRef]
- Zhang, L.X.; Li, C.X.; Kakar, M.U.; Khan, M.S.; Wu, P.F.; Amir, R.M.; Dai, D.F.; Naveed, M.; Li, Q.Y.; Saeed, M.; et al. Resveratrol (RV): A pharmacological review and call for further research. Biomed. Pharmacother. 2021, 143, 112164. [Google Scholar] [CrossRef]
- Hewlings, S.J.; Kalman, D.S. Curcumin: A review of its effects on human health. Foods 2017, 6, 92. [Google Scholar] [CrossRef] [PubMed]
- Dubur, G.Y.; Dobretsov, G.E.; Deme, A.K.; Dubure, R.R.; Lapshin, E.N.; Spirin, M.M. Fluorescent probes based on styrylpyridinium derivatives: Optical properties and membrane binding. J. Biochem. Biophys. Methods 1984, 10, 123–134. [Google Scholar] [CrossRef]
- Xu, X.; Sun, Z.; Fan, K.; Jiang, Y.; Huang, R.; Wen, Y.; He, Q.; Ao, T. Conversion of 4-N,N-dimethylamino-4′-N′-methyl-stilbazolium tosylate (DAST) from a Simple Optical Material to a Versatile Optoelectronic Material. Sci. Rep. 2015, 5, 12269. [Google Scholar] [CrossRef] [PubMed]
- Vaitkienė, S.; Kuliešienė, N.; Sakalauskaitė, S.; Bekere, L.; Krasnova, L.; Vigante, B.; Duburs, G.; Daugelavičius, R. Antifungal activity of styrylpyridinium compounds against Candida albicans. Chem. Biol. Drug Des. 2021, 97, 253–265. [Google Scholar] [CrossRef]
- Vaitkienė, S.; Daugelavičius, R.; Sychrová, H.; Kodedová, M. Styrylpyridinium Derivatives as New Potent Antifungal Drugs and Fluorescence Probes. Front. Microbiol. 2020, 11, 2077. [Google Scholar] [CrossRef]
- Panchenko, P.A.; Efremenko, A.V.; Feofanov, A.V.; Ustimova, M.A.; Fedorov, Y.V.; Fedorova, O.A. Ratiometric detection of mercury (Ii) ions in living cells using fluorescent probe based on bis(styryl) dye and azadithia-15-crown-5 ether receptor. Sensors 2021, 21, 470. [Google Scholar] [CrossRef]
- Ma, B.; Tian, D.H.; Yan, S.; Li, X.C.; Dai, F.; Zhou, B. Developing a styrylpyridinium-based fluorescent probe with excellent sensitivity for visualizing basal H2S levels in mitochondria. Sens. Actuators B Chem. 2021, 327, 128937. [Google Scholar] [CrossRef]
- Wangngae, S.; Ngivprom, U.; Khrootkaew, T.; Worakaensai, S.; Lai, R.Y.; Kamkaew, A. Cationic styryl dyes for DNA labelling and selectivity toward cancer cells and Gram-negative bacteria. RSC Adv. 2023, 13, 2115–2122. [Google Scholar] [CrossRef] [PubMed]
- Abeywickrama, C.S.; Wijesinghe, K.J.; Stahelin, R.V.; Pang, Y. Bright red-emitting pyrene derivatives with a large Stokes shift for nucleus staining. Chem. Commun. 2017, 53, 5886–5889. [Google Scholar] [CrossRef] [PubMed]
- Abeywickrama, C.S.; Pang, Y. Synthesis of a bis[2-(2′-hydroxyphenyl)benzoxazole]pyridinium derivative: The fluoride-induced large spectral shift for ratiometric response. New J. Chem. 2021, 45, 9102–9108. [Google Scholar] [CrossRef]
- Peng, L.; Domanov, Y.; Ioffe, V.; Finashin, A.; Gorbenko, G. Interaction of a series of fluorescent probes with glucose oxidase. J. Biol. Phys. Chem. 2006, 6, 77–81. [Google Scholar]
- Matsui, M.; Ooiwa, K.; Okada, A.; Kubota, Y.; Funabiki, K.; Sato, H. Solid-state fluorescence of pyridinium styryl dyes. Dye. Pigment. 2013, 99, 916–923. [Google Scholar] [CrossRef]
- Padalkar, V.S.; Patil, V.S.; Sekar, N. Synthesis and photo-physical properties of fluorescent 1,3,5-triazine styryl derivatives. Chem. Cent. J. 2011, 5, 77. [Google Scholar] [CrossRef]
- Cesaretti, A.; Foggi, P.; Fortuna, C.G.; Elisei, F.; Spalletti, A.; Carlotti, B. Uncovering Structure-Property Relationships in Push-Pull Chromophores: A Promising Route to Large Hyperpolarizability and Two-Photon Absorption. J. Phys. Chem. C 2020, 124, 15739–15748. [Google Scholar] [CrossRef]
- Mencaroni, L.; Cesaretti, A.; Carlotti, B.; Alebardi, M.; Elisei, F.; Ratković, A.; Škorić, I.; Spalletti, A. Tuning the Photophysics of Two-Arm Bis[(dimethylamino)styryl]benzene Derivatives by Heterocyclic Substitution. Molecules 2022, 27, 8725. [Google Scholar] [CrossRef]
- Rucins, M.; Kaukulis, M.; Plotniece, A.; Pajuste, K.; Pikun, N.; Sobolev, A. 1,1′-{[3,5-Bis(dodecyloxycarbonyl)-4-(naphthalen-2-yl)-1,4-dihydropyridine-2,6-diyl]bis(methylene)}bis{4-[(E)-2-(naphthalen-2-yl)vinyl]pyridin-1-ium}dibromide. Molbank 2022, 2022, M1396. [Google Scholar] [CrossRef]
- Xia, Z.; Guo, X.; Zhu, Y.; Wang, Y.; Wang, J. A julolidine-fused anthracene derivative: Synthesis, photophysical properties, and oxidative dimerization. RSC Adv. 2018, 8, 13588–13591. [Google Scholar] [CrossRef] [PubMed]
- Varejão, J.O.S.; Varejão, E.V.V.; Fernandes, S.A. Synthesis and Derivatization of Julolidine: A Powerful Heterocyclic Structure. Eur. J. Org. Chem. 2019, 2019, 4273–4310. [Google Scholar] [CrossRef]
- Enoki, T.; Matsuo, K.; Ohshita, J.; Ooyama, Y. Synthesis and optical and electrochemical properties of julolidine-structured pyrido[3,4-b] indole dye. Phys. Chem. Chem. Physic 2017, 19, 3565–3574. [Google Scholar] [CrossRef] [PubMed]
- Wyrzykiewicz, E.; Wendzonka, M.; Kedzia, B. Synthesis and antimicrobial activity of new (E)-4-[piperidino (4′-methylpiperidino-, morpholino-) N-alkoxy]stilbenes. Eur. J. Med. Chem. 2006, 41, 519–525. [Google Scholar] [CrossRef]
- Wyrzykiewicz, E.; Prukała, W.; Kedzia, B. Synthesis and antimicrobial properties of N-substituted derivatives of (E)-alpha-(or gamma)-azastilbenols. Farmaco 1994, 49, 127–131. [Google Scholar]
- Kluska, M.; Krajewska, E.; Jabłońska, J.; Prukała, W. New Applications and Analysis of (E)-Azastilbenes in Environmental Samples. Crit. Rev. Anal. Chem. 2019, 49, 395–402. [Google Scholar] [CrossRef]
- Vaitkienė, S.; Bekere, L.; Duburs, G.; Daugelavičius, R. Interaction of styrylpyridinium compound with pathogenic candida albicans yeasts and human embryonic kidney hek-293 cells. Microorganisms 2021, 9, 48. [Google Scholar] [CrossRef]
- Dumat, B.; Bordeau, G.; Aranda, A.I.; Mahuteau-Betzer, F.; El Harfouch, Y.; Metgé, G.; Charra, F.; Fiorini-Debuisschert, C.; Teulade-Fichou, M.P. Vinyl-triphenylamine dyes, a new family of switchable fluorescent probes for targeted two-photon cellular imaging: From DNA to protein labeling. Org. Biomol. Chem. 2012, 10, 6054–6061. [Google Scholar] [CrossRef]
- Berdnikova, D.V.; Sosnin, N.I.; Fedorova, O.A.; Ihmels, H. Governing the DNA-binding mode of styryl dyes by the length of their alkyl substituents-from intercalation to major groove binding. Org. Biomol. Chem. 2018, 16, 545–554. [Google Scholar] [CrossRef]
- Yeo, S.J.; Cuc, B.T.; Kim, S.A.; Kim, D.T.H.; Bao, D.T.; Tien, T.T.T.; Anh, N.T.V.; Choi, D.Y.; Chong, C.K.; Kim, H.S.; et al. Rapid detection of avian influenza A virus by immunochromatographic test using a novel fluorescent dye. Biosens. Bioelectron. 2017, 94, 677–685. [Google Scholar] [CrossRef]
- Sehlangia, S.; Nayak, N.; Garg, N.; Pradeep, C.P. Substituent-Controlled Structural, Supramolecular, and Cytotoxic Properties of a Series of 2-Styryl-8-nitro and 2-Styryl-8-hydroxy Quinolines. ACS Omega 2022, 7, 24838–24850. [Google Scholar] [CrossRef] [PubMed]
- Davis, T.J.; Soto-Ortega, D.D.; Kotarek, J.A.; Gonzalez-Velasquez, F.J.; Sivakumar, K.; Wu, L.; Wang, Q.; Moss, M.A. Comparative study of inhibition at multiple stages of amyloid-β self-assembly provides mechanistic insight. Mol. Pharmacol. 2009, 76, 405–413. [Google Scholar] [CrossRef]
- Cueto-Díaz, E.J.; Ebiloma, G.U.; Alfayez, I.A.; Ungogo, M.A.; Lemgruber, L.; González-García, M.C.; Giron, M.D.; Salto, R.; Fueyo-González, F.J.; Shiba, T.; et al. Synthesis, biological, and photophysical studies of molecular rotor-based fluorescent inhibitors of the trypanosome alternative oxidase. Eur. J. Med. Chem. 2021, 220, 113470. [Google Scholar] [CrossRef]
- Etrych, T.; Janoušková, O.; Chytil, P. Fluorescence imaging as a tool in preclinical evaluation of polymer-based nano-DDS systems intended for cancer treatment. Pharmaceutics 2019, 11, 471. [Google Scholar] [CrossRef]
- Perrin, J.; Capitao, M.; Mougin-Degraef, M.; Guérard, F.; Faivre-Chauvet, A.; Rbah-Vidal, L.; Gaschet, J.; Guilloux, Y.; Kraeber-Bodéré, F.; Chérel, M.; et al. Cell Tracking in Cancer Immunotherapy. Front. Med. 2020, 7, 458234. [Google Scholar] [CrossRef]
- Fukushima, H.; Matikonda, S.S.; Usama, S.M.; Furusawa, A.; Kato, T.; Štacková, L.; Klán, P.; Kobayashi, H.; Schnermann, M.J. Cyanine Phototruncation Enables Spatiotemporal Cell Labeling. J. Am. Chem. Soc. 2022, 144, 11075–11080. [Google Scholar] [CrossRef]
- Trofimova, O.; Korotkaja, K.; Skrastina, D.; Jansons, J.; Spunde, K.; Isaguliants, M.; Zajakina, A.; Tripp, R.A. Alphavirus-Driven Interferon Gamma (IFNg) Expression Inhibits Tumor Growth in Orthotopic 4T1 Breast Cancer Model. Vaccines 2021, 9, 1247. [Google Scholar] [CrossRef] [PubMed]
- Stöter, M.; Biersack, B.; Reimer, N.; Herling, M.; Stock, N.; Schobert, R.; Breu, J. Ordered heterostructures of two strictly alternating types of nanoreactors. Chem. Mater. 2014, 26, 5412–5419. [Google Scholar] [CrossRef]
- Guo, L.; Li, C.; Shang, H.; Zhang, R.; Li, X.; Lu, Q.; Cheng, X.; Liu, Z.; Sun, J.Z.; Yu, X. A side-chain engineering strategy for constructing fluorescent dyes with direct and ultrafast self-delivery to living cells. Chem. Sci. 2020, 11, 661–670. [Google Scholar] [CrossRef]
- Jedrzejewska, B.; Kabatc, J.; Ośmiałowski, B.; Paczkowski, J. Bischromophoric styrylpyridinium dyes. Spectroscopic properties of 1,3-bis-[4-(p-N,N-dialkylaminostyryl)pyridinyl]propane dibromides. Spectrochim. Acta Part A Mol. Biomol. Spectrosc. 2007, 67, 306–315. [Google Scholar] [CrossRef]
- Skrzydlewski, P.; Twarużek, M.; Grajewski, J. Cytotoxicity of Mycotoxins and Their Combinations on Different Cell Lines: A Review. Toxins 2022, 14, 244. [Google Scholar] [CrossRef]
- Kritis, A.A.; Stamoula, E.G.; Paniskaki, K.A.; Vavilis, T.D. Researching glutamate—Induced cytotoxicity in different cell lines: A comparative/collective analysis/study. Front. Cell. Neurosci. 2015, 9, 131867. [Google Scholar] [CrossRef]
- Sharmin, S.; Rahaman, M.M.; Martorell, M.; Sastre-Serra, J.; Sharifi-Rad, J.; Butnariu, M.; Bagiu, I.C.; Bagiu, R.V.; Islam, M.T. Cytotoxicity of synthetic derivatives against breast cancer and multi-drug resistant breast cancer cell lines: A literature-based perspective study. Cancer Cell Int. 2021, 21, 612. [Google Scholar] [CrossRef] [PubMed]
- Jabłoństski, A. Efficiency of anti-stokes fluorescence in dyes. Nature 1933, 131, 839–840. [Google Scholar] [CrossRef]
- Maillard, J.; Klehs, K.; Rumble, C.; Vauthey, E.; Heilemann, M.; Fürstenberg, A. Universal quenching of common fluorescent probes by water and alcohols. Chem. Sci. 2021, 12, 1352–1362. [Google Scholar] [CrossRef]
- Dahal, D.; Ojha, K.R.; Pokhrel, S.; Paruchuri, S.; Konopka, M.; Liu, Q.; Pang, Y. NIR-emitting styryl dyes with large Stokes’ shifts for imaging application: From cellular plasma membrane, mitochondria to zebrafish neuromast. Dye. Pigment. 2021, 194, 109629. [Google Scholar] [CrossRef] [PubMed]
- Collot, M.; Boutant, E.; Fam, K.T.; Danglot, L.; Klymchenko, A.S. Molecular Tuning of Styryl Dyes Leads to Versatile and Efficient Plasma Membrane Probes for Cell and Tissue Imaging. Bioconjug. Chem. 2020, 31, 875–883. [Google Scholar] [CrossRef]
- Abeywickrama, C.S.; Bertman, K.A.; Mcdonald, L.J.; Alexander, N.; Dahal, D.; Baumann, H.J.; Salmon, C.R.; Wesdemiotis, C.; Konopka, M.; Tessier, C.A.; et al. Synthesis of highly selective lysosomal markers by coupling 2-(2′-hydroxyphenyl)benzothiazole (HBT) with benzothiazolium cyanine (Cy): The impact of substituents on selectivity and optical properties. J. Mater. Chem. B 2019, 7, 7502–7514. [Google Scholar] [CrossRef]
- Abeywickrama, C.S.; Wijesinghe, K.J.; Plescia, C.B.; Fisher, L.S.; Goodson, T.; Stahelin, R.V.; Pang, Y. A pyrene-based two-photon excitable fluorescent probe to visualize nuclei in live cells. Photochem. Photobiol. Sci. 2020, 19, 1152–1159. [Google Scholar] [CrossRef] [PubMed]
- Abeywickrama, C.S.; Baumann, H.J.; Alexander, N.; Shriver, L.P.; Konopka, M.; Pang, Y. NIR-emitting benzothiazolium cyanines with an enhanced stokes shift for mitochondria imaging in live cells. Org. Biomol. Chem. 2018, 16, 3382–3388. [Google Scholar] [CrossRef]
- Charcosset, C.; Juban, A.; Valour, J.P.; Urbaniak, S.; Fessi, H. Preparation of liposomes at large scale using the ethanol injection method: Effect of scale-up and injection devices. Chem. Eng. Res. Des. 2015, 94, 508–515. [Google Scholar] [CrossRef]
- Krapivina, A.; Lacis, D.; Rucins, M.; Plotniece, M.; Pajuste, K.; Sobolev, A.; Plotniece, A. Synthesis and Characterization of Novel Amphiphilic N-Benzyl 1,4-Dihydropyridine Derivatives—Evaluation of Lipid Monolayer and Self-Assembling Properties. Materials 2023, 16, 4206. [Google Scholar] [CrossRef] [PubMed]
- Ozolins, R.; Plotniece, M.; Pajuste, K.; Putralis, R.; Pikun, N.; Sobolev, A.; Plotniece, A.; Rucins, M. 1,1′-{[3,5-Bis((dodecyloxycarbonyl)-4-phenyl-1,4-dihydropyridine-2,6-diyl]bis(methylene)}bis[4-(anthracen-9-yl)pyridin-1-ium] Dibromide. Molbank 2022, 2022, M1438. [Google Scholar] [CrossRef]
- Singh, H.; Sareen, D.; Sharma, S.; Kim, J.S.; Sharma, A. Molecular Theranostics for Cancer Therapy. In Nanoengineering of Biomaterials; John Wiley & Sons, Ltd.: Hoboken, NJ, USA, 2022; pp. 181–214. [Google Scholar]
- He, H.; Zhang, X.; Du, L.; Ye, M.; Lu, Y.; Xue, J.; Wu, J.; Shuai, X. Molecular imaging nanoprobes for theranostic applications. Adv. Drug Deliv. Rev. 2022, 186, 114320. [Google Scholar] [CrossRef]
- Zhang, J.; Ning, L.; Huang, J.; Zhang, C.; Pu, K. Activatable molecular agents for cancer theranostics. Chem. Sci. 2020, 11, 618–630. [Google Scholar] [CrossRef] [PubMed]
- Liu, Z.; Song, F.; Shi, W.; Gurzadyan, G.; Yin, H.; Song, B.; Liang, R.; Peng, X. Nitroreductase-Activatable Theranostic Molecules with High PDT Efficiency under Mild Hypoxia Based on a TADF Fluorescein Derivative. ACS Appl. Mater. Interfaces 2019, 11, 15426–15435. [Google Scholar] [CrossRef]
- Koo, S.; Bobba, K.N.; Cho, M.Y.; Park, H.S.; Won, M.; Velusamy, N.; Hong, K.S.; Bhuniya, S.; Kim, J.S. Molecular Theranostic Agent with Programmed Activation for Hypoxic Tumors. ACS Appl. Bio Mater. 2019, 2, 4648–4655. [Google Scholar] [CrossRef] [PubMed]
- Petrichenko, O.; Rucins, M.; Vezane, A.; Timofejeva, I.; Sobolev, A.; Cekavicus, B.; Pajuste, K.; Plotniece, M.; Gosteva, M.; Kozlovska, T.; et al. Studies of the physicochemical and structural properties of self-assembling cationic pyridine derivatives as gene delivery agents. Chem. Phys. Lipids 2015, 191, 25–37. [Google Scholar] [CrossRef] [PubMed]
- Vasilevska, J.; De Souza, G.A.; Stensland, M.; Skrastina, D.; Zhulenvovs, D.; Paplausks, R.; Kurena, B.; Kozlovska, T.; Zajakina, A. Comparative protein profiling of B16 mouse melanoma cells susceptible and non-susceptible to alphavirus infection: Effect of the tumor microenvironment. Cancer Biol. Ther. 2016, 17, 1035–1050. [Google Scholar] [CrossRef]
- Zajakina, A.; Vasilevska, J.; Zhulenkovs, D.; Skrastina, D.; Spaks, A.; Plotniece, A.; Kozlovska, T. High efficiency of alphaviral gene transfer in combination with 5-fluorouracil in a mouse mammary tumor model. BMC Cancer 2014, 14, 460. [Google Scholar] [CrossRef]
- Chen, S.; Saeed, A.F.U.H.; Liu, Q.; Jiang, Q.; Xu, H.; Xiao, G.G.; Rao, L.; Duo, Y. Macrophages in immunoregulation and therapeutics. Signal Transduct. Target. Ther. 2023, 8, 207. [Google Scholar] [CrossRef]
- Spunde, K.; Korotkaja, K.; Zajakina, A. Recombinant Viral Vectors for Therapeutic Programming of Tumour Microenvironment: Advantages and Limitations. Biomedicines 2022, 10, 2142. [Google Scholar] [CrossRef]
- Larochelle, A.; Bellavance, M.A.; Michaud, J.P.; Rivest, S. Bone marrow-derived macrophages and the CNS: An update on the use of experimental chimeric mouse models and bone marrow transplantation in neurological disorders. Biochim. Biophys. Acta Mol. Basis Dis. 2016, 1862, 310–322. [Google Scholar] [CrossRef]
- Kurena, B.; Müller, E.; Christopoulos, P.F.; Johnsen, I.B.; Stankovic, B.; Øynebråten, I.; Corthay, A.; Zajakina, A. Generation and functional in vitro analysis of Semliki Forest virus vectors encoding TNF-α and IFN-γ. Front. Immunol. 2017, 8, 1667. [Google Scholar] [CrossRef]
- Müller, E.; Speth, M.; Christopoulos, P.F.; Lunde, A.; Avdagic, A.; Øynebråten, I.; Corthay, A. Both type I and type II interferons can activate antitumor M1 macrophages when combined with TLR stimulation. Front. Immunol. 2018, 9, 2520. [Google Scholar] [CrossRef]
- Stout, R.D.; Suttles, J. Functional plasticity of macrophages: Reversible adaptation to changing microenvironments. J. Leukoc. Biol. 2004, 76, 509–513. [Google Scholar] [CrossRef]
- Murray, P.J.; Allen, J.E.; Biswas, S.K.; Fisher, E.A.; Gilroy, D.W.; Goerdt, S.; Gordon, S.; Hamilton, J.A.; Ivashkiv, L.B.; Lawrence, T.; et al. Macrophage Activation and Polarization: Nomenclature and Experimental Guidelines. Immunity 2014, 41, 14–20. [Google Scholar] [CrossRef] [PubMed]
- Stout, R.D.; Jiang, C.; Matta, B.; Tietzel, I.; Watkins, S.K.; Suttles, J. Macrophages Sequentially Change Their Functional Phenotype in Response to Changes in Microenvironmental Influences. J. Immunol. 2005, 175, 342–349. [Google Scholar] [CrossRef] [PubMed]
- Korotkaja, K.; Jansons, J.; Spunde, K.; Rudevica, Z.; Zajakina, A. Establishment and Characterization of Free-Floating 3D Macrophage Programming Model in the Presence of Cancer Cell Spheroids. Int. J. Mol. Sci. 2023, 24, 10763. [Google Scholar] [CrossRef] [PubMed]
- Mosmann, T. Rapid colorimetric assay for cellular growth and survival: Application to proliferation and cytotoxicity assays. J. Immunol. Methods 1983, 65, 55–63. [Google Scholar] [CrossRef]
- ICCVAM. ICCVAM Test Method Evaluation Report (TMER): In Vitro Cytotoxicity Test Methods for Estimating Starting Doses For Acute Oral Systemic Toxicity Testing; NIH Publication No: 07-4519; NIH: Bethesda, MD, USA, 2006.
- National Institutes of Health (NIH). Background Review Document: In Vitro Cytotoxicity Test Methods for Estimating Acute Oral Systemic Toxicity; National Institutes of Health (NIH): Stapleton, NY, USA, 2006.
- The European Parliament and the Council of the European Union. Regulation (EC) No 1272/2008 of the European Parliament and of the Council of 16 December 2008 on Classification, Labelling and Packaging of Substances and Mixtures, Amending and Repealing Directives 67/548/EEC and 1999/45/EC, and Amending Regulation (EC); The European Parliament and the Council of the European Union: Brussels, Belgium, 2008; Volume L 269. [Google Scholar]
- Tonga, M.; Lahti, P.M. Designing conjugation-extended viologens for high molar absorptivity with longer wavelength absorption. Synth. Met. 2019, 254, 75–84. [Google Scholar] [CrossRef]
- Salajkova, S.; Benkova, M.; Marek, J.; Sleha, R.; Prchal, L.; Malinak, D.; Dolezal, R.; Sepčíc, K.; Gunde-Cimerman, N.; Kuca, K.; et al. Wide-Antimicrobial Spectrum of Picolinium Salts. Molecules 2020, 25, 2254. [Google Scholar] [CrossRef]
- Baran, A.; Plotniece, A.; Sobolev, A.; Vigante, B.; Gosteva, M.; Olkhovik, V. Synthesis and photoluminescent properties of new cationic carbazole-containing luminophores. Chem. Heterocycl. Compd. 2012, 48, 287–295. [Google Scholar] [CrossRef]
- Van Deun, R.; Nockemann, P.; Parac-Vogt, T.N.; Van Hecke, K.; Van Meervelt, L.; Görller-Walrand, C.; Binnemans, K. Near-infrared photoluminescence of lanthanide complexes containing the hemicyanine chromophore. Polyhedron 2007, 26, 5441–5447. [Google Scholar] [CrossRef]
- Ibrahim, M.A.M.; Messali, M.; Moussa, Z.; Alzahrani, A.Y.; Alamry, S.N.; Hammouti, B. Corrosion inhibition of carbon steel by imidazolium and pyridinium cations ionic liquids in acidic environment. Port. Electrochim. Acta 2011, 29, 375–389. [Google Scholar] [CrossRef]
- Pecchioli, T.; Muthyala, M.K.; Haag, R.; Christmann, M. Multivalent polyglycerol supported imidazolidin-4-one organocatalysts for enantioselective Friedel-Crafts alkylations. Beilstein J. Org. Chem. 2015, 11, 730–738. [Google Scholar] [CrossRef]
- Battistuzzi, G.; Cacchi, S.; Fabrizi, G. An efficient palladium-catalyzed synthesis of cinnamaldehydes from acrolein diethyl acetal and aryl iodides and bromides. Org. Lett. 2003, 5, 777–780. [Google Scholar] [CrossRef]
- Bachollet, S.P.J.T.; Addi, C.; Pietrancosta, N.; Mallet, J.M.; Dumat, B. Fluorogenic Protein Probes with Red and Near-Infrared Emission for Genetically Targeted Imaging. Chem. A Eur. J. 2020, 26, 14467–14473. [Google Scholar] [CrossRef] [PubMed]
- Coe, B.J.; Fielden, J.; Foxon, S.P.; Harris, J.A.; Helliwell, M.; Brunschwig, B.S.; Asselberghs, I.; Clays, K.; Garín, J.; Orduna, J. Diquat derivatives: Highly active, two-dimensional nonlinear optical chromophores with potential redox switchability. J. Am. Chem. Soc. 2010, 132, 10498–10512. [Google Scholar] [CrossRef] [PubMed]
- Coe, B.J.; Rusanova, D.; Joshi, V.D.; Sánchez, S.; Vávra, J.; Khobragade, D.; Severa, L.; Císařová, I.; Šaman, D.; Pohl, R.; et al. Helquat Dyes: Helicene-like Push-Pull Systems with Large Second-Order Nonlinear Optical Responses. J. Org. Chem. 2016, 81, 1912–1920. [Google Scholar] [CrossRef]
- Frisch, M.J.; Trucks, G.W.; Schlegel, H.B.; Scuseria, G.E.; Robb, M.A.; Cheeseman, J.R.; Scalmani, G.; Barone, V.; Mennucci, B.; Petersson, G.A.; et al. Gaussian 09; Revision D.01; Gaussian, Inc.: Wallingford, CT, USA, 2013. [Google Scholar]


| Entry | Compound | Ar | R | n | Ref |
|---|---|---|---|---|---|
| 1 | 6a |  | C12H25 | 1 | |
| 2 | 6b | C16H33 | 1 | [38] | |
| 3 | 6c |  | C16H33 | 2 | |
| 4 | 6d |  | C12H25 | 1 | |
| 5 | 6e | C16H33 | 2 | ||
| 6 | 6f (DSP-6) * |  | C6H13 | 1 | [39] |
| 7 | 6g (DSP-12) * | C12H25 | 1 | [39] | |
| 8 | 7a |  | - | 1 | [40] |
| 9 | 7b * | - | 2 |
| Entry | Compound | Ar | R | n | IC50 (µg/mL) | Basal Cytotoxicity (NIH3T3) LD50 mg/kg | |
|---|---|---|---|---|---|---|---|
| HT-1080 | MH-22A | ||||||
| 1 | 6a |  | C12H25 | 1 | 0.22 ± 0.06 | 0.45 ± 0.08 | 249 ± 3 |
| 2 | 6b | C16H33 | 1 | 0.18 ± 0.02 | 1.08 ± 0.06 | 91 ± 6 | |
| 3 | 6c |  | C16H33 | 2 | 0.20 ± 0.04 | 0.13 ± 0.03 | 85 ± 7 |
| 4 | 6d |  | C12H25 | 1 | 1.4 ± 0.3 | 0.050 ± 0.003 | 169 ± 18 |
| 5 | 6e | C16H33 | 2 | 1.0 ± 0.03 | 0.40 ± 0.06 | 477 ± 11 | |
| 6 | 6f (DSP-6) * |  | C6H13 | 1 | 0.62 ± 0.06 | 0.062 ± 0.008 | 413 ± 25 |
| 7 | 6g (DSP-12) * | C12H25 | 1 | 0.40 ± 0.1 | 0.50 ± 0.1 | 203 ± 32 | |
| 8 | 7a |  | - | 1 | 2.0 ± 0.3 | 4.0 ± 0.3 | 1102 ± 20 |
| 9 | 7b * | - | 2 | 6.0 ± 0.2 | 5.0 ± 0.6 | 857 ± 13 | |
| Entry | Compound | 6a | 6b | 6c | 6d | 6e | 6f | 6g | 7a | 7b |
|---|---|---|---|---|---|---|---|---|---|---|
| 1 | fluor. max. λ, nm (excitation. λ, nm) | 580 (380) | 580 (380) | 760 (530) | 660 (530) | 760 (530) | n | n | 660 (530) | 770 (530) |
| 2 | log ε (abs. max., λ, nm) | 5.46 (384) | 5.23 (385) | 4.26 (408) | 5.06 (365) 5.05 (517) | 4.02 (520) | 5.09 (476) | 5.10 (476) | n | n |
| 3 | Stokes’ shift, nm | 196 | 195 | 352 | 325 | 240 | n | n | n | n |
| 4 | PLQY, % | 15.1 | 12.2 | 0.1 | 0.5 | 0.7 | 1.6 | 1.4 | n | n |
| Compound | 6a | 6c | 6d | 6e | 6g (DSP-12) |
|---|---|---|---|---|---|
| Dav, nm | 597 ± 115 | 212 ± 4 | 349 ± 4 | 118 ± 4 | 207 ± 6 |
| PDI | 0.331 ± 0.261 | 0.218 ± 0.026 | 0.286 ± 0.030 | 0.260 ± 0.011 | 0.254 ± 0.008 |
Disclaimer/Publisher’s Note: The statements, opinions and data contained in all publications are solely those of the individual author(s) and contributor(s) and not of MDPI and/or the editor(s). MDPI and/or the editor(s) disclaim responsibility for any injury to people or property resulting from any ideas, methods, instructions or products referred to in the content. |
© 2023 by the authors. Licensee MDPI, Basel, Switzerland. This article is an open access article distributed under the terms and conditions of the Creative Commons Attribution (CC BY) license (https://creativecommons.org/licenses/by/4.0/).
Share and Cite
Putralis, R.; Korotkaja, K.; Kaukulis, M.; Rudevica, Z.; Jansons, J.; Nilova, O.; Rucins, M.; Krasnova, L.; Domracheva, I.; Plotniece, M.; et al. Styrylpyridinium Derivatives for Fluorescent Cell Imaging. Pharmaceuticals 2023, 16, 1245. https://doi.org/10.3390/ph16091245
Putralis R, Korotkaja K, Kaukulis M, Rudevica Z, Jansons J, Nilova O, Rucins M, Krasnova L, Domracheva I, Plotniece M, et al. Styrylpyridinium Derivatives for Fluorescent Cell Imaging. Pharmaceuticals. 2023; 16(9):1245. https://doi.org/10.3390/ph16091245
Chicago/Turabian StylePutralis, Reinis, Ksenija Korotkaja, Martins Kaukulis, Zhanna Rudevica, Juris Jansons, Olga Nilova, Martins Rucins, Laura Krasnova, Ilona Domracheva, Mara Plotniece, and et al. 2023. "Styrylpyridinium Derivatives for Fluorescent Cell Imaging" Pharmaceuticals 16, no. 9: 1245. https://doi.org/10.3390/ph16091245