Article

Association between Beverage Consumption and Environmental Sustainability in an Adult Population with Metabolic Syndrome

by
Silvia García
1,2,3,
Margalida Monserrat-Mesquida
1,2,3,
Emma Argelich
1,2,3,
Lucía Ugarriza
1,2,3,
Jordi Salas-Salvadó
1,4,5,
Inmaculada Bautista
1,6,
Jesús Vioque
7,8,
María Dolores Zomeño
1,9,10,
Dolores Corella
11,
Xavier Pintó
1,12,
Aurora Bueno-Cavanillas
8,13,
Lidia Daimiel
1,14,15,
J. Alfredo Martínez
1,16,17,
Stephanie Nishi
1,4,5,
Estefanía Herrera-Ramos
6,
Sandra González-Palacios
7,8,
Montserrat Fitó
1,9,
Eva M. Asensio
11,
Marta Fanlo-Maresma
1,12,
Naomi Cano-Ibáñez
8,13,
Esther Cuadrado-Soto
1,14,18,
Itziar Abete
1,17,
Josep A. Tur
1,2,3,* and
Cristina Bouzas
1,2,3
add Show full author list remove Hide full author list
1
CIBER Fisiopatología de la Obesidad y Nutrición (CIBEROBN), Instituto de Salud Carlos III (ISCIII), 28029 Madrid, Spain
2
Research Group on Community Nutrition & Oxidative Stress, University of the Balearic Islands—IUNICS, 07122 Palma de Mallorca, Spain
3
Health Research Institute of the Balearic Islands (IdISBa), 07120 Palma de Mallorca, Spain
4
Departament de Bioquímica i Biotecnologia, Unitat de Nutrició, Universitat Rovira i Virgili, 43201 Reus, Spain
5
Institut d’Investigació Sanitària Pere Virgili (IISPV), 43201 Reus, Spain
6
Research Institute of Biomedical and Health Sciences (IUIBS), University of Las Palmas de Gran Canaria & Centro Hospitalario Universitario Insular Materno Infantil (CHUIMI), Canarian Health Service, 35016 Las Palmas de Gran Canaria, Spain
7
Instituto de Investigación Sanitaria y Biomédica de Alicante, Universidad Miguel Hernández (ISABIAL-UMH), 03550 Alicante, Spain
8
CIBER de Epidemiología y Salud Pública (CIBERESP), Instituto de Salud Carlos III, 28029 Madrid, Spain
9
Unit of Cardiovascular Risk and Nutrition, Institut Hospital del Mar de Investigaciones Médicas Municipal d`Investigació Médica (IMIM), 08003 Barcelona, Spain
10
School of Health Sciences, Blanquerna-Ramon Llull University, 08025 Barcelona, Spain
11
Department of Preventive Medicine, University of Valencia, 46100 Valencia, Spain
12
Lipids and Vascular Risk Unit, Internal Medicine, Hospital Universitario de Bellvitge—IDIBELL, Hospitalet de Llobregat, 08907 Barcelona, Spain
13
Department of Preventive Medicine and Public Health, University of Granada, 18016 Granada, Spain
14
Nutritional Control of the Epigenome Group, Precision Nutrition and Obesity Program, IMDEA Food, CEI UAM + CSIC, 28049 Madrid, Spain
15
Departamento de Ciencias Farmacéuticas y de la Salud, Facultad de Farmacia, Universidad San Pablo—CEU, CEU Universities, Urbanización Montepríncipe, 28660 Boadilla del Monte, Spain
16
Precision Nutrition and Cardiometabolic Health Program, IMDEA Food, CEI UAM + CSIC, 28049 Madrid, Spain
17
Department of Nutrition, Food Sciences, and Physiology, Center for Nutrition Research, University of Navarra, 31008 Pamplona, Spain
18
VALORNUT Research Group, Department of Nutrition and Food Science, Faculty of Pharmacy, Complutense University of Madrid, 28040 Madrid, Spain
*
Author to whom correspondence should be addressed.
Nutrients 2024, 16(5), 730; https://doi.org/10.3390/nu16050730
Submission received: 2 December 2023 / Revised: 29 February 2024 / Accepted: 1 March 2024 / Published: 3 March 2024
(This article belongs to the Section Nutrition and Public Health)

Abstract

:
Beverages are an important part of the diet, but their environmental impact has been scarcely assessed. The aim of this study was to assess how changes in beverage consumption over a one-year period can impact the environmental sustainability of the diet. This is a one-year longitudinal study of 55–75-year-old participants with metabolic syndrome (n = 1122) within the frame of the PREDIMED-Plus study. Food and beverage intake were assessed using a validated food frequency questionnaire and a validated beverage-specific questionnaire. The Agribalyse® 3.0.1 database was used to calculate environmental impact parameters such as greenhouse gas emission, energy, water, and land use. A sustainability beverage score was created by considering the evaluated environmental markers. A higher beverage sustainability score was obtained when decreasing the consumption of bottled water, natural and packed fruit juice, milk, and drinkable dairy, soups and broths, sorbets and jellies, soft drinks, tea without sugar, beer (with and without alcohol), and wine, as well as when increasing the consumption of tap water and coffee with milk and without sugar. Beverage consumption should be considered when assessing the environmental impact of a diet. Trial registration: ISRCTN, ISRCTN89898870. Registered 5 September 2013.

1. Introduction

The consumption of beverages other than water is significant on a global scale. The health effects of these beverages have already been studied [1], but there is still a knowledge gap concerning their environmental impact. Recently, an intervention study in children aimed to assess the possible interaction between beverages and sustainability, but the conclusions were unclear, claiming that more interventions based on nutrition and on environmental sustainability are needed [2]. The environmental impact can vary depending on the type of beverage. It has been observed that reducing the consumption of ultra-processed beverages could potentially decrease both the environmental footprint and overall mortality risk [3]. However, it is not entirely clear yet whether its consumption, production, packaging type, or other factors make each beverage more or less sustainable [4,5].
Beverage consumption is an important factor contributing to the population’s total intake as well. Specific drinks were studied due to their direct effects on health. An excessive consumption of sugar-sweetened beverages was found to be a risk factor for obesity, cardiovascular disease, type 2 diabetes, and dental caries, and several interventions were applied in different countries to decrease it [6]. Other relevant beverages with a negative impact on health were alcoholic drinks since their excessive consumption may lead to physical and mental disorders [7]. Recommendations on light and moderate alcohol consumption were presented to decrease mortality risk [7,8]. Usual beverages such as dairy products or coffee were also studied in relation to health. The increasing presence of chronic inflammatory diseases led to a study of their relationship with dairy product consumption since dairy can modulate human inflammatory processes [9]. Long-term coffee consumption effects were related with cardiovascular diseases [10]. The risk of metabolic syndrome (MetS) is also affected negatively or positively by beverage consumption [11,12]; however, MetS is closely related to lifestyle, and several factors could modify its severity [13].
The increasing presence of unhealthy and unsustainable foods and beverages leads the planet and the people to a global risk. Increases in non-communicable diseases together with the effects of food on greenhouse gas emissions (GHGs), fertilizer pollution, loss of biodiversity, energy use, water use, and land use will lead the Earth to a detrimental state. A more sustainable way of eating is necessary to meet the United Nations’ Sustainable Development Goals and other environmental protective strategies [14]. In 2015, 195 nations agreed on creating the Agenda 2030, which was aimed to accomplish 17 Sustainable Development Goals by the year 2030, making our world more environmentally friendly. The 17 goals are interconnected and some of them are related to food production, consumption, and security [15]. The food industry observed sustainable changes made in consumer purchases, and many producers have integrated environmental, social, or economic sustainability aspects into stages of their production processes [16].
Although it is known that beverages are an important part of diet composition and have different effects on health. The specific environmental impact of beverage consumption has been scarcely analyzed. The aim of this study was to assess how changes in beverage consumption over a one-year period can impact the environmental sustainability of the diet.

2. Methods

2.1. Study Design

The current study is a one-year longitudinal study within the frame of the PREDIMED-Plus trial. It is a parallel-group, randomized, and controlled trial, which aimed to combine an energy-reduced traditional Mediterranean Diet (MedDiet) with physical activity, and behavioral support to see its effects on cardiovascular disease morbimortality. The study protocol can be found elsewhere [17] and at https://www.predimedplus.com/en/, accessed on 5 September 2013. The International Standard Randomized Controlled Trial (ISRCT; http://www.isrctn.com/ISRCTN89898870, accessed on 5 September 2013) registered the mentioned trial with the number 89898870 in 2014.

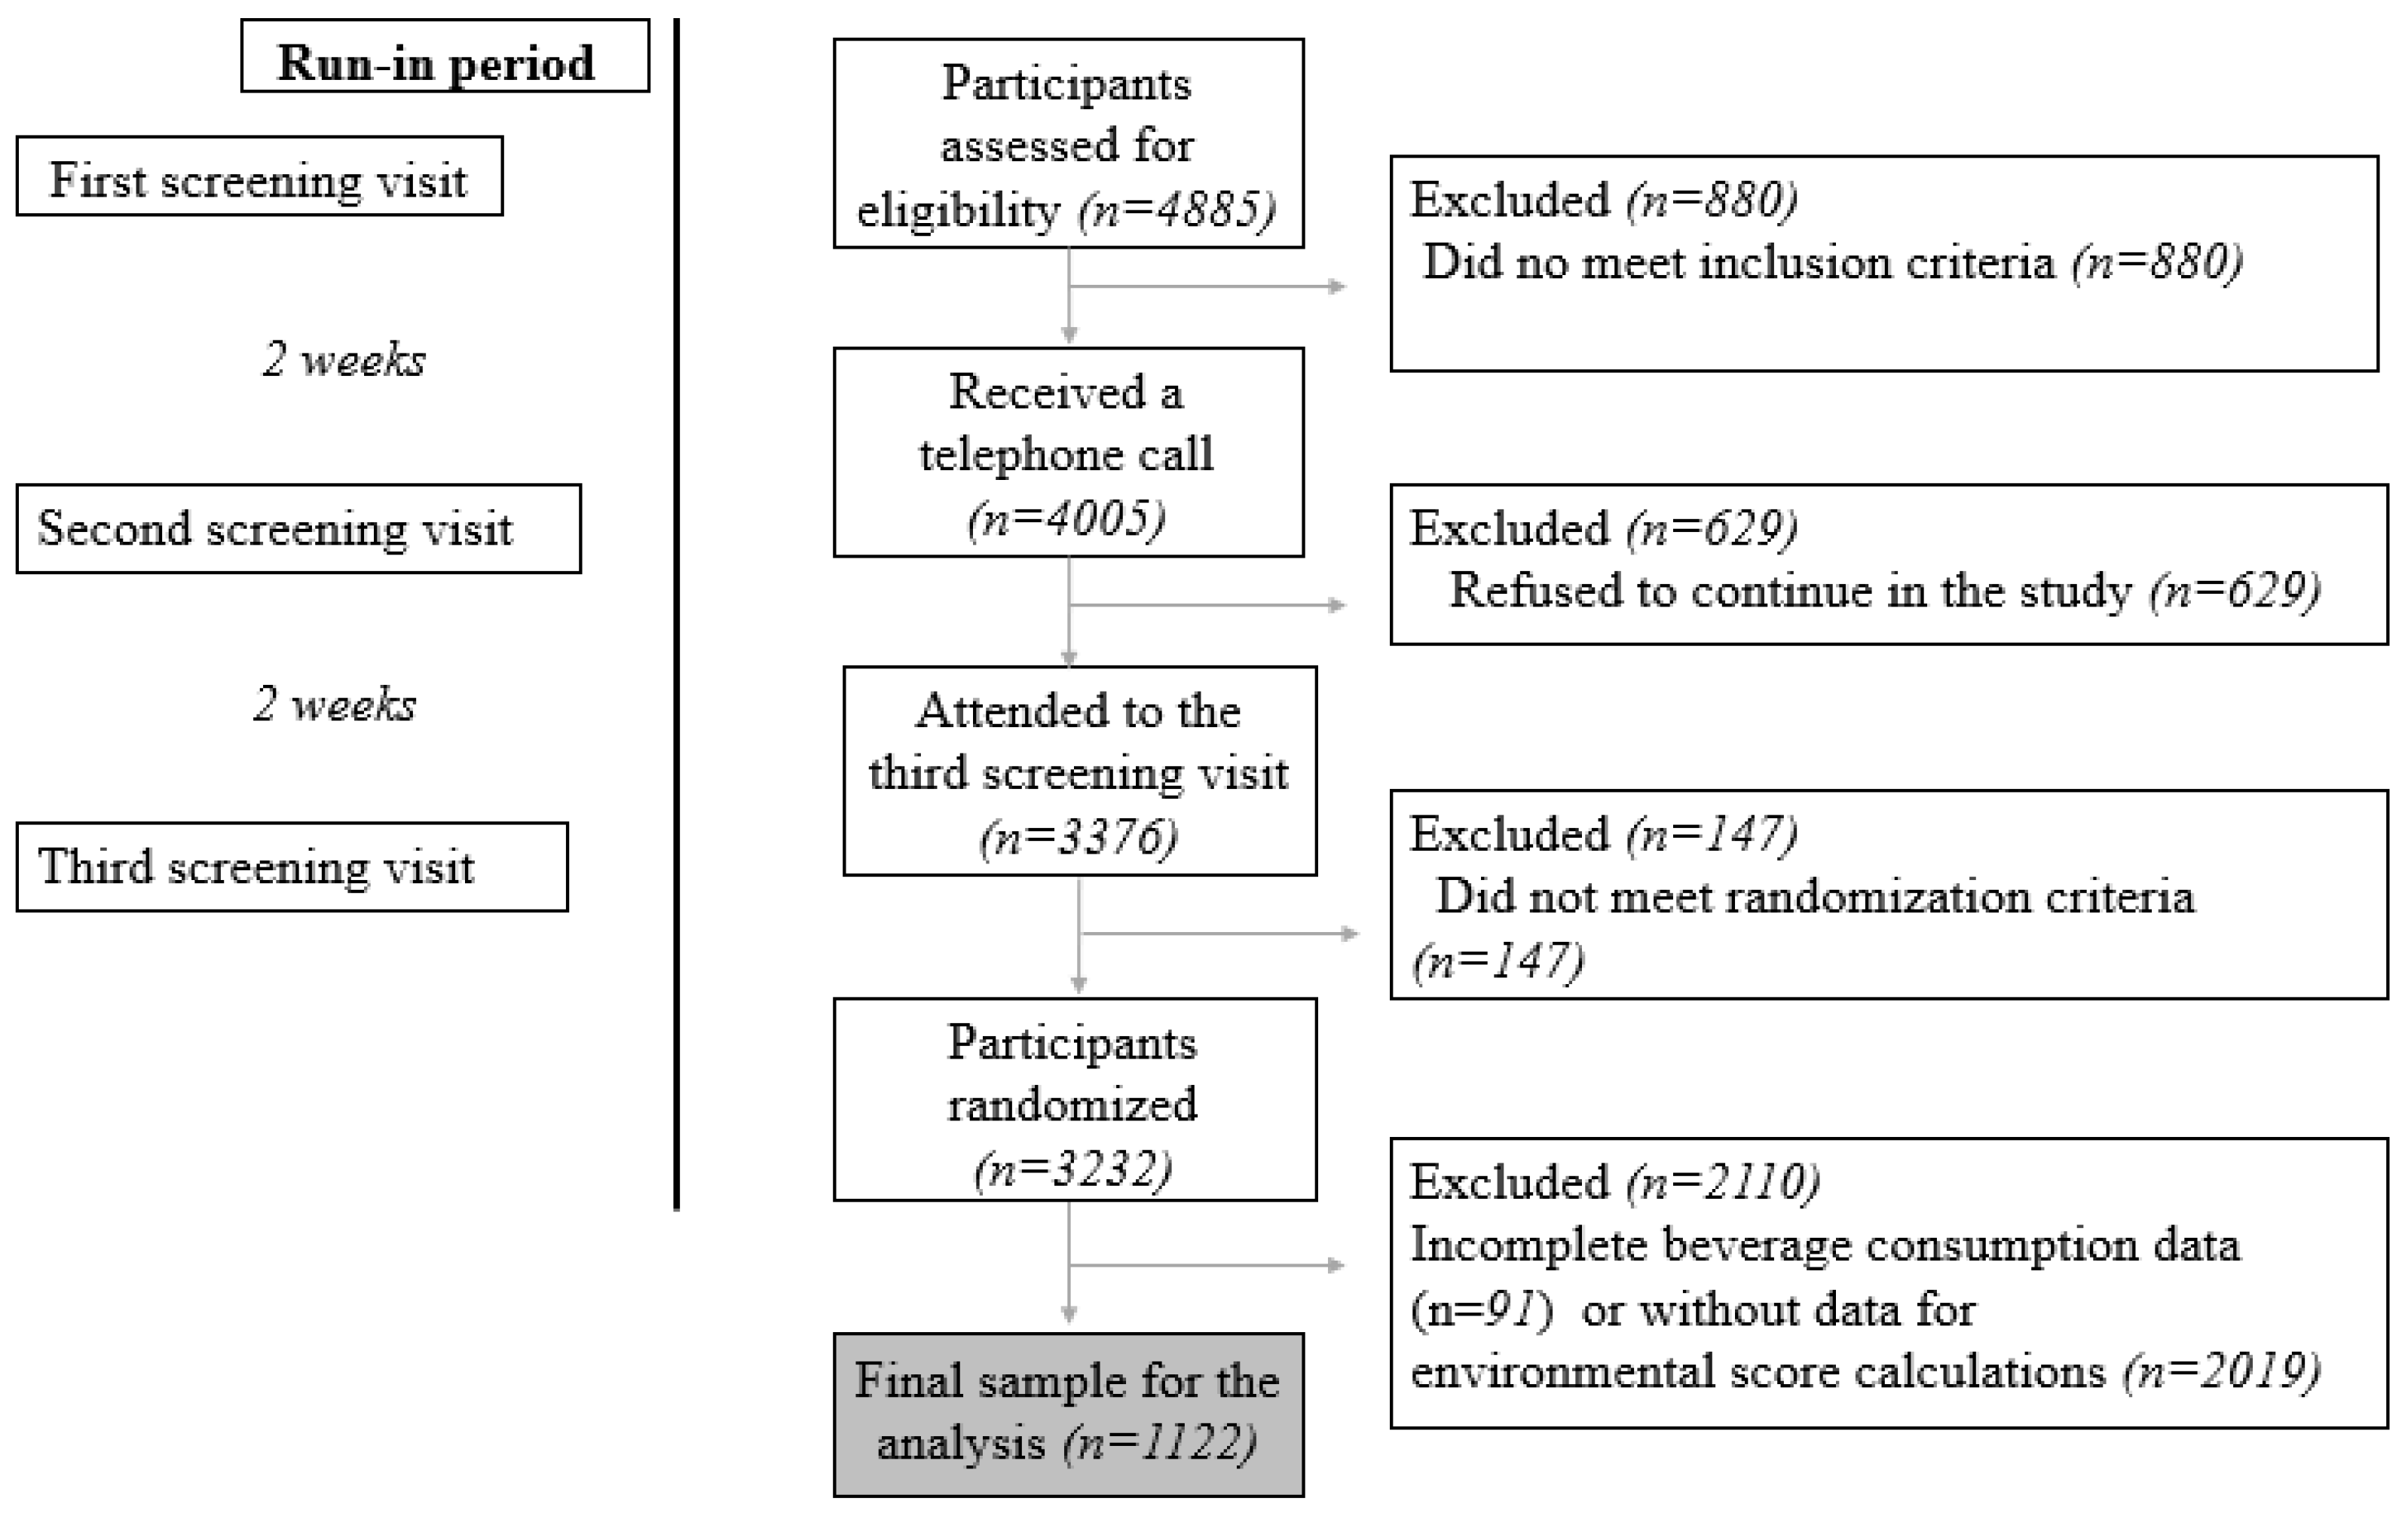
2.2. Participants, Recruitment, Randomization, and Ethics

The PREDIMED-Plus beverage group was composed of 3232 participants aged 55–75 years old with a body mass index (BMI) of 27–40 kg/m2, meeting three or more criteria of the MetS according to the International Diabetes Federation and the American Heart Association/National Heart, Lung, and Blood Institute [18], and with available beverage consumption data. Participants who did not fully complete the beverage consumption questionnaire were excluded (n = 2110), as their environmental impact could not be accurately calculated. The final sample was 1122 participants. A flow-chart of eligible participants is shown in Figure 1. All participants were provided with an informed written consent. The study protocol and procedures were approved by Ethics Committee of Research of Balearic Islands (refs. CEIC-IB2251/14PI and CEIC-IB1295/09PI; approved on 26 February 2020, and 2 July 2022, respectively), following the ethical standards of the Declaration of Helsinki.

2.3. Assessment of Food and Beverage Intake

Food and beverage intake were assessed separately by trained dietitians with questionnaires at baseline and after one-year follow-up. A semi-quantitative 143-item food frequency questionnaire (FFQ) previously validated in a Spanish population [19,20] was used to record food intake. Consumption frequencies were registered according to 9 categories (from “never or almost never” to “≥6 times/day”) and a regular portion size was established for each item. A computer program based on Spanish food composition information was used to calculate energy and nutrient intakes [21,22]. Results were used to assess the total energy intake consumed (kcal) for each participant per day. Beverage intake assessment was performed with a previously validated beverage-specific questionnaire [23]. The daily and weekly beverage consumption of 32 beverages consumed during the previous month was recorded and estimations on the average daily beverage intake were performed based on servings of each type of beverage. The sum of all different beverages was considered as the total beverage intake. Table 1 shows the questionnaire items of beverages.

2.4. GHGs, Energy, Water, and Land Use per kg of Food

Environmental parameter calculations were conducted using the Agribalyse® 3.0.1 database created by the French Agency for the Environment and Energy Management (ADEME), in conjunction with CIQUAL French food composition table [24]. Ecoinvent® also cooperates with Agribalyse® 3.0.1; data are stored in the Ecoinvent database for non-agricultural procedures (e.g., electricity, transport) and imported production; together, they aim to reflect the production and market conditions of European countries. The Agribalyse® 3.0.1 database provides reference data on the environmental impacts of agricultural and food products through a database built according to the LCI methodology [25]. It considers each phase in the food chain separated in two steps: production and post-farm procedures. Agricultural production, transport, processing, packaging, distribution and retailing, consumer preparation, and disposal of packaging are the steps considered to measure environmental impacts. Wastage at home and transport from retail to the household is not included. The method is based on the international LCA standards: ISO 14040 [26] and ISO 14044 [27], LEAP guidelines [28], and product environmental footprint (PEF) [29]; final measurements of each environmental indicator are provided per kg of product. Total amounts of GHGs, water use, energy use, and land use were used for the present paper and are described below.
GHGs were expressed in kilograms (kg) of carbon dioxide equivalents (CO2eq). Water use was calculated in cubic meters (m3) and in correspondence with water consumption and depletion in certain regions, taking scarcity into account. Energy use was calculated in megajoules (MJ) and corresponded to the disposal of non-renewable energy resources like carbon, gas, oil, or uranium. Land use largely determines biodiversity. The unit used for the variable land use was estimated using the echo indicator point (Pt), which reflects the impact of an activity on land biodiversity degradation with reference to the “natural state”, meaning that higher levels of land degradation would be reflected with higher Pt units.
All four parameters were estimated at baseline and 1-year follow-up using the following formula:
= g   of   each   reported   food × Amount   of   the   Environmental   Parameter 1000   g   of   the   corresponding   food
The sum of the total diet’s impact was calculated for each parameter separately. Differences between baseline results and one-year results per day was also calculated.

2.5. Environmental Score Calculations

A sustainability score for beverages was calculated considering all four environmental parameters: GHGs (kgCO2eq), energy use (MJ), water use (m3), and land use (Pt). The environmental impact of beverage consumption was calculated for each of these environmental parameters, as explained in the previous section. Subsequently, the medians of each environmental parameter were calculated and used as cut-off points. Values above medians were scored as 0, and values below medians were scored as 1. When scores of the four environmental parameters were added together, we ended up with a range from 0 to 4, with higher scores indicating lower environmental impact [30]. Score differences between baseline and one-year results were also calculated.

2.6. Sociodemographic Characteristics

Sociodemographic characteristics such as sex, age, and scholar level were also obtained.

2.7. Statistical Analyses

SPSS statistical software package version 27.0 (SPPS Inc., Chicago, IL, USA) was used to perform the analyses. Medians of CO2eq emissions, m3 of water, MJ of energy, and Pt of land for beverage consumption were calculated in order to create the beverage sustainability score. Data on beverage sustainability score change per participant and day between baseline and the first year were distributed in tertiles: tertile 1 (T1), participants with a reduction in their score (−4 to −1 points); tertile 2 (T2), participants with no changes in their score (0 points); and tertile 3 (T3), participants with an increase in their score (1 to 4 points). Data were shown as mean and standard deviation (SD), except for prevalence data, which were expressed as sample size and percentage. Chi-squared test was used for categorical variables and one-way ANOVA and Bonferroni’s post hoc test was used for continuous variables. General linear model (GLM) was used to relate changes in the beverage sustainability score and the beverages consumed by participants during one-year follow-up. GLM was adjusted by total energy intake and intervention group.

3. Results

Table 2 shows sociodemographic characteristics of the sample at baseline. Sex, educational level, age, and BMI were homogeneously distributed among the three categories of beverage score sustainability.
Table 3 shows changes in beverage sustainability score after one-year follow-up, showed by beverage consumed. The group with a higher beverage sustainability score (tertile 3: T3) showed decreased consumption of bottled water, natural and packed fruit juice, milk, and drinkable dairy, soups and broths, sorbets and jellies, soft drinks, tea without sugar, beer (with and without alcohol), and wine, as well as an increased consumption of tap water and coffee with milk and without sugar. The group with a lower beverage sustainability score (tertile 1: T1) consumed more bottled water, but not coffee with milk and without sugar. These differences in beverage consumption between the low sustainable group (T1) and the high sustainable group (T3) during the one-year period, are shown in Figure 2 and Figure 3.

4. Discussion

Beverage consumption was related with GHGs, water use, energy use, and land use. Some beverages appeared to be more environmentally friendly than others, reflecting how beverage consumption should be considered when assessing the environmental impact of a diet.
Given that each beverage has a distinct life cycle, previous studies assessed its environmental impact individually. The sustainability of the milk and dairy industry was addressed from 2011 since it was found to be among the most pollutant industries [31]. The extensive production of milk and its derivatives results in high resource consumption and a significant volume of waste, with whey production being particularly problematic [32]. Among environmental indicators, water use was found as the one that stands out above all [33]. Milk and dairy products are usually consumed, due to their valuable nutrient composition. This is why sustainable practices should be implemented in the dairy industry, considering environmental, economic, and social sustainability [34,35,36]. Current results show that milk consumption decreased more than half in the population group with the highest sustainability score, while its reduction is not as high in the other population groups.
The environmental pressure of the food system would be attenuated by moving towards a more plant-based (PB) diet [37,38]. Demands of PB products increased over the last several years [38,39]. However, not all of the population is willing to change their food habits; a lack of environmental consciousness or a phobia of new food products were seen in study results [40,41]. Current results show no relationships between the beverage sustainability score and vegetable drink consumption, perhaps due to the low consumption of these products in our studied population. Low vegetable drink consumption among current participants could be understood due to their age; they are older than 55 years old. The rejection of new foods is usual in children, but also in older people, mainly due to established traditional and cultural habits [42]. Age implies inherent differences in health status, behaviors, and life experiences between older and younger individuals. Factors such as physiological changes, generational disparities in technology use, and evolving social norms could affect the outcomes of the current study in younger age groups [43,44,45].
Alcoholic beverages, particularly wine, are part of the MedDiet. Wine and beer are the most consumed alcoholic beverages among our study population. Reductions were observed in the consumption of both, with a notable decrease seen in beer consumption. Although both reductions were statistically significant, the decrease in wine consumption was minimal. This can be explained because in the current study population, the participants were recommended to follow the MedDiet. It has been seen how red wine, consumed in moderation, can reduce the risk of MetS [46] and also contribute to improving cardiovascular health [47]. That is the reason why one of the 17 items to assess the MedDiet adherence is related to wine consumption, and it is scored positively if consumption was one drink/day for women and two drinks/day for men [48]. From an environmental perspective, wine and beer production were the most impactful sectors, especially because of water use, energy use, and wastewater [49,50]. Several studies calculated GHGs emitted from wine and beer industries and found out that a decrease in its consumption will decrease GHGs [49,50,51]. The present study shows more holistic results, since it considers GHGs, water use, energy use, and land use to calculate the environmental score. It seems that rather than focusing on reducing its consumption, proposals such as decreasing the use of fertilizers and pesticides [34] or using renewable energies [50] can help to achieve a sustainable production of these beverages. Most of the previous studies focused on the management and reuse of derivative and waste products [52,53]. The reuse of lees from wine, beer, and cider was possible by converting them in yeast extract, nutritional supplements, or fertilizers; by performing a recovery of ethanol via distillation; by producing biogas; or by using it for animal feeding [52]. Yeasts used for wine fermentation are a reusable source for developing new strains or making mixed yeast mixtures to achieve more efficient wine fermentation [53]. Another challenge would be to convince people to buy sustainable beverages. In the case of sustainable beer, its composition or effects on human health would not change, but it is more expensive [54]. However, it was found that the US population would be willing to pay more for sustainably brewed beer, mostly among those conscious of their consumption impact [54].
Coffee and tea are also two of the most consumed non-alcoholic beverages worldwide, and their production and consumption are increasing, as well as their environmental impact [55,56]. Current results for hot beverages were inconclusive. Most of the hot beverages studied did not exhibit statistical significance, except for coffee with milk without sugar and tea without sugar, which were significative but showing low size effect differences. It appears that the consumption of these kinds of beverages did not impact sustainability as much as their production methods. This is the reason why a set of sustainability standards for the agriculture of these products was assessed a few years ago [57]. The sustainability of coffee and tea is based in improving agricultural techniques [58,59], such as improving pesticide usage [60] or reusing waste products [55,56]. Spent coffee grounds have a great composition to be reused as biopolymers, biofuels, activated carbon, filler material, and fertilizers, as well as converted into pharmaceuticals, materials, and energy production [55]. Tea waste products can be transformed into absorbents such as waste biochar and activated carbon, which could absorb pollutant compounds from water, air, and soil and would be cheaper than its commercial equivalents [56]. Comparing black, oolong, and green tea, green tea appeared to be the more sustainable one in terms of energy use, being also the healthiest because of its great mineral value [61].
Sugar-sweetened beverages are identified as ultra-processed products, which are related with higher GHGs and pollution [11,62]. One study found that college students who took a footprint seminar reduced their environmental impact, reporting a reduction in their sugar-sweetened beverage intake [63]. Soft drinks were reduced by more than half in the population group with the highest sustainability score but increased in the group with the lowest sustainability score. A replacement of these soft drinks with tap water would mean a reduction in GHGs [50]. Current results also showed that switching from bottled water to tap water would result in a better beverage sustainability score. Preference for bottled water was found to be higher because of its organoleptic characteristics and due to health concerns [64,65]. The sustainability of tap water is also reflected in other studies, and it may be more consumed if environmentally friendly water consumption was better known [66,67].

Strengths and Limitations of the Study

The current paper offers a new source of information of a growing important issue: beverage sustainability. This paper has the following strengths. The literature reviewed assessed beverage sustainability separately, whereas in our study, the assessment considered all beverage consumption together, allowing calculations for the whole impact of the beverage intake. The analysis of environmental parameters was conducted by creating a holistic sustainable score, which includes GHGs, energy use, water use, and land use. The Agribalyse® 3.0.1 database, recently updated in 2023, was consulted for environmental calculations by considering all the processing steps of a product life cycle. The PREDIMED-Plus study allows for the analysis of a large-sized sample. Using two validated questionnaires such as FFQ and a fluid-specific questionnaire makes the food and beverage intake record more reliable. Finally, the longitudinal design of the study allows for a causal evaluation.
Some limitations were also present in this study. Given that our participants were elderly, it is important to acknowledge that the findings and conclusions of our research may not directly apply to a younger population and cannot be readily generalized to support conceptual sustainability. Therefore, it is essential for future research to consider these age-related variations when attempting to extend our findings to a broader and more diverse demographic. The fact that the literature showed analyses of beverages separately made it more difficult to perform accurate comparisons with the findings of the current study. Comparisons are also limited because there are no references or validated models to calculate environmental scores. There is no reference database for environmental parameter calculations either. The environmental calculations in this study are based on data from the Agribalyse® 3.0.1 database, which may have limitations in terms of the database’s comprehensive coverage of all beverages considered. In the current analysis, calculations for the beverage sustainability score encompassed all beverages showed in the study, except for tap water. In future studies on beverage sustainability, it is important to consider the use of pesticides and fertilizers, along with waste management. These are significant aspects frequently discussed in beverage production.

5. Conclusions

A higher beverage sustainability was observed in relation to a decreasing consumption of bottled water, natural and packed fruit juice, milk and drinkable dairy, soups and broths, sorbets and jellies, soft drinks, tea without sugar, beer (with and without alcohol), and wine, as well as an increasing consumption of tap water and coffee with milk and without sugar. Beverage consumption should be considered when assessing the environmental impact of a diet.

Author Contributions

All the study investigators contributed to the study concept and design and in data extraction from the participants. S.G., M.M.-M. and C.B. performed the statistical analyses. S.G., M.M.-M., C.B. and J.A.T. drafted the manuscript. All authors reviewed the manuscript for important intellectual content and approved the final version to be published. All authors have read and agreed to the published version of the manuscript.

Funding

This work was supported by the official Spanish Institutions for funding scientific biomedical research, CIBER Fisiopatología de la Obesidad y Nutrición (CIBEROBN) and Instituto de Salud Carlos III (ISCIII), through the Fondo de Investigación para la Salud (FIS), which is co-funded by the European Regional Development Fund (six coordinated FIS projects, including the following projects: PI13/00673, PI13/00492, PI13/00272, PI13/01123, PI13/00462, PI13/00233, PI13/02184, PI13/00728, PI13/01090, PI13/01056, PI14/01722, PI14/00636, PI14/00618, PI14/00696, PI14/01206, PI14/01919, PI14/00853, PI14/01374, PI14/00972, PI14/00728, PI14/01471, PI16/00473, PI16/00662, PI16/01873, PI16/01094, PI16/00501, PI16/00533, PI16/00381, PI16/00366, PI16/01522, PI16/01120, PI17/00764, PI17/01183, PI17/00855, PI17/01347, PI17/00525, PI17/01827, PI17/00532, PI17/00215, PI17/01441, PI17/00508, PI17/01732, PI17/00926, PI19/00957, PI19/00386, PI19/00309, PI19/01032, PI19/00576, PI19/00017, PI19/01226, PI19/00781, PI19/01560, PI19/01332, PI20/01802, PI20/00138, PI20/01532, PI20/00456, PI20/00339, PI20/00557, PI20/00886, PI20/01158); the Especial Action Project entitled: Implementación y evaluación de una intervención intensiva sobre la actividad física Cohorte PREDIMED-Plus grant to J.S.-S.; the European Research Council (Advanced Research Grant 2014–2019); the Recercaixa (number 2013ACUP00194) grant to J.S.-S.; the PROMETEO/2017/017 and PROMETEO/21/2021 grant from the Generalitat Valenciana; the SEMERGEN grant. J.S.-S. is partially supported by ICREA under the ICREA Academia program. C.B. was funded by Juan de la Cierva Program. S.G. and M.M.M. were funded by SOIB Investigo Program. None of the funding sources took part in the design, collection, analysis, interpretation of the data, or writing the report, or in the decision to submit the manuscript for publication.

Institutional Review Board Statement

Ethical committees based on the ethical standards of the Declaration of Helsinki approved the study protocol for all the participating institutions. The study protocol and procedures were approved by Ethics Committee of Research of Balearic Islands (refs. CEIC-IB2251/14PI and CEIC-IB1295/09PI; approved on 26 February 2020, and 2 July 2022, respectively). All participants provided an informed written consent before participation.

Informed Consent Statement

The results and writing of this manuscript followed the Committee on Publication Ethics (COPE) guidelines on how to deal with potential acts of misconduct, maintaining the integrity of the research and its presentation following the rules of good scientific practice, the trust in the journal, the professionalism of scientific authorship, and the entire scientific endeavor. Written informed consent has been obtained from the patient(s) to publish this paper if applicable.

Data Availability Statement

There are restrictions on the availability of data for the PREDIMED-Plus trial, due to the signed consent agreements around data sharing. Requestors wishing to access the PREDIMED-Plus trial data used in this study can make a request to the PREDIMED-Plus trial Steering Committee chair: [email protected]. The request will then be passed to members of the PREDIMED-Plus Steering Committee for deliberation.

Acknowledgments

We thank all the participants and investigators. CIBEROBN is an initiative of the Instituto de Salud Carlos III (ISCIII), Madrid, Spain.

Conflicts of Interest

J.S.-S. reported receiving research support from the Instituto de Salud Carlos III, Ministerio de Educación y Ciencia, the European Commission, the USA National Institutes of Health; receiving consulting fees or travel expenses from Eroski Foundation and Instituto Danone; receiving nonfinancial support from Hojiblanca, Patrimonio Comunal Olivarero, the California Almond Board of California, Pistachio Growers and Borges S.A; serving on the board of and receiving grant support through his institution from the International Nut and Dried Foundation and the Eroski Foundation; and personal fees from Instituto Danone Spain; serving in the Board of Danone Institute International. D.C. reported receiving grants from Instituto de Salud Carlos III. The other authors declared no competing interests. The funders had no role in the design of the study; in the collection, analyses, or interpretation of data; in the writing of the manuscript, or in the decision to publish the results.

Abbreviations

BMI: body mass index; CO2eq: carbon dioxide equivalent; FFQ: food frequency questionnaire; GHGs: greenhouse gas emissions; MedDiet: Mediterranean diet; MetS: metabolic syndrome; PB: plant based; SD: standard deviation; Pt: echo indicator point; T1: tertile 1; T2: tertile 2; T3: tertile 3; v00: baseline; v01: one-year follow-up; GLM: general linear model; METs: metabolic equivalents of task.

References

  1. Singh, G.M.; Micha, R.; Khatibzadeh, S.; Shi, P.; Lim, S.; Andrews, K.G.; Engell, R.E.; Ezzati, M.; Mozaffarian, D.; Global Burden of Diseases Nutrition and Chronic Diseases Expert Group (NutriCoDE). Global, Regional, and National Consumption of Sug-ar-Sweetened Beverages, Fruit Juices, and Milk: A Systematic Assessment of Beverage Intake in 187 Countries. PLoS ONE 2015, 10, e0124845, Correction in PLoS ONE 2019, 14, e0214344. [Google Scholar]
  2. Castetbon, K.; Assakali, W.; Thiébaut, I.; Desbouys, L. Decreasing consumption of sugar-sweetened beverages and Raising tap water consumption through Interventions based on Nutrition and sustainability for Kids: Study protocol of the “DRINK” cluster randomised controlled trial. Trials 2023, 24, 611. [Google Scholar] [CrossRef]
  3. Vellinga, R.E.; van den Boomgaard, I.; Boer, J.M.; van der Schouw, Y.T.; Harbers, M.C.; Verschuren, W.M.; van’t Veer, P.; Temme, E.H.; Biesbroek, S. Different Levels of Ultraprocessed Food and Beverage Consumption and Associations with Environmental Sustainability and All-cause Mortality in EPIC-NL. Am. J. Clin. Nutr. 2023, 118, 103–113. [Google Scholar] [CrossRef]
  4. Pasqualino, J.; Meneses, M.; Castells, F. The carbon footprint and energy consumption of beverage packaging selection and dis-posal. J. Food Eng. 2011, 103, 357–365. [Google Scholar] [CrossRef]
  5. Smedman, A.; Lindmark-Månsson, H.; Drewnowski, A.; Edman, A.-K.M. Nutrient density of beverages in relation to climate impact. Food Nutr. Res. 2010, 54, 5170. [Google Scholar] [CrossRef]
  6. Von Philipsborn, P.; Stratil, J.M.; Burns, J.; Busert, L.K.; Pfadenhauer, L.M.; Polus, S.; Holzapfel, C.; Hauner, H.; Rehfuess, E. Environmental interventions to reduce the consumption of sugar-sweetened beverages and their effects on health. Cochrane Database Syst. Rev. 2019, 6, CD012292. [Google Scholar] [CrossRef]
  7. Hendriks, H.F. Alcohol and Human Health: What Is the Evidence? Annu. Rev. Food Sci. Technol. 2020, 11, 1–21. [Google Scholar] [CrossRef]
  8. English, L.K.; Ard, J.D.; Bailey, R.L.; Bates, M.; Bazzano, L.A.; Boushey, C.J.; Brown, C.; Butera, G.; Callahan, E.H.; De Jesus, J.; et al. Evaluation of Dietary Patterns and All-Cause Mortality: A Systematic Review. JAMA Netw. Open. 2021, 4, e2122277. [Google Scholar] [CrossRef] [PubMed]
  9. Bordoni, A.; Danesi, F.; Dardevet, D.; Dupont, D.; Fernandez, A.S.; Gille, D.; Nunes dos Santos, C.; Pinto, P.; Re, R.; Rémond, D.; et al. Dairy products and inflammation: A review of the clinical evidence. Crit. Rev. Food Sci. Nutr. 2017, 57, 2497–2525. [Google Scholar] [CrossRef] [PubMed]
  10. Ding, M.; Bhupathiraju, S.; Satija, A. Long-term coffee consumption and risk of cardiovascular disease: A systematic review and a dose-response meta-analysis of prospective cohort studies. Circulation 2014, 129, 643–659. [Google Scholar] [CrossRef] [PubMed]
  11. Malik, V.S.; Popkin, B.M.; Bray, G.A.; Després, J.P.; Willett, W.C.; Hu, F.B. Sugar-sweetened beverages and risk of metabolic syndrome and type 2 diabetes: A meta-analysis. Diabetes Care 2010, 33, 2477–2483. [Google Scholar] [CrossRef] [PubMed]
  12. Baspinar, B.; Eskici, G.; Ozcelik, A.O. How coffee affects metabolic syndrome and its components. Food Funct. 2017, 8, 2089–2101. [Google Scholar] [CrossRef]
  13. Rochlani, Y.; Pothineni, N.V.; Kovelamudi, S.; Mehta, J.L. Metabolic syndrome: Pathophysiology, management, and modulation by natural compounds. Ther. Adv. Cardiovasc. Dis. 2017, 11, 215–225. [Google Scholar] [CrossRef] [PubMed]
  14. Willett, W.; Rockström, J.; Loken, B.; Springmann, M.; Lang, T.; Vermeulen, S.; Garnett, T.; Tilman, D.; DeClerck, F.; Wood, A.; et al. Food in the Anthropocene: The EAT–Lancet Commission on healthy diets from sustainable food systems. Lancet 2019, 393, 447–492. [Google Scholar] [CrossRef] [PubMed]
  15. United Nations (UN). Sustainable Development Goals. Available online: https://sdgs.un.org/es/goals (accessed on 3 February 2023).
  16. Rodriguez-Sanchez, C.; Sellers-Rubio, R. Sustainability in the Beverage Industry: A Research Agenda from the Demand Side. Sustainability 2021, 13, 186. [Google Scholar] [CrossRef]
  17. Martínez-González, M.A.; Buil-Cosiales, P.; Corella, D.; Bulló, M.; Fitó, M.; Vioque, J.; Romaguera, D.; Martínez, J.A.; Wärnberg, J.; López-Miranda, J.; et al. Cohort profile: Design and methods of the PREDIMED-Plus randomized trial. Int. J. Epidemiol. 2019, 48, 387–388. [Google Scholar] [CrossRef]
  18. Alberti, K.G.; Eckel, R.H.; Grundy, S.M.; Zimmet, P.Z.; Cleeman, J.I.; Donato, K.A.; Fruchart, J.C.; James, W.P.T.; Loria, C.M.; Smith, S.C., Jr. Harmonizing the metabolic syndrome: A joint interim statement of the international diabetes federation task force on epidemiology and prevention; National heart, lung, and blood institute; American heart association; World heart federation; International atherosclerosis society; And international association for the study of obesity. Circulation 2009, 120, 1640–1645. [Google Scholar]
  19. Fernández-Ballart, J.D.; Piñol, J.L.; Zazpe, I.; Corella, D.; Carrasco, P.; Toledo, E.; Perez-Bauer, M.; Martínez-González, M.Á.; Salas-Salvadó, J.; Martín-Moreno, J.M. Relative validity of a semi-quantitative food-frequency questionnaire in an elderly Mediterranean population of Spain. Br. J. Nutr. 2010, 103, 1808–1816. [Google Scholar] [CrossRef]
  20. De La Fuente-Arrillaga, C.; Ruiz, Z.V.; Bes-Rastrollo, M.; Sampson, L.; Martinez-González, M.A. Reproducibility of an FFQ validated in Spain. Public. Health Nutr. 2010, 13, 1364–1372. [Google Scholar] [CrossRef]
  21. Moreiras, O.; Carbajal, A.; Cabrera, L.; Cuadrado, C. Tablas de Composición de Alimentos, Guía de Prácticas (Spanish Food Com-Position Tables), 17th ed.; Pirámide: Madrid, Spain, 2015. [Google Scholar]
  22. Mataix, J.; Mañas, M.; Llopis, J.; Martínez de Victoria, E.; Juan, J.; Borregón, A. Tablas de Composición de Alimentos (Spanish Food Composition Tables), 5th ed.; Universidad de Granada: Granada, Spain, 2013. [Google Scholar]
  23. Ferreira-Pêgo, C.; Nissensohn, M.; Kavouras, S.A.; Babio, N.; Serra-Majem, L.; Martín Águila, A.; Mauromoustakos, A.; Álvarez Pérez, J.; Salas-Salvadó, J. Beverage Intake Assessment Questionnaire: Relative Validity and Repeatability in a Spanish Population with Metabolic Syndrome from the PREDIMED-PLUS Study. Nutrients 2016, 8, 475. [Google Scholar] [CrossRef]
  24. AGRIBALYSE Database of Environmental Impact Indicators for Food Items Produced and Consumed in France. 2013. Updated on 2021. Available online: https://agribalyse.ademe.fr/app/aliments (accessed on 11 May 2022).
  25. Colomb, V.; Ait-Amar, S.; Basset-Mens, C.; Gac, A.; Gaillard, G.; Koch, P.; Mousset, J.; Salou, T.; Tailleur, A.; Van Der Werf, H.M. AGRIBALYSE: The French Public LCI Database for Agricultural Products. 2015. Available online: http://rgdoi.net/10.13140/RG.2.1.2586.0240 (accessed on 2 May 2023).
  26. ISO 14040:2006 (fr). Management Environnemental—Analyse du Cycle de Vie—Principes et Cadre. Available online: https://www.iso.org/obp/ui/fr/#iso:std:iso:14040:ed-2:v1:fr (accessed on 2 May 2023).
  27. ISO 14044:2006 (fr). Management Environnemental—Analyse du Cycle de vie Exigences et Lignes Directrices. Available online: https://www.iso.org/obp/ui/fr/#iso:std:iso:14044:ed-1:v1:fr (accessed on 2 May 2023).
  28. Livestock Environmental Assessment and Performance (LEAP) Partnership—Food and Agriculture Organization of the United Nations. Available online: https://www.fao.org/partnerships/leap/overview/the-partnership/en/ (accessed on 2 May 2023).
  29. Kesse-Guyot, E.; Allès, B.; Brunin, J.; Fouillet, H.; Dussiot, A.; Berthy, F.; Perraud, E.; Hercberg, S.; Julia, C.; Mariotti, F.; et al. Environmental impacts along the value chain from the consumption of ultra-processed foods. Nat. Sustain. 2023, 6, 192–202. [Google Scholar] [CrossRef]
  30. Grosso, G.; Fresán, U.; Bes-Rastrollo, M.; Marventano, S.; Galvano, F. Environmental Impact of Dietary Choices: Role of the Medi-terranean and Other Dietary Patterns in an Italian Cohort. Int. J. Environ. Res. Public. Health 2020, 17, 1468. [Google Scholar] [CrossRef] [PubMed]
  31. Feil, A.A.; Schreiber, D.; Haetinger, C.; Haberkamp, M.; Kist, J.I.; Rempel, C.; Maehler, A.E.; Gomes, M.C.; da Silva, G.R. Sustainability in the dairy industry: A systematic literature review. Environ. Sci. Pollut. Res. 2020, 27, 33527–33542. [Google Scholar] [CrossRef] [PubMed]
  32. Kasmi, M. Biological processes as promoting way for both treatment and valorization of dairy industry effluents. Waste Biomass Valorization 2018, 9, 195–209. [Google Scholar] [CrossRef]
  33. Vourch, M.; Balannec, B.; Chaufer, B.; Dorange, G. Treatment of dairy industry wastewater by reverse osmosis for water re-use. Desalination 2008, 219, 190–202. [Google Scholar] [CrossRef]
  34. Zhu, L.; Lansink, A.O. Dynamic sustainable productivity growth of Dutch dairy farming. PLoS ONE 2022, 17, e0264410. [Google Scholar] [CrossRef]
  35. Luthra, S.; Govindan, K.; Kannan, D.; Mangla, S.K.; Garg, C.P. An integrated framework for sustainable supplier selection and evaluation in supply chains. J. Clean. Prod. 2017, 140, 1686–1698. [Google Scholar] [CrossRef]
  36. Fresán, U.; Sabaté, J. Vegetarian Diets: Planetary Health and Its Alignment with Human Health. Adv. Nutr. Int. Rev. J. 2019, 10, S380–S388. [Google Scholar] [CrossRef]
  37. García, S.; Bouzas, C.; Mateos, D.; Pastor, R.; Álvarez, L.; Rubín, M.; Martínez-González, M.Á.; Salas-Salvadó, J.; Corella, D.; Goday, A.; et al. Carbon dioxide (CO2) emissions and adherence to Medi-terranean diet in an adult population: The Mediterranean diet index as a pollution level index. Environ. Health 2023, 22, 1. [Google Scholar] [CrossRef]
  38. Euvepro. The Use of Plant-Based Proteins in Foods and Beverages in the EU. A 10- Year Review of New Product Launches con-taining Plant-Based Proteins across EU Brusseles. 2019. Available online: https://euvepro.eu/_library/_files/INNOVA_2018_report_summary_THE_USE_OF_PLANT-BASED_PROTEINS_IN_FOOD_AND_BEVERAGES_IN_THE_EU.pdf (accessed on 8 March 2023).
  39. Munekata, P.E.S.; Domínguez, R.; Budaraju, S.; Roselló-Soto, E.; Barba, F.J.; Mallikarjunan, K.; Roohinejad, S.; Lorenzo, J.M. Effect of Innovative Food Processing Technologies on the Physicochemical and Nutritional Properties and Quality of Non-Dairy Plant-Based Beverages. Foods 2020, 9, 288. [Google Scholar] [CrossRef]
  40. Haas, R.; Schnepps, A.; Pichler, A.; Meixner, O. Cow Milk versus Plant-Based Milk Substitutes: A Comparison of Product Image and Motivational Structure of Consumption. Sustainability 2019, 11, 5046. [Google Scholar] [CrossRef]
  41. Jaeger, S.R.; Giacalone, D. Barriers to consumption of plant-based beverages: A comparison of product users and non-users on emotional, conceptual, situational, conative and psychographic variables. Food Res. Int. 2021, 144, 110363. [Google Scholar] [CrossRef] [PubMed]
  42. D’Ammaro, D.; Capri, E.; Valentino, F.; Grillo, S.; Fiorini, E.; Lamastra, L. A multi-criteria approach to evaluate the sustainability performances of wines: The Italian red wine case study. Sci. Total Environ. 2021, 799, 149446. [Google Scholar] [CrossRef]
  43. Westenhoefer, J. Age and gender dependent profile of food choice. Forum Nutr. 2005, 57, 44–51. [Google Scholar]
  44. Van Meer, F.; Charbonnier, L.; Smeets, P.A.M. Food Decision-Making: Effects of Weight Status and Age. Curr. Diabetes Rep. 2016, 16, 84. [Google Scholar] [CrossRef] [PubMed]
  45. Chopik, W.J.; Bremner, R.H.; Johnson, D.J.; Giasson, H.L. Age Differences in Age Perceptions and Developmental Transitions. Front. Psychol. 2018, 9, 67. [Google Scholar] [CrossRef]
  46. Tresserra-Rimbau, A.; Medina-Remón, A.; Lamuela-Raventós, R.M.; Bulló, M.; Salas-Salvadó, J.; Corella, D.; Fitó, M.; Gea, A.; Gómez-Gracia, E.; Lapetra, J.; et al. Moderate red wine consumption is associated with a lower prevalence of the metabolic syndrome in the PREDIMED population. Br. J. Nutr. 2015, 113, S121–S130. [Google Scholar] [CrossRef]
  47. Rees, K.; Takeda, A.; Martin, N.; Ellis, L.; Wijesekara, D.; Vepa, A.; Das, A.; Hartley, L.; Stranges, S. Mediterranean-Style Diet for the Primary and Secondary Prevention of Cardiovascular Disease: A Cochrane Review. Glob. Heart 2020, 15, 56. [Google Scholar] [CrossRef]
  48. Schröder, H.; Zomeño, M.D.; Martínez-González, M.A.; Salas-Salvadó, J.; Corella, D.; Vioque, J.; Romaguera, D.; Martínez, J.A.; Tinahones, F.J.; Miranda, J.L.; et al. Validity of the energy-restricted Mediterranean Diet Adherence Screener. Clin. Nutr. 2021, 40, 4971–4979. [Google Scholar] [CrossRef]
  49. Baiano, A. Craft beer: An overview. Compr. Rev. Food Sci. Food Saf. 2021, 20, 1829–1856. [Google Scholar] [CrossRef]
  50. Van de Kamp, M.E.; Seves, S.M.; Temme, E.H.M. Reducing GHG emissions while improving diet quality: Exploring the potential of reduced meat, cheese and alcoholic and soft drinks consumption at specific moments during the day. BMC Public Health 2018, 18, 264. [Google Scholar] [CrossRef]
  51. Pérez-Bibbins, B.; Torrado-Agrasar, A.; Salgado, J.; Oliveira, R.P.d.S.; Domínguez, J. Potential of lees from wine, beer and cider manufacturing as a source of economic nutrients: An overview. Waste Manag. 2015, 40, 72–81. [Google Scholar] [CrossRef]
  52. Fleet, G.H. Wine yeasts for the future. FEMS Yeast Res. 2008, 8, 979–995. [Google Scholar] [CrossRef]
  53. Carley, S.; Yahng, L. Willingness-to-pay for sustainable beer. PLoS ONE 2018, 13, e0204917. [Google Scholar] [CrossRef]
  54. Bijla, L.; Aissa, R.; Laknifli, A.; Bouyahya, A.; Harhar, H.; Gharby, S. Spent coffee grounds: A sustainable approach toward novel perspectives of valorization. J. Food Biochem. 2022, 46, e14190. [Google Scholar] [CrossRef] [PubMed]
  55. Debnath, B.; Haldar, D.; Purkait, M.K. Environmental remediation by tea waste and its derivative products: A review on present status and technological advancements. Chemosphere 2022, 300, 134480. [Google Scholar] [CrossRef] [PubMed]
  56. Milder, J.C.; Arbuthnot, M.; Blackman, A.; Brooks, S.E.; Giovannucci, D.; Gross, L.; Kennedy, E.T.; Komives, K.; Lambin, E.F.; Lee, A.; et al. An agenda for assessing and improving conservation impacts of sustainability standards in tropical agriculture. Conserv. Biol. 2014, 29, 309–320. [Google Scholar] [CrossRef]
  57. Ul Haq, S.; Boz, I.; Shahbaz, P. Sustainability assessment of different land tenure farming systems in tea farming: The effect of decisional and structural variables. Integr. Environ. Assess. Manag. 2021, 17, 814–834. [Google Scholar] [CrossRef]
  58. Vogt, M.A.B. Developing stronger association between market value of coffee and functional biodiversity. J. Environ. Manag. 2020, 269, 110777. [Google Scholar] [CrossRef]
  59. Roy, S.; Muraleedharan, N. Microbial management of arthropod pests of tea: Current state and prospects. Appl. Microbiol. Biotechnol. 2014, 98, 5375–5386. [Google Scholar] [CrossRef] [PubMed]
  60. Khanali, M.; Mobli, H.; Hosseinzadeh-Bandbafha, H. Modeling of yield and environmental impact categories in tea processing units based on artificial neural networks. Environ. Sci. Pollut. Res. 2017, 24, 26324–26340. [Google Scholar] [CrossRef] [PubMed]
  61. Czernicka, M.; Zaguła, G.; Bajcar, M.; Saletnik, B.; Puchalski, C. Study of nutritional value of dried tea leaves and infusions of black, green and white teas from Chinese plantations. Rocz. Państwowego Zakładu Hig. 2017, 68, 237–245. [Google Scholar]
  62. Huse, O.; Reeve, E.; Bell, C.; Sacks, G.; Baker, P.; Wood, B.; Backholer, K. Strategies used by the soft drink industry to grow and sustain sales: A case-study of The Coca-Cola Company in East Asia. BMJ Glob. Heart 2022, 7, e010386. [Google Scholar] [CrossRef] [PubMed]
  63. Malan, H.; Amsler Challamel, G.; Silverstein, D.; Hoffs, C.; Spang, E.; Pace, S.A.; Malagueño, B.L.R.; Gardner, C.D.; Wang, M.C.; Slusser, W.; et al. Impact of a Scalable, Multi-Campus “Foodprint” Seminar on College Students’ Dietary Intake and Dietary Carbon Footprint. Nutrients 2020, 12, 2890. [Google Scholar] [CrossRef] [PubMed]
  64. Huerta-Saenz, L.; Irigoyen, M.; Benavides, J.; Mendoza, M. Tap or bottled water: Drinking preferences among urban minority children and adolescents. J. Community Health 2012, 37, 54–58. [Google Scholar] [CrossRef]
  65. Platikanov, S.; Hernández, A.; González, S.; Cortina, J.L.; Tauler, R.; Devesa, R. Predicting consumer preferences for mineral composition of bottled and tap water. Talanta 2017, 162, 1–9. [Google Scholar] [CrossRef]
  66. Etale, A.; Jobin, M.; Siegrist, M. Tap versus bottled water consumption: The influence of social norms, affect and image on consumer choice. Appetite 2018, 121, 138–146. [Google Scholar] [CrossRef]
  67. Geerts, R.; Vandermoere, F.; Van Winckel, T.; Halet, D.; Joos, P.; Steen, K.V.D.; Van Meenen, E.; Blust, R.; Borregán-Ochando, E.; Vlaeminck, S.E. Bottle or tap? Toward an integrated approach to water type consumption. Water Res. 2020, 173, 115578. [Google Scholar] [CrossRef]
Figure 1. Flow chart of eligibility of participants.
Nutrients 16 00730 g001
Figure 2. Differences between beverage intake (mL) at baseline (00) after one-year follow-up (01) in the low sustainable group (T1).
Nutrients 16 00730 g002
Figure 3. Differences between beverage intake (mL) at baseline (00) and after one-year follow-up (01) in the high sustainable group (T3).
Nutrients 16 00730 g003
Table 1. Fluid-specific questionnaire items.
-
Tap water, bottled water, natural fruit juices, bottled fruit juices, natural vegetable juices, bottled vegetable juices.
-
Whole milk, semi-skimmed milk, skimmed milk, drinking yogurt (100–200 cc), milkshakes.
-
Vegetable drinks, soups.
-
Jellies and sorbets, sugar-sweetened beverages (SSBs) (200–330 cc), artificially sweetened beverages (ASBs) (200–330 cc).
-
Espresso (sweetened and unsweetened), white coffee (sweetened and unsweetened), tea (sweetened and unsweetened), other infusions (sweetened and unsweetened).
-
Beer (200–330 cc), non-alcoholic beer (200–330 cc), wine, spirits, mixed alcoholic drinks, energy drinks, sports drinks (200–330 cc), meal replacement shakes and other beverages.
Table 2. Sociodemographic characteristics at baseline.
T1: Decreased Beverage Score (n = 374)T2: Non-Changed Beverage Score (n = 360)T3: Increased Beverage Score (n = 388)p
Sex 0.308
 Men (n; %)173 (46.3)178 (49.4)201 (51.8)
 Women (n; %)201 (53.7)182 (50.6)187 (48.2)
Highest school level completed 0.696
 Primary School (n; %)45 (12.0)36 (10.0)50 (12.9)
 College School Technician (n; %)30 (8.0)31 (8.6)36 (9.3)
 Secondary School (n; %)97 (25.9)91 (25.3)109 (28.1)
 Bachelor’s degree (n; %)202 (54.0)202 (56.1)193 (49.7)
Age (years) *64.9 (4.9)65.0 (4.7)64.8 (5.0)0.832
BMI (kg/m2) *32.6 (3.4)32.6 (3.2)33.1 (3.7)0.188
Energy (Kcal/day) *2400.3 (592.3)2479.7 (618.7)2531.7 (578.1)0.009
Physical Activity (METs) ^2297.5 (2256.2)2611.1 (2301.9)2478.1 (2484.2)0.193
* Mean values (SD). Abbreviations: SD: Standard deviation. BMI: Body mass index. METs: Metabolic equivalents of task. Chi-squared test was used for categorical variables and one-way ANOVA and Bonferroni’s post hoc test was used for continuous variables. ^ Measured in METs (metabolic equivalents of task) min/week.
Table 3. Changes in beverage sustainability score after one-year follow-up showed by beverage consumed.
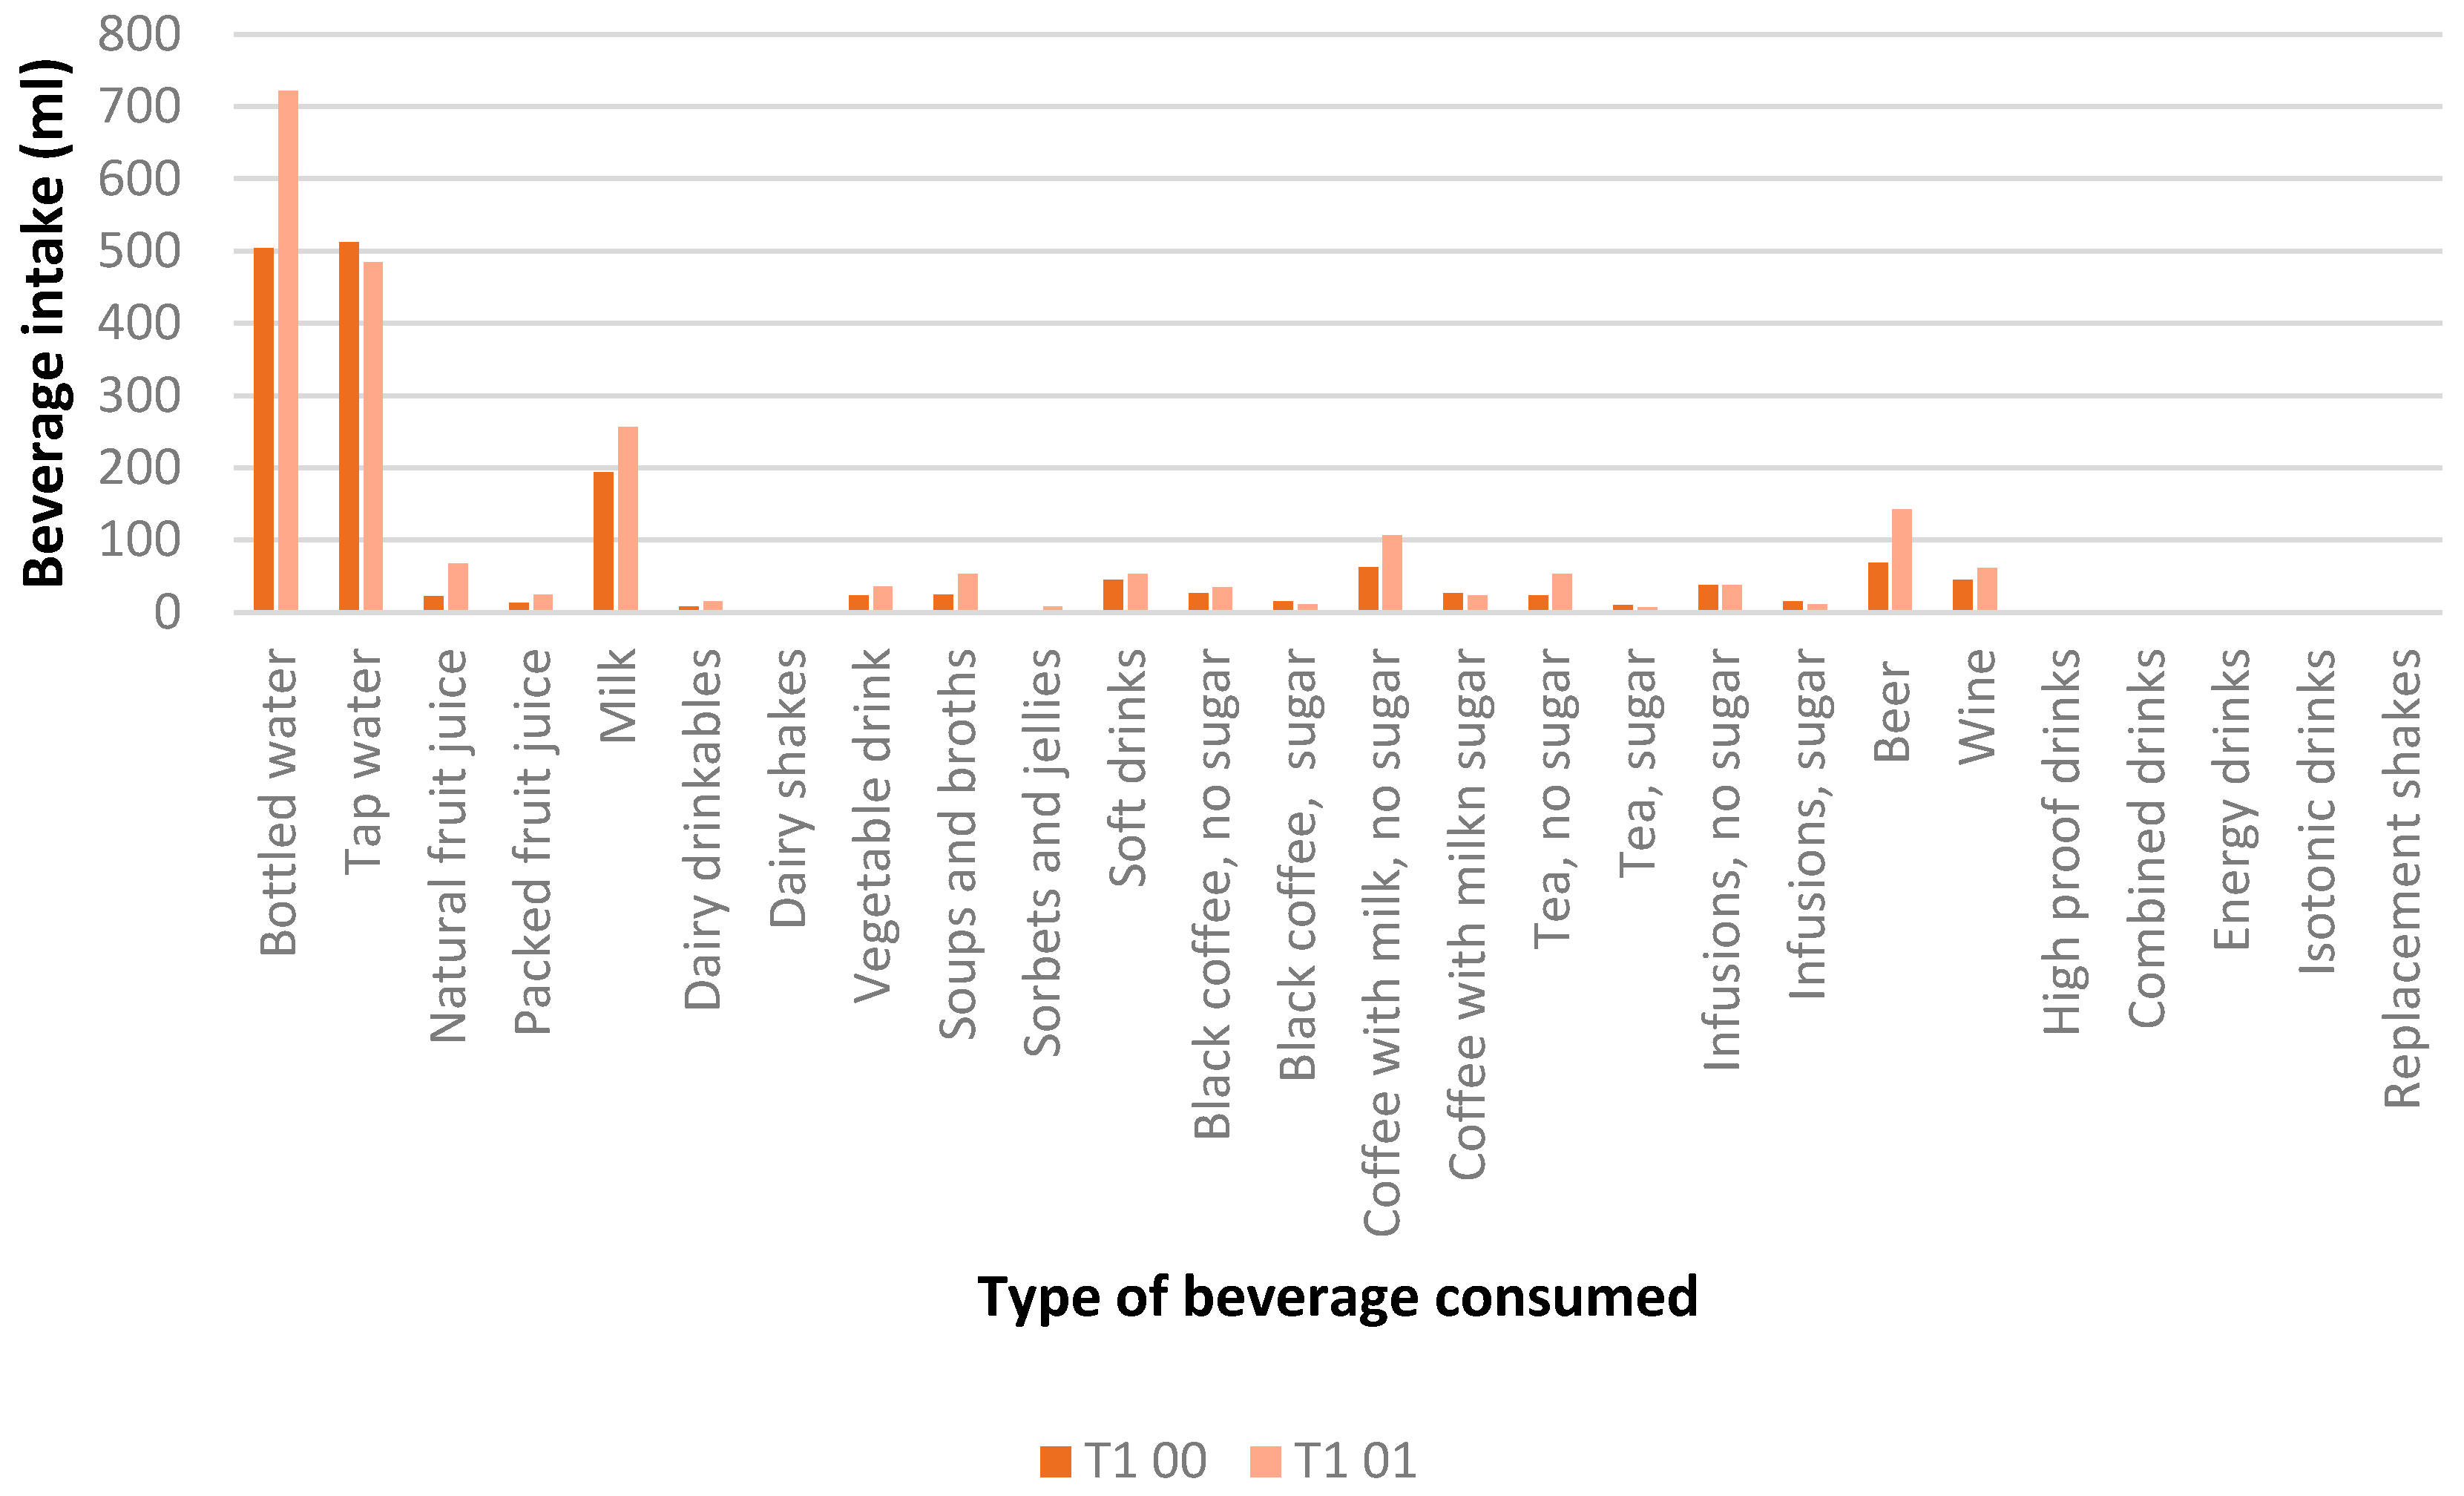
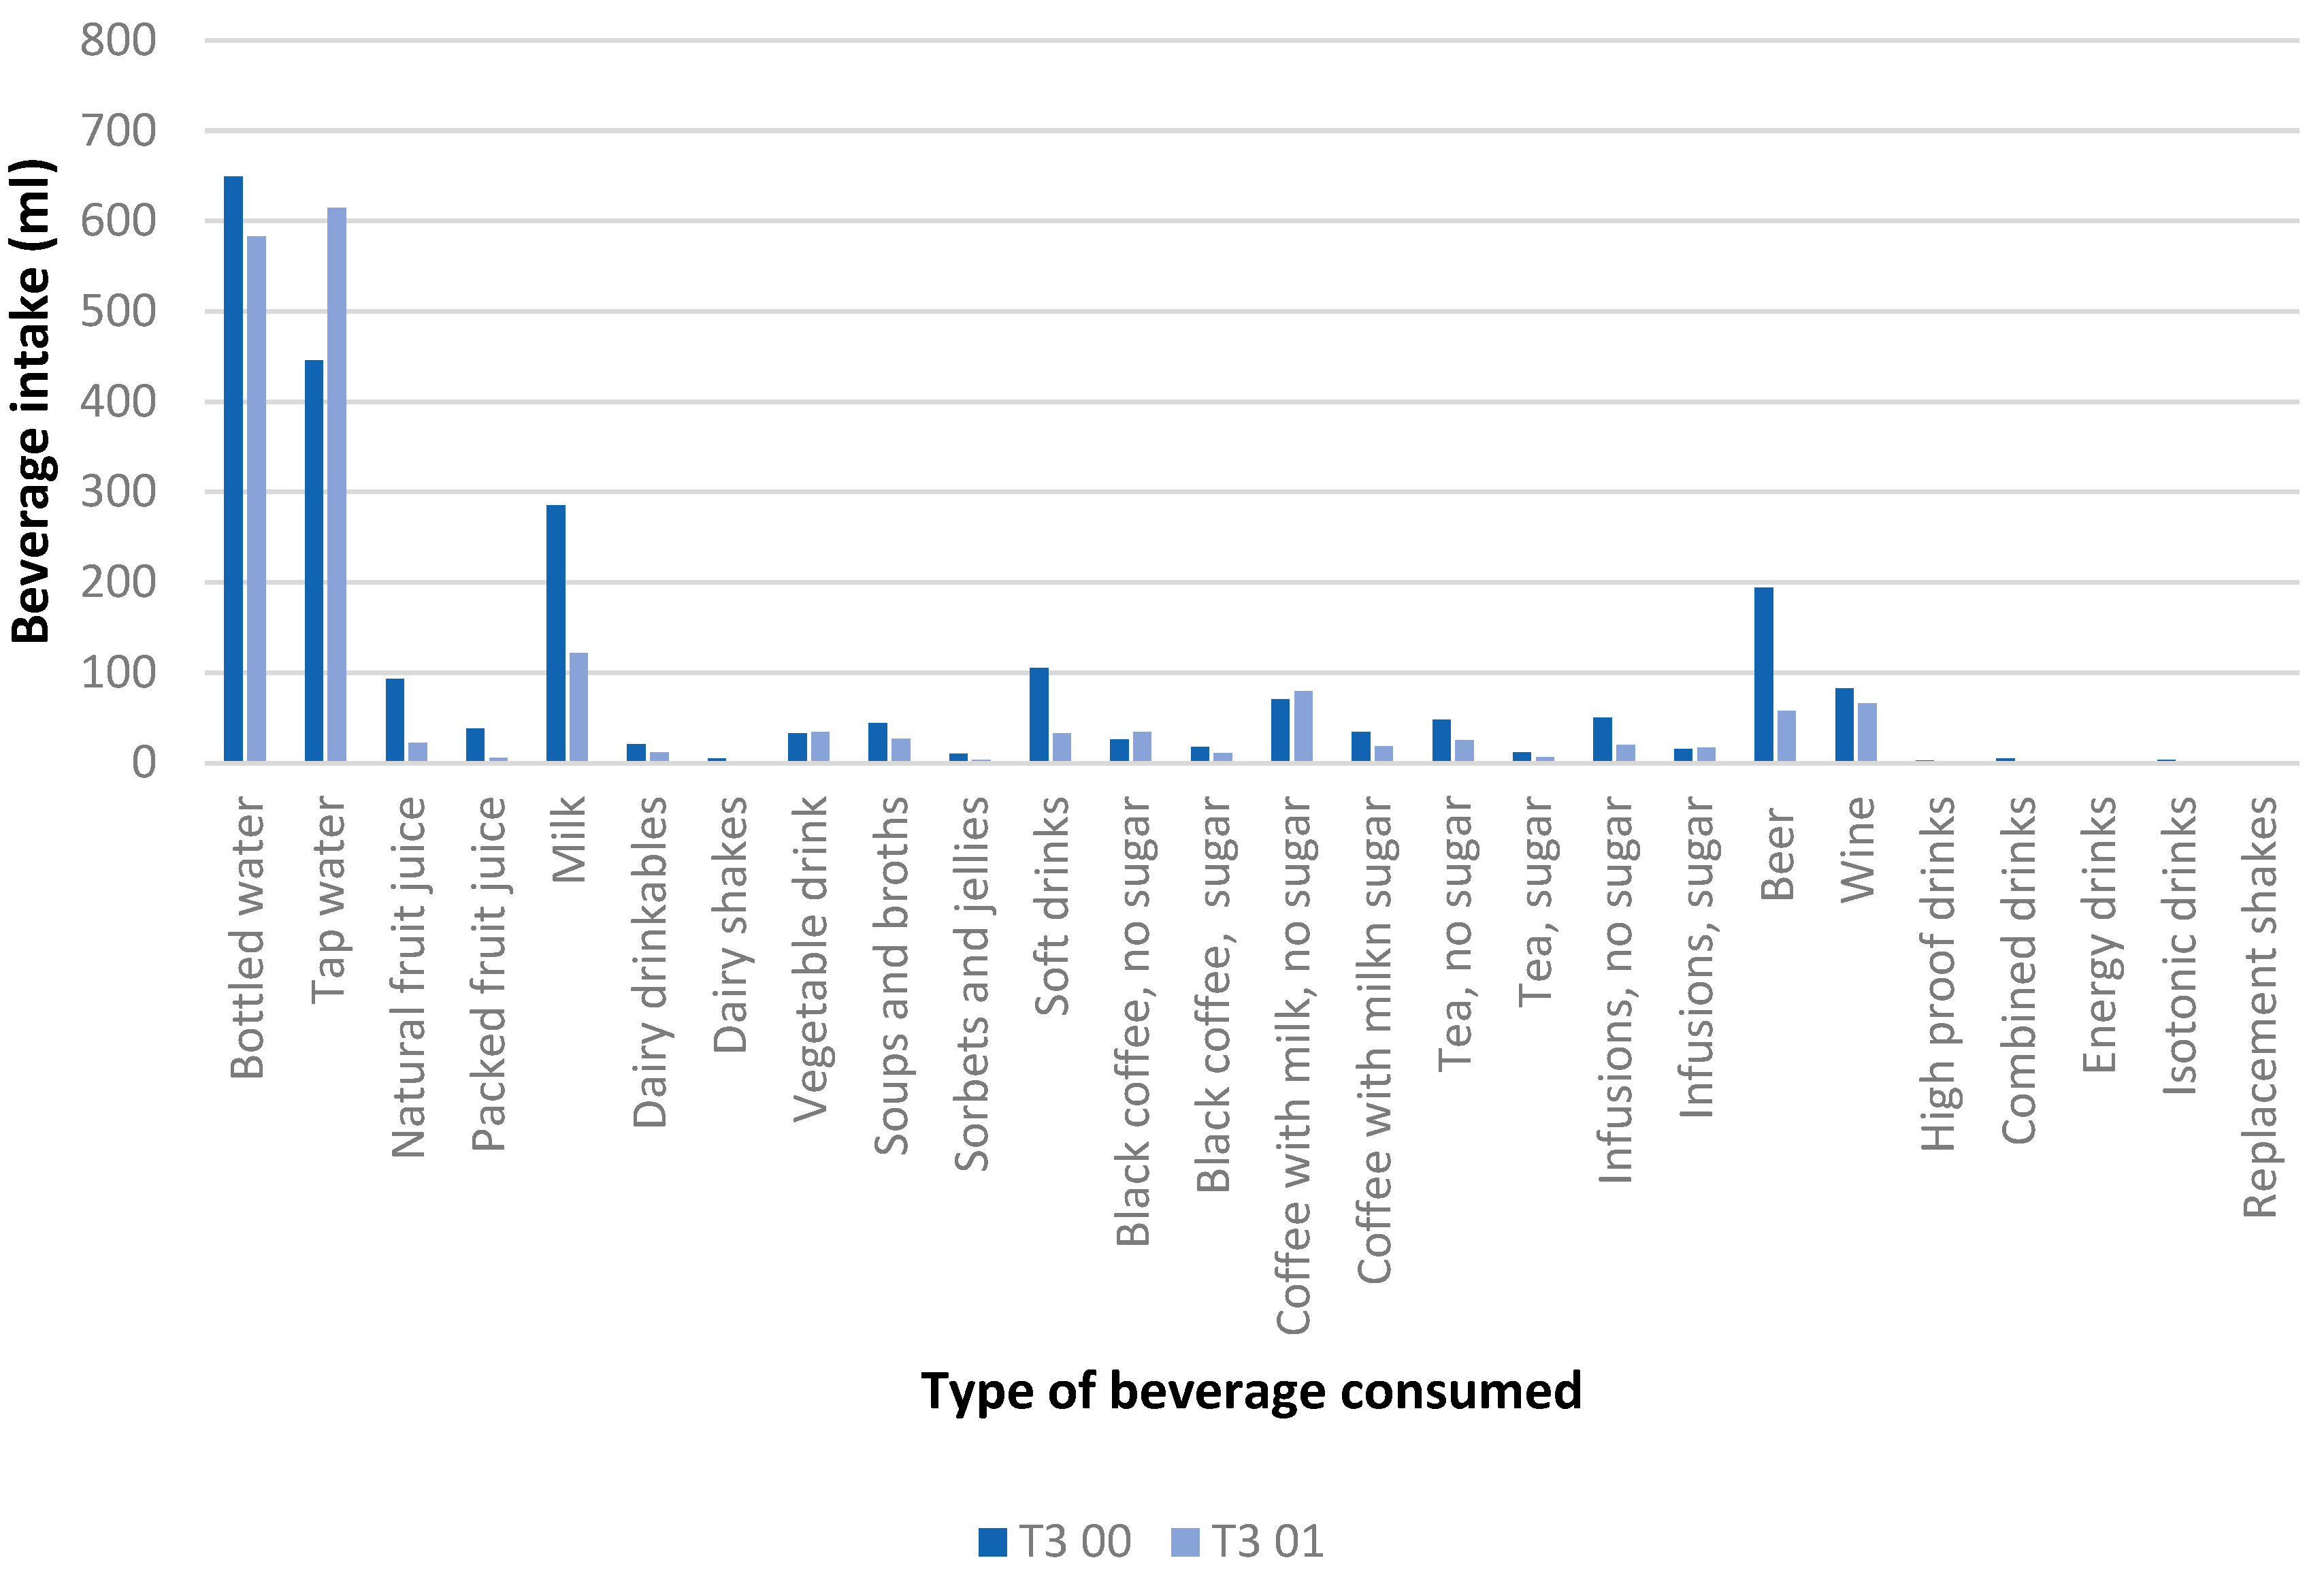
T1: Decreased Beverage Score § (n = 374)T2: Non-Changed Beverage Score § (n = 360)T3: Increased Beverage Score § (n = 388)p-Value Time × Group
Interaction
Bottled water <0.001
v00503.8 (559.7) b605.8 (593.9)649.4 (645.2) b
v01721.7 (633.2) b665.7 (654.8)582.6 (635.9) b
217.8 (651.4) * d e59.8 (539.1) * d f−66.7 (669.1) * e f
Tap water <0.001
v00511.8 (583.2)453.8 (596.2)445.9 (614.6)
v01484.8 (588.0) b495.7 (619.9)614.4 (681.1) b
−27.0 (588.4) e41.9 (532.9) f168.5 (651.8) * e f
Natural fruit juice <0.001
v0022.5 (74.2) a b83.4 (150.6) a92.9 (157.3) b
v0167.9 (143.8) b68.4 (148.9) c22.4 (79.3) b c
45.3 (140.3) * d e−15.0 (147.1) d f−70.5 (161.9) * e f
Packed fruit juice <0.001
v0012.9 (57.1) a b34.7 (101.2) a38.2 (110.8) b
v0123.8 (102.5) b16.6 (79.5)5.6 (33.2) b
10.8 (99.4) d e−18.0 (110.8) * d−32.5 (110.6) * e
Milk (whole/semi-skimmed/skimmed) <0.001
v00193.9 (203.7) a b242.2 (212.2) a c285.3 (205.8) b c
v01256.3 (215.4) b217.4 (230.3) c121.4 (182.6) b c
62.3 (229.5) * d e−24.8 (206.3) * d f−163.9 (230.8) * e f
Drinkable dairy 0.001
v008.2 (44.4) b14.4 (57.8) b20.5 (69.6)
v0114.8 (57.4)8.3 (43.3)11.8 (45.6)
6.6 (59.1) * d e−6.1 (60.1) d−8.7 (70.8) * e
Dairy shakes 0.176
v000.4 (4.4)3.4 (31.1)4.9 (40.9)
v012.9 (30.9)2.2 (29.7)1.3 (21.0)
2.5 (31.3)−1.2 (31.2)−3.5 (46.2)
Vegetable drinks 0.257
v0023.1 (90.5)25.2 (99.9)32.8 (112.7)
v0135.7 (116.4)25.8 (96.5)33.9 (108.6)
12.5 (111.1) *0.6 (95.8)1.1 (115.5)
Soups and broths <0.001
v0024.2 (29.1) b36.1 (70.9)44.3 (80.6) b
v0153.4 (79.8) a b39.8 (73.0) a c26.6 (34.4) b c
29.2 (82.6) * d e3.7 (91.5) d f−17.7 (76.6) * e f
Sorbets and jellies 0.002
v002.6 (13.4) b6.3 (43.2)10.4 (55.2) b
v017.8 (40.6)4.3 (31.5)3.3 (23.9)
5.1 (38.6) * d e−2.0 (32.0) d−7.1 (57.7) * e
Soft drinks (with/without sugar) <0.001
v0044.8 (113.1) a b93.4 (230.3) a105.1 (207.2) b
v0153.2 (148.3)51.7 (135.1)32.5 (103.3)
8.4 (168.1) d e−41.6 (221.4) * d−72.6 (204.3) * e
Black coffee without sugar 0.852
v0025.9 (38.4)21.6 (37.6)25.9 (44.6)
v0134.4 (43.5)31.1 (43.8)34.2 (42.5)
8.5 (46.1) *9.4 (46.8) *8.2 (54.0) *
Black coffee with sugar 0.477
v0014.8 (32.8)17.5 (34.1)17.7 (35.2)
v0111.0 (1507)14.1 (32.3)10.9 (27.7)
−3.8 (34.7) *−3.4 (37.2)−6.8 (38.3) *
Coffee with milk without sugar 0.008
v0062.6 (113.3)57.8 (104.7)70.3 (116.7)
v01106.4 (124.7) b91.2 (121.4)79.3 (116.7) b
43.8 (147.2) * e33.3 (127.9) *9.0 (148.3) e
Coffee with milk with sugar 0.488
v0026.8 (83.2)35.9 (89.5)34.4 (85.2)
v0122.8 (74.5)26.8 (76.1)18.1 (63.9)
−1.0 (100.6)−9.1 (101.1)−16.3 (101.5) *
Tea without sugar <0.001
v0023.3 (90.4) b35.8 (104.6)48.1 (125.8) b
v0152.8 (156.7) b37.6 (106.3)25.2 (82.7) b
29.4 (155.3) * d e1.8 (125.8) d f−22.8 (133.0) * e f
Tea with sugar 0.804
v009.9 (53.3)12.4 (64.0)11.3 (59.1)
v016.8 (46.9)8.3 (49.7)6.3 (42.5)
−16.5 (103.3)−27.5 (114.7)−41.7 (133.7)
Infusions without sugar 0.296
v0037.3 (104.6)46.1 (139.5)50.2 (121.4)
v0157.5 (123.4)61.4 (129.7)54.1 (116.8)
20.2 (141.2) *15.3 (152.4)3.9 (148.4)
Infusions with sugar 0.576
v0015.4 (70.2)21.1 (81.1)15.4 (74.6)
v0110.8 (56.6)16.1 (70.6)16.8 (73.5)
−4.6 (89.1)−5.1 (94.9)1.4 (96.4)
Beer with and without alcohol <0.001
v0068.3 (156.6) b118.5 (275.1) c194.1 (369.2) b c
v01141.9 (304.4) a b95.9 (275.6) a57.8 (144.2) b
73.5 (301.0) * d e−22.5 (287.1) d f−136.2 (363.6) * e f
Wine <0.001
v0044.6 (84.8) a b64.9 (109.9) a82.6 (123.3) b
v0161.2 (96.7)69.5 (110.1)65.6 (99.2)
16.5 (90.4) * e4.6 (109.8) f−17.1 (119.2) * e f
High proof drinks 0.908
v002.1 (10.9)2.7 (16.1)2.6 (12.2)
v012.0 (9.7)1.3 (8.3)1.4 (8.0)
−0.1 (13.1)−1.3 (17.5)−1.2 (14.3)
Combined drinks 0.075
v001.2 (9.0)3.7 (31.7)4.5 (30.7)
v012.7 (22.8)3.4 (31.7)1.4 (7.7)
1.5 (24.5) e−0.3 (39.5)−3.1 (30.6) * e
Energy drinks 0.645
v000.1 (2.2)1.1 (21.1)0.4 (8.7)
v010.0 (0.0)0.2 (5.2)0.0 (0.0)
−0.1 (2.2)−0.8 (15.8)−0.4 (8.7)
Isotonic drinks 0.091
v001.4 (21.21)0.7 (7.7)3.1 (29.9)
v011.2 (11.4)6.5 (85.6)0.6 (8.9)
−0.2 (24.1)5.7 (86.1) *−2.5 (30.1)
Replacement shakes 0.223
v000.0 (0.0)0.3 (5.7)0.0 (0.0)
v011.0 (20.6)0.0 (0.0)0.0 (0.0)
1.0 (20.6)−0.3 (5.7)0.0 (0.0)
Values are mean (SD). Abbreviations: T1: Tertile 1. T2: Tertile 2. T3: Tertile 3. SD: Standard deviation. V00: Baseline; v01: one-year follow-up. ▲: Differences in beverage consumption between v00 and v01. § Differences by ANOVA in the beverage sustainability score between baseline and at 1-year follow-up distributed in tertiles: T1: beverage score reduction: −4 through −1; T2: no score changes; T3: beverage: 1 through 4. * v00 vs. v01. Different letters mean Bonferroni’s post hoc test: a T1 v00 vs. T2 v00; b T1 v00 vs. T3 v00; c T2 v00 vs. T3 v00; d T1 v01 vs. T3 v01; e T1 v01 vs. T3 v01; f Ts v01 vs. T3 v01. Greenhouse gas emissions, water use, energy use, and land use were considered for the sustainability score calculations. General linear model was calculated between baseline and year 1 and was adjusted by total energy intake and intervention group.
Disclaimer/Publisher’s Note: The statements, opinions and data contained in all publications are solely those of the individual author(s) and contributor(s) and not of MDPI and/or the editor(s). MDPI and/or the editor(s) disclaim responsibility for any injury to people or property resulting from any ideas, methods, instructions or products referred to in the content.

