
Micronutrient Status of Critically Ill Patients with COVID-19 Pneumonia
 , , ,
, , ,
Abstract
:1. Background
2. Methods
2.1. Study Population and Design
2.2. Samples and Measurements
2.3. Power Analysis
2.4. Statistical Analysis
3. Results
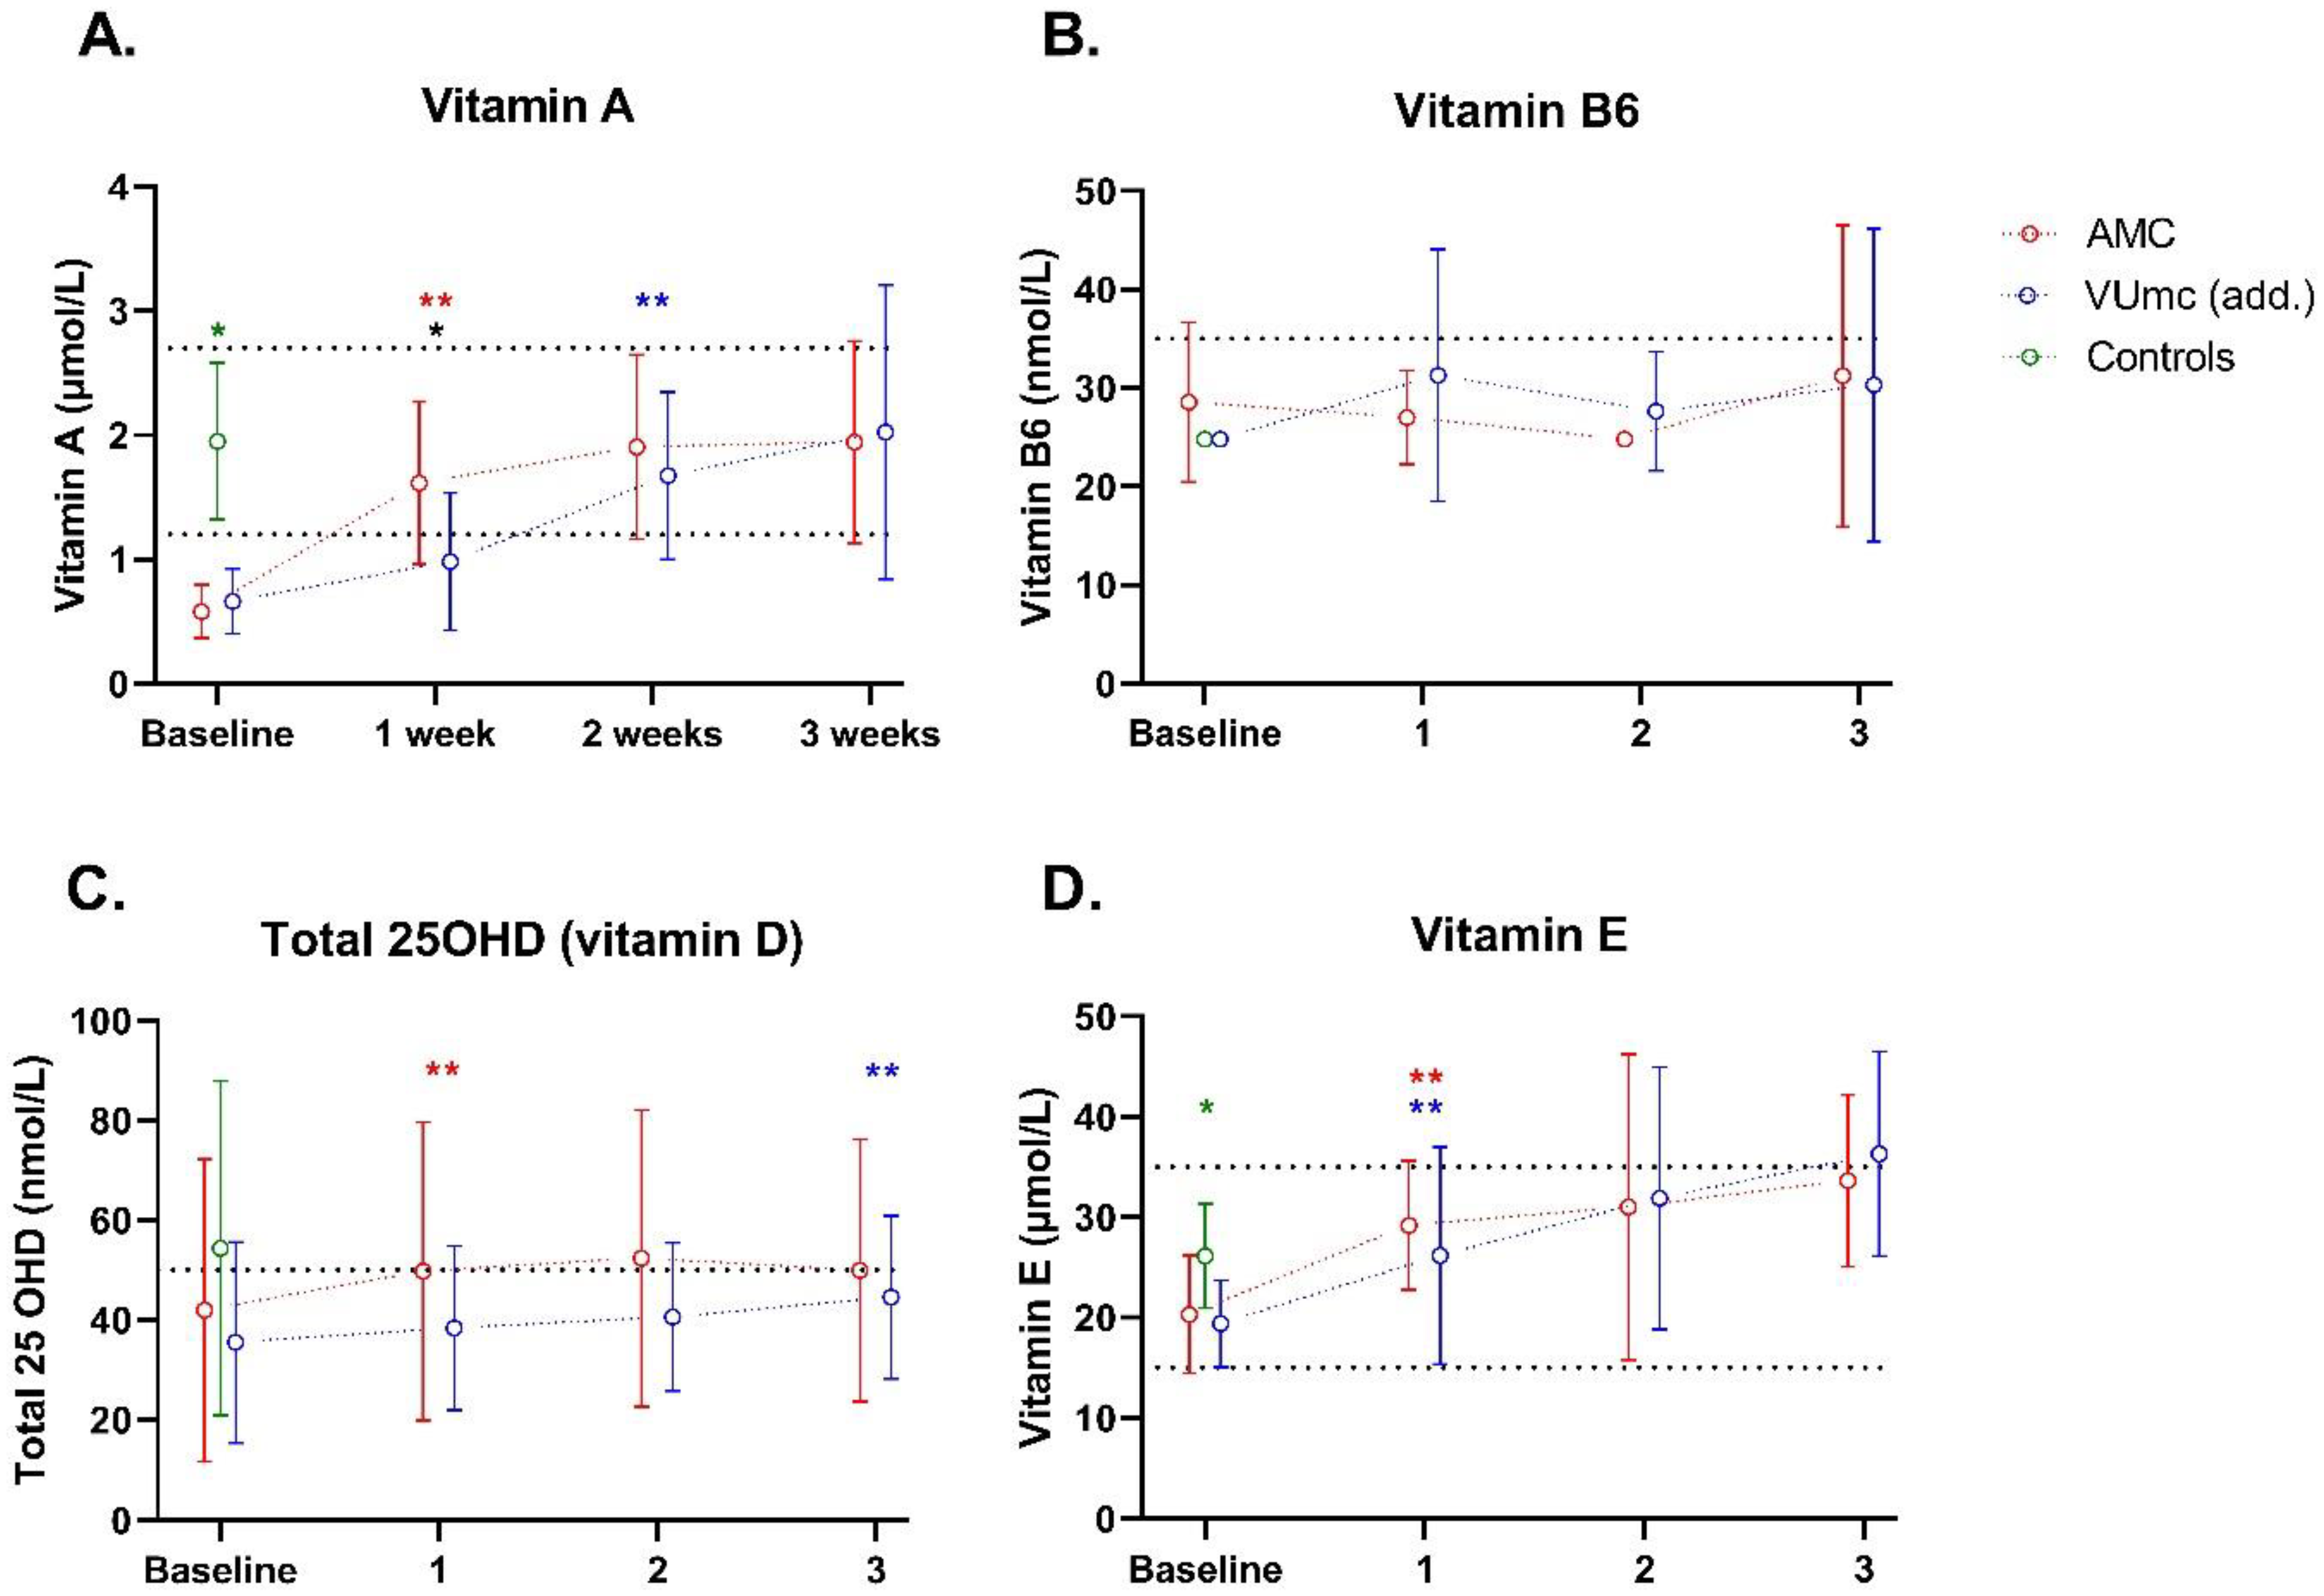
3.1. Vitamins
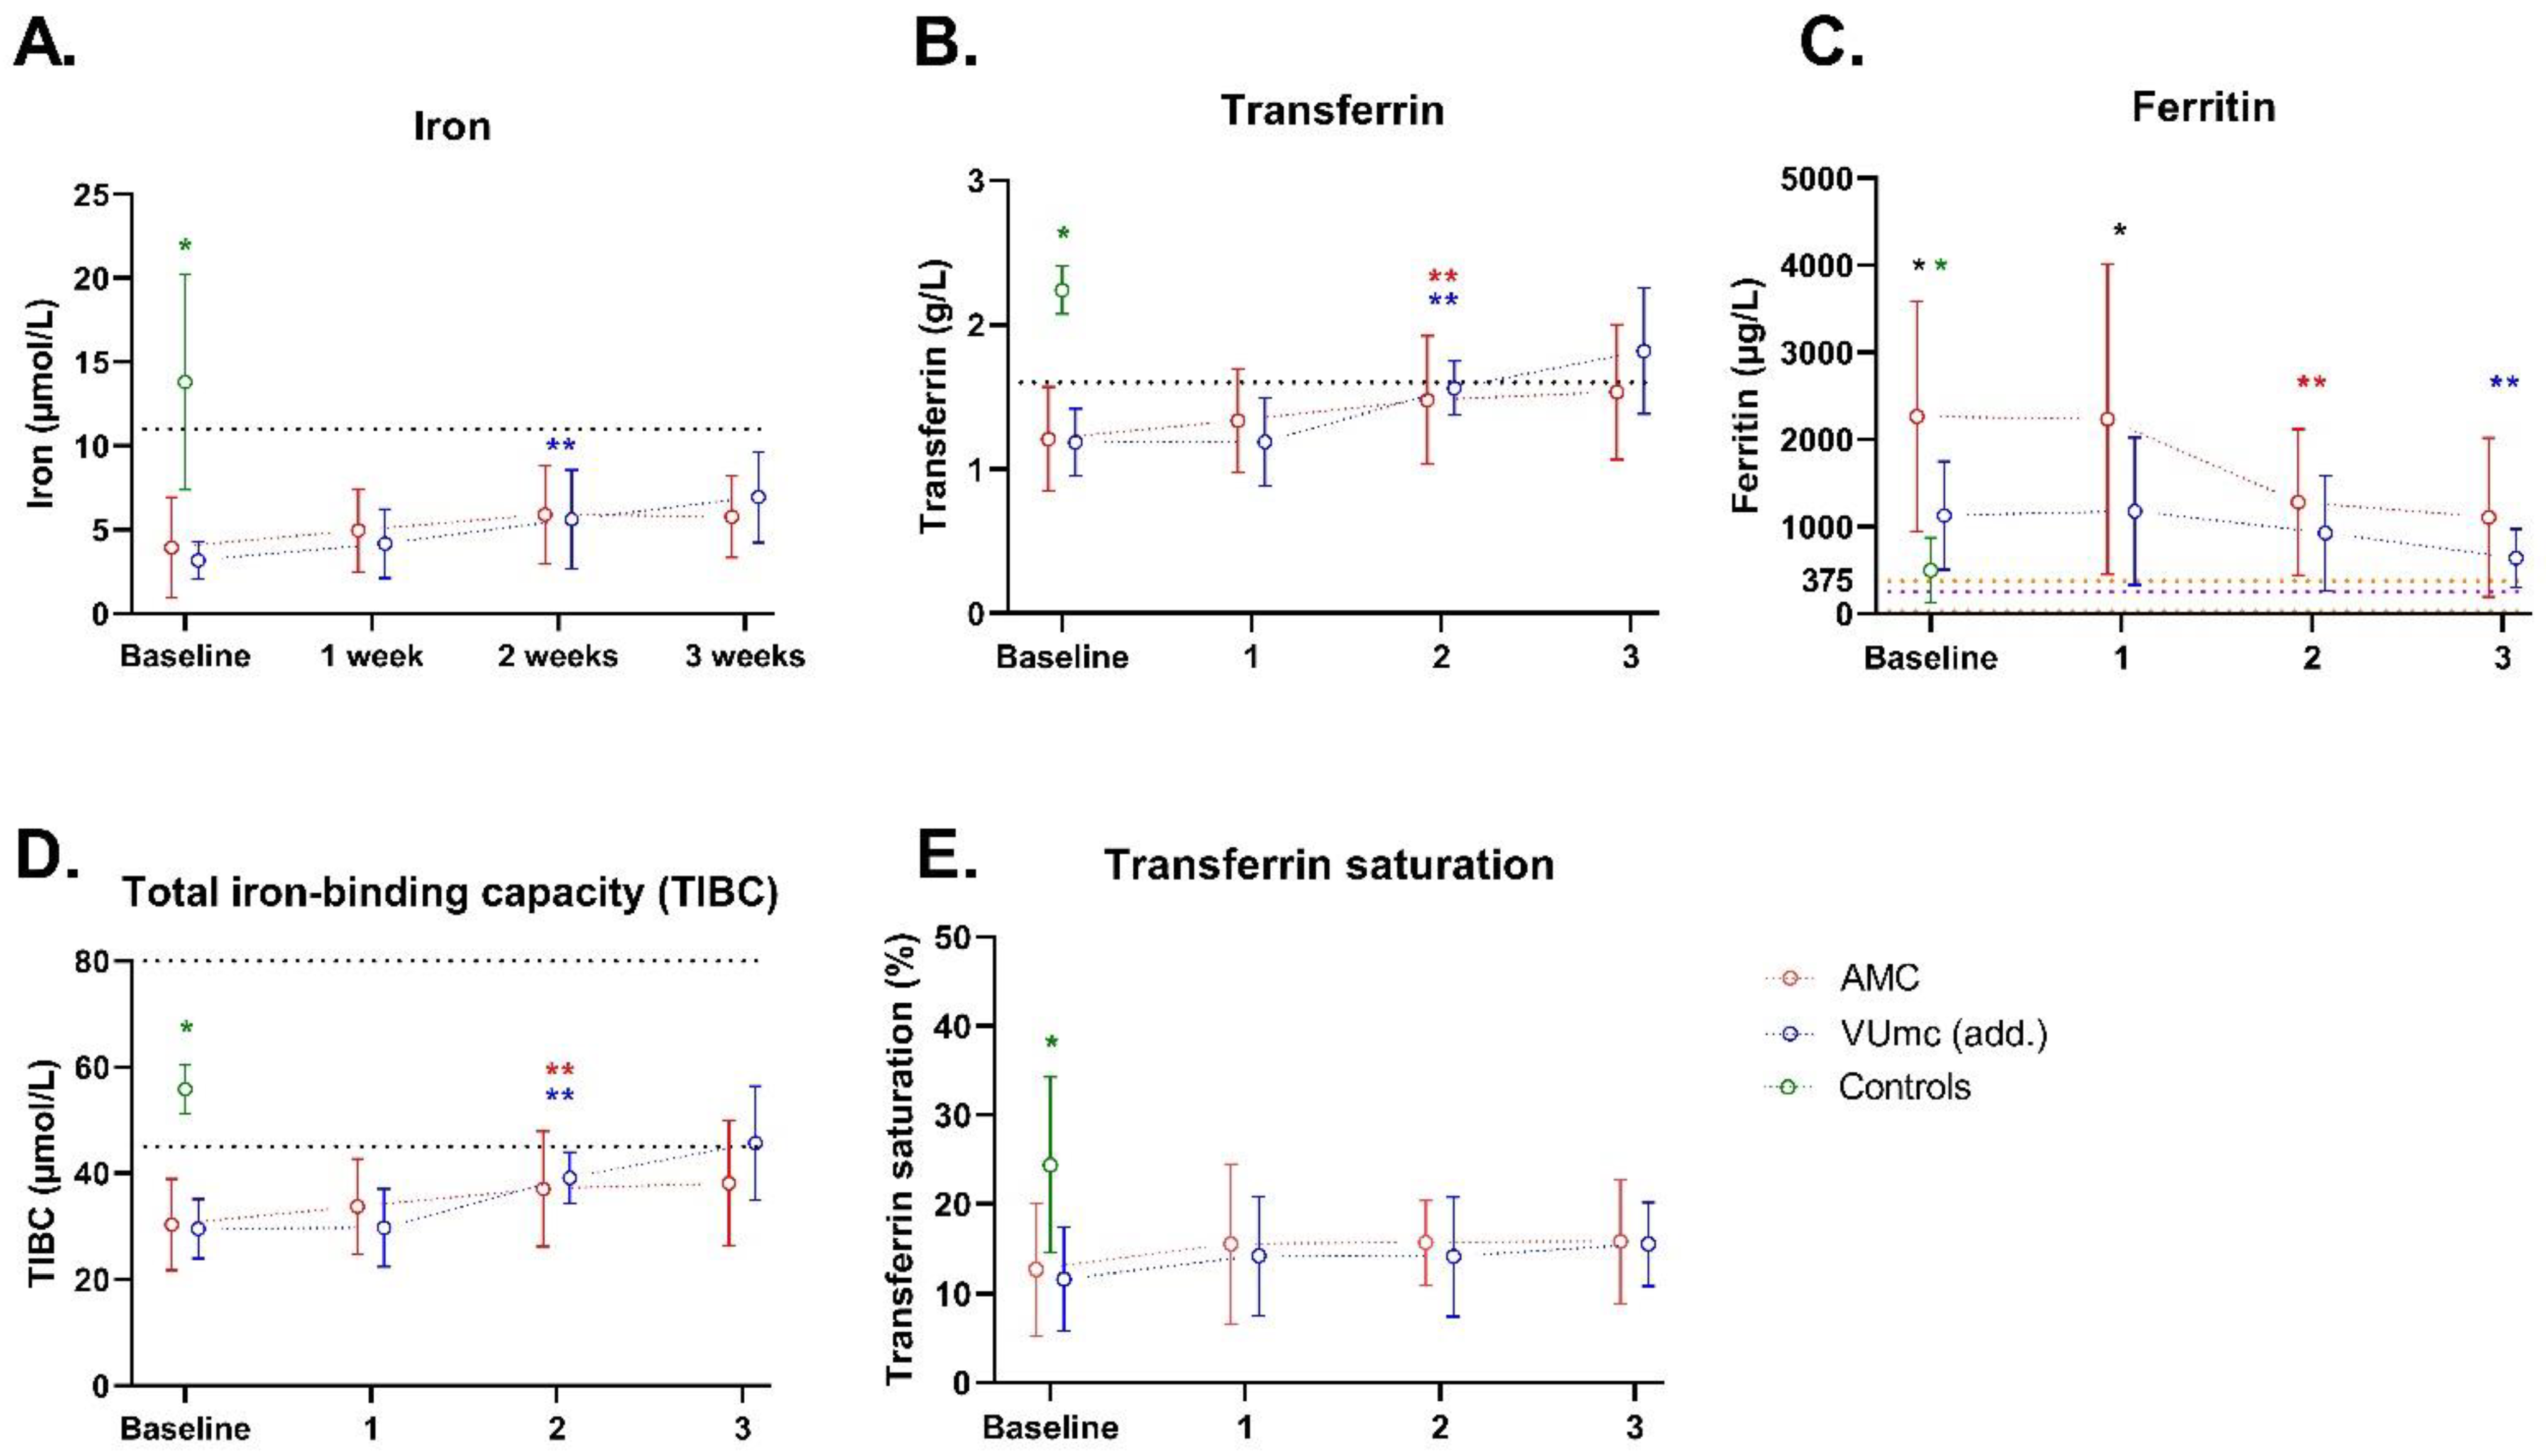
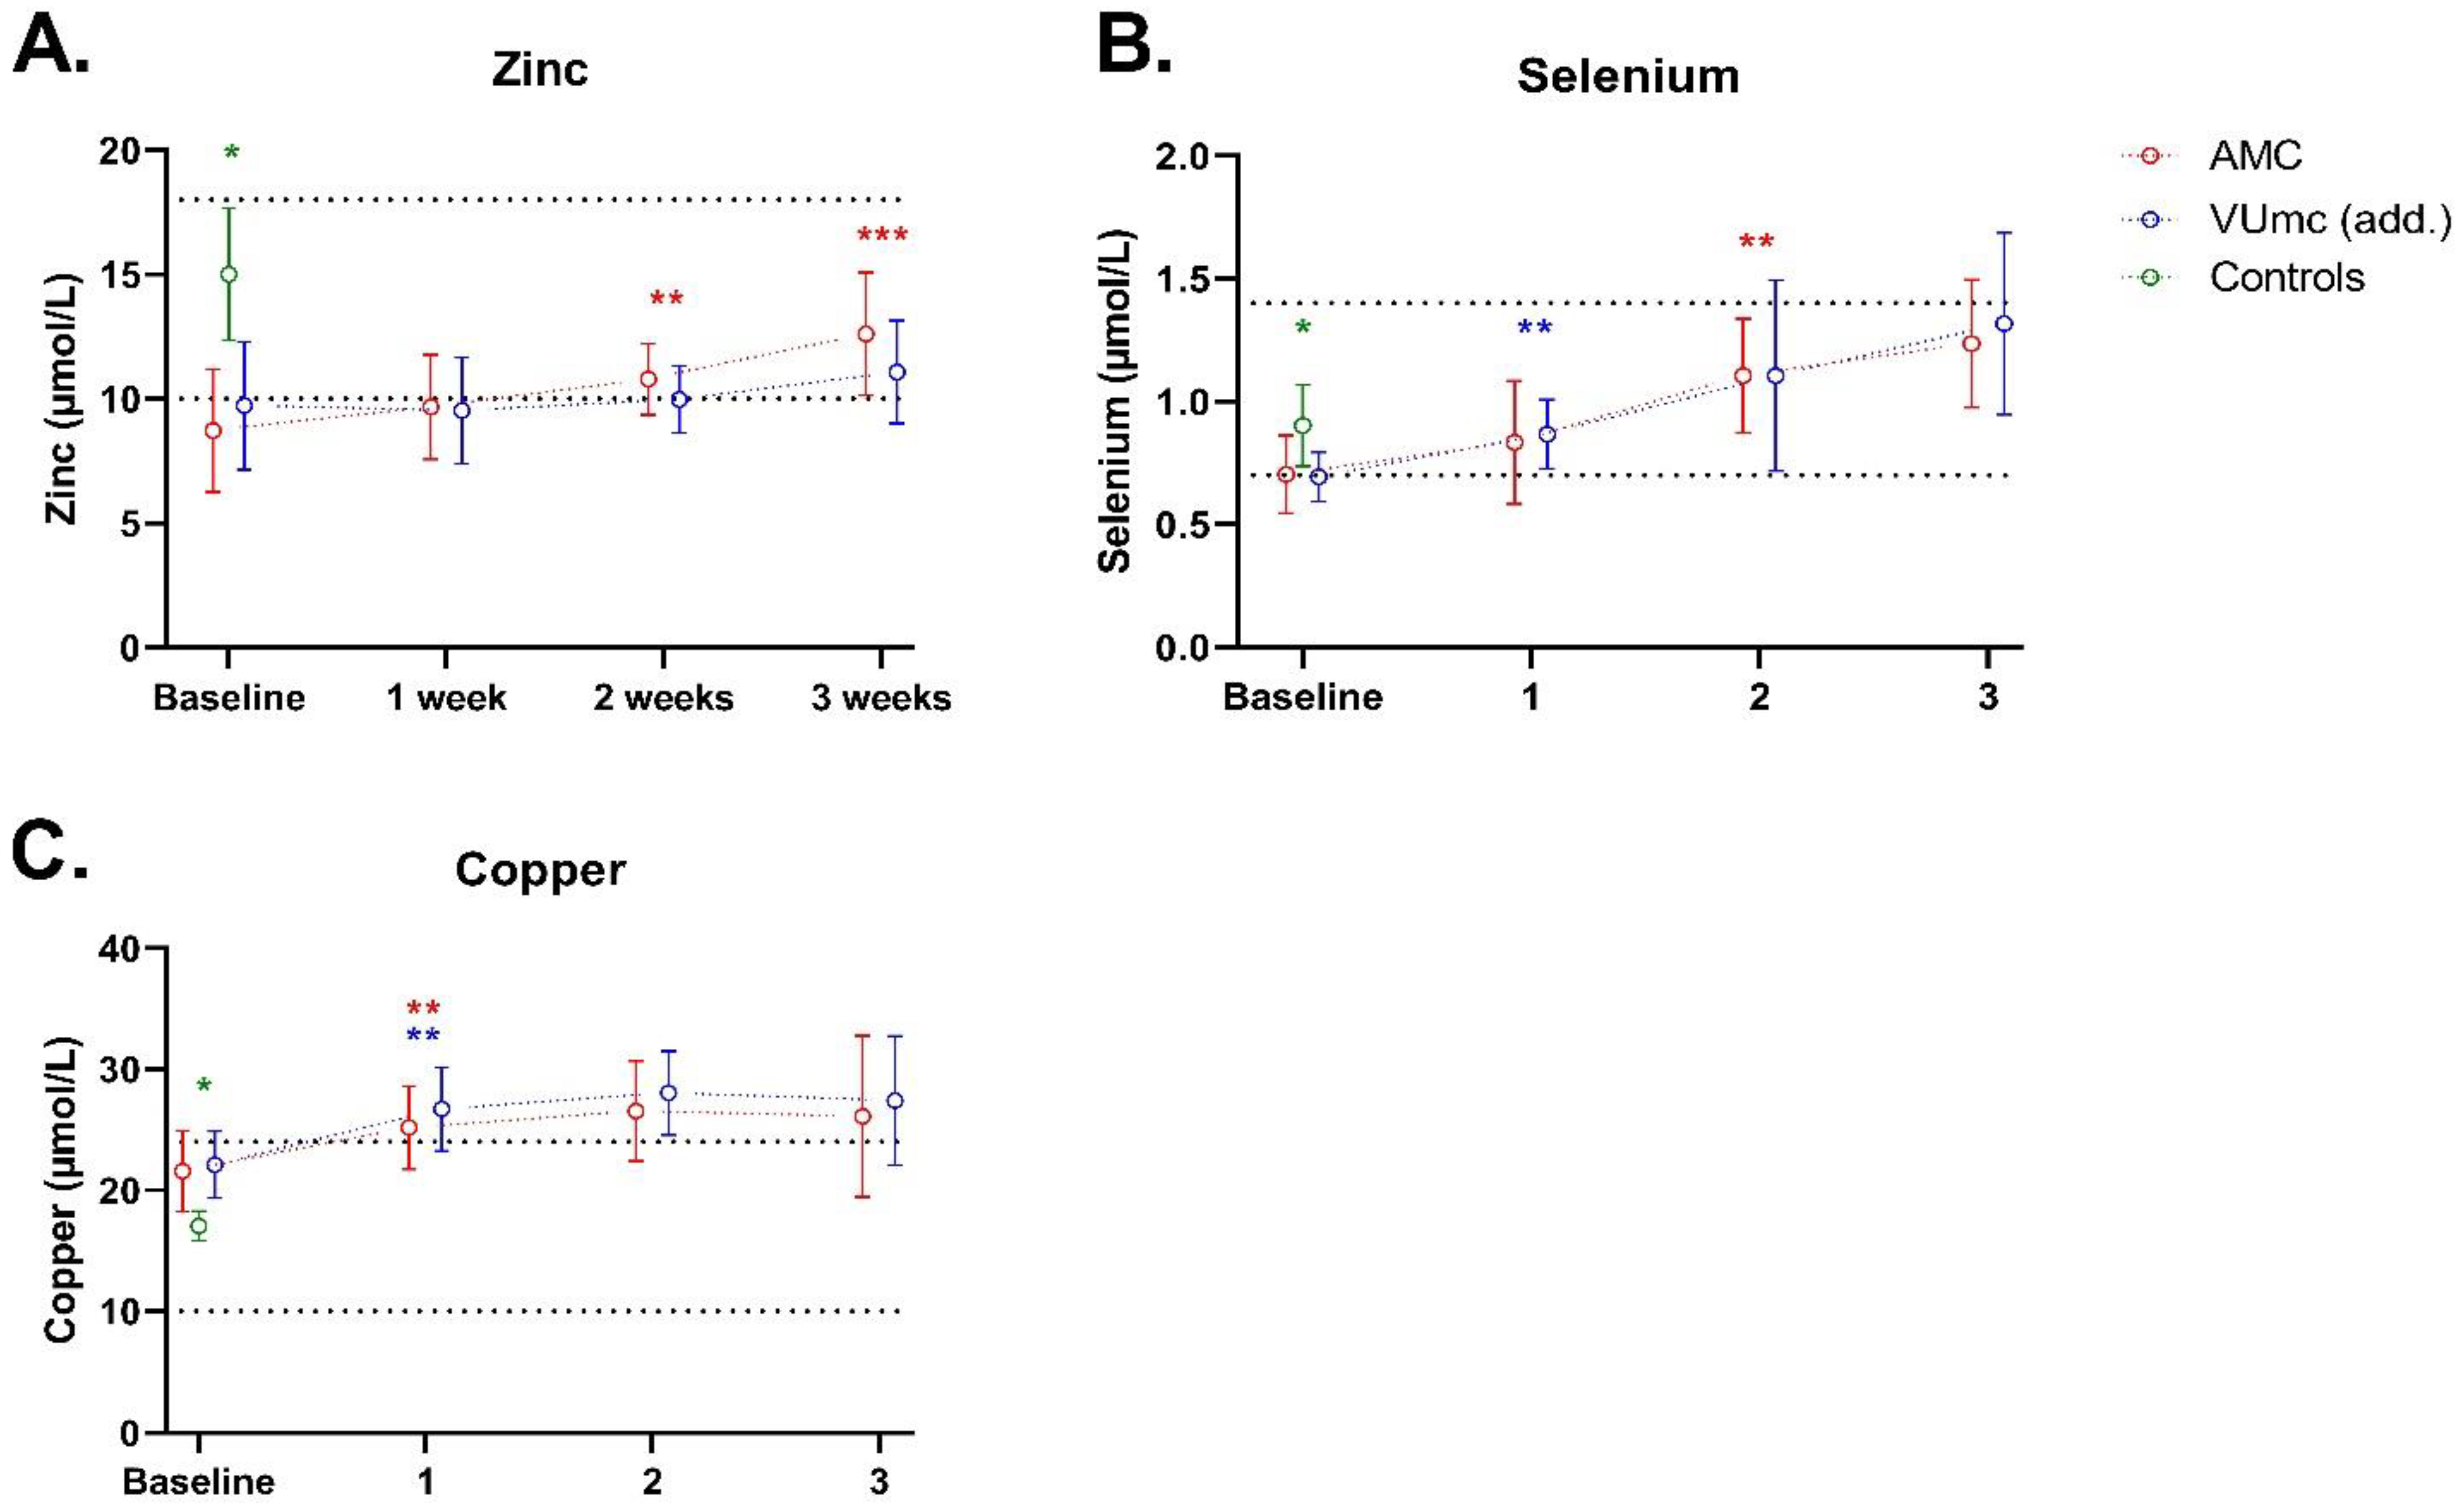
3.2. Trace Elements
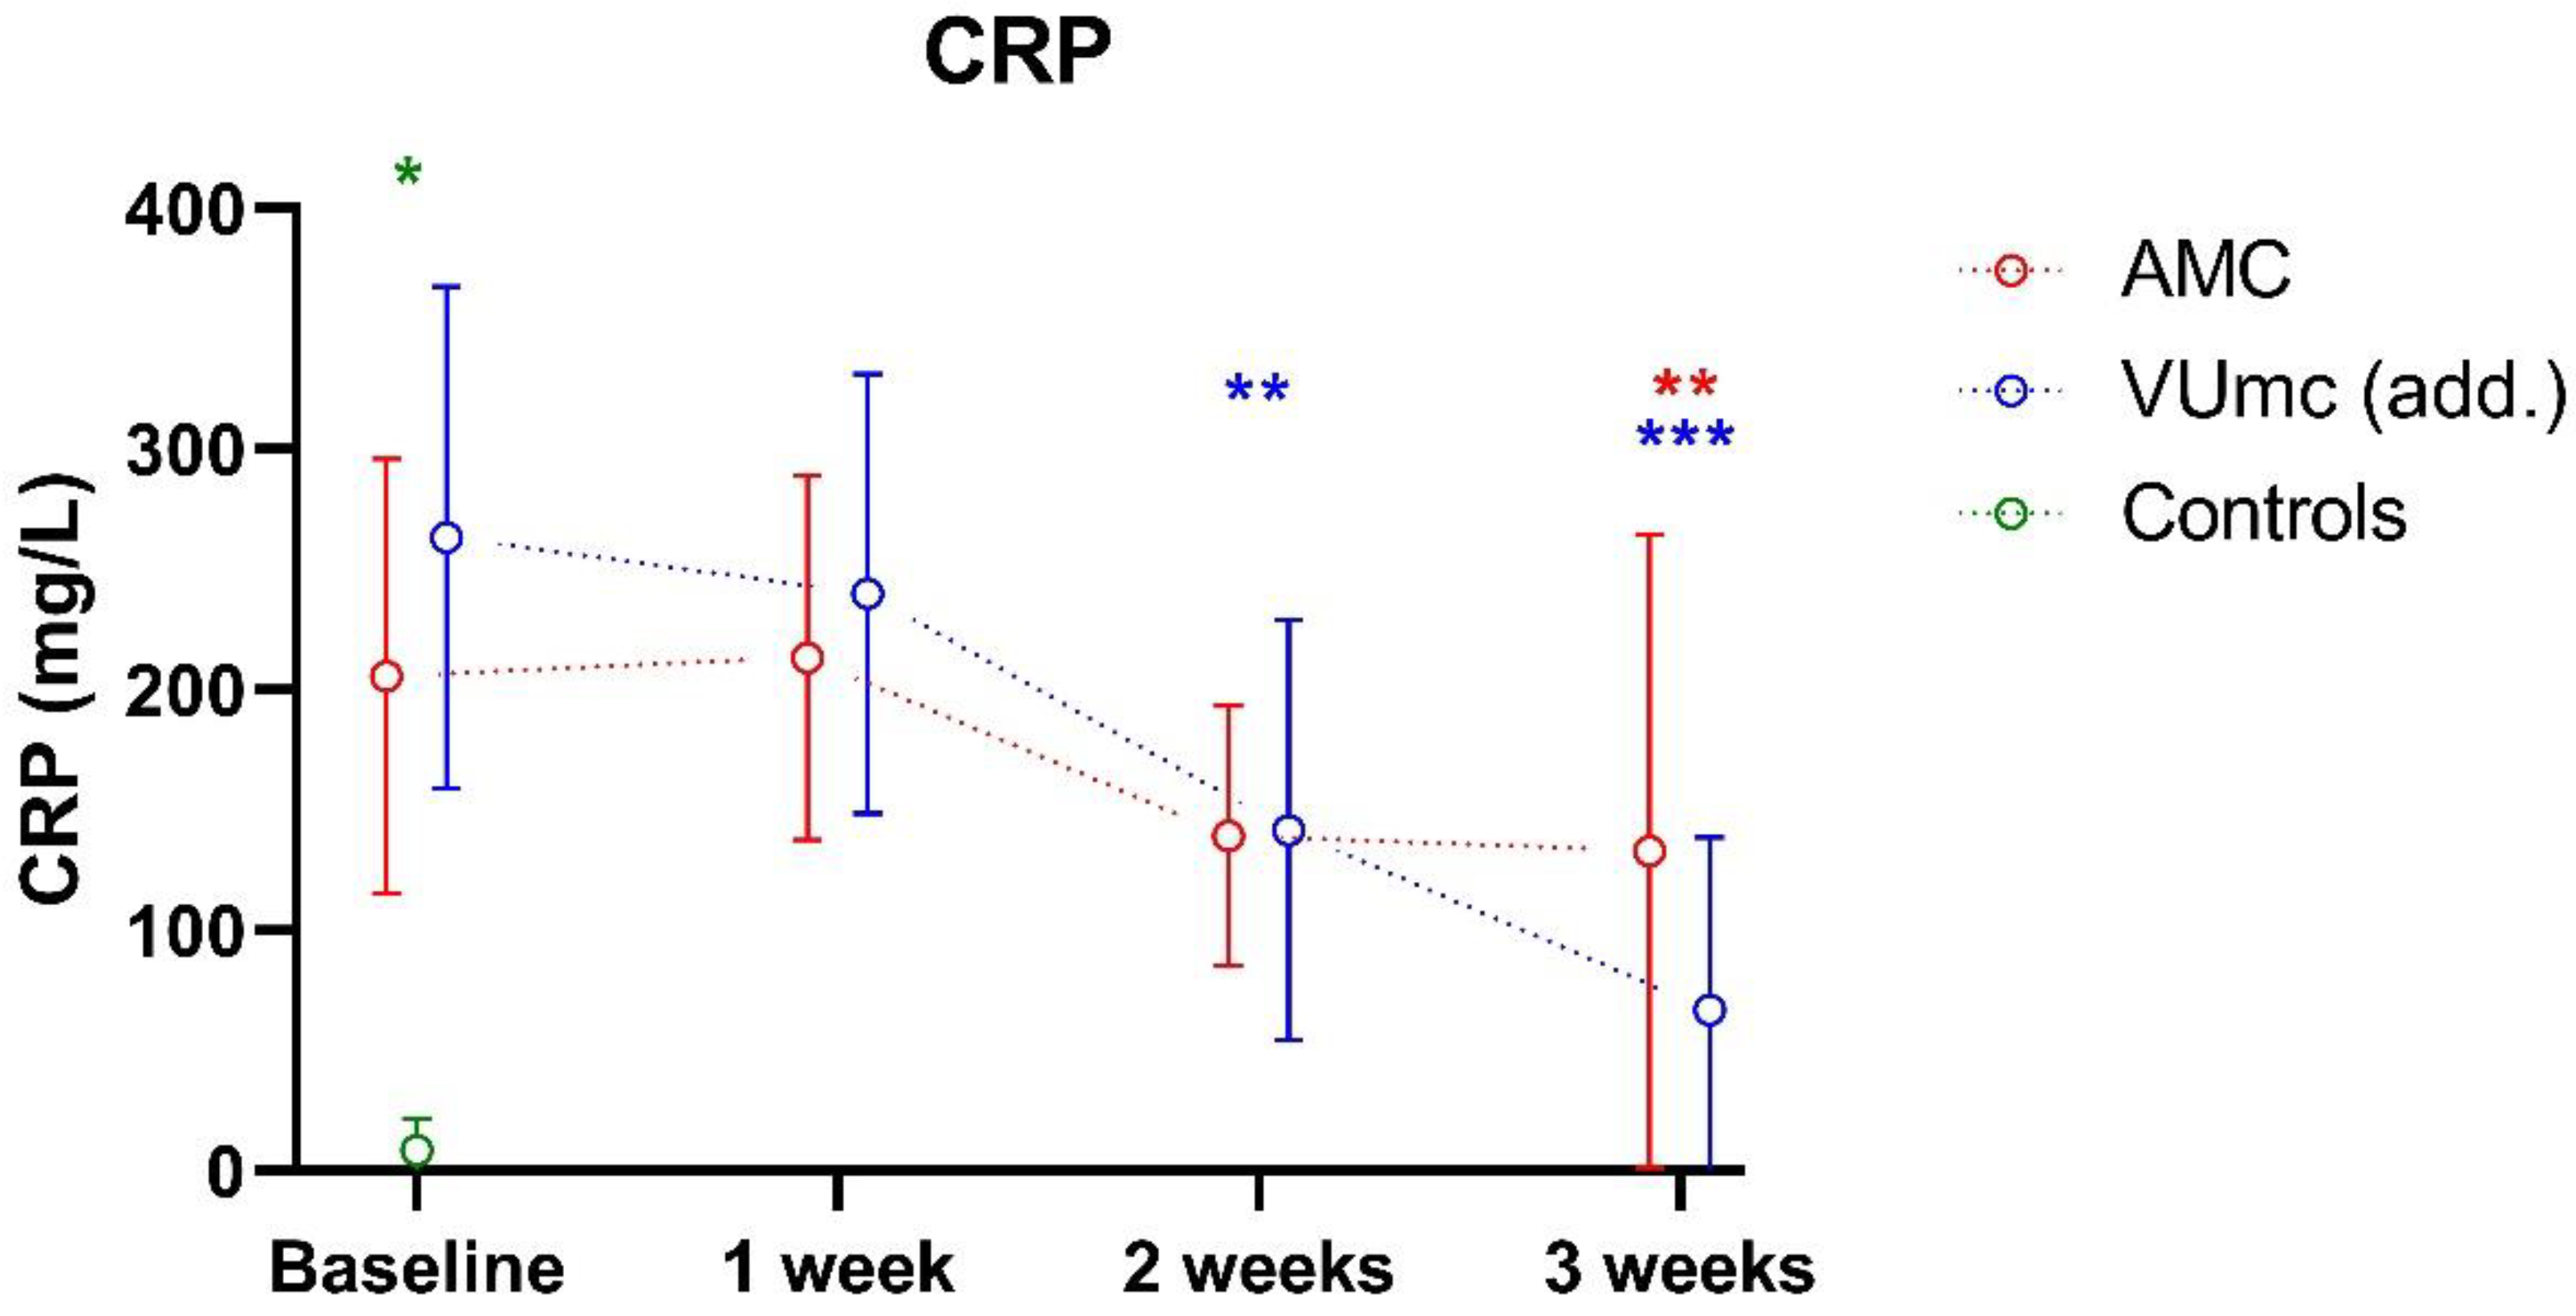
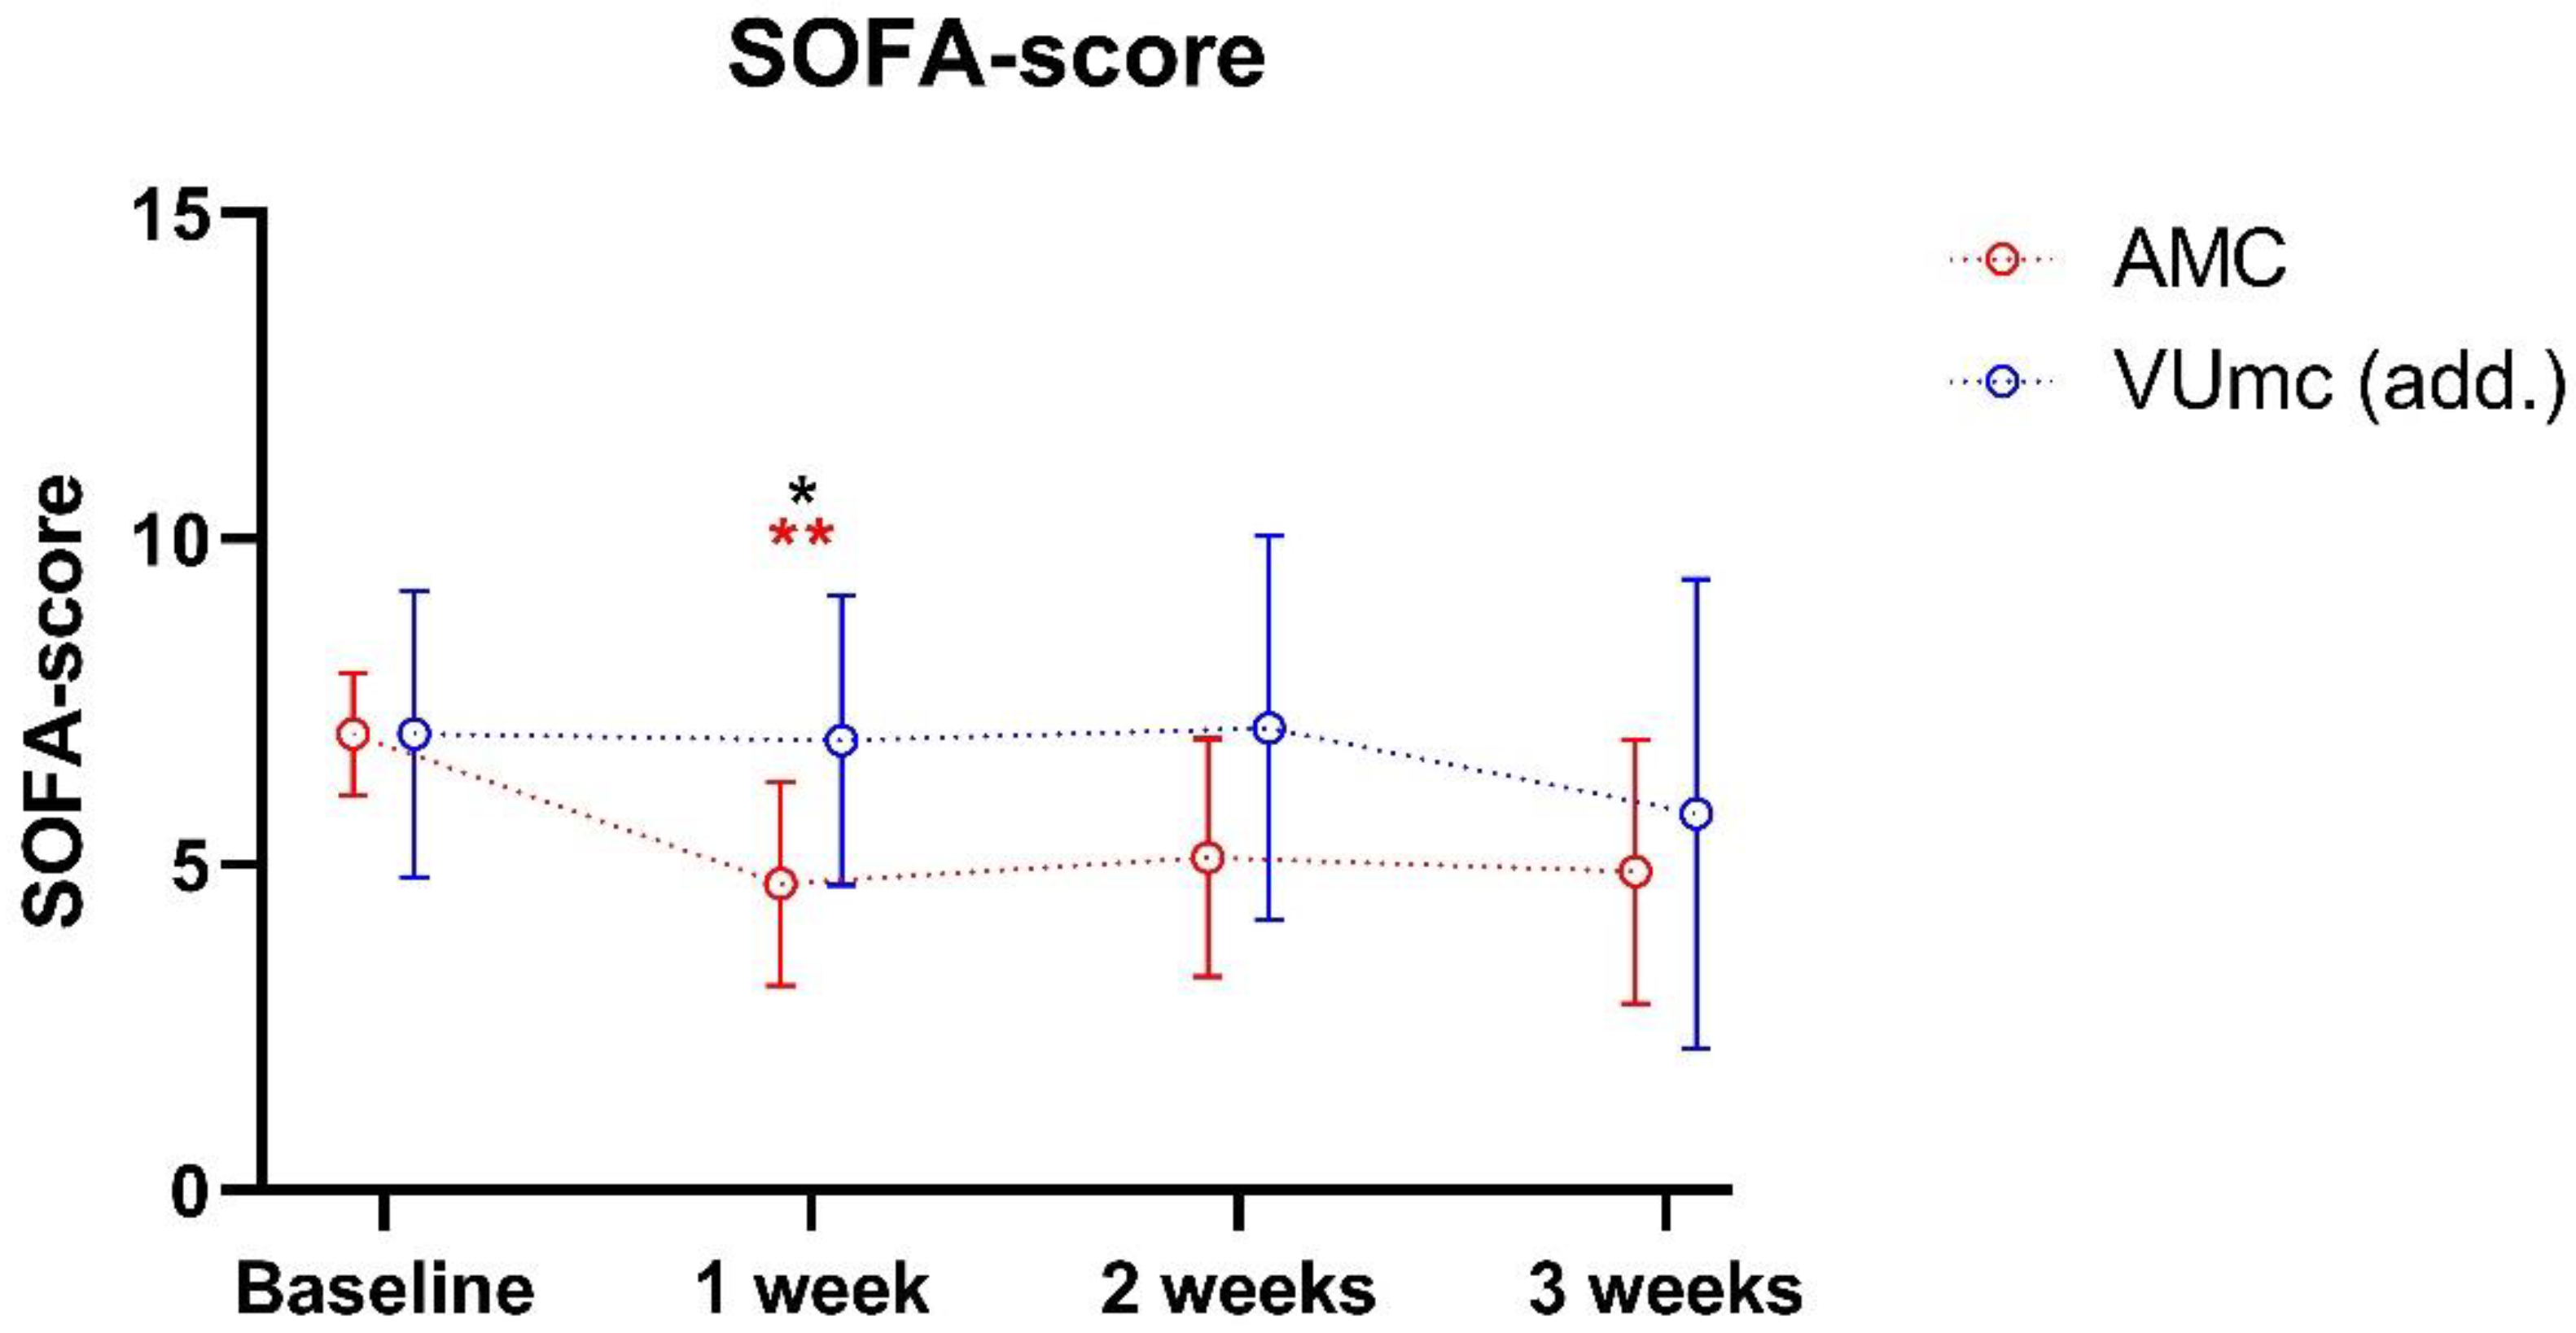
3.3. Degree of Inflammation and Organ Failure during ICU Stay
4. Discussion
4.1. Repletion Studies
4.2. Strengths and Limitations
4.3. Future Directions
5. Conclusions
Supplementary Materials
Author Contributions
Funding
Institutional Review Board Statement
Informed Consent Statement
Data Availability Statement
Acknowledgments
Conflicts of Interest
References
- Romano, L.; Bilotta, F.; Dauri, M.; Macheda, S.; Pujia, A.; De Santis, G.L.; Tarsitano, M.G.; Merra, G.; Di Renzo, L.; Esposito, E.; et al. Short Report—Medical nutrition therapy for critically ill patients with COVID-19. Eur. Rev. Med. Pharmacol. Sci. 2020, 24, 4035–4039. [Google Scholar]
- Zhang, L.; Liu, Y. Potential interventions for novel coronavirus in China: A systematic review. J. Med. Virol. 2020, 92, 479–490. [Google Scholar] [CrossRef]
- Calder, P.C.; Carr, A.C.; Gombart, A.F.; Eggersdorfer, M. Optimal Nutritional Status for a Well-Functioning Immune System Is an Important Factor to Protect against Viral Infections. Nutrients 2020, 12, 1181. [Google Scholar] [CrossRef]
- Fernandez-Quintela, A.; Milton-Laskibar, I.; Trepiana, J.; Gomez-Zorita, S.; Kajarabille, N.; Leniz, A.; Gonzalez, M.; Portillo, M.P. Key Aspects in Nutritional Management of COVID-19 Patients. J. Clin. Med. 2020, 9, 2589. [Google Scholar] [CrossRef]
- Tomasa-Irriguible, T.M.; Bielsa-Berrocal, L.; Bordeje-Laguna, L.; Tural-Llacher, C.; Barallat, J.; Manresa-Dominguez, J.M.; Toran-Monserrat, P. Low Levels of Few Micronutrients May Impact COVID-19 Disease Progression: An Observational Study on the First Wave. Metabolites 2021, 11, 565. [Google Scholar] [CrossRef]
- Panagiotou, G.; Tee, S.A.; Ihsan, Y.; Athar, W.; Marchitelli, G.; Kelly, D.; Boot, C.S.; Stock, N.; Macfarlane, J.; Martineau, A.R.; et al. Low serum 25-hydroxyvitamin D (25[OH]D) levels in patients hospitalized with COVID-19 are associated with greater disease severity. Clin. Endocrinol. 2020, 93, 508–511. [Google Scholar] [CrossRef]
- Im, J.H.; Je, Y.S.; Baek, J.; Chung, M.H.; Kwon, H.Y.; Lee, J.S. Nutritional status of patients with COVID-19. Int. J. Infect. Dis. 2020, 100, 390–393. [Google Scholar] [CrossRef]
- Luo, X.; Liao, Q.; Shen, Y.; Li, H.; Cheng, L. Vitamin D Deficiency Is Associated with COVID-19 Incidence and Disease Severity in Chinese People. J. Nutr. 2021, 151, 98–103. [Google Scholar] [CrossRef]
- Murai, I.H.; Fernandes, A.L.; Sales, L.P.; Pinto, A.J.; Goessler, K.F.; Duran, C.S.C.; Silva, C.B.R.; Franco, A.S.; Macedo, M.B.; Dalmolin, H.H.H.; et al. Effect of a Single High Dose of Vitamin D3 on Hospital Length of Stay in Patients With Moderate to Severe COVID-19: A Randomized Clinical Trial. JAMA 2021, 325, 1053–1060. [Google Scholar] [CrossRef]
- Herrera-Quintana, L.; Gamarra-Morales, Y.; Vázquez-Lorente, H.; Molina-López, J.; Castaño-Pérez, J.; Machado-Casas, J.F.; Coca-Zúñiga, R.; Pérez-Villares, J.M.; Planells, E. Bad Prognosis in Critical Ill Patients with COVID-19 during Short-Term ICU Stay regarding Vitamin D Levels. Nutrients 2021, 13, 1988. [Google Scholar] [CrossRef]
- Jain, A.; Chaurasia, R.; Sengar, N.S.; Singh, M.; Mahor, S.; Narain, S. Analysis of vitamin D level among asymptomatic and critically ill COVID-19 patients and its correlation with inflammatory markers. Sci. Rep. 2020, 10, 20191. [Google Scholar] [CrossRef]
- Vasheghani, M.; Jannati, N.; Baghaei, P.; Rezaei, M.; Aliyari, R.; Marjani, M. The relationship between serum 25-hydroxyvitamin D levels and the severity of COVID-19 disease and its mortality. Sci. Rep. 2021, 11, 17594. [Google Scholar] [CrossRef]
- Shah, A.; Frost, J.N.; Aaron, L.; Donovan, K.; Drakesmith, H.; McKechnie, S.R.; Stanworth, S.J. Systemic hypoferremia and severity of hypoxemic respiratory failure in COVID-19. Crit. Care 2020, 24, 320. [Google Scholar] [CrossRef]
- Bolondi, G.; Russo, E.; Gamberini, E.; Circelli, A.; Meca, M.C.C.; Brogi, E.; Viola, L.; Bissoni, L.; Poletti, V.; Agnoletti, V. Iron metabolism and lymphocyte characterisation during COVID-19 infection in ICU patients: An observational cohort study. World J. Emerg. Surg. 2020, 15, 41. [Google Scholar] [CrossRef]
- Hippchen, T.; Altamura, S.; Muckenthaler, M.U.; Merle, U. ypoferremia is Associated With Increased Hospitalization and Oxygen Demand in COVID-19 Patients. Hemasphere 2020, 4, e492. [Google Scholar] [CrossRef]
- Zhao, K.; Huang, J.; Dai, D.; Feng, Y.; Liu, L.; Nie, S. Serum Iron Level as a Potential Predictor of Coronavirus Disease 2019 Severity and Mortality: A Retrospective Study. Open Forum. Infect. Dis. 2020, 7, ofaa250. [Google Scholar] [CrossRef]
- Patel, O.; Chinni, V.; El-Khoury, J.; Perera, M.; Neto, A.S.; McDonald, C.; See, E.; Jones, D.; Bolton, D.; Bellomo, R.; et al. A pilot double-blind safety and feasibility randomized controlled trial of high-dose intravenous zinc in hospitalized COVID-19 patients. J. Med. Virol. 2021, 93, 3261–3267. [Google Scholar] [CrossRef]
- Notz, Q.; Herrmann, J.; Schlesinger, T.; Helmer, P.; Sudowe, S.; Sun, Q.; Hackler, J.; Roeder, D.; Lotz, C.; Meybohm, P.; et al. Clinical Significance of Micronutrient Supplementation in Critically Ill COVID-19 Patients with Severe ARDS. Nutrients 2021, 13, 2113. [Google Scholar] [CrossRef]
- Moghaddam, A.; Heller, R.A.; Sun, Q.; Seelig, J.; Cherkezov, A.; Seibert, L.; Hackler, J.; Seemann, P.; Diegmann, J.; Pilz, M.; et al. Selenium Deficiency Is Associated with Mortality Risk from COVID-19. Nutrients 2020, 12, 2098. [Google Scholar] [CrossRef]
- Duncan, A.; Talwar, D.; McMillan, D.C.; Stefanowicz, F.; O’Reilly, D.S. Quantitative data on the magnitude of the systemic inflammatory response and its effect on micronutrient status based on plasma measurements. Am. J. Clin. Nutr. 2012, 95, 64–71. [Google Scholar] [CrossRef]
- Berger, M.M.; Shenkin, A.; Schweinlin, A.; Amrein, K.; Augsburger, M.; Biesalski, H.-K.; Bischoff, S.C.; Casaer, M.P.; Gundogan, K.; Lepp, H.-L.; et al. ESPEN micronutrient guideline. Clin. Nutr. 2022, 41, 1357–1424. [Google Scholar] [CrossRef]
- Dirks, N.F.; Ackermans, M.T.; Jonge, R.d.; Heijboer, A.C. Reference values for 24,25-dihydroxyvitamin D and the 25-hydroxyvitamin D/24,25-dihydroxyvitamin D ratio. Clin. Chem. Lab. Med. (CCLM) 2019, 57, e259–e261. [Google Scholar] [CrossRef]
- Driskell, W.J.; Neese, J.W.; Bryant, C.C.; Bashor, M.M. Measurement of vitamin A and vitamin E in human serum by high-performance liquid chromatography. J. Chromatogr. 1982, 231, 439–444. [Google Scholar] [CrossRef]
- Talwar, D.; Quasim, T.; McMillan, D.C.; Kinsella, J.; Williamson, C.; O’Reilly, D.S. Optimisation and validation of a sensitive high-performance liquid chromatography assay for routine measurement of pyridoxal 5-phosphate in human plasma and red cells using pre-column semicarbazide derivatisation. J. Chromatogr. B Analyt. Technol. Biomed. Life Sci. 2003, 792, 333–343. [Google Scholar] [CrossRef]
- Stichting-NICE. Sequential Organ Failure Assessment (SOFA). Available online: https://www.stichting-nice.nl/download/?Groep=Data%20Dictionary&Taal=Engels (accessed on 19 November 2020).
- Dignass, A.; Farrag, K.; Stein, J. Limitations of Serum Ferritin in Diagnosing Iron Deficiency in Inflammatory Conditions. Int. J. Chronic. Dis. 2018, 2018, 9394060. [Google Scholar] [CrossRef]
- Smolders, J.; van den Ouweland, J.; Geven, C.; Pickkers, P.; Kox, M. Letter to the Editor: Vitamin D deficiency in COVID-19: Mixing up cause and consequence. Metabolism 2021, 115, 154434. [Google Scholar] [CrossRef]
- Kazemi, A.; Mohammadi, V.; Aghababaee, S.K.; Golzarand, M.; Clark, C.C.T.; Babajafari, S. Association of Vitamin D Status with SARS-CoV-2 Infection or COVID-19 Severity: A Systematic Review and Meta-analysis. Adv. Nutr. 2021, 12, 1636–1658. [Google Scholar] [CrossRef]
- Bilezikian, J.P.; Binkley, N.; De Luca, H.F.; Fassio, A.; Formenti, A.M.; El-Hajj Fuleihan, G.; Heijboer, A.C.; Giustina, A. Consensus and Controversial Aspects of Vitamin D and COVID-19. J. Clin. Endocrinol. Metab. 2023, 108, 1034–1042. [Google Scholar] [CrossRef]
- Tepasse, P.R.; Vollenberg, R.; Fobker, M.; Kabar, I.; Schmidt, H.; Meier, J.A.; Nowacki, T.; Husing-Kabar, A. Vitamin A Plasma Levels in COVID-19 Patients: A Prospective Multicenter Study and Hypothesis. Nutrients 2021, 13, 2173. [Google Scholar] [CrossRef]
- Fakhrolmobasheri, M.; Mazaheri-Tehrani, S.; Kieliszek, M.; Zeinalian, M.; Abbasi, M.; Karimi, F.; Mozafari, A.M. COVID-19 and Selenium Deficiency: A Systematic Review. Biol. Trace Elem. Res. 2022, 200, 3945–3956. [Google Scholar] [CrossRef]
- Beigmohammadi, M.T.; Bitarafan, S.; Abdollahi, A.; Amoozadeh, L.; Salahshour, F.; Mahmoodi Ali Abadi, M.; Soltani, D.; Motallebnejad, Z.A. The association between serum levels of micronutrients and the severity of disease in patients with COVID-19. Nutrition 2021, 91–92, 111400. [Google Scholar] [CrossRef]
- Beigmohammadi, M.T.; Bitarafan, S.; Hoseindokht, A.; Abdollahi, A.; Amoozadeh, L.; Soltani, D. The effect of supplementation with vitamins A, B, C, D, and E on disease severity and inflammatory responses in patients with COVID-19: A randomized clinical trial. Trials 2021, 22, 802. [Google Scholar] [CrossRef]
- Thomas, S.; Patel, D.; Bittel, B.; Wolski, K.; Wang, Q.; Kumar, A.; Il’Giovine, Z.J.; Mehra, R.; McWilliams, C.; Nissen, S.E.; et al. Effect of High-Dose Zinc and Ascorbic Acid Supplementation vs Usual Care on Symptom Length and Reduction Among Ambulatory Patients With SARS-CoV-2 Infection: The COVID A to Z Randomized Clinical Trial. JAMA Netw. Open 2021, 4, e210369. [Google Scholar] [CrossRef]
- Manzanares, W.; Lemieux, M.; Elke, G.; Langlois, P.L.; Bloos, F.; Heyland, D.K. High-dose intravenous selenium does not improve clinical outcomes in the critically ill: A systematic review and meta-analysis. Crit. Care 2016, 20, 356. [Google Scholar] [CrossRef]
- Mousavi, M.A.; Saghaleini, S.H.; Mahmoodpoor, A.; Ghojazadeh, M.; Mousavi, S.N. Daily parenteral selenium therapy in critically ill patients: An updated systematic review and meta-analysis of randomized controlled trials. Clin. Nutr. ESPEN 2021, 41, 49–58. [Google Scholar] [CrossRef]
- Argano, C.; Mallaci Bocchio, R.; Natoli, G.; Scibetta, S.; Lo Monaco, M.; Corrao, S. Protective Effect of Vitamin D Supplementation on COVID-19-Related Intensive Care Hospitalization and Mortality: Definitive Evidence from Meta-Analysis and Trial Sequential Analysis. Pharmaceuticals 2023, 16, 130. [Google Scholar] [CrossRef]
- Manzanares, W.; Moreira, E.; Hardy, G. Pharmaconutrition revisited for critically ill patients with coronavirus disease 2019 (COVID-19): Does selenium have a place? Nutrition 2021, 81, 110989. [Google Scholar] [CrossRef]


| Patients AMC (n = 10) | Patients VUmc (n = 10) | Controls AMC (n = 5) | |
|---|---|---|---|
| Age (years) | 61 [58–71] | 66 [59–75] | 31 [24–78] |
| Sex, men (%) | 7 (70) | 8 (80) | 3 (60) |
| BMI (kg/m2) | 26.9 [21.0–29.0] | 28.6 [26.1–30.9] | 24.8 b |
| Medical history | |||
| Chronic cardiac disease | 3 | 3 | 1 |
| Hypertension | 6 | 3 | 0 |
| Chronic pulmonary disease | 3 | 0 | 0 |
| Asthma | 2 | 2 | 0 |
| Immunosuppressive medication | 1 | 1 | 0 |
| Obesity | 1 | 4 | n.a. |
| Diabetes without complications | 4 | 2 | 0 |
| Rheumatologic disorder | 1 | 0 | 0 |
| Autoimmune and/or inflammatory diseases | 0 | 1 | 0 |
| Hospital admission | |||
| APACHE II | 17 [16–19] | 14 [10–18] | 10 [0–17] c |
| APACHE IV | 62 [45–78] | 62 [52–68] | 42 [13–68] c |
| SOFA baseline a | 7 [6–8] | 7 [7–8] | 2 [0–4] c |
| Hb baseline | 8.3 [7.3–9.0] | 7.4 [6.2–8.4] | 8.9 [8.3–9.1] |
| Creatinine baseline | 92 [70–118] | 73 [65–106] | 61 [55–72] |
| eGFR baseline | 80 [47–90] | 88 [64–90] | >60 |
| CRP baseline (mg/L) | 209 [129–282] | 255 [200–352] | 2 [1–20] |
| Albumin baseline (g/L) | 22.0 [19.6–27.1] | 20.6 [18.7–25.0] | 39.6 [37.5–40.7] |
| Mechanical ventilation (%) | 100% | 100% | 40% |
| Vasopressor support (%) | 100% | 100% | 0% |
| Total length of stay ICU (days) | 30 [23–46] | 27 [24–36] | 1 [0–2] |
| Dexamethasone treatment (%) | 0% | 20% | 0% |
| Tocilizumab treatment (%) | 0% | 0% | 0% |
Disclaimer/Publisher’s Note: The statements, opinions and data contained in all publications are solely those of the individual author(s) and contributor(s) and not of MDPI and/or the editor(s). MDPI and/or the editor(s) disclaim responsibility for any injury to people or property resulting from any ideas, methods, instructions or products referred to in the content. |
© 2024 by the authors. Licensee MDPI, Basel, Switzerland. This article is an open access article distributed under the terms and conditions of the Creative Commons Attribution (CC BY) license (https://creativecommons.org/licenses/by/4.0/).
Share and Cite
Rozemeijer, S.; Hamer, H.M.; Heijboer, A.C.; de Jonge, R.; Jimenez, C.R.; Juffermans, N.P.; Dujardin, R.W.G.; Girbes, A.R.J.; de Man, A.M.E. Micronutrient Status of Critically Ill Patients with COVID-19 Pneumonia. Nutrients 2024, 16, 385. https://doi.org/10.3390/nu16030385
Rozemeijer S, Hamer HM, Heijboer AC, de Jonge R, Jimenez CR, Juffermans NP, Dujardin RWG, Girbes ARJ, de Man AME. Micronutrient Status of Critically Ill Patients with COVID-19 Pneumonia. Nutrients. 2024; 16(3):385. https://doi.org/10.3390/nu16030385
Chicago/Turabian StyleRozemeijer, Sander, Henrike M. Hamer, Annemieke C. Heijboer, Robert de Jonge, Connie R. Jimenez, Nicole P. Juffermans, Romein W. G. Dujardin, Armand R. J. Girbes, and Angélique M. E. de Man. 2024. "Micronutrient Status of Critically Ill Patients with COVID-19 Pneumonia" Nutrients 16, no. 3: 385. https://doi.org/10.3390/nu16030385