Article

PNPLA3 Genotype and Dietary Fat Modify Concentrations of Plasma and Fecal Short Chain Fatty Acids and Plasma Branched-Chain Amino Acids

1
Department of Medicine, Endoscopy Unit, Kuopio University Hospital, 70029 Kuopio, Finland
2
Institute of Public Health and Clinical Nutrition, University of Eastern Finland, 70210 Kuopio, Finland
3
School of Biological Sciences, University of Hong Kong, Pokfulam, Hong Kong, China
4
Diagnostic Imaging Centre, Department of Clinical Radiology, Kuopio University Hospital, 70029 Kuopio, Finland
5
Institute of Clinical Medicine, Internal Medicine, University of Eastern Finland, 70211 Kuopio, Finland
6
Department of Medicine, Kuopio University Hospital, 70029 Kuopio, Finland
7
Department of Medicine, Endocrinology and Clinical Nutrition, Kuopio University Hospital, 70029 Kuopio, Finland
*
Author to whom correspondence should be addressed.
Nutrients 2024, 16(2), 261; https://doi.org/10.3390/nu16020261
Submission received: 1 November 2023 / Revised: 11 December 2023 / Accepted: 25 December 2023 / Published: 16 January 2024

Abstract

:
The GG genotype of the Patatin-like phosphatase domain-containing 3 (PNPLA3), dietary fat, short-chain fatty acids (SCFA) and branched-chain amino acids (BCAA) are linked with non-alcoholic fatty liver disease. We studied the impact of the quality of dietary fat on plasma (p) and fecal (f) SCFA and p-BCAA in men homozygous for the PNPLA3 rs738409 variant (I148M). Eighty-eight randomly assigned men (age 67.8 ± 4.3 years, body mass index 27.1 ± 2.5 kg/m2) participated in a 12-week diet intervention. The recommended diet (RD) group followed the National and Nordic nutrition recommendations for fat intake. The average diet (AD) group followed the average fat intake in Finland. The intervention resulted in a decrease in total p-SCFAs and iso-butyric acid in the RD group (p = 0.041 and p = 0.002). Valeric acid (p-VA) increased in participants with the GG genotype regardless of the diet (RD, 3.6 ± 0.6 to 7.0 ± 0.6 µmol/g, p = 0.005 and AD, 3.8 ± 0.3 to 9.7 ± 8.5 µmol/g, p = 0.015). Also, genotype relation to p-VA was seen statistically significantly in the RD group (CC: 3.7 ± 0.4 to 4.2 ± 1.7 µmol/g and GG: 3.6 ± 0.6 to 7.0 ± 0.6 µmol/g, p = 0.0026 for time and p = 0.004 for time and genotype). P-VA, unlike any other SCFA, correlated positively with plasma gamma-glutamyl transferase (r = 0.240, p = 0.025). Total p-BCAAs concentration changed in the AD group comparing PNPLA3 CC and GG genotypes (CC: 612 ± 184 to 532 ± 149 µmol/g and GG: 587 ± 182 to 590 ± 130 µmol/g, p = 0.015 for time). Valine decreased in the RD group (p = 0.009), and leucine decreased in the AD group (p = 0.043). RD decreased total fecal SCFA, acetic acid (f-AA), and butyric acid (f-BA) in those with CC genotype (p = 0.006, 0.013 and 0.005, respectively). Our results suggest that the PNPLA3 genotype modifies the effect of dietary fat modification for p-VA, total f-SCFA, f-AA and f-BA, and total p-BCAA.

1. Introduction

The rs738409 variant (I148M) of the Patatin-like phosphatase domain-containing 3 (PNPLA3) gene is the most common gene associated with non-alcoholic fatty liver disease (NAFLD) [1,2], a condition contributed by genetic factors in one-third of individuals [3]. The prevalence of the G risk allele of PNPLA3 varies from 17% to 50% in different populations [4]. In the Finnish population, the prevalence of the GG genotype is 6% [5]. Increased total energy intake and the PNPLA3 risk genotype GG have been associated with non-alcoholic steatohepatitis (NASH) [6]. NAFLD is a common liver disease [7,8,9] associated with metabolic syndrome. Diet and genetic background affect the risk of NAFLD [3,9,10,11,12,13].
It has been reviewed that genetic variability modifies short-chain fatty acid (SCFA) metabolism [14], and genes and dietary fatty acids regulate fatty acid composition [15]. Western diet, including high-calorie intake and excess proportion of saturated fats (SFA), is associated with the risk of NAFLD and obesity [16,17]. SFA, but not polyunsaturated fat (PUFA), increases intrahepatic triglycerides [18,19] and obesity [20]. In Finland, the recommendation of SFA intake (<10% of total energy) is achieved by only one of 20 individuals [21]. Also, many dietary fat interventions have been reviewed in relation to NAFLD [22] but not in relation to the NAFLD risk gene PNPLA3.
SCFAs are produced by the gut microbiota through saccharolytic fermentation [23] and consist of acetic acid (AA); propionic acid (PA); butyric acid (BA), including iso-butyric acid (IBA); and, to a lesser amount, valeric acid (VA). Plasma SCFAs are beneficial for health and improve intestinal barrier function [24] and are involved in energy homeostasis [25]. Plasma BA and PA serve as substrates for lipogenesis and gluconeogenesis in the liver [26]. On the other hand, high f-SCFA levels have been found to be associated with gut dysbiosis, excess adiposity, cardiometabolic risk factors [27] and NAFLD [26,28]. The branched-chain SCFA IBA is the proteolytic fermentation product of branched-chain amino acids (BCAAs) and influences glucose and lipid metabolism in adipocytes [29]. A calorie restriction diet or a low-calorie Mediterranean or vegetarian diet decreased or had no effect on f-SCFAs [30,31], but the effects of dietary fat quality modification on the SCFAs or BCAAs have not been reported yet. Interaction between the GG genotype of PNPLA3, essential fatty acids and carbohydrates have been reported in NAFLD [32], but the interaction of PNPLA3 with SCFA and BCAA has not yet been published.
Plasma BCAAs, including valine (VAL), leucine (LEU) and isoleucine (ILEU), are absorbed from the diet, with meat and dairy products being the main sources [33,34]. High-protein or high-energy diets, as well as muscle catabolism, are known to increase p-BCAA concentrations [35,36]. In mice, tissue levels of BCAAs were increased by light exercise [37]. P-BCAA concentrations are higher in male, obese individuals with insulin resistance or diabetes, cardiovascular disease and subjects with NASH compared to simple liver steatosis [33,35,38,39,40,41,42], but the causative relation to these diseases is not clear [43,44,45]. In another study, obese people with NAFLD had higher p-VAL compared to lean people with NAFLD [46]. Both p-VAL and p-LEU are proposed as cardiometabolic risk factors [47]. P-ILE can prevent plasma glucose increase by stimulating glucose intake in muscle and prevent obesity and hyperinsulinemia in rats and mice [48,49].
The linkage between the PNPLA3 gene, diet fat, NAFLD, SCFAs and BCAAs has been proposed. However, a study combining them all into one setting has not yet been published. Further, the knowledge of the effect of dietary fat modification in those with high genetic risk of NAFLD is limited. A recent review [50] suggested that having a further understanding of SCFA could allow a more personalized dietary therapy for patients with obesity, which is closely linked to NAFLD. Therefore, the primary aim of this study was to examine whether the effect of dietary fat modification on plasma and fecal SCFA and plasma BCAA differ in carriers of PNPLA3 rs738409 CC or GG genotype. As a secondary aim, we studied the association of SCFAs and BCAAs to liver- and diabetes-associated factors and clinical characteristics.

2. Materials and Methods

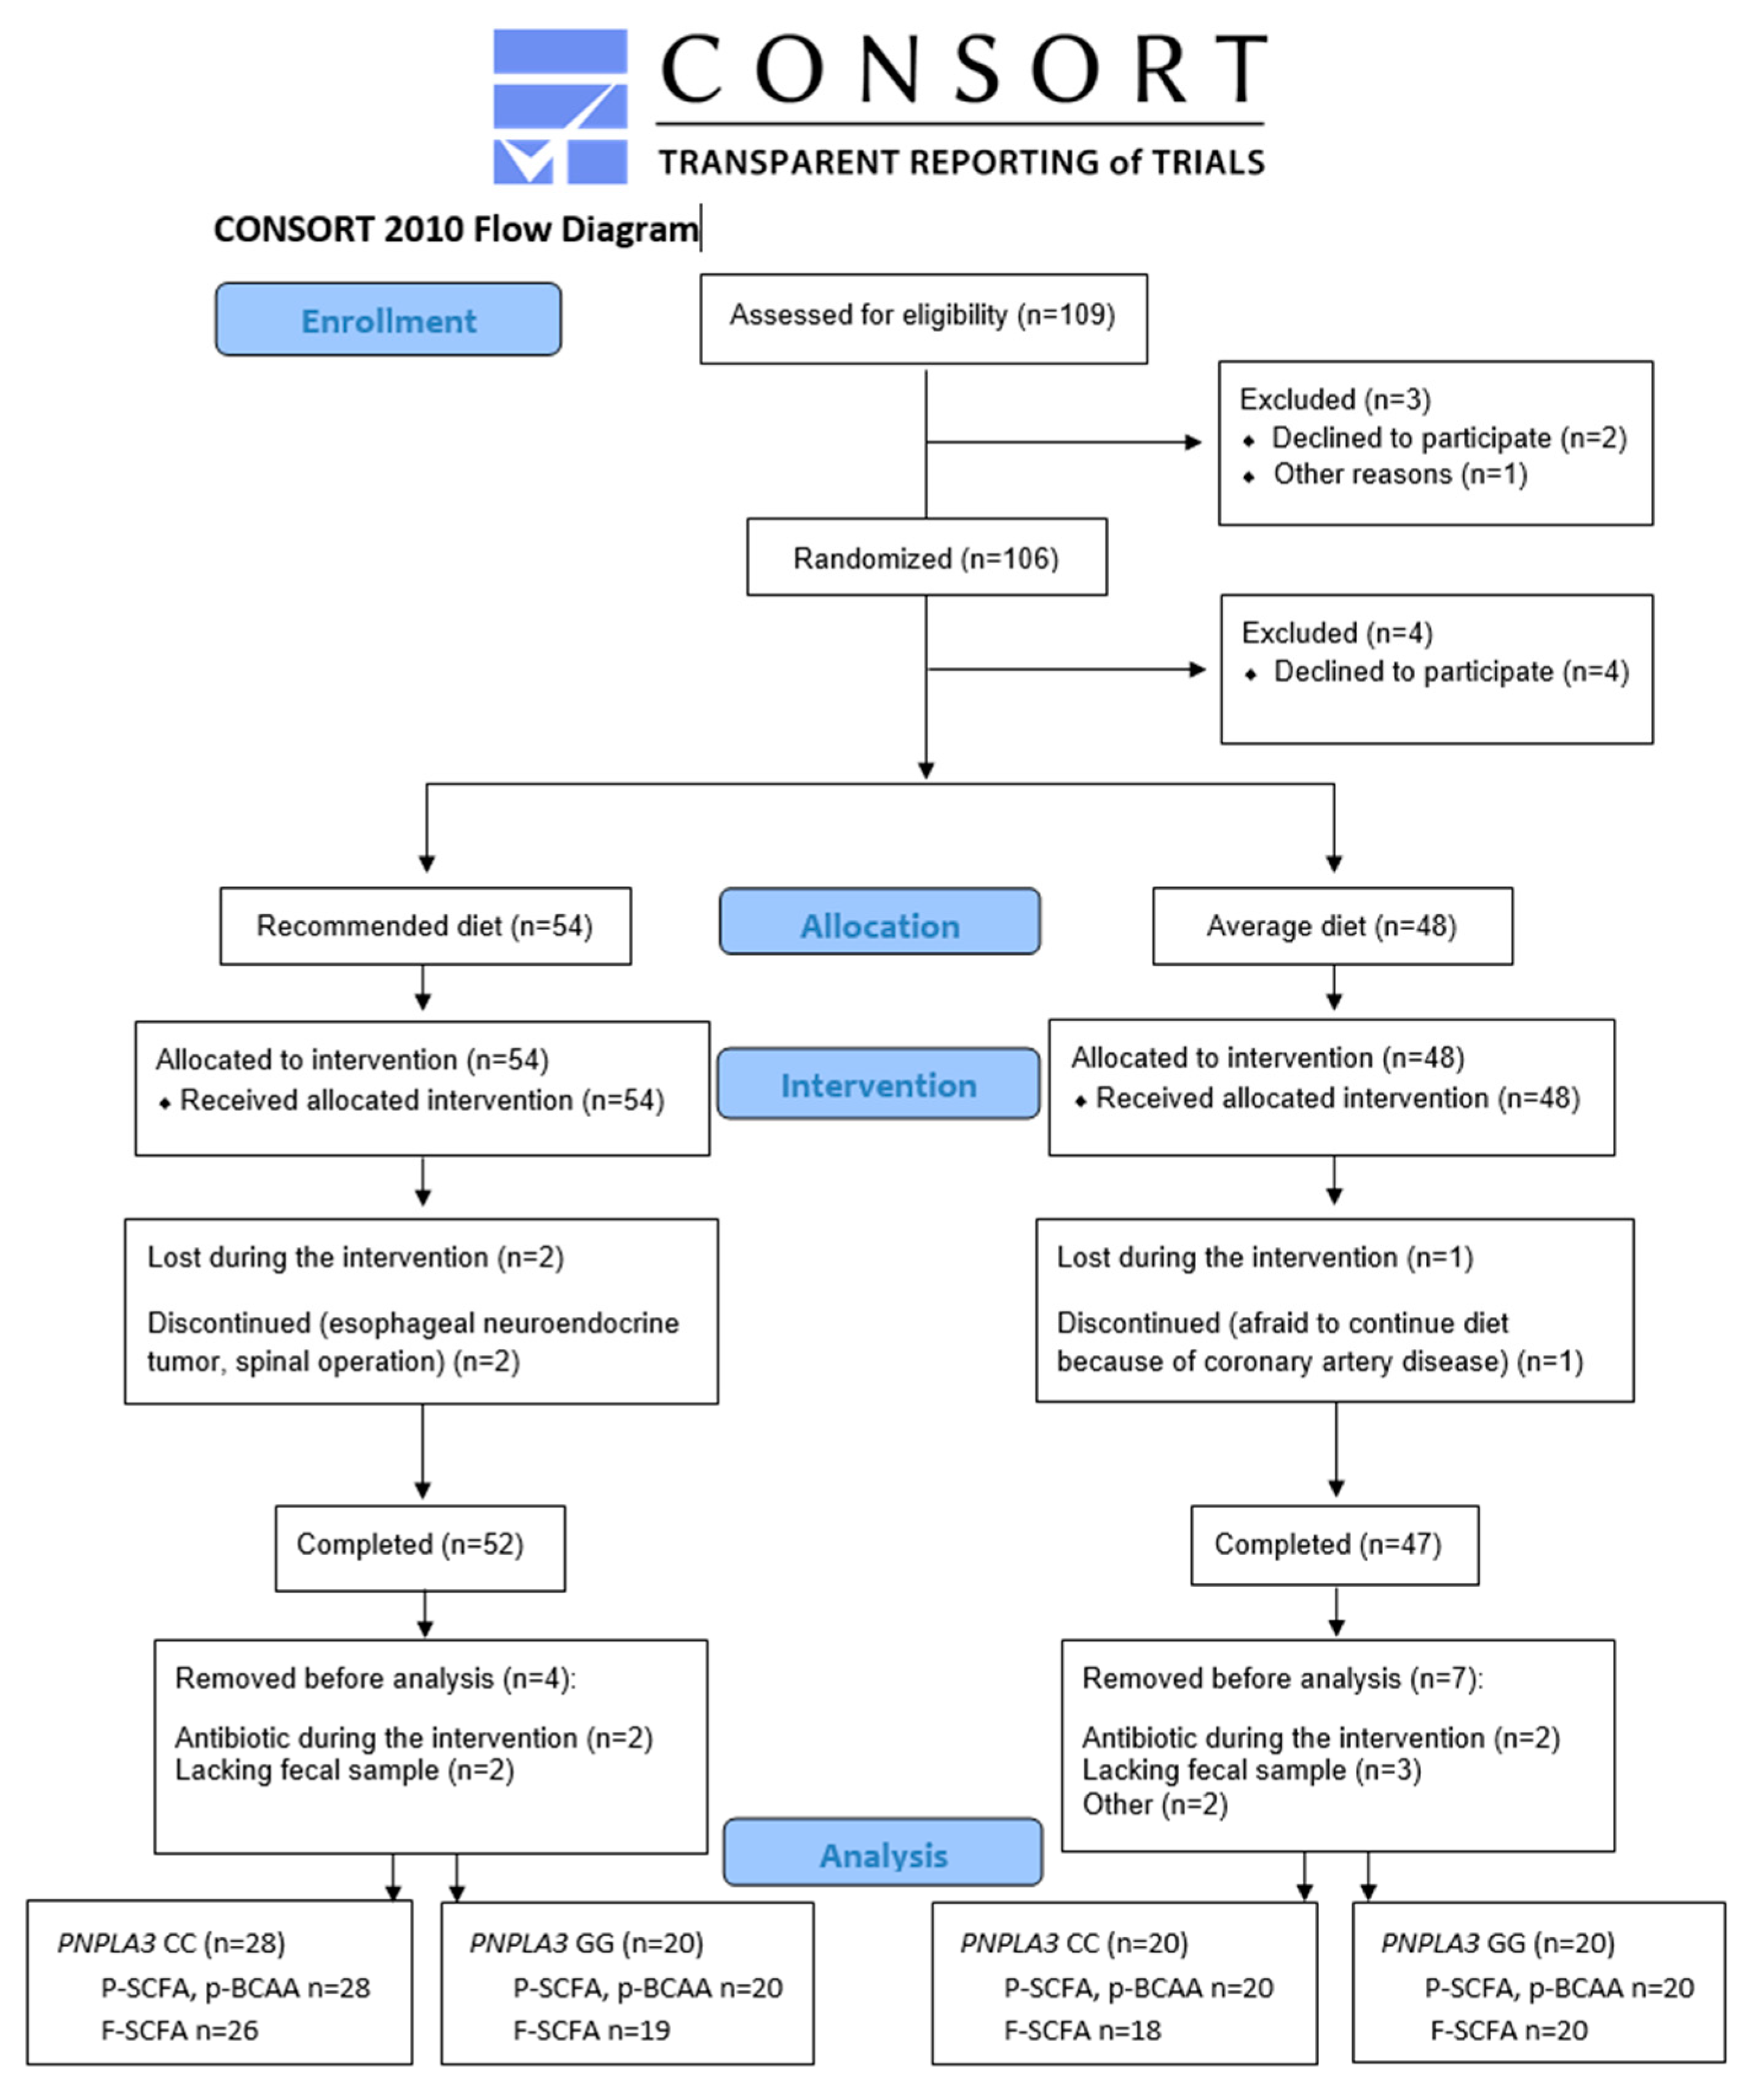
2.1. Study Participants

Study participants (homozygotes for PNPLA3 rs738409 SNP, I148M variant) were recruited from the METSIM study [51]. Inclusion criteria were the CC or GG genotypes of PNPLA3 rs738409, body mass index (BMI) < 35 kg/m2, total cholesterol < 8 mmol/L, low-density lipoprotein (LDL) cholesterol < 5 mmol/L, fasting glucose < 7 mmol/L, alanine aminotransferase (ALT) < 100 U/L and age of 60–75 years. We excluded subjects with inflammatory diseases, other liver diseases besides fatty liver disease, kidney disease, unstable thyroid disease, diabetes, mental illnesses preventing the completion of the study, excess alcohol use (daily ≥ 30 g in men and ≥20 g in women) and smoking.
As shown in Figure 1, 109 men were identified as eligible for the study. Out of these, three were excluded before randomization (one did not arrive at the screening, and two passed the screening but chose not to participate). After randomization, four decided not to participate. Altogether, 102 men started the intervention, with 54 in the recommended diet (RD) group and 48 in the average diet (AD) group. Of those, three dropped out from the study: one in the AD group (coronary artery disease) and two in the RD group (one had an esophageal neuroendocrine tumor, and one had a spinal operation). Out of these, 99 participants completed the intervention. Four participants from the RD group and five from the AD group were removed before SCFA or BCAA analysis because they either had antibiotic treatment during the intervention or lacked fecal samples. From two participants missing the primary outcome of the study, SCFAs and BCAAs were not measured. P-SCFA and p-BCAA were analyzed from 88 and f-SCFA from 83 study participants (Figure 1).
We included 88 men (mean age 67.8 ± 4.3 years, body mass index (BMI) 27.1 ± 2.5 kg/m2, waist 99.2 ± 8.8 cm) in the statistical analyses. Study participants were randomly assigned into two diet groups (RD or AD). Taking the PNPLA3 genotype (CC or GG) into account, there were four groups. In the RD group, 28 had CC, and 20 had the GG genotype; in the AD group, 20 had CC, and 20 had the GG genotype (Figure 1 and Table 1). Background diseases or medications were not different between the study groups (Table S1). Alcohol consumption and physical exercise were kept constant during the study. BMI, waist circumference, concentrations of gamma-glutamyl transferase (GGT), fasting insulin and high-sensitive C-reactive protein (hs-CRP) were different between the study groups at baseline (p = 0.004, 3.6 × 10⁻⁴, 0.026, 0.003, 0.032, respectively) (Table 1). Covariate analyses with BMI did not change the results, and therefore, we presented data without covariation. The intake of SCFAs or BCAAs could not be calculated.
Power calculations of the study were performed for the main outcome of the study but not for the SCFA and BCAA.

2.2. Genotyping for PNPLA3

The variant rs738409 (PNPLA3) was genotyped using the TaqMan SNP Genotyping Assay (Applied Biosystems, Foster City, CA, USA) according to their protocol. The individuals participating in this study did not know their genetic background for PNPLA3. The study personnel were also blinded regarding the genotype of the participants.

2.3. Dietary Intervention and Food Records

Dietary intervention was advised and followed by clinical nutritionists. The participants filled out four-day food records (predefined days including one weekend day) at baseline and weeks 3, 7 and 11. Records were checked by a clinical nutritionist upon their return at baseline and at weeks 4, 8 and 12.
The RD group was instructed to follow the National and Nordic nutrition recommendations [52], i.e., SFA < 10% of energy intake (E%) and unsaturated fatty acids (UFA) > 2/3 of the total fat intake. The AD group was advised to follow an average diet in Finland [21], in which the intake of SFA was aimed to be 15 E% and the proportion of UFA 50% of total fat intake.
The RD group was advised to use vegetable-oil-based spread (60–70% of fat) for bread and rapeseed oil and rapeseed-oil-based liquid products for cooking. It was recommended to use one tablespoon of oil-based salad dressing per day. Butter or butter-based spreads were not allowed. The use of juice-, yogurt- or sour cream-based dressing was not allowed. Milk and sour milk were advised to be fat-free, and yogurts were to be low-fat (fat < 1%). Cheese was advised to consist of a maximum fat of 17%, with a maximum of three to four slices per day. Low-fat (<4%) cold cuts were allowed. Fish was recommended twice a week. Two tablespoons of non-spiced nuts, seeds and almonds per day were allowed.
The AD group was advised to use butter-based spread as a spread. The salad dressing was advised to consist of, e.g., sour cream or juice, not vegetable oils. For cooking, it was advised to use butter or butter-based spreads. Milk and cultured milk were advised to consist of at least 1.5% fat, with yogurts at least 2.0%. The cheese was advised to have more than 17% fat. Fish was recommended to be eaten a maximum of once a week. Two tablespoons of nuts, seeds and almonds per week were allowed.
To provide better compliance, the key products (spreads, cooking fats and oils, and cheeses) were given to the participants for free.
The food records were analyzed by the AivoDiet nutrient calculation software (version 2.2.0.0; Mashie FoodTech Solutions Finland Oy, Turku, Finland) based on national and international analyses and international food composition tables.

2.4. Laboratory Analysis

Concentrations of plasma lipids, glucose, insulin and hs-CRP were analyzed as previously described [53,54]. Liver transaminases were measured by the Eastern Finland laboratory center ISLAB.

2.5. Calculations for Glucose Metabolism and NAFLD Associated Scores

For glucose metabolism-associated scores, we used MATSUDA insulin sensitivity index [55], which is calculated from fasting, 30 min and 120 min (OGTT, oral glucose tolerance test) insulin and glucose concentrations as MATSUDA-ISI = 10,000/sqrt[(Ins 0 min × gluc 0 min × 18) × [(Ins 0 min + Ins 30 min + Ins 120 min)/3] × [(gluc 0 min + gluc 30 min + gluc 120 min) × 18/3)], and triglyceride-glucose (TyG) index, an indicator of insulin resistance [56], and NAFLD [57] as TyG = ln [fasting tg (mg/dL) × fasting gluc (mg/dL)]/2.
NAFLD-associated scores included fatty liver index [58]; FLI is calculated from triglycerides (TG), BMI, GGT and waist circumference as FLI= (e 0.953*loge (triglycerides) + 0.139*BMI + 0.718*loge (ggt) + 0.053*waist circumference − 15.745)/(1 + e 0.953*loge (triglycerides) + 0.139*BMI + 0.718*loge (ggt) + 0.053*waist circumference − 15.745) × 100. Hepatic steatosis index [59] is calculated as HSI = 8 × ALT/AST + BMI(+2 if type 2 diabetes yes, +2 if female), and NAFLD liver fat score [60] is calculated as NAFLD-LFS = −2.89 + 1.18 × metabolic syndrome (Yes: 1, No: 0) + 0.45 × type 2 diabetes (Yes: 2, No: 0) + 0.15 × Ins in mU/L + 0.04 × AST in U/L − 0.94 × AST/ALT.

2.6. Plasma and Fecal SCFAs and Plasma BCAAs Quantification

Stool samples were collected in a plastic container with a lid by the subject at weeks 0 and 12. The sealable container was placed in a box filled with ice bags and brought to the research unit the next day. At the research unit, stool samples were directly homogenized, aliquoted and frozen at −80 °C without any detergents for further analysis. SCFAs and BCAAs were quantified using Agilent 7890B gas chromatography–mass spectrometry (GC-MS) (Agilent Technologies, Santa Clara, CA, USA), as previously described [61,62]. All the analyses were performed in blinded and random order. In brief, fecal content was mixed with 0.005 M sodium hydroxide with internal standard (10 mg/mL deuterated acetic acid), homogenized with 1.0 mm glass bead (Sigma-Aldrich, St. Louis, MO, USA) and centrifuged at 13,200× g for 20 min at 4 °C. Fecal supernatant or plasma was then mixed with 1-propanol/pyridine (3:2, v:v) and propyl chloroformate, incubated at 60 °C for 1 h. Hexane was then added into the derivatized samples and centrifuged at 2000× g for 4 min. The upper n-hexane layers were collected and analyzed with the conditions set according to Zheng et al. [61].

2.7. Statistical Methods

Statistical analyses were conducted by IBM SPSS Statistics for Windows, Version 27 (IBM Corp., Armonk, NY, USA), and figures were created using GraphPad Prism 5 (Boston, MA, USA). The normality of the distributions of clinical parameters, energy intake and SCFA/BCAA variables were tested using a Kolmogorov–Smirnov normality test with Lilliefors’ significance correction. Variables with skewed distribution were transformed to a base-10 logarithmic scale to achieve normal distribution. Nonparametric tests were used when a normal distribution was not achieved. A one-way analysis of variance (ANOVA) with Bonferroni’s multiple comparison test was used to test differences in baseline characteristics. Differences between the genotypes in responses to the diet, i.e., genotype–diet interaction and within the diet group’s timepoints of 0 and 12 weeks, were tested using a general linear model for repeated measures. Correlation analyses were performed as Spearman correlations at baseline.

2.8. Ethical Considerations

The study (Clinical Trials identifier: NCT04644887) protocol conforms to the ethical guidelines of the Declaration of Helsinki, as reflected in a prior approval by the institution’s human research committee, and has been approved by the Ethics Committee of the Northern Savo Hospital District (no:13.02.00 1408/2020). Written informed consent was obtained from each participant included in the study.

3. Results

3.1. Dietary Intervention: Recommended Diet and Average Diet

The study participants kept their diet as advised (Table 2). The intake of SFA (E%) decreased in the RD group and increased in the AD group during the intervention (p = 2.47 × 10⁻⁸ and p = 4.06 × 10⁻⁸, respectively). Additionally, the intake of both MUFA (p = 0.048) and PUFA increased in the RD group (p = 0.048 and p = 0.028, respectively), and PUFA decreased in the AD group (p = 1.20 × 10⁻⁶).
Intake of omega-3 PUFA increased in the RD group (p = 1.8 × 10⁻⁵), and both omega-3 and omega-6 PUFAs decreased in the AD group (p = 0.004 and p = 1.3 × 10⁻⁵, respectively). Eicosapentaenoic acid (EPA) and docosahexaenoic acid (DHA) intake increased in the RD group (p = 2.6 × 10⁻⁴ and p = 2.2 × 10⁻⁴, respectively). Total fat intake (E%) decreased in the RD group (p = 0.032) and increased in the AD group (p = 0.001). Intake of fiber did not change during the study. There were no differences between the genotype groups in the adherence to the diet (based on non-significant genotype-diet interaction p-values, Table 2).

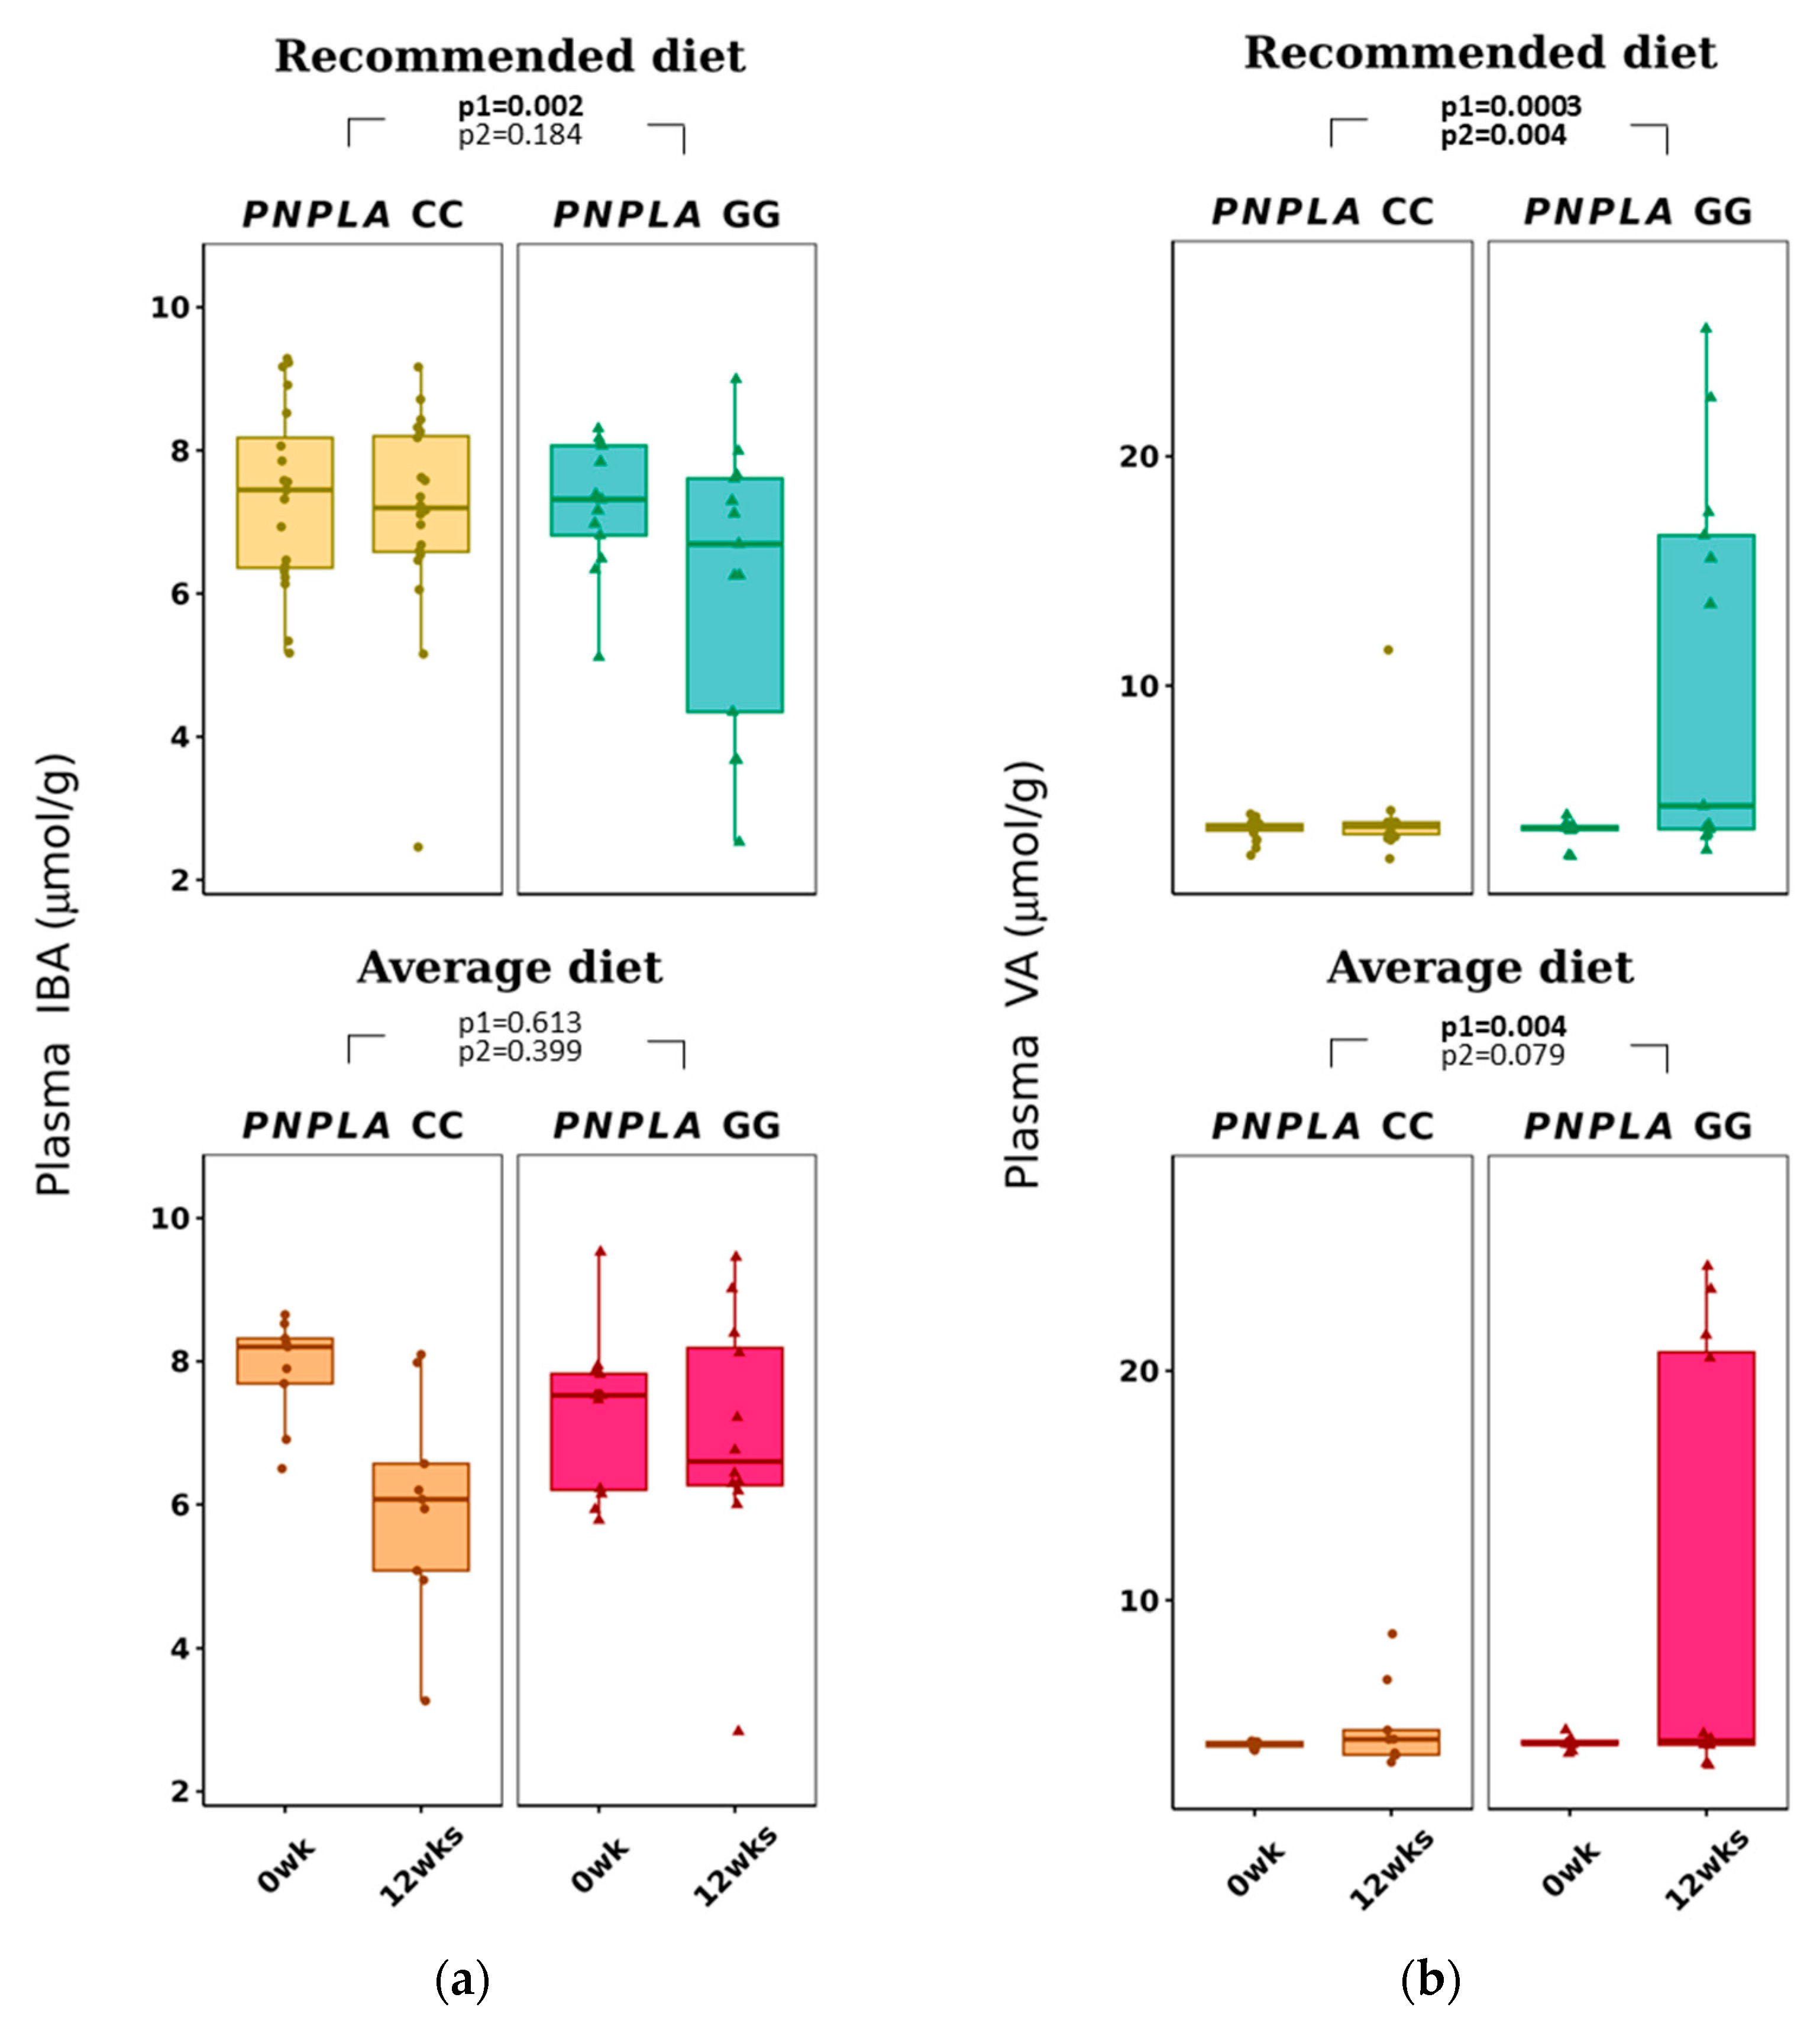
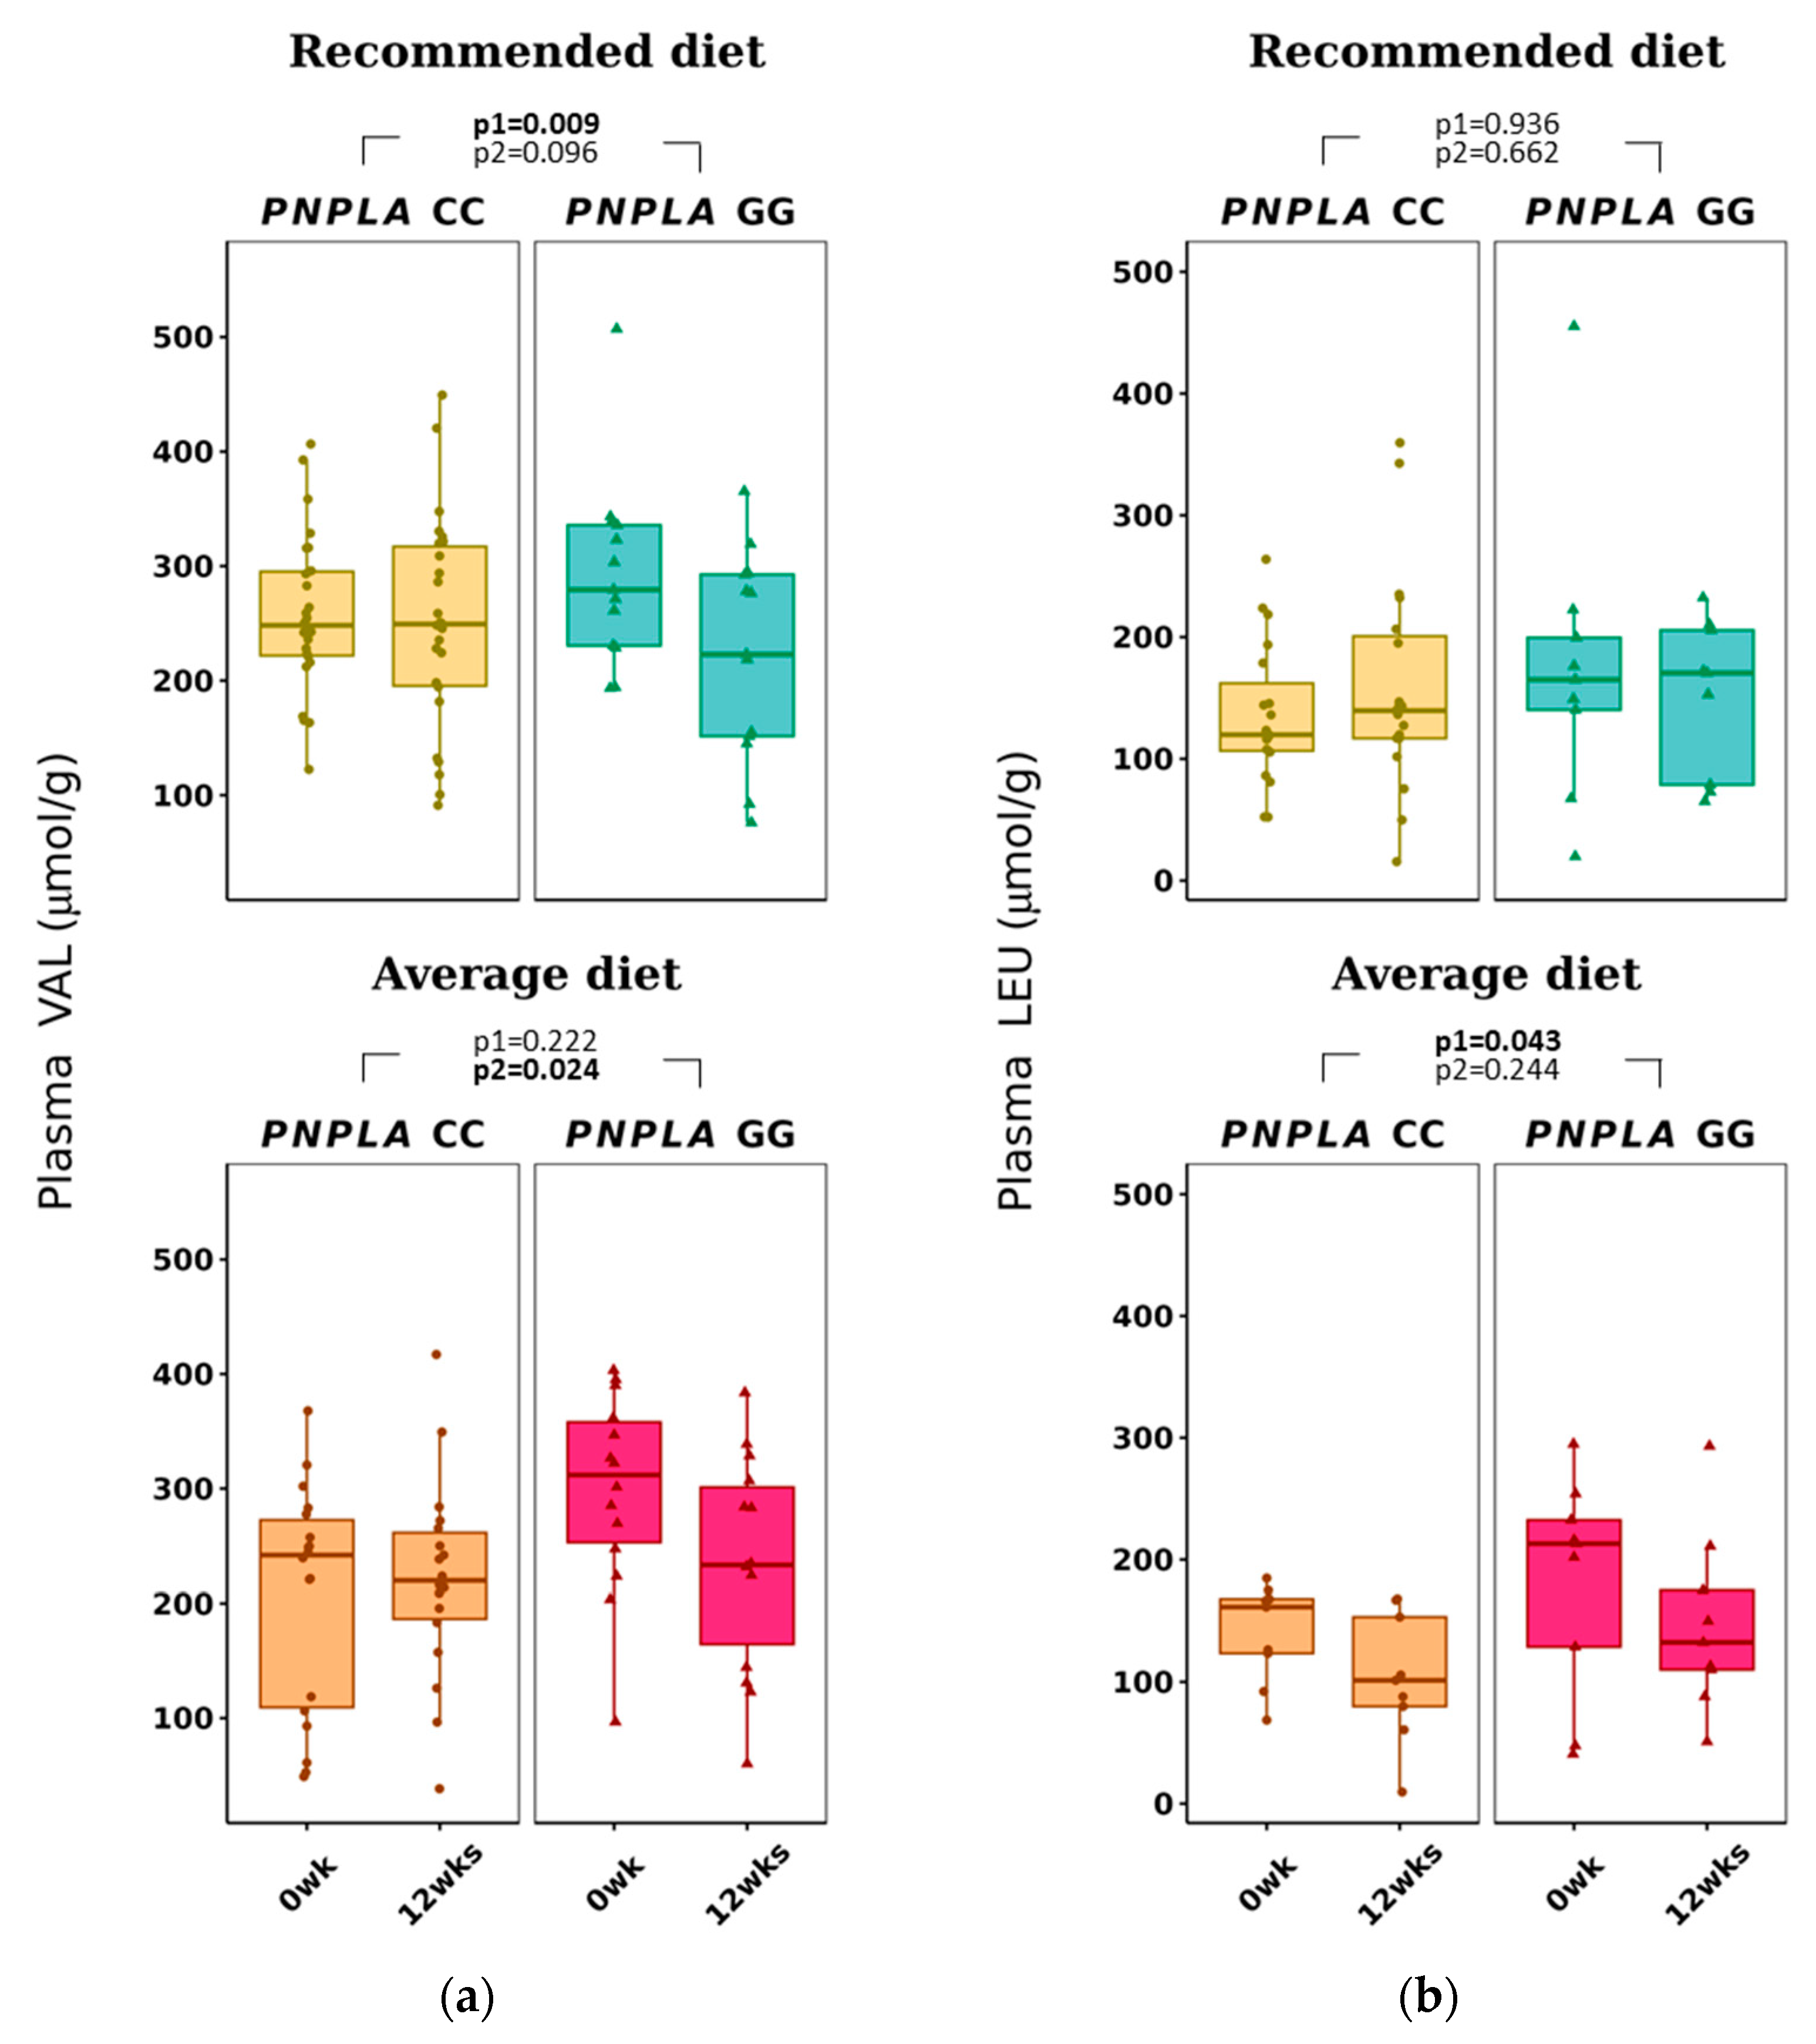
3.2. Changes in Dietary Fat Quality on Plasma SCFA and BCAA

Total p-SCFAs and p-IBA decreased in the RD group by time (p = 0.041 and p = 0.002, respectively) (Table 3 and Figure 2). Plasma VA increased with time in both diet groups (CC, 3.7 ± 0.4 to 4.2 ± 1.7 µmol/g; GG, 3.6 ± 0.6 to 7.0 ± 0.6 µmol/g; p = 0.0026 for time and p = 0.004 for time and genotype).
The baseline p-IBA and p-VAL concentrations were different in comparison to the four study groups (p = 0.012 and p = 0.005, respectively, both lower in the PNPLA3 CC genotype and AD (Table S5). At baseline, P-VAL was already lower in carriers of PNPLA3 genotype CC (p = 0.014, Table S4). All p-SCFA, f-SCFA and p-BCAA changes by the diet modifications and PNPLA3 genotypes are presented in Figure S1.
The average diet modified total p-BCAAs in the carriers of CC were 612 ± 184 to 532 ± 149 µmol/g (p = 0.015 for time) (Table 3). P-VAL decreased in the RD group (by time p = 0.009). Of note, VAL was already different between the PNPLA3 genotypes CC and GG at baseline in the AD group, increased in the CC group and decreased in the GG group (p = 0.024, time and genotype). P-LEU decreased by time in the AD group (p = 0.043) (Table 3 and Figure 3).
Plasma and fecal SCFAs did not correlate significantly with each other, and measured concentrations were in line with previous publications [63,64].

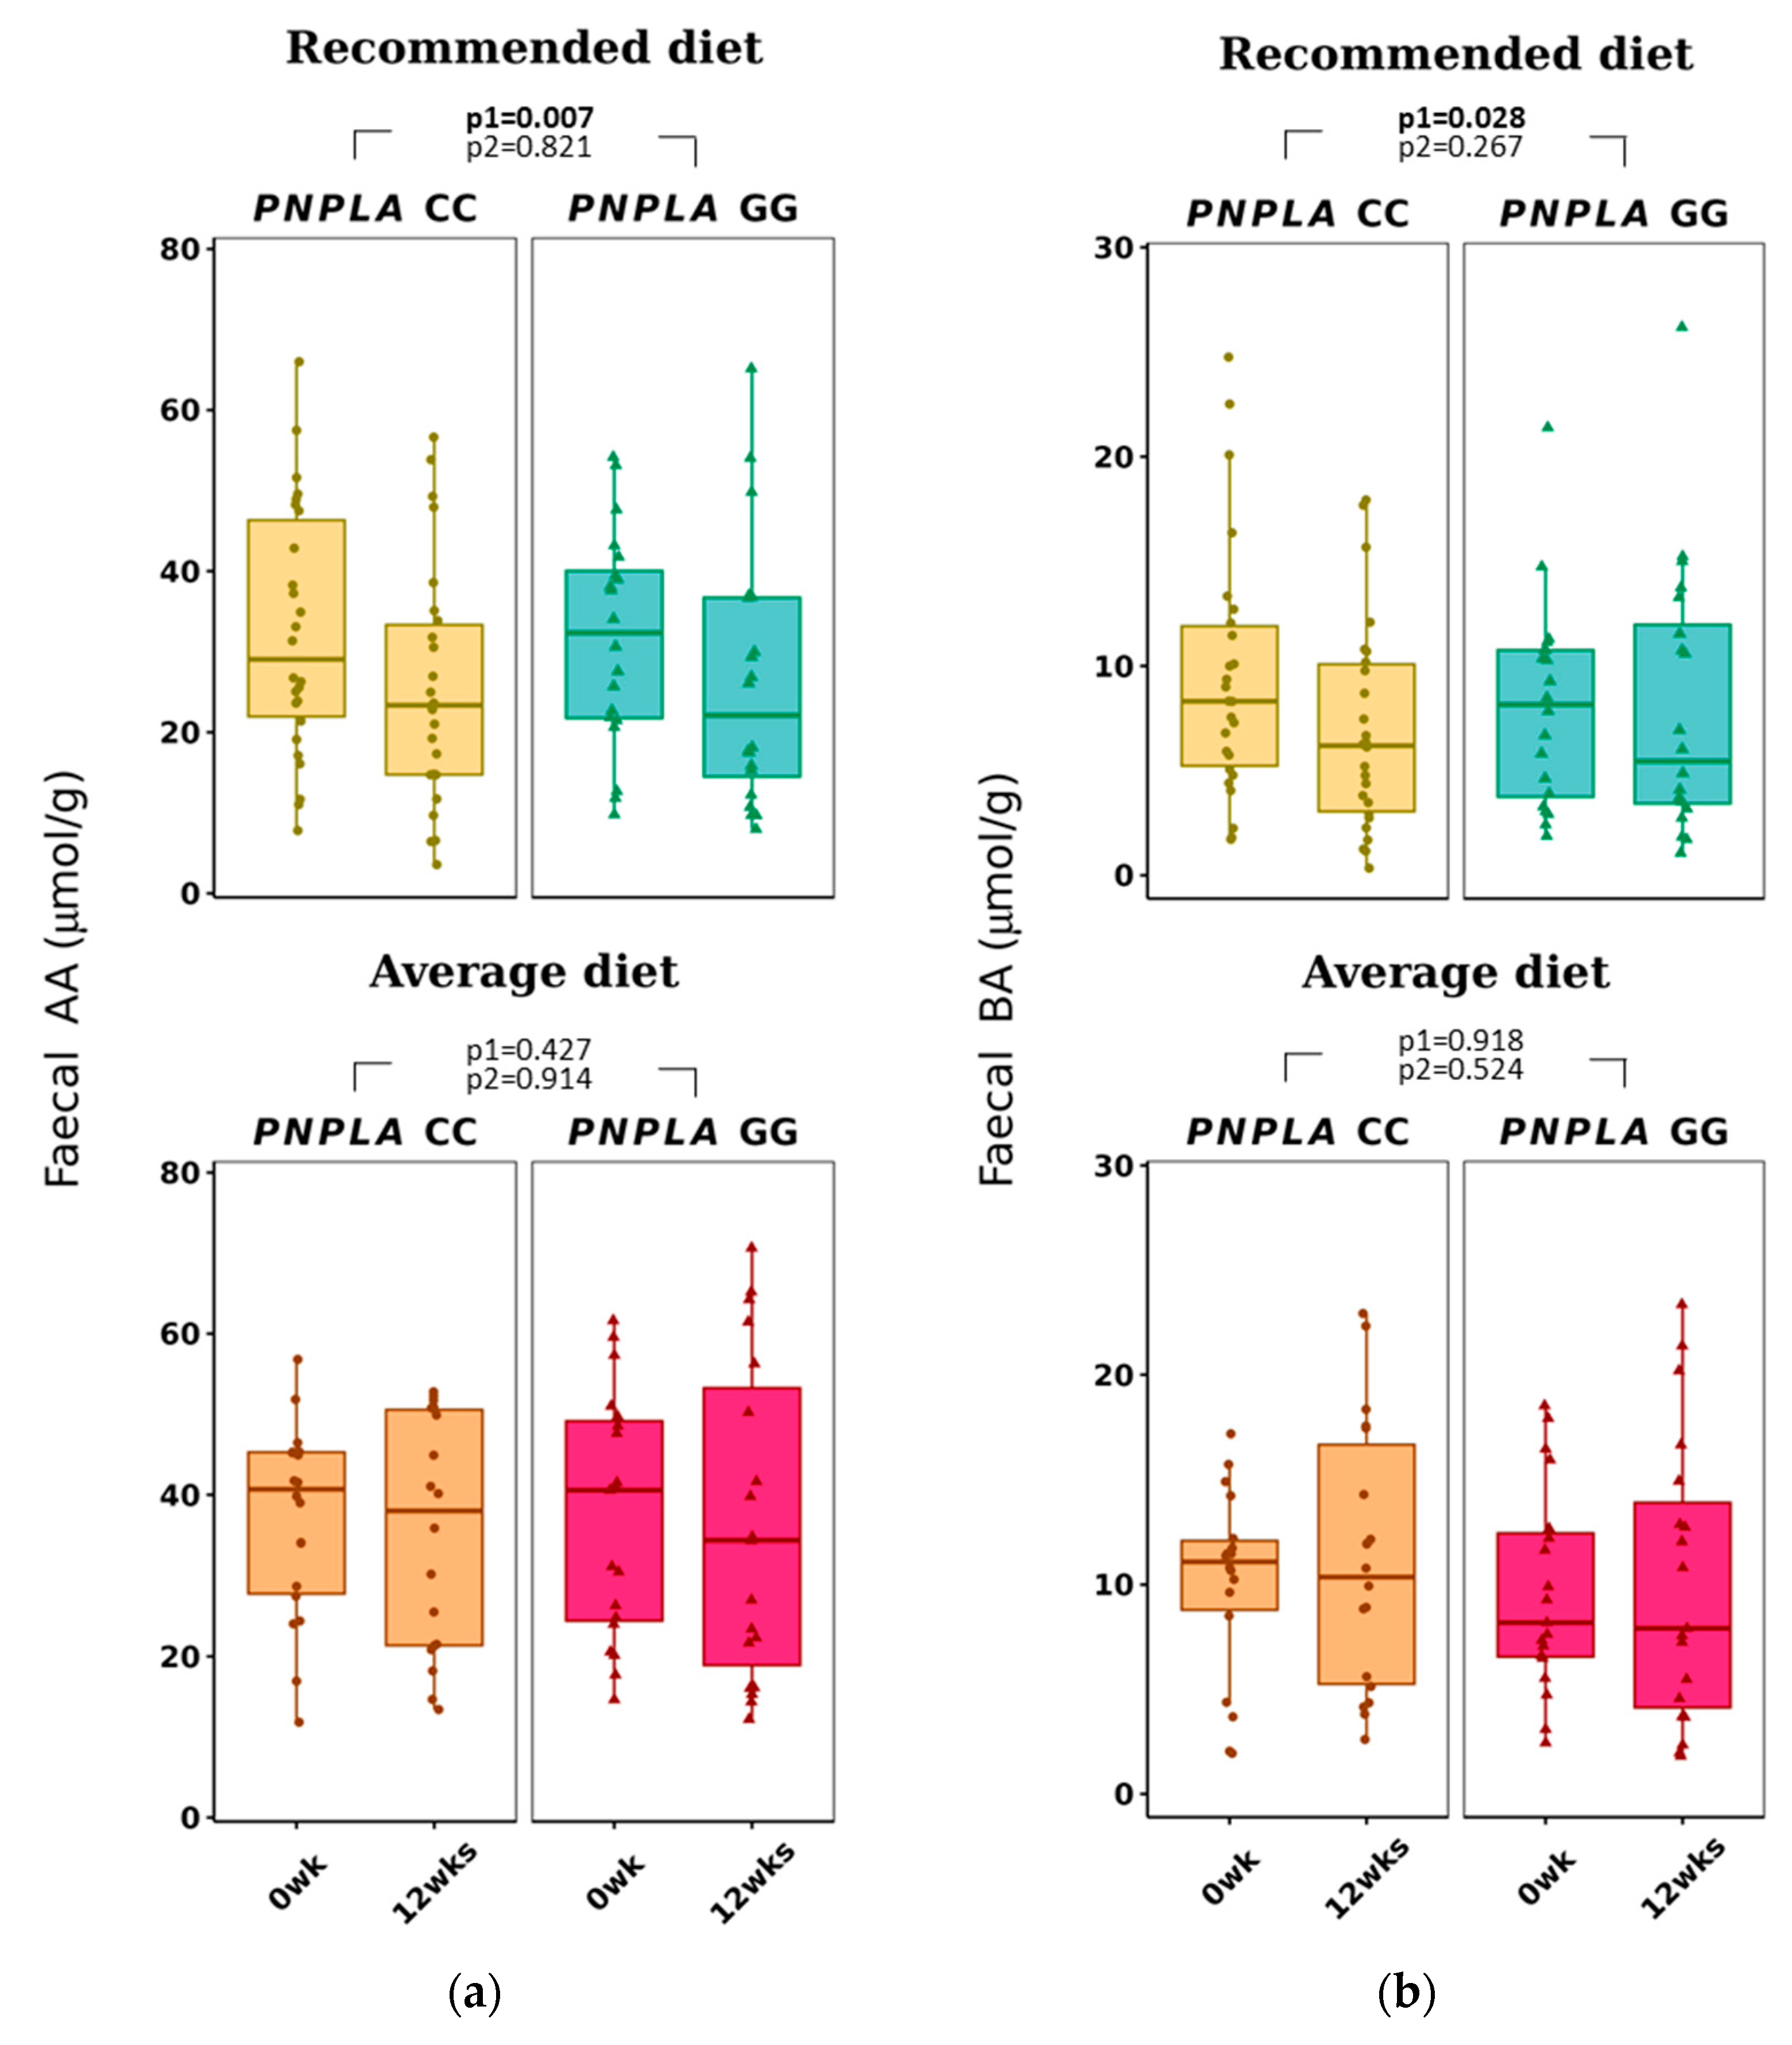
3.3. Changes in Dietary Fat Quality Modification on Fecal SCFA

Total f-SCFA, f-AA, and f-BA decreased in all study participants in the RD group (all p < 0.028 by time) (Figure 4 and Table 3). No correlations with any f-SCFAs were seen with the clinical characteristics, diabetes-related indices, or liver-related scores (Table S2A).

3.4. Associations of Food Intake and Plasma SCFA and BCAA and Fecal SCFA

From food intake at baseline, positive correlations were seen with energy intake and f-BA (r = 0.280, p = 0.010), with protein (E%) and total p-BCAA (r = 0.238 and p = 0.043), and carbohydrate (E%) with total f-SCFA and f-AA (r = 0.216, p = 0.0498 and r = 0.243 and p = 0.027, respectively). Also, PUFA (E%) correlated positively with total p-SCFA (r = 0.268, p = 0.016), p-AA (r = 0.226, p = 0.034) and p-BA (r = 0.315, p = 0.003), and negatively with the same SCFAs from feces (f-SCFA: r = −0.278, p = 0.011, f-AA: r = −0.325, p = 0.003 and f-BA: r = −0.217, p = 0.049). Fiber intake correlated only with p-AA (r = 0.211, p = 0.049).

3.5. Plasma SCFA and BCAA Associate with Lipids, Glucose Metabolism and NAFLD Associated Scores

At baseline, total plasma SCFAs and p-AA were associated with lipid metabolism by correlating positively with HDL-C concentration (r = 0.302 and p = 0.007, r = 0.289 and p = 0.006, respectively) and inversely with TG concentration (r = −0.307 and p = 0.006, r = −0.267 and p = 0.012, respectively). In addition, p-SCFA and p-AA were associated with glucose metabolism by correlating positively with MATSUDA-ISI (r = 0.233 and p = 0.038, r = 0.256 and p = 0.016, respectively) and inversely with TyG (r = −0.370 and p =0.006, r = −0.283, p = 0.008, respectively) (Table S2A).
P-VA, unlike any other SCFA, was also found to correlate positively with GGT at baseline (r = 0.240, p = 0.025) (Table S2A).
All plasma BCAAs, valine, leucine and isoleucine had associations with glucose metabolism, seen as positive correlations with fasting insulin (r = 0.331 and p = 0.004, r = 0.226 and p = 0.036, r = 0.336 and p = 0.004, r = 0.284 and p = 0.007, respectively) and negative association with MATSUDA-ISI (r = −0.377 and p = 0.001, r = −0.266 and p = 0.013, r = −0.397 and p = 0.001, r = −0.309 and p = 0.003, respectively) and also positive correlation with NAFLD associated score LFS (r = 0.355 and p = 0.002, r = 0.215 and p = 0.046, r = 0.391 and p = 0.001, r = 0.329 and p = 0.002, respectively) (Table S2B). Also, LEU correlated positively with NAFLD-associated factors such as BMI (r = 0.238, p = 0.043), ALT (r = 0.295, p = 0.011), HIS (r = 0.339, p = 0.003) and LFS (r = 0.391 and p = 0.001). In addition, p-ILE correlated positively with TG (r = 0.240, p = 0.025); TyG, an insulin resistance index calculated from triglyceride (r = 0.249, p = 0.020); and HSI (r = 0.254, p = 0.017) (Table S2B).

4. Discussion

The main result of our study is that dietary fat modification caused changes in SCFAs (p-IBA, p-VA and f-AA, f-BA) and p-BCAAs (VAL and LEU) (Figure 2 and Table 3). Previously, in humans, only the total fat (E%) intake, but not fat quality, was shown to correlate positively with acetate, butyrate and propionate [65]. On the other hand, in a study with mice, dietary fat modification resulted in changes in f-SCFA [66], but the change was probably due to a difference in fiber intake. In our study, the fiber intake was reported and kept the same, which is also a strength of this study.
As NAFLD is a major risk factor of cardiovascular diseases and is partially caused by genetic risk factors and still missing other therapeutic approaches except weight loss, exercise and dietary changes, it is important to study whether a targeted dietary approach could provide health benefits to those in genetic risk of more progressive NAFLD. This knowledge could help in assessing the dietary advice resources better. Our study with a 12-week dietary fat modification intervention resulted in changes in plasma and fecal SCFAs and plasma BCAAs. The novelty of this study is a dietary fat quality modification with a known NAFLD-predisposing PNPLA3 genetic background.
In our study, RD decreased p-IBA in all study groups (Table 3), a result that we could not explain. It is worth noting that p-IBA was lower in the group with AD and PNPLA3 genotypes of CC (Table S5). An increase in IBA intake has decreased lipolysis and lipogenesis and increased insulin-stimulated glucose uptake [29] and correlates negatively with GGT [67]. In contrast, we did not see associations of p-IBA to glucose or lipid metabolism, nor NAFLD-related scores or liver transaminases (Table S2A).
Interestingly, p-VA increased in all study groups regardless of the diet group, and the increase was greater in those with the PNPLA3 GG genotype (Table 3). Fecal VA has previously been associated with reduced hypercholesterolemia and lipid accumulation, total cholesterol, TG, free fatty acids or LDL-C in the liver and serum in mice [68], and lower levels of f-VA have been associated with lower GGT [67]. Since increased f-VA contributes to health benefit changes and p-VA is increased by AD with participants of the PNPLA3 GG genotype, we suggest that PNPLA3 and dietary fat changes would modify the absorption of VA from the gut into blood circulation.
In contrast to previous publications [67,68], there were no correlations of p- or f-VA with lipid or glucose metabolism (Table S2A) in our study. Also, p-VA or f-VA did not correlate with other plasma or fecal SCFA or energy intake at baseline. Bearing in mind that p-VA was positively associated with GGT (Table S2A), there could be a pathway of p-VA causing more progressive NAFLD in those with the PNPLA3 GG genotype. Unfortunately, p-VA is often lacking in publications about SCFAs, as in this recent review [30], making it even more important to report our findings.
In our study, the fecal and plasma SCFAs did not correlate with their counterparts, unlike, i.e., in a human adult study (n = 441) from Columbia [27] or in a small pilot study (n = 10) by Vogt and Wolever [69]. Also, Deng et al. [70] reported recently that counterparts of plasma and fecal SCFAs have different associations with gut microbiota and diabetes in a cohort of 1007 middle-aged and elderly adults. Our finding was that f-AA, but not p-AA, decreased in all with RD (Table 3, Figure 4), but opposite to p-AA, which was found to associate with concentrations of HDL-C and TG, and diabetes indices (Table S2A); f-AA did not correlate with clinical characteristics, diabetes, or liver-related indices. This discrepancy of plasma and fecal SCFA values could be partly explained by the fact that only 5% of the SCFAs absorbed into circulation are excreted into feces [71] and also by the knowledge of big inter-individual variation in the concentration of f-SCFAs [72].
Recommended diet decreased f-BA in all subjects regardless of the PNPLA3 genotype (Table 3), and f-BA did not correlate with clinical characteristics, diabetes indices (our study subjects were non-diabetic) or NAFLD-related scores (Table S2A). Our result did not support previous findings that reported higher fecal BA in obese people; higher total energy intake; higher fasting concentrations of TG, insulin, and hs-CRP [27]; and lower f-BA in those with type 2 diabetes [65]. Fecal BA, unlike p-BA, has been reported to be associated with gut microbiota and type 2 diabetes [70].
All plasma BCAAs, p-VAL, p-LEU and p-ILE were associated positively with worsening of insulin resistance (Table S2B), which is in line with previous publications [33,35,38,39,40,41,42]. In our study, AD decreased p-LEU concentrations (Table 3 and Figure 3) and was associated positively with NAFLD predisposing factors BMI, ALT, HSI and LFS (Table S2B). In addition, p-ILE correlated positively with TG and HSI (Table S2B).
The intake and plasma concentrations of BCAAs have only a weak association [73,74,75]; therefore, the lack of BCAA intake data was not crucial in our study. In a study of adolescents, BCAAs in plasma, but not BCAA intake, were associated with obesity and insulin resistance [76]. Previously, BCAAs (mostly p-LEU [77]) have been shown to activate the mammalian target of the rapamycin (mTOR) gene [78], and, by using phosphoinositide-3-kinase-protein kinase B (PI3K-Akt) signaling pathway, BCAAs could modify the lipid and glucose metabolisms [79]. As BCAAs are also synthesized for circulation by the gut microbiome [80], future analyses could aim to study the relationship between BCAAs, gut microbiome, lipid and glucose metabolism and NAFLD.
Plasma VAL was higher at baseline in participants with the PNPLA3 genotype of GG compared to CC (Table S4), a result that has not been published before. Interestingly, both RD and AD reduced the concentrations of p-VAL with the PNPLA3 genotype of GG (Table S3). Even though the response to AD in p-VAL was significantly different between PNPLA3 genotypes of CC and GG, this could be due to the difference in the p-VAL concentrations at baseline (Tables S3–S5) and might not be a relevant result. In our study, p-VAL did not correlate with BMI or waist circumference, even though it has been reported to be lower in lean people with NAFLD compared to obese people with NAFLD [46]. Total BCAA, VAL, LEU and ILE correlated positively with insulin and negatively with diabetes-associated index MATSUDA (Table S2B), which is in line with higher p-BCAAs being related to worsening of glucose metabolism [41].
In our study, p-VAL decreased in both diets in the carriers of the GG genotype of the PNPLA3 gene, and p-LEU decreased by AD (Table S3 and Table 3). This could suggest that PNPLA3 modifies the concentration of p-BCAAs. In a Chinese 1-year exercise intervention, the increase in p-BCAAs improved liver fat content in obese individuals [81]. On the contrary, Merz et al. [82] noticed (in a cross-sectional study of 312 healthy adults) that an unhealthy diet was associated with higher p-BCAAs. Because some gut microbes can produce not only SCFAs but also BCAAs [80], and a high-fat diet is suggested to modify gut microbiota and increase gut permeability [83,84], the results of our study could derive from gut microbiota changes. Thus, possibly, the PNPLA3 gene could also modify the gut microbiota in hand with the dietary fat modification and cause our differing results of SCFAs and BCAAs according to the CC or GG genotype of the PNPLA3 gene.
The strengths of this study are the targeted recruitment of participants based on their rs738409 variant (I148M) of the PNPLA3 gene homozygous status and the equally distributed sample size in four study groups (n = 28, 20, 20 and 20). Additionally, the participants were motivated; thus, the number of dropouts was low. The intervention was carefully guided, and the quality of the diet was well monitored. The physical activity of the participants was registered by questionnaires and remained unchanged during the intervention. In addition, the clinical parameters were not seen to change during the intervention (Table S6) besides lipids, which the diet intervention aimed to affect.
Some study limitations need to be highlighted. The intake of carbohydrates was unintentionally changed in the AD group (increased in CC and decreased in GG genotype, Table 2). Herein, as SCFAs are derived from carbohydrates, this could cause false positive findings in genotype comparisons of SCFAs. Of note, p-IBA and p-VAL baseline concentrations were lower with the CC genotype of PNPLA3 and AD (Table S5), and p-VAL was lower in CC than the GG genotype of PNPLA3 (Table S4). This could cause false positive findings for p-IBA and p-VAL during the intervention.
For analyzing data, we made several comparisons between the diet groups and PNPLA3 genotypes, and by using the p-value threshold of 0.05 instead of correcting it by the number of variables, it is possible that we had some false positive findings. Additionally, the power calculation was not based on these endpoints, so it might be that we do not have enough power for these analyses.
Combining the results of this article with liver imagining and gut microbiota analysis, as in previous publications [14,27,28,85], could help understand the effects of dietary fat modification and carriage of CC or GG genotype of PNPLA3 gene on SCFAs and BCAAs and their possible effect on NAFLD. Our study does not provide a mechanistic answer on how the PNPLA3 gene, together with changes in dietary fat, modifies SCFA or BCAA. The modification of diet fat could affect the gut microbiota, causing changes in gut permeability and the ability to both produce and absorb SCFAs and BCAAs.

5. Conclusions

In conclusion, dietary fat modification influenced p-SCFA, f-SCFA and p-BCAA concentrations. Additionally, the PNPLA3 gene modified the response to dietary fat modification for p-VA and total p-BCAA. Also, total p-SCFA and p-AA were associated with plasma lipids and diabetes indices, and p-BCAA was associated with diabetes indices and liver steatosis scores. Further studies addressing this issue are warranted.

Supplementary Materials

The following supporting information can be downloaded at: https://www.mdpi.com/article/10.3390/nu16020261/s1, Table S1: Diseases and medication usage at week 0 (n = 88). Table S2A. Correlations of plasma (n = 88) and fecal (n = 83) SCFAs with clinical characteristics, liver scores at baseline. Table S2B. Correlations of plasma BCAAs with clinical characteristics, diabetes indexes and liver scores at baseline (n = 88). Table S3. Plasma and fecal SCFA and plasma BCAA at baseline and 12 weeks. Table S4. Plasma and fecal SCFA and plasma BCAA at baseline compared with PNPLA3 genotypes CC and GG. Table S5. Plasma and fecal SCFA and plasma BCAA at baseline compared with four study groups. Table S6. Clinical characteristics during the intervention (n = 88). Figure S1. All plasma SCFAs (a, n = 88), fecal SCFAs (b, n = 83) and plasma BCAAs (c, n = 88) at baseline (week 0) and 12 by recommended diet and average diet and PNPLA3 genotypes CC and GG (n = 83). Repeated generalized linear model; Values are presented as means ± SEM, dots/triangular dots present each participant; p < 0.05 in bold; p1 = time, p2 = time and genotype.

Author Contributions

Conceptualization, M.L. (Maria Lankinen), U.S. and M.L. (Markku Laakso); methodology, M.L. (Maria Lankinen), U.S., K.K.L., C.C., S.C. and O.L.; formal analysis, M.-M.T., K.K.L. and C.C.; investigation, M.-M.T. and S.C.; writing—original draft preparation, M.-M.T.; writing—review and editing, M.-M.T., S.C., M.L. (Maria Lankinen), U.S., O.L., H.E.-N. and M.L. (Markku Laakso); visualization, M.-M.T. and C.C.; supervision, M.L. (Maria Lankinen), U.S and M.L. (Markku Laakso). All authors have read and agreed to the published version of the manuscript.

Funding

M-M.T. received a personal grant from the Finnish Cultural Foundation and Mary & Georg Ehrnrooth Foundation. S.C. Grant from the University of Eastern Finland doctoral school. M.A.L., K.K.L., C.C., O.L. and H.E.-N. received no grants for this study. M.L. The study was supported by grants from the Academy of Finland (321428), Sigrid Juselius Foundation, Finnish Foundation for Cardiovascular Research, Kuopio University Hospital, Centre of Excellence of Cardiovascular and Metabolic Diseases, supported by the Academy of Finland (to M.L.). U.S. received a grant from strategic funding from the University of Eastern Finland to enable the conduction of the intervention and project funding from the Finnish Cultural Foundation (grant number 220938).

Institutional Review Board Statement

Ethics Committee of the Northern Savo Hospital District (no:13.02.00 14 August 2020).

Informed Consent Statement

Informed consent was obtained from all subjects involved in the study.

Data Availability Statement

The data presented in this study are available on request from the corresponding author. The data are not publicly available due to the nature of the research and to enable the conduction of the intervention.

Acknowledgments

We thank study nurses Erja Kinnunen and Matti Laitinen for patient recruitment and sample collection.

Conflicts of Interest

The authors declare no conflicts of interest. The funders had no role in the design of the study; in the collection, analyses, or interpretation of data; in the writing of the manuscript; or in the decision to publish the results.

References

  1. Romeo, S.; Kozlitina, J.; Xing, C.; Pertsemlidis, A.; Cox, D.; Pennacchio, L.A.; Boerwinkle, E.; Cohen, J.C.; Hobbs, H.H. Genetic Variation in PNPLA3 Confers Susceptibility to Nonalcoholic Fatty Liver Disease. Nat. Genet. 2008, 40, 1461–1465.e24. [Google Scholar] [CrossRef] [PubMed]
  2. Yuan, X.; Waterworth, D.; Perry, J.R.B.; Lim, N.; Song, K.; Chambers, J.C.; Zhang, W.; Vollenweider, P.; Stirnadel, H.; Johnson, T.; et al. Population-Based Genome-Wide Association Studies Reveal Six Loci Influencing Plasma Levels of Liver Enzymes. Am. J. Hum. Genet. 2008, 83, 520–528. [Google Scholar] [CrossRef] [PubMed]
  3. Trépo, E.; Valenti, L. Update on NAFLD Genetics: From New Variants to the Clinic. J. Hepatol. 2020, 72, 1196–1209. [Google Scholar] [CrossRef] [PubMed]
  4. Dong, X.C. PNPLA3-A Potential Therapeutic Target for Personalized Treatment of Chronic Liver Disease. Front. Med. 2019, 6, 304. [Google Scholar] [CrossRef] [PubMed]
  5. Kotronen, A.; Johansson, L.E.; Johansson, L.M.; Roos, C.; Westerbacka, J.; Hamsten, A.; Bergholm, R.; Arkkila, P.; Arola, J.; Kiviluoto, T.; et al. A Common Variant in PNPLA3, Which Encodes Adiponutrin, Is Associated with Liver Fat Content in Humans. Diabetologia 2009, 52, 1056–1060. [Google Scholar] [CrossRef] [PubMed]
  6. Son, H.; Koo, B.K.; Joo, S.K.; Lee, D.H.; Jang, H.; Park, J.H.; Chang, M.S.; Kim, W. Innovative Target Exploration of NAFLD (ITEN) consortium PNPLA3 Genotypes Modify the Adverse Effect of the Total Energy Intake on High-Risk Nonalcoholic Steatohepatitis Development. Am. J. Clin. Nutr. 2023, 117, 910–917. [Google Scholar] [CrossRef] [PubMed]
  7. Powell, E.E.; Wong, V.W.-S.; Rinella, M. Non-Alcoholic Fatty Liver Disease. Lancet 2021, 397, 2212–2224. [Google Scholar] [CrossRef] [PubMed]
  8. Raizi, K.; Azhari, H.; Charette, J.H.; Underwood, F.E.; King, J.A.; Afshar, E.E.; Swain, P.M.G.; Congly, S.E.; Kaplan, P.G.G.; Shaheen, A.-A. The Prevalence and Incidence of NAFLD Worldwide: A Systematic Review and Meta-Analysis. Lancet. Gastroenterol. Hepatol. 2022, 7, 74–75. [Google Scholar] [CrossRef]
  9. Younossi, Z.; Anstee, Q.M.; Marietti, M.; Hardy, T.; Henry, L.; Eslam, M.; George, J.; Bugianesi, E. Global Burden of NAFLD and NASH: Trends, Predictions, Risk Factors and Prevention. Nat. Rev. Gastroenterol. Hepatol. 2018, 15, 11–20. [Google Scholar] [CrossRef]
  10. Yki-Järvinen, H. Non-Alcoholic Fatty Liver Disease as a Cause and a Consequence of Metabolic Syndrome. Lancet Diabetes Endocrinol. 2014, 2, 901–910. [Google Scholar] [CrossRef]
  11. Jarvis, H.; Craig, D.; Barker, R.; Spiers, G.; Stow, D.; Anstee, Q.M.; Hanratty, B. Metabolic Risk Factors and Incident Advanced Liver Disease in Non-Alcoholic Fatty Liver Disease (NAFLD): A Systematic Review and Meta-Analysis of Population-Based Observational Studies. PLoS Med. 2020, 17, e1003100. [Google Scholar] [CrossRef]
  12. Younossi, Z.M. Non-Alcoholic Fatty Liver Disease—A Global Public Health Perspective. J. Hepatol. 2019, 70, 531–544. [Google Scholar] [CrossRef]
  13. Jonas, W.; Schürmann, A. Genetic and Epigenetic Factors Determining NAFLD Risk. Mol. Metab. 2021, 50, 101111. [Google Scholar] [CrossRef]
  14. Ramos Meyers, G.; Samouda, H.; Bohn, T. Short Chain Fatty Acid Metabolism in Relation to Gut Microbiota and Genetic Variability. Nutrients 2022, 14, 5361. [Google Scholar] [CrossRef]
  15. Lankinen, M.; Uusitupa, M.; Schwab, U. Genes and Dietary Fatty Acids in Regulation of Fatty Acid Composition of Plasma and Erythrocyte Membranes. Nutrients 2018, 10, 1785. [Google Scholar] [CrossRef]
  16. Musso, G.; Gambino, R.; De Michieli, F.; Cassader, M.; Rizzetto, M.; Durazzo, M.; Fagà, E.; Silli, B.; Pagano, G. Dietary Habits and Their Relations to Insulin Resistance and Postprandial Lipemia in Nonalcoholic Steatohepatitis. Hepatology 2003, 37, 909–916. [Google Scholar] [CrossRef]
  17. Tiikkainen, M.; Bergholm, R.; Vehkavaara, S.; Rissanen, A.; Häkkinen, A.-M.; Tamminen, M.; Teramo, K.; Yki-Järvinen, H. Effects of Identical Weight Loss on Body Composition and Features of Insulin Resistance in Obese Women with High and Low Liver Fat Content. Diabetes 2003, 52, 701–707. [Google Scholar] [CrossRef]
  18. Luukkonen, P.K.; Sädevirta, S.; Zhou, Y.; Kayser, B.; Ali, A.; Ahonen, L.; Lallukka, S.; Pelloux, V.; Gaggini, M.; Jian, C.; et al. Saturated Fat Is More Metabolically Harmful for the Human Liver Than Unsaturated Fat or Simple Sugars. Diabetes Care 2018, 41, 1732–1739. [Google Scholar] [CrossRef]
  19. Yki-Järvinen, H.; Luukkonen, P.K.; Hodson, L.; Moore, J.B. Dietary Carbohydrates and Fats in Nonalcoholic Fatty Liver Disease. Nat. Rev. Gastroenterol. Hepatol. 2021, 18, 770–786. [Google Scholar] [CrossRef]
  20. Rosqvist, F.; Iggman, D.; Kullberg, J.; Cedernaes, J.; Johansson, H.-E.; Larsson, A.; Johansson, L.; Ahlström, H.; Arner, P.; Dahlman, I.; et al. Overfeeding Polyunsaturated and Saturated Fat Causes Distinct Effects on Liver and Visceral Fat Accumulation in Humans. Diabetes 2014, 63, 2356–2368. [Google Scholar] [CrossRef]
  21. Valsta, L.; Kaartinen, N.; Tapanainen, H.; Männistö, S.; Sääksjärvi, K. Nutrition in Finland—The National FinDiet 2017 Survey; PunaMusta Oy, 2018; Finland Institute for Health and Welfare: Helsinki, Finland, 2018; pp. 74–75. [Google Scholar]
  22. Tsompanaki, E.; Thanapirom, K.; Papatheodoridi, M.; Parikh, P.; Chotai de Lima, Y.; Tsochatzis, E.A. Systematic Review and Meta-Analysis: The Role of Diet in the Development of Nonalcoholic Fatty Liver Disease. Clin. Gastroenterol. Hepatol. 2023, 21, 1462–1474.e24. [Google Scholar] [CrossRef]
  23. Cronin, P.; Joyce, S.A.; O’Toole, P.W.; O’Connor, E.M. Dietary Fibre Modulates the Gut Microbiota. Nutrients 2021, 13, 1655. [Google Scholar] [CrossRef]
  24. Bashiardes, S.; Shapiro, H.; Rozin, S.; Shibolet, O.; Elinav, E. Non-Alcoholic Fatty Liver and the Gut Microbiota. Mol. Metab. 2016, 5, 782–794. [Google Scholar] [CrossRef]
  25. Puertollano, E.; Kolida, S.; Yaqoob, P. Biological Significance of Short-Chain Fatty Acid Metabolism by the Intestinal Microbiome. Curr. Opin. Clin. Nutr. Metab. Care 2014, 17, 139–144. [Google Scholar] [CrossRef]
  26. Jasirwan, C.O.M.; Lesmana, C.R.A.; Hasan, I.; Sulaiman, A.S.; Gani, R.A. The Role of Gut Microbiota in Non-Alcoholic Fatty Liver Disease: Pathways of Mechanisms. Biosci. Microbiota Food Health 2019, 38, 81–88. [Google Scholar] [CrossRef]
  27. de la Cuesta-Zuluaga, J.; Mueller, N.T.; Álvarez-Quintero, R.; Velásquez-Mejía, E.P.; Sierra, J.A.; Corrales-Agudelo, V.; Carmona, J.A.; Abad, J.M.; Escobar, J.S. Higher Fecal Short-Chain Fatty Acid Levels Are Associated with Gut Microbiome Dysbiosis, Obesity, Hypertension and Cardiometabolic Disease Risk Factors. Nutrients 2018, 11, 51. [Google Scholar] [CrossRef]
  28. Rau, M.; Rehman, A.; Dittrich, M.; Groen, A.K.; Hermanns, H.M.; Seyfried, F.; Beyersdorf, N.; Dandekar, T.; Rosenstiel, P.; Geier, A. Fecal SCFAs and SCFA-Producing Bacteria in Gut Microbiome of Human NAFLD as a Putative Link to Systemic T-Cell Activation and Advanced Disease. United Eur. Gastroenterol. J. 2018, 6, 1496–1507. [Google Scholar] [CrossRef]
  29. Heimann, E.; Nyman, M.; Pålbrink, A.-K.; Lindkvist-Petersson, K.; Degerman, E. Branched Short-Chain Fatty Acids Modulate Glucose and Lipid Metabolism in Primary Adipocytes. Adipocyte 2016, 5, 359–368. [Google Scholar] [CrossRef]
  30. Sowah, S.A.; Riedl, L.; Damms-Machado, A.; Johnson, T.S.; Schübel, R.; Graf, M.; Kartal, E.; Zeller, G.; Schwingshackl, L.; Stangl, G.I.; et al. Effects of Weight-Loss Interventions on Short-Chain Fatty Acid Concentrations in Blood and Feces of Adults: A Systematic Review. Adv. Nutr. 2019, 10, 673–684. [Google Scholar] [CrossRef]
  31. Pagliai, G.; Russo, E.; Niccolai, E.; Dinu, M.; Di Pilato, V.; Magrini, A.; Bartolucci, G.; Baldi, S.; Menicatti, M.; Giusti, B.; et al. Influence of a 3-Month Low-Calorie Mediterranean Diet Compared to the Vegetarian Diet on Human Gut Microbiota and SCFA: The CARDIVEG Study. Eur. J. Nutr. 2020, 59, 2011–2024. [Google Scholar] [CrossRef]
  32. Vasconcellos, C.; Ferreira, O.; Lopes, M.F.; Ribeiro, A.F.; Vasques, J.; Guerreiro, C.S. Nutritional Genomics in Nonalcoholic Fatty Liver Disease. Biomedicines 2023, 11, 319. [Google Scholar] [CrossRef]
  33. Zheng, Y.; Li, Y.; Qi, Q.; Hruby, A.; Manson, J.E.; Willett, W.C.; Wolpin, B.M.; Hu, F.B.; Qi, L. Cumulative Consumption of Branched-Chain Amino Acids and Incidence of Type 2 Diabetes. Int. J. Epidemiol. 2016, 45, 1482–1492. [Google Scholar] [CrossRef]
  34. Jennings, A.; MacGregor, A.; Pallister, T.; Spector, T.; Cassidy, A. Associations between Branched Chain Amino Acid Intake and Biomarkers of Adiposity and Cardiometabolic Health Independent of Genetic Factors: A Twin Study. Int. J. Cardiol. 2016, 223, 992–998. [Google Scholar] [CrossRef]
  35. Branched-Chain Amino Acids Are Associated with Cardiometabolic Risk Profiles Found Already in Lean, Overweight and Obese Young—PubMed. Available online: https://pubmed.ncbi.nlm.nih.gov/27142745/ (accessed on 16 March 2023).
  36. Shimomura, Y.; Murakami, T.; Nakai, N.; Nagasaki, M.; Harris, R.A. Exercise Promotes BCAA Catabolism: Effects of BCAA Supplementation on Skeletal Muscle during Exercise. J. Nutr. 2004, 134, 1583S–1587S. [Google Scholar] [CrossRef]
  37. Giacco, A.; Cioffi, F.; Cuomo, A.; Simiele, R.; Senese, R.; Silvestri, E.; Amoresano, A.; Fontanarosa, C.; Petito, G.; Moreno, M.; et al. Mild Endurance Exercise during Fasting Increases Gastrocnemius Muscle and Prefrontal Cortex Thyroid Hormone Levels through Differential BHB and BCAA-Mediated BDNF-MTOR Signaling in Rats. Nutrients 2022, 14, 1166. [Google Scholar] [CrossRef]
  38. Newgard, C.B.; An, J.; Bain, J.R.; Muehlbauer, M.J.; Stevens, R.D.; Lien, L.F.; Haqq, A.M.; Shah, S.H.; Arlotto, M.; Slentz, C.A.; et al. A Branched-Chain Amino Acid-Related Metabolic Signature That Differentiates Obese and Lean Humans and Contributes to Insulin Resistance. Cell. Metab. 2009, 9, 311–326. [Google Scholar] [CrossRef]
  39. Guasch-Ferre, M.; Hruby, A.; Toledo, E.; Clish, C.B.; Martinez-Gonzalez, M.A.; Salas-Salvado, J.; Hu, F.B. Metabolomics in Prediabetes and Diabetes: A Systematic Review and Meta-Analysis. Diabetes Care 2016, 39, 833–846. [Google Scholar] [CrossRef]
  40. Lake, A.D.; Novak, P.; Shipkova, P.; Aranibar, N.; Robertson, D.G.; Reily, M.D.; Lehman-McKeeman, L.D.; Vaillancourt, R.R.; Cherrington, N.J. Branched Chain Amino Acid Metabolism Profiles in Progressive Human Nonalcoholic Fatty Liver Disease. Amino Acids 2015, 47, 603–615. [Google Scholar] [CrossRef]
  41. Zhao, X.; Han, Q.; Liu, Y.; Sun, C.; Gang, X.; Wang, G. The Relationship between Branched-Chain Amino Acid Related Metabolomic Signature and Insulin Resistance: A Systematic Review. J. Diabetes Res. 2016, 2016, 2794591. [Google Scholar] [CrossRef]
  42. Batch, B.C.; Hyland, K.; Svetkey, L.P. Branch Chain Amino Acids: Biomarkers of Health and Disease. Curr. Opin. Clin. Nutr. Metab. Care 2014, 17, 86–89. [Google Scholar] [CrossRef]
  43. Fiehn, O.; Garvey, W.T.; Newman, J.W.; Lok, K.H.; Hoppel, C.L.; Adams, S.H. Plasma Metabolomic Profiles Reflective of Glucose Homeostasis in Non-Diabetic and Type 2 Diabetic Obese African-American Women. PLoS ONE 2010, 5, e15234. [Google Scholar] [CrossRef]
  44. Lackey, D.E.; Lynch, C.J.; Olson, K.C.; Mostaedi, R.; Ali, M.; Smith, W.H.; Karpe, F.; Humphreys, S.; Bedinger, D.H.; Dunn, T.N.; et al. Regulation of Adipose Branched-Chain Amino Acid Catabolism Enzyme Expression and Cross-Adipose Amino Acid Flux in Human Obesity. Am. J. Physiol. Endocrinol. Metab. 2013, 304, E1175–E1187. [Google Scholar] [CrossRef]
  45. Giesbertz, P.; Daniel, H. Branched-Chain Amino Acids as Biomarkers in Diabetes. Curr. Opin. Clin. Nutr. Metab. Care 2016, 19, 48–54. [Google Scholar] [CrossRef]
  46. Clinical and Metabolic Characterization of Lean Caucasian Subjects with Non-Alcoholic Fatty Liver–PubMed. Available online: https://pubmed.ncbi.nlm.nih.gov/27527746/ (accessed on 16 March 2023).
  47. Shah, S.H.; Bain, J.R.; Muehlbauer, M.J.; Stevens, R.D.; Crosslin, D.R.; Haynes, C.; Dungan, J.; Newby, L.K.; Hauser, E.R.; Ginsburg, G.S.; et al. Association of a Peripheral Blood Metabolic Profile with Coronary Artery Disease and Risk of Subsequent Cardiovascular Events. Circ. Cardiovasc. Genet. 2010, 3, 207–214. [Google Scholar] [CrossRef]
  48. Doi, M.; Yamaoka, I.; Nakayama, M.; Mochizuki, S.; Sugahara, K.; Yoshizawa, F. Isoleucine, a Blood Glucose-Lowering Amino Acid, Increases Glucose Uptake in Rat Skeletal Muscle in the Absence of Increases in AMP-Activated Protein Kinase Activity. J. Nutr. 2005, 135, 2103–2108. [Google Scholar] [CrossRef]
  49. Nishimura, J.; Masaki, T.; Arakawa, M.; Seike, M.; Yoshimatsu, H. Isoleucine Prevents the Accumulation of Tissue Triglycerides and Upregulates the Expression of PPARalpha and Uncoupling Protein in Diet-Induced Obese Mice. J. Nutr. 2010, 140, 496–500. [Google Scholar] [CrossRef]
  50. Lange, O.; Proczko-Stepaniak, M.; Mika, A. Short-Chain Fatty Acids-A Product of the Microbiome and Its Participation in Two-Way Communication on the Microbiome-Host Mammal Line. Curr. Obes. Rep. 2023, 12, 108–126. [Google Scholar] [CrossRef]
  51. Laakso, M.; Kuusisto, J.; Stančáková, A.; Kuulasmaa, T.; Pajukanta, P.; Lusis, A.J.; Collins, F.S.; Mohlke, K.L.; Boehnke, M. The Metabolic Syndrome in Men Study: A Resource for Studies of Metabolic and Cardiovascular Diseases. J. Lipid Res. 2017, 58, 481–493. [Google Scholar] [CrossRef]
  52. Mithril, C.; Dragsted, L.O.; Meyer, C.; Blauert, E.; Holt, M.K.; Astrup, A. Guidelines for the New Nordic Diet. Public Health Nutr. 2012, 15, 1941–1947. [Google Scholar] [CrossRef]
  53. Lankinen, M.A.; de Mello, V.D.; Meuronen, T.; Sallinen, T.; Ågren, J.; Virtanen, K.A.; Laakso, M.; Pihlajamäki, J.; Schwab, U. The FADS1 Genotype Modifies Metabolic Responses to the Linoleic Acid and Alpha-Linolenic Acid Containing Plant Oils-Genotype Based Randomized Trial FADSDIET2. Mol. Nutr. Food Res. 2021, 65, e2001004. [Google Scholar] [CrossRef]
  54. Lankinen, M.A.; Fauland, A.; Shimizu, B.; Ågren, J.; Wheelock, C.E.; Laakso, M.; Schwab, U.; Pihlajamäki, J. Inflammatory Response to Dietary Linoleic Acid Depends on FADS1 Genotype. Am. J. Clin. Nutr. 2019, 109, 165–175. [Google Scholar] [CrossRef]
  55. Matsuda, M.; DeFronzo, R.A. Insulin Sensitivity Indices Obtained from Oral Glucose Tolerance Testing: Comparison with the Euglycemic Insulin Clamp. Diabetes Care 1999, 22, 1462–1470. [Google Scholar] [CrossRef]
  56. Ramdas Nayak, V.K.; Satheesh, P.; Shenoy, M.T.; Kalra, S. Triglyceride Glucose (TyG) Index: A Surrogate Biomarker of Insulin Resistance. J. Pak. Med. Assoc. 2022, 72, 986–988. [Google Scholar] [CrossRef]
  57. Wang, J.; Yan, S.; Cui, Y.; Chen, F.; Piao, M.; Cui, W. The Diagnostic and Prognostic Value of the Triglyceride-Glucose Index in Metabolic Dysfunction-Associated Fatty Liver Disease (MAFLD): A Systematic Review and Meta-Analysis. Nutrients 2022, 14, 4969. [Google Scholar] [CrossRef]
  58. Bedogni, G.; Bellentani, S.; Miglioli, L.; Masutti, F.; Passalacqua, M.; Castiglione, A.; Tiribelli, C. The Fatty Liver Index: A Simple and Accurate Predictor of Hepatic Steatosis in the General Population. BMC Gastroenterol. 2006, 6, 33. [Google Scholar] [CrossRef]
  59. Lee, J.H.; Kim, D.; Kim, H.J.; Lee, C.H.; Yang, J.I.; Kim, W.; Kim, Y.J.; Yoon, J.H.; Cho, S.H.; Sung, M.W.; et al. Hepatic Steatosis Index: A Simple Screening Tool Reflecting Nonalcoholic Fatty Liver Disease. Dig. Liver Dis. 2010, 42, 503–508. [Google Scholar] [CrossRef]
  60. Kotronen, A.; Peltonen, M.; Hakkarainen, A.; Sevastianova, K.; Bergholm, R.; Johansson, L.M.; Lundbom, N.; Rissanen, A.; Ridderstrale, M.; Groop, L.; et al. Prediction of Non-Alcoholic Fatty Liver Disease and Liver Fat Using Metabolic and Genetic Factors. Gastroenterology 2009, 137, 865–872. [Google Scholar] [CrossRef]
  61. Zheng, X.; Qiu, Y.; Zhong, W.; Baxter, S.; Su, M.; Li, Q.; Xie, G.; Ore, B.M.; Qiao, S.; Spencer, M.D.; et al. A Targeted Metabolomic Protocol for Short-Chain Fatty Acids and Branched-Chain Amino Acids. Metabolomics 2013, 9, 818–827. [Google Scholar] [CrossRef]
  62. Cai, J.; Zhang, J.; Tian, Y.; Zhang, L.; Hatzakis, E.; Krausz, K.W.; Smith, P.B.; Gonzalez, F.J.; Patterson, A.D. Orthogonal Comparison of GC-MS and 1H NMR Spectroscopy for Short Chain Fatty Acid Quantitation. Anal. Chem. 2017, 89, 7900–7906. [Google Scholar] [CrossRef]
  63. Martin-Gallausiaux, C.; Marinelli, L.; Blottière, H.M.; Larraufie, P.; Lapaque, N. SCFA: Mechanisms and Functional Importance in the Gut. Proc. Nutr. Soc. 2021, 80, 37–49. [Google Scholar] [CrossRef]
  64. Hamer, H.M.; Jonkers, D.; Venema, K.; Vanhoutvin, S.; Troost, F.J.; Brummer, R.-J. Review Article: The Role of Butyrate on Colonic Function. Aliment. Pharmacol. Ther. 2008, 27, 104–119. [Google Scholar] [CrossRef]
  65. Maldonado-Contreras, A.; Noel, S.E.; Ward, D.V.; Velez, M.; Mangano, K.M. Associations between Diet, the Gut Microbiome, and Short-Chain Fatty Acid Production among Older Caribbean Latino Adults. J. Acad. Nutr. Diet 2020, 120, 2047–2060.e6. [Google Scholar] [CrossRef]
  66. Wang, B.; Kong, Q.; Li, X.; Zhao, J.; Zhang, H.; Chen, W.; Wang, G. A High-Fat Diet Increases Gut Microbiota Biodiversity and Energy Expenditure Due to Nutrient Difference. Nutrients 2020, 12, 3197. [Google Scholar] [CrossRef]
  67. Ziętek, M.; Celewicz, Z.; Kikut, J.; Szczuko, M. Implications of SCFAs on the Parameters of the Lipid and Hepatic Profile in Pregnant Women. Nutrients 2021, 13, 1749. [Google Scholar] [CrossRef]
  68. Zhao, G.; Yang, L.; Zhong, W.; Hu, Y.; Tan, Y.; Ren, Z.; Ban, Q.; Yang, C.S.; Wang, Y.; Wang, Z. Polydatin, A Glycoside of Resveratrol, Is Better Than Resveratrol in Alleviating Non-Alcoholic Fatty Liver Disease in Mice Fed a High-Fructose Diet. Front. Nutr. 2022, 9, 857879. [Google Scholar] [CrossRef]
  69. Vogt, J.A.; Wolever, T.M.S. Fecal Acetate Is Inversely Related to Acetate Absorption from the Human Rectum and Distal Colon. J. Nutr. 2003, 133, 3145–3148. [Google Scholar] [CrossRef]
  70. Deng, K.; Xu, J.; Shen, L.; Zhao, H.; Gou, W.; Xu, F.; Fu, Y.; Jiang, Z.; Shuai, M.; Li, B.; et al. Comparison of Fecal and Blood Metabolome Reveals Inconsistent Associations of the Gut Microbiota with Cardiometabolic Diseases. Nat. Commun. 2023, 14, 571. [Google Scholar] [CrossRef]
  71. Trefflich, I.; Dietrich, S.; Braune, A.; Abraham, K.; Weikert, C. Short- and Branched-Chain Fatty Acids as Fecal Markers for Microbiota Activity in Vegans and Omnivores. Nutrients 2021, 13, 1808. [Google Scholar] [CrossRef]
  72. McOrist, A.L.; Abell, G.C.J.; Cooke, C.; Nyland, K. Bacterial Population Dynamics and Faecal Short-Chain Fatty Acid (SCFA) Concentrations in Healthy Humans. Br. J. Nutr. 2008, 100, 138–146. [Google Scholar] [CrossRef]
  73. Zhou, M.; Shao, J.; Wu, C.-Y.; Shu, L.; Dong, W.; Liu, Y.; Chen, M.; Wynn, R.M.; Wang, J.; Wang, J.; et al. Targeting BCAA Catabolism to Treat Obesity-Associated Insulin Resistance. Diabetes 2019, 68, 1730–1746. [Google Scholar] [CrossRef]
  74. Vanweert, F.; Schrauwen, P.; Phielix, E. Role of Branched-Chain Amino Acid Metabolism in the Pathogenesis of Obesity and Type 2 Diabetes-Related Metabolic Disturbances BCAA Metabolism in Type 2 Diabetes. Nutr. Diabetes 2022, 12, 35. [Google Scholar] [CrossRef]
  75. Tai, E.S.; Tan, M.L.S.; Stevens, R.D.; Low, Y.L.; Muehlbauer, M.J.; Goh, D.L.M.; Ilkayeva, O.R.; Wenner, B.R.; Bain, J.R.; Lee, J.J.M.; et al. Insulin Resistance Is Associated with a Metabolic Profile of Altered Protein Metabolism in Chinese and Asian-Indian Men. Diabetologia 2010, 53, 757–767. [Google Scholar] [CrossRef]
  76. McCormack, S.E.; Shaham, O.; McCarthy, M.A.; Deik, A.A.; Wang, T.J.; Gerszten, R.E.; Clish, C.B.; Mootha, V.K.; Grinspoon, S.K.; Fleischman, A. Circulating Branched-Chain Amino Acid Concentrations Are Associated with Obesity and Future Insulin Resistance in Children and Adolescents. Pediatr. Obes. 2013, 8, 52–61. [Google Scholar] [CrossRef]
  77. Gleason, C.E.; Lu, D.; Witters, L.A.; Newgard, C.B.; Birnbaum, M.J. The Role of AMPK and MTOR in Nutrient Sensing in Pancreatic Beta-Cells. J. Biol. Chem. 2007, 282, 10341–10351. [Google Scholar] [CrossRef]
  78. Tajiri, K.; Shimizu, Y. Branched-Chain Amino Acids in Liver Diseases. World J. Gastroenterol. 2013, 19, 7620–7629. [Google Scholar] [CrossRef]
  79. Yoon, M.-S. The Emerging Role of Branched-Chain Amino Acids in Insulin Resistance and Metabolism. Nutrients 2016, 8, 405. [Google Scholar] [CrossRef]
  80. Pedersen, H.K.; Gudmundsdottir, V.; Nielsen, H.B.; Hyotylainen, T.; Nielsen, T.; Jensen, B.A.; Forslund, K.; Hildebrand, F.; Prifti, E.; Falony, G.; et al. Human Gut Microbes Impact Host Serum Metabolome and Insulin Sensitivity. Nature 2016, 535, 376–381. [Google Scholar] [CrossRef]
  81. Shi, X.; Yin, H.; Li, J.; Huang, C.; Chen, Y.; Chen, Z.; Liu, W.; Su, W.; Zhang, Y.; Lin, M.; et al. Circulating Branch Chain Amino Acids and Improvement in Liver Fat Content in Response to Exercise Interventions in NAFLD. Sci. Rep. 2021, 11, 13415. [Google Scholar] [CrossRef]
  82. Merz, B.; Frommherz, L.; Rist, M.J.; Kulling, S.E.; Bub, A.; Watzl, B. Dietary Pattern and Plasma BCAA-Variations in Healthy Men and Women-Results from the KarMeN Study. Nutrients 2018, 10, 623. [Google Scholar] [CrossRef]
  83. Ley, R.E.; Turnbaugh, P.J.; Klein, S.; Gordon, J.I. Microbial Ecology: Human Gut Microbes Associated with Obesity. Nature 2006, 444, 1022–1023. [Google Scholar] [CrossRef]
  84. Turnbaugh, P.J.; Ridaura, V.K.; Faith, J.J.; Rey, F.E.; Knight, R.; Gordon, J.I. The Effect of Diet on the Human Gut Microbiome: A Metagenomic Analysis in Humanized Gnotobiotic Mice. Sci. Transl. Med. 2009, 1, 6ra14. [Google Scholar] [CrossRef]
  85. Ecklu-Mensah, G.; Choo-Kang, C.; Gjerstad Maseng, M.; Donato, S.; Bovet, P.; Bedu-Addo, K.; Plange-Rhule, J.; Forrester, T.E.; Lambert, E.V.; Rae, D.; et al. Gut Microbiota and Fecal Short Chain Fatty Acids Differ with Adiposity and Country of Origin: The METS-Microbiome Study. Nat. Commun. 2023, 14, 5160. [Google Scholar] [CrossRef]
Figure 1. Flowchart of the LIDIGE study and analysis of short-chain fatty acids and branched-chain amino acids.
Nutrients 16 00261 g001
Figure 2. Plasma short-chain fatty acids: (a) iso-butyric acid (IBA) and (b) valeric acid (VA) at baseline (week 0) and week 12 by recommended diet and average diet and PNPLA3 genotypes CC and GG (n = 88). Repeated generalized linear model; Values are presented as means ± SEM, dots/triangular dots present each participant; p < 0.05 in bold; p1 = time, p2 = time and genotype group.
Nutrients 16 00261 g002
Figure 3. Plasma branched-chain amino acids (a) valine (VAL) and (b) leucine (LEU) at baseline (week 0) and week 12 by recommended diet and average diet and PNPLA3 genotypes CC and GG (n = 88). Repeated generalized linear model; Values are presented as means ± SEM, dots/triangular dots present each participant; p < 0.05 in bold; p1 = time, p2 = time and genotype.
Nutrients 16 00261 g003
Figure 4. Fecal short-chain fatty acids (a) acetic acid (AA) and (b) butyric acid (BA) at baseline (week 0) and week 12 by recommended diet and average diet and PNPLA3 genotypes CC and GG (n = 83). Repeated generalized linear model; Values are presented as means ± SEM, dots/triangular dots present each participant; p < 0.05 in bold; p1 = time, p2 = time and genotype.
Nutrients 16 00261 g004
Table 1. Baseline characteristics of the participants (n = 88).
CC Genotype of PNPLA3 GG Genotype of PNPLA3
RD
n = 28
AD
n = 20
RD
n = 20
AD
n = 20
p Value
Age (years)68.9 ± 4.566.2 ± 3.768.4 ± 4.567.2 ± 4.20.151
BMI (kg/m2)27.8 ± 2.528.1 ± 2.425.8 ± 2.026.4 ± 2.30.004 *,2,3
Waist (cm)101.5 ± 8.7104.4 ± 8.094.6 ± 7.695.8 ± 7.50.00036 *,2,3
GGT (U/L)32.8 ± 19.332.8 ± 21.120.1 ± 5.626.1 ± 9.90.026 *,2,4
ALT (U/L)26.3 ± 13.327.7 ± 9.123.5 ± 12.927.7 ± 10.60.633
AST (U/L)28.2 ± 7.427.6 ± 5.027.0 ± 6.927.0 ± 7.50.902
Albumin (g/dL)38.3 ± 2.838.9 ± 2.238.0 ± 2.438.5 ± 3.20.763
Total cholesterol (mmol/L)4.21 ± 0.974.66 ± 0.964.51 ± 0.804.58 ± 1.010.355
HDL cholesterol (mmol/L)1.47 ± 0.541.29 ± 0.251.49 ± 0.371.41 ± 0.370.230
LDL cholesterol (mmol/L)2.53 ± 0.773.04 ± 0.862.84 ± 0.782.93 ± 0.890.167
Triglycerides (mmol/L)0.97 ± 0.371.28 ± 0.421.21 ± 0.791.12 ± 0.490.193
Fasting glucose (mmol/L)5.71 ± 0.455.78 ± 0.355.58 ± 0.355.83 ± 0.410.229
120 min glucose (mmol/L)6.23 ± 1.466.31 ± 1.675.81 ± 1.465.96 ± 1.160.648
Fasting insulin (mU/L)9.1 ± 5.414.0 ± 7.67.4 ± 3.59.1 ± 5.40.0031 *,1,4
120 min insulin (mU/L)63.2 ± 58.659.8 ± 40.640.9 ± 27.252.1 ± 46.30.387
Hs-CRP (mg/L)1.01 ± 1.041.65 ± 1.450.71 ± 0.311.02 ± 0.870.032 *
RD, recommended diet; AD, average diet; BMI, body mass index; GGT, gamma-glutamyl transferase; ALT, alanine aminotransferase; AST, aspartate aminotransferase; HDL, high-density lipoprotein; LDL, low-density lipoprotein; Hs-CRP, high-sensitive C-reactive protein; Mean ± SD; * p < 0.05, 1 between all the study groups, one-way ANOVA; 2 between the RD CC and GG; 3 between the AD CC and GG; 4 between the CC RD and AD.
Table 2. Energy intake at baseline (week 0) and during the intervention (average of weeks 3, 7 and 11) (n = 88).
PNPLA3 GenotypeRecommended Dietp1p2Average Dietp1p2
CCGGCCGG
Total, n2820 2020
Study Time0Inter.0Inter. 0Inter.0Inter.
Energy (kcal/day)2220 ± 4252277 ± 4442195 ± 4022139 ± 4230.8930.2092429 ± 4062580 ± 4542342 ± 5102284 ± 3990.6830.057
Protein (E%) 16.4 ± 2.817.1 ± 2.317.5 ± 2.517.4 ± 1.60.3130.20916.3 ± 2.715.6 ± 1.816.8 ± 3.116.0 ± 2.30.039 *0.914
Carbohydrate (E%)40.8 ± 5.541.3 ± 5.642.0 ± 6.143.0 ± 5.50.2180.88043.2 ± 4.840.9 ± 5.043.6 ± 4.840.7 ± 4.70.001 *0.327
Fat (E%)38.3 ± 4.536.5 ± 3.536.2 ± 5.535.1 ± 4.80.032 *0.60636.8 ± 4.838.9 ± 4.435.0 ± 5.138.0 ± 4.70.001 *0.327
SFA (E%)13.2 ± 2.610.9 ± 1.912.3 ± 2.610.3 ± 1.82.47−8 *0.61613.0 ± 1.516.6 ± 2.512.3 ± 3.015.7 ± 2.04.06−8 *0.778
MUFA (E%)11.1 ± 2.414.6 ± 1.813.5 ± 2.614.2 ± 2.40.048 *0.75013.3 ± 1.912.9 ± 1.412.2 ± 2.112.8 ± 2.10.6730.175
PUFA (E%)7.3 ± 1.77.7 ± 1.37.1 ± 2.07.5 ± 1.40.028 *0.7987.2 ± 2.25.4 ± 0.86.9 ± 2.25.3 ± 0.71.20−6 *0.720
Omega 3 (E%)1.84 ± 0.612.16 ± 0.441.83 ± 0.732.18 ± 0.490.000018 *0.6711.78 ± 0.481.40 ± 0.231.7 ± 0.71.4 ± 0.20.004 *0.241
Omega 6 (E%)5.0 ± 1.25.3 ± 1.05.1 ± 1.85.0 ± 1.00.2100.5225.0 ± 1.53.9 ± 0.54.8 ± 1.43.7 ± 0.50.000013 *0.980
EPA (E%)0.056 ± 0.0690.070 ± 0.0450.064 ± 0.0840.083 ± 0.0560.00026 *0.9960.047 ± 0.0600.023 ± 0.0210.068 ± 0.0710.035 ± 0.0300.1780.830
DHA (E%)0.146 ± 0.2030.178 ± 0.1370.170 ± 0.2450.227 ± 0.1620.00022 *0.9570.127 ± 0.1670.587 ± 0.5420.175 ± 0.2020.100 ± 0.7930.3240.886
Fiber (g/day)29.3 ± 12.330.3 ± 10.231.8 ± 11.731.0 ± 10.80.7090.22431.2 ± 8.330.1 ± 9.329.6 ± 8.027.5 ± 7.20.0640.717
AD, average diet; RD, recommended diet; E%/day, percent of the total energy intake of the day; SFA, saturated fat; MUFA, monounsaturated fat; PUFA, polyunsaturated fat; EPA, eicosapentaenoic fatty acid; DHA, docosahexaenoic acid; mean ± SD; repeated generalized linear model; * p < 0.05; p1 = time, p2 = time and genotype group.
Table 3. Plasma SCFA and BCAA and fecal SCFA at baseline (week 0) and after the intervention (week 12).
Recommended Dietp1p2Average Dietp1 p2
CCGG CCGG
Week012012 012012
Plasma SCFA (µmol/g) n = 28n = 20 n = 20n = 20
Total SCFA245 ± 130227 ± 54 232 ± 68209 ± 85 0.041 *0.315228 ± 48235 ± 78219 ± 63208 ± 610.8880.934
Acetic acid (AA)179 ± 121145 ± 31 162 ± 63143 ± 410.1200.879155 ± 33167 ± 59161 ± 60142 ± 610.4200.211
Propionic acid (PA)48 ± 2764 ± 5243 ± 3142 ± 480.7000.35452 ± 31 50 ± 4436 ± 27 29 ± 340.0770.983
Iso-butyric acid (IBA)7.3 ± 1.4 6.6 ± 2.07.3 ± 1.35.7 ± 2.30.002 *0.1845.6 ±3.05.4 ± 2.5 7.3 ± 1.65.9 ± 2.50.6130.399
Butyric acid (BA)7.4 ± 1.07.3 ± 1.07.3 ± 1.3 5.7 ± 2.30.1600.6357.0 ± 0.77.2 ± 1.07.3 ± 0.76.9 ± 0.70.4110.065
Valeric acid (VA)3.7 ± 0.44.2 ± 1.73.6 ± 0.67.0 ± 0.60.0003 *0.004 *3.5 ± 0.64.3 ± 2.13.8 ± 0.39.7 ± 8.50.004 *0.079
Plasma BCAA (µmol/g)
Total BCAA572 ± 128581 ± 182599 ± 202634 ± 1540.6880.280612 ± 184532 ± 149587 ± 182590 ± 1300.015 *0.376
Valine (VAL)258 ± 67252 ± 90266 ± 92212 ± 950.009 *0.096196 ± 100214 ± 89290 ± 75211 ± 1080.2220.024 *
Leucine (LEU)136 ± 55145 ± 85141 ± 96142 ± 590.9360.662141 ± 49124 ± 71162 ± 75148 ± 610.043 *0.244
Isoleucine (ILE)160 ± 23153 ± 33169 ± 65157 ± 900.1330.657164 ±112155 ± 31167 ± 26139 ± 370.2380.081
Fecal SCFA (µmol/g)n = 26n = 20 n = 18n = 19
Total SCFA52 ± 2540 ± 2448 ± 2142 ± 26 0.010 *0.46159 ± 2257 ± 2758 ± 2560 ± 35 0.6590.964
Acetic acid (AA)32 ± 1526 ± 1532 ± 1326 ± 160.007 *0.82137 ± 1235 ± 1537 ± 1536 ± 200.4270.914
Propionic acid (PA)8.7 ± 5.36.5 ± 3.6 6.9 ± 4.36.9 ± 4.60.3040.1459.6 ± 6.58.9 ± 7.49.2 ± 6.211.8 ± 3.40.8820.340
Iso-butyric acid (IBA)0.60±0.390.61±0.450.62±0.450.55±0.570.4610.8610.62±0.550.60±0.550.66±0.550.67±0.520.6210.660
Butyric acid (BA)9.5 ± 6.06.9 ± 5.08.0 ± 4.98.0 ± 6.40.028 *0.26710.1 ± 4.511.2 ± 6.59.7 ± 4.910.1 ± 6.80.9180.524
Valeric acid (VA)1.04±0.591.00±0.530.91±0.530.81±0.660.3390.8941.32±0.991.29±0.711.28±0.951.35±1.180.7250.808
SCFA, short-chain fatty acid; BCAA, branched-chain amino acids; mean ± SD; repeated generalized linear model; * p < 0.05; p1 = time, p2 = time and genotype.
Disclaimer/Publisher’s Note: The statements, opinions and data contained in all publications are solely those of the individual author(s) and contributor(s) and not of MDPI and/or the editor(s). MDPI and/or the editor(s) disclaim responsibility for any injury to people or property resulting from any ideas, methods, instructions or products referred to in the content.

