
Adoption of a Short-Term (4-Week) Vegan Diet as Part of ‘Veganuary’ Significantly Reduces Saturated Fatty Acid (SFA), Cholesterol, B12, and Iodine Intake in Omnivorous Individuals—An Observational Study


Abstract
:1. Introduction
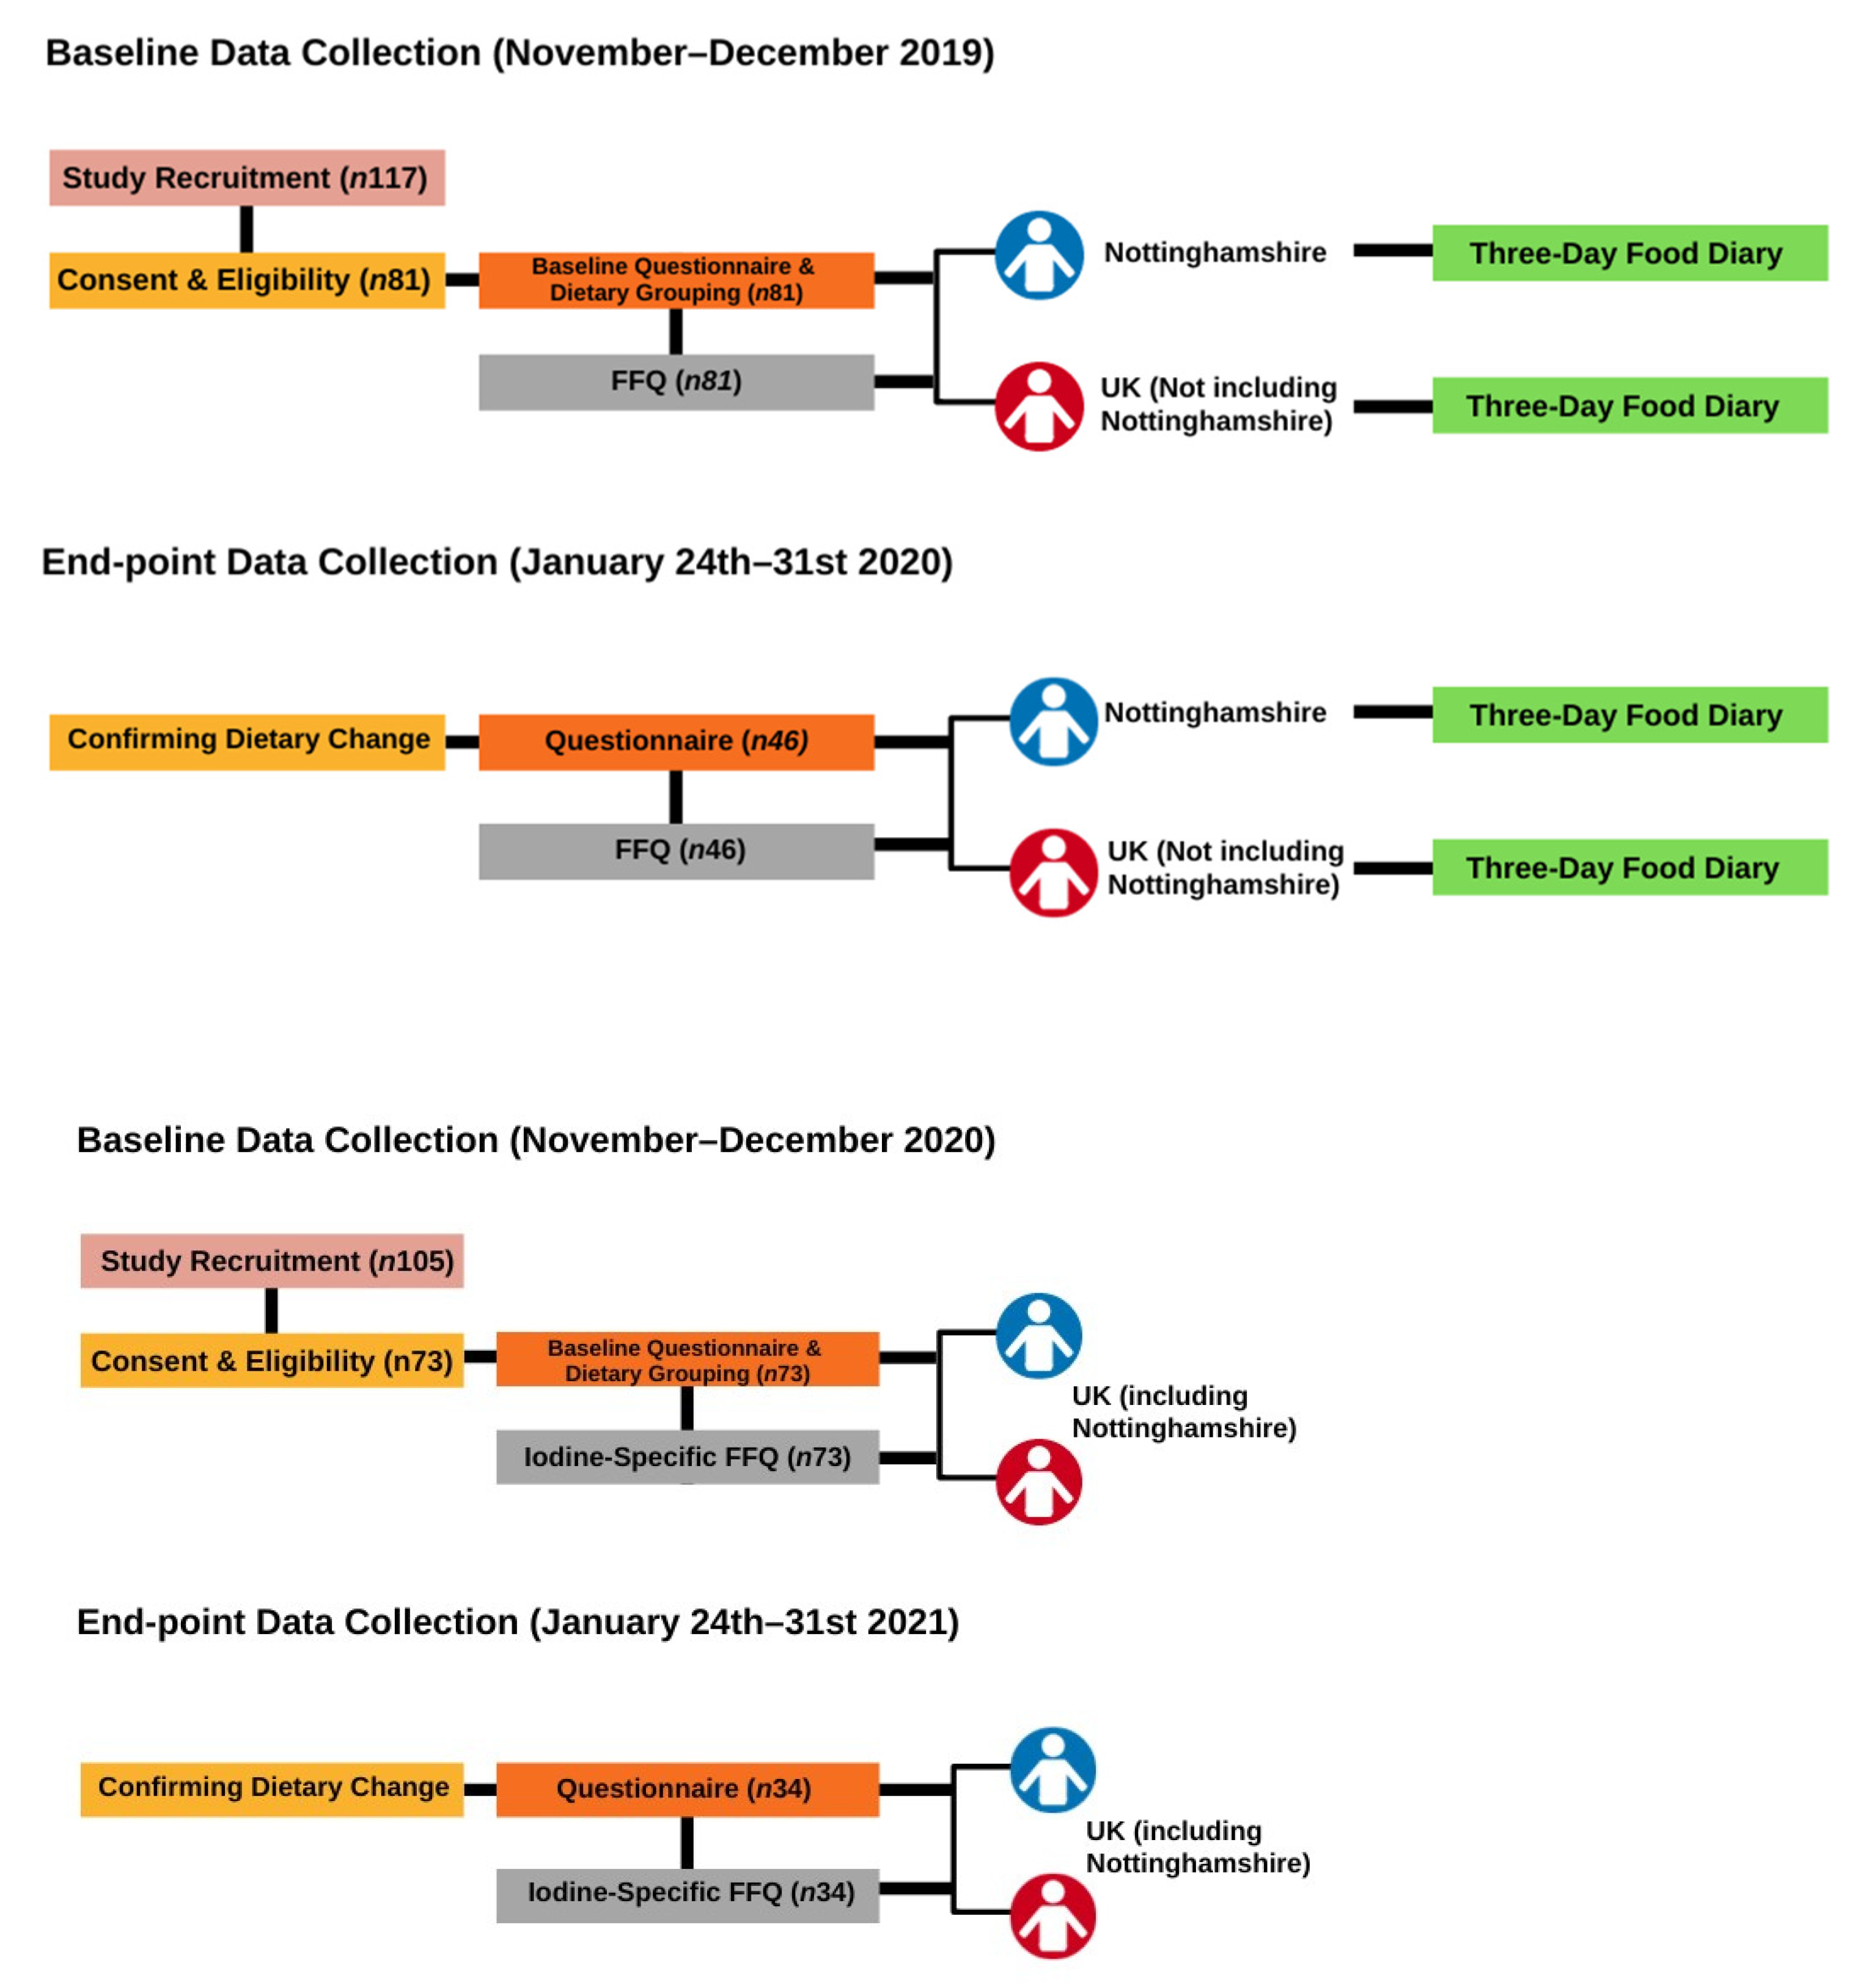
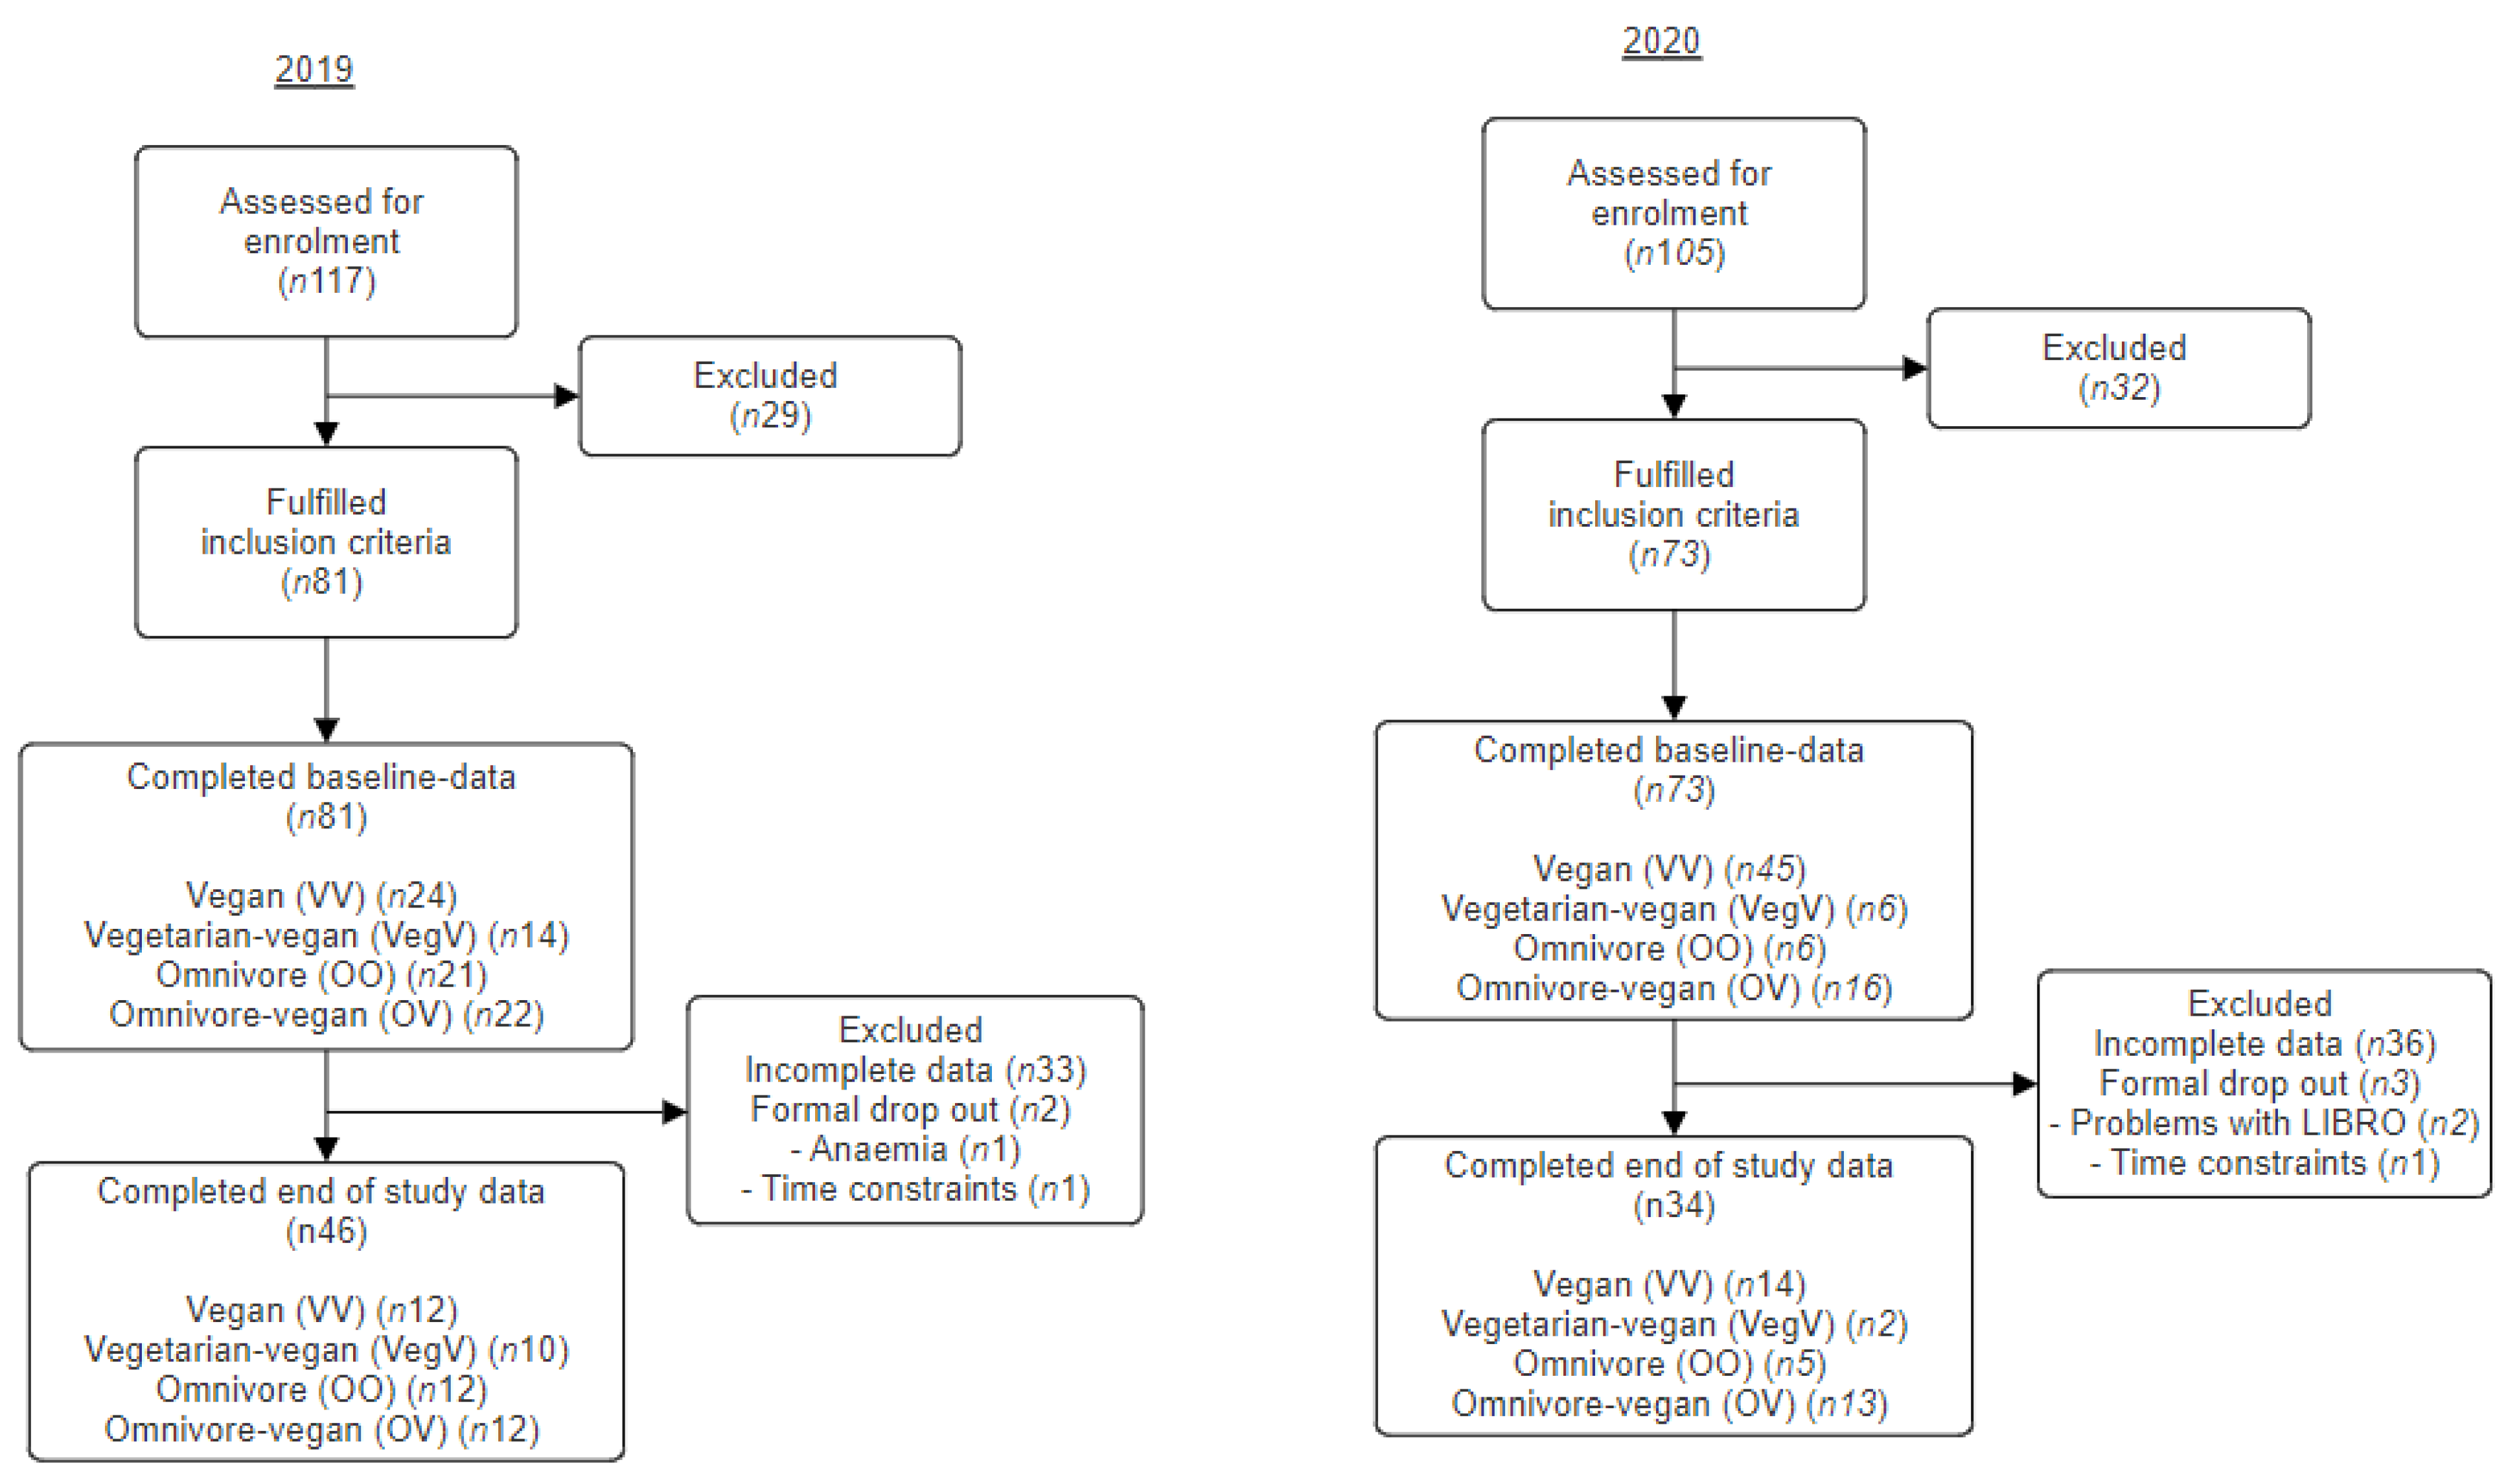
2. Materials and Methods
2.1. Baseline Questionnaire
2.2. Dietary Grouping
2.3. Motivation Survey
2.4. Food Choice Survey
2.5. Dietary Adherence Log
2.6. Food Frequency Questionnaire (FFQ)
2.7. Statistical Analysis
3. Results
3.1. Participant Demographics
3.2. Motivations to Follow a Vegan Diet
3.3. Dietary Intake by Food Frequency Questionnaire in 2019
3.4. Supplement Intake
3.5. Food Choice Survey
3.6. Micronutrient Knowledge
3.7. Iodine Knowledge
4. Discussion
Limitations
5. Conclusions
Supplementary Materials
Author Contributions
Funding
Institutional Review Board Statement
Informed Consent Statement
Data Availability Statement
Acknowledgments
Conflicts of Interest
References
- Phillips, F. Vegetarian Nutrition. Nutr. Bull. 2005, 30, 132–167. [Google Scholar] [CrossRef]
- YouGov. Meet Britain’s Vegans and Vegetarians. 2022. Available online: https://yougov.co.uk/topics/lifestyle/articles-reports/2022/01/20/meet-britains-vegans-and-vegetarians (accessed on 25 August 2022).
- Mathieu, S.; Dorard, G. Vegetarianism and veganism lifestyle: Motivation and psychological dimensions associated with selective diet. Presse Med. 2016, 45, 726–733. [Google Scholar] [CrossRef] [PubMed]
- Rosenfeld, D.L.; Tomiyama, A.J. When vegetarians eat meat: Why vegetarians violate their diets and how they feel about doing so. Appetite 2019, 143, 104417. [Google Scholar] [CrossRef] [PubMed]
- MacInnis, C.C.; Hodson, G. Tensions within and between vegans and vegetarians: Meat-free motivations matter. Appetite 2021, 164, 105246. [Google Scholar] [CrossRef] [PubMed]
- Fox, N.; Ward, K. Health, ethics and environment: A qualitative study of vegetarian motivations. Appetite 2008, 50, 422–429. [Google Scholar] [CrossRef]
- North, M.; Klas, A.; Ling, M.; Kothe, E. A qualitative examination of the motivations behind vegan, vegetarian, and omnivore diets in an Australian population. Appetite 2021, 167, 105614. [Google Scholar] [CrossRef]
- Kerschke-Risch, P. Vegan diet: Motives, approach and duration. [CrossRef]
- De Backer, C.J.S.; Hudders, L. From Meatless Mondays to Meatless Sundays: Motivations for Meat Reduction among Vegetarians and Semi-vegetarians Who Mildly or Significantly Reduce Their Meat Intake. Ecol. Food Nutr. 2014, 53, 639–657. [Google Scholar] [CrossRef]
- Meatless Monday Compaigns Meatless Monday. Available online: https://www.mondaycampaigns.org/meatless-monday (accessed on 19 August 2022).
- Veganuary. Veganuary 2023. 2023. Available online: https://veganuary.com/ (accessed on 24 August 2022).
- British Dietetic Association (BDA). British Dietetic Association Confirms Well-Planned Vegan Diets Can Support Healthy Living in People of All Ages. 2017. Available online: https://www.vegansociety.com/whats-new/news/british-dietetic-association-confirms-vegan-diets-support-healthy-living (accessed on 26 August 2022).
- Australian Dietary Guidelines-Providing the Scientific Evidence for Healthier Australian Diets. Available online: https://www.eatforhealth.gov.au/guidelines/guidelines (accessed on 22 November 2023).
- Malik, N.; Tonstad, S.; Paalani, M.; Dos Santos, H.; Prado, W.L.D. Are long-term FAD diets restricting micronutrient intake? A randomized controlled trial. Food Sci. Nutr. 2020, 8, 6047–6060. [Google Scholar] [CrossRef]
- García-Morant, A.; Cortés-Castell, E.; Palazón-Bru, A.; Martínez-Amorós, N.; Gil-Guillén, V.F.; Rizo-Baeza, M. Macronutrientes y micronutrientes en adultos veganos españoles (población mediterránea). Nutr. Hosp. 2020, 37, 549–558. [Google Scholar] [CrossRef]
- Kristensen, N.B.; Madsen, M.L.; Hansen, T.H.; Allin, K.H.; Hoppe, C.; Fagt, S.; Lausten, M.S.; Gøbel, R.J.; Vestergaard, H.; Hansen, T.; et al. Intake of macro- and micronutrients in Danish vegans. Nutr. J. 2015, 14, 115. [Google Scholar] [CrossRef]
- Engel, M.G.; Kern, H.J.; Brenna, J.T.; Mitmesser, S.H. Micronutrient gaps in three commercial weight-loss diet plans. Nutrients 2018, 10, 108. [Google Scholar] [CrossRef]
- Schüpbach, R.; Wegmüller, R.; Berguerand, C.; Bui, M.; Herteraeberli, I. Micronutrient status and intake in omnivores, vegetarians and vegans in Switzerland. Eur. J. Nutr. 2017, 56, 283–293. [Google Scholar] [CrossRef]
- Derbyshire, E. Micronutrient Intakes of British Adults Across Mid-Life: A Secondary Analysis of the UK National Diet and Nutrition Survey. Front. Nutr. 2018, 5, 55. [Google Scholar] [CrossRef]
- Rizzo, G.; Laganà, A.S.; Rapisarda, A.M.C.; La Ferrera, G.M.G.; Buscema, M.; Rossetti, P.; Nigro, A.; Muscia, V.; Valenti, G.; Sapia, F.; et al. Vitamin B12 among Vegetarians: Status, Assessment and Supplementation. Nutrients 2016, 8, 767. [Google Scholar] [CrossRef]
- Pawlak, R.; Parrott, S.J.; Raj, S.; Cullum-Dugan, D.; Lucus, D. How prevalent is vitamin B12 deficiency among vegetarians? Nutr. Rev. 2013, 71, 110–117. [Google Scholar] [CrossRef]
- Gilsing, A.M.J.; Crowe, F.L.; Lloyd-Wright, Z.; Sanders, T.A.B.; Appleby, P.N.; E Allen, N.; Key, T.J. Serum concentrations of vitamin B12 and folate in British male omnivores, vegetarians and vegans: Results from a cross-sectional analysis of the EPIC-Oxford cohort study. Eur. J. Clin. Nutr. 2010, 64, 933–939. [Google Scholar] [CrossRef]
- Damayanti, D.; Jaceldo-Siegl, K.; Beeson, W.L.; Fraser, G.; Oda, K.; Haddad, E.H. Foods and Supplements Associated with Vitamin B12 Biomarkers among Vegetarian and Non-Vegetarian Participants of the Adventist Health Study-2 (AHS-2) Calibration Study. Nutrients 2018, 10, 722. [Google Scholar] [CrossRef]
- Selinger, E.; Kühn, T.; Procházková, M.; Anděl, M.; Gojda, J. Vitamin B12 Deficiency Is Prevalent Among Czech Vegans Who Do Not Use Vitamin B12 Supplements. Nutrients 2019, 11, 3019. [Google Scholar] [CrossRef]
- Eveleigh, E.R.; Coneyworth, L.J.; Avery, A.; Welham, S.J.M. Vegans, vegetarians, and omnivores: How does dietary choice influence iodine intake? A systematic review. Nutrients 2020, 12, 1606. [Google Scholar] [CrossRef]
- Fallon, N.; Dillon, S.A. Low Intakes of Iodine and Selenium Amongst Vegan and Vegetarian Women Highlight a Potential Nutritional Vulnerability. Front. Nutr. 2020, 7, 72. [Google Scholar] [CrossRef]
- Nicol, K.; Thomas, E.L.; Nugent, A.P.; Woodside, J.V.; Hart, K.H.; Bath, S.C. Iodine fortification of plant-based dairy and fish alternatives: The effect of substitution on iodine intake based on a market survey in the UK. Br. J. Nutr. 2023, 129, 832–842. [Google Scholar] [CrossRef]
- Platel, K.; Srinivasan, K. Bioavailability of Micronutrients from Plant Foods: An Update. Crit. Rev. Food Sci. Nutr. 2016, 56, 1608–1619. [Google Scholar] [CrossRef]
- Dineva, M.; Rayman, M.P.; Bath, S.C. Iodine status of consumers of milk-alternative drinks versus cows’ milk: Data from the UK National Diet and Nutrition Survey. Br. J. Nutr. 2020, 126, 28–36. [Google Scholar] [CrossRef]
- Bath, S.C.; Hill, S.; Infante, H.G.; Elghul, S.; Nezianya, C.J.; Rayman, M.P. Iodine concentration of milk-alternative drinks available in the UK in comparison with cows’ milk. Br. J. Nutr. 2017, 118, 525–532. [Google Scholar] [CrossRef]
- Alcorta, A.; Porta, A.; Tárrega, A.; Alvarez, M.D.; Vaquero, M.P. Foods for Plant-Based Diets: Challenges and Innovations. Foods 2021, 10, 293. [Google Scholar] [CrossRef]
- Sethi, S.; Tyagi, S.K.; Anurag, R.K. Plant-based milk alternatives an emerging segment of functional beverages: A review. J. Food Sci. Technol. 2016, 53, 3408–3423. [Google Scholar] [CrossRef]
- Tso, R.; Forde, C.G. Unintended Consequences: Nutritional Impact and Potential Pitfalls of Switching from Animal- to Plant-Based Foods. Nutrients 2021, 13, 2527. [Google Scholar] [CrossRef]
- Brown, L.; Rose, K.; Campbell, A. Healthy plant-based diets and their short-term effects on weight loss, nutrient intake and serum cholesterol levels. Nutr. Bull. 2022, 47, 199–207. [Google Scholar] [CrossRef]
- Rogerson, D.; Maçãs, D.; Milner, M.; Liu, Y.; Klonizakis, M. Contrasting Effects of Short-Term Mediterranean and Vegan Diets on Microvascular Function and Cholesterol in Younger Adults: A Comparative Pilot Study. Nutrients 2018, 10, 1897. [Google Scholar] [CrossRef]
- Pellinen, T.; Päivärinta, E.; Isotalo, J.; Lehtovirta, M.; Itkonen, S.T.; Korkalo, L.; Erkkola, M.; Pajari, A.-M. Replacing dietary animal-source proteins with plant-source proteins changes dietary intake and status of vitamins and minerals in healthy adults: A 12-week randomized controlled trial. Eur. J. Nutr. 2021, 61, 1391–1404. [Google Scholar] [CrossRef]
- O’kane, S.M.; Pourshahidi, L.K.; Farren, K.M.; Mulhern, M.S.; Strain, J.J.; Yeates, A.J. Iodine knowledge is positively associated with dietary iodine intake among women of childbearing age in the UK and Ireland. Br. J. Nutr. 2016, 116, 1728–1735. [Google Scholar] [CrossRef]
- Eveleigh, E.; Coneyworth, L.; Zhou, M.; Burdett, H.; Malla, J.; Nguyen, V.H.; Welham, S. Vegans and vegetarians living in Nottingham (UK) continue to be at risk of iodine deficiency. Br. J. Nutr. 2022, 129, 1510–1527. [Google Scholar] [CrossRef]
- von Elm, E.; Altman, D.G.; Egger, M.; Pocock, S.J.; Gøtzsche, P.C.; Vandenbroucke, J.P.; STROBE Initiative. The strengthening the reporting of observational studies in epidemiology (STROBE) statement: Guidelines for reporting observational studies. Int. J. Surg. 2014, 12, 1495–1499. [Google Scholar] [CrossRef]
- Online Surveys. 2019. Available online: https://www.onlinesurveys.ac.uk/ (accessed on 27 September 2019).
- Lee, P.H.; Macfarlane, D.J.; Lam, T.H.; Stewart, S.M. Validity of the international physical activity questionnaire short form (IPAQ-SF): A systematic review. Int. J. Behav. Nutr. Phys. Act. 2011, 8, 1–11. [Google Scholar] [CrossRef]
- Combet, E.; Lean, M.E.J. Validation of a short food frequency questionnaire specific for iodine in UK females of childbearing age. J. Hum. Nutr. Diet. 2014, 27, 599–605. [Google Scholar] [CrossRef]
- Steptoe, A.; Pollard, T.M.; Wardle, J. Development of a measure of the motives underlying the selection of food: The food choice questionnaire. Appetite 1995, 25, 267–284. [Google Scholar] [CrossRef]
- Pollard, T.M.; Steptoe, A.; Wardle, J. Motives underlying healthy eating: Using the Food Choice Questionnaire to explain variation in dietary intake. J. Biosoc. Sci. 1998, 30, 165–179. [Google Scholar] [CrossRef]
- Study Design, Ethics and Regulation. EPIC Oxford. Available online: http://www.epic-oxford.org/methods/ (accessed on 16 September 2020).
- Mulligan, A.A.; Luben, R.N.; Bhaniani, A.; Parry-Smith, D.J.; O’Connor, L.; Khawaja, A.P.; Forouhi, N.G.; Khaw, K.-T. A new tool for converting food frequency questionnaire data into nutrient and food group values: FETA research methods and availability. BMJ Open 2014, 4, e004503. [Google Scholar] [CrossRef]
- Weder, S.; Keller, M.; Fischer, M.; Becker, K.; Alexy, U. Intake of micronutrients and fatty acids of vegetarian, vegan, and omnivorous children (1–3 years) in Germany (VeChi Diet Study). Eur. J. Nutr. 2022, 61, 1507–1520. [Google Scholar] [CrossRef]
- Bakaloudi, D.R.; Halloran, A.; Rippin, H.L.; Oikonomidou, A.C.; Dardavesis, T.I.; Williams, J.; Wickramasinghe, K.; Breda, J.; Chourdakis, M. Intake and adequacy of the vegan diet. A systematic review of the evidence. Clin. Nutr. 2021, 40, 3503–3521. [Google Scholar] [CrossRef]
- Dinu, M.; Abbate, R.; Gensini, G.F.; Casini, A.; Sofi, F. Vegetarian, vegan diets and multiple health outcomes: A systematic review with meta-analysis of observational studies. Crit. Rev. Food Sci. Nutr. 2017, 57, 3640–3649. [Google Scholar] [CrossRef]
- Clarys, P.; Deliens, T.; Huybrechts, I.; Deriemaeker, P.; Vanaelst, B.; De Keyzer, W.; Hebbelinck, M.; Mullie, P. Comparison of Nutritional Quality of the Vegan, Vegetarian, Semi-Vegetarian, Pesco-Vegetarian and Omnivorous Diet. Nutrients 2014, 6, 1318. [Google Scholar] [CrossRef]
- Krajčovičová-Kudláčková, M.; Bučková, K.; Klimeš, I.; Šeboková, E. Iodine Deficiency in Vegetarians and Vegans. Ann. Nutr. Metab. 2003, 47, 183–185. [Google Scholar] [CrossRef]
- Dawczynski, C.; Weidauer, T.; Richert, C.; Schlattmann, P.; Dawczynski, K.; Kiehntopf, M. Nutrient Intake and Nutrition Status in Vegetarians and Vegans in Comparison to Omnivores—The Nutritional Evaluation (NuEva) Study. Front. Nutr. 2022, 9, 819106. [Google Scholar] [CrossRef]
- Turner-McGrievy, G.M.; Barnard, N.D.; Scialli, A.; Lanou, A. Effects of a low-fat vegan diet and a Step II diet on macro-and micronutrient intakes in overweight postmenopausal women. Nutrition 2004, 20, 738–746. [Google Scholar] [CrossRef]
- Turner-McGrievy, G.M.; Barnard, N.D.; Cohen, J.; Jenkins, D.J.; Gloede, L.; Green, A.A. Changes in Nutrient Intake and Dietary Quality among Participants with Type 2 Diabetes Following a Low-Fat Vegan Diet or a Conventional Diabetes Diet for 22 Weeks. J. Am. Diet. Assoc. 2008, 108, 1636–1645. [Google Scholar] [CrossRef]
- Benatar, J.R.; Stewart, R.A.H. Cardiometabolic risk factors in vegans; A meta-analysis of observational studies. PLoS ONE 2018, 13, e0209086. [Google Scholar] [CrossRef]
- Kahleova, H.; Hlozkova, A.; Fleeman, R.; Fletcher, K.; Holubkov, R.; Barnard, N.D. Fat Quantity and Quality, as Part of a Low-Fat, Vegan Diet, Are Associated with Changes in Body Composition, Insulin Resistance, and Insulin Secretion. A 16-Week Randomized Controlled Trial. Nutrients 2019, 11, 615. [Google Scholar] [CrossRef]
- Elorinne, A.-L.; Alfthan, G.; Erlund, I.; Kivimäki, H.; Paju, A.; Salminen, I.; Turpeinen, U.; Voutilainen, S.; Laakso, J. Food and Nutrient Intake and Nutritional Status of Finnish Vegans and Non-Vegetarians. PLoS ONE 2016, 11, e0148235. [Google Scholar] [CrossRef]
- Govindji, A. Vegan Savvy: The Expert’s Guide to Nutrition on a Plant-Based Diet, 1st ed.; Pavilion: London, UK, 2020. [Google Scholar]
- Kuchta, A.; Lebiedzińska, A.; Fijałkowski, M.; Gałąska, R.; Kreft, E.; Totoń, M.; Czaja, K.; Kozłowska, A.; Ćwiklińska, A.; Kortas-Stempak, B.; et al. Impact of plant-based diet on lipid risk factors for atherosclerosis. Cardiol. J. 2016, 23, 141–148. [Google Scholar] [CrossRef]
- Davey, G.K.; Spencer, E.A.; Appleby, P.N.; Allen, N.E.; Knox, K.H.; Key, T.J. EPIC–Oxford:lifestyle characteristics and nutrient intakes in a cohort of 33 883 meat-eaters and 31 546 non meat-eaters in the UK. Public Health Nutr. 2003, 6, 259–268. [Google Scholar] [CrossRef]
- Shim, J.-S.; Oh, K.; Kim, H.C. Dietary assessment methods in epidemiologic studies. Epidemiol. Health 2014, 36, e2014009. [Google Scholar] [CrossRef]
- Pawlak, R.; Berger, J.; Hines, I. Iron Status of Vegetarian Adults: A Review of Literature. Am. J. Lifestyle Med. 2018, 12, 486. [Google Scholar] [CrossRef]
- Lederer, A.K.; Hannibal, L.; Hettich, M.; Behringer, S.; Spiekerkoetter, U.; Steinborn, C.; Gründemann, C.; Zimmermann-Klemd, A.M.; Müller, A.; Simmet, T.; et al. Vitamin B12 Status Upon Short-Term Intervention with a Vegan Diet—A Randomized Controlled Trial in Healthy Participants. Nutrients 2019, 11, 2815. [Google Scholar] [CrossRef]
- Bailey, R.L.; Dodd, K.W.; Gahche, J.J.; Dwyer, J.T.; Cowan, A.E.; Jun, S.; Eicher-Miller, H.A.; Guenther, P.M.; Bhadra, A.; Thomas, P.R.; et al. Best Practices for Dietary Supplement Assessment and Estimation of Total Usual Nutrient Intakes in Population-Level Research and Monitoring. J. Nutr. 2019, 149, 181. [Google Scholar] [CrossRef]
- Ankar, A.; Bhimji, S.S. Vitamin B12 Deficiency; StatPearls: Treasure Island, FL, USA, 2022. [Google Scholar]
- WHO; UNICEF; ICCICC. Assessment of Iodine Deficiency Disorders and Monitoring their Elimination: A Guide for Programme Managers; WHO: Geneva, Switzerland, 2007. [Google Scholar]
- The Department of Health. Dietary Reference Values A Guide; The Department of Health: London, UK, 1991. [Google Scholar]
- EFSA. Scientific Opinion on Dietary Reference Values for iodine. EFSA J. 2014, 12, 3660. [Google Scholar] [CrossRef]
- Public Health England. SACN Statement on Iodine and Health; Public Health England: London, UK, 2014. [Google Scholar]
- Thomas, E.; Nicol, K.; Bath, S. Iodine fortification of plant-based dairy- and fish-alternative products available in UK supermarkets. Proc. Nutr. Soc. 2022, 81, E29. [Google Scholar] [CrossRef]
- Rosenfeld, D.L.; Burrow, A.L. Vegetarian on purpose: Understanding the motivations of plant-based dieters. Appetite 2017, 116, 456–463. [Google Scholar] [CrossRef]
- Miki, A.J.; Livingston, K.A.; Karlsen, M.C.; Folta, S.C.; McKeown, N.M. Using Evidence Mapping to Examine Motivations for Following Plant-Based Diets. Curr. Dev. Nutr. 2020, 4, nzaa013. [Google Scholar] [CrossRef]
- Medawar, E.; Huhn, S.; Villringer, A.; Veronica Witte, A. The effects of plant-based diets on the body and the brain: A systematic review. Transl. Psychiatry 2019, 9, 226. [Google Scholar] [CrossRef]
- DEMOS; Food Standards Agency. Food in a Pandemic; Food Standards Agency: London, UK, 2021. [Google Scholar]
- Díaz-Zavala, R.G.; Castro-Cantú, M.F.; Valencia, M.E.; Álvarez-Hernández, G.; Haby, M.M.; Esparza-Romero, J. Effect of the Holiday Season on Weight Gain: A Narrative Review. J. Obes. 2017, 2017, 2085136. [Google Scholar] [CrossRef] [PubMed]


| 2019 | 2020 | |||||||
|---|---|---|---|---|---|---|---|---|
| Vegan (VV) (n24) | Vegetarian- Vegan (VegV) (n14) | Omnivore (OO) (n21) | Omnivore-Vegan (OV) (n22) | Vegan (VV) (n45) | Vegetarian- Vegan (VegV) (n6) | Omnivore (OO) (n6) | Omnivore-Vegan (OV) (n16) | |
| Sex (%) | ||||||||
| Female | 75.0 | 85.7 | 76.2 | 81.8 | 73.3 | 100.0 | 83.3 | 75.0 |
| Age (Years), Mean (SD) | 31.2 (10.4) | 35.2 (11.6) | 30.10 (9.5) | 39.1 (13.8) | 26.7 (8.4) | 23.3 (3.2) | 24.8 (2.0) | 34.7 (15.3) |
| Highest education level (%) | ||||||||
| Secondary (GCSE equivalent) | 0.0 | 7.1 | 0.0 | 9.1 | 2.2 | 0.0 | 0.0 | 0.0 |
| College (A-level equivalent) | 16.7 | 21.4 | 9.5 | 0.0 | 31.1 | 33.3 | 16.7 | 6.2 |
| Undergraduate degree | 62.5 | 35.7 | 42.9 | 59.1 | 46.7 | 50.0 | 50.0 | 31.2 |
| Postgraduate degree (MSc, PhD) | 8.3 | 35.7 | 42.8 | 27.2 | 20.0 | 16.7 | 33.3 | 37.5 |
| Other | 12.5 | 0.0 | 4.8 | 4.5 | 0.0 | 0.0 | 0.0 | 6.2 |
| Employment status (%) | ||||||||
| Employed | 50.0 | 92.9 | 33.3 | 59.1 | 53.4 | 33.3 | 33.3 | 62.4 |
| Furloughed | - | - | - | - | 4.4 | 0.0 | 0.0 | 0.0 |
| Student | 25.0 | 0.0 | 38.1 | 18.2 | 28.9 | 16.7 | 66.7 | 25.0 |
| Employed student | 16.7 | 7.1 | 28.6 | 22.7 | 13.3 | 33.3 | 0.0 | 12.5 |
| Unemployed | 8.3 | 0.0 | 0.0 | 0.0 | 0.0 | 0.0 | 0.0 | 0.0 |
| Nationality (%) | ||||||||
| United Kingdom | 95.8 | 92.9 | 85.7 | 81.9 | - | - | - | - |
| Europe | 0.0 | 0.0 | 4.8 | 9.0 | - | - | - | - |
| East and Southeast Asia | 4.2 | 0.0 | 4.8 | 9.0 | - | - | - | - |
| United States | 0.0 | 7.1 | 4.8 | 0.0 | - | - | - | - |
| Mexico | 0.0 | 0.0 | 0.0 | 0.0 | - | - | - | - |
| Oceania | 0.0 | 0.0 | 0.0 | 0.0 | - | - | - | - |
| Ethnicity (%) | ||||||||
| Caucasian—British/Irish | - | - | - | - | 86.7 | 100.0 | 100.0 | 87.5 |
| Caucasian—Other | - | - | - | - | 11.1 | 0.0 | 0.0 | 6.2 |
| Other | - | - | - | - | 2.2 | 0.0 | 0.0 | 6.2 |
| Weight status (BMI) (SD) | 22.6 (3.4) | 24.1 (7.5) | 23.6 (4.3) | 26.2 (6.9) | 23.8 (4.8) | 23.4 (2.0) | 21.3 (2.5) | 23.6 (3.3) |
| Minutes per Week of Moderate Physical Activity | ||||||||
| <30 | 4.2 | 14.3 | 15.0 | 18.2 | 2.2 | 0.0 | 0.0 | 6.2 |
| 30–90 | 20.8 | 7.1 | 5.0 | 27.3 | 31.1 | 33.3 | 16.7 | 37.5 |
| 90–150 | 12.5 | 14.3 | 30.0 | 27.3 | 20.0 | 0.0 | 16.7 | 31.2 |
| 150–300 | 25.0 | 35.7 | 30.0 | 13.6 | 31.1 | 16.7 | 50.0 | 18.8 |
| >300 | 37.5 | 28.6 | 20.0 | 13.6 | 15.6 | 50.0 | 16.7 | 6.2 |
| Smoking status (%) | ||||||||
| Non-smoker | 70.8 | 64.3 | 95.2 | 54.5 | 80.0 | 100.0 | 83.3 | 68.8 |
| Smoker | 8.3 | 28.6 | 0.0 | 22.7 | 6.7 | 0.0 | 0.0 | 6.2 |
| Vaper | - | - | - | - | 4.4 | 0.0 | 0.0 | 6.2 |
| Ex-smoker | 20.8 | 7.1 | 0.0 | 22.7 | 8.9 | 0.0 | 16.7 | 18.8 |
| Did not disclose | 0.0 | 0.0 | 4.8 | 0.0 | 0.0 | 0.0 | 0.0 | 0.0 |
| Weekly alcohol consumption (%) | ||||||||
| None | 12.5 | 0.0 | 14.3 | 22.7 | 33.3 | 33.3 | 50.0 | 18.8 |
| <5 Units | 41.7 | 42.9 | 38.1 | 31.8 | 37.8 | 66.7 | 33.3 | 18.8 |
| 5–10 units | 29.2 | 28.6 | 23.8 | 13.6 | 13.3 | 0.0 | 16.7 | 31.2 |
| 10–15 units | 12.5 | 21.4 | 19.0 | 22.7 | 11.1 | 0.0 | 0.0 | 18.8 |
| 15+ | 0.0 | 7.1 | 0.0 | 9.1 | 4.4 | 0.0 | 0.0 | 12.5 |
| Prefer not to disclose | 4.2 | 0.0 | 4.8 | 0.0 | 0.0 | 0.0 | 0.0 | 0.0 |
| Frequent salt usage (%) | ||||||||
| No | 50.0 | 38.5 | 33.3 | 47.6 | 26.7 | 83.3 | 66.7 | 18.8 |
| Yes, table salt | 33.3 | 46.2 | 33.3 | 42.9 | 44.4 | 16.7 | 33.3 | 43.8 |
| Yes, iodized salt | 0.0 | 0.0 | 14.3 | 4.8 | 6.7 | 0.0 | 0.0 | 6.2 |
| Yes, other salt | 16.7 | 15.4 | 19.0 | 4.8 | 22.2 | 0.0 | 0.0 | 31.2 |
| Length of diet (%) | ||||||||
| 0–3 Months | 16.7 | 14.3 | 9.5 | 9.1 | 2.2 | 0.0 | 0.0 | 0.0 |
| 3–6 Months | 16.7 | 0.0 | 0.0 | 4.5 | 0.0 | 0.0 | 0.0 | 6.2 |
| 6–12 Months | 12.5 | 7.1 | 4.8 | 22.7 | 22.2 | 16.7 | 0.0 | 12.5 |
| 12+ Months | 41.7 | 57.1 | 9.5 | 9.1 | 37.8 | 50.0 | 0.0 | 31.2 |
| 5+ Years | 12.5 | 21.4 | 76.2 | 54.5 | 37.8 | 33.3 | 0.0 | 12.5 |
| Prefer not to disclose | - | - | - | - | 0.0 | 0.0 | 100.0 | 37.5 |
| Dietary intolerance (%) | ||||||||
| None | 87.5 | 85.7 | 90.5 | 86.4 | 68.9 | 50.0 | 83.3 | 100.0 |
| Yes, not professionally diagnosed | 12.5 | 7.1 | 0.0 | 13.6 | 20.0 | 33.3 | 0.0 | 0.0 |
| Yes, professionally diagnosed | 0.0 | 7.1 | 9.5 | 0.0 | 11.1 | 16.7 | 16.7 | 0.0 |
| Baseline (Mean) | End (Mean) | SED(a) | df(a) | SED(b) | df(b) | p-Value (Baseline-to-End) | |||||||||
|---|---|---|---|---|---|---|---|---|---|---|---|---|---|---|---|
| Vegan (VV) (n12) | Vegetarian-Vegan (VegV) (n10) | Omnivore (OO) (n12) | Omnivore-Vegan (OV) (n12) | Vegan (VV) (n12) | Vegetarian-Vegan (VegV) (n10) | Omnivore (OO) (n12) | Omnivore-Vegan (OV) (n12) | Time × Diet | Time × Diet | Time | Diet | Time × Diet | |||
| Energy (kcal) | 1275.9 | 1645.4 | 1656.3 | 1720.3 | 1073.2 | 1516.4 | 1514.7 | 1422.7 | 149.5 | 42.0 | 220.2 | 65.0 | 0.010 * | 0.083 | 0.840 |
| Protein (g) | 50.4 | 56.1 | 76.3 | 72.5 | 37.4 | 56.8 | 69.4 | 47.0 | 7.3 | 42.0 | 9.8 | 70.0 | 0.002 * | 0.008 * | 0.087 |
| COH (g) | 158.2 | 193.7 | 183.2 | 203.6 | 141.5 | 171.5 | 162.9 | 204.3 | 17.9 | 42.0 | 25.6 | 67.0 | 0.109 | 0.109 | 0.778 |
| Fat (g) | 50.1 | 66.7 | 70.5 | 69.5 | 40.7 | 65.3 | 63.6 | 48.3 | 7.2 | 42.0 | 10.5 | 65.0 | 0.006 * | 0.071 | 0.253 |
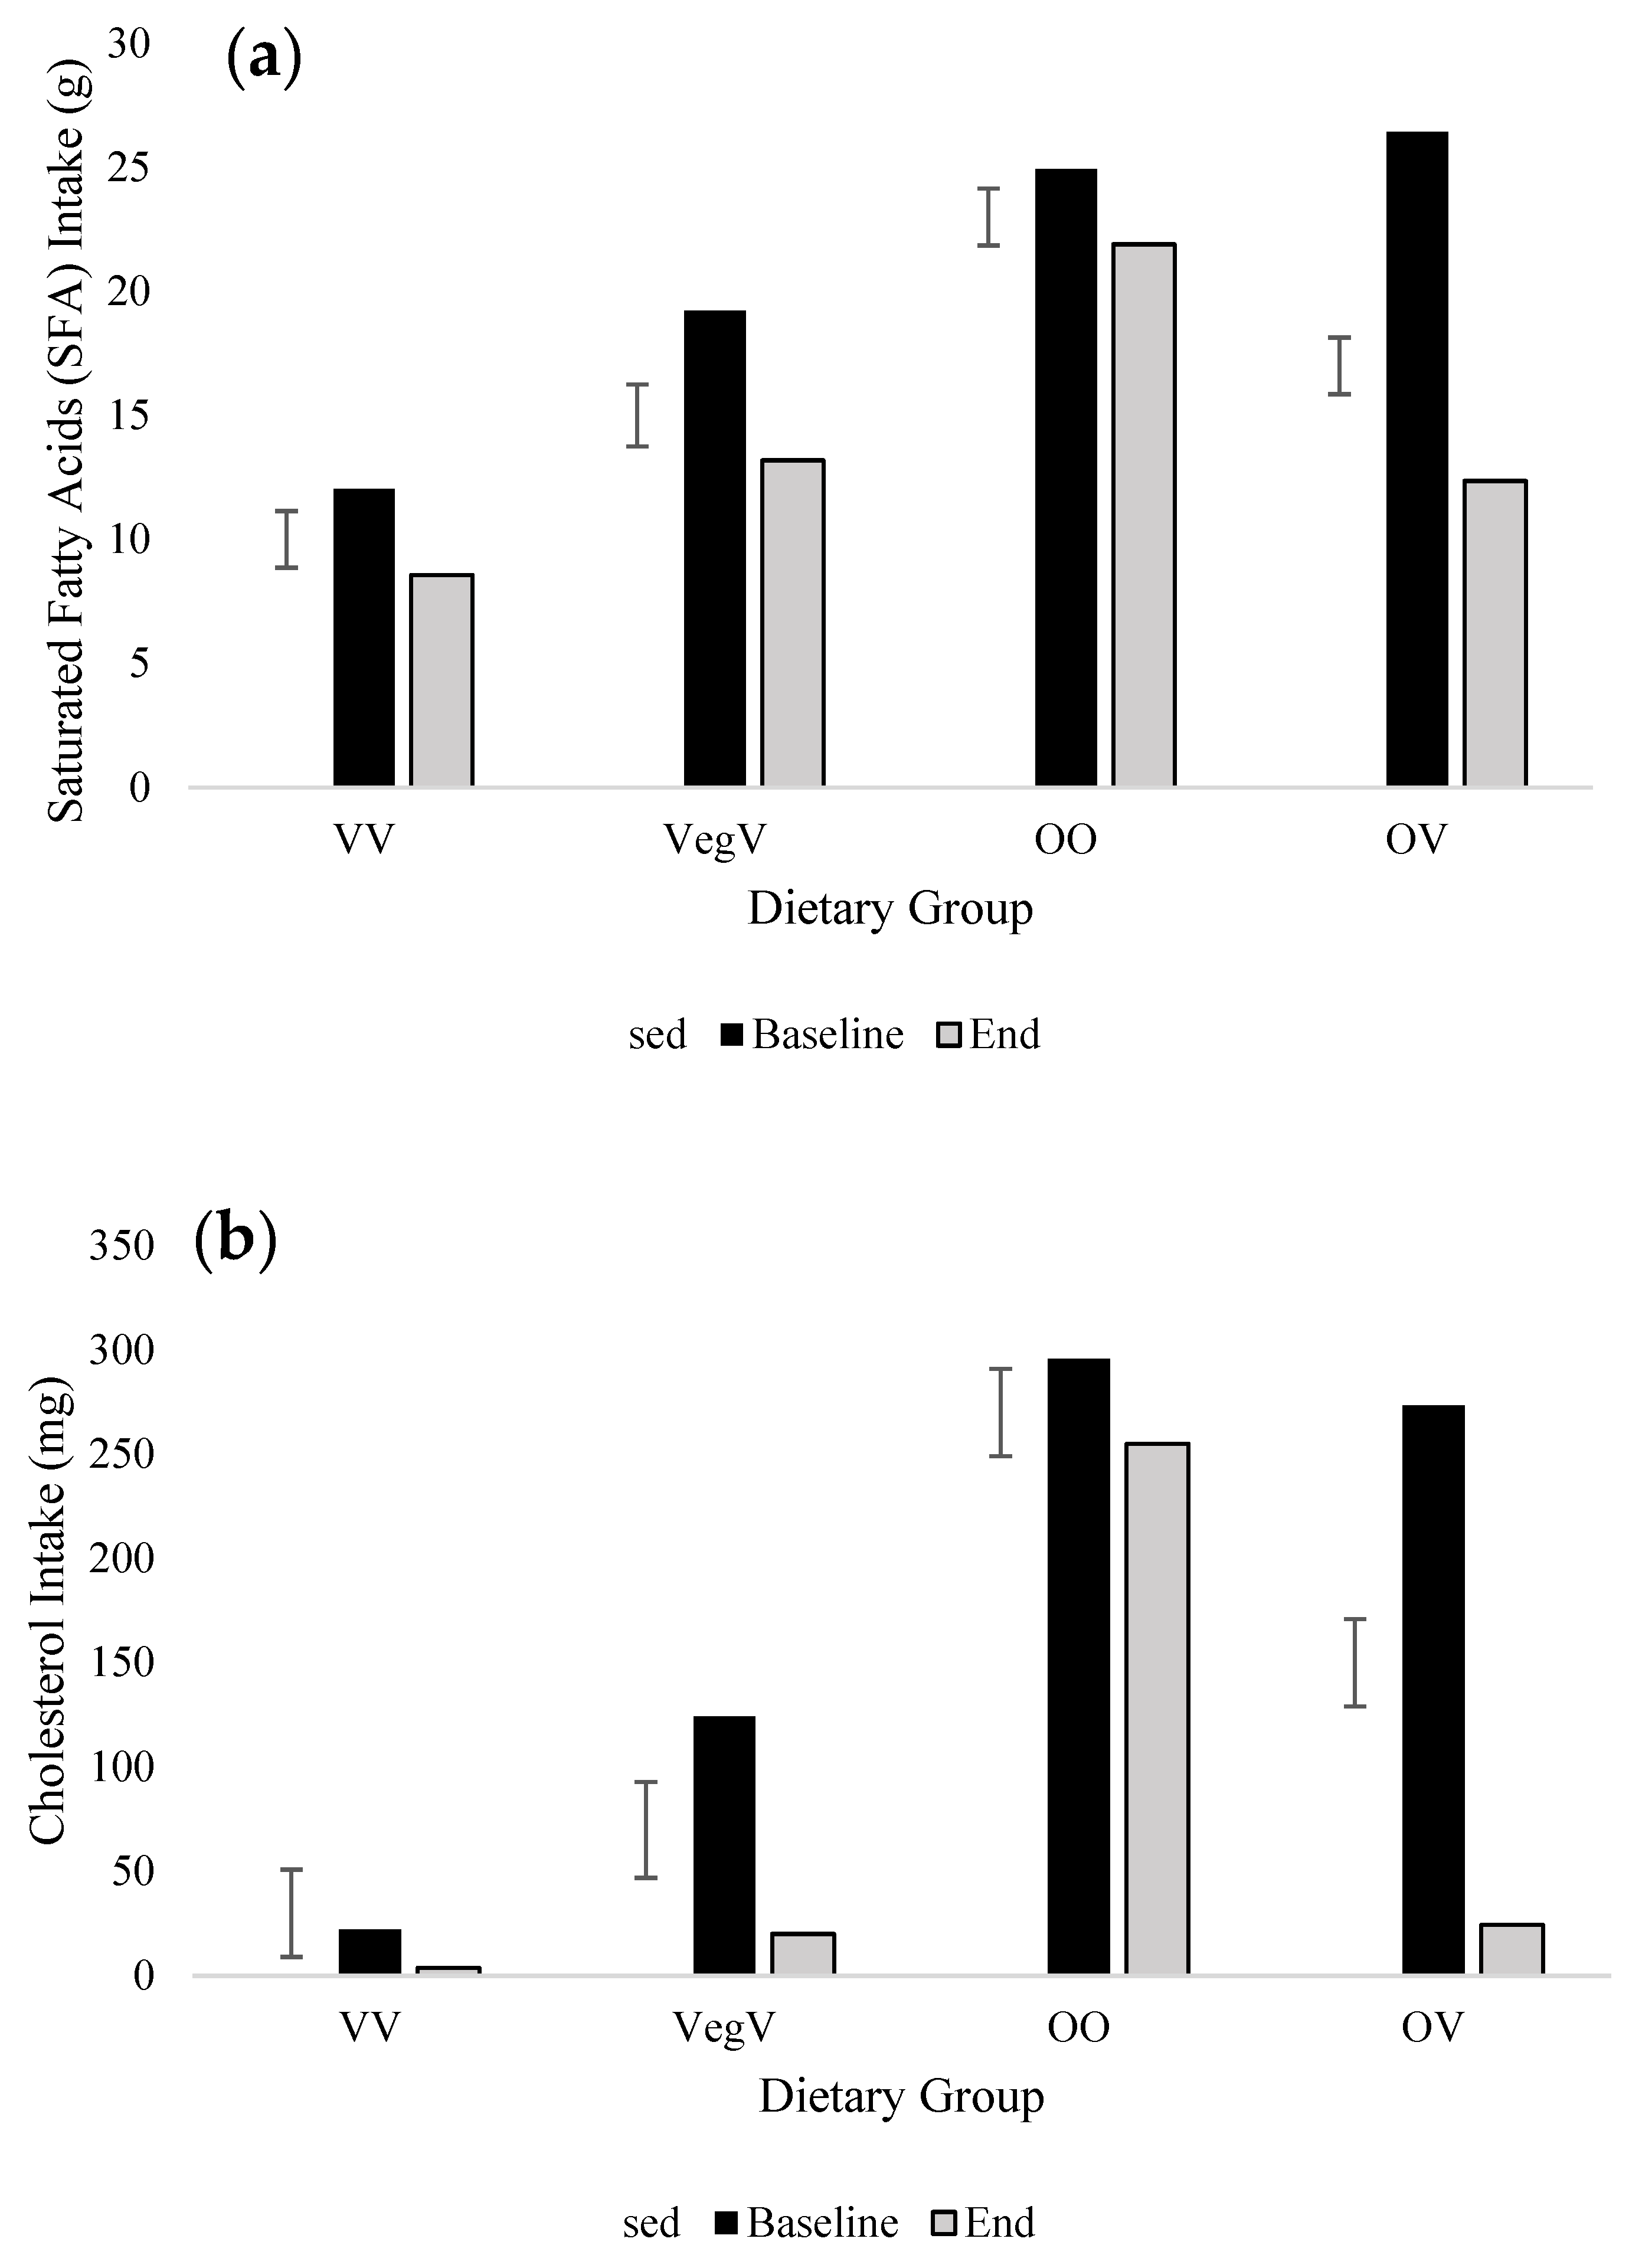
| SFA (g) | 12.0 | 19.2 | 24.9 | 26.4 | 8.6 | 13.2 | 21.9 | 12.4 | 2.4 | 42.0 | 3.3 | 70.0 | <0.001 * | <0.001 * | 0.005 * |
| MUFA (g) | 17.8 | 22.6 | 26.9 | 25.3 | 16.2 | 23.8 | 24.4 | 17.3 | 2.7 | 42.0 | 3.9 | 65.0 | 0.032 * | 0.071 | 0.112 |
| PUFA (g) | 12.6 | 14.4 | 11.8 | 11.0 | 10.3 | 14.7 | 11.0 | 10.6 | 1.6 | 42.0 | 2.5 | 68.0 | 0.274 | 0.242 | 0.696 |
| Cholesterol (mg) | 22.1 | 124.1 | 295.5 | 273.3 | 3.8 | 20.0 | 254.9 | 24.5 | 44.0 | 42.0 | 47.2 | 83.0 | <0.001 * | <0.001 * | 0.001 * |
| Sugar (g) | 59.0 | 77.4 | 83.2 | 94.3 | 58.3 | 69.0 | 77.8 | 85.2 | 10.2 | 42.0 | 15.4 | 64.0 | 0.254 | 0.124 | 0.928 |
| Fibre (g) | 20.9 | 20.3 | 16.2 | 17.9 | 18.2 | 25.0 | 14.6 | 21.1 | 2.2 | 42.0 | 3.0 | 71.0 | 0.486 | 0.044 * | 0.059 |
| Baseline (Mean) | End (Mean) | SED(a) | df(a) | SED(b) | df(b) | p-Value (Baseline-to-End) | |||||||||
|---|---|---|---|---|---|---|---|---|---|---|---|---|---|---|---|
| Vegan (VV) (n12) | Vegetarian-Vegan (VegV) (n10) | Omnivore (OO) (n12) | Omnivore-Vegan (OV) (n12) | Vegan (VV) (n12) | Vegetarian-Vegan (VegV) (n10) | Omnivore (OO) (n12) | Omnivore-Vegan (OV) (n12) | Time × Diet | Time × Diet | Time | Diet | Time × Diet | |||
| Vitamin A (μg) | 918.5 | 952.4 | 1147.0 | 1193.1 | 649.1 | 1122.3 | 906.3 | 839.8 | 201.0 | 42.0 | 285.5 | 67.0 | 0.061 | 0.670 | 0.287 |
| Vitamin C (mg) | 111.3 | 103.6 | 113.0 | 99.3 | 105.2 | 140.4 | 97.9 | 107.0 | 19.3 | 42.0 | 23.8 | 75.0 | 0.639 | 0.780 | 0.270 |
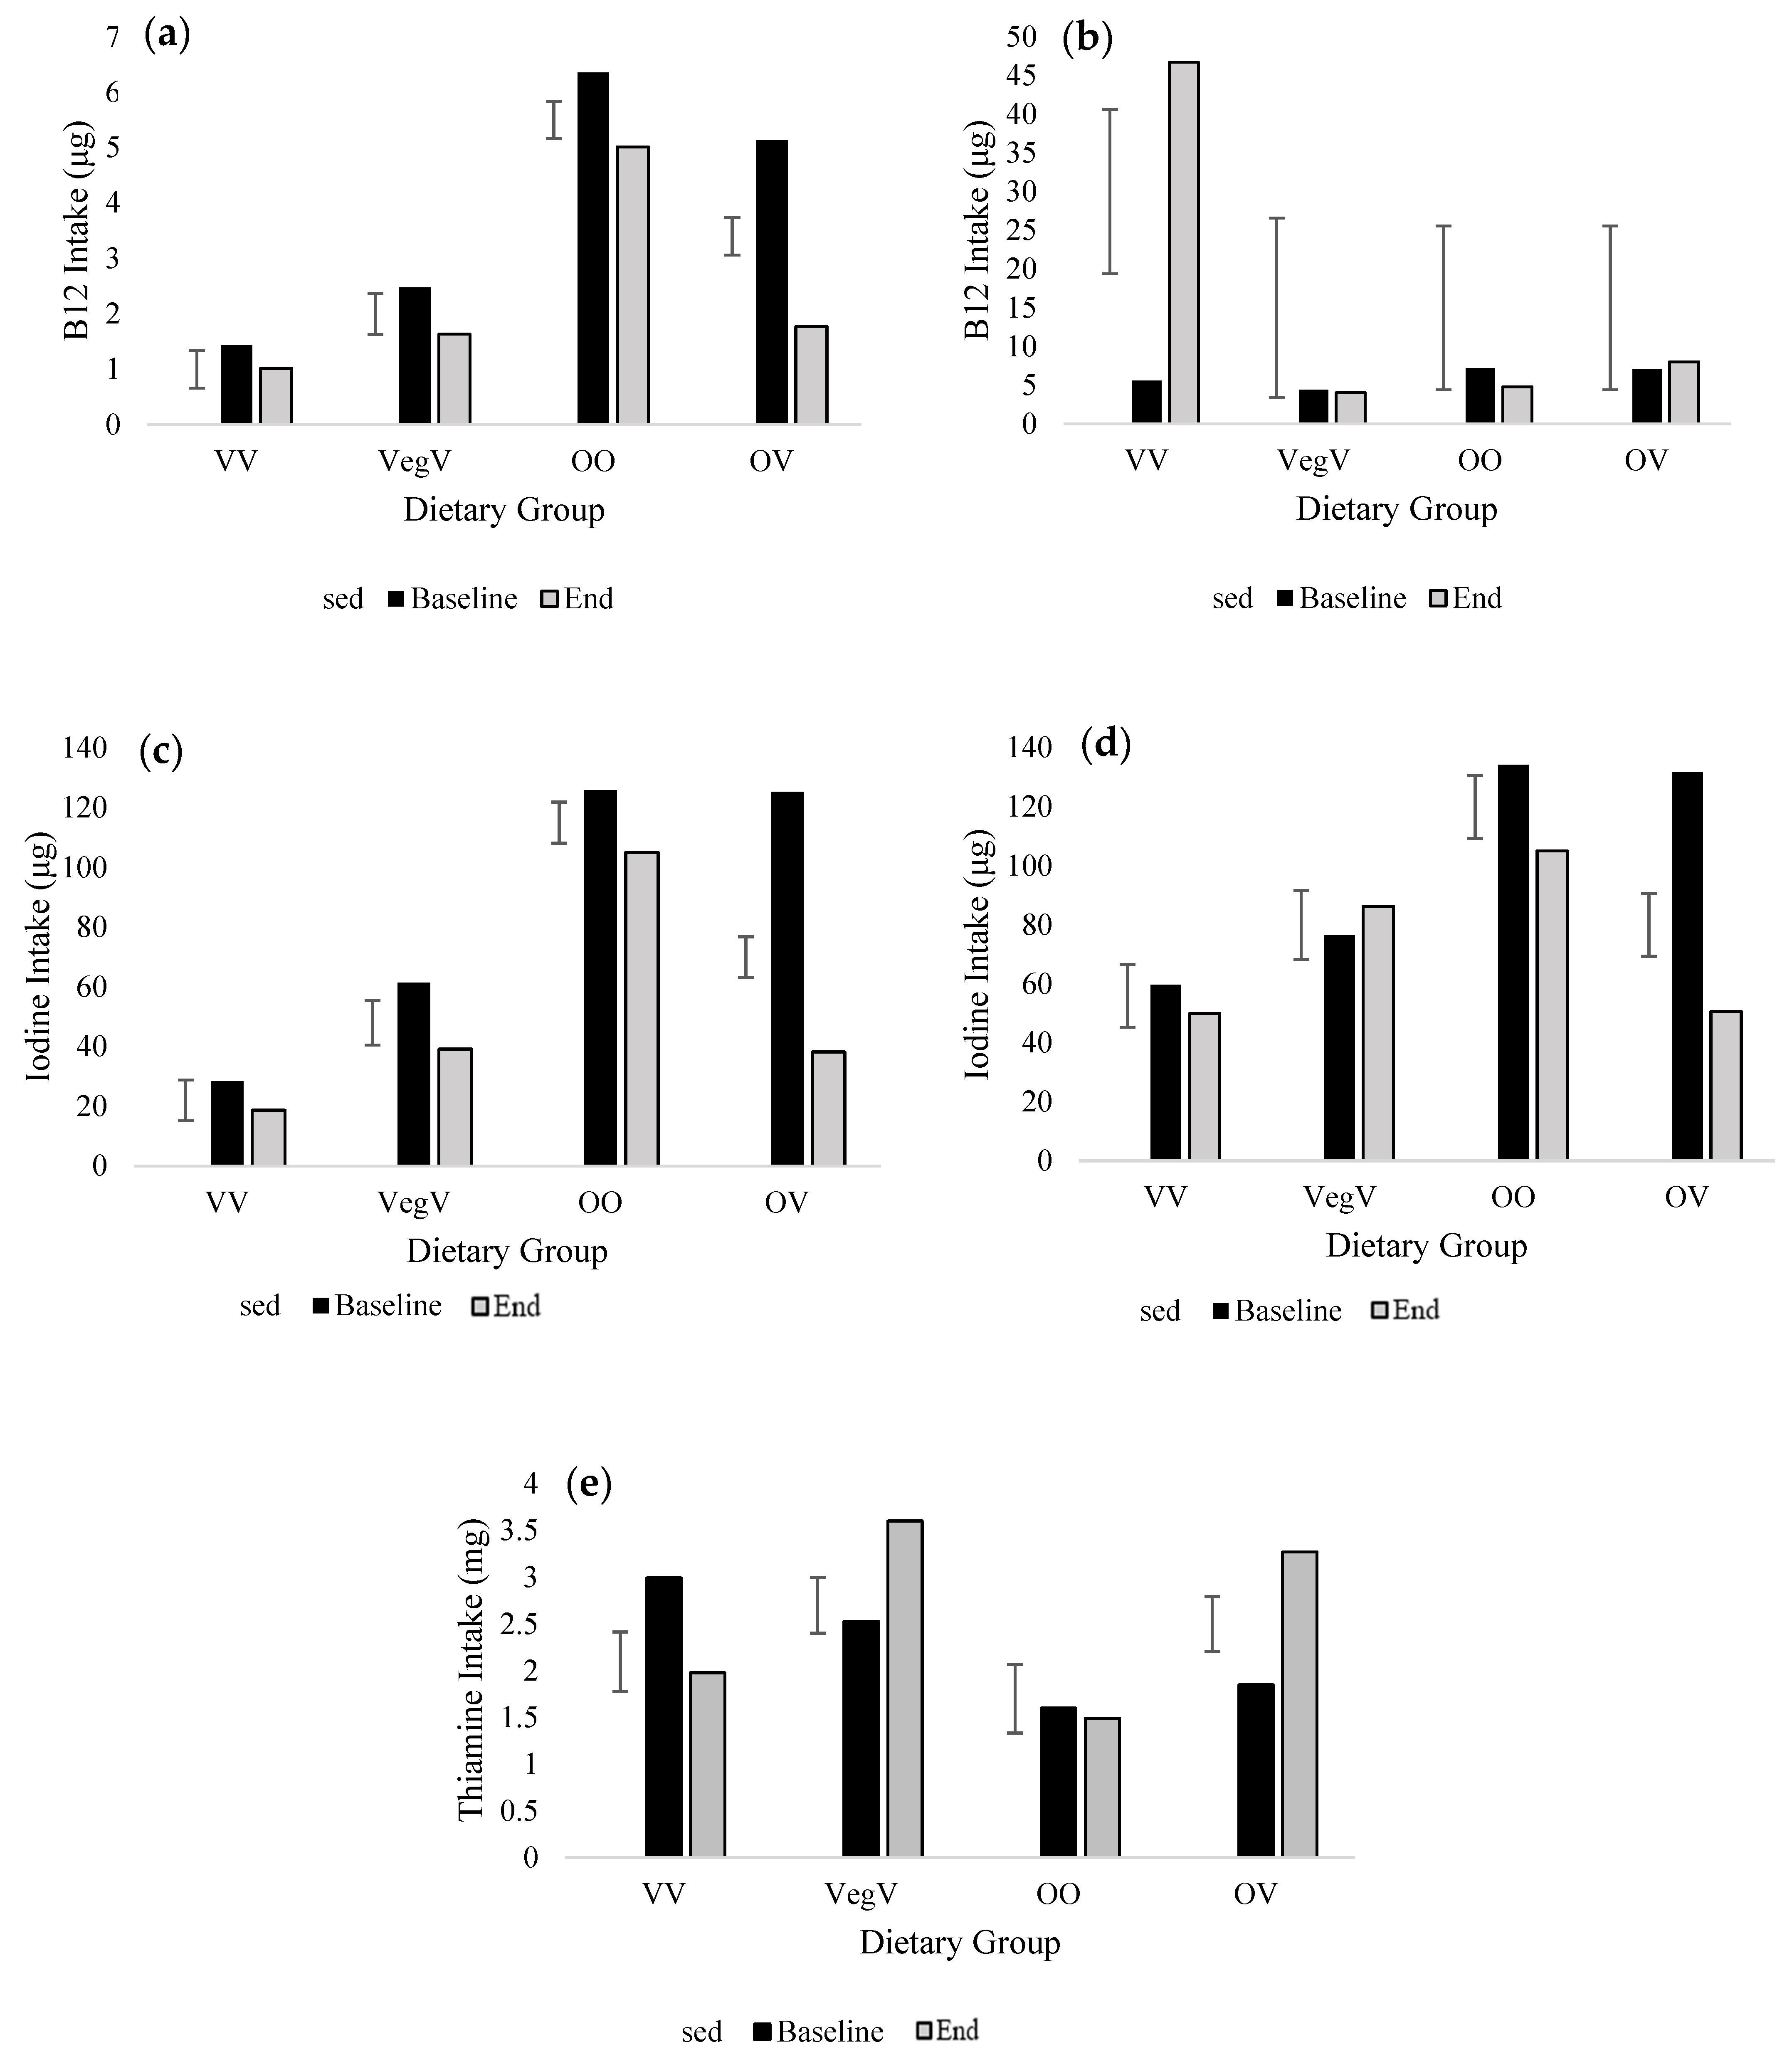
| Thiamine (mg) | 3.0 | 2.5 | 1.6 | 1.9 | 2.0 | 3.6 | 1.5 | 3.3 | 0.6 | 42.0 | 0.8 | 70.0 | 0.291 | 0.176 | 0.020 * |
| Riboflavin (mg) | 1.1 | 1.5 | 1.7 | 1.6 | 1.0 | 1.5 | 1.4 | 1.3 | 0.2 | 42.0 | 0.3 | 60.0 | 0.021 * | 0.221 | 0.730 |
| Niacin (mg) | 13.8 | 14.8 | 18.7 | 17.2 | 11.4 | 16.1 | 17.8 | 14.2 | 2.1 | 42.0 | 2.6 | 76.0 | 0.196 | 0.062 | 0.499 |
| Vitamin B6 (mg) | 1.6 | 1.7 | 2.0 | 2.0 | 1.4 | 1.8 | 1.8 | 1.7 | 0.2 | 42.0 | 0.3 | 70.0 | 0.203 | 0.270 | 0.588 |
| Vitamin B12 (μg) | 1.4 | 2.5 | 6.4 | 5.1 | 1.0 | 1.6 | 5.0 | 1.8 | 0.7 | 42.0 | 1.0 | 70.0 | <0.001 * | <0.001 * | 0.020 * |
| Folate (μg) | 281.0 | 299.8 | 265.6 | 273.0 | 239.3 | 360.0 | 232.0 | 264.3 | 38.6 | 42.0 | 49.8 | 72.0 | 0.642 | 0.238 | 0.257 |
| Calcium (mg) | 651.3 | 825.1 | 852.6 | 879.7 | 535.9 | 802.7 | 657.2 | 609.8 | 99.9 | 42.0 | 151.0 | 64.0 | 0.003 * | 0.387 | 0.344 |
| Iron (mg) | 10.6 | 11.3 | 9.9 | 10.7 | 9.0 | 12.0 | 9.2 | 10.1 | 1.1 | 42.0 | 1.6 | 66.0 | 0.287 | 0.448 | 0.580 |
| Magnesium (mg) | 307.8 | 323.4 | 276.7 | 314.3 | 267.2 | 359.1 | 253.4 | 309.9 | 31.3 | 42.0 | 47.8 | 63.0 | 0.513 | 0.320 | 0.368 |
| Potassium (mg) | 2680.3 | 3021.5 | 3043.6 | 3392.8 | 2386.1 | 3329.0 | 2709.2 | 2956.7 | 323.1 | 42.0 | 461.2 | 67.0 | 0.187 | 0.309 | 0.384 |
| Sodium (mg) | 1799.0 | 2173.3 | 2112.0 | 2193.2 | 1407.9 | 2146.9 | 1987.5 | 1853.5 | 193.3 | 42.0 | 337.0 | 58.0 | 0.019 * | 0.277 | 0.490 |
| Zinc (mg) | 7.7 | 7.2 | 8.7 | 8.6 | 5.5 | 8.3 | 7.8 | 7.0 | 0.9 | 42.0 | 1.2 | 65.7 | 0.022 * | 0.287 | 0.238 |
| Selenium (μg) | 35.6 | 41.3 | 56.0 | 52.0 | 25.3 | 34.0 | 49.4 | 29.9 | 4.7 | 42.0 | 6.8 | 66.0 | <0.001 * | 0.003 * | 0.070 |
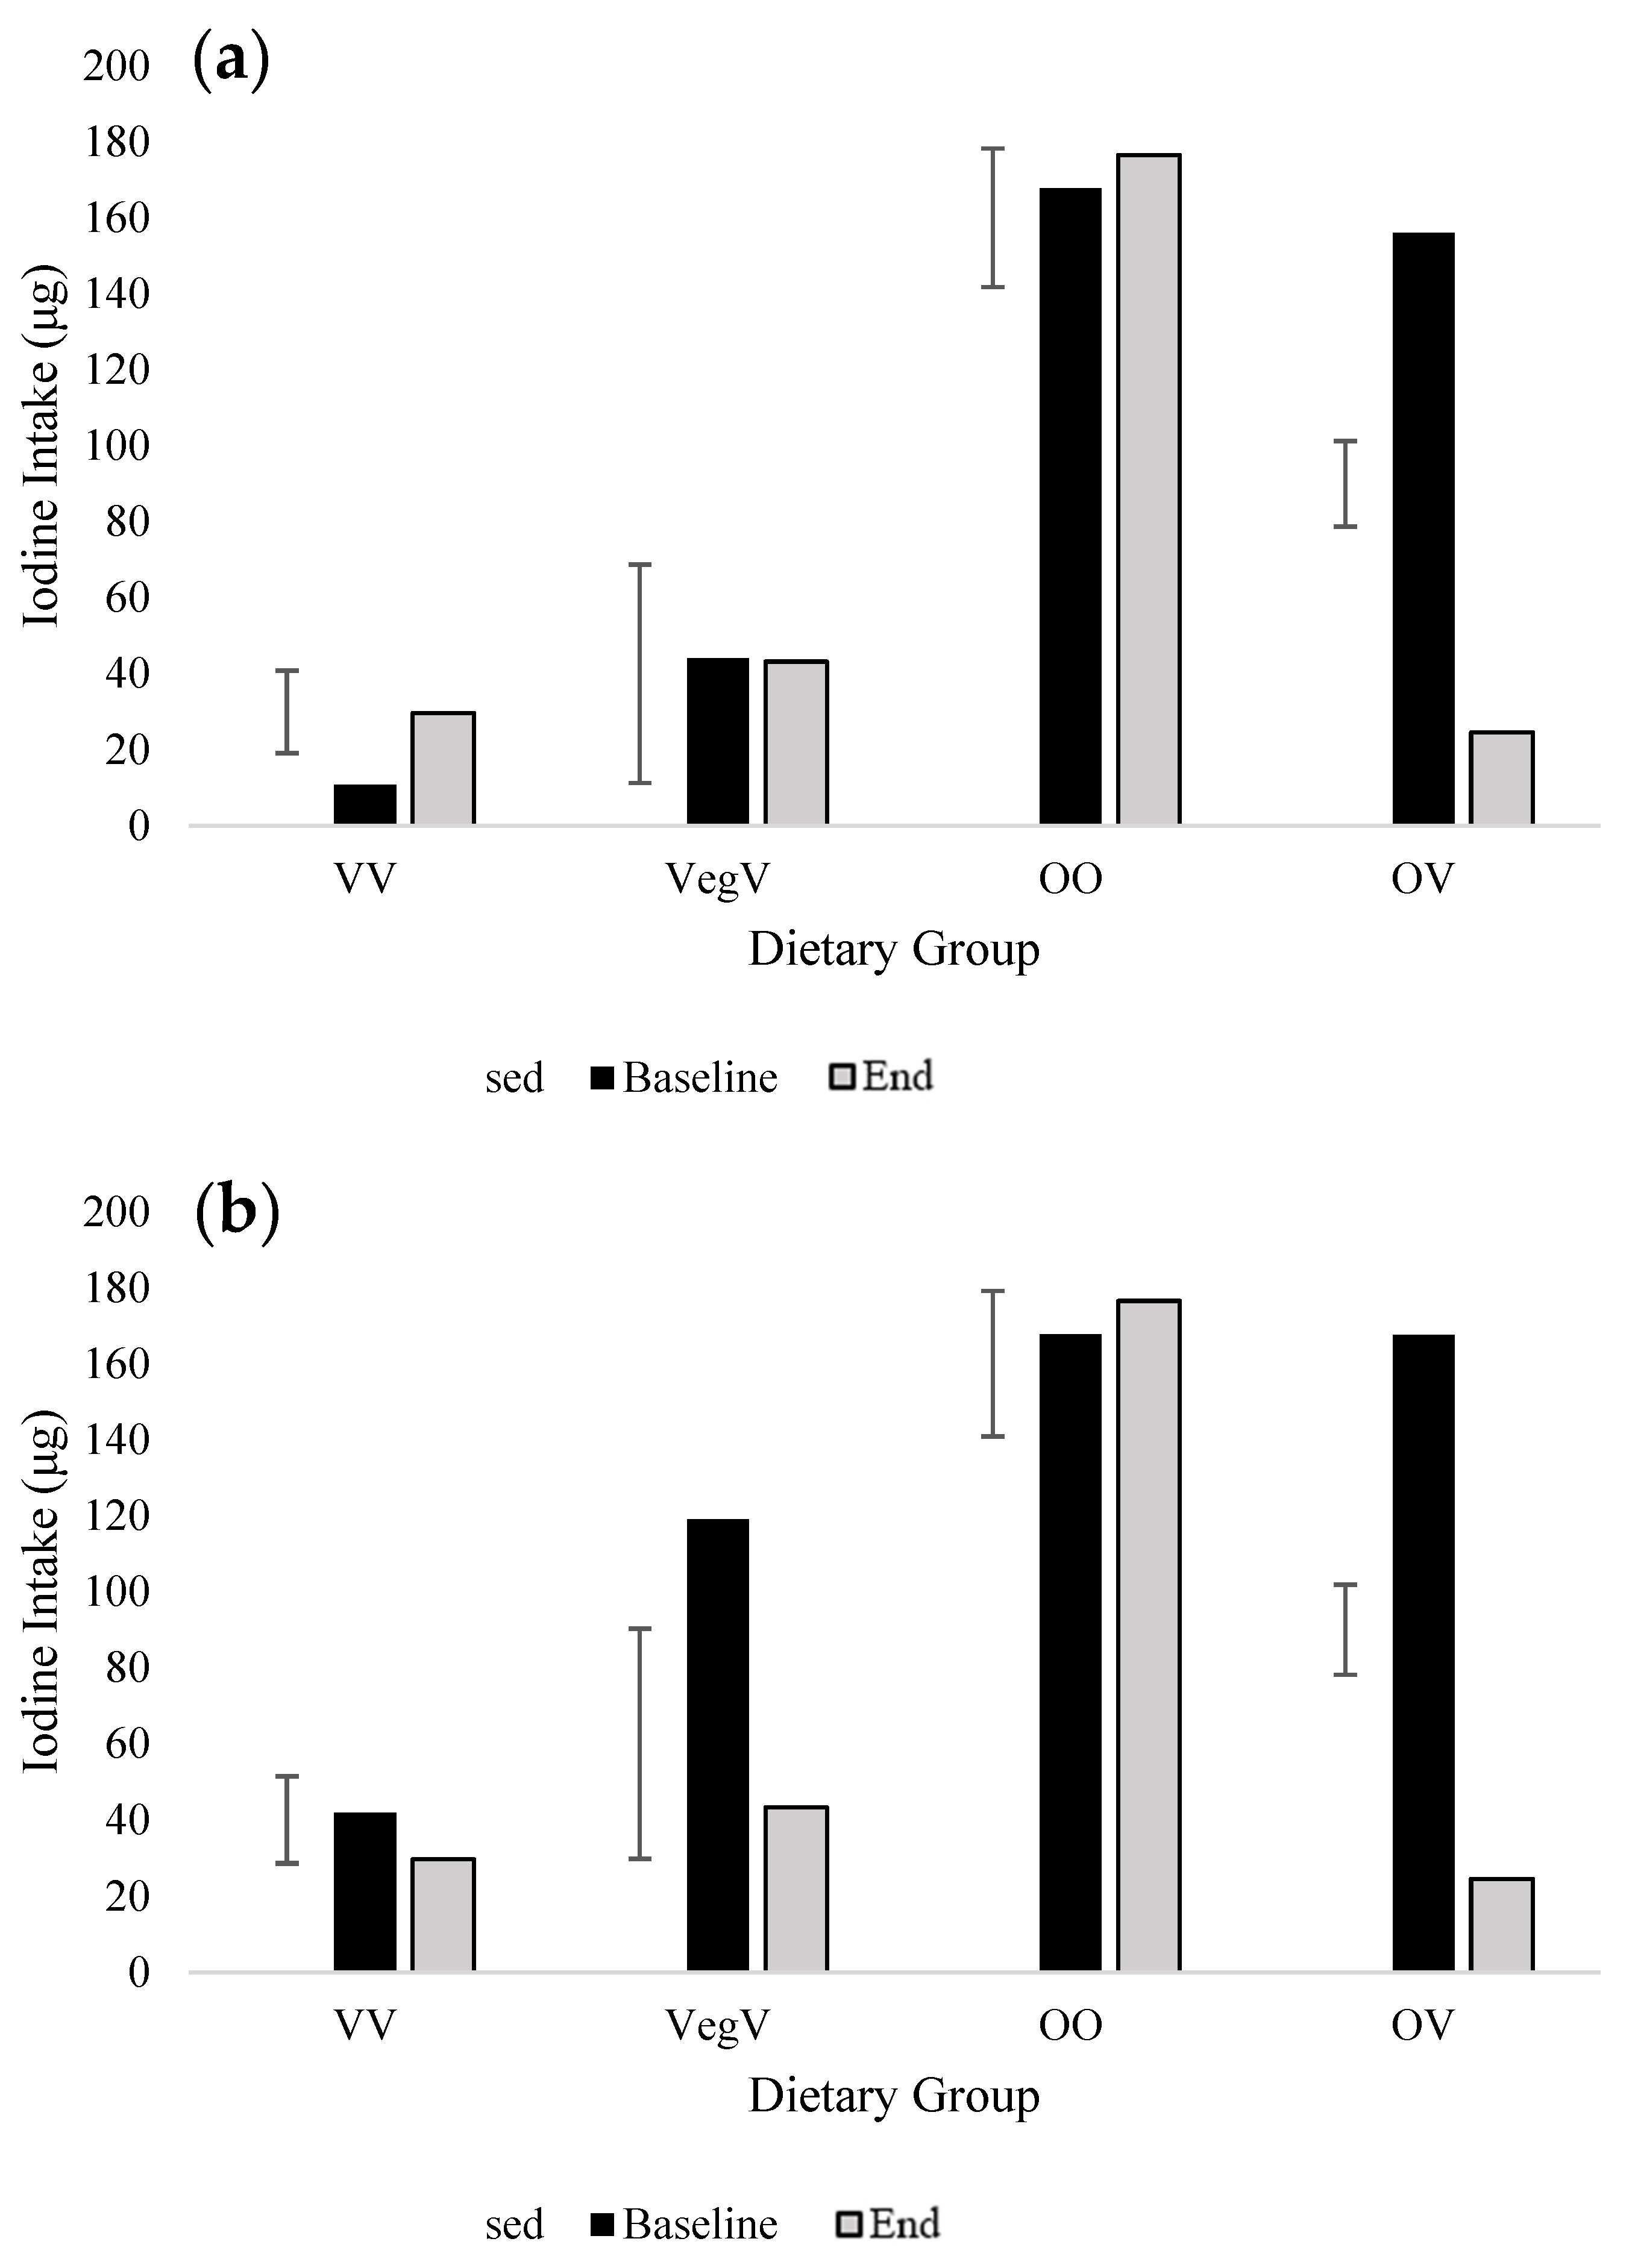
| Iodine (μg) | 28.3 | 61.4 | 125.7 | 125.2 | 18.7 | 39.2 | 105.1 | 38.2 | 14.3 | 42.0 | 18.0 | 74.0 | <0.001 * | <0.001 * | <0.001 * |
| Vitamin D (μg) | 1.8 | 2.4 | 3.5 | 2.7 | 1.6 | 1.5 | 2.7 | 1.7 | 0.4 | 42.0 | 0.7 | 56.0 | <0.001 * | 0.135 | 0.423 |
| Baseline (Mean) | End (Mean) | SED(a) | df(a) | SED(b) | df(b) | p-Value (Baseline-to-End) | |||||||||
|---|---|---|---|---|---|---|---|---|---|---|---|---|---|---|---|
| Vegan (VV) (n14) | Vegetarian-Vegan (VegV) (n2) | Omnivore (OO) (n5) | Omnivore-Vegan (OV) (n13) | Vegan (VV) (n14) | Vegetarian-Vegan (VegV) (n2) | Omnivore (OO) (n5) | Omnivore-Vegan (OV) (n13) | Time × Diet | Time × Diet | Time | Diet | Time × Diet | |||
| Iodine (μg) | 10.8 | 44.1 | 167.7 | 156.0 | 29.6 | 43.2 | 176.5 | 24.6 | 44.95 | 30.0 | 45.0 | 60.0 | 0.006 * | <0.001 * | <0.001 * |
| Foods Contributing to Iodine Intake from FFQ Output (μg day−1) | |||||||||||||||
| Cow’s Milk (total) | - | 5.4 | 38.7 | 30.6 | - | 0.0 | 51.9 | 0.4 | 14.9 | 12.2 | 19.6 | 33.0 | 0.040 * | 0.017 * | 0.071 |
| Alternative Milk (total) | 0.77 | 1.71 | 0.02 | 4.62 | 0.00 | 0.00 | 0.00 | 0.00 | 4.1 | 2.9 | 4.1 | 60.0 | 0.062 | 0.618 | 0.618 |
| Dairy Yogurts | - | 8.3 | 21.9 | 13.5 | - | 0.0 | 22.3 | 0.2 | 8.4 | 8.3 | 10.2 | 31.0 | 0.016 * | 0.041 * | 0.272 |
| Non-Dairy Yogurts | 2.6 | 5.3 | 0.1 | 2.8 | 2.2 | 11.2 | 1.1 | 0.8 | 3.2 | 2.4 | 3.3 | 60.0 | 0.685 | 0.050 * | 0.362 |
| Dairy Cheese | - | 3.4 | 6.3 | 4.5 | 0.0 | - | 46.3 | 0.1 | 5.5 | 4.9 | 6.0 | 32.0 | 0.009 * | <0.001 * | <0.001 * |
| Dairy-Based Puddings | - | 1.1 | 1.5 | 1.4 | - | 0.0 | 0.9 | 0.0 | 0.5 | 0.4 | 0.5 | 34.0 | <0.001 * | 0.145 | 0.336 |
| Non-Dairy Puddings | 1.8 | 2.9 | 0.1 | 5.0 | 2.2 | 4.7 | 0.1 | 1.4 | 5.0 | 0.6 | 5.0 | 60.0 | 0.482 | 0.645 | 0.675 |
| Eggs (boiled, scrambled, etc.) | - | 3.5 | 25.2 | 23.2 | - | 0.0 | 19.3 | 0.1 | 15.7 | 12.7 | 16.7 | 33.0 | 0.019* | 0.311 | 0.442 |
| Omelette | - | 1.8 | 4.1 | 2.5 | - | 0.0 | 2.2 | 0.1 | 0.8 | 0.5 | 0.8 | 34.0 | <0.001 * | <0.001 * | 0.794 |
| Egg-Based Deserts | - | 1.1 | 2.6 | 4.0 | - | 0.0 | 10.5 | 0.2 | 4.5 | 3.2 | 4.5 | 34.0 | 0.119 | 0.746 | 0.054 |
| White Fish | - | 0.0 | 10.8 | 11.0 | - | 0.0 | 10.8 | 1.3 | 3.9 | 4.3 | 5.3 | 31.0 | 0.002 * | 0.095 | 0.041 * |
| Oil-Rich Fish | - | 0.0 | 17.0 | 14.8 | - | 0.0 | 8.3 | 0.6 | 13.5 | 11.5 | 15.0 | 33.0 | 0.060 | 0.608 | 0.735 |
| Other Seafood | - | 0.0 | 0.8 | 1.0 | - | 0.0 | 0.7 | 0.1 | 0.3 | 0.4 | 0.5 | 26.0 | 0.001 * | 0.315 | 0.050 * |
| Seaweed | 2.1 | 0.0 | 0.0 | 2.3 | 16.8 | 14.7 | 14.7 | 15.8 | 2.5 | 4.2 | 4.5 | 40.0 | <0.001 * | 0.875 | 0.921 |
Disclaimer/Publisher’s Note: The statements, opinions and data contained in all publications are solely those of the individual author(s) and contributor(s) and not of MDPI and/or the editor(s). MDPI and/or the editor(s) disclaim responsibility for any injury to people or property resulting from any ideas, methods, instructions or products referred to in the content. |
© 2023 by the authors. Licensee MDPI, Basel, Switzerland. This article is an open access article distributed under the terms and conditions of the Creative Commons Attribution (CC BY) license (https://creativecommons.org/licenses/by/4.0/).
Share and Cite
Eveleigh, E.; Coneyworth, L.; Craigon, J.; Welham, S. Adoption of a Short-Term (4-Week) Vegan Diet as Part of ‘Veganuary’ Significantly Reduces Saturated Fatty Acid (SFA), Cholesterol, B12, and Iodine Intake in Omnivorous Individuals—An Observational Study. Nutrients 2023, 15, 4967. https://doi.org/10.3390/nu15234967
Eveleigh E, Coneyworth L, Craigon J, Welham S. Adoption of a Short-Term (4-Week) Vegan Diet as Part of ‘Veganuary’ Significantly Reduces Saturated Fatty Acid (SFA), Cholesterol, B12, and Iodine Intake in Omnivorous Individuals—An Observational Study. Nutrients. 2023; 15(23):4967. https://doi.org/10.3390/nu15234967
Chicago/Turabian StyleEveleigh, Elizabeth, Lisa Coneyworth, Jim Craigon, and Simon Welham. 2023. "Adoption of a Short-Term (4-Week) Vegan Diet as Part of ‘Veganuary’ Significantly Reduces Saturated Fatty Acid (SFA), Cholesterol, B12, and Iodine Intake in Omnivorous Individuals—An Observational Study" Nutrients 15, no. 23: 4967. https://doi.org/10.3390/nu15234967