
A Narrative Review on Strategies for the Reversion of Prediabetes to Normoglycemia: Food Pyramid, Physical Activity, and Self-Monitoring Innovative Glucose Devices
 , ,
, ,
Abstract
:
1. Introduction
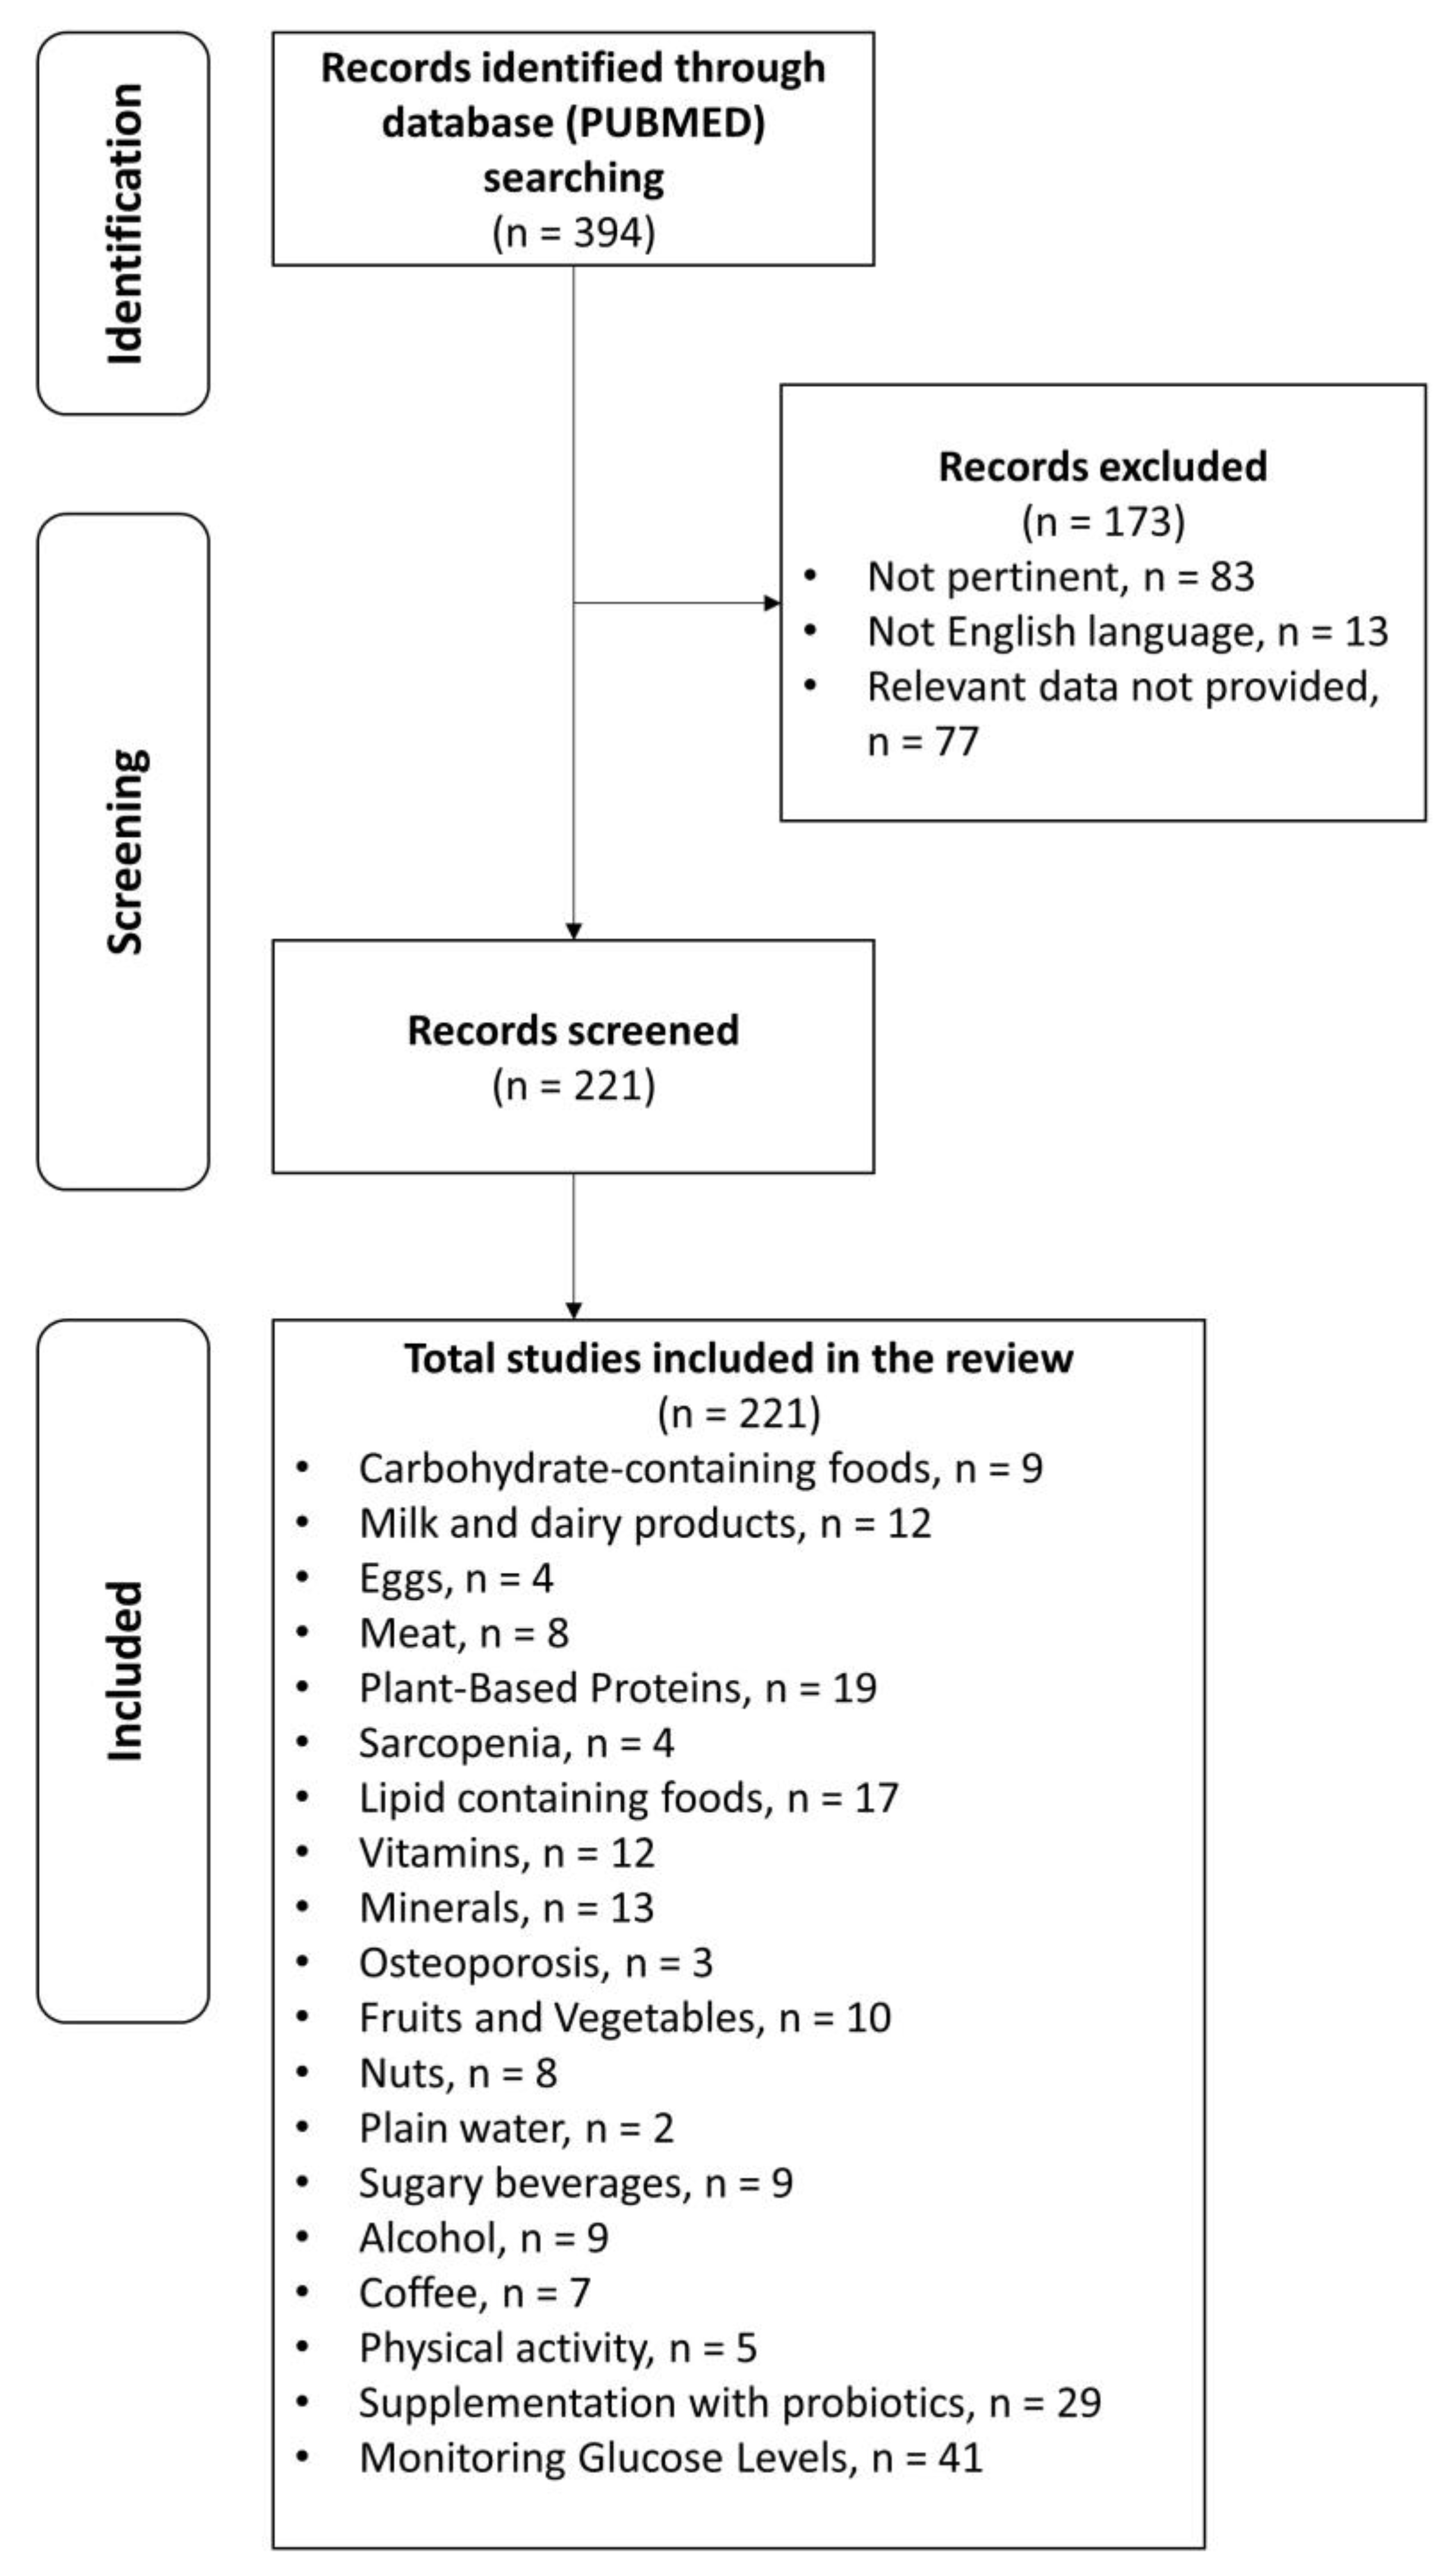
2. Materials and Methods
3. Results
3.1. Carbohydrate-Containing Food
3.2. Protein Foods
3.2.1. Milk and Dairy Products
3.2.2. Eggs
3.2.3. Meat
3.2.4. Plant Based Protein
3.3. Sarcopenia
3.4. Lipid-Containing Food
3.5. Vitamins
3.6. Minerals
3.7. Osteoporosis
3.8. Fruits and Vegetables
3.9. Nuts
3.10. Hydratation
3.10.1. Plain Water
3.10.2. Sugary Beverages
3.11. Alcohol
3.12. Coffee
3.13. Physical Activity
3.14. Dietary Supplementation with Probiotics
3.15. Monitoring Glucose Levels

| (A) Carbohydrate-Containing Foods and Prediabetes Interventional Studies | ||||||||
| Authors | Type of Study | Population Characteristics | Type of Intervention | Duration | End Point | Results | Conclusion | Strength of Evidence |
| Saslow L.R. et al., 2017 [25] | Parallel-group randomized (1:1) trial | Randomize 34 adults with glycated hemoglobin (HbA1c) > 6.0% and elevated body weight (BMI > 25) to a LCK diet (n = 16) or a MCCR diet (n = 18). | Participants attended 19 classes. All participants were encouraged to be physically active, get sufficient sleep, and practice behavioral adherence strategies based on positive affect and mindful eating. | 12 months | Considerable uncertainty exists about the optimal level of carbohydrate intake. Previous research suggests that an ad libitum very-low-carbohydrate ketogenic diet (LCK) may improve metabolic measures in adults with T2DM and reduce the need for diabetes-related medications. | Compared to the MCCR group, the LCK group reported consuming fewer non-fiber grams of carbohydrates (6 and 12 months), more grams of fat (6 and 12 months), and more grams of protein (12 months), but not a different number of calories per day | Adults with prediabetes or noninsulin-dependent type 2 diabetes may be able to improve glycemic control with less medication by following an ad libitum very-low-carbohydrate ketogenic diet compared to a moderate-carbohydrate, calorie-restricted low-fat diet. | High |
| Saslow L.R. et al. 2014 [26] | Randomized pilot trial | Enrolled and randomized 34 participants to the MCCR (n = 18) or LCK (n = 16) diet groups. | MCCR diet (medium-carbohydrate, low-fat, calorie-restricted, carbohydrate-counting diet) consistent with guidelines from ADA. LCK diet (very-low-carbohydrate, high-fat, non-calorie-restricted diet) whose goal is to induce a low level of ketosis, here referred to as LCK (low-carbohydrate, ketogenic). | 3 months | Compared a MCCR representative of conventional diabetic diet recommendations to an LCK (≤50 g carbohydrates per day not including fiber) in persons with HbA1c > 6.0%. The primary outcome measure was change in glycated hemoglobin (HbA1c) from baseline to 3 months. | Both groups had significant weight loss, even though the LCK group tended to lose more weight that the MCCR group (although only significant to the p = 0.09 level), even though only the MCCR group aimed to restrict calories. | In overweight and obese individuals with type 2 diabetes, a very-low-carbohydrate, high-fat, non-calorie-restricted diet may be more effective at improving blood glucose control than a medium-carbohydrate, low-fat, calorie-restricted, carbohydrate-counting diet that remains the standard for most diabetes education efforts. | High |
| Gardner C.D. et al., 2022 [27] | Randomized, crossover, interventional trial | 40 participants aged ≥18 years with prediabetes or T2DM followed the well-formulated ketogenic diet (WFKD) and the Mediterranean-plus diet (Med-Plus) for 12 weeks each, in random order. | Compared two low-carbohydrate diets with three key similarities (nonstarchy vegetables, avoid added sugars and refined grains) and three key differences (avoid legumes, fruits, and whole, intact grains) for their effects on glucose control and cardiometabolic risk factors in individuals with prediabetes and T2DM. | 3 months | The primary outcome was the percentage change in glycated hemoglobin (HbA1c) after 12 weeks on each diet. | The primary analysis was of 33 participants with complete data. The HbA1c values did not differ between diets at 12 weeks. | HbA1c values were not different between diet phases after 12 weeks, but improved from baseline on both diets, likely due to several shared dietary aspects. | High |
| (B) Carbohydrate-Containing Foods and Prediabetes Observational Studies | ||||||||
| Authors | Type of Study | Population Characteristics | Type of Intervention | Duration | End Point | Results | Conclusion | Strength of Evidence |
| Cea-Soriano L. et al., 2021 [28] | Cohort prospective study | 1184 participants with prediabetes based on levels of fasting plasma glucose and/or glycated hemoglobin. | Hazard ratios of diabetes onset were estimated by Cox proportional regression models associated to high versus low/medium adherence to Mediterranean diet. Different propensity score methods were used to control for potential confounders. | 4.2 years | Evaluate the effect from high adherence to Mediterranean diet on the risk of diabetes. | Incidence rate of diabetes in participants with high versus low/medium adherence to Mediterranean diet was 2.9 versus 4.8 per 100 persons-years. The hazard ratios adjusted for propensity score and by inverse probability weighting (IPW) had identical magnitude: 0.63 (95% confidence interval, 0.43–0.93). The hazard ratio in the adjusted model using propensity score matching 1:2 was 0.56 (95% confidence interval, 0.37–0.84). | These propensity score analyses suggest that high adherence to Mediterranean diet reduces diabetes risk in people with prediabetes. | Moderate |
| Filippatos T.D. et al., 2016 [29] | Cohort Prospective Study | 3042 men and women (>18 year) were enrolled for the study. | In 2011 and 2012, the 10-year follow-up examinations were performed, including a working sample of n = 1875 participants without diabetes at baseline. Adherence to the Mediterranean diet at baseline evaluation was assessed using the MedDietScore (range 0–55). | 10 years | Examine the effect of the Mediterranean diet on diabetes and CVD risk in subjects with impaired fasting glucose (IFG, i.e., fasting plasma glucose 100–125 mg/dL). | The prediabetic subjects (343) had a significantly higher incidence of diabetes (25% vs. 10%, p < 0.001) and CVD (17.8% vs. 12.3%, p = 0.007) compared with subjects with normal glucose values. A significant trend towards lower diabetes and CVD incidence was observed with medium and high adherence to the Mediterranean diet compared with low adherence (p < 0.001). High adherence to the Mediterranean diet (>35/55 score) was associated with lower 10-year incidence of diabetes and CVD. | High adherence to the Mediterranean diet is associated with a low risk of developing diabetes and CVD in prediabetic subjects. | Moderate |
| Li L. et al., 2022 [30] | Prospective observational study | 9793 adults with prediabetes from the NHANES 1999–2014 (age > 20 years old). | Dietary intake was measured by 24 h recalls in the NHANES. From 1999 to 2002, one 24 h dietary recall was conducted in person in the NHANES Mobile Examination Center. From 2003 to 2014, dietary intake was measured by a 24 h dietary recall for two nonconsecutive days. | 15 years | Examine the associations of different types of lower-carbohydrate diets (LCDs) and lower-fat diets (LFDs) with mortality among individuals with prediabetes. | Higher healthy LCD score was associated with favorable blood glucose, insulin, HOMA-IR, C-reactive protein (CRP), and blood lipids, whereas higher healthy LFD score was associated with lower blood glucose and CRP at baseline (all p-trend < 0.05). | Healthy LCD and LFD scores were significantly associated with lower all-cause mortality, whereas unhealthy LCD and LFD scores tended to be associated with higher all-cause mortality, among people with prediabetes. | Moderate |
| (A) Milk and Dairy Products and Prediabetes Interventional Studies | ||||||||
| Authors | Type of Study | Population Characteristics | Type of Intervention | Duration | End Point | Results | Conclusion | Strength of Evidence |
| Rideout T.C. et al., 2013 [31] | Randomized controlled trial | Twenty-three healthy subjects completed a randomized, crossover trial. | Randomly assigned to one of two treatment groups: a high-dairy-supplemented group instructed to consume four servings of dairy per day (HD); or a low-dairy-supplemented group limited to no more than two servings of dairy per day (LD). | 12 months | Examine the influence of long-term (6 month) dairy consumption on metabolic parameters in healthy volunteers. | Body weight and composition, energy expenditure, blood pressure, blood glucose, and blood lipid and lipoprotein responses did not differ (p > 0.05) between the LD and HD groups. HD consumption improved (p < 0.05) plasma insulin (−9%) and insulin resistance (−11%, p = 0.03) as estimated by HOMA-IR compared with the LD group. | Study results suggest that high dairy consumption (4 servings/d) may improve insulin resistance without negatively impacting bodyweight or lipid status under free-living conditions. | High |
| Akhavan T. et al., 2010 [32] | Randomized controlled study | Experiment 1: 16 men; experiment 2: 12 men and 10 women. | Whey protein (10–40 g) in 300 mL water was provided in experiment 1, and whey protein (5–40 g) and whey protein hydrolysate (10 g) in 300 mL water were provided in experiment 2. | To describe the effect of whey protein or its hydrolysate when consumed before a meal on food intake, pre- and postmeal satiety, and concentrations of blood glucose and insulin in healthy young adults. | In experiment 1, 20–40 g WP suppressed food intake (p < 0.0001) and 10–40 g WP reduced postmeal blood glucose concentrations and the area under the curve (AUC) (p < 0.05). In experiment 2, 10–40 g WP, but not WPH, reduced postmeal blood glucose AUC and insulin AUC in a dose-dependent manner (p < 0.05). | WP consumed before a meal reduces food intake, postmeal blood glucose and insulin, and the ratio of cumulative blood glucose to insulin AUCs in a dose-dependent manner. | High | |
| (B) Milk and Dairy Products and Prediabetes Observational and Experimental Studies | ||||||||
| Authors | Type of Study | Population Characteristics | Type of Intervention | Duration | End Point | Results | Conclusions | Strength of Evidence |
| Séverin Sindayikengera and Wen-shui Xia [33] | Experimental study | Whey protein chemical composition, protein solubility, amino acid composition, essential amino acid index (EAA index), biological value (BV), nutritional index (NI), chemical score, enzymic protein efficiency ratio (E-PER), and in vitro protein digestibility (IVPD) were determined. | The results indicated that the enzymatic hydrolysis of WPC 80 and sodium caseinate by Protamex improved the solubility and IVPD of their hydrolysates. | The nutritional qualities of WPC 80, sodium caseinate, and their hydrolysates were good and make them appropriate for food formulations or as nutritional supplement. | Moderate | |||
| Slurink I.A. et al., 2022 [34] | Prospective cohort study | 2262 participants without (pre-) diabetes at enrolment (mean age 56 ± 7.3 years; 50% male). | Consumption of total dairy and dairy types. | 6.4 ± 0.7 years of follow-up | Investigate prospective associations of consumption of total dairy and dairy types with incident prediabetes in a Dutch population-based study. | 810 participants (35.9%) developed prediabetes. High-fat fermented dairy, cheese, and high-fat cheese were associated with a 17% (p-trend = 0.04), 14% (p-trend = 0.04), and 21% (p-trend = 0.01) lower risk of incident prediabetes, respectively, in top compared to bottom quartiles, after adjustment for confounders. Total dairy and other dairy types were not associated with prediabetes risk in adjusted models. | The highest intake of high-fat fermented dairy, cheese, and high-fat cheese were associated with a lower risk of prediabetes, whereas other dairy types were not associated. Cheese seems to be inversely associated with type 2 diabetes risk, despite high levels of saturated fatty acids and sodium. | Moderate |
| Slurink I.A. et al., 2022 [35] | Prospective cohort study | 6770 participants (aged 62 ± 4 years, 59% female) free of (pre-)diabetes. | 11.3 ± 4.8 years | To examine associations between dairy-type intake with prediabetes risk and longitudinal insulin resistance. | 1139 incident prediabetes cases were documented (18.8%); a higher intake of high-fat yogurt was associated with lower prediabetes risk; higher intake of high-fat milk was associated with lower prediabetes risk. | A higher intake of high-fat yogurt was associated with a lower prediabetes risk and lower longitudinal insulin resistance. Additionally, high-fat milk was associated with a lower prediabetes risk. | Moderate | |
| Hruby A. et al., 2017 [36] | Retrospective cohort study | 2809 participants [mean ± SD age: 54.0 ± 9.7 year; body mass index (in kg/m2): 27.1 ± 4.7; 54% female]. | Consumption of milk-based products. | To assess associations between consumption of milk-based products, incident prediabetes, and progression to T2D in the Framingham Heart Study Offspring Cohort. | 902 (48%) developed prediabetes. | Associations of dairy with incident prediabetes or diabetes varied both by dairy product and type and by baseline glycemic status in this middle-aged US population. | Moderate | |
| Slurink I.A. et al., 2023 [37] | Prospective cohort study | 4891 participants with normal glucose tolerance (aged 49.0 ± 12.3 year, 57% female). | Consumption of dairy, including different types of dairy products. | 12 years | To examine the relationship between the consumption of dairy, including different types of dairy products and risk of prediabetes. | 765 (15.6%) incident cases of prediabetes were observed. The mean intake of dairy foods was 2.4 ± 1.2 servings/d, mostly consisting of low-fat milk (0.70 ± 0.78 servings/d) and high-fat milk (0.47 ± 0.72 servings/d). | Protective associations were found for high-fat dairy types, whereas neutral associations were seen for low-fat dairy types. | Moderate |
| Brouwer-Brolsma E.M. et al., 2018 [38] | Cross-sectional study | 112,086 adults | A broad variety of dairy subgroups. | / | To assess cross-sectional associations of a broad variety of dairy subgroups with prediabetes and newly diagnosed type 2 diabetes (ND-T2DM) among Dutch adults. | Median dairy product intake was 324 (interquartile range 227) g/d; 25 549 (23%) participants had prediabetes; and 1305 (1%) had ND-T2DM. After full adjustment, inverse associations were observed of skimmed dairy (OR100 g 0.98; 95% CI 0.97, 1.00), fermented dairy (OR100 g 0.98; 95% CI 0.97, 0.99), and buttermilk (OR150 g 0.97; 95% CI 0.94, 1.00) with prediabetes. | Data showed inverse associations of skimmed and fermented dairy products with prediabetes. Positive associations were observed for full-fat and non-fermented dairy products with prediabetes and ND-T2DM. | Moderate |
| Pestoni G. et al., 2021 [39] | Cross-sectional study | 1305 participants of the cross-sectional population-based KORA FF4 study. | / | / | To identify dietary patterns and to investigate their association with prediabetes, undetected diabetes, and prevalent diabetes. | Participants following the Western pattern had significantly higher chances of having prediabetes (odds ratio [OR] 1.92; 95% confidence interval [CI] 1.35, 2.73), undetected diabetes (OR 10.12; 95% CI 4.19, 24.43), or prevalent diabetes (OR 3.51; 95% CI 1.85, 6.67), compared to participants following the Prudent pattern. | These results suggest a very important role of dietary habits in the prevention of prediabetes and type 2 diabetes. | Moderate |
| (C) Milk and Dairy Products and Prediabetes Review and Meta-Analysis | ||||||||
| Authors | Type of Study | Number of Studies | Subjects (Total) | End Point | Result | Conclusion | Strenght of Evidence | |
| Hidayat K. et al., 2019 [40] | Narrative review | / | Providing a clear presentation of the potential implementation of milk proteins as a dietary supplement in the prevention and management of T2DM by summarizing the relevant supporting evidence for this particular topic. | The results from these trials showed that milk proteins may have functional properties for stimulating postprandial insulin, resulting in lower postprandial glucose levels. | Low | |||
| Hoffman J.R. and Falvo M.J., 2004 [41] | Narrative review | / | To examine and analyze key factors responsible for making appropriate choices on the type of protein to consume in both athletic and general populations. | Low | ||||
| Yau W.J. et al., 2020 [42] | Systematic review | Ninety-five articles involving a total of 11,211 participants were included in this review. | Nutritional strategies were broadly classified into four groups: low-calorie diet, low-glycemic-index diet, specific foods, and a combination of diet and exercise | Review on recently reported nutritional interventions for individuals with prediabetes. | More than 50% of reported interventions resulted in significant improvements in these parameters. | High | ||
| (D) Eggs and Prediabetes Interventional Studies | ||||||||
| Authors | Type of Study | Population Characteristics | Type of Intervention | Duration | End Point | Results | Conclusion | Strenght Of Evidence |
| Pourafshar S. 2018 [43] | RCT | 42 overweight or obese individuals between the ages of 40 and 75 years with pre- and type II diabetes were included. | Participants were randomly assigned to receive either one large egg per day or an equivalent amount of egg substitute for 12 weeks. Blood samples were obtained to analyze lipid profile and biomarkers associated with glycemic control at all time points. | 12 weeks | Evaluated if egg consumption may improve factors associated with glycemic control and insulin sensitivity. | Regular egg consumption resulted in improvements of fasting blood glucose, which was significantly (p = 0.05) reduced by 4.4% at the final visit in the egg group. Participants in the egg group had significantly (p = 0.01) lower levels of homeostatic model assessment of insulin resistance (HOMA-IR) at all visits. | Regular egg consumption has been shown to lead to an improvement in fasting blood sugar and insulin resistance levels (HOMA-IR). There were no significant changes in the levels of total cholesterol and LDL cholesterol. | High |
| (E) Eggs and Prediabetes Review and Meta-Analysis | ||||||||
| Authors | Type of Study | Number of Studies | Subjects (Total) | End Point | Result | Conclusion | Strenght of Evidence | |
| Richard C., 2017 [44] | Sistematic review | Six original controlled randomized trials. | / | Evaluated the link between egg consumption and the main cardiovascular risk factors in subjects with type 2 diabetes or at risk of the disease (prediabetes, insulin resistance, or metabolic syndrome) | The majority of studies found that egg consumption did not affect major CVD risk factors. Consumption of 6 to 12 eggs per week had no impact on plasma concentrations of total cholesterol, low-density lipoprotein-cholesterol, triglycerides, fasting glucose, insulin, or C-reactive protein. | Results from randomized controlled trials suggest that consumption of 6 to 12 eggs per week, in the context of a diet that is consistent with guidelines on cardiovascular health promotion, has no adverse effect on major CVD risk factors in individuals at risk for developing diabetes or with type 2 diabetes | High | |
| Drouin-Chartier J.P., 2020 [45] | Systematic review and meta-analysis of Prospective cohort studies | Three prospective cohort studies. | 82,750 women from the Nurses’ Health Study (NHS; 1980–2012), 89,636 women from NHS II (1991–2017), and 41,412 men from the Health Professionals Follow-Up Study (HPFS; 1986–2016) with no diabetes, cardiovascular disease, and baseline cancer. | Evaluated the association between egg consumption and T2D risk | Documented 20,514 incident cases of T2D in the NHS, NHS II, and HPFS. In the pooled multivariable model adjusted for updated BMI, lifestyle, and dietary confounders, a 1 egg/d increase was associated with a 14% higher T2D risk. There were, however, significant differences by geographic region (P for interaction = 0.01). Each 1 egg/d was associated with higher T2D risk among US studies (RR: 1.18; 95% CI: 1.10, 1.27; I2 = 51.3%), but not among European (RR: 0.99; 95% CI: 0.85, 1.15; I2 = 73.5%) or Asian (RR: 0.82; 95% CI: 0.62, 1.09; I2 = 59.1%) studies. | Results from the updated meta-analysis show no overall association between moderate egg consumption and risk of T2D. | High | |
| (F) Meat and Prediabetes Observational Studies | ||||||||
| Authors | Type of Study | Population Characteristics | Type of Intervention | Duration | End Point | Results | Conclusion | Strenght of Evidence |
| Nguyen et al., 2022 [46] | Cross-sectional study | 3000 subjects, aged 40–60 years, living in rural communes in Khánh Hòa Province for at least six months. | Anthropometry results, blood samples for biochemical measurements and questionnaire information via face-to-face interviews were collected. | 2–4 years | Examine the association between daily consumption of red/processed meat (0–99 g, 100–199 g or ≥200 g) and preDM/DM | The relative-risk ratios for DM were 1.00 (reference), 1.11 (95% CI = 0.75, 1.62) and 1.80 (95% CI = 1.40, 2.32) from the lowest to the highest red/processed meat consumption categories (p-trend = 0.006). The corresponding values for preDM were 1.00 (reference), 1.25 (95% CI = 1.01, 1.54), and 1.67 (95% CI = 1.20, 2.33) (p-trend = 0.004). | Increased red/processed meat consumption, but not poultry consumption, was positively associated with the prevalence of preDM/DM in rural communes in Khánh Hòa Province, Vietnam. | Moderate |
| Song et al., 2004 [47] | Prospective cohort study | 37,309 participants in the Women’s Health Study aged ≥5 years who were free of cardiovascular disease, cancer, and type 2 diabetes. | Validated semi-quantitative food-frequency questionnaire. | 8.8 years | To prospectively assess the relation between red meat intake and incidence of type 2 diabetes. | It was documented that there were 1558 incident cases of type 2 diabetes and positive associations were found between intakes of red meat and processed meat and risk of type 2 diabetes. Comparing women in the highest quintile with those in the lowest quintile, the multivariate-adjusted relative risks (RRs) of type 2 diabetes were 1.28 for red meat (95% CI 1.07–1.53, p < 0.001 for trend) and 1.23 for processed meat intake (1.05–1.45, p = 0.001 for trend). | Higher consumption of total red meat, especially various processed meats, may increase risk of developing type 2 diabetes in women. | Moderate |
| (G) Meat and Prediabetes Review and Meta-Analysis | ||||||||
| Authors | Type of Study | Number of Studies | Subjects (Total) | End Point | Result | Conclusion | Strenght of Evidence | |
| Pan A. et al., 2011 [48] | Meta-analysis combined with three cohort studies | Three cohort studies + one meta analysis. | Meta-analysis (442,101 participants and 28,228 diabetes cases). | Evaluated the association between unprocessed and processed red meat consumption and incident T2D in US adults. | Documented 13,759 incident T2D cases. Both unprocessed and processed red meat intakes were positively associated with T2D risk in each cohort (all p-trend <0.001). The pooled HRs (95% CIs) for a one serving/d increase in unprocessed, processed, and total red meat consumption were 1.12, 1.32, and 1.14, respectively. The results were confirmed by a meta-analysis: the RRs (95% CIs) were 1.19 and 1.51 for 100 g unprocessed red meat and for 50 g processed red meat, respectively. | Red meat consumption, particularly processed red meat, is associated with an increased risk of T2D | High | |
| Pan A. et al., 2013 [49] | Meta-analysis combined with three cohort studies | Three cohort studies | 26,357 men in the Health Professionals Follow-Up Study (1986–2006), 48,709 women in the Nurses’ Health Study (1986–2006), and 74,077 women in the Nurses’ Health Study II (1991–2007). | Evaluate the association between changes in red meat consumption during a four-year period and subsequent four-year risk of T2DM in US adults. | Documented 7540 incident T2DM cases. Compared with the reference group of no change in red meat intake, increasing red meat intake of more than 0.50 servings per day was associated with a 48% elevated risk. Reducing red meat consumption by more than 0.50 servings per day from baseline to the first four years of follow-up was associated with a 14% lower risk | Increasing red meat consumption over time is associated with an elevated subsequent risk of T2DM, and the association is partly mediated by body weight. Limiting red meat consumption over time confers benefits for T2DM prevention. | High | |
| Sanders L.M. et al., 2022 [50] | Systematic review and meta-analysis of randomized controlled trials | 21 RCTs | Adult humans (≥18 y of age). | Evaluating the effects of diets containing red meat compared to diets with lower or no red meat, on markers of glucose homeostasis in adults. | Compared to diets with reduced or no red meat intake, there was no significant impact of red meat intake on insulin sensitivity, insulin resistance, fasting glucose, fasting insulin, glycated hemoglobin, pancreatic beta-cell function, or glucagon-like peptide-1. Red meat intake modestly reduced postprandial glucose compared to meals with reduced or no red meat intake. | The results suggest red meat intake does not impact most glycemic and insulinemic risk factors for T2D. Further investigations are needed on other markers of glucose homeostasis. | High | |
| (H) Plant-Based Protein Foods and Prediabetes Interventional Studies | ||||||||
| Authors | Type of Study | Population Characteristics | Type of Intervention | Duration | End Point | Results | Conclusion | Strength of Evidence |
| Kwak J.H. et al., 2010 [51] | RCT | 42 prediabetic or diabetic subjects. | Subjects with prediabetes and type 2 DM. Black soy peptide intervention group or placebo control group. | 12 weeks | Effect of black soy peptide supplementation on glucose control in subjects with prediabetes and newly diagnosed type 2 diabetes mellitus. | Subjects with fasting glucose ≥ 110 mg/dL who consumed black soy peptides tended to have lower fasting glucose levels (two-tailed test, p = 0.098; one-tailed test, p = 0.049) and had a significant reduction in 2 h PG level (two-tailed p = 0.012, one-tailed p = 0.006), compared with baseline levels. The changes in 2 h PG levels were also statistically significant in the intervention group (−41.25 ± 13.67 mg/dL) compared with the placebo group (12.42 ± 9.80 mg/dL; two-tailed p = 0.015, one-tailed p = 0.008). | Black soy peptide supplementation may be beneficial for controlling fasting blood glucose levels and 2 h PG levels. | High |
| Reis C.E. et al., 2011 [52] | RCT | 13 subjects (4 men and 9 women), with a mean age of 28.5 ± 10 years. | Four types of test meals were consumed: raw peanuts with skin (RPS), roasted peanuts without skin, ground-roasted peanuts without skin (GRPWS), or control meal. The test meals had the same nutrient composition. | 24 h | Evaluate the effect of peanut processing on glycemic response, and energy and nutrients intake. | The area under the glycemic response curve after GRPWS was lower (p = 0.02) than the one obtained for RPS. There was no treatment effect on energy intake, macronutrients, and fiber consumption. | The consumption of ground-roasted peanuts may favor the control and prevention of diabetes due to its reduction on postprandial glucose response. | High |
| (I) Plant-Based Protein Foods and Prediabetes Observational Studies | ||||||||
| Authors | Type of Study | Population Characteristics | Type of Intervention | Duration | End Point | Results | Conclusion | Strength of Evidence |
| Becerra-Tomás N. et al., 2017 [53] | Prospective cohort study | 3349 participants without type 2 diabetes at baseline. Aged 55–80 years. | - | 4.3 years | Examine the associations between consumption of total legumes and specific subtypes, and type 2 diabetes risk. | 266 new cases of type 2 diabetes. Individuals in the highest quartile of total legume and lentil consumption had a lower risk of diabetes than those in the lowest quartile (HR: 0.65; 95% CI: 0.43, 0.96; p-trend = 0.04; and HR: 0.67; 95% CI: 0.46–0.98; p-trend = 0.05, respectively). | A frequent consumption of legumes, particularly lentils, may provide benefits on type 2 diabetes prevention in older adults. | Moderate |
| Shams H. et al., 2008 [54] | Case–control study | 30 patients with type 2 diabetes mellitus. | Two groups. Group A normal diet. Group B normal diet with 50 g cooked lentil and 6 g canula oil (substitute of 30 g bread and 20 g cheese) | 6 weeks | Assess the effects of cooked lentil on serum blood glucose and lipid profile among type 2 diabetic patients. | Total cholesterol and fasting blood glucose decreased significantly in regimen containing lentils (p < 0.05). | Consumption of cooked lentil in breakfast led to reduction of FBS and TC and improvement of glycemic control in type 2 diabetic patients. | Moderate |
| Jiang R. et al., 2002 [55] | Prospective cohort study | 83,818 women, aged 34 to 59 years, no history of diabetes, cardiovascular disease, or cancer. | Subjects completed a validated dietary questionnaire at baseline in 1980, and were followed-up for 16 years. | 16 years | Examine prospectively the relationship between nut consumption and risk of type 2 diabetes. | 3206 new cases of type 2 diabetes were documented. The consumption was inversely associated with risk of type 2 diabetes. | A higher consumption of nut and peanut butter may have some benefits in lowering risk of type 2 diabetes in women. | Moderate |
| (J) Plant-Based Protein Foods and Prediabetes Reviews and Meta-Analyses | ||||||||
| Authors | Type of Study | Number of Studies | Subjects (Total) | End Point | Result | Conclusion | Strenght of Evidence | |
| Ley S.H. et al., 2014 [56] | Narrative review | - | - | To examine the role of diet in prevention and management of diabetes in the scientific literature. | - | - | Low | |
| Kim Y., Keogh J.B., Clifton P.M., 2016 [57] | Narrative review | - | - | To provide a comprehensive overview of the anti-diabetic effects of commonly consumed dietary polyphenols. | In vitro and in vivo studies have shown that dietary polyphenolic compounds improved glucose homeostasis in the intestine, liver, muscle adipocytes, and pancreatic β-cells, as well as through prebiotic effects in the digestive tract. | Polyphenols may play a role in diabetes treatment and prevention but further investigations are needed. | Low | |
| Schwingshackl L. et al., 2018 [58] | Meta-analysis | 66 randomized trials (86 reports) comparing 10 food groups. | 3595 participants | To assess the effects of main food groups (refined grains, whole grains, nuts, legumes, fruits and vegetables, eggs, dairy, fish, red meat, and sugar-sweetened beverages) on intermediate-disease markers across randomized intervention trials. | Legumes, but also whole grains, nuts, and refined grains, were more effective at reducing HOMA-IR (−1.01 to −0.53) compared with eggs and dairy. No significant effects were detected for HbA1c. | Increased intake of legumes (but also nuts and whole grains) is more effective at improving metabolic health than other food groups. | High | |
| Schwingshackl L. et al., 2017 [59] | Meta-analysis | 103 studies were included in the meta-analysis. | - | Synthesize the knowledge about the relation between intake of 12 major food groups (whole grains, refined grains, vegetables, fruits, nuts, legumes, eggs, dairy, fish, red meat, processed meat, and sugar-sweetened beverages) with risk of all-cause mortality. | An inverse association was observed for the highest compared with lowest legume intake categories (RR: 0.96; 95% CI: 0.93, 1.00; I2 = 48%; p-heterogeneity = 0.01). Consumption of legumes was associated with a decreased by 16% risk of all-cause mortality with increasing intake of legumes up to 150 g daily intake. | Legume intake up to 150 g/day may be helpful in reducing mortality for all causes (including diabetes and its complications). | High | |
| Tang J. et al., 2020 [60] | Meta-analysis | 15 cohort studies | 565,810 individuals and 32,093 incident cases (diabetes occursions) | Summarize the longitudinal associations between legume and soy intake and risk of type 2 diabetes. | In dose–response analysis, significant linear inverse associations were observed for tofu, soy protein, and soy isoflavones (all p < 0.05). Overall quality of evidence was rated as moderate for total legumes and low for total soy and soy subtypes. | Dietary intakes of tofu, soy protein, and soy isoflavones, but not total legumes or total soy, are inversely associated with incident type 2 diabetes. | High | |
| Li W. et al., 2018 [61] | Meta-analysis | Eight studies with 19 reports | 335,230 participants | Evaluate the relationship between soy intake and type 2 diabetes mellitus risk. | A significant inverse association was shown between soy intake and type 2 diabetes mellitus risk with an overall RR of 0.77 (95% CI = 0.66–0.91) with high heterogeneity. Moreover, there was an obvious relationship between soy protein and isoflavones intake and risk of T2DM with the summary RR was 0.88 (95% CI = 0.80–0.97) with no heterogeneity. | Soy products and soy constituents (soy protein and soy isoflavones) may be associated with a lower risk of type 2 diabetes mellitus. | High | |
| (A) Sarcopenia and Prediabetes Observational Studies | ||||||||
| Authors | Type of Study | Population Characteristics | Type of Intervention | Duration | End Point | Results | Conclusion | Strength of Evidence |
| Xu J. et al., 2023 [62] | Population study | 16,116 U.S. adults aged 20–59 year with dual energy X-ray absorptiometry (DXA) from the National Health and Nutrition Examination Surveys (NHANES). | Evaluation of sarcopenia by DXA. | / | To explore the specific association between sarcopenia and prediabetes based on large population samples. | Sarcopenia was strongly associated with an increased risk of prediabetes after full adjustment (OR = 1.21, 95CI%: 1.05, 1.39, p = 0.009). | Sarcopenia was positively associated with prevalent prediabetes, especially IGT in the non-elderly. | Moderate |
| Kaga H. et al., 2022 [63] | Cross-sectional study | 1629 elderly (mean age 73.1 ± 5.4 years) living in Japan. | Evaluation of glucose metabolism (75 g oral glucose tolerance test and glycated hemoglobin) and sarcopenia (BIA and hand grip strength). | / | To examine the relationship between sarcopenia and prediabetes. | Prediabetes and diabetes are independent risk factors for sarcopenia in men (prediabetes, odds ratio [OR] = 2.081 [95% confidence interval {CI}: 1.031–4.199]; diabetes, OR = 2.614 [95% CI: 1.362–5.018]) and diabetes, but not prediabetes, is an independent risk factor for sarcopenia in women (prediabetes, OR = 1.036 [95% CI: 0.611–1.757]; diabetes, OR = 2.099 [95% CI: 1.146–3.844]). | Although diabetes mellitus is associated with sarcopenia in both sexes, prediabetes is associated with sarcopenia in men, but not in women. | Moderate |
| Li S. et al., 2023 [64] | Observational study | 22,482 adults aged ≥20 years in the National Health and Nutrition Examination Survey (NHANES). | Sarcopenia defined as ASMBMI (appendicular skeletal muscle mass/body mass index) < 0.789 for males, and <0.512 for females. | / | To explore the detailed correlation between prediabetes and sarcopenia. | Sarcopenia was directly correlated with prediabetes [OR (95% CI) = 1.230 (1.057, 1.431), p = 0.008] and T2DM [OR (95% CI) = 2.106 (1.625, 2.729), p < 0.001]. In non-T2DM population, HbA1c was negatively correlated with ASMBMI [β (95% CI) = −0.009 (−0.013, −0.005), p < 0.001]. | Prediabetes is associated with increased risk of sarcopenia. HbA1c is an independent risk factor for loss of appendicular skeletal muscle mass and sarcopenia when HbA1c greater than 5.2% in the male non-T2DM population. | Moderate |
| (B) Sarcopenia and Prediabetes Review and Meta-Analysis | ||||||||
| Authors | Type of Study | Number of Studies | Subjects (Total) | End Point | Result | Conclusion | Strenght of Evidence | |
| Qiao Y.S. et al., 2021 [65] | Meta-analysis | 16 observational studies. | / | To investigate the association between the presence of sarcopenia and HbA1c values, prediabetes, diabetes, and its complications. | Three studies showed that high HbA1c levels lead to loss of muscle mass, and one study showed that people with prediabetes had lower muscle mass, strength, and performance than non-diabetic population. Seven studies showed that people with diabetes had a higher risk of sarcopenia than those without diabetes. The remaining five studies suggested that diabetic complications increased the risk of sarcopenia. | Subjects with prediabetes had reduced mass, strength, and muscle performance compared to non-diabetics. | High | |
| (A) Lipid-Containing Foods and Prediabetes Interventional Studies | ||||||||
| Authors | Type of Study | Population Characteristics | Type of Intervention | Duration | End Point | Results | Conclusion | Strength of Evidence |
| Díaz-Rizzolo et al., 2021 [66] | RCT | 152 subjects with fasting glucose between 100–124 mg/dL aged ≥65 yo randomly distributed among control group (CG, n = 77) and sardine group (SG, n = 75). | Both groups received same T2D-prevention nutritional during a year but only SG had to add 200 g of sardine per week. | 1 years | The study hypothesized that the consumption of twice a week of sardine, during one year, would reduce T2D-developing risk in a population with prediabetes (preDM) and old age. | Subjects in SG, significantly compared to CG, decreased percentage of individuals classified in a very high-risk group to develop T2D (p = 0.035). SG showed a lower HOMA-IR (p = 0.032). | A year T2D-prevention diet with sardine supplementation has a greater protective effect against developing T2D and CV events. | High |
| Rajabi-Naeeni M. et al., 2020 [67] | RCT | 168 women of reproductive age with prediabetes and hypovitaminosis D, assigned to four groups. | Placebo group (omega-3 and vitamin D placebos); the omega-3 group (omega-3 supplements and vitamin D placebos); the vitamin D group (omega-3 placebos and vitamin D supplements); co-supplementation group. Every 2 weeks, the groups received 50,000 IU pearls of vitamin D and twice-daily doses of 1000-mg omega-3 tablets or placebos. | 8 weeks | Determine the effectiveness of vitamin D and omega-3 co-supplementation on glycemic control and serum lipid profiles in women of reproductive age with prediabetes and hypovitaminosis D. | A significant reduction was observed in fasting glucose, insulin, homeostasis model assessment beta cell function, weight, and waist circumference in the co-supplementation group compared to the other three groups (p < 0.05). | Vitamin D and omega-3 co-supplementation improved fasting serum glucose, insulin, high-density lipoprotein-cholesterol level, homeostasis model assessment beta cell function, weight, and waist circumference in women of reproductive age with prediabetes and hypovitaminosis D. | High |
| Weta I.W. et al., 2017 [68] | RCT | 45 young obese women randomized into two groups. | 22 participants were supplemented with 2000 mg and 1000 mg of LA and ALA (Intervention), and 23 participants were given placebo (Control). | 12 weeks | Elucidate the effect of the linoleic acid (LA) and alfa linolenic acid (ALA) supplementation to fasting plasma glucose in young women obese patients. | In the Intervention group, there was no significant change in fasting plasma glucose, contrary to it being increased (p = 0.007) in the Control group. The impaired plasma glucose increased in the Control group (OR = 8, p = 0.039), but not in the Intervention group (p = 0.508). | Restriction energy intake with supplementation 2000 mg and 1000 mg of LA and ALA control prediabetes of young obese women. | High |
| Jamilian M. et al., 2018 [69] | Randomized, double-blinded, placebo-controlled clinical trial | 60 subjects, aged 18–40 years old with PCOS. | 50,000 IU vitamin D every 2 weeks plus 2000 mg/day omega-3 fatty acid from fish oil (n = 30) or placebo (n = 30). | 12 weeks | Evaluate the effect of the co-administration of vitamin D and omega-3 fatty acid on clinical, metabolic, and genetic parameters in women with polycystic ovary syndrome (PCOS). | Vitamin D and omega-3 fatty acid co-administration significantly decreased serum high-sensitivity C-reactive protein (hs-CRP) (p = 0.001) and malondialdehyde (MDA) levels (p < 0.001), and significantly increased plasma total antioxidant capacity (TAC) levels (p = 0.003) compared with the placebo. Vitamin D and omega-3 fatty acid co-supplementation significantly downregulated gene expression of interleukin-1 (IL-1) (p = 0.03), and upregulated vascular endothelial growth factor (VEGF) (p = 0.004) in PBMCs of subjects with PCOS, when compared with placebo. | The co-administration of vitamin D and omega-3 fatty acid for 12 weeks had beneficial effects on mental health parameters, serum total testosterone, hs-CRP, plasma TAC and MDA levels, and gene expression of IL-1 and VEGF among women with PCOS. | High |
| Njike, V.Y. et al., 2021 [70] | RCT cross-over | 20 adults (mean age 56.1 years; 10 women, 10 men) at risk for T2DM. | Subjects were assigned to one of two possible sequence permutations of two different single dose treatments (50 mL of high-polyphenolic EVOO or 50 mL of refined olive oil without polyphenols), with 1-week washout. | To compare the effects of high-polyphenolic extra-virgin olive oil (EVOO) and refined olive oil without polyphenols on endothelial function (EF) in adults at risk for type 2 diabetes mellitus (T2DM). | EVOO acutely improved EF as compared to refined olive oil (1.2 ± 6.5% versus −3.6 ± 3.8%; p = 0.0086). | High-polyphenolic EVOO acutely enhanced EF in the study cohort, whereas refined olive oil did not. | High | |
| Carnevale, R. et al., 2017 [71] | RCT | 30 IFG patients | Patients were randomly allocated to a meal containing or not 10 g of EVOO in a cross-over design. | 6 months | Was investigated if EVOO affects postprandial glucose and lipid profile in patients with impaired fasting glucose (IFG). | The meal containing EVOO was associated with a reduction of glucose (p = 0.009) and DPP4 activity (p < 0.001) and a significant increase of insulin (p < 0.001) and GLP-1 (p < 0.001) compared with the meal without EVOO. | In IFG patients, EVOO improves postprandial glucose and lipid profile with a mechanism probably related to incretin upregulation. | High |
| Bartimoccia, S. et al., 2022 [72] | Clinical trial | 20 patients with impaired fasting glucose (IFG) and 20 healthy subjects (HS) matched for sex and age. | Variables were measured before and after a Mediterranean diet with 10 g EVOO added or not or in IFG patients before and after intake of 40 g chocolate with EVOO added or not. | The hypothesis that EVOO improves postprandial glycemia by reducing gut-permeability-derived low-grade endotoxemia was tested. | IFG had higher levels of LPS and zonulin. Two hours after a meal intake containing EVOO, IFG patients showed a less significant increase of blood glucose, a more marked increase of blood insulin and GLP1, and a significant reduction of LPS and zonulin compared to IFG patients not given EVOO. | Addition of EVOO to a Mediterranean diet or chocolate improves gut permeability and low-grade endotoxemia. | High | |
| (B) Lipid-Containing Foods and Prediabetes Observational Studies | ||||||||
| Authors | Type of study | Population Characteristics | Type of Intervention | Duration | End Point | Results | Conclusion | Strength of Evidence |
| Abshirini et al., 2020 [73] | Case–control study | 150 subjects with normal fasting glucose and 147 prediabetic subjects, aged 35–65. | FFQ with 168 food items. | Determine the association of DFQ (dietary fat quality) and fatty acid intake with prediabetes. | A positive association between intake of total SFA, myristic acid, palmitic acid, and prediabetes, and a negative association among n-3 PUFA, eicosapentaenoic, docosahexaenoic, and arachidonic acid intake and prediabetes. | Higher intake of dietary n-3 fatty acids was adversely related, whereas SFA intake was positively related to prediabetes morbidity. | Moderate | |
| Mirmian P. et al., 2018 [74] | Cohort prospective study | 2139 adults, free of T2DM, aged 20–70 y-old. | Diet information was collected with the use of a validated questionnaire at baseline. | 5.8 years | Examine the association between fatty acid quantity and quality with risk of T2DM in adults. | Identified 143 incident T2D cases. When extreme quintiles were compared, cholesterol, monounsaturated fatty acids, polyunsaturated fatty acids, and ω-3 fatty acids were associated with T2DM. ω-6 to ω-3 ratio intake was associated with a higher risk of T2D. Also found positive associations between the ratios of total fat to ω-3. | Findings indicate that diets with high cholesterol, monounsaturated, polyunsaturated, and ω-3 fatty acids are associated with a lower risk of T2DM. Moreover, the ratios of ω-6/ω-3 and total fat/ω-3 were positively associated with T2DM. | Moderate |
| Nanri A. et al., 2011 [75] | Cohort prospective study | 22,921 men and 29,759 women aged 45–75 y. | Participants completed a questionnaire of the second survey for the Japan Public Health Center-based Prospective Study. | 5-year period | Prospectively investigated the association between fish intake and type 2 diabetes risk in Japanese adults. | 971 new cases (572 men and 399 women) of type 2 diabetes were self-reported. In men, fish intake was significantly associated with a decreased risk of type 2 diabetes; In women, fish intake was not appreciably associated with type 2 diabetes risk. | In a population with high fish and seafood intake, fish consumption was associated with a lower risk of type 2 diabetes in men but not in women. | Moderate |
| Ibsen D.B. et al., 2019 [76] | Cohort study | A cohort of 53,163 participants from the Danish Diet, Cancer and Health study were followed for incident type 2 diabetes. | Diet was assessed by a validated 192-item food-frequency questionnaire at baseline. | Median follow-up time 15.4 years. | The associations between substitution of red meat (total, processed and unprocessed, low fat and high fat) with poultry or fish and substitution of processed red meat with unprocessed red meat and the risk of type 2 diabetes was examined. | 6879 cases. Replacing total red meat with fish was associated with a lower risk of type 2 diabetes, as was replacement of processed red meat with poultry or fish. Replacing low fat red meat or high fat red meat with fish was associated with a lower risk of type 2 diabetes, whereas similar substitutions, with poultry, were not. Replacing processed red meat with unprocessed red meat was also associated with a lower risk of type 2 diabetes. | Replacing processed red meat with poultry, replacing total or processed red meat with fish, and replacing processed red meat with unprocessed red meat were all associated with a lower risk of type 2 diabetes. | Moderate |
| Chen G.C. et al., 2021 [77] | Prospective cohort study | 392,287 middle-aged and older participants (55.0% women) in the UK Biobank who were free of diabetes, major cardiovascular disease, and cancer. | 163,706 participated in one to five rounds of 24 h dietary recalls during 2009–2012. | Median 10.1 years of follow-up. | Evaluate associations of oily and nonoily fish consumption and fish oil supplements with incident type 2 diabetes. | 7262 incident cases of T2D were identified. | Consumption of oily fish but not nonoily fish was associated with a lower risk of T2D. Use of fish oil supplements, especially constant use over time, was also associated with a lower risk of T2D. | Moderate |
| (C) Lipid-Containing Foods and Prediabetes Review and Meta-Analysis | ||||||||
| Authors | Type of Study | Number of Studies | Subjects (Total) | End Point | Result | Conclusion | Strenght of Evidence | |
| Xun P. et al., 2012 [78] | Meta-analysis | Nine eligible studies | 12 independent cohorts—438,214 individuals. | Assess the literature and determine the association between fish consumption and diabetes risk quantitatively. | Compared with those who never consumed fish or ate fish less than once per month, the pooled RR of incident diabetes was 0.99 (95% CI 0.85–1.16) for individuals who ate fish five or more times per week (p-trend = 0.80). Similar results were found for long-chain n-3 polyunsaturated fatty acid intake. | Evidence generated from this meta-analysis does not support an overall inverse association of fish or fish oil intake with incidence of diabetes. | High | |
| Schwingshackl, L. et al., 2017 [79] | Systematic review and meta-analysis | Four cohort studies. 29 trials included in the metanalysis. | 15,784 T2D | Illustrate the impact of olive oil (OO) on type 2 diabetes (T2D) by investigating the association between OO intake and risk of T2D, and the effect of OO intake in the management of T2D. | The highest OO intake category showed a 16% reduced risk of T2D. In T2D patients, OO supplementation resulted in a significantly more pronounced reduction in HbA1c. | The intake of OO could be beneficial for the prevention and management of T2D. | High | |
| (A) Vitamins and Prediabetes Interventional Studies | ||||||||
| Authors | Type of Study | Population Characteristics | Type of Intervention | Duration | End Point | Results | Conclusion | Strength of Evidence |
| Rasouli et al., 2022 [80] | RCT | 1774 subjects with a mean age of 60.5 ± 9.8 years and a mean BMI of 31.9 ± 4.4 kg/m2 (44% female and 69% white). Participants had to meet at least two of three glycemic criteria for prediabetes defined by the 2010 American Diabetes Association guidelines. | Overweight/obese adults at high risk for type 2 diabetes (prediabetes) were randomly treated with vitamin D3 4000 IU or matching placebo daily. Disposition index (DI), as an estimate of β-cell function, was calculated as the product of HOMA2%Scpep and C-peptide response during the first 30 min of a 75 g oral glucose tolerance test (OGTT). | 24 months | Investigate the effects of vitamin D3 supplementation on insulin sensitivity and β-cell function in adults at high risk for type 2 diabetes. | In the entire cohort, there were no significant differences in changes in DI, HOMA2%Scpep, or C-peptide response between the two groups. Vitamin D improved β-cell function among those who had baseline 25(OH)D levels below 12 ng/mL. | Supplementation with vitamin D3 for 24 months did not improve an OGTT-derived index of β-cell function in people with prediabetes not selected based on baseline vitamin D status; however, there was benefit among those with very low baseline vitamin D status. | High |
| (B) Vitamins and Prediabetes Observational Studies | ||||||||
| Authors | Type of Study | Population Characteristics | Type of Intervention | Duration | End Point | Results | Conclusion | Strength of Evidence |
| Banerjee et al., 2017 [81] | Cross-sectional study | 202 subjects: 77 subjects with type 2 diabetes (mean age 48.09 ± 6.8), 73 with prediabetes (mean age 49.96 ± 7.6), and 52 healthy subjects constituting the control group (mean age 50.08 ± 7.1). | All subjects were matched for age, gender, and BMI within study groups. In all study groups, fasting serum levels of adiponectin, insulin and 25(OH)D were measured and routine biochemical parameters were analyzed. | Investigate the roles of deficient or deranged insulin, adiponectin, and 25 hydroxy vitamin D (25[OH]D) levels and to establish their interrelationship. | A statistically significant lower level of serum adiponectin and serum 25(OH)D and higher serum insulin levels in prediabetes or type 2 diabetes. The changes in the serum adiponectin or serum 25(OH)D in prediabetes and type 2 diabetes were inversely correlated with the serum levels of insulin. | The association of these hormones might act as a significant predictor of progression of prediabetes to type 2 diabetes. | Moderate | |
| Jie Zhu et al., 2020 [82] | Prospective cohort study | 4704 American adults (52% female and 51% black) between 18 and 30 years of age (mean age, 24.9 ± 3.6 years) and without diabetes enrolled in 1985–1986 and monitored through 2015–2016 in the Coronary Artery Risk Development in Young Adults (CARDIA) study. | Dietary assessment conducted by means of a validated anamnestic questionnaire at baseline, year 7, and year 20. | 30 years | Prospectively examine intakes of folate, vitamin B6, and vitamin B12 in relation to diabetes incidence in a large U.S. cohort. | During 30 years of follow-up, 655 incident cases of diabetes occurred. Intake of folate was inversely associated with diabetes incidence after adjustment for potential confounders. Higher folate intake was also associated with lower plasma homocysteine (p-trend < 0.01) and insulin p-trend < 0.01). | Intake of folate in young adulthood was inversely associated with diabetes incidence in midlife among Americans. | Moderate |
| Jin G. et al., 2021 [83] | Cross-sectional study | 22,041 participants (10,672 men and 11,369 women) over the age of 20. | Five diagnostic criteria (three based on laboratory data and two on questionnaires) were applied to define the condition of diabetes or prediabetes. A 24 h recall of two different days was used. | Define the association between folate, B12, and B6 obtained from diet and supplementation, and diabetes and prediabetes in American adults. | Of the 22,041 participants, 18.3% had diabetes and most were over 60 years old. Dietary folate and B6 were associated with a lower risk of diabetes, and, after adjusting for confounders, folate, B6, and B12 levels were inversely associated with diabetes. Dietary folate and B6 intakes were negatively associated with new diabetes diagnoses, and B12 and B6 were inversely associated with prediabetes. | There is an association between low values of B vitamins and the risk of diabetes, especially in the population over 60 years of age. | Moderate | |
| Wilson et al., 2017 [84] | Cross-sectional study | 89 participants, including individuals with normal glucose tolerance (n = 35), prediabetes (n = 25), and DM2 managed with diet alone or a metformin-only regimen (n = 29). | Participants completed a four-day food diary. | Analyzing plasma vitamin C concentrations across the glycemic spectrum and investigating the correlation with indices of metabolic health in adults with glycemic conditions ranging from normal glucose tolerance (NGT) to those with DM2. | Vitamin C plasma concentrations were significantly lower in subjects with DM2 than in those with NGT (41.2 µmol/L versus 57.4 µmol/L, p < 0.05), and a higher rate of deficiency was observed of vitamin C (i.e., <11.0 µmol/L) in both the prediabetic and DM2 groups. Fasting glucose, BMI, smoking history and dietary vitamin C intake are predictor-significant independents of plasma vitamin C concentrations. | These results suggest that adults with a history of smoking, prediabetes or DM2, and/or obesity have higher vitamin C requirements. | Moderate | |
| (C) Vitamins and Prediabetes Review and Meta-Analysis | ||||||||
| Authors | Type of Study | Number of Studies | Subjects (Total) | End Point | Result | Conclusion | Strenght of Evidence | |
| Zhang Y. et al., 2020 [85] | Systematic review and meta-analysis | Eight eligible studies | Total of 4896 subjects | Evaluate whether vitamin D supplementation reduces the risk of developing type 2 diabetes in patients with prediabetes. | All eight studies reported the development of new-onset diabetes, particularly in 1022 (20.9%) of 4896 participants. Combining data from all eight studies, vitamin D supplementation reduced the incidence of new-onset diabetes by 11%. Reversion of prediabetes to normoglycemia occurred in 116 of 548 (21.2%) participants in the vitamin D group and 75 of 532 (14.1%) participants in the control group. | In people with prediabetes, vitamin D supplementation reduces the risk of T2DM and increases the rate of reversion of prediabetes to normoglycemia. | High | |
| Lind M.V. and al, 2019 [86] | Meta-analysis of RCTs | 29 studies (4 with crossover design and 25 with parallel design). | Total of 22,250 participants. | Investigate the effects of folate supplementation on the outcome of insulin resistance and diabetes, evaluating the effect of placebo-controlled folate supplementation, alone or in combination with other B vitamins, on fasting glucose, insulin, HOMA-IR, HbA1c, or risk of type 2 diabetes. | Compared with placebo, folate supplementation lowered fasting insulin and HOMA-IR, but no overall effects were observed for fasting glucose or HbA1c. Changes in homocysteine after folate supplementation correlated with changes in fasting glucose and HbA1c. | Folate supplementation might be beneficial for glucose homeostasis and lowering IR, but, at present, there are insufficient data to conclusively determine the effect on development of T2D. | High | |
| Ashor A.W. and al, 2017 [87] | Systematic review and meta-analysis of RCTs | 22 studies (16 with parallel design and 6 with crossover design). | Total of 937 participants. | Test the effect of vitamin C administration on glucose, HbA1c, and insulin concentrations and on insulin sensitivity. | Vitamin C did not change glucose, insulin, and HbA1c concentrations. Subgroup analyses showed that vitamin C significantly decreased glucose concentrations in patients with DM2. The analyses showed a better benefit of vitamin C administration on glycemia in those with a higher baseline BMI and glucose concentration, with the greatest effects in the longer duration studies. Positive effects were observed on fasting insulin concentration values. | The greatest reduction in glucose concentrations was observed in patients with diabetes, older individuals, and with more prolonged supplementation. | High | |
| Xu R. et al., 2014 [88] | Meta-analysis of RCTs | 14 RCTs (12 evaluated the effects on HbA1c, 12 on fasting glucose, 6 on fasting insulin). | 714 subjects (363 for the vitamin E group and 351 for the control group). | Characterize vitamin E impact (range of vitamin E administered 200–1600 IU/day, taken from 6 to 27 weeks) on HbA1c, fasting glucose, and fasting insulin. | Vitamin E supplementation did not lead to significant benefits in glycemic control, but subgroup analyses revealed significant reductions in HbA1c and fasting insulin versus controls in patients with low baseline vitamin E status. | There is insufficient evidence supporting a potential beneficial effect of vitamin E supplementation on improving HbA1c and fasting glucose and insulin concentrations in subjects with prediabetes. | High | |
| (A) Minerals and Prediabetes Interventional Studies | ||||||||
| Authors | Type of Study | Population Characteristics | Type of Intervention | Duration | End Point | Results | Conclusion | Strength of Evidence |
| Pittas, A.G. et al., 2007 [89] | Double-blinded randomized controlled trial | 314 Caucasian adults | Received, either 500 mg calcium citrate and 700 IU vitamin D(3), or placebos daily for 3 years | 3 years | Compare the effects of combined calcium and vitamin D supplementation versus placebo on blood glucose and markers of inflammation in nondiabetic adults aged > or =65 years. | Effects of combined calcium–vitamin D supplementation on 3-year change in FPG depended on baseline FPG (p = 0.02 for interaction). Among participants with IFG at baseline, those who took combined calcium–vitamin D supplements had a lower rise in FPG at 3 years compared with those on placebo (0.02 mmol/L [0.4 mg/dL] vs. 0.34 mmol/L [6.1 mg/dL], respectively, p = 0.042) and a lower increase in HOMA-IR (0.05 vs. 0.91, p = 0.031). | In healthy, older adults with IFG, supplementation with calcium and vitamin D may attenuate increases in glycemia and insulin resistance that occur over time. | High |
| Ali, A. et. al., 2011 [90] | Double-blind randomized controlled trial | 59 adult with IFG | Randomized, double-blind, placebo-controlled, modified cross-over clinical trial. Participants received six-month sequences of chromium picolinate or placebo at one of two dosages (500 or 1000 mcg daily). | Six months | To investigate the effects of daily chromium picolinate supplementation on serum measures of glucose tolerance and insulin sensitivity in patients at high risk for type 2 diabetes mellitus. | No changes were seen in glucose level, insulin level, or HOMA-IR (all p > 0.05) after six months of chromium at either dosage level (500 mcg or 1000 mcg daily) when compared with placebo. | Chromium supplementation does not appear to ameliorate insulin resistance or impaired glucose metabolism in patients at risk for type 2 diabetes and, thus, is unlikely to attenuate diabetes risk. | High |
| (B) Minerals and Prediabetes Observational Studies | ||||||||
| Authors | Type of Study | Population Characteristics | Type of Intervention | Duration | End Point | Results | Conclusion | Strength of Evidence |
| Zhou, Q. et al., 2019 [91] | Cross-sectional Study | Patients with IFG (n = 12), IGT (n = 15), T1D (n = 25), T2D (n = 137), and healthy controls (n = 50) | Se was detected using inductively coupled plasma spectrometer. | / | This study investigated serum and urinary Se levels in patients with impaired fasting glucose (IFG), impaired glucose tolerance (IGT), type 1 diabetes (T1D), and type 2 diabetes (T2D) in northeast Chinese populations. | The serum Se level was dramatically lower in patients with T1D and was significantly higher in IFG subjects, and the urinary Se concentration was markedly lower in IGT and T2D groups. The serum Se levels were positively correlated with serum zinc (Zn) in both IFG and IGT groups, while urinary Se were positively associated with urinary Zn and copper (Cu) in IGT group. | The serum Se levels were positively correlated with serum Cu in both T1D and T2D groups, and urinary levels of Se were positively associated with serum zinc and urinary Cu, Zn, calcium (Ca), and magnesium (Mg) and negatively correlated with serum Ca and Mg in T2D group, while the urinary levels of Se were positively correlated with urinary Zn and Mg both in peripheral neuropathy (DPN) and retinopathy (DR) groups. | Moderate |
| Xu, J. et al., 2013 [92] | Cross-sectional study | Patients with type 1 diabetes (T1D, n = 25), type 2 diabetes (T2D, n = 137), impaired fasting glucose (IFG, n = 12) or impaired glucose tolerance (IGT, n = 15), and age/gender matched controls (n = 50) | / | The association of copper and zinc levels in the serum or urine of patients living in northeast China, with either prediabetes or diabetes | Serum copper levels were significantly higher in IFG, IGT, and T2D groups. Serum zinc level was dramatically lower, and urinary zinc level was significantly higher in both T1D and T2D subjects compared with controls. | Simvastatin treatment in T2D patients had no significant effect on serum and urinary copper and zinc. These results suggest the need for further studies of the potential impact of the imbalanced serum copper and zinc levels on metabolic syndrome, diabetes, and diabetic complications. | Moderate | |
| Hruby, A. et al., 2014 [93] | Prospective cohort study | 2582 community-dwelling participants 26–81 years old at baseline | 7 years | To assess 7-year associations between magnesium intake and incident prediabetes and/or insulin resistance (IR), and progression from these states to type 2 diabetes | Higher magnesium intake tended to be associated with lower follow-up FG and IR, but not fasting insulin, postload values, or insulin sensitivity. | Magnesium intake may be particularly beneficial in offsetting risk of developing diabetes among those at high risk. Magnesium’s long-term associations with non-steady-state (dynamic) measures deserve further research. | Moderate | |
| Kieboom, B.C.T. et al., 2017 [94] | Retrospective cohort study | 8555 participants (mean age, 64.7 years; median follow-up, 5.7 years) with normal glucose levels (mean ± SD: 5.46 ± 0.58 mmol/L) at baseline | Study the directionality of the association between serum magnesium levels and diabetes | A 0.1 mmol/L decrease in serum magnesium level was associated with an increase in diabetes risk (HR 1.18 [95% CI 1.04, 1.33]); similar association was found between serum magnesium levels and prediabetes risk (HR 1.12 [95% CI 1.01, 1.25]) | Low serum magnesium levels are associated with an increased risk of prediabetes and this increased risk is similar to that of diabetes. | Moderate | ||
| Guerrero-Romero, F. et al., 2008 [95] | Prospective cohort study | 1122 individuals (20–65 years of age) were enrolled between 1996 and 1997, and 817 individuals re-examined about 10 years later | New-onset IFG (5.6–7.0 mmol L−1 fasting glucose), IGT (7.8–11.1 mmol L−1 glucose 2-h postload), and type 2 diabetes were determined from the number of subjects who had these conditions at the second examination without evidence that they were present at the first one. | 10 years | To examine the association between serum magnesium levels and the risk for developing IFG, IGT, and type 2 diabetes | New-onset IFG and IGT was identified in 276 (33.8%) individuals. The relative risk for IFG, IGT, and IFG + IGT was 1.11 (95% confidence interval, 0.5–5.1), 1.38 (95% confidence interval, 1.1–6.3), and 1.49 (95% confidence interval, 1.1–4.9), respectively. New-onset diabetes was identified in 78 (9.5%) individuals (relative risk 2.54; 95% confidence interval, 1.1–4.1). | Hypomagnesaemia is independently associated with the development of IGT, IFG + IGT, and type 2 diabetes, but not with the development of IFG | Moderate |
| Wu, F. et al., 2019 [96] | Prospective cohort study | 1134 subjects; age 3 to 18 years at baseline | Dietary calcium intake was assessed at baseline (1980) and adult follow-up visits (2001, 2007, and 2011). Long-term (mean between youth and adulthood) dietary calcium intake was calculated. | 31 years | Examine whether youth and long-term (between youth and adulthood) dietary calcium intake is associated with adult impaired glucose metabolism and type 2 diabetes (T2D). | No evidence for nonlinear associations between calcium intake and IFG or T2D among females and males (all p for nonlinearity > 0.05). Higher youth and long-term dietary calcium intake was not associated with the risk of IFG or T2D among females or males | Youth or long-term dietary calcium intake is not associated with adult risk of developing impaired glucose metabolism or T2D | Moderate |
| Alissa, E.M. et al., 2009 [97] | Cross-sectional study | 130 Saudi men with an established history of myocardial infarction and 130 age-matched controls without established CVD | Measured serum and urine chromium concentrations, fasted lipid profile, plasma glucose, and serum lipid peroxide | To investigate chromium status among Saudi men with and without established cardiovascular disease (CVD) and its relationship to glucose tolerance, lipid profile, and other established CVD risk factors | Patients with established CVD had higher serum triglycerides (p < 0.05) and plasma glucose (p < 0.0001) and lower serum and urinary chromium concentrations (p < 0.0001) than controls. Serum chromium was inversely correlated with plasma glucose among cases and controls (r = −0.189, p < 0.05 and r = −0.354, p < 0.00001, respectively). | While chromium metabolism appears to be altered in individuals with CVD, it is unclear whether chromium supplementation would be effective in CVD prevention among patients with IGT. | Moderate | |
| (C) Minerals and Prediabetes Reviews and Meta-Analysis | ||||||||
| Authors | Type of Study | Population Characteristics | Type of Intervention | End Point | Results | Conclusion | Strength of Evidence | |
| Capdor, J. et al., 2013 [98] | Meta-analysis | 3978 subjects were included in the meta-analysis. | A systematic review and meta-analysis of randomized placebo-controlled trials was conducted. | To determine the effect of zinc supplementation on fasting blood glucose, HbA1c, serum insulin, and serum zinc concentrations. | A small but statistically significant reduction in fasting glucose concentrations was observed (−0.19 ± 0.08 mmol/L, p = 0.013) after zinc supplementation. HbA1c tended to decrease in zinc-supplemented individuals (−0.64 ± 0.36%, p = 0.072). No significant effect was observed for serum insulin concentrations. | The significant, albeit modest, reduction in glucose concentrations and tendency for a decrease in HbA1c following zinc supplementation suggest that zinc may contribute to the management of hyperglycemia in individuals with chronic metabolic disease. | High | |
| Wang X. et al., 2019 [99] | Meta-analysis | Thirty-two placebo-controlled interventions were extracted from 36 publications, involving a total of 1700 participants in 14 countries. | Zinc supplementation. | To assess the effects of zinc supplementation in preventing and managing diabetes. | The subjects in the zinc-supplementation group had a statistically significant reduction in fasting glucose [FG, weighted mean difference (WMD): −14.15 mg/dL; 95% CI: −17.36, −10.93 mg/dL], 2 h postprandial glucose (WMD: −36.85 mg/dL; 95% CI: −62.05, −11.65 mg/dL), fasting insulin (WMD: −1.82 mU/L; 95% CI: −3.10, −0.54 mU/L), homeostasis model assessment for insulin resistance (WMD: −0.73; 95% CI: −1.22, −0.24), glycated hemoglobin (WMD: −0.55%; 95% CI: −0.84, −0.27%), and high-sensitivity C-reactive protein (WMD: −1.31 mg/L; 95% CI: −2.05, −0.56 mg/L) concentrations. | Several key glycemic indicators are significantly reduced by zinc supplementation, particularly, the FG in subjects with diabetes and in subjects who received an inorganic zinc supplement. | High | |
| Althuis, M.D. et al., 2002 [100] | Meta-analysis | This review summarizes data on 618 participants from the 15 trials. | To determine the effect of chromium on glucose and insulin responses in healthy subjects and in individuals with glucose intolerance or type 2 diabetes. | The meta-analysis showed no association between chromium and glucose or insulin concentrations among nondiabetic subjects. Three trials reported data on Hb A(1c): one study each of persons with type 2 diabetes, persons with impaired glucose tolerance, and healthy subjects. | Data from RCTs show no effect of chromium on glucose or insulin concentrations in nondiabetic subjects. The data for persons with diabetes are inconclusive. | High | ||
| Wang, Z.Q. et al., 2010 [101] | Narrative review | Chromium supplementation in type 2 diabetes and insulin resistance. | A consistent significant and beneficial effect of chromium may not be observed. Specifically, recent data fail to demonstrate significant improvement in carbohydrate metabolism in individuals with metabolic syndrome, impaired glucose tolerance, or consistently in individuals with type 2 diabetes. | Low | ||||
| Authors | Type of Study | Population Characteristics | Type of Intervention | Duration | End Point | Results | Conclusion | Strength of Evidence |
|---|---|---|---|---|---|---|---|---|
| Liu Y et al., 2023 [102] | Multistage cross-sectional study | A total of 23,825 subjects (7427 with prediabetes). | Data from the U.S. National Health and Nutrition Examination Surveys. Bone mineral density and the skeletal muscle mass index (SMI) were measured with dual-energy X-ray absorptiometry (DXA). | Data from 2009 to 2018 | Investigate the effect of sarcopenia, osteoporosis and osteosarcopenia on spine fracture in patients with prediabetes. | Regarding bone health, the lumbar and spinal bone mineral density of the prediabetes group was lower than in the healthy group, while there were no differences between diabetic and healthy subjects. The prevalence of osteoporosis was higher in diabetics than in prediabetics, and higher in the latter than in healthy subjects. | Osteoporosis is a risk factor for spine fracture in prediabetic adults and the combination of sarcopenia and osteoporosis further increases the prevalence of spine fracture. | Moderate |
| (A) Fruits and Vegetables and Prediabetes Observational Studies | ||||||||
| Authors | Type of Study | Population Characteristics | Type of Intervention | Duration | End Point | Results | Conclusion | Strength of Evidence |
| Barouti et al., 2022 [103] | Cohort prospective study | 6961 men and women, aged between 35 and 56 | Questionnaire for diet assessment | 20 years | To establish a relationship between consumption of fruit and vegetables and the development of dysglycemia. | An inverse relationship was seen between fruit and vegetable consumption and the development of dysglycemia. | Increasing fruits and vegetables in the diet reduces the risk of dysglicemia (HR: 0.86) | High |
| Li et al., 2023 [104] | Cohort prospective study | 79,922 patients aged over 40 years | Questionnaire for diet assessment | Four years | To establish a relationship between consumption of fruit and vegetables and the development of dysglycemia. | The risk of development of dysglycemia decreased especially in normoglycemic patients in whom the consumption of more than seven portions of fruit per week decreased the risk of developing diabetes by 48%. | Increasing fruits and vegetables in the diet reduces the risk of dysglycemia | High |
| Wu et al., 2021 [105] | Cross-sectional study | 6802 participants between 18 and 65 years old | Questionnaire for diet assessment | To establish a relationship between diet and the development of DM2 or IFG. | A reduction in the risk of prediabetes was seen with a consumption of fruit and vegetables corresponding to the third and fourth quartile, i.e., between 320 and 530 g (vegetables + fruit/day). | Increasing fruits and vegetables in the diet reduces the risk of dysglycemia | High | |
| Zhang et al., 2022 [106] | Cohort prospective study | 18,085 participants who at baseline had neither diabetes nor prediabetes or other CVD nor cancer | Questionnaire for diet assesment | 63,175 person-years | To establish a relationship between the consumption of fiber and DM2 or IFG. | 4139 cases of diabetes occurred. | Fiber intake was inversely related to the incidence of prediabetes. The type of fiber that was found to be most effective in preventing prediabetes is soluble fiber, mostly found in fruit and vegetables. | High |
| Lopez Ridarura et al., 2004 [107] | Cohort prospective study | 85,060 women and 42,872 men | Magnesium intake was evaluated using a validated food-frequency questionnaire every 2–4 years | 18 years | To establish if magnesium intake could reduce the risk of developing diabetes mellitus. | Magnesium reduces the risk of diabetes. | The results of this study confirmed the inverse association between magnesium intake and diabetes risk | High |
| (B) Fruits and Vegetables and Prediabetes Review and Meta-Analysis | ||||||||
| Authors | Type of Study | Number of Studies | Subjects (Total) | End Point | Result | Conclusion | Strenght of Evidence | |
| Min Li et al., 2014 [108] | Meta-analysis and systematic review of prospective cohort studies | A total of 10 articles including 13 comparisons with 24,013 cases of type 2 diabetes | 434,342 participants | To assess the relationship between fruit and vegetable consumption and the risk of developing diabetes | Evidence of curve linear associations was seen between fruit and green leafy vegetables consumption and risk of type 2 diabetes. | Higher fruit or green leafy vegetables intake is associated with a significantly reduced risk of type 2 diabetes. | High | |
| Authors | Type of Study | Population Characteristics | Type of Intervention | Duration | End Point | Results | Conclusion | Strength of Evidence |
|---|---|---|---|---|---|---|---|---|
| Gulati et al., 2022 [109] | RCT with two parallel groups | 66 participants with prediabetes in the range of 18–60 years. | The effects of a dose of 20 g of almonds before lunch and dinner was evaluated. | Three months | To evaluate the risk of prediabetes and DM2. | The intake of almonds before main meals would therefore seem to help in the prevention of the evolution from prediabetes to frank diabetes. | Eating almonds before meals can help reduce the risk of DM2 and IFG. | High |
| Casas-Agustench P. et al., 2011 [110] | Randomized parallel-group study | 50 patients with metabolic syndrome were instructed to consume 30 g of dried fruit per day. | People were instructed to consume 30 g of dried fruit per day (15 g walnuts, 7.5 g almonds, 7.5 g hazelnuts). | 12 weeks | To evaluate the effects of nuts in inflammatory markers and HOMA index. | The nut group reduced fasting insulin by 2.60 μU/mL (95% CI, −4.62 to −0.59) and HOMA by 0.72 (−1.28 to −0.16) (p < 0.05). Among inflammatory markers, IL6 levels decreased by 1.1 ng/mL. | Eating nuts seems to reduce HOMA index and inflammatory markers. | High |
| Hou Y. et al., 2018 [111] | RCT | 32 patients with DM2. | 60 g/day peanuts for men and 50 g/day for women in the Peanut group, and 55 g/day almonds for men and 45 g/day for women in the Almond group. | Three months | To evaluate the relationship with peanuts and almonds in the diet and BMI and glycometabolic patterns. | There were significant pre-post changes in fasting and postprandial blood glucose (p < 0.05). The glycated value was reduced in the almond group (p < 0.05). | Introducing in the diet of peanuts and almonds can improve glycometabolic patterns. | High |
| Wien M. et al., 2010 [112] | Randomized parallel-group study | 65 people with prediabetes. | Almond intake was approximately 20% of the daily caloric intake, approximately 60 g/day. | 16 weeks | To evaluate the relationship with almonds in the diet and BMI and glycometabolic patterns. | The intervention group showed both a reduction in insulin HOMA IR and HOMA 2B compared with the control group without almonds. | Introducing in the diet of almonds can improve glycometabolic patterns and can help reduce insulin resistance. | High |
| Lu et al., 2021 [113] | Randomized crossover study | Ten overweight Chinese men with a mean age of 47.9 years. | Ingestion of a nut-based, high-protein snack bar or an isocaloric bar contain more carbohydrates. The bar used contained a caloric quantity of about 1000 KJ. | 0–120 min | Evaluate the glycemic response in a 2 h window with two different bars. | In the patients who received the bar rich in dried fruit, there was a reduction in blood sugar (p < 0⋅05) in the 30–120 min after ingestion of both the bar alone and the bar associated with 50 g of white bread (a food that normally raises blood sugar), with an area under the glycemic curve 10 times lower. | The nut bar can reduce postprandial glycemia. | High |
| (A) Plain Water and Prediabetes Interventional Studies | ||||||||
| Authors | Type of Study | Population Characteristics | Type of Intervention | Duration | End Point | Results | Conclusion | Strength of Evidence |
| Carroll et al., 2015 [114] | Cross-sectional study | 138 adult subjects | The risk of DM2, blood pressure, fruit and vegetable intake, and beverage intake were evaluated. The DM2 risk score was calculated using the Diabetes UK risk assessment tool validated for use in the UK. Dietary variables were assessed using an FFQ. Water was measured in beakers and one beaker equaled 240 mL. | The past seven days | Investigate the correlation between water intake and risk of developing type 2 diabetes mellitus in an adult population in the United Kingdom. | Water intake was negatively correlated with the risk of developing DM2. A trend of low water consumption emerged in groups classified as high-risk for DM2. The analyses showed that each 240 mL portion of water drunk per day was associated with a 0.72-point decrease in the risk of DM2. The mean risk reduction in each participant was 1.7 points. | A negative correlation was observed between water intake and risk score, suggesting that water intake may play a significant role in the development and prevention of DM2. | Moderate |
| Carroll et al., 2016 [115] | Cross-sectional study | Total of 1035 subjects (456 men and 579 women, with an average age of 44 years) | Data includes a 4-day food diary and HbA1c values from blood sampling. The analyses used linear and logistic regressions stratified by gender modeling the associations of glasses per day (240 mL) of still water with HbA1c and probabilities of HbA1c ≥ 5–5%, respectively. Sugary drinks, fruit juices, and artificially sweetened drinks have been transformed with modeling systems into still water. | From 2008 to 2012 | Analyze the association between simple water intake and HbA1c trend in the National Diet and Nutrition Survey (2008–2012) rolling survey. | 1 glass/day of water was found to be associated with a reduction in HbA1c of −0–4% in men and men had a 22% reduced chance of HbA1c ≥ 5–5%/day cup of plain water. Still water intake was associated with lower HbA1c in men but not in women. | Water can be specifically associated with a reduction in the risk of DM2 and that intake of simple water and the right hydration are very important in the prevention or influence on the evolution of prediabetes into diabetes. | Moderate |
| (B) Sugary Beverages and Prediabetes Interventional Studies | ||||||||
| Authors | Type of Study | Population Characteristics | Type of Intervention | Duration | End Point | Results | Conclusion | Strength of Evidence |
| Maersk M. et al., 2012 [116] | Randomized intervention study | Overweight subject (n = 47) | Subject randomly assigned to four different test drinks
| Six months | To compare the effects of sucrose-sweetened soft drinks (SSSDs) with those of isocaloric milk and a noncaloric soft drink on changes in total fat mass and ectopic fat deposition (in liver and muscle tissue). | The relative changes between baseline and the end of 6-month intervention were significantly higher in the regular cola group than in the three other groups for liver fat (132–143%, sex-adjusted mean; p < 0.01), skeletal muscle fat (117–221%; p < 0.05), visceral fat (24–31%; p < 0.05), blood triglycerides (32%; p < 0.01), and total cholesterol (11%; p < 0.01). Total fat mass was not significantly different between the four beverage groups. | Daily intake of SSSDs for 6 mo increases ectopic fat accumulation and lipids compared with milk, diet cola, and water. Thus, daily intake of SSSDs is likely to enhance the risk of cardiovascular and metabolic diseases. | High |
| Raben A. et al., 2002 [117] | Randomized controlled trial | Overweight men and women (sucrose group n = 21, mean BMI 28 kg/m2; sweeteners group n = 20, mean BMI 27.6 kg/m2) | Subjects consumed daily supplements of either sucrose or artificial sweeteners. | 10 weeks | To investigate the effect of long-term supplementation with drinks and foods containing either sucrose or artificial sweeteners on ad libitum food intake and body weight in overweight subjects. | Body weight and fat mass increased in the sucrose group (by 1.6 and 1.3 kg, respectively) and decreased in the sweetener group (by 1.0 and 0.3 kg, respectively); the between-group differences were significant at p < 0.001 (body weight) and p < 0.01 (fat mass). | Overweight subjects who consumed fairly large amounts of sucrose (28% of energy), mostly as beverages, had increased energy intake, body weight, fat mass, and blood pressure after 10 wk. These effects were not observed in a similar group of subjects who consumed artificial sweeteners. | High |
| (C) Sugary Beverages and Prediabetes Observational Studies | ||||||||
| Authors | Type of Study | Population Characteristics | Type of Intervention | Duration | End Point | Results | Conclusion | Strength of Evidence |
| Sylvetsky A.C. et al., 2017 [118] | Cross-sectional study using National Health and Nutrition Examination Survey data from 2009 to 2012 | The final sample size was 16,942 | / | Three years | To describe low-calorie sweetener (LCSs) consumption in the United States and to characterize consumption by sociodemographic subgroups, source, frequency, eating occasion, and location. | LCS consumption was higher in females compared with males among adults. Individuals of non-Hispanic white race/ethnicity also had higher prevalence of consumption compared with non-Hispanic blacks and Hispanics and those in the highest tertile of income had higher LCS consumption compared with individuals of middle or low income across LCS product categories in adults, and for LCS beverages and LCS foods in children. | LCS consumption is highly prevalent in the United States, among both children and adults. Well-controlled, prospective trials are required to understand the health impact of this widespread LCS exposure. | Medium |
| (D) Sugary Beverages and Prediabetes Reviews, Meta-Analyses, and Guidelines | ||||||||
| Authors | Type of Study | Number of Studies | Subjects (Total) | End Point | Result | Conclusion | Strenght of Evidence | |
| Drouin-Chartier et al., 2019 [119] | Meta-analysis. | Three large prospective cohort studies. | 76,531 women in the Nurses’ Health Study (1986–2012); 81,597 women in the Nurses’ Health Study II (1991–2013); 34,224 men in the Health Professionals’ Follow-up Study (1986–2012). | Investigate the association between long-term changes due to the consumption of sugary drinks (including 100% fruit juices) and drinks containing artificial sweeteners (ASBs) and the consequent risk of DM2. | Over 2,783,210 person-years of follow-up, 11,906 incident cases of DM2 are documented. Increase in total consumption of sugar-sweetened beverages by >0.5 servings per day over four years was associated with a 16% higher risk of DM2 in the following four years. Increasing ASB consumption by > 0.5 servings per day was associated with an 18% higher risk of DM2. Replacing a daily serving of sugary drink with water, coffee or tea was associated with a 2–10% lower risk of DM2. | Increased consumption of sugary drinks or ASB was associated with a higher risk of DM2, although the latter association may be influenced by reverse causality and surveillance biases. | High | |
| Toews I. et al., 2018 [120] | Systematic review and meta-analysis of randomized and non-randomized CT and observational studies | 56 studies included (21 RCT, 35 observational studies | / | To assess the association between intake of non-sugar sweeteners (NSSs) and important health outcomes in generally healthy or overweight/obese adults and children. | In adults, evidence of very low and low certainty from a limited number of small studies indicated a small beneficial effect of NSSs on fasting blood glucose (−0.16 mmol/L, −0.26 to −0.06; two, n = 52). | Most health outcomes did not seem to have differences between the NSS exposed and unexposed groups. Of the few studies identified for each outcome, most had few participants and were of short duration, and their methodological and reporting quality was limited; therefore, confidence in the reported results is limited. | High | |
| WHO [121] | Guideline from WHO | / | / | Evidence-informed guidance on the use of non-sugar sweeteners to reduce the risk of unhealthy weight gain and diet-related noncommunicable diseases in adults and children. | / | This guideline includes a recommendation on the use of non-sugar sweeteners which can be used by policy-makers and programme managers to address non-sugar sweetener use in their populations through a range of policy actions and public health interventions. | High | |
| ElSayed N.A. et al., 2023 [122] | ADA Standards of Care in Diabetes | / | / | Provide the components of diabetes care, general treatment goals and guidelines, and tools to evaluate quality of care. | / | / | High | |
| Franz J.M. et al., 2017 [123] | Systematic review | 60 studies met the inclusion criteria (18 RCTs, 1 nonrandomized clinical study, 3 cohort studies | / | Evidence for medical nutrition therapy effectiveness and recommendations for integration into the nutrition care process. | The systematic review for the Academy’s Nutrition Practice Guideline for Diabetes Type 1 and Type 2 in Adults reviewed 13 subtopics with 19 questions. | Strong evidence supports the effectiveness of medical nutrition therapy/MNT) provided by registered dietitian nutritionists (RDNs) on HbA1c with decreases up to 2.0% at 3 months, and with ongoing MNT support, decreases were maintained or improved long-term. | High | |
| Hedrick V.E. et al., 2023 [124] | Narrative review | / | / | Current evidence on non-sugar sweetener intake is inadequate, and further research is needed to determine the health effects of individual non-sugar sweeteners, especially in specific population subgroups. | Research examining non-sugar sweeteners as a single entity provides unclear findings related to their health effects, especially for obesity, weight management, glycemic control, and other cardiometabolic disease risk factors. | Low | ||
| (A) Alcohol and Prediabetes Interventional Studies | ||||||||
| Authors | Type of Study | Population Characteristics | Type of Intervention | Duration | End Point | Results | Conclusion | Strength of Evidence |
| Gepner et al., 2015 [125] | Randomized controlled trial | 224 subjects | Three groups: one group to drink 150 mL of mineral water at dinner, another 150 mL of white wine, and, finally, 150 mL of red wine. | Two years | To establish any effects of wine on metabolic and diabetes blood markers. | No significant differences among groups, except for red wine which can reduce the risk of metabolic syndrome. | Red wine in moderate consumption can reduce the risk of metabolic syndrome. | High |
| (B) Alcohol and Prediabetes Obervational Studies | ||||||||
| Authors | Type of Study | Population Characteristics | Type of Intervention | Duration | End Point | Results | Conclusion | Strength of Evidence |
| Luz P et al., 2014 [126] | Case–control study | T205 people healthy males between the ages of 50 and 75. | Two groups of people were retrospectively compared, 101 people drinking red wine and 104 with complete abstinence from alcohol. | Five years | To evaluate the effects of red wine on glycometabolic patterns. | Drinking one glass of red wine a day has led to better glycometabolic parameters. | Drinking one glass of red wine is beneficial in preventing T2DM. | Moderate |
| Blomster et al., 2014 [127] | Prospective cohort study | 11,140 people with type 2 diabetes mellitus | To define groups based on their alcohol consumption. | Five years | To establish the risk of complications in people with different levels of alcohol consumption. | Those who consumed moderate alcohol saw a reduction in cardiovascular events, fewer micro-vascular complications, and reduced all-cause mortality. | Moderate alcohol consumption is beneficial for all-cause mortality. | Moderate |
| Li et al., 2022 [128] | Cohort study | 15,726 participants | Groups based on daily alcohol consumption. | Four years | To assess the association between the average consumption of alcohol with the incidence of type 2 diabetes mellitus. | Occasional or moderate alcohol use was not associated with risk of hyperglycemia, while high consumption increased the incidence of dysglycemia. | High alcohol consumption is detrimental, while moderate consumption is not associated with risk of dysglycemia. | Moderate |
| Cullman et al., 2011 [129] | Cohort study | 2070 men and 3058 women with normoglycemia and 70 men and 41 women with prediabetes | Groups based on alcohol consumption in quantity and quality. | 8–10 years of follow-up | To evaluate the effect on glycometabolic patterns of different types and dosages of alcoholic beverages. | Both women and men had higher risk with heavy alcohol consumption. | Heavy alcohol consumption is detrimental for both sexes. | Moderate |
| Suebsamran et al., 2016 [130] | Cross-sectional analytical study | 383,442 patients | Enrolled were divided into six different groups based on the amount of alcohol consumed. | Relationship between alcohol consumption and prediabetes. | After adjustment for other risk factors, alcohol consumption was independently associated with prediabetes, with dose–response relationship. | The more the alcohol consumption, the more the risk of prediabetes. | Moderate | |
| (C) Alcohol and Prediabetes Review and Meta-Analysis | ||||||||
| Authors | Type of Study | Number of Studies | Subjects (Total) | End Point | Result | Conclusion | Strenght of Evidence | |
| Baliunas et al., 2009 [131] | Meta-analysis | 20 cohort studies | 477,200 individuals | To establish a relationship between alcohol consumption and diabetes type 2. | Our analysis confirms previous research findings that moderate alcohol consumption is protective for type 2 diabetes in men and women. | Moderate alcohol consumption is beneficial for preventing the risk of diabetes. | High | |
| (A) Coffee and Prediabetes Interventional and in Vitro Studies | ||||||||
| Authors | Type of study | Population Characteristics | Type of Intervention | Duration | End Point | Results | Conclusion | Strength of Evidence |
| Arion, W.J. et al., 1997 [132] | In vitro study | The interactions of chlorogenic acid (CHL) and 2-hydroxy-5-nitrobenzaldehyde (HNB) with the components of the rat hepatic glucose 6-phosphatase (Glc-6-Pase) system | CHL is without effect on the enzyme of fully disrupted microsomes or the system inorganic pyrophosphatase (PPiase) activity. HNB is a potent competitive inhibitor of the system PPiase activity (Ki = 0.56 mm) and a somewhat weaker noncompetitive inhibitor of enzyme activity (Ki = 2.1 mm). | The presence of CHL effectively protects T1, but not T2, against the irreversible inhibition by HNB. In contrast, PPi and Pi are effective in protecting T2, but not T1. | Low | |||
| Yanagimoto, A. et al., 2023 [133] | RCT randomized, double-blind, placebo-controlled crossover study | Study 1 (n = 18) evaluated two doses of GTC (270 or 540 mg) containing a fixed dose of CCA (270 mg) with 113 mg of caffeine and a placebo (0 mg GTC and 0 mg CCA) with 112 mg of caffeine. Study 2 (n = 18) evaluated two doses of CCA (150 or 300 mg) containing a fixed dose of GTC (540 mg) and a placebo with 99 mg of caffeine. | One year | Examined the effective dose of GTC and CCA on postprandial glucose, insulin, and incretin responses to a high-fat and high-carbohydrate cookie meal containing 75 g of glucose in healthy men. | The single combined ingestion of GTC and CCA significantly altered the incretin response and suppressed glucose and insulin levels. | These findings suggest that the effective minimum dose is 540 mg of GTC and 150 mg of CCA | High | |
| (B) Coffee and Prediabetes Observational Studies | ||||||||
| Authors | Type of Study | Population Characteristics | Type of Intervention | Duration | End Point | Results | Conclusion | Strength of Evidence |
| Sakhi A. et al., 2004 [134] | Cross-sectional study | A group of 61 adults with corresponding plasma samples and data from a nationwide survey of 2672 Norwegian adults based on an extensive FFQ. | To determine the contribution of various food groups to total antioxidant intake, and to assess the correlations of the total antioxidant intake from various food groups with plasma antioxidants. | The total intake of antioxidants was approximately 17 mmol/d with beta-carotene, alpha-tocopherol, and vitamin C contributing <10%. The intake of coffee contributed approximately 11.1 mmol. | Dietary antioxidants other than the well-known antioxidants contribute to our antioxidant defense. Surprisingly, the single greatest contributor to the total antioxidant intake was coffee. | Moderate | ||
| (C) Coffee and Prediabetes Reviews and Meta-Anaylisis | ||||||||
| Authors | Type of Study | Population Characteristics | Type of Intervention | Duration | End Point | Results | Conclusion | Strength of Evidence |
| Poole, R. et al., 2017 [135] | Meta-analysis | 201 meta-analyses of observational research with 67 unique health outcomes and 17 meta-analyses of interventional research with nine unique outcomes. | Umbrella review of the evidence across meta-analyses of observational and interventional studies of coffee consumption and any health outcome. | To evaluate the existing evidence for associations between coffee consumption and multiple health outcomes. | There was evidence of a non-linear association between consumption and some outcomes, with summary estimates indicating largest relative risk reduction at intakes of three to four cups a day versus none, including all-cause mortality (relative risk 0.83 (95% confidence interval 0.79 to 0.88), cardiovascular mortality (0.81, 0.72 to 0.90), and cardiovascular disease (0.85, 0.80 to 0.90). | Coffee consumption seems generally safe within usual levels of intake, with summary estimates indicating largest risk reduction for various health outcomes at three to four cups a day, and is more likely to benefit health than harm. | High | |
| Ding, M. et al., 2014 [136] | Dose–response meta-analysis | Twenty-eight prospective studies were included in the analysis, with 1,109,272 study participants and 45,335 cases of type 2 diabetes. | The follow-up duration ranged from 10 months to 20 years. | Association of coffee consumption with the risk of type 2 diabetes. | Compared with no or rare coffee consumption, the relative risk (RR; 95% CI) for diabetes was 0.92 (0.90–0.94), 0.85 (0.82–0.88), 0.79 (0.75–0.83), 0.75 (0.71–0.80), 0.71 (0.65–0.76), and 0.67 (0.61–0.74) for 1–6 cups/day, respectively. The RR of diabetes for a 1 cup/day increase was 0.91 (0.89–0.94) for caffeinated coffee consumption and 0.94 (0.91–0.98) for decaffeinated coffee consumption (p for difference = 0.17). | Coffee consumption was inversely associated with the risk of type 2 diabetes in a dose–response manner. Both caffeinated and decaffeinated coffee was associated with reduced diabetes risk. | High | |
| Van Dam, R.M., 2008 [137] | Narrative review | / | / | / | This paper briefly reviews the evidence for a relation between coffee consumption and these conditions, with particular attention to methodological issues. | Several early studies suggested that coffee consumption could result in a marked increase in risk of coronary heart disease and several types of cancer. High consumption of unfiltered types of coffee, such as French press and boiled coffee, has been shown to increase low-density-lipoprotein-cholesterol concentrations. In addition, limiting caffeinated coffee intake during pregnancy seems a prudent choice. | In sum, the currently available evidence on coffee and risk of cardiovascular diseases and cancer is largely reassuring, and suggests that, for the general population, addressing other health-related behaviors has priority for the prevention of chronic diseases. | Low |
| Meng, S. et al., 2013 [138] | Narrative review | Roles of chlorogenic acid on regulating glucose and lipids metabolism. | Chlorogenic acid (CGA) exerts many biological properties, including antibacterial, antioxidant, and anticarcinogenic activities. | The mechanism on glucose and lipid metabolism has not yet been conclusively elucidated. | Low | |||
| (A) Physical Activity and Prediabetes Interventional Studies | ||||||||
| Authors | Type of Study | Population Characteristic | Type of Intervention | Duration | End Point | Result | Conclusion | Strength of Evidence |
| Jung M.E. et al., 2015 [139] | RCT | 32 inactive individuals with prediabetes between the ages of 30 and 60 years. | 15 individuals received HIIT and 17 individuals received MICT one-month follow-up testing. | After completing 10 sessions of supervised training participants were asked to perform HIIT or MICT three times per week for four weeks. | To compare self-report and objective measures of physical activity after one month of independent exercise in individuals with prediabetes who were randomized to HIIT (n = 15) or traditional moderate-intensity continuous training (MICT, n = 17). | Individuals in HIIT (89 ± 11%) adhered to their prescribed protocol to a greater extent than individuals in MICT (71 ± 31%). Minutes spent in vigorous physical activity per week measured by accelerometer were higher in HIIT (24 ± 18) as compared to MICT (11 ± 10) at one-month follow-up (p = 0.049, Cohen’s d = 0.92). Cardiorespiratory fitness and systolic blood pressure assessed at one-month follow-up were equally improved (p < 0.05). | This study provides preliminary evidence that individuals with prediabetes can adhere to HIIT over the short term and do so at a level that is greater than MICT. | High |
| (B) Physical Activity and Prediabetes, Review, and Meta-Analysis | ||||||||
| Authors | Type of Study | Number of Studies | Subjects | End Point | Results | Conclusion | Strength of Evidence | |
| Snowling N.J. et al., 2006 [140] | Meta-analysis | 27 eligible studies | 1003 type 2 diabetic patients (age 55 +/− 7 years) over 5–104 weeks. | Meta-analyze the effects of different modes of exercise training on measures of glucose control and other risk factors for complications of diabetes. | Differences among the effects of aerobic, resistance, and combined training on HbA(1c) (A1C) were trivial; for training lasting ≥ 12 weeks, the overall effect was a small beneficial reduction (A1C 0.8 +/− 0.3% [mean +/− 90% confidence limit]). There were generally small to moderate benefits for other measures of glucose control. Effects of covariates were generally trivial or unclear, but there were small additional benefits of exercise on glucose control with increased disease severity. | All forms of exercise training produce small benefits in the main measure of glucose control: A1C. The effects are similar to those of dietary, drug, and insulin treatments. The clinical importance of combining these treatments needs further research. | High | |
| De Nardi A.T. et al., 2018 [141] | Meta-analysis | 818 eligible studies | Seven studies were included in systematic review (64 prediabetes and 120 T2D patients) and five with T2D were meta-analyzed. | To compare the effects of high-intensity interval training (HIIT) versus moderate-intensity continuous training (MICT) on functional capacity and cardiometabolic markers. | No differences were found between two modalities of exercises considering the outcomes HbA1c, systolic and diastolic blood pressure, total cholesterol, HDL and LDL cholesterol, triglycerides, BMI, and waist-to-hip ratio. Most of the studies presented unclear risk of bias, and low and very low quality of evidence. | HIIT induces cardiometabolic adaptations similar to those of MICT in prediabetes and T2D, and provides greater benefits to functional capacity in patients with T2D. | High | |
| Jadhav R.A. et al., 2021 [142] | Systematic review and meta-analysis of randomized controlled trials | 1688 citations, 31 full-text articles assessed for eligibility of inclusion. Nine studies satisfied the pre-specified criteria for inclusion. | 1906 participants with the age group ranging from 20 to 70 years. All participants were diagnosed by either WHO or ADA. | Strengthen the evidence on the impact of physical activity promotion on inflammatory markers in prediabetes considering that the inflammatory stage in prediabetes is associated with increased levels of adipokines and pro-inflammatory cytokines. | Meta-analysis found that physical activity with or without dietary or lifestyle modification reduces level of leptin (MD −2.11 ng/mL, 95% CI −3.81–−0.42) and interleukin-6 (MD −0.15 pg/mL, 95% CI −0.25–−0.04). It has no effect on level of adiponectin (MD 0.26 µg/mL, 95% CI −0.42–0.93), C-reactive protein (MD −0.05 mg/L, 95% CI −0.33–0.23), and tumour necrosis factor-α (MD 0.67 pg/mL, 95% CI −2.56–3.89). | Physical activity promotion with dietary and lifestyle modification may reduce the level of leptin and interleukin-6, but we are uncertain if there is any effect on levels of adiponectin, C-reactive protein, and tumour necrosis factor-α in the individuals with prediabetes. | High | |
| (A) Dietary Supplementation With Probiotics and Prediabetes Observational Studies | ||||||||
| Authors | Type of Study | Population Characteristics | Type of Intervention | Duration | End Point | Results | Conclusion | Strength of Evidence |
| Qin J. et al., 2012 [143] | Case–control study | 123 patients with metabolic syndrome (MetS) and 304 controls | Whole-genome shotgun sequencing was used and approximately 60,000 type-2-diabetes-associated markers was identified | To determine whether the gut microbiome plays a role in MetS development and progression | Gut microbiomes of MetS patients possess significantly lower gut microbiome diversity. Microbiome changes in MetS patients may aggravate inflammation and contribute to MetS diseases by inhibiting the production of short-chain fatty acids (SCFAs). | Potential utility of beneficial gut microbiota as a potential therapeutic to alleviate MetS. | Moderate | |
| Larsen N. et al., 2010 [144] | Case–control study | 36 male adults with different ages and body-mass indices (BMIs), including 18 subjects with diabetes type 2 (DT2) | The fecal bacterial composition was investigated by real-time quantitative PCR (qPCR) and in a subgroup of subjects (n = 20) by tag-encoded amplicon pyrosequencing of the V4 region of the 16S rRNA gene. | To assess the differences between the composition of the intestinal microbiota in humans with type 2 diabetes and non-diabetic persons | The proportions of phylum Firmicutes and class Clostridia were significantly reduced in the diabetic group compared to control group. Bacteroidetes/Firmicutes ratios, as well as Bacteroides/Prevotella ratios, correlated positively and significantly with plasma glucose concentration but not with BMIs. Class Betaproteobacteria was highly enriched in diabetic compared to non-diabetic persons (p = 0.02) | DT2 in humans is associated with compositional changes in intestinal microbiota. | Moderate | |
| Tang W.H.W. et al., 2017 [145] | Prospective cohort study | Two cohorts: the first cohort comprises 1216 patients with T2DM, second cohort comprises 300 apparently healthy individuals ≥21 years old | Examination of relationship between fasting TMAO and two of its nutrient precursors, choline and betaine, vs. three-year major adverse cardiac events and five-year mortality | Five-year period | To study prognostic value of TMAO concentrations that are increased in T2DM patients and their relation to glycemic control. | TMAO and choline concentrations were higher in individuals with T2DM vs. healthy controls. Within T2DM patients, higher plasma TMAO was associated with a significant 3.0-fold increased three-year major adverse cardiac event risk and a 3.6-fold increased five-year mortality risk. | Fasting plasma concentrations of the proatherogenic-gut-microbe-generated metabolite TMAO are higher in T2DM patients and are independent risk factor for major adverse cardiac events and mortality risks. | Moderate |
| Li Y. et al., 2015 [146] | Prospective cohort study | 203,308 men and women extracted from three cohorts: the Nurses’ Health Study (NHS), NHS II, and the Health Professionals Follow-Up Study (HPFS). | Dietary phosphatidylcholine was estimated by a food-frequency questionnaire | Four years | To study the association between dietary phosphatidylcholine and risk of type 2 diabetes (T2D). | 7063, 4465, and 3531 cases of T2D (during NHS, NHS II, and HPFS, respectively) were documented. Compared with people in the lowest quintiles of dietary phosphatidylcholine intakes, the RR of T2D for those in the highest quintiles was 1.36 in NHS, 1.35 in NHS II, 1.28 in HPFS, and 1.34 in the pooled analysis. The association was 1.24 after further adjustment for the three major food sources (red meat, eggs, and seafoods) and 1.27 with all choline-containing components and betaine mutually adjusted. With an increase of 100 mg choline from phosphatidylcholine, the risk of T2D increased by 17%. | Dietary intakes of phosphatidylcholine are associated with incident T2D risk. | Moderate |
| Roy S. et al., 2020 [147] | Longitudinal cohort study | 300 diabetes-free men and women (77%) aged 20–55 years (mean = 34 ± 10) | Multivariable generalized linear models regressed; (i) FPG change (year 2 minus baseline) on baseline TMAO tertiles; and (ii) HOMA-IR and HbA1c on TMAO tertiles. Multivariable relative risk regressions modeled prevalent prediabetes across TMAO tertiles. | 2 years | To investigate the association between TMAO and biomarkers of diabetes risk. | Mean values of two-year longitudinal FPG ± SE across tertiles of TMAO were 86.6 ± 0.9, 86.7 ± 0.9, and 86.4 ± 0.9 (p = 0.98). Trends were null for FPG, HbA1c, and HOMA-IR, cross-sectionally. The prevalence ratio of prediabetes among participants in second and third TMAO tertiles (vs. the 1st) were 1.94 [95% CI 1.09–3.48] and 1.41 [95% CI: 0.76–2.61]. | TMAO levels are associated with increased prevalence of prediabetes in a nonlinear fashion but not with insulin resistance or longitudinal FPG change. | Moderate |
| Allin K.H. et al., 2018 [148] | Case–control study | 134 Danish adults with prediabetes, overweight, insulin resistance, dyslipidemia, and low-grade inflammation and 134 individuals with normal glucose regulation. | Comparison of biochemical markers, anthropometric parameters, and gut microbiota in control and case groups. | 12 weeks | To test whether specific gut microbiota profiles are associated with prediabetes. | Five bacterial genera and 36 operational taxonomic units (OTUs) were differentially abundant between individuals with prediabetes and those with normal glucose regulation. At the genus level, the abundance of Clostridium was decreased, whereas the abundances of Dorea, Sutterella and Streptococcus were increased. The two OTUs that differed the most were members of the order Clostridiales and Akkermansia muciniphila, which both displayed lower abundance among individuals with prediabetes. | Individuals with prediabetes have intestinal microbiota characterized by a decreased of the genus Clostridium and the mucin-degrading bacterium A. muciniphila. These findings are comparable to observations in overt chronic diseases characterized by low-grade inflammation. | Moderate |
| Zhong H. et al., 2019 [149] | Cohort study | 77 type 2 diabetic individuals who are treatment-naïve, 80 pre-diabetic individuals, and 97 normal glucose-tolerant individuals. | Combination of in-depth metagenomics and metaproteomics analyses on fecal samples | To investigate compositional and functional changes of the gut microbiota and the fecal content of microbial and host proteins in preDM and treatment-naïve T2D individuals | Distinct differences characterizing the gut microbiota of the three groups were observed. The content of several human antimicrobial peptides and pancreatic enzymes differed in fecal samples between three groups. | There is a complex, disease-stage-dependent interplay between the gut microbiota and the host. | Moderate | |
| (B) Dietary Supplementation with Probiotics and Prediabetes Reviews and Meta-Analyses | ||||||||
| Authors | Type of Study | Number of Studies | Subjects (Total) | End Point | Result | Conclusion | Strenght of Evidence | |
| Letchumanan G. et al., 2022 [150] | Systematic Review of Observational Studies | 18 eligible studies | 5489 participants | To summarize the existing evidence related to microbiota composition and diversity in individuals with prediabetes (preDM) and individuals newly diagnosed with T2DM (newDM) in comparison to individuals with normal glucose tolerance (nonDM). | 4 out of the 18 studies found increased abundance of phylum Firmicutes along with decreased abundance of Bacteroidetes in newDM. At the genus/species levels, decreased abundance of Faecalibacterium prausnitzii, Roseburia, Dialister, Flavonifractor, Alistipes, Haemophilus, and Akkermansia muciniphila and increased abundance of Lactobacillus, Streptococcus, Escherichia, Veillonella, and Collinsella were observed in the disease groups in at least two studies. Lactobacillus was also found to positively correlate with fasting plasma glucose (FPG), HbA1c, and/or homeostatic assessment of insulin resistance (HOMA-IR) in four studies. | There is a need for further investigations on the species/strain-specific role of endogenously present Lactobacillus in the glucose regulation mechanism and T2DM disease progression and more studies are needed to establish more consistent associations, between clinical biomarkers or dietary intake and specific gut bacterial composition in prediabetes and early T2DM. | High | |
| Gurung M. et al., 2020 [151] | Systematic review | 42 human studies | Not available | To study the potential role of different bacterial taxa affecting diabetes and to discuss potential molecular mechanisms of microbiota effects in the onset and progression of T2D. | The genera of Bifidobacterium, Bacteroides, Faecalibacterium, Akkermansia, and Roseburia were negatively associated with T2D, while the genera of Ruminococcus, Fusobacterium, and Blautia were positively associated with T2D. | Some microbial taxa and related molecular mechanisms may be involved in glucose metabolism related to T2D. However, the heterogeneity of T2D and redundancy of gut microbiota do not promise simple interpretations (e.g., low diversity) and easy solutions (such as fecal transplant from non-diabetic/non-obese donor). | High | |
| Barengolts E., 2016 [152] | Review of randomized controlled trials | Not available | Not available | To review the data from randomized controlled trials (RCTs) for the roles of microbiota, pre-, pro-, and synbiotics in metabolic conditions (obesity, prediabetes, and diabetes mellitus type 2 [DM2]). | Results of RCTs of prebiotics suggested a neutral effect on body weight, decreased fasting and postprandial glucose, and improved insulin sensitivity and lipid profile. Some inflammation markers were reduced, sometimes substantially (20–30%). The effect was seen mostly with fermented milk or yogurt compared to capsule form, consumption for at least eight weeks, and use of multiple rather than a single bacterial strain. Changes in microbiota were seen at times with both pre- and probiotics. Pickled and fermented foods, particularly vegetables and beans, could serve as a dietary source of pre-, pro-, and synbiotics. | Pre-, pro-, and synbiotics could prove useful, but further research is needed to clarify their clinical relevance for the prevention and management of metabolic disease. | High | |
| Wang X. et al., 2021 [153] | Systematic review of randomized controlled trials | Eight randomized controlled trials. | 391 Participants | To identify evidence for microbiota’s role and use of probiotics, pre-biotics, or synbiotics in prediabetes. | Probiotics can decrease glycated hemoglobin (HbA1c) and have the potential to improve post-load glucose levels. Pre-biotics failed to show an evident improvement in glycemic control, but their use caused the changes in the composition of gut microbiota. A combination of probiotics and prebiotics in the synbiotic supplementation is more effective than probiotics alone in glycemic control. | Using probiotics, pre-biotics, or synbiotics for the treatment of prediabetes, the benefits of modulating the abundance of gut microbiota were partially demonstrated. However, there is insufficient evidence to show significant benefits on glucose metabolism. | High | |
| Li Y. et al., 2022 [154] | Systematic review and meta-analysis | Seven publications | 460 patients | To examine the effects of probiotics on eight factors in the prediabetic population. | Probiotics were able to significantly decrease the levels of glycated hemoglobin A1c (HbA1c), quantitative insulin sensitivity check index (QUICKI), total cholesterol (TC), triglyceride (TG), and low-density lipoprotein cholesterol (LDL-C) compared to levels in the placebo group. | Probiotics may fulfil an important role in the regulation of HbA1c, QUICKI, TC, TG, and LDL-C in patients with prediabetes. In addition, probiotics may regulate blood glucose homeostasis in a variety of ways. | High | |
| Zeighamy Alamdary S. et al., 2022 [155] | Systematic review of randomized controlled trials | 15 articles | 1295 patients | To compile the results of clinical trials investigating the effects of pro-/pre-/synbiotics on prediabetes subjects from 2010 to 2020. | Different probiotics compositions have shown beneficial and noticeable effects on glucose homeostasis, lipid profiles, BMI, and inflammatory markers in subjects with prediabetes, metabolic syndrome, and healthy individuals. | Administration of probiotics may provide beneficial and healthful effects in the clinical management of patients with prediabetes and metabolic syndrome and could be advantageous in recomposing the gut microbiota back into the normal state during the prediabetic state. | High | |
| Bock P.M. et al., 2021 [156] | Systematic review and meta-analysis of randomized controlled clinical trials | 130 articles for review, 38 of which included in the meta-analysis | 2086 participants | To assess the effect of probiotic, prebiotic, or synbiotic supplementation on gut microbiota and glucose control and lipid levels in individuals with diabetes. | The use of prebiotics, probiotics, or synbiotics reduced HbA1c levels, but did not reach the threshold for significance and had no effect on LDL-cholesterol levels. However, their consumption decreased levels of fasting blood glucose, total cholesterol, triacylglycerols, and insulinemia, and increased HDL-cholesterol levels. | In individuals with diabetes mellitus, supplementation with probiotics, prebiotics, or synbiotics improved metabolic variables, although the magnitude of this effect is low. | High | |
| Zhang Q. et al., 2015 [157] | Meta-analysis of randomized controlled trials | Seven trials | 386 participants | To investigate the effects of probiotics on glucose metabolism in patients with type 2 diabetes mellitus. | Probiotic consumption significantly changed FPG by −15.92 mg/dL and HbA1cby −0.54% compared with control groups. Subgroup analysis was conducted in to trials with non-yogurts control. Meta-analysis of trials with multiple species of probiotics found a significant reduction in FPG. The duration of intervention for ≥8 weeks resulted in a significant reduction in FPG. The results also showed that probiotic therapy significantly decreased homeostasis model assessment of insulin resistance (HOMA-IR) and insulin concentration. | Consuming probiotics may improve glucose metabolism by a modest degree, with a potentially greater effect when the duration of intervention is ≥8 weeks, or multiple species of probiotics are consumed. | High | |
| (A) Monitoring Glucose Levels and Prediabetes Interventional Studies | ||||||||
| Authors | Type of Study | Population Characteristics | Type of Intervention/Exposure | Duration | End Point | Results | Conclusion | Strength of Evidence |
| Pierre K.B. et al. [158] | Randomized controlled trial | 1548 patients receiving mechanical ventilation admitted to the surgical intensive care. | A total of 1548 critically ill surgical intensive care unit patients were randomly assigned to receive either intensive insulin therapy (BG 80–110 mg/dL) or conventional treatment (initiation of insulin infusion for BG greater than 215 mg/dL and maintenance of BG between 180 and 200 mg/dL). | 2 February 2000 and 18 January 2001 | To determine whether intensive insulin therapy to normalize blood glucose levels (BG) reduces mortality and morbidity among critically ill patients. | In the intensive insulin therapy group, BG was maintained between 80 and 110 mg/dL. Overall, 98.7% of the intensive treatment group required insulin based on this algorithm. Of the conventional treatment group, 39.2% of patients received insulin therapy with maintenance of BG at a mean of 173 ± 33 mg/dL. | Maintenance of normoglycemia (80–110 mg/dL) with intensive insulin therapy reduces both mortality and morbidity associated with critical illness. | High |
| Zhang Z. et al., 2019 [159] | Experimental study | 12 adults (10 completed). | The photos of the patches were used for the determination of sweat loss and pH level. The sweat patches were then placed in Petri dishes and air-dried before a second photograph was taken to capture the color intensity on the detection zones. | / | They introduce a versatile, cost-effective, flexible, and wearable POC biomarker patch for effective sweat collection and health monitoring. | It was observed glucose concentrations between 4.7 and 98.4 μM for eight of the subjects, which is in the normal range of sweat glucose (<120 μM). Subject 2 and 10 have a relatively high sweat glucose concentration of 163.5 μM and 336.1 μM, respectively. The high glucose readout in subject 10, corrected by the sweat volume, could potentially indicate a prediabetic or diabetic condition for the subject. | The device can detect sweat loss, pH, glucose concentrations, and lactate concentrations in sweat, with the ability to detect glucose levels in the physiological range of 50–300 μM. | Low |
| Cui Y. et al., 2021 [160] | Randomized controlled trial | A total amount of six saliva collection methods were employed in 80 healthy participants in the morning. | / | / | To identify the ideal saliva collection method | The improved method obtained absorbance at the wavelength of 520 nm, and the optimized parameter combination was pH 6.5 and 5 mg/dL NaCl. The lower limit of glucose detection was 0.1 mg/dL. Unstimulated saliva glucose concentration was higher than stimulated saliva glucose concentration. Unstimulated parotid saliva glucose concentration was the highest. Moreover, unstimulated saliva glucose has a better normal distribution effect. Meantime, it was found that unstimulated parotid saliva was the most highly correlated with blood glucose (R2 = 0.707). | The saliva collection method was an important factor that affected saliva glucose concentration. Unstimulated parotid saliva was the most highly correlated with blood glucose, which provided a reference for the prediction of diabetes mellitus. | High |
| Cui Y. et al., 2022 [161] | Randomized controlled trial | 40 age-matched DM patients and 40 healthy controls. | The correlations between salivary glucose and blood glucose before and after breakfast were analyzed. | / | This study aims to identify an ideal saliva collection method and to use this method to determine the population and individual correlations between salivary glucose and blood glucose levels in DM patients and healthy controls. | Compared with unstimulated saliva, stimulated saliva had decreased glucose level and increased salivary flow. In addition, unstimulated parotid salivary glucose was most correlated with blood glucose level (R2 = 0.9153), and the ROC curve area was 0.9316, which could accurately distinguish DM patients. | The unstimulated parotid salivary glucose before breakfast presents an ideal saliva collecting method with which to replace blood-glucose use to detect DM, which provides a reference for the prediction of DM. | High |
| (B) Monitoring Glucose Levels and Prediabetes Observational Studies | ||||||||
| Authors | Type of Study | Population Characteristics | Type of Intervention/Exposure | Duration | End Point | Results | Conclusion | Strength of Evidence |
| Schaffzin J.K. et al. 2012 [162] | Retrospective cohort study | Any resident with diabetes living in the assisted-living facilities between August 2006 and January 2007 (34 residents with diabetes and 12 epidemiologically linked residents). A case was defined as any member of the cohort with serologic evidence of current or previous HBV infection. Diabetes was identified based on notation in the medical record. | / | / | HBV transmission in patient during assisted monitoring of blood glucose (AMBG) and implemented preventive measures. | Serologic testing detected six residents with diabetes with current HBVI and four residents with diabetes and one epidemiologically linked resident with previous HBVI. | AMBG was significantly associated with HBVI in ALF residents with diabetes. | Medium |
| Han B. et al. 2021 [163] | Cross-sectional comparative study | 408 patients with diabetes and 408 people without diabetes randomly matched 1:1. | Venous blood was collected for HBV serological testing and blood glucose testing. | / | Comparison of hepatitis B surface antigen (HBsAg) positive rates between the two groups. | HBsAg positive rate in people without diabetes was 2.0% and in those with diabetes was 4.2%. Whether in people without diabetes or patients with diabetes, higher frequency of SMBG was associated with higher HBsAg positive rate. Increases in the duration of diabetes were correlated with increasing rates of HBsAg. | Routine blood glucose monitoring at home was associated with HBV infection, which meant people with diabetes may be at high risk of HBV infection. | Medium |
| Finney S.J. et al. 2003 [164] | Single-center, prospective, observational study | 531 patients (median age, 64 years). | / | Median lengths of stay were 1.8 (interquartile range, 0.9–3.7) days and 6 (interquartile range, 4.5–8.3) days, respectively. | Intensive care unit (ICU) mortality. | Of 531 patients admitted to the ICU, 523 underwent analysis of their glycemic control. Twenty-four–hour control of blood glucose levels was variable. Rates of ICU and hospital mortality were 5.2% and 5.7%, respectively. | Increased insulin administration is positively associated with death in the ICU regardless of the prevailing blood glucose level. Thus, control of glucose levels rather than of absolute levels of exogenous insulin appear to account for the mortality benefit associated with intensive insulin therapy demonstrated by others. | Medium |
| Evans J.M. et al. 1999 [165] | Retrospective study | Patients resident in Tayside in 1993–1995 who were using insulin and were registered on the database and diagnosed with insulin-dependent (type 1) or non-insulin-dependent (type 2) diabetes before 1993. | Investigate patterns of self-monitoring of blood glucose concentration in diabetic patients who use insulin and to determine whether frequency of self-monitoring is related to glycemic control. | Among 807 patients with type 1 diabetes, 128 (16%) did not redeem any prescriptions for glucose-monitoring reagent strips in the three-year study period. Only 161 (20%) redeemed prescriptions for enough reagent strips to test glucose daily. The corresponding figures for the 790 patients with type 2 diabetes who used insulin were 162 (21%; no strips) and 131 (17%; daily tests). | Self-monitoring of blood glucose concentration is associated with improved glycemic control in patients with type 1 diabetes. Regular self-monitoring in patients with type 1 and type 2 diabetes is uncommon. | Medium | ||
| Berghe G. et al. 2003 [166] | Prospective randomized controlled trial | 1548 patients | Subjects randomly assigned to either strict normalization of blood glucose (80–110 mg/dL) with insulin infusion or the conventional approach, in which insulin is only given to maintain blood glucose levels at 180–200 mg/dL. | 12 days | Report the factors determining insulin requirements and the impact of insulin dose vs. blood glucose control on the observed outcome benefits. | The lowered blood glucose level rather than the insulin dose was related to reduced mortality (p < 0.0001), critical illness polyneuropathy (p < 0.0001), bacteremia (p = 0.02), and inflammation (p = 0.0006) but not to prevention of acute renal failure. | Normoglycemia was safely reached within 24 hrs and maintained during intensive care by using insulin titration guidelines. | High |
| Sørgård, B. et al. 2019 [167] | Cross-sectional study | 23 adults with type 1 diabetes, including current and former users of continuous glucose monitoring from four different outpatient clinics. | / | / | To describe positively and negatively perceived situations experienced by adults with type 1 diabetes using continuous glucose monitoring and the actions they take to deal with these situations. | The participants described that they felt that the use of continuous glucose monitoring was a balance between benefits and barriers, and how, through their actions, they tried to adapt their use of continuous glucose monitoring to fit their lifestyles. | Continuous glucose monitoring is perceived as an effective and important tool in the self-management of diabetes type 1. It enables a better everyday life and increased satisfaction with treatment. | Medium |
| Hilliard M.E. et al. 2019 [168] | Cross-sectional study | Transcripts from semi-structured qualitative interviews with 55 parents of children aged 1 to <8 years, with T1D duration ≥6 months, and whose child currently or previously used continuous glucose monitoring (CGM). | / | / | Parents described benefits of CGM use: decreased worry about glucose excursions, improved sleep, increased sense of safety with children who cannot recognize or express symptoms of hypo- or hyperglycemia, and greater comfort with other caregivers. | CGM may address unique challenges of T1D in young children and increase parental comfort with diabetes management, yet there are multiple barriers to initiating or maintaining CGM use. | Medium | |
| Engler R. et al. 2018 [169] | Cross-sectional study | People with diabetes and the parents of children with diabetes (n = 1348). | Results from two surveys regarding continuous glucose monitoring (CGM) devices. | / | The importance of the concept of “user burden” in patients’ and caregivers’ evaluations of the acceptability of available devices. | / | Minimizing system obtrusiveness will likely be of significant value in reducing hurdles to CGM device use and adherence. | Medium |
| Diabetes Care 2022 [2] | Position statement | SMBG is recommended for all patients who use insulin. Recommendations for testing urine for glucose and ketones as part of diabetes management are described here. | Low | |||||
| Hayford J.T. et al., 1983 [170] | Cross-sectional study | 24 diabetic subjects (15 female and 9 male); all subjects had type I diabetes, with the exception of one subject (insulin-treated type II diabetic patient). | Subjects were maintained on their previous insulin regimens with no attempt to optimize blood glucose control. | / | Correlation between mean plasma glucose concentration with simultaneous urine glucose concentration on excretion rate. | Both the urine glucose concentration and urine glucose excretion rate are significantly correlated (p < 0.0001). | Observations on the correlation between mean plasma glucose concentration with simultaneous urine glucose concentration or excretion rate re-emphasize the limitations of this approach. | Medium |
| Morris L.R., 1981 [171] | Cross-sectional study | 246 adult diabetics | Reported levels from 400 s-voided urines was compared to simultaneous plasma determinations. | / | Determine whether semi-quantitative glucose measurements of spot urine specimens accurately reflect prevailing plasma glucose levels. | Quantitative urine levels and plasma glucose levels correlated. However, when semi-quantitative urinary determinations were compared to plasma glucose stratified into 0 to 149, 150 to 199, and greater than 200 mg/dL, 75% of the urine samples associated with plasma levels from 150 to 199 mg/dL were negative by Diastix, and 16.5% of samples negative by Diastix were in the 200+ mg/dL plasma range. | Except for the detection of marked hyperglycemia, spot urine glucose determinations are inadequate as the sole means of clinical assessment for the management of diabetic patients. | Medium |
| (C) Monitoring Glucose Levels and Prediabetes Reviews and Meta-Analyses | ||||||||
| Authors | Type of Study | Numbers of Studies | Population Characteristics | Type of Intervention/Exposure | End Point | Results | Conclusions | Strenght of Evidence |
| Malanda U.L. et al., 2012 [172] | Systematic review | Twelve randomized controlled trials were included and evaluated outcomes in 3259 randomized patients. | Nine trials compared SMBG with usual care without monitoring, one study compared SMBG with SMUG, one study was a three-armed trial comparing SMBG and SMUG with usual care, and one study was a three-armed trial comparing less intensive SMBG and more intensive SMBG with a control group. Seven out of eleven studies had a low risk of bias for most indicators. | Intervention duration ranged from 6 months (26 weeks) to 12 months (52 weeks). | To assess the effects of SMBG in patients with type 2 diabetes mellitus who are not using insulin. | / | When diabetes duration is over one year, the overall effect of self-monitoring of blood glucose on glycemic control in patients with type 2 diabetes who are not using insulin is small up to 6 months after initiation and subsides after 12 months. | High |
| Ilea A. et al., 2019 [173] | Systematic review | 49 papers selected | / | / | To present the development in the biosensors research and their utility using salivary assessment. | The 49 papers selected for the present review focused on assessing the salivary biomarkers used in general diseases, oral pathologies, and pharmacology. The biosensors proved to be reliable tools for measuring the salivary levels of biochemical metabolic compounds such as glucose, proteinases and proteins, heavy metals and various chemical compounds, micro-organisms, oncology markers, drugs, and neurotransmitters. | Saliva is a biofluid with a significant clinical applicability for the evaluation and monitoring of a patient’s general health. Biosensors designed for assessing a wide range of salivary biomarkers are emerging as promising diagnostic or screening tools for improving the patients’ quality of life. | High |
4. Discussion
4.1. Carbohydrate-Containing Foods
Low-Carbohydrate Diets for the Treatment of Obese Patients with Prediabetes
4.2. Protein Foods
4.2.1. Milk and Dairy Products
4.2.2. Eggs
4.2.3. Meat
4.2.4. Plant-Based Foods
4.3. Sarcopenia
4.4. Lipid-Containing Foods
4.4.1. Fish
4.4.2. Olive Oil
4.5. Vitamins
4.5.1. Vitamin D
4.5.2. Group B Vitamins
4.5.3. Vitamin C
4.5.4. Vitamin E
4.6. Minerals
4.7. Osteoporosis
4.8. Fruits and Vegetables
4.9. Nuts
4.10. Hydration
4.10.1. Plain Water
4.10.2. Sugary Beverages
4.11. Alcohol
4.12. Coffee
4.13. Physical Activity
4.14. Dietary Supplementation with Probiotics
4.15. Monitoring Glucose Levels
5. Conclusions
Supplementary Materials
Author Contributions
Funding
Institutional Review Board Statement
Informed Consent Statement
Data Availability Statement
Conflicts of Interest
References
- Glauber, H.; Vollmer, W.M.; Nichols, G.A. A Simple Model for Predicting Two-Year Risk of Diabetes Development in Individuals with Prediabetes. Perm. J. 2018, 22. [Google Scholar] [CrossRef] [PubMed]
- American Diabetes Association Professional Practice Committee. 2. Classification and Diagnosis of Diabetes: Standards of Medical Care in Diabetes—2022. Diabetes Care 2022, 45, S17–S38. [Google Scholar] [CrossRef]
- Smulders, Y.; Serné, E. Is HbA1c a Good Diagnostic Test for (Pre)Diabetes in Cardiac Rehabilitation Patients? Eur. J. Prev. Cardiol. 2018, 25, 462–463. [Google Scholar] [CrossRef]
- Tatulashvili, S.; Patois-Vergès, B.; Nguyen, A.; Blonde, M.-C.; Vergès, B. Detection of Glucose Metabolism Disorders in Coronary Patients Enrolled in Cardiac Rehabilitation: Is Glycated Haemoglobin Useful? Data from the Prospective REHABDIAB Study. Eur. J. Prev. Cardiol. 2018, 25, 464–471. [Google Scholar] [CrossRef]
- Færch, K.; Vistisen, D.; Johansen, N.B.; Jørgensen, M.E. Cardiovascular Risk Stratification and Management in Pre-Diabetes. Curr. Diabetes Rep. 2014, 14, 493. [Google Scholar] [CrossRef]
- Zhang, X.; Gregg, E.W.; Williamson, D.F.; Barker, L.E.; Thomas, W.; Bullard, K.M.; Imperatore, G.; Williams, D.E.; Albright, A.L. A1C Level and Future Risk of Diabetes: A Systematic Review. Diabetes Care 2010, 33, 1665–1673. [Google Scholar] [CrossRef]
- Ackermann, R.T.; Cheng, Y.J.; Williamson, D.F.; Gregg, E.W. Identifying Adults at High Risk for Diabetes and Cardiovascular Disease Using Hemoglobin A1c. Am. J. Prev. Med. 2011, 40, 11–17. [Google Scholar] [CrossRef]
- Diabetes Prevention Program Research Group. HbA1c as a Predictor of Diabetes and as an Outcome in the Diabetes Prevention Program: A Randomized Clinical Trial. Diabetes Care 2015, 38, 51–58. [Google Scholar] [CrossRef]
- DeFronzo, R.A.; Tripathy, D. Skeletal Muscle Insulin Resistance Is the Primary Defect in Type 2 Diabetes. Diabetes Care 2009, 32, S157–S163. [Google Scholar] [CrossRef]
- Tabák, A.G.; Herder, C.; Rathmann, W.; Brunner, E.J.; Kivimäki, M. Prediabetes: A High-Risk State for Diabetes Development. Lancet 2012, 379, 2279–2290. [Google Scholar] [CrossRef] [PubMed]
- Echouffo-Tcheugui, J.B.; Selvin, E. Prediabetes and What It Means: The Epidemiological Evidence. Annu. Rev. Public. Health 2021, 42, 59–77. [Google Scholar] [CrossRef]
- Diabetes Prevention Program Research Group. The Prevalence of Retinopathy in Impaired Glucose Tolerance and Recent-Onset Diabetes in the Diabetes Prevention Program. Diabetes Med. 2007, 24, 137–144. [Google Scholar] [CrossRef]
- Lee, C.C.; Perkins, B.A.; Kayaniyil, S.; Harris, S.B.; Retnakaran, R.; Gerstein, H.C.; Zinman, B.; Hanley, A.J. Peripheral Neuropathy and Nerve Dysfunction in Individuals at High Risk for Type 2 Diabetes: The PROMISE Cohort. Diabetes Care 2015, 38, 793–800. [Google Scholar] [CrossRef]
- Echouffo-Tcheugui, J.B.; Narayan, K.M.; Weisman, D.; Golden, S.H.; Jaar, B.G. Association between Prediabetes and Risk of Chronic Kidney Disease: A Systematic Review and Meta-Analysis. Diabetes Med. 2016, 33, 1615–1624. [Google Scholar] [CrossRef]
- Huang, Y.; Cai, X.; Mai, W.; Li, M.; Hu, Y. Association between Prediabetes and Risk of Cardiovascular Disease and All Cause Mortality: Systematic Review and Meta-Analysis. BMJ 2016, 355, i5953. [Google Scholar] [CrossRef]
- The HAPO Study Cooperative Research Group. Hyperglycemia and Adverse Pregnancy Outcomes. N. Engl. J. Med. 2008, 358, 1991–2002. [Google Scholar] [CrossRef]
- de Souza, C.F.; Gross, J.L.; Gerchman, F.; Leitão, C.B. Pré-Diabetes: Diagnóstico, Avaliação de Complicações Crônicas e Tratamento. Arq. Bras. Endocrinol. Metabol. 2012, 56, 275–284. [Google Scholar] [CrossRef]
- Khan, R.M.M.; Chua, Z.J.Y.; Tan, J.C.; Yang, Y.; Liao, Z.; Zhao, Y. From Pre-Diabetes to Diabetes: Diagnosis, Treatments and Translational Research. Medicina 2019, 55, 546. [Google Scholar] [CrossRef]
- Evert, A.B.; Dennison, M.; Gardner, C.D.; Garvey, W.T.; Lau, K.H.K.; MacLeod, J.; Mitri, J.; Pereira, R.F.; Rawlings, K.; Robinson, S.; et al. Nutrition Therapy for Adults with Diabetes or Prediabetes: A Consensus Report. Diabetes Care 2019, 42, 731–754. [Google Scholar] [CrossRef]
- Egger, M.; Smith, D.G. Doug Altman Systematic Reviews in Health Care. Meta-Analysis in Context. Int. J. Epidemiol. 2002, 31, 697. [Google Scholar] [CrossRef]
- How to Read a Paper. Available online: https://www.bmj.com/about-bmj/resources-readers/publications/how-read-paper (accessed on 20 November 2023).
- Available online: https://www.cochrane.it/sites/cochrane.it/files/public/uploads/guidausorevisioni.pdf (accessed on 20 November 2023).
- Owens, D.K.; Lohr, K.N.; Atkins, D.; Treadwell, J.R.; Reston, J.T.; Bass, E.B.; Chang, S.; Helfand, M. AHRQ Series Paper 5: Grading the Strength of a Body of Evidence When Comparing Medical Interventions—Agency for Healthcare Research and Quality and the Effective Health-Care Program. J. Clin. Epidemiol. 2010, 63, 513–523. [Google Scholar] [CrossRef] [PubMed]
- Available online: https://www.iss.it/-/snlg-manuale-metodologico (accessed on 20 November 2023).
- Saslow, L.R.; Daubenmier, J.J.; Moskowitz, J.T.; Kim, S.; Murphy, E.J.; Phinney, S.D.; Ploutz-Snyder, R.; Goldman, V.; Cox, R.M.; Mason, A.E.; et al. Twelve-Month Outcomes of a Randomized Trial of a Moderate-Carbohydrate versus Very Low-Carbohydrate Diet in Overweight Adults with Type 2 Diabetes Mellitus or Prediabetes. Nutr. Diabetes 2017, 7, 304. [Google Scholar] [CrossRef]
- Saslow, L.R.; Kim, S.; Daubenmier, J.J.; Moskowitz, J.T.; Phinney, S.D.; Goldman, V.; Murphy, E.J.; Cox, R.M.; Moran, P.; Hecht, F.M. A Randomized Pilot Trial of a Moderate Carbohydrate Diet Compared to a Very Low Carbohydrate Diet in Overweight or Obese Individuals with Type 2 Diabetes Mellitus or Prediabetes. PLoS ONE 2014, 9, e91027. [Google Scholar] [CrossRef] [PubMed]
- Gardner, C.D.; Landry, M.J.; Perelman, D.; Petlura, C.; Durand, L.R.; Aronica, L.; Crimarco, A.; Cunanan, K.M.; Chang, A.; Dant, C.C.; et al. Effect of a Ketogenic Diet versus Mediterranean Diet on Glycated Hemoglobin in Individuals with Prediabetes and Type 2 Diabetes Mellitus: The Interventional Keto-Med Randomized Crossover Trial. Am. J. Clin. Nutr. 2022, 116, 640–652. [Google Scholar] [CrossRef] [PubMed]
- Cea-Soriano, L.; Pulido, J.; Franch-Nadal, J.; Santos, J.M.; Mata-Cases, M.; Díez-Espino, J.; Ruiz-García, A.; Regidor, E. Mediterranean Diet and Diabetes Risk in a Cohort Study of Individuals with Prediabetes: Propensity Score Analyses. Diabetes Med. 2022, 39, e14768. [Google Scholar] [CrossRef] [PubMed]
- Filippatos, T.D.; Panagiotakos, D.B.; Georgousopoulou, E.N.; Pitaraki, E.; Kouli, G.-M.; Chrysohoou, C.; Tousoulis, D.; Stefanadis, C.; Pitsavos, C. Mediterranean Diet and 10-Year (2002–2012) Incidence of Diabetes and Cardiovascular Disease in Participants with Prediabetes: The ATTICA Study. Rev. Diabetes Stud. 2016, 13, 226–235. [Google Scholar] [CrossRef]
- Li, L.; Shan, Z.; Wan, Z.; Li, R.; Geng, T.; Lu, Q.; Zhu, K.; Qiu, Z.; Zhang, X.; Liu, Y.; et al. Associations of Lower-Carbohydrate and Lower-Fat Diets with Mortality among People with Prediabetes. Am. J. Clin. Nutr. 2022, 116, 206–215. [Google Scholar] [CrossRef] [PubMed]
- Rideout, T.C.; Marinangeli, C.P.F.; Martin, H.; Browne, R.W.; Rempel, C.B. Consumption of Low-Fat Dairy Foods for 6 Months Improves Insulin Resistance without Adversely Affecting Lipids or Bodyweight in Healthy Adults: A Randomized Free-Living Cross-over Study. Nutr. J. 2013, 12, 56. [Google Scholar] [CrossRef]
- Akhavan, T.; Luhovyy, B.L.; Brown, P.H.; Cho, C.E.; Anderson, G.H. Effect of Premeal Consumption of Whey Protein and Its Hydrolysate on Food Intake and Postmeal Glycemia and Insulin Responses in Young Adults. Am. J. Clin. Nutr. 2010, 91, 966–975. [Google Scholar] [CrossRef]
- Sindayikengera, S.; Xia, W. Nutritional Evaluation of Caseins and Whey Proteins and Their Hydrolysates from Protamex. J. Zhejiang Univ. Sci. B 2006, 7, 90–98. [Google Scholar] [CrossRef]
- Slurink, I.A.L.; den Braver, N.R.; Rutters, F.; Kupper, N.; Smeets, T.; Elders, P.J.M.; Beulens, J.W.J.; Soedamah-Muthu, S.S. Dairy Product Consumption and Incident Prediabetes in Dutch Middle-Aged Adults: The Hoorn Studies Prospective Cohort. Eur. J. Nutr. 2022, 61, 183–196. [Google Scholar] [CrossRef]
- Slurink, I.A.L.; Voortman, T.; Ochoa-Rosales, C.; Ahmadizar, F.; Kavousi, M.; Kupper, N.; Smeets, T.; Soedamah-Muthu, S.S. Dairy Product Consumption in Relation to Incident Prediabetes and Longitudinal Insulin Resistance in the Rotterdam Study. Nutrients 2022, 14, 415. [Google Scholar] [CrossRef] [PubMed]
- Hruby, A.; Ma, J.; Rogers, G.; Meigs, J.B.; Jacques, P.F. Associations of Dairy Intake with Incident Prediabetes or Diabetes in Middle-Aged Adults Vary by Both Dairy Type and Glycemic Status. J. Nutr. 2017, 147, 1764–1775. [Google Scholar] [CrossRef] [PubMed]
- Slurink, I.A.L.; Chen, L.; Magliano, D.J.; Kupper, N.; Smeets, T.; Soedamah-Muthu, S.S. Dairy Product Consumption and Incident Prediabetes in the Australian Diabetes, Obesity, and Lifestyle Study With 12 Years of Follow-Up. J. Nutr. 2023, 153, 1742–1752. [Google Scholar] [CrossRef]
- Brouwer-Brolsma, E.M.; Sluik, D.; Singh-Povel, C.M.; Feskens, E.J.M. Dairy Product Consumption Is Associated with Pre-Diabetes and Newly Diagnosed Type 2 Diabetes in the Lifelines Cohort Study. Br. J. Nutr. 2018, 119, 442–455. [Google Scholar] [CrossRef]
- Pestoni, G.; Riedl, A.; Breuninger, T.A.; Wawro, N.; Krieger, J.P.; Meisinger, C.; Rathmann, W.; Thorand, B.; Harris, C.; Peters, A.; et al. Association between Dietary Patterns and Prediabetes, Undetected Diabetes or Clinically Diagnosed Diabetes: Results from the KORA FF4 Study. Eur. J. Nutr. 2021, 60, 2331–2341. [Google Scholar] [CrossRef] [PubMed]
- Hidayat, K.; Du, X.; Shi, B.-M. Milk in the Prevention and Management of Type 2 Diabetes: The Potential Role of Milk Proteins. Diabetes Metab. Res. Rev. 2019, 35, e3187. [Google Scholar] [CrossRef]
- Hoffman, J.R.; Falvo, M.J. Protein—Which Is Best? J. Sports Sci. Med. 2004, 3, 118–130. [Google Scholar] [PubMed]
- Yau, J.W.; Thor, S.M.; Ramadas, A. Nutritional Strategies in Prediabetes: A Scoping Review of Recent Evidence. Nutrients 2020, 12, 2990. [Google Scholar] [CrossRef]
- Pourafshar, S.; Akhavan, N.S.; George, K.S.; Foley, E.M.; Johnson, S.A.; Keshavarz, B.; Navaei, N.; Davoudi, A.; Clark, E.A.; Arjmandi, B.H. Egg Consumption May Improve Factors Associated with Glycemic Control and Insulin Sensitivity in Adults with Pre- and Type II Diabetes. Food Funct. 2018, 9, 4469–4479. [Google Scholar] [CrossRef]
- Richard, C.; Cristall, L.; Fleming, E.; Lewis, E.D.; Ricupero, M.; Jacobs, R.L.; Field, C.J. Impact of Egg Consumption on Cardiovascular Risk Factors in Individuals with Type 2 Diabetes and at Risk for Developing Diabetes: A Systematic Review of Randomized Nutritional Intervention Studies. Can. J. Diabetes 2017, 41, 453–463. [Google Scholar] [CrossRef] [PubMed]
- Drouin-Chartier, J.P.; Schwab, A.L.; Chen, S.; Li, Y.; Sacks, F.M.; Rosner, B.; Manson, J.A.E.; Willett, W.C.; Stampfer, M.J.; Hu, F.B.; et al. Egg Consumption and Risk of Type 2 Diabetes: Findings from 3 Large US Cohort Studies of Men and Women and a Systematic Review and Meta-Analysis of Prospective Cohort Studies. Am. J. Clin. Nutr. 2020, 112, 619–630. [Google Scholar] [CrossRef] [PubMed]
- Nguyen, C.Q.; Pham, T.T.P.; Fukunaga, A.; Van Hoang, D.; Phan, T.V.; Phan, D.C.; Van Huynh, D.; Hachiya, M.; Le, H.X.; Do, H.T.; et al. Red Meat Consumption Is Associated with Prediabetes and Diabetes in Rural Vietnam: A Cross-Sectional Study. Public Health Nutr. 2023, 26, 1006–1013. [Google Scholar] [CrossRef] [PubMed]
- Song, Y.; Manson, J.E.; Buring, J.E.; Liu, S. A Prospective Study of Red Meat Consumption and Type 2 Diabetes in Middle-Aged and Elderly Women: The Women’s Health Study. Diabetes Care 2004, 27, 2108–2115. [Google Scholar] [CrossRef]
- Pan, A.; Sun, Q.; Bernstein, A.M.; Schulze, M.B.; Manson, J.A.E.; Willett, W.C.; Hu, F.B. Red Meat Consumption and Risk of Type 2 Diabetes: 3 Cohorts of US Adults and an Updated Meta-Analysis. Am. J. Clin. Nutr. 2011, 94, 1088–1096. [Google Scholar] [CrossRef]
- Pan, A.; Sun, Q.; Bernstein, A.M.; Manson, J.E.; Willett, W.C.; Hu, F.B. Changes in Red Meat Consumption and Subsequent Risk of Type 2 Diabetes Mellitus: Three Cohorts of US Men and Women. JAMA Intern. Med. 2013, 173, 1328–1335. [Google Scholar] [CrossRef] [PubMed]
- Sanders, L.M.; Wilcox, M.L.; Maki, K.C. Red Meat Consumption and Risk Factors for Type 2 Diabetes: A Systematic Review and Meta-Analysis of Randomized Controlled Trials. Eur. J. Clin. Nutr. 2023, 77, 156–165. [Google Scholar] [CrossRef]
- Kwak, J.H.; Lee, J.H.; Ahn, C.-W.; Park, S.-H.; Shim, S.-T.; Song, Y.D.; Han, E.N.; Lee, K.H.; Chae, J.-S. Black Soy Peptide Supplementation Improves Glucose Control in Subjects with Prediabetes and Newly Diagnosed Type 2 Diabetes Mellitus. J. Med. Food 2010, 13, 1307–1312. [Google Scholar] [CrossRef]
- Reis, C.E.G.; Bordalo, L.A.; Rocha, A.L.C.; Freitas, D.M.O.; da Silva, M.V.L.; de Faria, V.C.; Martino, H.S.D.; Costa, N.M.B.; Alfenas, R.C. Ground Roasted Peanuts Leads to a Lower Post-Prandial Glycemic Response than Raw Peanuts. Nutr. Hosp. 2011, 26, 745–751. [Google Scholar] [CrossRef]
- Becerra-Tomás, N.; Díaz-López, A.; Rosique-Esteban, N.; Ros, E.; Buil-Cosiales, P.; Corella, D.; Estruch, R.; Fitó, M.; Serra-Majem, L.; Arós, F.; et al. Legume Consumption Is Inversely Associated with Type 2 Diabetes Incidence in Adults: A Prospective Assessment from the PREDIMED Study. Clin. Nutr. 2018, 37, 906–913. [Google Scholar] [CrossRef]
- Shams, H.; Tahbaz, F.; Entezari, M.H.; Abadi, A. Effects of Cooked Lentils on Glycemic Control and Blood Lipids of Patients with Type 2 Diabetes. ARYA Atheroscler. J. 2008, 3, 215–218. [Google Scholar]
- Jiang, R. Nut and Peanut Butter Consumption and Risk of Type 2 Diabetes in Women. JAMA 2002, 288, 2554. [Google Scholar] [CrossRef]
- Ley, S.H.; Hamdy, O.; Mohan, V.; Hu, F.B. Prevention and Management of Type 2 Diabetes: Dietary Components and Nutritional Strategies. Lancet 2014, 383, 1999–2007. [Google Scholar] [CrossRef]
- Kim, Y.; Keogh, J.B.; Clifton, P.M. Polyphenols and Glycemic Control. Nutrients 2016, 8, 17. [Google Scholar] [CrossRef]
- Schwingshackl, L.; Hoffmann, G.; Iqbal, K.; Schwedhelm, C.; Boeing, H. Food Groups and Intermediate Disease Markers: A Systematic Review and Network Meta-Analysis of Randomized Trials. Am. J. Clin. Nutr. 2018, 108, 576–586. [Google Scholar] [CrossRef] [PubMed]
- Schwingshackl, L.; Schwedhelm, C.; Hoffmann, G.; Lampousi, A.-M.; Knüppel, S.; Iqbal, K.; Bechthold, A.; Schlesinger, S.; Boeing, H. Food Groups and Risk of All-Cause Mortality: A Systematic Review and Meta-Analysis of Prospective Studies. Am. J. Clin. Nutr. 2017, 105, 1462–1473. [Google Scholar] [CrossRef]
- Tang, J.; Wan, Y.; Zhao, M.; Zhong, H.; Zheng, J.-S.; Feng, F. Legume and Soy Intake and Risk of Type 2 Diabetes: A Systematic Review and Meta-Analysis of Prospective Cohort Studies. Am. J. Clin. Nutr. 2020, 111, 677–688. [Google Scholar] [CrossRef] [PubMed]
- Li, W.; Ruan, W.; Peng, Y.; Wang, D. Soy and the Risk of Type 2 Diabetes Mellitus: A Systematic Review and Meta-Analysis of Observational Studies. Diabetes Res. Clin. Pract. 2018, 137, 190–199. [Google Scholar] [CrossRef] [PubMed]
- Chen, R.; Xu, J.; Wang, Y.; Jiang, B.; Xu, X.; Lan, Y.; Wang, J.; Lin, X. Prevalence of Sarcopenia and Its Association with Clinical Outcomes in Heart Failure: An Updated Meta-analysis and Systematic Review. Clin. Cardiol. 2023, 46, 260–268. [Google Scholar] [CrossRef]
- Kaga, H.; Tamura, Y.; Someya, Y.; Naito, H.; Tabata, H.; Kakehi, S.; Yamasaki, N.; Sato, M.; Kadowaki, S.; Suzuki, R.; et al. Prediabetes Is an Independent Risk Factor for Sarcopenia in Older Men, but Not in Older Women: The Bunkyo Health Study. J. Cachexia Sarcopenia Muscle 2022, 13, 2835–2842. [Google Scholar] [CrossRef] [PubMed]
- Li, S.; Mao, J.; Zhou, W. Prediabetes Is Associated with Loss of Appendicular Skeletal Muscle Mass and Sarcopenia. Front. Nutr. 2023, 10, 1109824. [Google Scholar] [CrossRef] [PubMed]
- Qiao, Y.S.; Chai, Y.H.; Gong, H.J.; Zhuldyz, Z.; Stehouwer, C.D.A.; Zhou, J.B.; Simó, R. The Association Between Diabetes Mellitus and Risk of Sarcopenia: Accumulated Evidences From Observational Studies. Front. Endocrinol. 2021, 12, 782391. [Google Scholar] [CrossRef] [PubMed]
- Díaz-Rizzolo, D.A.; Serra, A.; Colungo, C.; Sala-Vila, A.; Sisó-Almirall, A.; Gomis, R. Type 2 Diabetes Preventive Effects with a 12-Months Sardine-Enriched Diet in Elderly Population with Prediabetes: An Interventional, Randomized and Controlled Trial. Clin. Nutr. 2021, 40, 2587–2598. [Google Scholar] [CrossRef] [PubMed]
- Rajabi-Naeeni, M.; Dolatian, M.; Qorbani, M.; Vaezi, A.A. The Effect of Omega-3 and Vitamin D Co-Supplementation on Glycemic Control and Lipid Profiles in Reproductive-Aged Women with Pre-Diabetes and Hypovitaminosis D: A Randomized Controlled Trial. Diabetol. Metab. Syndr. 2020, 12, 41. [Google Scholar] [CrossRef]
- Weta, I.W.; Sutirtayasa, I.W.P.; Subawa, A.A.N.S.N.; Malik, S.G. Supplementation 2000 mg and 1000 mg of Linoleic Acid and Alfa Linolenic Acid Delayed Pre Diabetic State in Balinese Young Obese Women: A Randomised Clinical Trial. Bali Med. J. 2017, 6, 55. [Google Scholar] [CrossRef]
- Jamilian, M.; Samimi, M.; Mirhosseini, N.; Afshar Ebrahimi, F.; Aghadavod, E.; Talaee, R.; Jafarnejad, S.; Hashemi Dizaji, S.; Asemi, Z. The Influences of Vitamin D and Omega-3 Co-Supplementation on Clinical, Metabolic and Genetic Parameters in Women with Polycystic Ovary Syndrome. J. Affect. Disord. 2018, 238, 32–38. [Google Scholar] [CrossRef] [PubMed]
- Njike, V.Y.; Ayettey, R.; Treu, J.A.; Doughty, K.N.; Katz, D.L. Post-Prandial Effects of High-Polyphenolic Extra Virgin Olive Oil on Endothelial Function in Adults at Risk for Type 2 Diabetes: A Randomized Controlled Crossover Trial. Int. J. Cardiol. 2021, 330, 171–176. [Google Scholar] [CrossRef]
- Carnevale, R.; Loffredo, L.; Del Ben, M.; Angelico, F.; Nocella, C.; Petruccioli, A.; Bartimoccia, S.; Monticolo, R.; Cava, E.; Violi, F. Extra Virgin Olive Oil Improves Post-Prandial Glycemic and Lipid Profile in Patients with Impaired Fasting Glucose. Clin. Nutr. 2017, 36, 782–787. [Google Scholar] [CrossRef]
- Bartimoccia, S.; Cammisotto, V.; Nocella, C.; Del Ben, M.; D’Amico, A.; Castellani, V.; Baratta, F.; Pignatelli, P.; Loffredo, L.; Violi, F.; et al. Extra Virgin Olive Oil Reduces Gut Permeability and Metabolic Endotoxemia in Diabetic Patients. Nutrients 2022, 14, 2153. [Google Scholar] [CrossRef] [PubMed]
- Abshirini, M.; Mahaki, B.; Bagheri, F.; Siassi, F.; Koohdani, F.; Qorbani, M.; Yavari, P.; Sotoudeh, G. Dietary Fat Quality and Pre-Diabetes: A Case-Control Study. Int. J. Prev. Med. 2020, 11, 160. [Google Scholar] [CrossRef] [PubMed]
- Mirmiran, P.; Esfandyari, S.; Moghadam, S.K.; Bahadoran, Z.; Azizi, F. Fatty Acid Quality and Quantity of Diet and Risk of Type 2 Diabetes in Adults: Tehran Lipid and Glucose Study. J. Diabetes Complicat. 2018, 32, 655–659. [Google Scholar] [CrossRef]
- Nanri, A.; Mizoue, T.; Noda, M.; Takahashi, Y.; Matsushita, Y.; Poudel-Tandukar, K.; Kato, M.; Oba, S.; Inoue, M.; Tsugane, S. Fish Intake and Type 2 Diabetes in Japanese Men and Women: The Japan Public Health Center–Based Prospective Study. Am. J. Clin. Nutr. 2011, 94, 884–891. [Google Scholar] [CrossRef]
- Ibsen, D.B.; Warberg, C.K.; Würtz, A.M.L.; Overvad, K.; Dahm, C.C. Substitution of Red Meat with Poultry or Fish and Risk of Type 2 Diabetes: A Danish Cohort Study. Eur. J. Nutr. 2019, 58, 2705–2712. [Google Scholar] [CrossRef] [PubMed]
- Chen, G.-C.; Arthur, R.; Qin, L.-Q.; Chen, L.-H.; Mei, Z.; Zheng, Y.; Li, Y.; Wang, T.; Rohan, T.E.; Qi, Q. Association of Oily and Nonoily Fish Consumption and Fish Oil Supplements with Incident Type 2 Diabetes: A Large Population-Based Prospective Study. Diabetes Care 2021, 44, 672–680. [Google Scholar] [CrossRef] [PubMed]
- Xun, P.; He, K. Fish Consumption and Incidence of Diabetes. Diabetes Care 2012, 35, 930–938. [Google Scholar] [CrossRef]
- Schwingshackl, L.; Lampousi, A.-M.; Portillo, M.P.; Romaguera, D.; Hoffmann, G.; Boeing, H. Olive Oil in the Prevention and Management of Type 2 Diabetes Mellitus: A Systematic Review and Meta-Analysis of Cohort Studies and Intervention Trials. Nutr. Diabetes 2017, 7, e262. [Google Scholar] [CrossRef] [PubMed]
- Rasouli, N.; Brodsky, I.G.; Chatterjee, R.; Kim, S.H.; Pratley, R.E.; Staten, M.A.; Pittas, A.G.; D2d Research Group. Effects of Vitamin D Supplementation on Insulin Sensitivity and Secretion in Prediabetes. J. Clin. Endocrinol. Metab. 2022, 107, 230–240. [Google Scholar] [CrossRef]
- Banerjee, A.; Khemka, V.K.; Roy, D.; Poddar, J.; Roy, T.K.S.; Karnam, S.A. Role of Serum Adiponectin and Vitamin D in Prediabetes and Diabetes Mellitus. Can. J. Diabetes 2017, 41, 259–265. [Google Scholar] [CrossRef]
- Zhu, J.; Chen, C.; Lu, L.; Yang, K.; Reis, J.; He, K. Intakes of Folate, Vitamin B6, and Vitamin B12 in Relation to Diabetes Incidence Among American Young Adults: A 30-Year Follow-up Study. Diabetes Care 2020, 43, 2426–2434. [Google Scholar] [CrossRef]
- Jin, G.; Wang, J.; Jiang, X. Association of Folate, Vitamin B-12 and Vitamin B-6 Intake with Diabetes and Prediabetes in Adults Aged 20 Years and Older. Asia Pac. J. Clin. Nutr. 2021, 30, 75–86. [Google Scholar] [CrossRef]
- Wilson, R.; Willis, J.; Gearry, R.; Skidmore, P.; Fleming, E.; Frampton, C.; Carr, A. Inadequate Vitamin C Status in Prediabetes and Type 2 Diabetes Mellitus: Associations with Glycaemic Control, Obesity, and Smoking. Nutrients 2017, 9, 997. [Google Scholar] [CrossRef] [PubMed]
- Zhang, Y.; Tan, H.; Tang, J.; Li, J.; Chong, W.; Hai, Y.; Feng, Y.; Lunsford, L.D.; Xu, P.; Jia, D.; et al. Effects of Vitamin D Supplementation on Prevention of Type 2 Diabetes in Patients with Prediabetes: A Systematic Review and Meta-Analysis. Diabetes Care 2020, 43, 1650–1658. [Google Scholar] [CrossRef] [PubMed]
- Lind, M.V.; Lauritzen, L.; Kristensen, M.; Ross, A.B.; Eriksen, J.N. Effect of Folate Supplementation on Insulin Sensitivity and Type 2 Diabetes: A Meta-Analysis of Randomized Controlled Trials. Am. J. Clin. Nutr. 2019, 109, 29–42. [Google Scholar] [CrossRef] [PubMed]
- Ashor, A.W.; Werner, A.D.; Lara, J.; Willis, N.D.; Mathers, J.C.; Siervo, M. Effects of Vitamin C Supplementation on Glycaemic Control: A Systematic Review and Meta-Analysis of Randomised Controlled Trials. Eur. J. Clin. Nutr. 2017, 71, 1371–1380. [Google Scholar] [CrossRef]
- Xu, R.; Zhang, S.; Tao, A.; Chen, G.; Zhang, M. Influence of Vitamin E Supplementation on Glycaemic Control: A Meta-Analysis of Randomised Controlled Trials. PLoS ONE 2014, 9, e95008. [Google Scholar] [CrossRef]
- Pittas, A.G.; Harris, S.S.; Stark, P.C.; Dawson-Hughes, B. The Effects of Calcium and Vitamin D Supplementation on Blood Glucose and Markers of Inflammation in Nondiabetic Adults. Diabetes Care 2007, 30, 980–986. [Google Scholar] [CrossRef]
- Ali, A.; Ma, Y.; Reynolds, J.; Wise, J.P.; Inzucchi, S.E.; Katz, D.L. Chromium effects on glucose tolerance and insulin sesitivity in persons at risk for diabetes mellitus. Endocr. Pr. 2011, 17, 16. [Google Scholar] [CrossRef]
- Zhou, Q.; Guo, W.; Jia, Y.; Xu, J. Serum and Urinary Selenium Status in Patients with the Pre-Diabetes and Diabetes in Northeast China. Biol. Trace Elem. Res. 2019, 191, 61–69. [Google Scholar] [CrossRef] [PubMed]
- Xu, J.; Zhou, Q.; Liu, G.; Tan, Y.; Cai, L. Analysis of Serum and Urinal Copper and Zinc in Chinese Northeast Population with the Prediabetes or Diabetes with and without Complications. Oxid. Med. Cell Longev. 2013, 2013, 635214. [Google Scholar] [CrossRef]
- Hruby, A.; Meigs, J.B.; O’Donnell, C.J.; Jacques, P.F.; McKeown, N.M. Higher Magnesium Intake Reduces Risk of Impaired Glucose and Insulin Metabolism and Progression from Prediabetes to Diabetes in Middle-Aged Americans. Diabetes Care 2014, 37, 419–427. [Google Scholar] [CrossRef] [PubMed]
- Kieboom, B.C.T.; Ligthart, S.; Dehghan, A.; Kurstjens, S.; de Baaij, J.H.F.; Franco, O.H.; Hofman, A.; Zietse, R.; Stricker, B.H.; Hoorn, E.J. Serum Magnesium and the Risk of Prediabetes: A Population-Based Cohort Study. Diabetologia 2017, 60, 843–853. [Google Scholar] [CrossRef]
- Guerrero-Romero, F.; Rascón-Pacheco, R.A.; Rodríguez-Morán, M.; De La Peña, J.E.; Wacher, N.; Chavez-Negrete, A.; Madero, A.; Salcedo, A.; Medina-Escobedo, C.E.; Revilla-Monsalve, C.; et al. Hypomagnesaemia and Risk for Metabolic Glucose Disorders: A 10-Year Follow-up Study. Eur. J. Clin. Investig. 2008, 38, 389–396. [Google Scholar] [CrossRef]
- Wu, F.; Juonala, M.; Pahkala, K.; Buscot, M.J.; Sabin, M.A.; Pitkanen, N.; Ronnemaa, T.; Jula, A.; Lehtimaki, T.; Hutri-Kahonen, N.; et al. Youth and Long-Term Dietary Calcium Intake with Risk of Impaired Glucose Metabolism and Type 2 Diabetes in Adulthood. J. Clin. Endocrinol. Metab. 2019, 104, 2067–2074. [Google Scholar] [CrossRef] [PubMed]
- Alissa, E.M.; Bahjri, S.M.; Ahmed, W.H.; Al-Ama, N.; Ferns, G.A.A. Chromium Status and Glucose Tolerance in Saudi Men with and without Coronary Artery Disease. Biol. Trace Elem. Res. 2009, 131, 215–228. [Google Scholar] [CrossRef] [PubMed]
- Capdor, J.; Foster, M.; Petocz, P.; Samman, S. Zinc and Glycemic Control: A Meta-Analysis of Randomised Placebo Controlled Supplementation Trials in Humans. J. Trace Elem. Med. Biol. 2013, 27, 137–142. [Google Scholar] [CrossRef] [PubMed]
- Wang, X.; Wu, W.; Zheng, W.; Fang, X.; Chen, L.; Rink, L.; Min, J.; Wang, F. Zinc Supplementation Improves Glycemic Control for Diabetes Prevention and Management: A Systematic Review and Meta-Analysis of Randomized Controlled Trials. Am. J. Clin. Nutr. 2019, 110, 76–90. [Google Scholar] [CrossRef]
- Althuis, M.D.; Jordan, N.E.; Ludington, E.A.; Wittes, J.T. Glucose and Insulin Responses to Dietary Chromium Supplements: A Meta-Analysis. Am. J. Clin. Nutr. 2002, 76, 148–155. [Google Scholar] [CrossRef] [PubMed]
- Wang, Z.Q.; Cefalu, W.T. Current Concepts about Chromium Supplementation in Type 2 Diabetes and Insulin Resistance. Curr. Diabetis Rep. 2010, 10, 145–151. [Google Scholar] [CrossRef]
- Liu, Y.; Chai, S.; Zhang, X. Effect of Sarcopenia, Osteoporosis, and Osteosarcopenia on Spine Fracture in American Adults with Prediabetes. Front. Endocrinol. 2023, 14, 1163029. [Google Scholar] [CrossRef]
- Barouti, A.A.; Tynelius, P.; Lager, A.; Björklund, A. Fruit and Vegetable Intake and Risk of Prediabetes and Type 2 Diabetes: Results from a 20-Year Long Prospective Cohort Study in Swedish Men and Women. Eur. J. Nutr. 2022, 61, 3175–3187. [Google Scholar] [CrossRef]
- Li, L.; Yang, H.-Y.; Ma, Y.; Liang, X.-H.; Xu, M.; Zhang, J.; Huang, Z.-X.; Meng, L.-H.; Zhou, J.; Xian, J.; et al. Whole Fresh Fruit Intake and Risk of Incident Diabetes in Different Glycemic Stages: A Nationwide Prospective Cohort Investigation. Eur. J. Nutr. 2022, 62, 771–782. [Google Scholar] [CrossRef] [PubMed]
- Wu, C.; Liu, P.; Yuan, Z. Fruit and Vegetable Intake Is Inversely Associated with Type 2 Diabetes in Chinese Women: Results from the China Health and Nutrition Survey. Int. J. Food Sci. Nutr. 2021, 72, 208–218. [Google Scholar] [CrossRef] [PubMed]
- Zhang, S.; Meng, G.; Zhang, Q.; Liu, L.; Yao, Z.; Wu, H.; Gu, Y.; Wang, Y.; Zhang, T.; Wang, X.; et al. Dietary Fibre Intake and Risk of Prediabetes in China: Results from the Tianjin Chronic Low-Grade Systemic Inflammation and Health (TCLSIH) Cohort Study. Br. J. Nutr. 2022, 128, 753–761. [Google Scholar] [CrossRef] [PubMed]
- Lopez-Ridaura, R.; Willett, W.C.; Rimm, E.B.; Liu, S.; Stampfer, M.J.; Manson, J.E.; Hu, F.B. Magnesium Intake and Risk of Type 2 Diabetes in Men and Women. Diabetes Care 2004, 27, 134–140. [Google Scholar] [CrossRef] [PubMed]
- Li, M.; Fan, Y.; Zhang, X.; Hou, W.; Tang, Z. Fruit and Vegetable Intake and Risk of Type 2 Diabetes Mellitus: Meta-Analysis of Prospective Cohort Studies. BMJ Open 2014, 4, e005497. [Google Scholar] [CrossRef] [PubMed]
- Gulati, S.; Misra, A.; Tiwari, R.; Sharma, M.; Pandey, R.M.; Upadhyay, A.D.; Chandra Sati, H. Premeal Almond Load Decreases Postprandial Glycaemia, Adiposity and Reversed Prediabetes to Normoglycemia: A Randomized Controlled Trial. Clin. Nutr. ESPEN 2023, 54, 12–22. [Google Scholar] [CrossRef]
- Casas-Agustench, P.; López-Uriarte, P.; Bulló, M.; Ros, E.; Cabré-Vila, J.J.; Salas-Salvadó, J. Effects of One Serving of Mixed Nuts on Serum Lipids, Insulin Resistance and Inflammatory Markers in Patients with the Metabolic Syndrome. Nutr. Metab. Cardiovasc. Dis. 2011, 21, 126–135. [Google Scholar] [CrossRef] [PubMed]
- Hou, Y.-Y.; Ojo, O.; Wang, L.-L.; Wang, Q.; Jiang, Q.; Shao, X.-Y.; Wang, X.-H. A Randomized Controlled Trial to Compare the Effect of Peanuts and Almonds on the Cardio-Metabolic and Inflammatory Parameters in Patients with Type 2 Diabetes Mellitus. Nutrients 2018, 10, 1565. [Google Scholar] [CrossRef]
- Wien, M.; Bleich, D.; Raghuwanshi, M.; Gould-Forgerite, S.; Gomes, J.; Monahan-Couch, L.; Oda, K. Almond Consumption and Cardiovascular Risk Factors in Adults with Prediabetes. J. Am. Coll. Nutr. 2010, 29, 189–197. [Google Scholar] [CrossRef] [PubMed]
- Lu, L.W.; Silvestre, M.P.; Sequeira, I.R.; Plank, L.D.; Foster, M.; Middleditch, N.; Acevedo-Fani, A.; Hollingsworth, K.G.; Poppitt, S.D. A Higher-Protein Nut-Based Snack Product Suppresses Glycaemia and Decreases Glycaemic Response to Co-Ingested Carbohydrate in an Overweight Prediabetic Asian Chinese Cohort: The Tū Ora Postprandial RCT. J. Nutr. Sci. 2021, 10, e30. [Google Scholar] [CrossRef]
- Carroll, H.A.; Davis, M.G.; Papadaki, A. Higher Plain Water Intake Is Associated with Lower Type 2 Diabetes Risk: A Cross-Sectional Study in Humans. Nutr. Res. 2015, 35, 865–872. [Google Scholar] [CrossRef] [PubMed]
- Carroll, H.A.; Betts, J.A.; Johnson, L. An Investigation into the Relationship between Plain Water Intake and Glycated Hb (HbA1c): A Sex-Stratified, Cross-Sectional Analysis of the UK National Diet and Nutrition Survey (2008–2012). Br. J. Nutr. 2016, 116, 1–11. [Google Scholar] [CrossRef] [PubMed]
- Maersk, M.; Belza, A.; Stødkilde-Jørgensen, H.; Ringgaard, S.; Chabanova, E.; Thomsen, H.; Pedersen, S.B.; Astrup, A.; Richelsen, B. Sucrose-Sweetened Beverages Increase Fat Storage in the Liver, Muscle, and Visceral Fat Depot: A 6-Mo Randomized Intervention Study. Am. J. Clin. Nutr. 2012, 95, 283–289. [Google Scholar] [CrossRef] [PubMed]
- Raben, A.; Vasilaras, T.H.; Møller, A.C.; Astrup, A. Sucrose Compared with Artificial Sweeteners: Different Effects on Ad Libitum Food Intake and Body Weight after 10 Wk of Supplementation in Overweight Subjects. Am. J. Clin. Nutr. 2002, 76, 721–729. [Google Scholar] [CrossRef] [PubMed]
- Sylvetsky, A.C.; Jin, Y.; Clark, E.J.; Welsh, J.A.; Rother, K.I.; Talegawkar, S.A. Consumption of Low-Calorie Sweeteners among Children and Adults in the United States. J. Acad. Nutr. Diet. 2017, 117, 441–448.e2. [Google Scholar] [CrossRef] [PubMed]
- Drouin-Chartier, J.-P.; Zheng, Y.; Li, Y.; Malik, V.; Pan, A.; Bhupathiraju, S.N.; Tobias, D.K.; Manson, J.E.; Willett, W.C.; Hu, F.B. Changes in Consumption of Sugary Beverages and Artificially Sweetened Beverages and Subsequent Risk of Type 2 Diabetes: Results from Three Large Prospective U.S. Cohorts of Women and Men. Diabetes Care 2019, 42, 2181–2189. [Google Scholar] [CrossRef]
- Toews, I.; Lohner, S.; Küllenberg de Gaudry, D.; Sommer, H.; Meerpohl, J.J. Association between Intake of Non-Sugar Sweeteners and Health Outcomes: Systematic Review and Meta-Analyses of Randomised and Non-Randomised Controlled Trials and Observational Studies. BMJ 2019, 364, k4718. [Google Scholar] [CrossRef]
- Khan, T.A.; Lee, J.J.; Ayoub-Charette, S.; Noronha, J.C.; McGlynn, N.; Chiavaroli, L.; Sievenpiper, J.L. WHO Guideline on the Use of Non-Sugar Sweeteners: A Need for Reconsideration. Eur. J. Clin. Nutr. 2023, 77, 1009–1013. [Google Scholar] [CrossRef]
- ElSayed, N.A.; Aleppo, G.; Aroda, V.R.; Bannuru, R.R.; Brown, F.M.; Bruemmer, D.; Collins, B.S.; Hilliard, M.E.; Isaacs, D.; Johnson, E.L.; et al. 15. Management of Diabetes in Pregnancy: Standards of Care in Diabetes-2023. Diabetes Care 2023, 46, S254–S266. [Google Scholar] [CrossRef]
- Franz, M.J.; MacLeod, J.; Evert, A.; Brown, C.; Gradwell, E.; Handu, D.; Reppert, A.; Robinson, M. Academy of Nutrition and Dietetics Nutrition Practice Guideline for Type 1 and Type 2 Diabetes in Adults: Systematic Review of Evidence for Medical Nutrition Therapy Effectiveness and Recommendations for Integration into the Nutrition Care Process. J. Acad. Nutr. Diet. 2017, 117, 1659–1679. [Google Scholar] [CrossRef]
- Hedrick, V.E.; Nieto, C.; Grilo, M.F.; Sylvetsky, A.C. Non-Sugar Sweeteners: Helpful or Harmful? The Challenge of Developing Intake Recommendations with the Available Research. BMJ 2023, 383, e075293. [Google Scholar] [CrossRef] [PubMed]
- Gepner, Y.; Golan, R.; Harman-Boehm, I.; Henkin, Y.; Schwarzfuchs, D.; Shelef, I.; Durst, R.; Kovsan, J.; Bolotin, A.; Leitersdorf, E.; et al. Effects of Initiating Moderate Alcohol Intake on Cardiometabolic Risk in Adults with Type 2 Diabetes. Ann. Intern. Med. 2015, 163, 569–579. [Google Scholar] [CrossRef]
- da Luz, P.L.; Coimbra, S.; Favarato, D.; Albuquerque, C.; Mochiduky, R.I.; Rochitte, C.E.; Hojaij, E.; Gonsalves, C.R.L.; Laurindo, F.R. Coronary Artery Plaque Burden and Calcium Scores in Healthy Men Adhering to Long-Term Wine Drinking or Alcohol Abstinence. Braz. J. Med. Biol. Res. 2014, 47, 697–705. [Google Scholar] [CrossRef] [PubMed]
- Blomster, J.I.; Zoungas, S.; Chalmers, J.; Li, Q.; Chow, C.K.; Woodward, M.; Mancia, G.; Poulter, N.; Williams, B.; Harrap, S.; et al. The Relationship Between Alcohol Consumption and Vascular Complications and Mortality in Individuals with Type 2 Diabetes. Diabetes Care 2014, 37, 1353–1359. [Google Scholar] [CrossRef] [PubMed]
- Li, M.J.; Ren, J.; Zhang, W.S.; Jiang, C.Q.; Jin, Y.L.; Lam, T.H.; Cheng, K.K.; Thomas, G.N.; Xu, L. Association of Alcohol Drinking with Incident Type 2 Diabetes and Pre-diabetes: The Guangzhou Biobank Cohort Study. Diabetes Metab. Res. Rev. 2022, 38, e3548. [Google Scholar] [CrossRef]
- Cullmann, M.; Hilding, A.; Östenson, C.-G. Alcohol Consumption and Risk of Pre-diabetes and Type 2 Diabetes Development in a Swedish Population. Diabet. Med. 2012, 29, 441–452. [Google Scholar] [CrossRef]
- Suebsamran, P.; Choenchoopon, H.; Rojanasaksothorn, S.; Loiha, S.; Chamnan, P. Association between Alcohol Consumption and Pre-Diabetes among 383,442 Thai Population Aged 15 Years and Older in Ubon Ratchathani: Analytical Cross-Sectional Study. J. Med. Assoc. Thai 2016, 99 (Suppl. S1), S35–S42. [Google Scholar]
- Baliunas, D.O.; Taylor, B.J.; Irving, H.; Roerecke, M.; Patra, J.; Mohapatra, S.; Rehm, J. Alcohol as a Risk Factor for Type 2 Diabetes. Diabetes Care 2009, 32, 2123–2132. [Google Scholar] [CrossRef]
- Arion, W.J.; Canfield, W.K.; Ramos, F.C.; Schindler, P.W.; Burger, H.-J.; Hemmerle, H.; Schubert, G.; Below, P.; Herling, A.W. Chlorogenic Acid and Hydroxynitrobenzaldehyde: New Inhibitors of Hepatic Glucose 6-Phosphatase. Arch. Biochem. Biophys. 1997, 339, 315–322. [Google Scholar] [CrossRef]
- Yanagimoto, A.; Matsui, Y.; Yamaguchi, T.; Saito, S.; Hanada, R.; Hibi, M. Acute Dose–Response Effectiveness of Combined Catechins and Chlorogenic Acids on Postprandial Glycemic Responses in Healthy Men: Results from Two Randomized Studies. Nutrients 2023, 15, 777. [Google Scholar] [CrossRef]
- Sakhi, A.K.; Andersen, L.F.; Jacobs, D.R.; Blomhoff, R.; Svilaas, A.; Svilaas, T.; Ström, E.C.; Ose, L. Intakes of Antioxidants in Coffee, Wine, and Vegetables Are Correlated with Plasma Carotenoids in Humans. J. Nutr. 2004, 134, 562–567. [Google Scholar] [CrossRef] [PubMed]
- Poole, R.; Kennedy, O.J.; Roderick, P.; Fallowfield, J.A.; Hayes, P.C.; Parkes, J. Coffee Consumption and Health: Umbrella Review of Meta-Analyses of Multiple Health Outcomes. BMJ 2017, 359, j5024. [Google Scholar] [CrossRef] [PubMed]
- Ding, M.; Bhupathiraju, S.N.; Chen, M.; van Dam, R.M.; Hu, F.B. Caffeinated and Decaffeinated Coffee Consumption and Risk of Type 2 Diabetes: A Systematic Review and a Dose-Response Meta-Analysis. Diabetes Care 2014, 37, 569–586. [Google Scholar] [CrossRef] [PubMed]
- van Dam, R.M. Coffee Consumption and Risk of Type 2 Diabetes, Cardiovascular Diseases, and Cancer. Appl. Physiol. Nutr. Metab. 2008, 33, 1269–1283. [Google Scholar] [CrossRef] [PubMed]
- Meng, S.; Cao, J.; Feng, Q.; Peng, J.; Hu, Y. Roles of Chlorogenic Acid on Regulating Glucose and Lipids Metabolism: A Review. Evid. Based Complement. Altern. Med. 2013, 2013, 801457. [Google Scholar] [CrossRef] [PubMed]
- Jung, M.E.; Bourne, J.E.; Beauchamp, M.R.; Robinson, E.; Little, J.P. High-Intensity Interval Training as an Efficacious Alternative to Moderate-Intensity Continuous Training for Adults with Prediabetes. J. Diabetes Res. 2015, 2015, 191595. [Google Scholar] [CrossRef]
- Snowling, N.J.; Hopkins, W.G. Effects of Different Modes of Exercise Training on Glucose Control and Risk Factors for Complications in Type 2 Diabetic Patients: A Meta-Analysis. Diabetes Care 2006, 29, 2518–2527. [Google Scholar] [CrossRef] [PubMed]
- De Nardi, A.T.; Tolves, T.; Lenzi, T.L.; Signori, L.U.; Silva, A.M.V. da High-Intensity Interval Training versus Continuous Training on Physiological and Metabolic Variables in Prediabetes and Type 2 Diabetes: A Meta-Analysis. Diabetes Res. Clin. Pr. 2018, 137, 149–159. [Google Scholar] [CrossRef]
- Jadhav, R.A.; Maiya, G.A.; Hombali, A.; Umakanth, S.; Shivashankar, K.N. Effect of Physical Activity Promotion on Adiponectin, Leptin and Other Inflammatory Markers in Prediabetes: A Systematic Review and Meta-Analysis of Randomized Controlled Trials. Acta Diabetol. 2021, 58, 419–429. [Google Scholar] [CrossRef] [PubMed]
- Qin, J.; Li, Y.; Cai, Z.; Li, S.; Zhu, J.; Zhang, F.; Liang, S.; Zhang, W.; Guan, Y.; Shen, D.; et al. A Metagenome-Wide Association Study of Gut Microbiota in Type 2 Diabetes. Nature 2012, 490, 55–60. [Google Scholar] [CrossRef]
- Larsen, N.; Vogensen, F.K.; van den Berg, F.W.J.; Nielsen, D.S.; Andreasen, A.S.; Pedersen, B.K.; Al-Soud, W.A.; Sørensen, S.J.; Hansen, L.H.; Jakobsen, M. Gut Microbiota in Human Adults with Type 2 Diabetes Differs from Non-Diabetic Adults. PLoS ONE 2010, 5, e9085. [Google Scholar] [CrossRef]
- Tang, W.H.W.; Wang, Z.; Li, X.S.; Fan, Y.; Li, D.S.; Wu, Y.; Hazen, S.L. Increased Trimethylamine N-Oxide Portends High Mortality Risk Independent of Glycemic Control in Patients with Type 2 Diabetes Mellitus. Clin. Chem. 2017, 63, 297–306. [Google Scholar] [CrossRef]
- Li, Y.; Wang, D.D.; Chiuve, S.E.; Manson, J.E.; Willett, W.C.; Hu, F.B.; Qi, L. Dietary Phosphatidylcholine Intake and Type 2 Diabetes in Men and Women. Diabetes Care 2015, 38, e13–e14. [Google Scholar] [CrossRef] [PubMed]
- Roy, S.; Yuzefpolskaya, M.; Nandakumar, R.; Colombo, P.C.; Demmer, R.T. Plasma Trimethylamine-N-Oxide and Impaired Glucose Regulation: Results from The Oral Infections, Glucose Intolerance and Insulin Resistance Study (ORIGINS). PLoS ONE 2020, 15, e0227482. [Google Scholar] [CrossRef] [PubMed]
- Allin, K.H.; Tremaroli, V.; Caesar, R.; Jensen, B.A.H.; Damgaard, M.T.F.; Bahl, M.I.; Licht, T.R.; Hansen, T.H.; Nielsen, T.; Dantoft, T.M.; et al. Aberrant Intestinal Microbiota in Individuals with Prediabetes. Diabetologia 2018, 61, 810–820. [Google Scholar] [CrossRef] [PubMed]
- Zhong, H.; Ren, H.; Lu, Y.; Fang, C.; Hou, G.; Yang, Z.; Chen, B.; Yang, F.; Zhao, Y.; Shi, Z.; et al. Distinct Gut Metagenomics and Metaproteomics Signatures in Prediabetics and Treatment-Naïve Type 2 Diabetics. EBioMedicine 2019, 47, 373–383. [Google Scholar] [CrossRef] [PubMed]
- Letchumanan, G.; Abdullah, N.; Marlini, M.; Baharom, N.; Lawley, B.; Omar, M.R.; Mohideen, F.B.S.; Addnan, F.H.; Nur Fariha, M.M.; Ismail, Z.; et al. Gut Microbiota Composition in Prediabetes and Newly Diagnosed Type 2 Diabetes: A Systematic Review of Observational Studies. Front. Cell Infect. Microbiol. 2022, 12, 985. [Google Scholar] [CrossRef]
- Gurung, M.; Li, Z.; You, H.; Rodrigues, R.; Jump, D.B.; Morgun, A.; Shulzhenko, N. Role of Gut Microbiota in Type 2 Diabetes Pathophysiology. EBioMedicine 2020, 51, 102590. [Google Scholar] [CrossRef] [PubMed]
- Barengolts, E. Gut Microbiota, Prebiotics, Probiotics, and Synbiotics in Management of Obesity and Prediabetes: Review of Randomized Controlled Trials. Endocr. Pract. 2016, 22, 1224–1234. [Google Scholar] [CrossRef]
- Wang, X.; Yang, J.; Qiu, X.; Wen, Q.; Liu, M.; Zhou, D.; Chen, Q. Probiotics, Pre-Biotics and Synbiotics in the Treatment of Pre-Diabetes: A Systematic Review of Randomized Controlled Trials. Front. Public Health 2021, 9, 645035. [Google Scholar] [CrossRef]
- Li, Y.; Wu, Y.; Wu, L.; Qin, L.; Liu, T. The Effects of Probiotic Administration on Patients with Prediabetes: A Meta-Analysis and Systematic Review. J. Transl. Med. 2022, 20, 498. [Google Scholar] [CrossRef] [PubMed]
- Zeighamy Alamdary, S.; Afifirad, R.; Asgharzadeh, S.; Asadollahi, P.; Mahdizade Ari, M.; Dashtibin, S.; Sabaghan, M.; Shokouhamiri, M.R.; Ghanavati, R.; Darbandi, A. The Influence of Probiotics Consumption on Management of Prediabetic State: A Systematic Review of Clinical Trials. Int. J. Clin. Pract. 2022, 2022, 5963679. [Google Scholar] [CrossRef] [PubMed]
- Bock, P.M.; Telo, G.H.; Ramalho, R.; Sbaraini, M.; Leivas, G.; Martins, A.F.; Schaan, B.D. The Effect of Probiotics, Prebiotics or Synbiotics on Metabolic Outcomes in Individuals with Diabetes: A Systematic Review and Meta-Analysis. Diabetologia 2021, 64, 26–41. [Google Scholar] [CrossRef] [PubMed]
- Zhang, Q.; Wu, Y.; Fei, X. Effect of Probiotics on Glucose Metabolism in Patients with Type 2 Diabetes Mellitus: A Meta-Analysis of Randomized Controlled Trials. Medicina 2016, 52, 28–34. [Google Scholar] [CrossRef]
- Pierre, K.B.; Jones, C.M.; Stain, S.C. Benefits of Intense Glucose Control in Critically Ill Patients. Curr. Surg. 2005, 62, 277–282. [Google Scholar] [CrossRef] [PubMed]
- Zhang, Z.; Azizi, M.; Lee, M.; Davidowsky, P.; Lawrence, P.; Abbaspourrad, A. A Versatile, Cost-Effective, and Flexible Wearable Biosensor for in situ and ex situ Sweat Analysis, and Personalized Nutrition Assessment. Lab. Chip 2019, 19, 3448–3460. [Google Scholar] [CrossRef] [PubMed]
- Cui, Y.; Zhang, H.; Zhu, J.; Peng, L.; Duan, Z.; Liu, T.; Zuo, J.; Xing, L.; Liao, Z.; Wang, S.; et al. Unstimulated Parotid Saliva Is a Better Method for Blood Glucose Prediction. Appl. Sci. 2021, 11, 11367. [Google Scholar] [CrossRef]
- Cui, Y.; Zhang, H.; Zhu, J.; Liao, Z.; Wang, S.; Liu, W. Correlations of Salivary and Blood Glucose Levels among Six Saliva Collection Methods. Int. J. Env. Res. Public Health 2022, 19, 4122. [Google Scholar] [CrossRef]
- Schaffzin, J.K.; Southwick, K.L.; Clement, E.J.; Konings, F.; Ganova-Raeva, L.; Xia, G.; Khudyakov, Y.; Johnson, G.S. Transmission of Hepatitis B Virus Associated with Assisted Monitoring of Blood Glucose at an Assisted Living Facility in New York State. Am. J. Infect. Control 2012, 40, 726–731. [Google Scholar] [CrossRef]
- Han, B.; Liu, W.; Yang, S.; Wang, S.; Du, J.; Liu, Y.; Cui, F. Association between Self-Monitoring of Blood Glucose and Hepatitis B Virus Infection among People with Diabetes Mellitus: A Cross-Sectional Study in Gansu Province, China. BMJ Open 2021, 11, e048463. [Google Scholar] [CrossRef]
- Finney, S.J. Glucose Control and Mortality in Critically Ill Patients. JAMA 2003, 290, 2041. [Google Scholar] [CrossRef]
- Evans, J.M.; Newton, R.W.; Ruta, D.A.; MacDonald, T.M.; Stevenson, R.J.; Morris, A.D. Frequency of Blood Glucose Monitoring in Relation to Glycaemic Control: Observational Study with Diabetes Database. BMJ 1999, 319, 83–86. [Google Scholar] [CrossRef] [PubMed]
- Van den Berghe, G.; Wouters, P.J.; Bouillon, R.; Weekers, F.; Verwaest, C.; Schetz, M.; Vlasselaers, D.; Ferdinande, P.; Lauwers, P. Outcome Benefit of Intensive Insulin Therapy in the Critically Ill: Insulin Dose versus Glycemic Control. Crit. Care Med. 2003, 31, 359–366. [Google Scholar] [CrossRef] [PubMed]
- Sørgård, B.; Iversen, M.M.; Mårtensson, J. Continuous Glucose Monitoring in Adults with Type 1 Diabetes: A Balance between Benefits and Barriers: A Critical Incident Study. J. Clin. Nurs. 2019, 28, 3318–3329. [Google Scholar] [CrossRef] [PubMed]
- Hilliard, M.E.; Levy, W.; Anderson, B.J.; Whitehouse, A.L.; Commissariat, P.V.; Harrington, K.R.; Laffel, L.M.; Miller, K.M.; Van Name, M.; Tamborlane, W.V.; et al. Benefits and Barriers of Continuous Glucose Monitoring in Young Children with Type 1 Diabetes. Diabetes Technol. Ther. 2019, 21, 493–498. [Google Scholar] [CrossRef] [PubMed]
- Engler, R.; Routh, T.L.; Lucisano, J.Y. Adoption Barriers for Continuous Glucose Monitoring and Their Potential Reduction with a Fully Implanted System: Results from Patient Preference Surveys. Clin. Diabetes 2018, 36, 50–58. [Google Scholar] [CrossRef]
- Hayford, J.T.; Weydert, J.A.; Thompson, R.G. Validity of Urine Glucose Measurements for Estimating Plasma Glucose Concentration. Diabetes Care 1983, 6, 40–44. [Google Scholar] [CrossRef] [PubMed]
- Morris, L.R. Correlation Between Plasma and Urine Glucose in Diabetes. Ann. Intern. Med. 1981, 94, 469. [Google Scholar] [CrossRef] [PubMed]
- Malanda, U.L.; Welschen, L.M.C.; Riphagen, I.I.; Dekker, J.M.; Nijpels, G.; Bot, S.D.M. Self-Monitoring of Blood Glucose in Patients with Type 2 Diabetes Mellitus Who Are Not Using Insulin. Cochrane Database Syst. Rev. 2012, 1, CD005060. [Google Scholar] [CrossRef]
- Ilea, A.; Andrei, V.; Feurdean, C.N.; Băbțan, A.-M.; Petrescu, N.B.; Câmpian, R.S.; Boșca, A.B.; Ciui, B.; Tertiș, M.; Săndulescu, R.; et al. Saliva, a Magic Biofluid Available for Multilevel Assessment and a Mirror of General Health-A Systematic Review. Biosensors 2019, 9, 27. [Google Scholar] [CrossRef]
- Macdonald-Clarke, C.J.; Martin, B.R.; McCabe, L.D.; McCabe, G.P.; Lachcik, P.J.; Wastney, M.; Weaver, C.M. Bioavailability of Potassium from Potatoes and Potassium Gluconate: A Randomized Dose Response Trial. Am. J. Clin. Nutr. 2016, 104, 346–353. [Google Scholar] [CrossRef] [PubMed]
- Garber, A.J.; Handelsman, Y.; Grunberger, G.; Einhorn, D.; Abrahamson, M.J.; Barzilay, J.I.; Blonde, L.; Bush, M.A.; DeFronzo, R.A.; Garber, J.R.; et al. Consensus statement by the american association of clinical endocrinologists and american college of endocrinology on the comprehensive type 2 diabetes management algorithm—2020 executive summary. Endocrinol. Pract. 2020, 26, 107–139. [Google Scholar] [CrossRef] [PubMed]
- Campbell, A.P.; Rains, T.M. Dietary Protein Is Important in the Practical Management of Prediabetes and Type 2 Diabetes. J. Nutr. 2015, 145, 164S–169S. [Google Scholar] [CrossRef] [PubMed]
- Nuttall, F.Q.; Mooradian, A.D.; Gannon, M.C.; Billington, C.; Krezowski, P. Effect of Protein Ingestion on the Glucose and Insulin Response to a Standardized Oral Glucose Load. Diabetes Care 1984, 7, 465–470. [Google Scholar] [CrossRef] [PubMed]
- Rietman, A.; Schwarz, J.; Tomé, D.; Kok, F.J.; Mensink, M. High Dietary Protein Intake, Reducing or Eliciting Insulin Resistance? Eur. J. Clin. Nutr. 2014, 68, 973–979. [Google Scholar] [CrossRef]
- Stentz, F.B.; Mikhael, A.; Kineish, O.; Christman, J.; Sands, C. High Protein Diet Leads to Prediabetes Remission and Positive Changes in Incretins and Cardiovascular Risk Factors. Nutr. Metab. Cardiovasc. Dis. 2021, 31, 1227–1237. [Google Scholar] [CrossRef] [PubMed]
- Ferrannini, E.; Simonson, D.C.; Katz, L.D.; Reichard, G.J.; Bevilacqua, S.; Barrett, E.J.; Olsson, M.; DeFronzo, R.A. The Disposal of an Oral Glucose Load in Patients with Non-Insulin-Dependent Diabetes. Metabolism 1988, 37, 79–85. [Google Scholar] [CrossRef] [PubMed]
- Gannon, M.C.; Nuttall, F.Q.; Saeed, A.; Jordan, K.; Hoover, H. An Increase in Dietary Protein Improves the Blood Glucose Response in Persons with Type 2 Diabetes. Am. J. Clin. Nutr. 2003, 78, 734–741. [Google Scholar] [CrossRef]
- Ajala, O.; English, P.; Pinkney, J. Systematic Review and Meta-Analysis of Different Dietary Approaches to the Management of Type 2 Diabetes. Am. J. Clin. Nutr. 2013, 97, 505–516. [Google Scholar] [CrossRef]
- Clayton, Z.S.; Fusco, E.; Kern, M. Egg Consumption and Heart Health: A Review. Nutrition 2017, 37, 79–85. [Google Scholar] [CrossRef]
- Anderson, C.A.; Campbell, W.W. USDA 2015 Dietary Guidelines Advisory Committee Report: A Call for Bold Action to Create a Culture of Health. Nutr. Today 2015, 50, 172–173. [Google Scholar] [CrossRef]
- Ademiluyi, A.O.; Oboh, G. Phenolic-Rich Extracts from Selected Tropical Underutilized Legumes Inhibit α-Amylase, α-Glucosidase, and Angiotensin I Converting Enzyme in Vitro. J. Basic Clin. Physiol. Pharmacol. 2012, 23. [Google Scholar] [CrossRef] [PubMed]
- Kwon, Y.-I.; Apostolidis, E.; Kim, Y.-C.; Shetty, K. Health Benefits of Traditional Corn, Beans, and Pumpkin: In Vitro Studies for Hyperglycemia and Hypertension Management. J. Med. Food 2007, 10, 266–275. [Google Scholar] [CrossRef] [PubMed]
- Koh, L.W.; Wong, L.L.; Loo, Y.Y.; Kasapis, S.; Huang, D. Evaluation of Different Teas against Starch Digestibility by Mammalian Glycosidases. J. Agric. Food Chem. 2010, 58, 148–154. [Google Scholar] [CrossRef]
- Hara, Y.; Honda, M. The Inhibition of α-Amylase by Tea Polyphenols. Agric. Biol. Chem. 1990, 54, 1939–1945. [Google Scholar] [CrossRef]
- Kurimoto, Y.; Shibayama, Y.; Inoue, S.; Soga, M.; Takikawa, M.; Ito, C.; Nanba, F.; Yoshida, T.; Yamashita, Y.; Ashida, H.; et al. Black Soybean Seed Coat Extract Ameliorates Hyperglycemia and Insulin Sensitivity via the Activation of AMP-Activated Protein Kinase in Diabetic Mice. J. Agric. Food Chem. 2013, 61, 5558–5564. [Google Scholar] [CrossRef] [PubMed]
- Baothman, O.A.; Zamzami, M.A.; Taher, I.; Abubaker, J.; Abu-Farha, M. The Role of Gut Microbiota in the Development of Obesity and Diabetes. Lipids Health Dis. 2016, 15, 108. [Google Scholar] [CrossRef]
- Carbohydrates in Human Nutrition. Report of a Joint FAO/WHO Expert Consultation. FAO Food Nutr. Pap. 1998, 66, 1–140. [Google Scholar]
- Atkinson, F.S.; Foster-Powell, K.; Brand-Miller, J.C. International Tables of Glycemic Index and Glycemic Load Values: 2008. Diabetes Care 2008, 31, 2281–2283. [Google Scholar] [CrossRef]
- Xu, J.; Han, X.; Chen, Q.; Cai, M.; Tian, J.; Yan, Z.; Guo, Q.; Xu, J.; Lu, H. Association between Sarcopenia and Prediabetes among Non-Elderly US Adults. J. Endocrinol. Investig. 2023, 46, 1815–1824. [Google Scholar] [CrossRef]
- Stinkens, R.; Goossens, G.H.; Jocken, J.W.E.; Blaak, E.E. Targeting Fatty Acid Metabolism to Improve Glucose Metabolism. Obes. Rev. 2015, 16, 715–757. [Google Scholar] [CrossRef]
- Palomer, X.; Pizarro-Delgado, J.; Barroso, E.; Vázquez-Carrera, M. Palmitic and Oleic Acid: The Yin and Yang of Fatty Acids in Type 2 Diabetes Mellitus. Trends Endocrinol. Metab. 2018, 29, 178–190. [Google Scholar] [CrossRef] [PubMed]
- Shetty, S.; Kumari, S. Fatty Acids and Their Role in Type-2 Diabetes (Review). Exp. Ther. Med. 2021, 22, 706. [Google Scholar] [CrossRef] [PubMed]
- Guasch-Ferré, M.; Merino, J.; Sun, Q.; Fitó, M.; Salas-Salvadó, J. Dietary Polyphenols, Mediterranean Diet, Prediabetes, and Type 2 Diabetes: A Narrative Review of the Evidence. Oxid. Med. Cell Longev. 2017, 2017, 6723931. [Google Scholar] [CrossRef]
- Al-Maskari, M.Y.; Waly, M.I.; Ali, A.; Al-Shuaibi, Y.S.; Ouhtit, A. Folate and Vitamin B12 Deficiency and Hyperhomocysteinemia Promote Oxidative Stress in Adult Type 2 Diabetes. Nutrition 2012, 28, e23–e26. [Google Scholar] [CrossRef] [PubMed]
- Hong, S.M.; Woo, H.W.; Kim, M.K.; Kim, S.Y.; Lee, Y.-H.; Shin, D.H.; Shin, M.-H.; Chun, B.-Y.; Choi, B.Y. A Prospective Association between Dietary Folate Intake and Type 2 Diabetes Risk among Korean Adults Aged 40 Years or Older: The Korean Multi-Rural Communities Cohort (MRCohort) Study. Br. J. Nutr. 2017, 118, 1078–1088. [Google Scholar] [CrossRef]
- Eshak, E.S.; Iso, H.; Muraki, I.; Tamakoshi, A. Among the Water-Soluble Vitamins, Dietary Intakes of Vitamins C, B2 and Folate Are Associated with the Reduced Risk of Diabetes in Japanese Women but Not Men. Br. J. Nutr. 2019, 121, 1357–1364. [Google Scholar] [CrossRef]
- Paschou, S.A.; Dede, A.D.; Anagnostis, P.G.; Vryonidou, A.; Morganstein, D.; Goulis, D.G. Type 2 Diabetes and Osteoporosis: A Guide to Optimal Management. J. Clin. Endocrinol. Metab. 2017, 102, 3621–3634. [Google Scholar] [CrossRef] [PubMed]
- Ferrari, S.L.; Abrahamsen, B.; Napoli, N.; Akesson, K.; Chandran, M.; Eastell, R.; El-Hajj Fuleihan, G.; Josse, R.; Kendler, D.L.; Kraenzlin, M.; et al. Diagnosis and Management of Bone Fragility in Diabetes: An Emerging Challenge. Osteoporos. Int. 2018, 29, 2585–2596. [Google Scholar] [CrossRef]
- Suàrez, A.; Pulido, N.; Casla, A.; Casanova, B.; Arrieta, F.J.; Rovira, A. Impaired Tyrosine-Kinase Activity of Muscle Insulin Receptors from Hypomagnesaemic Rats. Diabetologia 1995, 38, 1262–1270. [Google Scholar] [CrossRef]
- Barbagallo, M.; Dominguez, L.J.; Galioto, A.; Ferlisi, A.; Cani, C.; Malfa, L.; Pineo, A.; Busardo’, A.; Paolisso, G. Role of Magnesium in Insulin Action, Diabetes and Cardio-Metabolic Syndrome X. Mol. Asp. Med. 2003, 24, 39–52. [Google Scholar] [CrossRef] [PubMed]
- Banaszak, M.; Górna, I.; Przysławski, J. Non-Pharmacological Treatments for Insulin Resistance: Effective Intervention of Plant-Based Diets—A Critical Review. Nutrients 2022, 14, 1400. [Google Scholar] [CrossRef] [PubMed]
- Kang, I.; Buckner, T.; Shay, N.F.; Gu, L.; Chung, S. Improvements in Metabolic Health with Consumption of Ellagic Acid and Subsequent Conversion into Urolithins: Evidence and Mechanisms. Adv. Nutr. 2016, 7, 961–972. [Google Scholar] [CrossRef]
- Duke, N.N. Youth Beverage Intake and Reported Prediabetes: Choice and Frequency Matter. J. Pediatr. Health Care 2021, 35, 216–225. [Google Scholar] [CrossRef] [PubMed]
- Castellarin, S.D.; Bavaresco, L.; Falginella, L.; Gonçalves, M.I.V.Z.; Di Gaspero, G.; Gerós, H.; Delrot, S. Phenolics in Grape Berry and Key Antioxidants. In The Biochemistry of the Grape Berry; Castellarin, S.D., Bavaresco, L., Falginella, L., Gonçalves, M.I.V.Z., Di Gaspero, G., Eds.; Bentham Science Publishers: Sharjah, United Arab Emirates, 2012; pp. 89–110. [Google Scholar]
- Gómez-Plaza, E.; Gil-Muñoz, R. Biochemistry of Wine and Beer. Biomolecules 2021, 11, 59. [Google Scholar] [CrossRef] [PubMed]
- Ridaura, V.K.; Faith, J.J.; Rey, F.E.; Cheng, J.; Duncan, A.E.; Kau, A.L.; Griffin, N.W.; Lombard, V.; Henrissat, B.; Bain, J.R.; et al. Gut Microbiota from Twins Discordant for Obesity Modulate Metabolism in Mice. Science 2013, 341, 1241214. [Google Scholar] [CrossRef] [PubMed]
- Safari, Z.; Gérard, P. The Links between the Gut Microbiome and Non-Alcoholic Fatty Liver Disease (NAFLD). Cell. Mol. Life Sci. 2019, 76, 1541–1558. [Google Scholar] [CrossRef]
- Thursby, E.; Juge, N. Introduction to the Human Gut Microbiota. Biochem. J. 2017, 474, 1823–1836. [Google Scholar] [CrossRef]
- Aw, W.; Fukuda, S. Understanding the Role of the Gut Ecosystem in Diabetes Mellitus. J. Diabetes Investig. 2018, 9, 5–12. [Google Scholar] [CrossRef] [PubMed]
- Thomas, C.; Gioiello, A.; Noriega, L.; Strehle, A.; Oury, J.; Rizzo, G.; Macchiarulo, A.; Yamamoto, H.; Mataki, C.; Pruzanski, M.; et al. TGR5-Mediated Bile Acid Sensing Controls Glucose Homeostasis. Cell Metab. 2009, 10, 167–177. [Google Scholar] [CrossRef]
- Amar, J.; Chabo, C.; Waget, A.; Klopp, P.; Vachoux, C.; Bermúdez-Humarán, L.G.; Smirnova, N.; Bergé, M.; Sulpice, T.; Lahtinen, S.; et al. Intestinal Mucosal Adherence and Translocation of Commensal Bacteria at the Early Onset of Type 2 Diabetes: Molecular Mechanisms and Probiotic Treatment. EMBO Mol. Med. 2011, 3, 559–572. [Google Scholar] [CrossRef]
- Amyot, J.; Semache, M.; Ferdaoussi, M.; Fontés, G.; Poitout, V. Lipopolysaccharides Impair Insulin Gene Expression in Isolated Islets of Langerhans via Toll-Like Receptor-4 and NF-ΚB Signalling. PLoS ONE 2012, 7, e36200. [Google Scholar] [CrossRef]
- Kawano, Y.; Edwards, M.; Huang, Y.; Bilate, A.M.; Araujo, L.P.; Tanoue, T.; Atarashi, K.; Ladinsky, M.S.; Reiner, S.L.; Wang, H.H.; et al. Microbiota Imbalance Induced by Dietary Sugar Disrupts Immune-Mediated Protection from Metabolic Syndrome. Cell 2022, 185, 3501–3519.e20. [Google Scholar] [CrossRef] [PubMed]
- Muccioli, G.G.; Naslain, D.; Bäckhed, F.; Reigstad, C.S.; Lambert, D.M.; Delzenne, N.M.; Cani, P.D. The Endocannabinoid System Links Gut Microbiota to Adipogenesis. Mol. Syst. Biol. 2010, 6, 392. [Google Scholar] [CrossRef] [PubMed]
- Lefebvre, P.; Cariou, B.; Lien, F.; Kuipers, F.; Staels, B. Role of Bile Acids and Bile Acid Receptors in Metabolic Regulation. Physiol. Rev. 2009, 89, 147–191. [Google Scholar] [CrossRef] [PubMed]
- Ridlon, J.M.; Kang, D.-J.; Hylemon, P.B. Bile Salt Biotransformations by Human Intestinal Bacteria. J. Lipid Res. 2006, 47, 241–259. [Google Scholar] [CrossRef] [PubMed]
- Chávez-Talavera, O.; Tailleux, A.; Lefebvre, P.; Staels, B. Bile Acid Control of Metabolism and Inflammation in Obesity, Type 2 Diabetes, Dyslipidemia, and Nonalcoholic Fatty Liver Disease. Gastroenterology 2017, 152, 1679–1694.e3. [Google Scholar] [CrossRef]
- Katsuma, S.; Hirasawa, A.; Tsujimoto, G. Bile Acids Promote Glucagon-like Peptide-1 Secretion through TGR5 in a Murine Enteroendocrine Cell Line STC-1. Biochem. Biophys. Res. Commun. 2005, 329, 386–390. [Google Scholar] [CrossRef] [PubMed]
- Trabelsi, M.-S.; Daoudi, M.; Prawitt, J.; Ducastel, S.; Touche, V.; Sayin, S.I.; Perino, A.; Brighton, C.A.; Sebti, Y.; Kluza, J.; et al. Farnesoid X Receptor Inhibits Glucagon-like Peptide-1 Production by Enteroendocrine L Cells. Nat. Commun. 2015, 6, 7629. [Google Scholar] [CrossRef]
- Klonoff, D.C.; Perz, J.F. Assisted Monitoring of Blood Glucose: Special Safety Needs for a New Paradigm in Testing Glucose. J. Diabetes Sci. Technol. 2010, 4, 1027–1031. [Google Scholar] [CrossRef]
- American Diabetes Association. Standards of Medical Care in Diabetes—2014. Diabetes Care 2014, 37, S14–S80. [Google Scholar] [CrossRef] [PubMed]
- Clarke, S.F.; Foster, J.R. A History of Blood Glucose Meters and Their Role in Self-Monitoring of Diabetes Mellitus. Br. J. Biomed. Sci. 2012, 69, 83–93. [Google Scholar] [CrossRef] [PubMed]
- Heikenfeld, J.; Jajack, A.; Feldman, B.; Granger, S.W.; Gaitonde, S.; Begtrup, G.; Katchman, B.A. Accessing Analytes in Biofluids for Peripheral Biochemical Monitoring. Nat. Biotechnol. 2019, 37, 407–419. [Google Scholar] [CrossRef] [PubMed]
- Vashist, S.K. Non-Invasive Glucose Monitoring Technology in Diabetes Management: A Review. Anal. Chim. Acta 2012, 750, 16–27. [Google Scholar] [CrossRef] [PubMed]
- American Diabetes Association. Urine Glucose and Ketone Determinations. Diabetes Care 1991, 14, 39–40. [Google Scholar] [CrossRef]
- Bariya, M.; Nyein, H.Y.Y.; Javey, A. Wearable Sweat Sensors. Nat. Electron. 2018, 1, 160–171. [Google Scholar] [CrossRef]
- Boselli, L.; Pomili, T.; Donati, P.; Pompa, P.P. Nanosensors for Visual Detection of Glucose in Biofluids: Are We Ready for Instrument-Free Home-Testing? Materials 2021, 14, 1978. [Google Scholar] [CrossRef]
- Humphrey, S.P.; Williamson, R.T. A Review of Saliva: Normal Composition, Flow, and Function. J. Prosthet. Dent. 2001, 85, 162–169. [Google Scholar] [CrossRef] [PubMed]
- de Almeida, P.D.V.; Grégio, A.M.T.; Machado, M.A.N.; de Lima, A.A.S.; Azevedo, L.R. Saliva Composition and Functions: A Comprehensive Review. J. Contemp. Dent. Pr. 2008, 9, 72–80. [Google Scholar]
- Lee, Y.-H.; Wong, D.T. Saliva: An Emerging Biofluid for Early Detection of Diseases. Am. J. Dent. 2009, 22, 241–248. [Google Scholar]
- Malamud, D. Saliva as a Diagnostic Fluid. Dent. Clin. North. Am. 2011, 55, 159–178. [Google Scholar] [CrossRef] [PubMed]
- Shah, S. Salivaomics: The Current Scenario. J. Oral. Maxillofac. Pathol. 2018, 22, 375–381. [Google Scholar] [CrossRef] [PubMed]
- Wong, D.T.W. Salivaomics. J. Am. Dent. Assoc. 2012, 143, 19S–24S. [Google Scholar] [CrossRef] [PubMed]
- Koneru, S.; Tanikonda, R. Salivaomics—A Promising Future in Early Diagnosis of Dental Diseases. Dent. Res. J. 2014, 11, 11–15. [Google Scholar]
- Zhang, L.; Xiao, H.; Wong, D.T. Salivary Biomarkers for Clinical Applications. Mol. Diagn. Ther. 2009, 13, 245–259. [Google Scholar] [CrossRef] [PubMed]
- Ganesan, A.; Muthukrishnan, A.; Veeraraghavan, V.; Kumar, N. Effectiveness of Salivary Glucose as a Reliable Alternative in Diagnosis of Type 1 Diabetes Mellitus: A Cross-Sectional Study. J. Pharm. Bioallied Sci. 2022, 14, 557. [Google Scholar] [CrossRef] [PubMed]
- Balan, P.; Babu, S.; Sucheta, K.; Shetty, S.; Rangare, A.; Castelino, R.; Fazil, A.K. Can Saliva Offer an Advantage in Monitoring of Diabetes Mellitus? —A Case Control Study. J. Clin. Exp. Dent. 2014, 6, e335. [Google Scholar] [CrossRef]
- Abikshyeet, P.; Ramesh, V.; Oza, N. Glucose Estimation in the Salivary Secretion of Diabetes Mellitus Patients. Diabetes Metab. Syndr. Obes. 2012, 5, 149–154. [Google Scholar] [CrossRef]
- Gupta, S.; Nayak, M.; Sunitha, J.; Dawar, G.; Sinha, N.; Rallan, N. Correlation of Salivary Glucose Level with Blood Glucose Level in Diabetes Mellitus. J. Oral. Maxillofac. Pathol. 2017, 21, 334. [Google Scholar] [CrossRef]
- Ragunathan, H.; Aswath, N.; Sarumathi, T. Salivary Glucose Estimation: A Noninvasive Method. Indian J. Dent. Sci. 2019, 11, 25. [Google Scholar] [CrossRef]
- Abd-Elraheem, S.E.; Mansour, H.H. Salivary Changes in Type 2 Diabetic Patients. Diabetes Metab. Syndr. Clin. Res. Rev. 2017, 11, S637–S641. [Google Scholar] [CrossRef] [PubMed]
- Katti, G.; Ghali, S.; Diwakar, D.; Guduba, V.; Shahbaz, S.; Katti, C. Salivary Alterations in Type 1 Diabetes Mellitus Patients: Salivary Glucose Could Be Noninvasive Tool for Monitoring Diabetes Mellitus. Indian J. Dent. Res. 2014, 25, 420. [Google Scholar] [CrossRef] [PubMed]
- Choudhry, A.A.; Kumar, P.; Prasad, M.; Mohapatra, T.; Sharma, P. Validation of Salivary Glucose as a Screening Tool of Diabetes Mellitus. Rom. J. Intern. Med. 2022, 60, 145–152. [Google Scholar] [CrossRef]
- Fares, S.; Said, M.S.M.; Ibrahim, W.; Amin, T.T.; Saad, N.E.S. Accuracy of Salivary Glucose Assessment in Diagnosis of Diabetes and Prediabestes. Diabetes Metab. Syndr. Clin. Res. Rev. 2019, 13, 1543–1547. [Google Scholar] [CrossRef] [PubMed]


Disclaimer/Publisher’s Note: The statements, opinions and data contained in all publications are solely those of the individual author(s) and contributor(s) and not of MDPI and/or the editor(s). MDPI and/or the editor(s) disclaim responsibility for any injury to people or property resulting from any ideas, methods, instructions or products referred to in the content. |
© 2023 by the authors. Licensee MDPI, Basel, Switzerland. This article is an open access article distributed under the terms and conditions of the Creative Commons Attribution (CC BY) license (https://creativecommons.org/licenses/by/4.0/).
Share and Cite
Rondanelli, M.; Barrile, G.C.; Cavioni, A.; Donati, P.; Genovese, E.; Mansueto, F.; Mazzola, G.; Patelli, Z.; Pirola, M.; Razza, C.; et al. A Narrative Review on Strategies for the Reversion of Prediabetes to Normoglycemia: Food Pyramid, Physical Activity, and Self-Monitoring Innovative Glucose Devices. Nutrients 2023, 15, 4943. https://doi.org/10.3390/nu15234943
Rondanelli M, Barrile GC, Cavioni A, Donati P, Genovese E, Mansueto F, Mazzola G, Patelli Z, Pirola M, Razza C, et al. A Narrative Review on Strategies for the Reversion of Prediabetes to Normoglycemia: Food Pyramid, Physical Activity, and Self-Monitoring Innovative Glucose Devices. Nutrients. 2023; 15(23):4943. https://doi.org/10.3390/nu15234943
Chicago/Turabian StyleRondanelli, Mariangela, Gaetan Claude Barrile, Alessandro Cavioni, Paolo Donati, Elisa Genovese, Francesca Mansueto, Giuseppe Mazzola, Zaira Patelli, Martina Pirola, Claudia Razza, and et al. 2023. "A Narrative Review on Strategies for the Reversion of Prediabetes to Normoglycemia: Food Pyramid, Physical Activity, and Self-Monitoring Innovative Glucose Devices" Nutrients 15, no. 23: 4943. https://doi.org/10.3390/nu15234943