
Spirulina Supplementation with High-Intensity Interval Training Decreases Adipokines Levels and Cardiovascular Risk Factors in Men with Obesity
 , , , , ,
  , ,
, ,  and
and 
Abstract
:1. Introduction
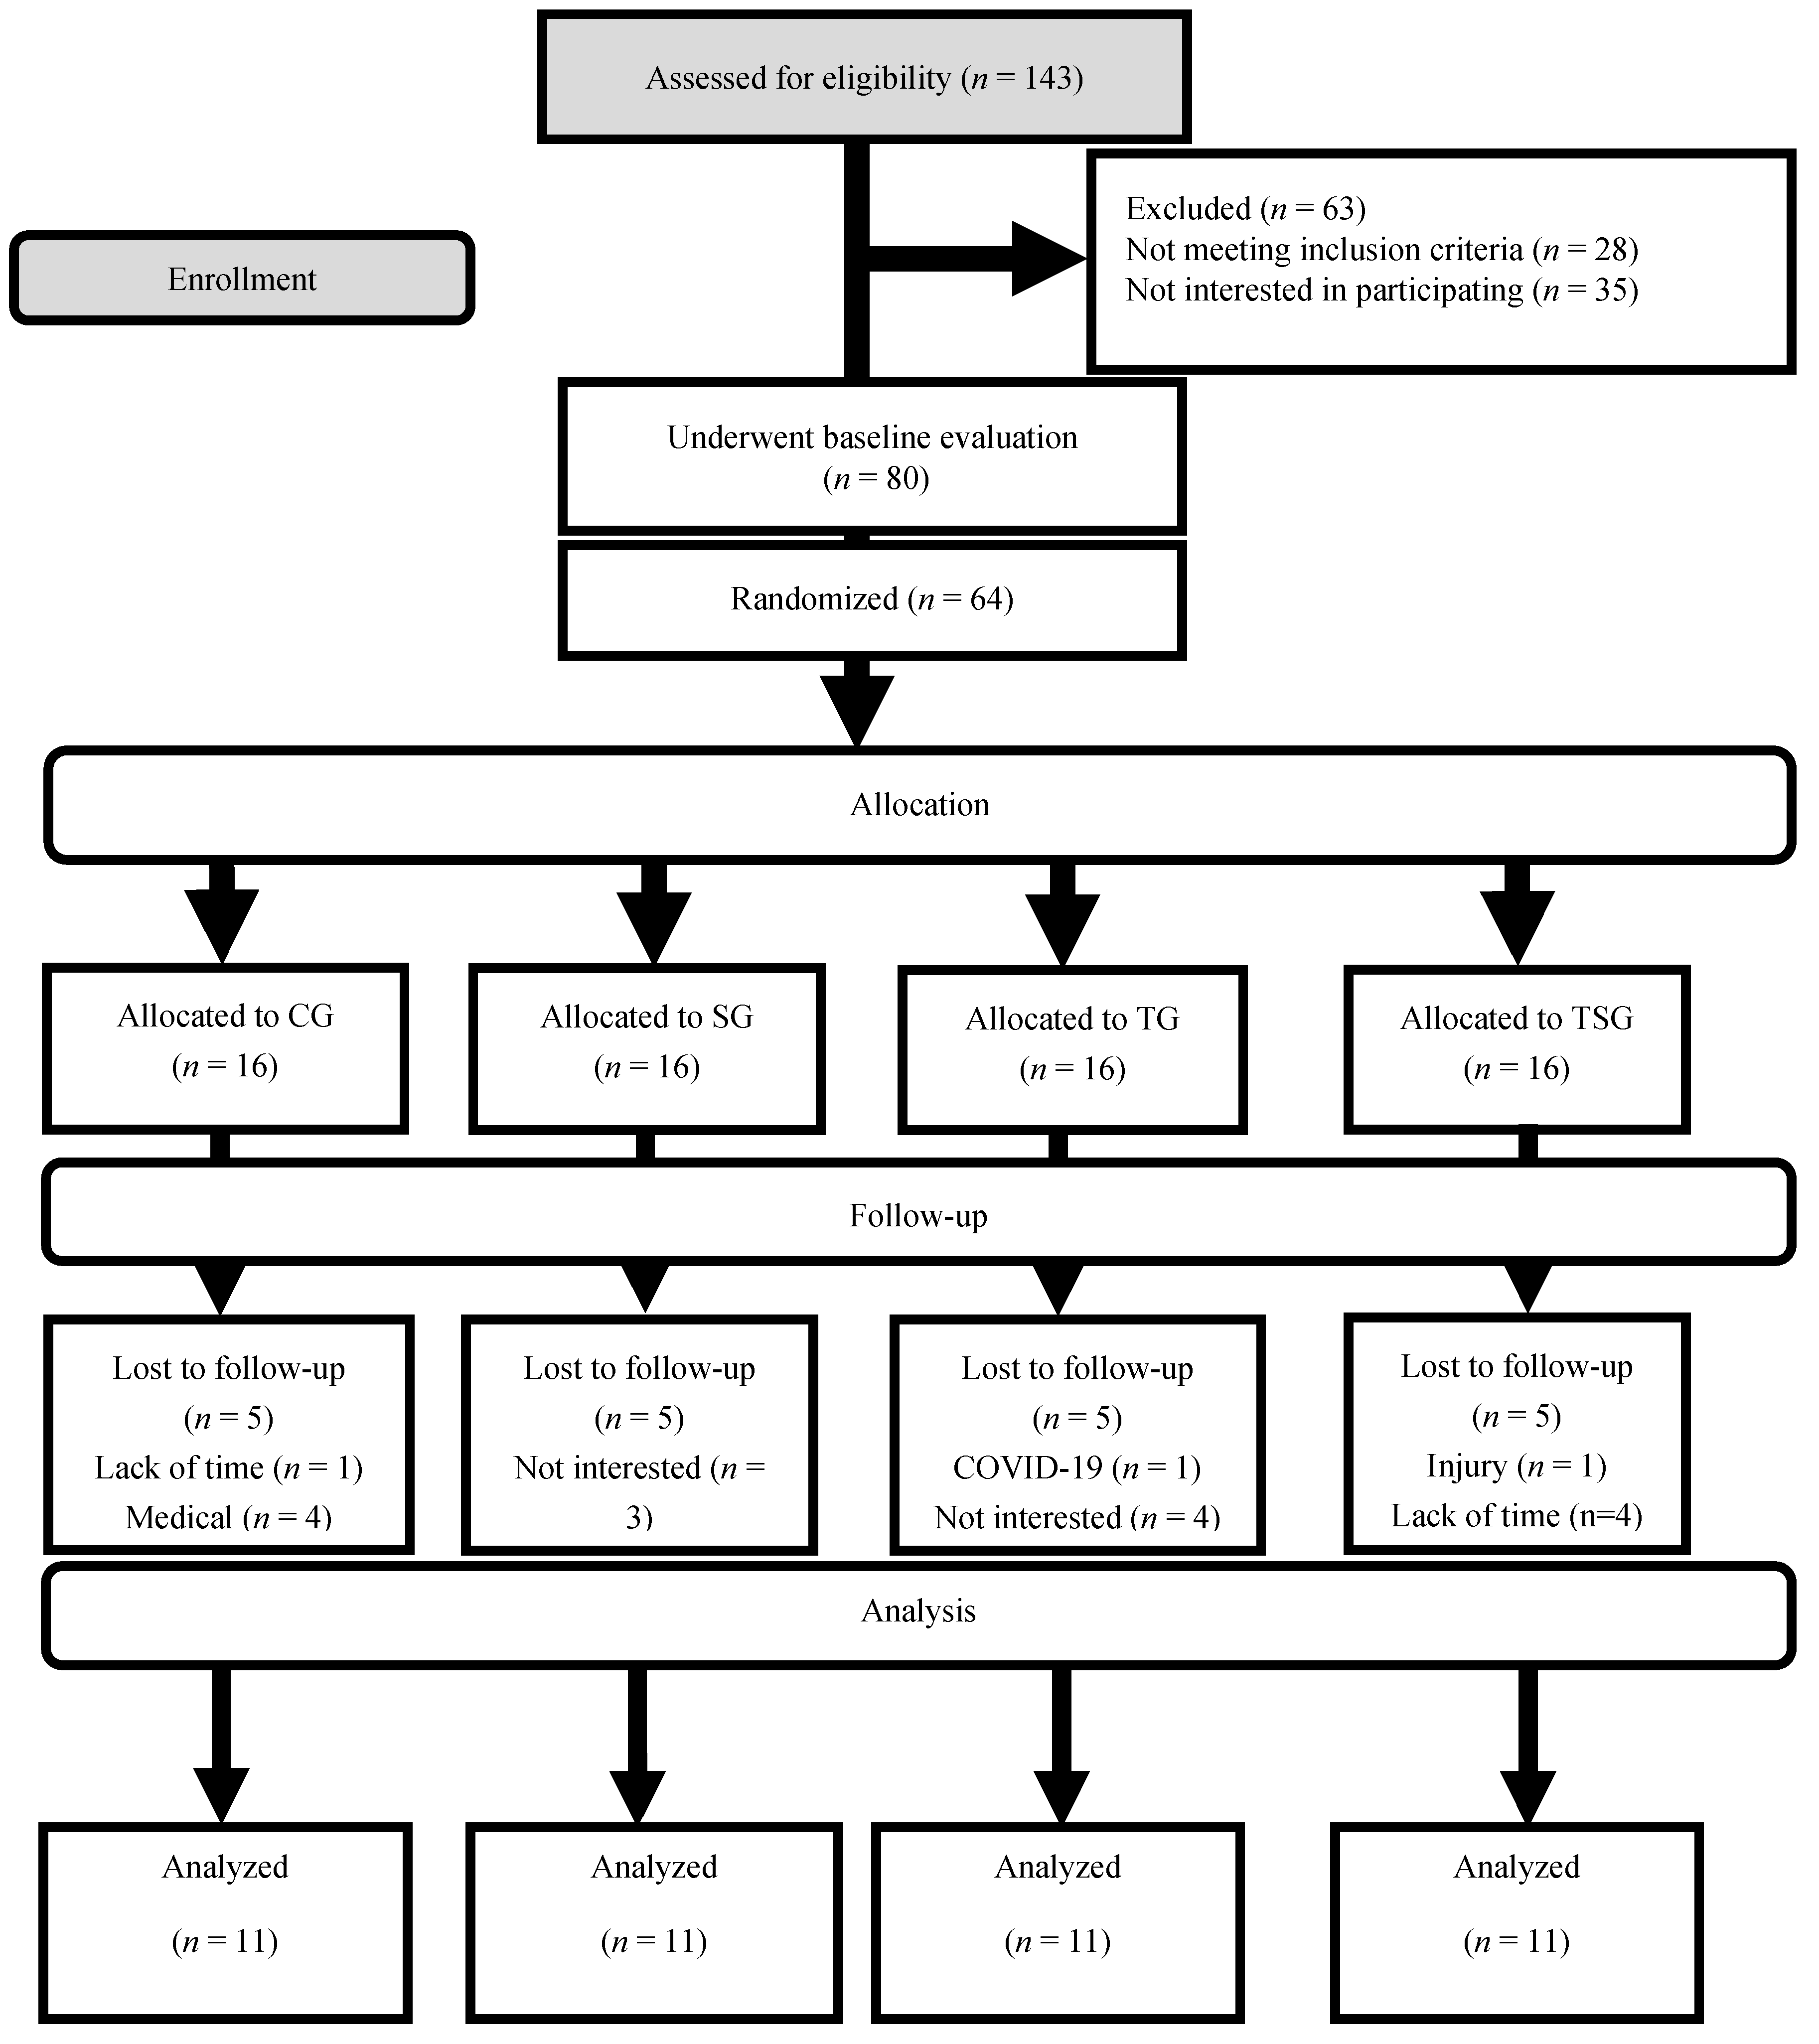
2. Methods
2.1. Ethical Approval
2.2. Participants
2.3. Experimental Design
2.4. Anthropometric and Cardio-Respiratory Fitness Assessments
2.5. Training Protocols
2.6. Supplementation of Spirulina and Placebo
2.7. Nutrient Intake and Dietary Analysis
2.8. Blood Markers
2.9. Statistical Analysis
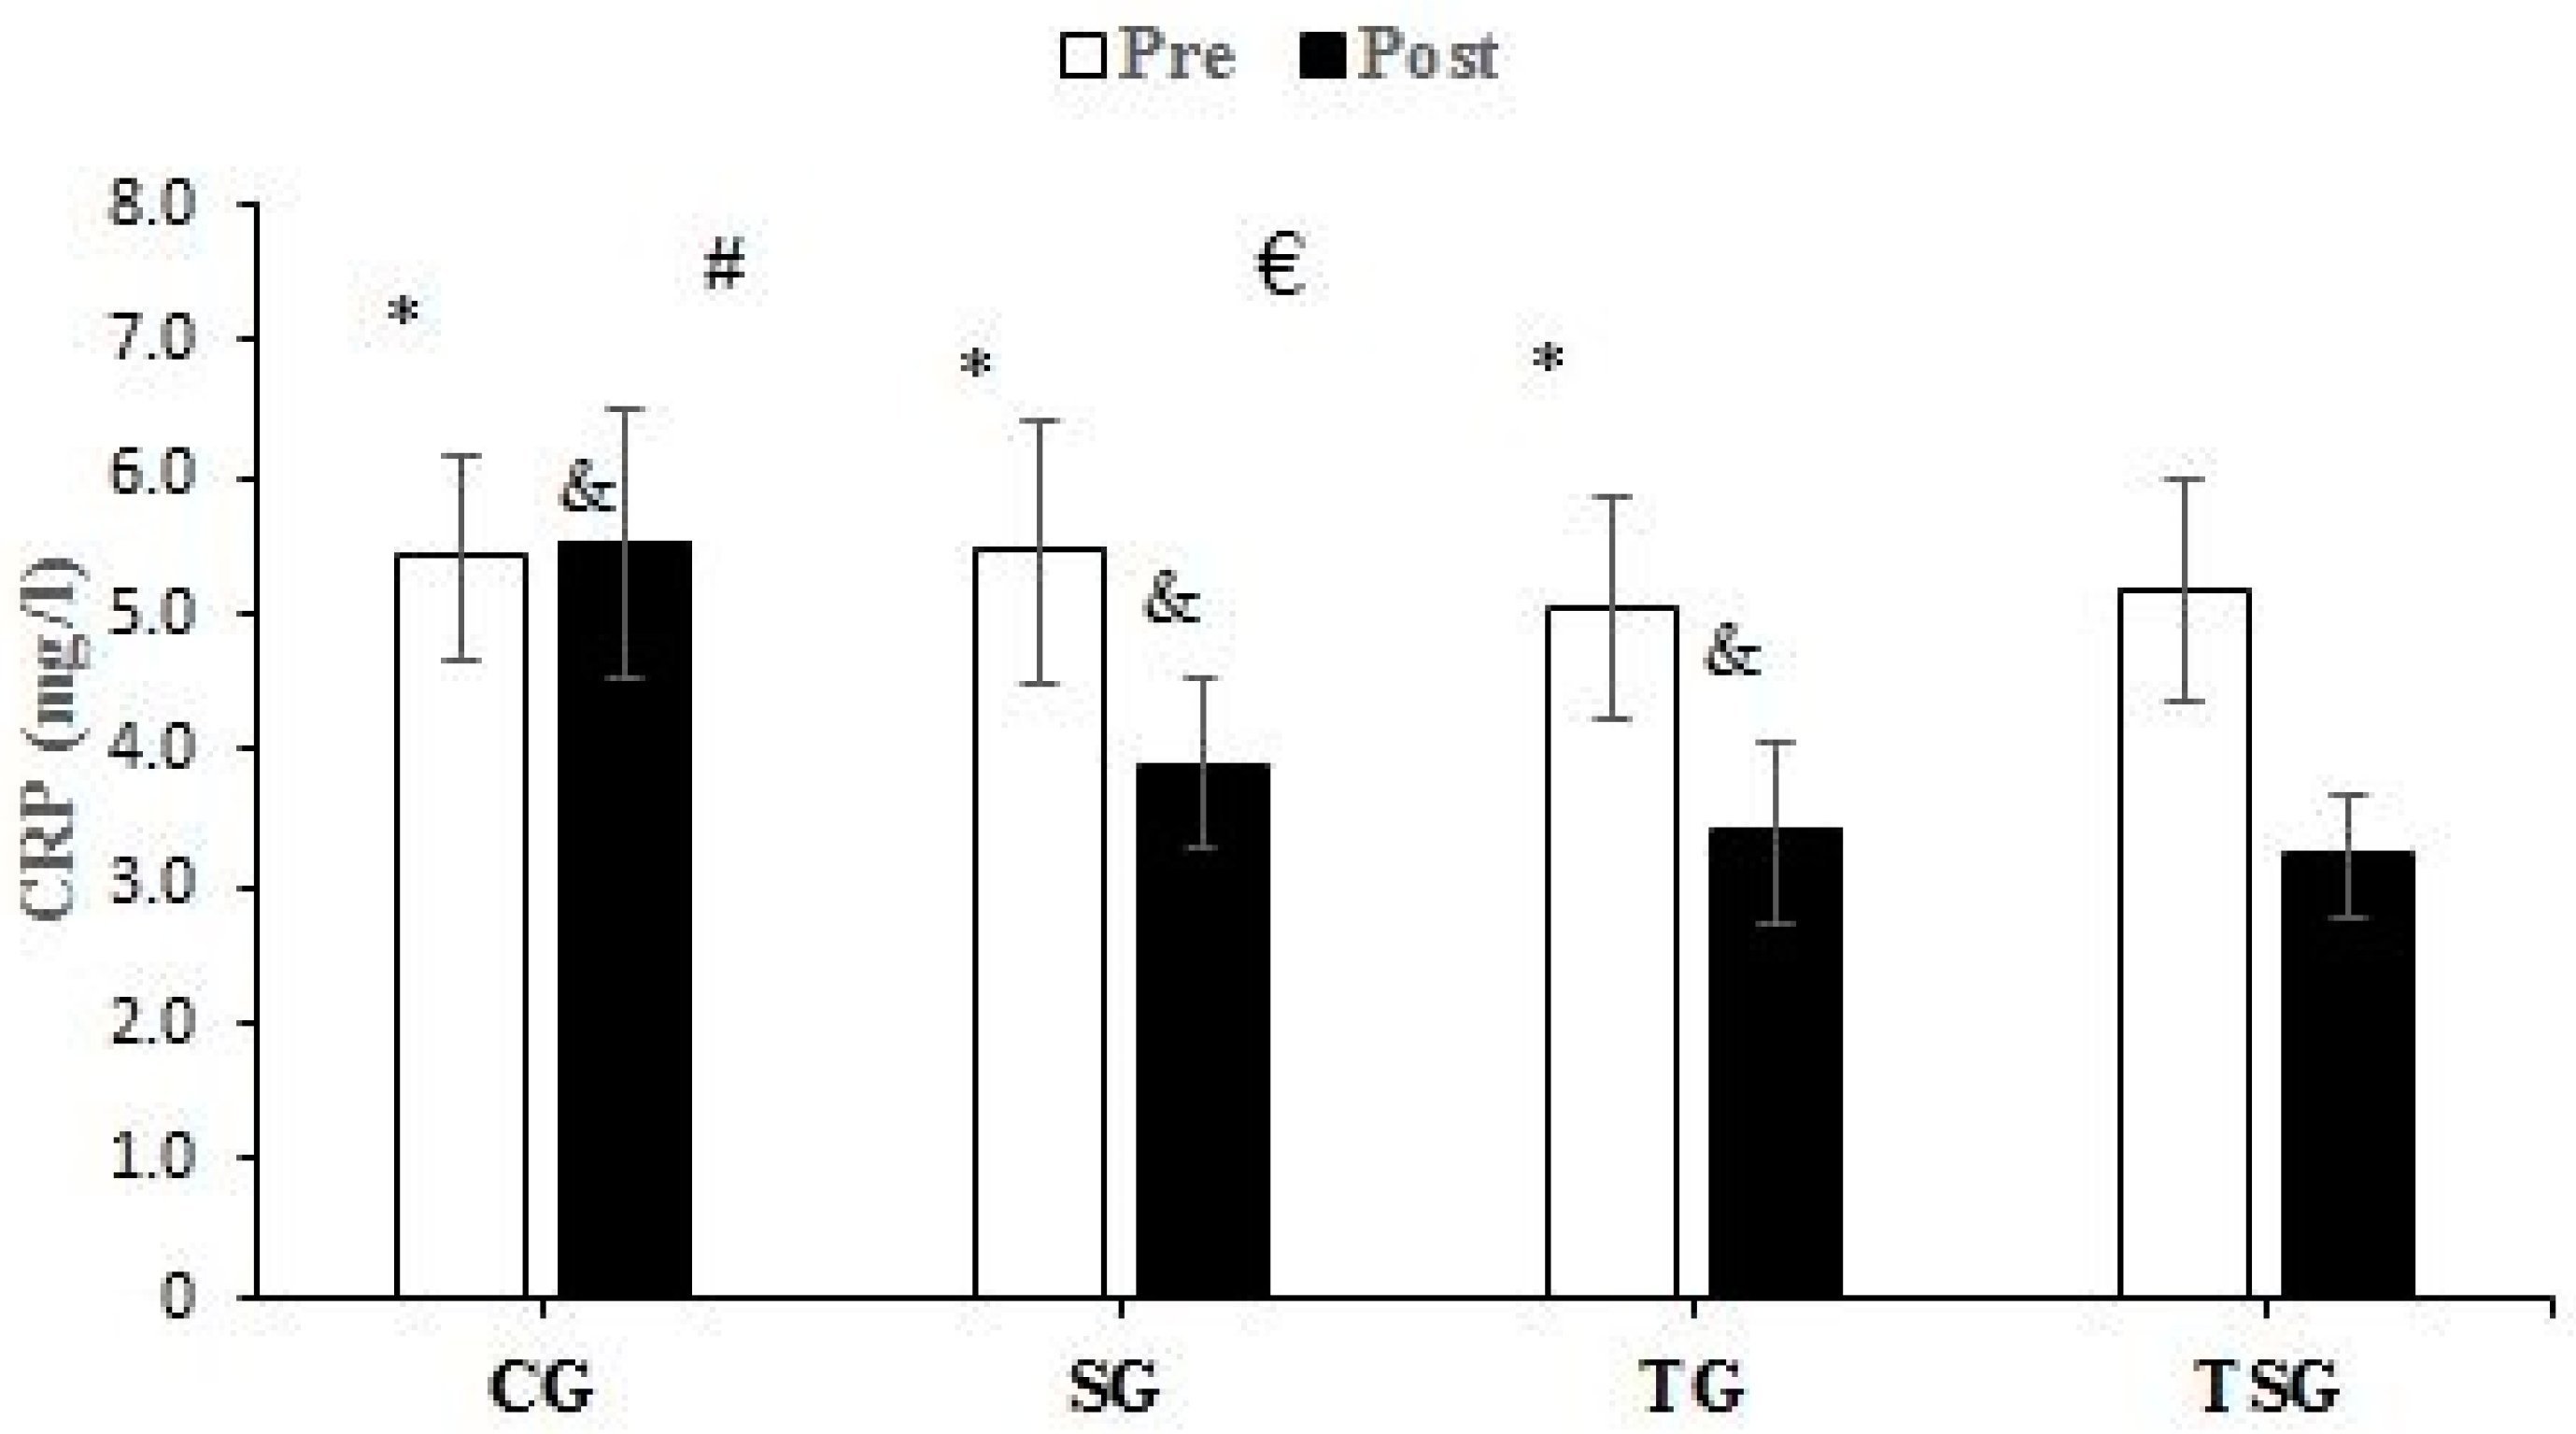
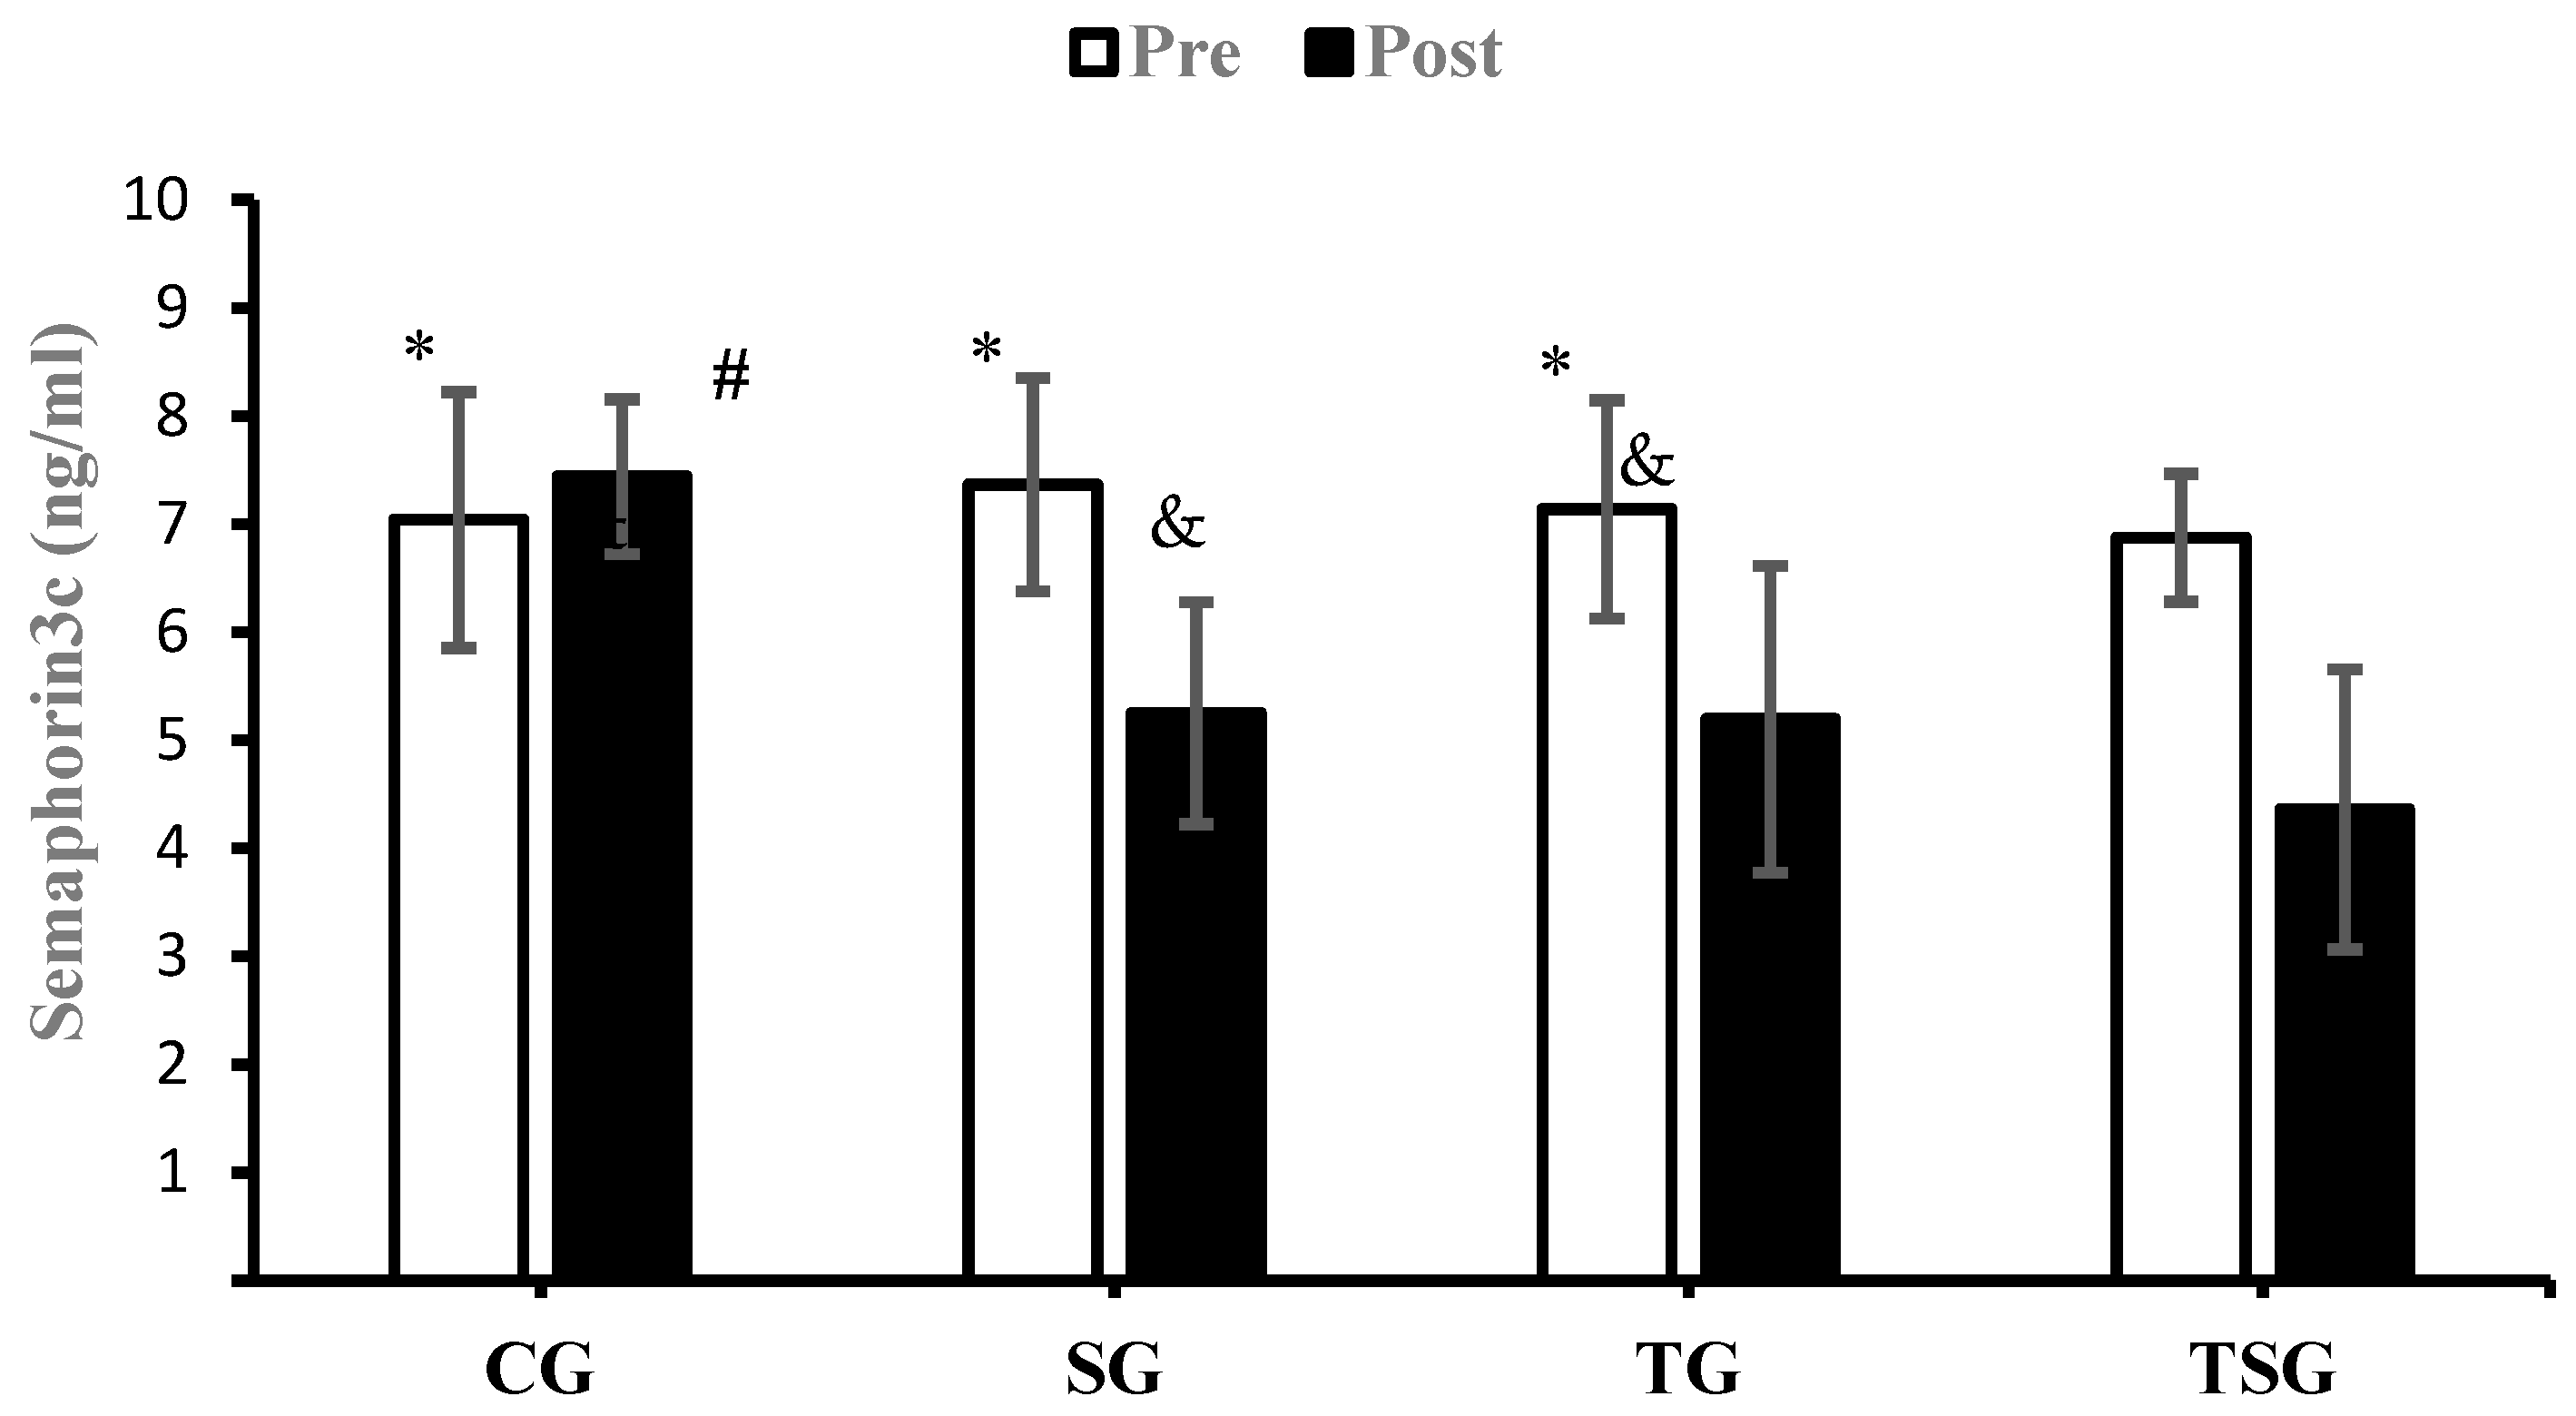
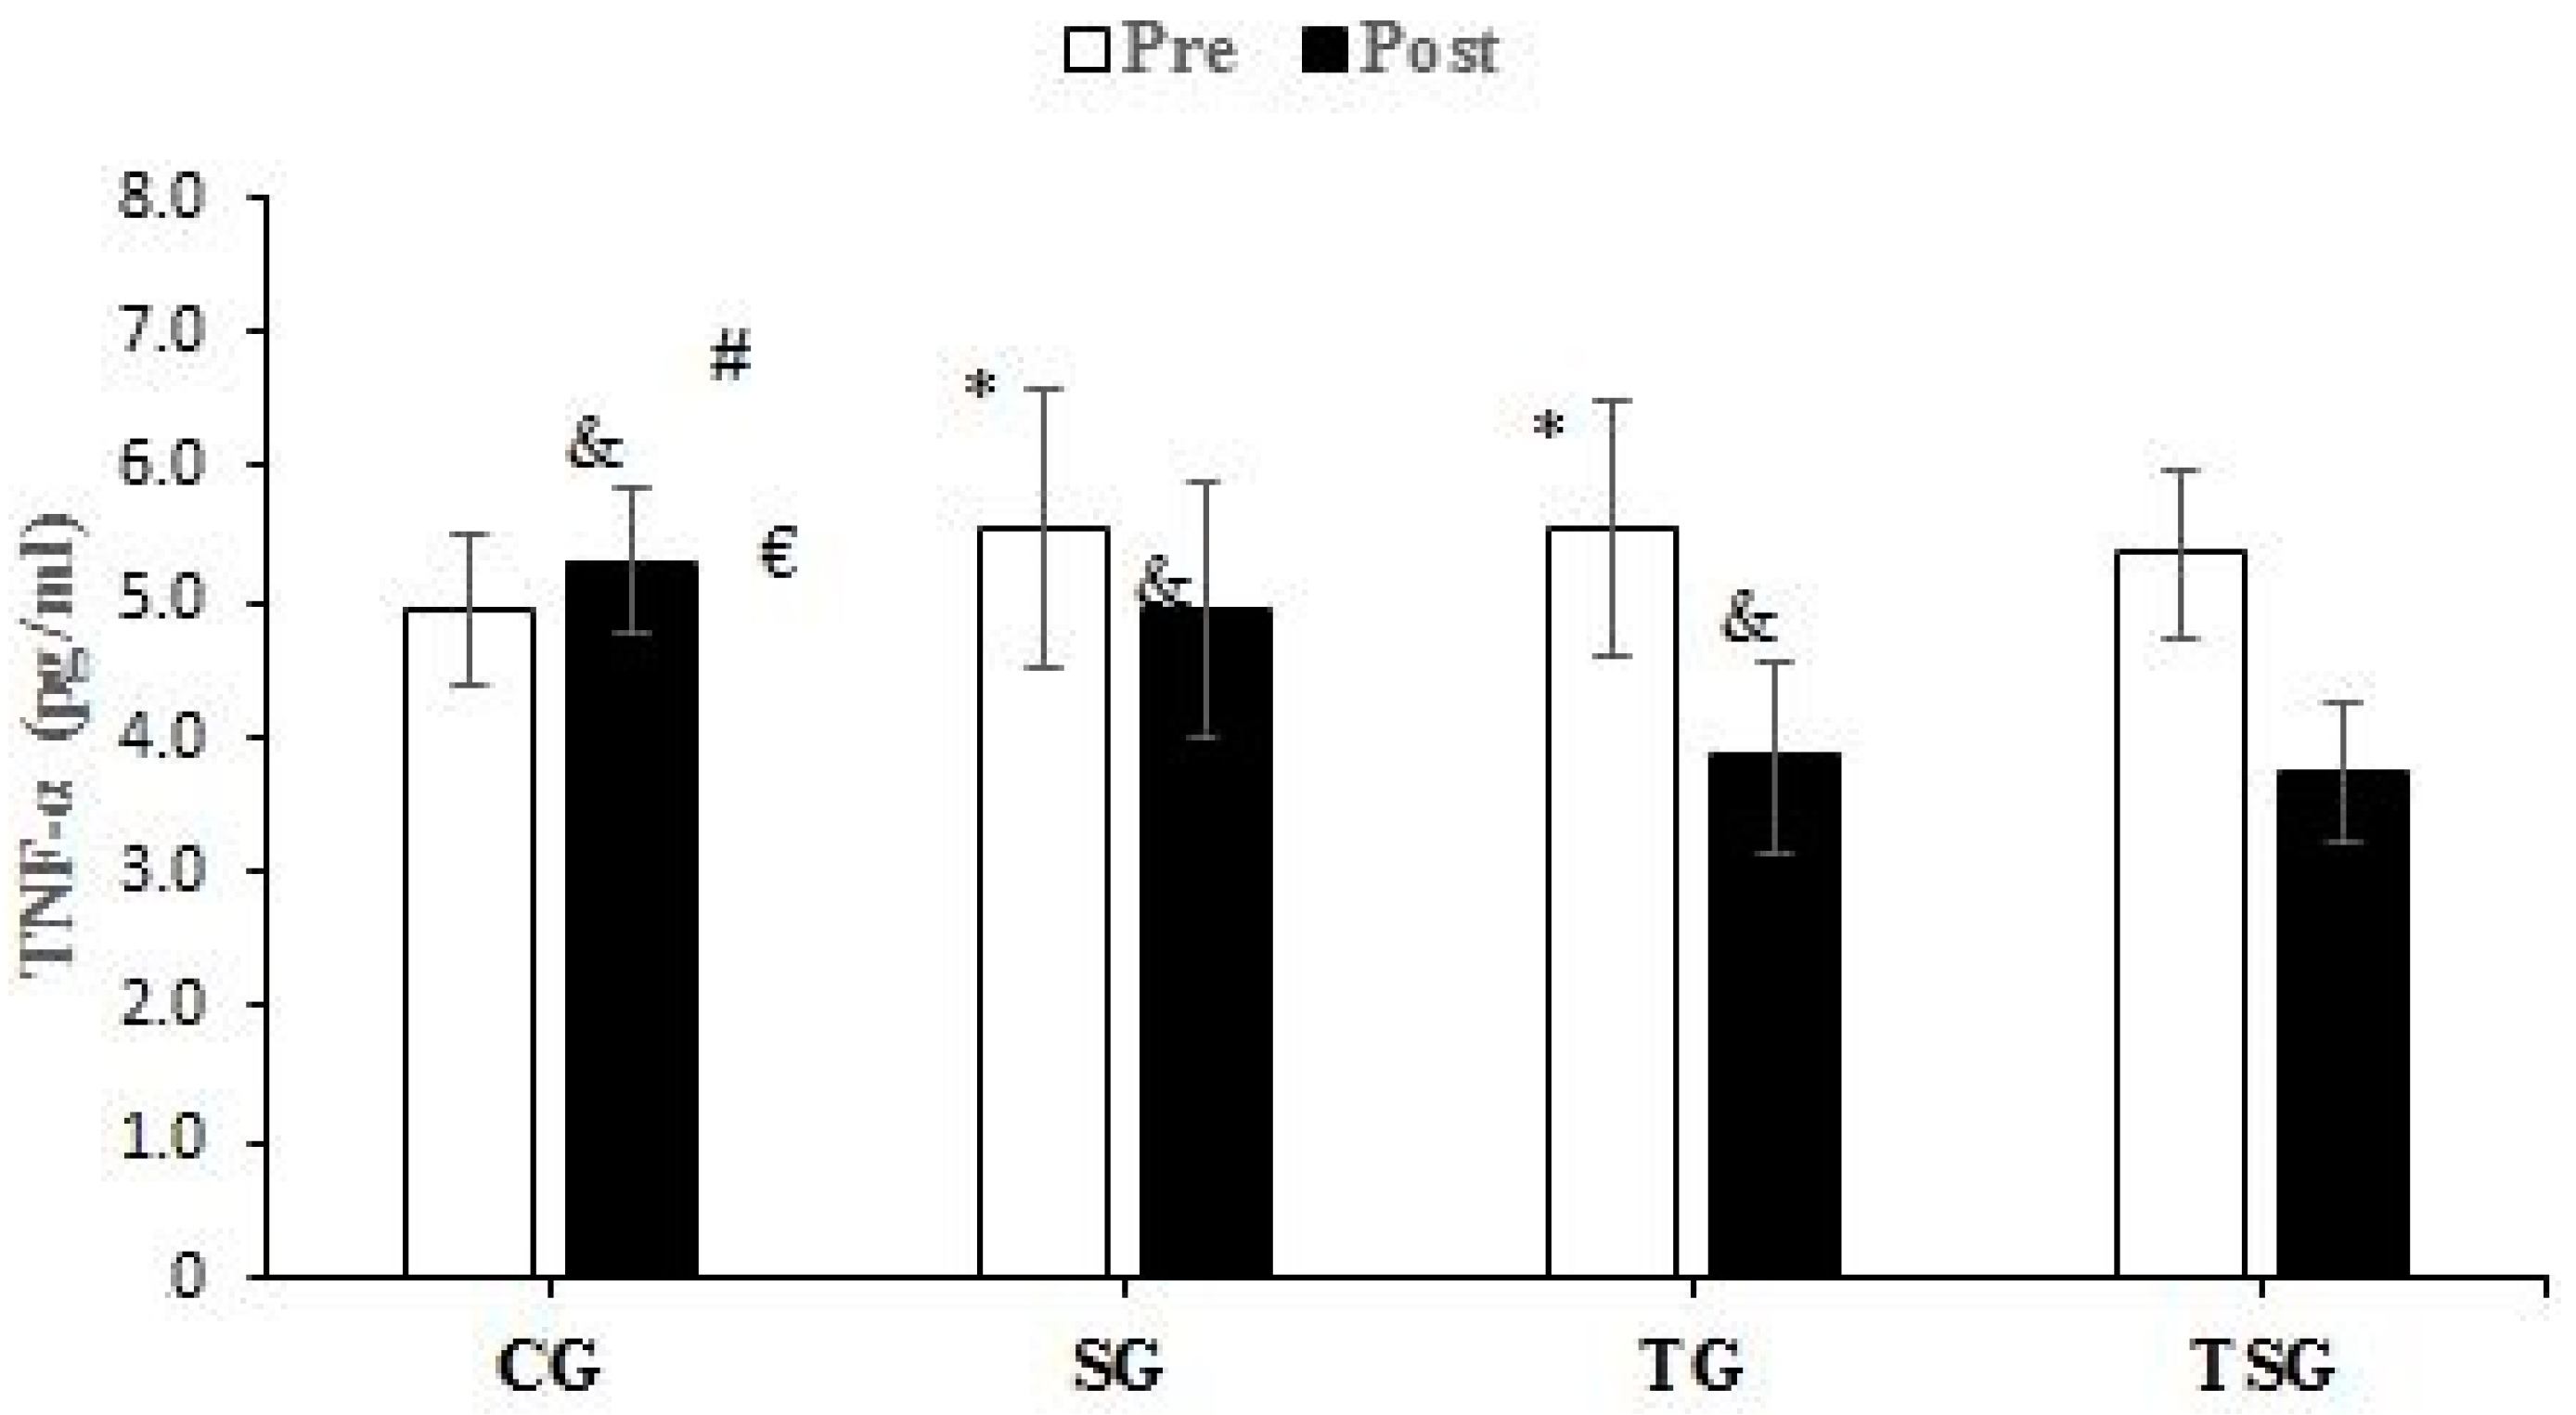
3. Results
3.1. Anthropometry and VO2peak
3.2. Lipid Profiles
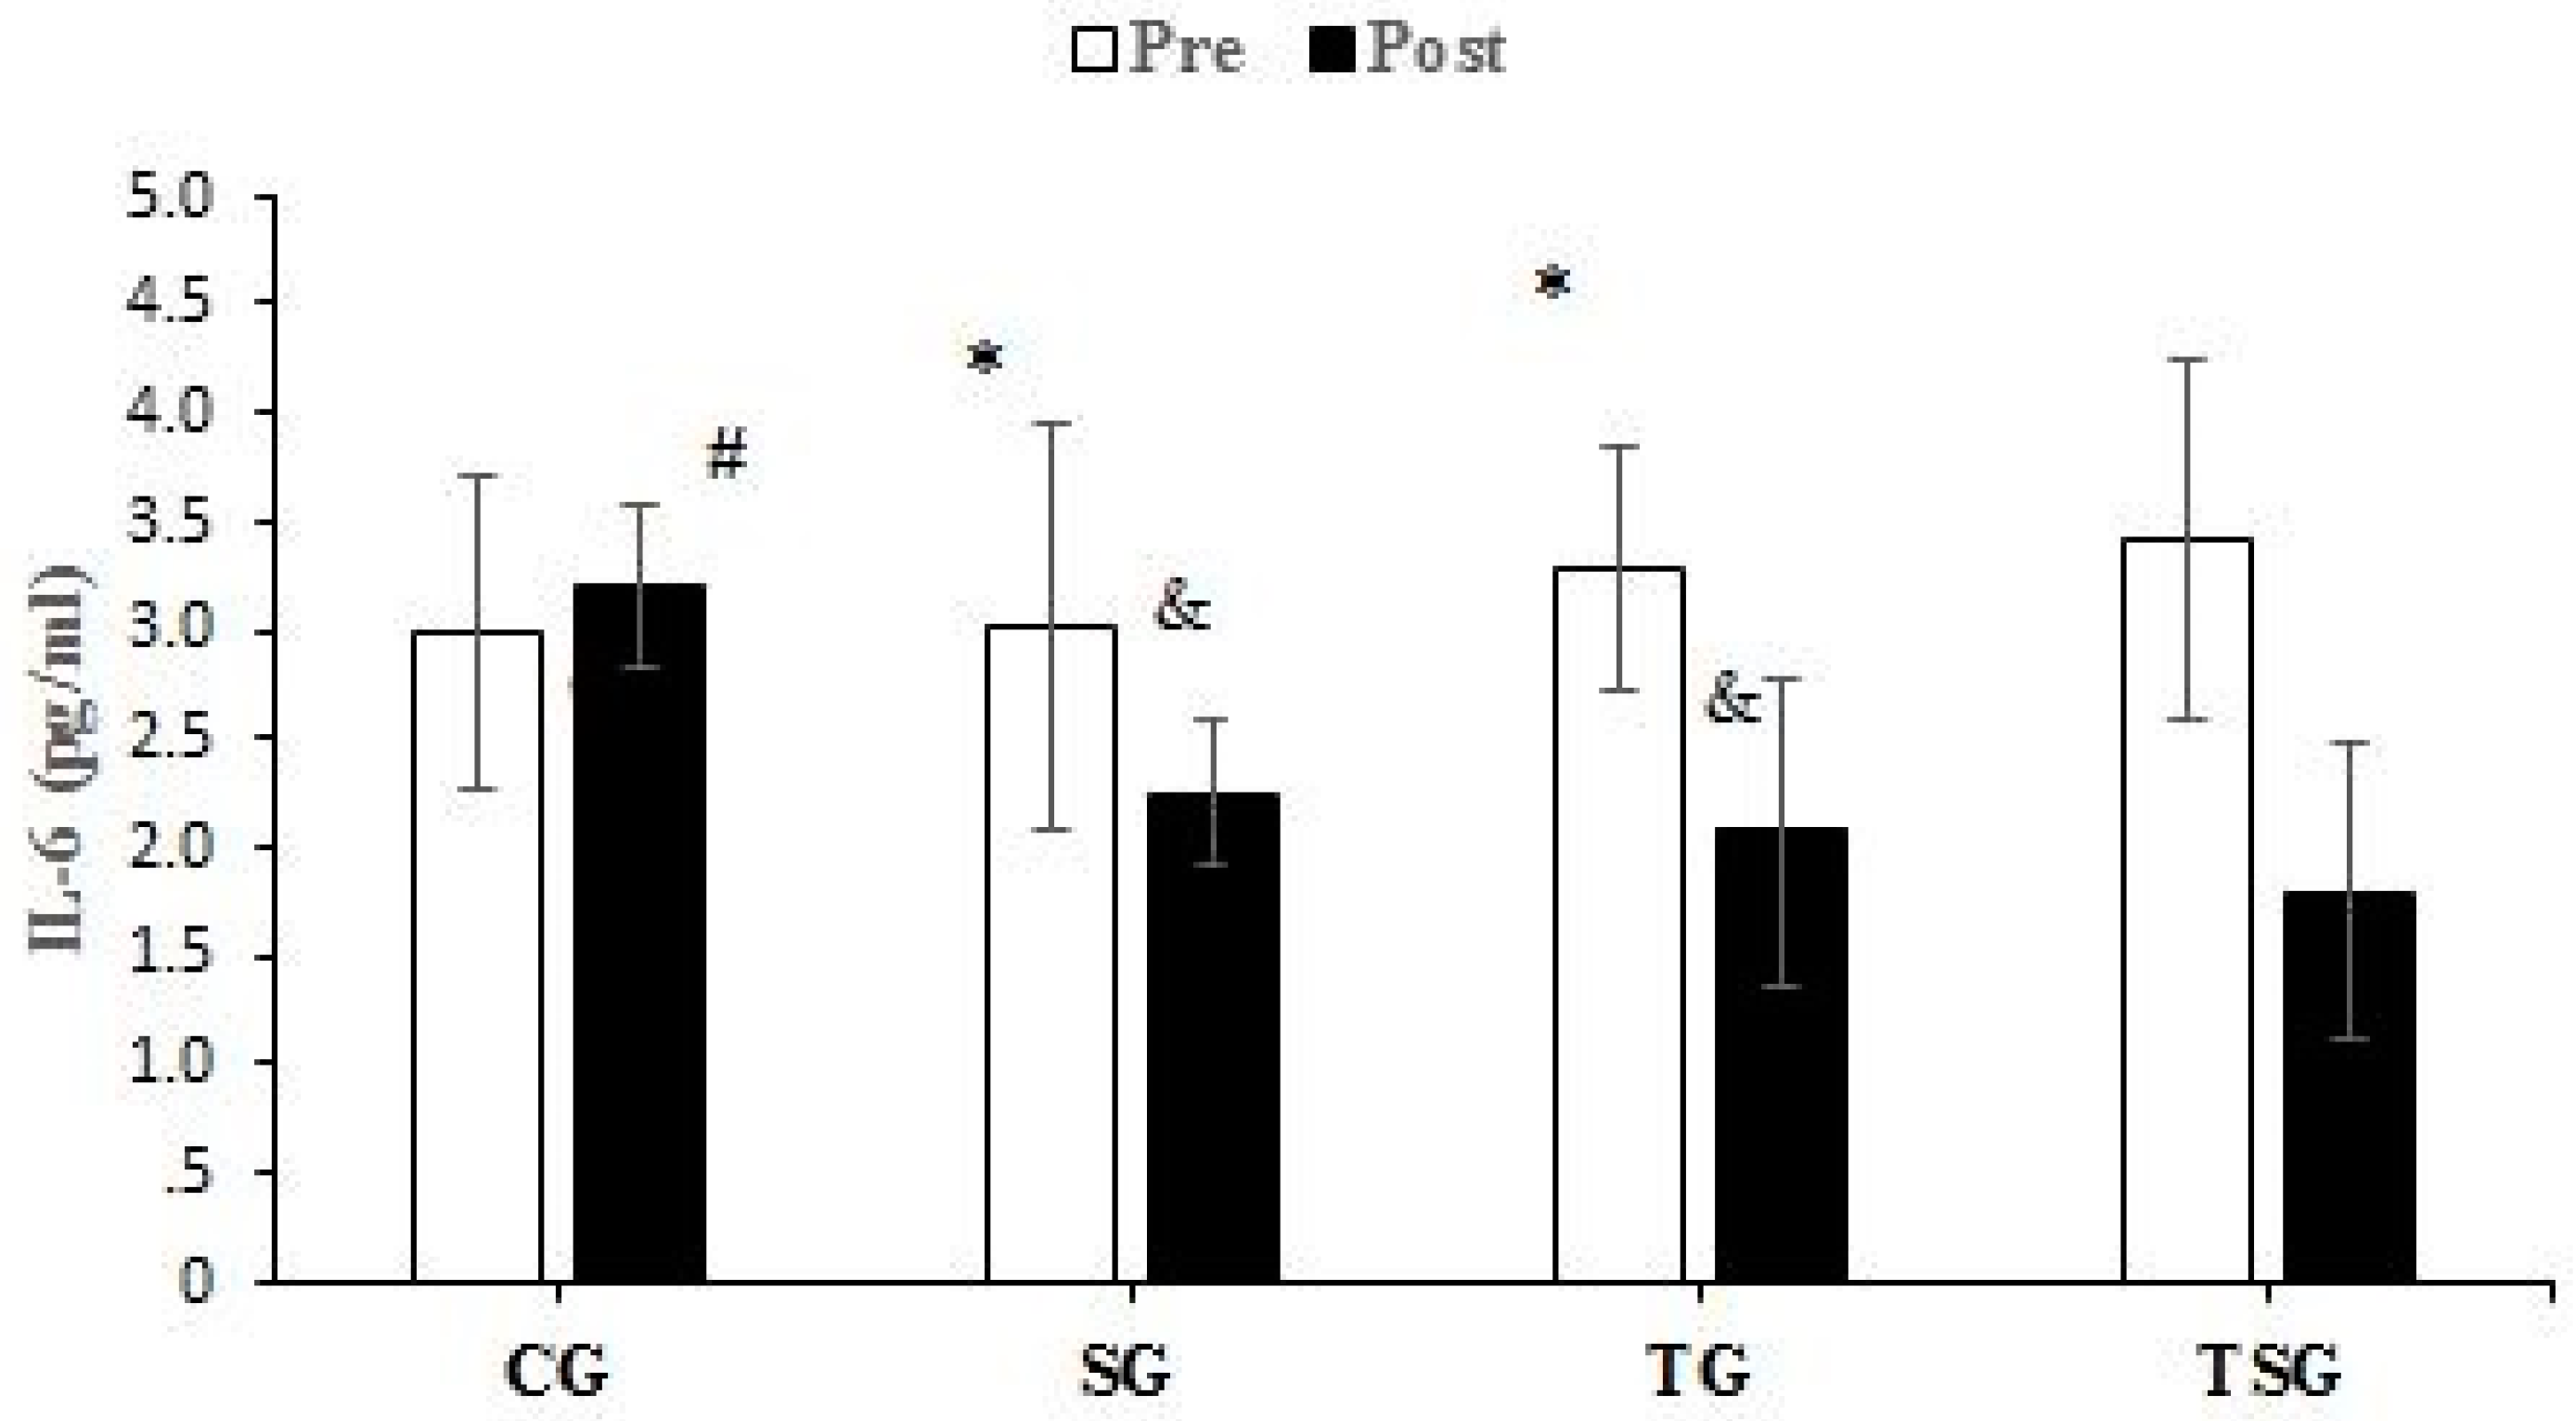
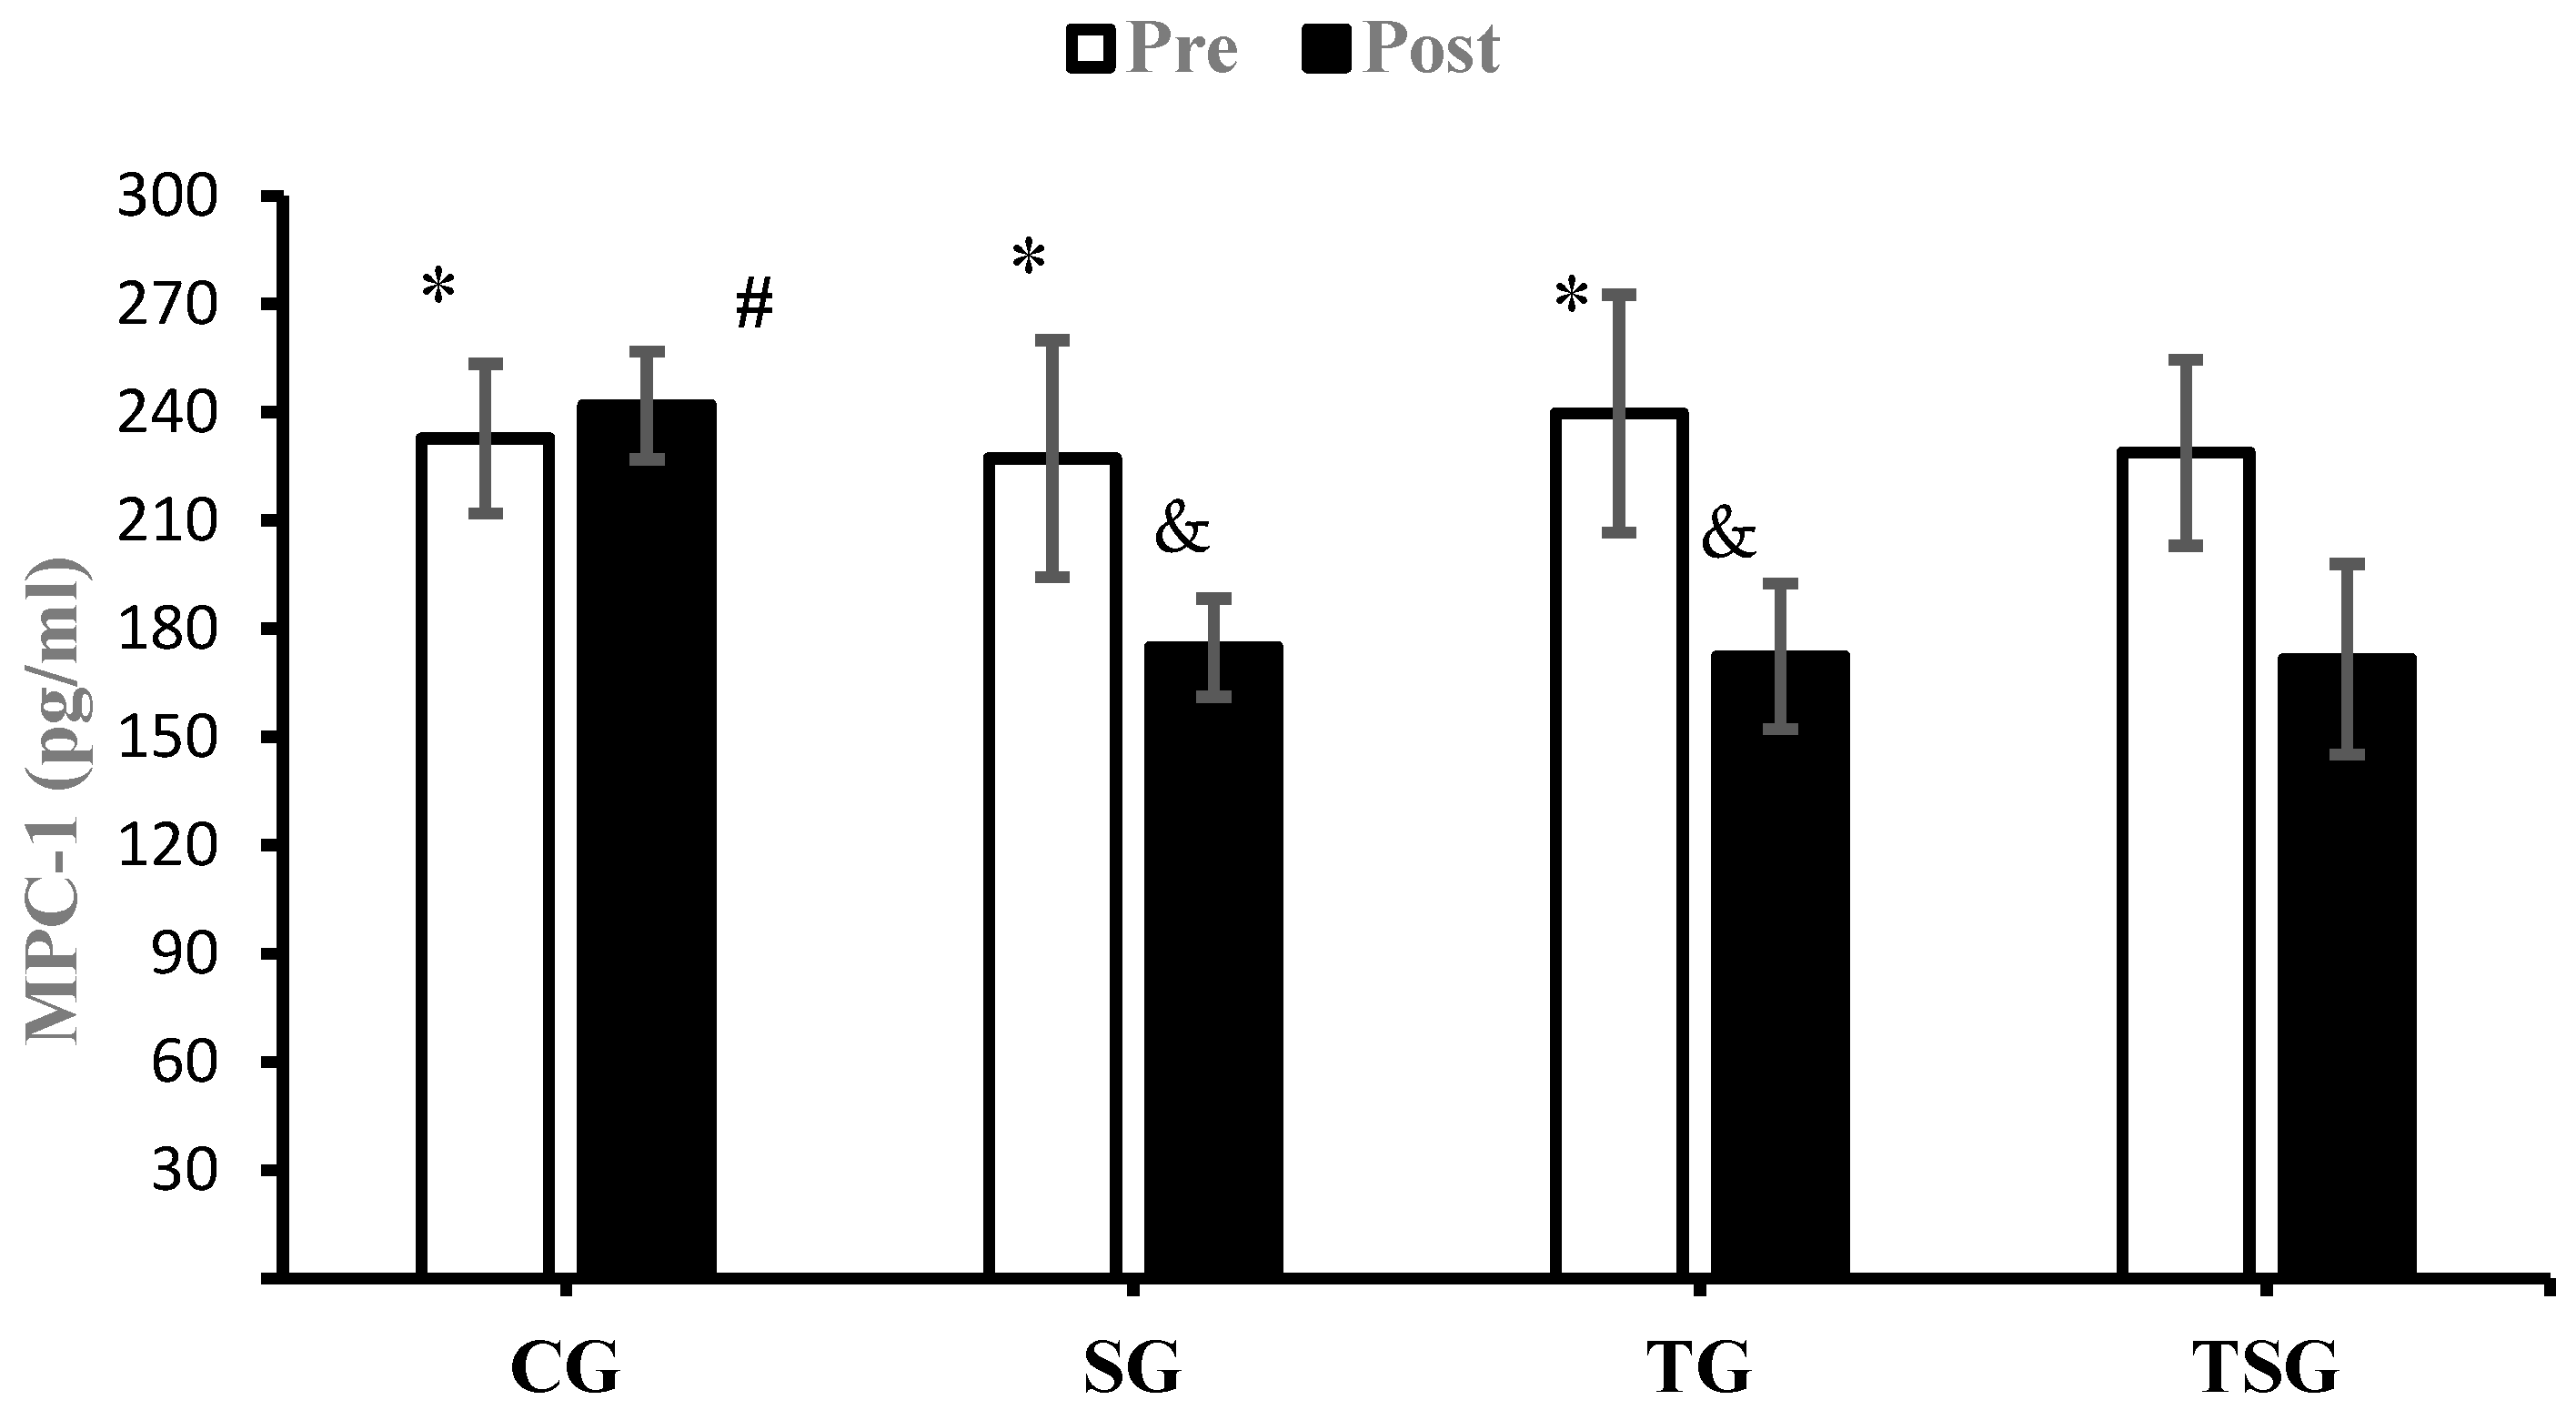
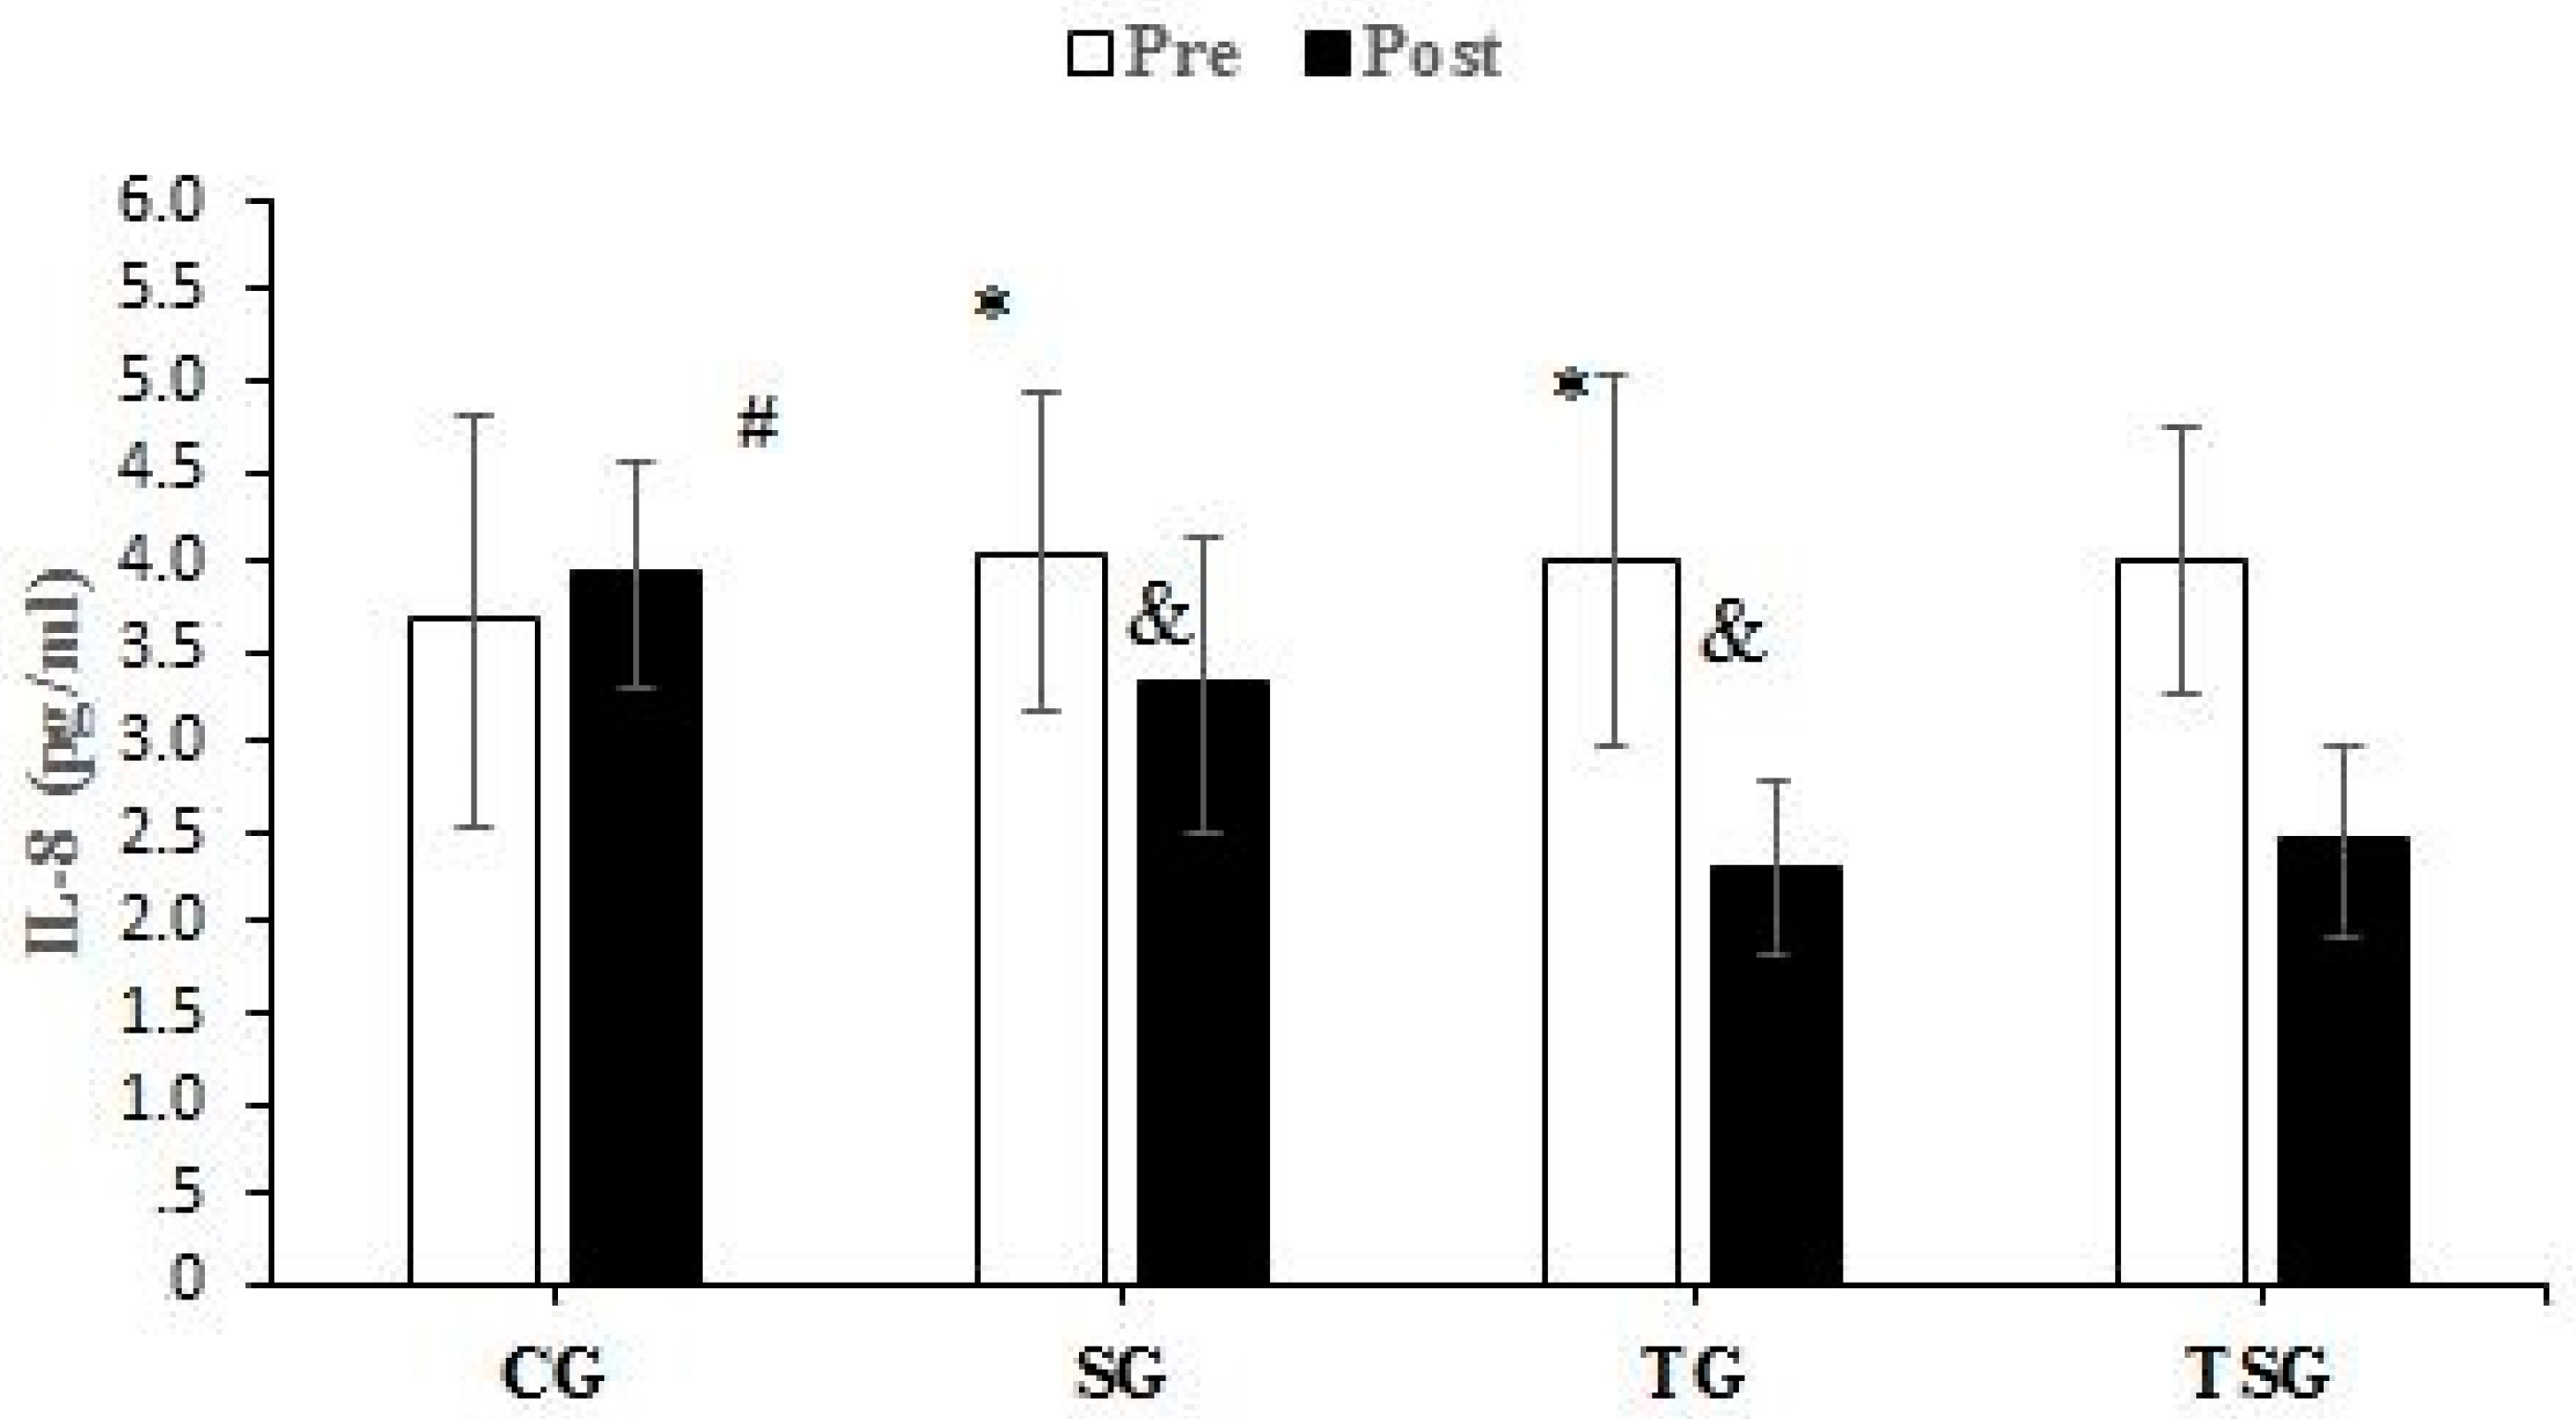
3.3. Adipokines and Cytokines
4. Discussion
4.1. Favorable Modulations of Metabolic Factors and Cardiorespiratory Parameters
4.2. Favorable Modulations of Adipokines
5. Study Limitations
6. Conclusions
Author Contributions
Funding
Institutional Review Board Statement
Informed Consent Statement
Data Availability Statement
Acknowledgments
Conflicts of Interest
References
- World Health Organization. WHO European Regional Obesity Report 2022; World Health Organization Regional Office for Europe: Copenhagen, Denmark, 2022. [Google Scholar]
- Syed Ikmal, S.I.Q.; Zaman Huri, H.; Vethakkan, S.R.; Wan Ahmad, W.A. Potential biomarkers of insulin resistance and atherosclerosis in type 2 diabetes mellitus patients with coronary artery disease. Int. J. Endocrinol. 2013, 2013, 698567. [Google Scholar] [CrossRef] [PubMed]
- Nway, N.C.; Sitticharoon, C.; Chatree, S.; Maikaew, P. Correlations between the expression of the insulin sensitizing hormones, adiponectin, visfatin, and omentin, and the appetite regulatory hormone, neuropeptide Y and its receptors in subcutaneous and visceral adipose tissues. Obes. Res. Clin. Pract. 2016, 10, 256–263. [Google Scholar] [CrossRef] [PubMed]
- DeMarco, V.G.; Johnson, M.S.; Whaley-Connell, A.T.; Sowers, J.R. Cytokine abnormalities in the etiology of the cardiometabolic syndrome. Curr. Hypertens. Rep. 2010, 12, 93–98. [Google Scholar] [CrossRef]
- Li, Q.; Wang, Q.; Xu, W.; Ma, Y.; Wang, Q.; Eatman, D.; You, S.; Zou, J.; Champion, J.; Zhao, L. C-reactive protein causes adult-onset obesity through chronic inflammatory mechanism. Front. Cell Dev. Biol. 2020, 8, 18. [Google Scholar] [CrossRef] [PubMed]
- Visser, M.; Bouter, L.M.; McQuillan, G.M.; Wener, M.H.; Harris, T.B. Elevated C-reactive protein levels in overweight and obese adults. JAMA 1999, 282, 2131–2135. [Google Scholar] [CrossRef] [PubMed]
- Panee, J. Monocyte Chemoattractant Protein 1 (MCP-1) in obesity and diabetes. Cytokine 2012, 60, 1–12. [Google Scholar] [CrossRef]
- Straczkowski, M.; Dzienis-Straczkowska, S.; Stêpieň, A.; Kowalska, I.; Szelachowska, M.; Kinalska, I. Plasma interleukin-8 concentrations are increased in obese subjects and related to fat mass and tumor necrosis factor-α system. J. Clin. Endocrinol. Metab. 2002, 87, 4602–4606. [Google Scholar] [CrossRef]
- Tun, S.; Spainhower, C.J.; Cottrill, C.L.; Lakhani, H.V.; Pillai, S.S.; Dilip, A.; Chaudhry, H.; Shapiro, J.I.; Sodhi, K. Therapeutic efficacy of antioxidants in ameliorating obesity phenotype and associated comorbidities. Front. Pharmacol. 2020, 11, 1234. [Google Scholar] [CrossRef]
- Eder, K.; Baffy, N.; Falus, A.; Fulop, A.K. The major inflammatory mediator interleukin-6 and obesity. Inflamm. Res. 2009, 58, 727–736. [Google Scholar] [CrossRef]
- DiNicolantonio, J.J.; Bhat, A.G.; OKeefe, J. Effects of spirulina on weight loss and blood lipids: A review. Open Heart 2020, 7, e001003. [Google Scholar] [CrossRef]
- Calella, P.; Di Dio, M.; Cerullo, G.; Di Onofrio, V.; Galle, F.; Liguori, G. Antioxidant, immunomodulatory, and anti-inflammatory effects of Spirulina in disease conditions: A systematic review. Int. J. Food Sci. Nutr. 2022, 73, 1047–1056. [Google Scholar] [CrossRef] [PubMed]
- Moradi, S.; Ziaei, R.; Foshati, S.; Mohammadi, H.; Nachvak, S.M.; Rouhani, M.H. Effects of Spirulina supplementation on obesity: A systematic review and meta-analysis of randomized clinical trials. Complement. Ther. Med. 2019, 47, 102211. [Google Scholar] [CrossRef]
- Mohiti, S.; Zarezadeh, M.; Naeini, F.; Tutunchi, H.; Ostadrahimi, A.; Ghoreishi, Z.; Ebrahimi Mamaghani, M. Spirulina supplementation and oxidative stress and pro-inflammatory biomarkers: A systematic review and meta-analysis of controlled clinical trials. Clin. Exp. Pharmacol. Physiol. 2021, 1059–1069. [Google Scholar] [CrossRef] [PubMed]
- Zeinalian, R.; Farhangi, M.A.; Shariat, A.; Saghafi-Asl, M. The effects of Spirulina Platensis on anthropometric indices, appetite, lipid profile and serum vascular endothelial growth factor (VEGF) in obese individuals: A randomized double blinded placebo controlled trial. BMC Complement. Altern. Med. 2017, 17, 225. [Google Scholar] [CrossRef] [PubMed]
- Beavers, K.M.; Brinkley, T.E.; Nicklas, B.J. Effect of exercise training on chronic inflammation. Clin. Chim. Acta 2010, 411, 785–793. [Google Scholar] [CrossRef] [PubMed]
- Yavari, A.; Javadi, M.; Mirmiran, P.; Bahadoran, Z. Exercise-induced oxidative stress and dietary antioxidants. Asian J. Sports Med. 2015, 6, e24898. [Google Scholar] [CrossRef] [PubMed]
- Araújo, M.M.; Botelho, P.B. Probiotics, prebiotics, and synbiotics in chronic constipation: Outstanding aspects to be considered for the current evidence. Front. Nutr. 2022, 9, 935830. [Google Scholar] [CrossRef]
- Kalafati, M.; Jamurtas, A.Z.; Nikolaidis, M.G.; Paschalis, V.; Theodorou, A.A.; Sakellariou, G.K.; Koutedakis, Y.; Kouretas, D. Ergogenic and antioxidant effects of spirulina supplementation in humans. Med. Sci. Sports Exerc. 2010, 42, 142–151. [Google Scholar] [CrossRef]
- Chaouachi, M.; Vincent, S.; Groussard, C. A Review of the Health-Promoting Properties of Spirulina with a Focus on athletes’ Performance and Recovery. J. Diet. Suppl. 2023, 1–32. [Google Scholar] [CrossRef]
- Hernández-Lepe, M.A.; López-Díaz, J.A.; Juárez-Oropeza, M.A.; Hernández-Torres, R.P.; Wall-Medrano, A.; Ramos-Jiménez, A. Effect of Arthrospira (Spirulina) maxima supplementation and a systematic physical exercise program on the body composition and cardiorespiratory fitness of overweight or obese subjects: A double-blind, randomized, and crossover controlled trial. Mar. Drugs 2018, 16, 364. [Google Scholar] [CrossRef]
- Golestani, F.; Mogharnasi, M.; Erfani-Far, M.; Abtahi-Eivari, S.H. The effects of spirulina under high-intensity interval training on levels of nesfatin-1, omentin-1, and lipid profiles in overweight and obese females: A randomized, controlled, single-blind trial. J. Res. Med. Sci. 2021, 26, 10. [Google Scholar] [CrossRef] [PubMed]
- Hernández-Lepe, M.A.; Wall-Medrano, A.; López-Díaz, J.A.; Juárez-Oropeza, M.A.; Luqueño-Bocardo, O.I.; Hernández-Torres, R.P.; Ramos-Jiménez, A. Hypolipidemic effect of Arthrospira (Spirulina) maxima supplementation and a systematic physical exercise program in overweight and obese men: A double-blind, randomized, and crossover controlled trial. Mar. Drugs 2019, 17, 270. [Google Scholar] [CrossRef] [PubMed]
- Oriquat, G.A.; Ali, M.A.; Mahmoud, S.A.; Eid, R.M.; Hassan, R.; Kamel, M.A. Improving hepatic mitochondrial biogenesis as a postulated mechanism for the antidiabetic effect of Spirulina platensis in comparison with metformin. Appl. Physiol. Nutr. Metab. 2019, 44, 357–364. [Google Scholar] [CrossRef] [PubMed]
- Nobari, H.; Gandomani, E.E.; Reisi, J.; Vahabidelshad, R.; Suzuki, K.; Volpe, S.L.; Pérez-Gómez, J. Effects of 8 weeks of high-intensity interval training and spirulina supplementation on immunoglobin levels, cardio-respiratory fitness, and body composition of overweight and obese women. Biology 2022, 11, 196. [Google Scholar] [CrossRef]
- Ceylan, H.İ.; Saygın, Ö.; Özel Türkçü, Ü. Assessment of acute aerobic exercise in the morning versus evening on asprosin, spexin, lipocalin-2, and insulin level in overweight/obese versus normal weight adult men. Chronobiol. Int. 2020, 37, 1252–1268. [Google Scholar] [CrossRef]
- Pescatello, L.S. ACSM’s Guidelines for Exercise Testing and Prescription; Lippincott Williams & Wilkins: Philadelphia, PA, USA, 2014. [Google Scholar]
- Myers, J.; Arena, R.; Franklin, B.; Pina, I.; Kraus, W.; McInnis, K.; Balady, G. American Heart Association Committee on Exercise, Cardiac Rehabilitation, and Prevention of the Council on Clinical Cardiology, the Council on Nutrition, Physical Activity, and Metabolism, and the Council on Cardiovascular Nursing. Recommendations for clinical exercise laboratories: A scientific statement from the american heart association. Circulation 2009, 119, 3144–3161. [Google Scholar]
- Soltani, M.; Aghaei Bahmanbeglou, N.; Ahmadizad, S. High-intensity interval training irrespective of its intensity improves markers of blood fluidity in hypertensive patients. Clin. Exp. Hypertens. 2020, 42, 309–314. [Google Scholar] [CrossRef]
- Mazokopakis, E.E.; Papadomanolaki, M.G.; Fousteris, A.A.; Kotsiris, D.A.; Lampadakis, I.M.; Ganotakis, E.S. The hepatoprotective and hypolipidemic effects of Spirulina (Arthrospira platensis) supplementation in a Cretan population with non-alcoholic fatty liver disease: A prospective pilot study. Ann. Gastroenterol. 2014, 27, 387. [Google Scholar]
- Thomas, D.T.; Erdman, K.A.; Burke, L.M. Position of the Academy of Nutrition and Dietetics, Dietitians of Canada, and the American College of Sports Medicine: Nutrition and athletic performance. J. Acad. Nutr. Diet. 2016, 116, 501–528. [Google Scholar] [CrossRef]
- Hopkins, W.G.; Marshall, S.W.; Batterham, A.M.; Hanin, J. Progressive statistics for studies in sports medicine and exercise science. Med. Sci. Sports Exerc. 2009, 41, 3–13. [Google Scholar] [CrossRef] [PubMed]
- Booth, F.W.; Roberts, C.K.; Laye, M.J. Lack of exercise is a major cause of chronic diseases. Compr. Physiol. 2012, 2, 1143. [Google Scholar] [PubMed]
- Gurney, T.; Spendiff, O. Algae supplementation for exercise performance: Current perspectives and future directions for spirulina and chlorella. Front. Nutr. 2022, 384, 865741. [Google Scholar] [CrossRef]
- Szulinska, M.; Gibas-Dorna, M.; Miller-Kasprzak, E.; Suliburska, J.; Miczke, A.; Walczak-Gałezewska, M.; Stelmach-Mardas, M.; Walkowiak, J.; Bogdanski, P. Spirulina maxima improves insulin sensitivity, lipid profile, and total antioxidant status in obese patients with well-treated hypertension: A randomized double-blind placebo-controlled study. Eur. Rev. Med. Pharmacol. Sci. 2017, 21, 2473–2481. [Google Scholar] [PubMed]
- Batrakoulis, A.; Jamurtas, A.Z.; Metsios, G.S.; Perivoliotis, K.; Liguori, G.; Feito, Y.; Riebe, D.; Thompson, W.R.; Angelopoulos, T.J.; Krustrup, P. Comparative efficacy of 5 exercise types on cardiometabolic health in overweight and obese adults: A systematic review and network meta-analysis of 81 randomized controlled trials. Circ. Cardiovasc. Qual. Outcomes 2022, 15, e008243. [Google Scholar] [CrossRef] [PubMed]
- Iyer Uma, M.; Sophia, A.; Uliyar, V. Glycemic and lipemic responses of selected spirulina-supplemented rice-based recipes in normal subjects. Age Years 1999, 22, 17–22. [Google Scholar]
- Hao, S.; Li, F.; Li, Q.; Yang, Q.; Zhang, W. Phycocyanin Protects against High Glucose High Fat Diet Induced Diabetes in Mice and Participates in AKT and AMPK Signaling. Foods 2022, 11, 3183. [Google Scholar] [CrossRef]
- Mann, S.; Beedie, C.; Balducci, S.; Zanuso, S.; Allgrove, J.; Bertiato, F.; Jimenez, A. Changes in insulin sensitivity in response to different modalities of exercise: A review of the evidence. Diabetes/Metab. Res. Rev. 2014, 30, 257–268. [Google Scholar] [CrossRef]
- Holten, M.K.; Zacho, M.; Gaster, M.; Juel, C.; Wojtaszewski, J.F.; Dela, F. Strength training increases insulin-mediated glucose uptake, GLUT4 content, and insulin signaling in skeletal muscle in patients with type 2 diabetes. Diabetes 2004, 53, 294–305. [Google Scholar] [CrossRef]
- Kjøbsted, R.; Munk-Hansen, N.; Birk, J.B.; Foretz, M.; Viollet, B.; Björnholm, M.; Zierath, J.R.; Treebak, J.T.; Wojtaszewski, J.F. Enhanced muscle insulin sensitivity after contraction/exercise is mediated by AMPK. Diabetes 2017, 66, 598–612. [Google Scholar] [CrossRef]
- Roughan, P.G. Spirulina: A source of dietary gamma-linolenic acid? J. Sci. Food Agric. 1989, 47, 85–93. [Google Scholar] [CrossRef]
- Dillon, J.; Phuc, A.P.; Dubacq, J. Nutritional value of the alga Spirulina. Plants Hum. Nutr. 1995, 77, 32–46. [Google Scholar]
- Iwata, K.; Inayama, T.; Kato, T. Effects of Spirulina platensis on plasma lipoprotein lipase activity in fructose-induced hyperlipidemic rats. J. Nutr. Sci. Vitaminol. 1990, 36, 165–171. [Google Scholar] [CrossRef] [PubMed]
- Maximus, P.S.; Al Achkar, Z.; Hamid, P.F.; Hasnain, S.S.; Peralta, C.A. Adipocytokines: Are they the theory of everything? Cytokine 2020, 133, 155144. [Google Scholar] [CrossRef] [PubMed]
- Ouchi, N.; Parker, J.L.; Lugus, J.J.; Walsh, K. Adipokines in inflammation and metabolic disease. Nat. Rev. Immunol. 2011, 11, 85–97. [Google Scholar] [CrossRef]
- Otani, H. Oxidative stress as pathogenesis of cardiovascular risk associated with metabolic syndrome. Antioxid. Redox Signal. 2011, 15, 1911–1926. [Google Scholar] [CrossRef]
- Gordon, S. Alternative activation of macrophages. Nat. Rev. Immunol. 2003, 3, 23–35. [Google Scholar] [CrossRef]
- Basak, I.; Patil, K.S.; Alves, G.; Larsen, J.P.; Møller, S.G. microRNAs as neuroregulators, biomarkers and therapeutic agents in neurodegenerative diseases. Cell. Mol. Life Sci. 2016, 73, 811–827. [Google Scholar] [CrossRef]
- Cancello, R.; Henegar, C.; Viguerie, N.; Taleb, S.; Poitou, C.; Rouault, C.; Coupaye, M.; Pelloux, V.; Hugol, D.; Bouillot, J.-L. Reduction of macrophage infiltration and chemoattractant gene expression changes in white adipose tissue of morbidly obese subjects after surgery-induced weight loss. Diabetes 2005, 54, 2277–2286. [Google Scholar] [CrossRef]


| CG | SG | TG | TSG | |||||
|---|---|---|---|---|---|---|---|---|
| Pre | Post | Pre | Post | Pre | Post | Pre | Post | |
| Energy (kcal/day) | 2321 ± 47 | 2342 ± 56 | 2354 ± 101 | 2314 ± 100 | 2349 ± 117 | 2297 ± 117 | 2375 ± 157 | 2301 ± 126 |
| CHO (g/day) | 292 ± 30.4 | 295 ± 31.3 | 288.4 ± 25.1 | 278 ± 26.5 | 298 ± 41.6 | 270 ± 37.2 | 297 ± 39.6 | 269 ± 30.1 |
| Fat (g/day) | 91.2 ± 16.0 | 92 ± 19.8 | 95.5 ± 17.7 | 84 ± 16.2 | 94.4 ± 19.4 | 84.1 ± 15.2 | 91 ± 15.87 | 75.2 ± 18.3 |
| Protein (g/day) | 115 ± 17.0 | 119 ± 19.3 | 112 ± 15.5 | 105 ± 16.6 | 113 ± 13.8 | 103 ± 11.7 | 112 ± 11.5 | 101 ± 12.5 |
| CG | SG | TG | TSG | |||||
|---|---|---|---|---|---|---|---|---|
| Pre | Post | Pre | Post | Pre | Post | Pre | Post | |
| Body height (cm) | 175.7 ± 4.21 | - | 171.3 ± 4.17 | - | 173.3 ± 8.16 | - | 175.2 ± 6.47 | - |
| Body Mass (kg) | 101.22 ± 5.27 | 102.03 ± 2.48 | 97.81 ± 4.73 | 97.05 ± 2.45 | 99.52 ± 10.21 | 96.22 ± 2.39 | 101.48 ± 7.95 | 96.98 ± 1.93 a |
| BMI (kg/m2) | 32.77 ± 1.18 | 33.07 ± 1.40 | 33.31 ± 0.62 | 33.13 ± 1.99 | 33.01 ± 0.76 | 32.16 ± 2.71 | 33.00 ± 1.00 | 31.68 ± 2.18 |
| VO2peak (mL⋅kg−1⋅min−1) | 26.58 ± 1.76 | 25.71 ± 1.73 | 26.72 ± 1.36 | 27.92 ± 2.32 a,b | 26.38 ± 1.30 | 29.93 ± 2.08 a,b | 26.46 ± 1.76 | 30.38 ± 1.97 a,b,ab |
| HDL (mg/dL) | 29.76 ± 6.43 | 31.67 ± 6.76 | 30.85 ± 4.68 | 36.40 ± 5.36 a,b | 31.23 ± 4.32 | 37.23 ± 7.45 a,b | 28.19 ± 5.88 | 42.19 ± 5.48 a,b,ab |
| LDL (mg/dL) | 174.0 ± 13.76 | 173.5 ± 13.49 | 172.7 ± 13.91 | 165.9 ± 11.9 a,b | 174.3 ± 10.63 | 158.2 ± 8.56 a,b | 176.4 ± 16.83 | 151.8 ± 13.87 a,b,ab |
| TC (mg/dL) | 264.2 ± 16.23 | 269.7 ± 12.24 | 256.9 ± 20.07 | 245.7 ± 18.3 a,b | 262.3 ± 13.02 | 245.0 ± 15.0a,b | 258.9 ± 15.77 | 240.0 ± 11.14 a,b,ab |
| TGL (mg/dL) | 260.9 ± 15.51 | 258.9 ± 12.88 | 262.8 ± 16.75 | 258.8 ± 13.5 a,b | 261.4 ± 20.78 | 252.0 ± 18.5 a,b | 265.8 ± 19.17 | 253.8 ± 16.48 a,b,ab |
Disclaimer/Publisher’s Note: The statements, opinions and data contained in all publications are solely those of the individual author(s) and contributor(s) and not of MDPI and/or the editor(s). MDPI and/or the editor(s) disclaim responsibility for any injury to people or property resulting from any ideas, methods, instructions or products referred to in the content. |
© 2023 by the authors. Licensee MDPI, Basel, Switzerland. This article is an open access article distributed under the terms and conditions of the Creative Commons Attribution (CC BY) license (https://creativecommons.org/licenses/by/4.0/).
Share and Cite
Supriya, R.; Delfan, M.; Saeidi, A.; Samaie, S.S.; Al Kiyumi, M.H.; Escobar, K.A.; Laher, I.; Heinrich, K.M.; Weiss, K.; Knechtle, B.; et al. Spirulina Supplementation with High-Intensity Interval Training Decreases Adipokines Levels and Cardiovascular Risk Factors in Men with Obesity. Nutrients 2023, 15, 4891. https://doi.org/10.3390/nu15234891
Supriya R, Delfan M, Saeidi A, Samaie SS, Al Kiyumi MH, Escobar KA, Laher I, Heinrich KM, Weiss K, Knechtle B, et al. Spirulina Supplementation with High-Intensity Interval Training Decreases Adipokines Levels and Cardiovascular Risk Factors in Men with Obesity. Nutrients. 2023; 15(23):4891. https://doi.org/10.3390/nu15234891
Chicago/Turabian StyleSupriya, Rashmi, Maryam Delfan, Ayoub Saeidi, Seyedeh Somayeh Samaie, Maisa Hamed Al Kiyumi, Kurt A. Escobar, Ismail Laher, Katie M. Heinrich, Katja Weiss, Beat Knechtle, and et al. 2023. "Spirulina Supplementation with High-Intensity Interval Training Decreases Adipokines Levels and Cardiovascular Risk Factors in Men with Obesity" Nutrients 15, no. 23: 4891. https://doi.org/10.3390/nu15234891