
Impact of a Nutrient Formulation on Longitudinal Myelination, Cognition, and Behavior from Birth to 2 Years: A Randomized Clinical Trial
 , , and
Abstract
:1. Introduction
2. Materials and Methods
2.1. Trial Design
2.2. Trial Interventions
2.3. Trial Outcomes
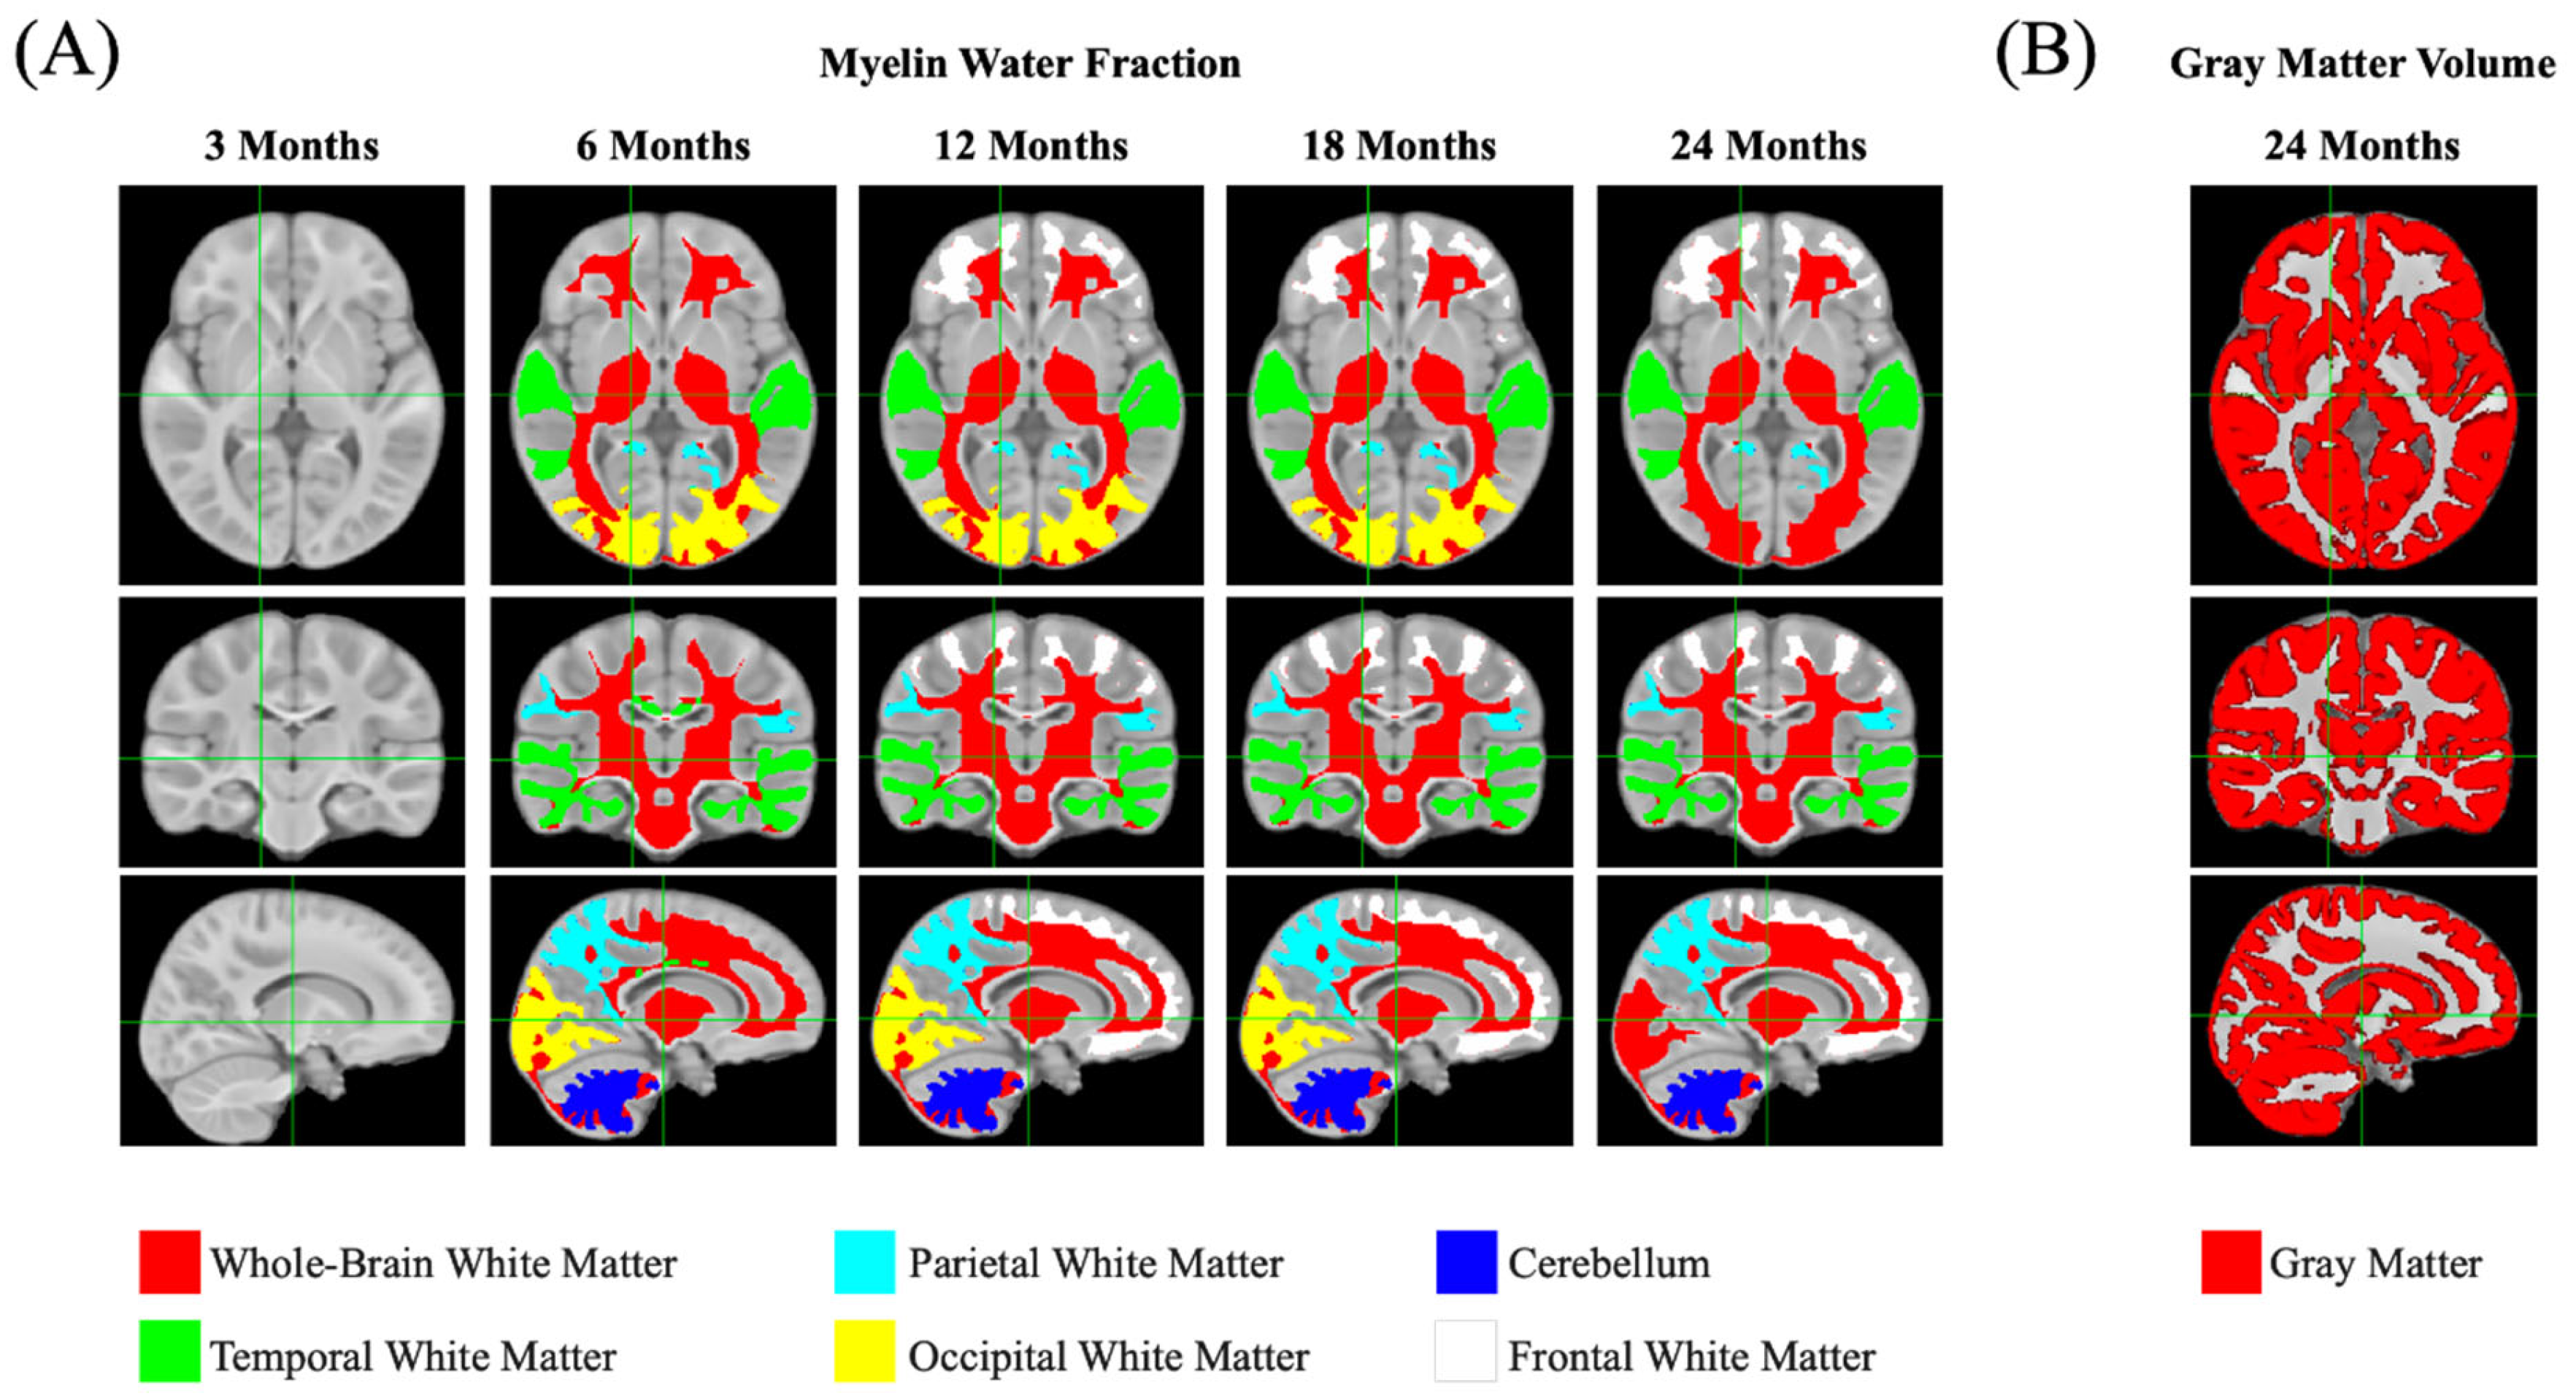
2.4. MRI Assessment
2.4.1. MRI Acquisition Protocol
2.4.2. MRI Analysis
2.4.3. Multi-Site Harmonization
2.5. Cognitive and Behavioral Assessment
2.5.1. Endpoints for Inference Statistics
2.5.2. A Priori Defined Endpoints for Descriptive Statistics
2.6. Sample Size Justification
2.7. Statistical Analysis
3. Results
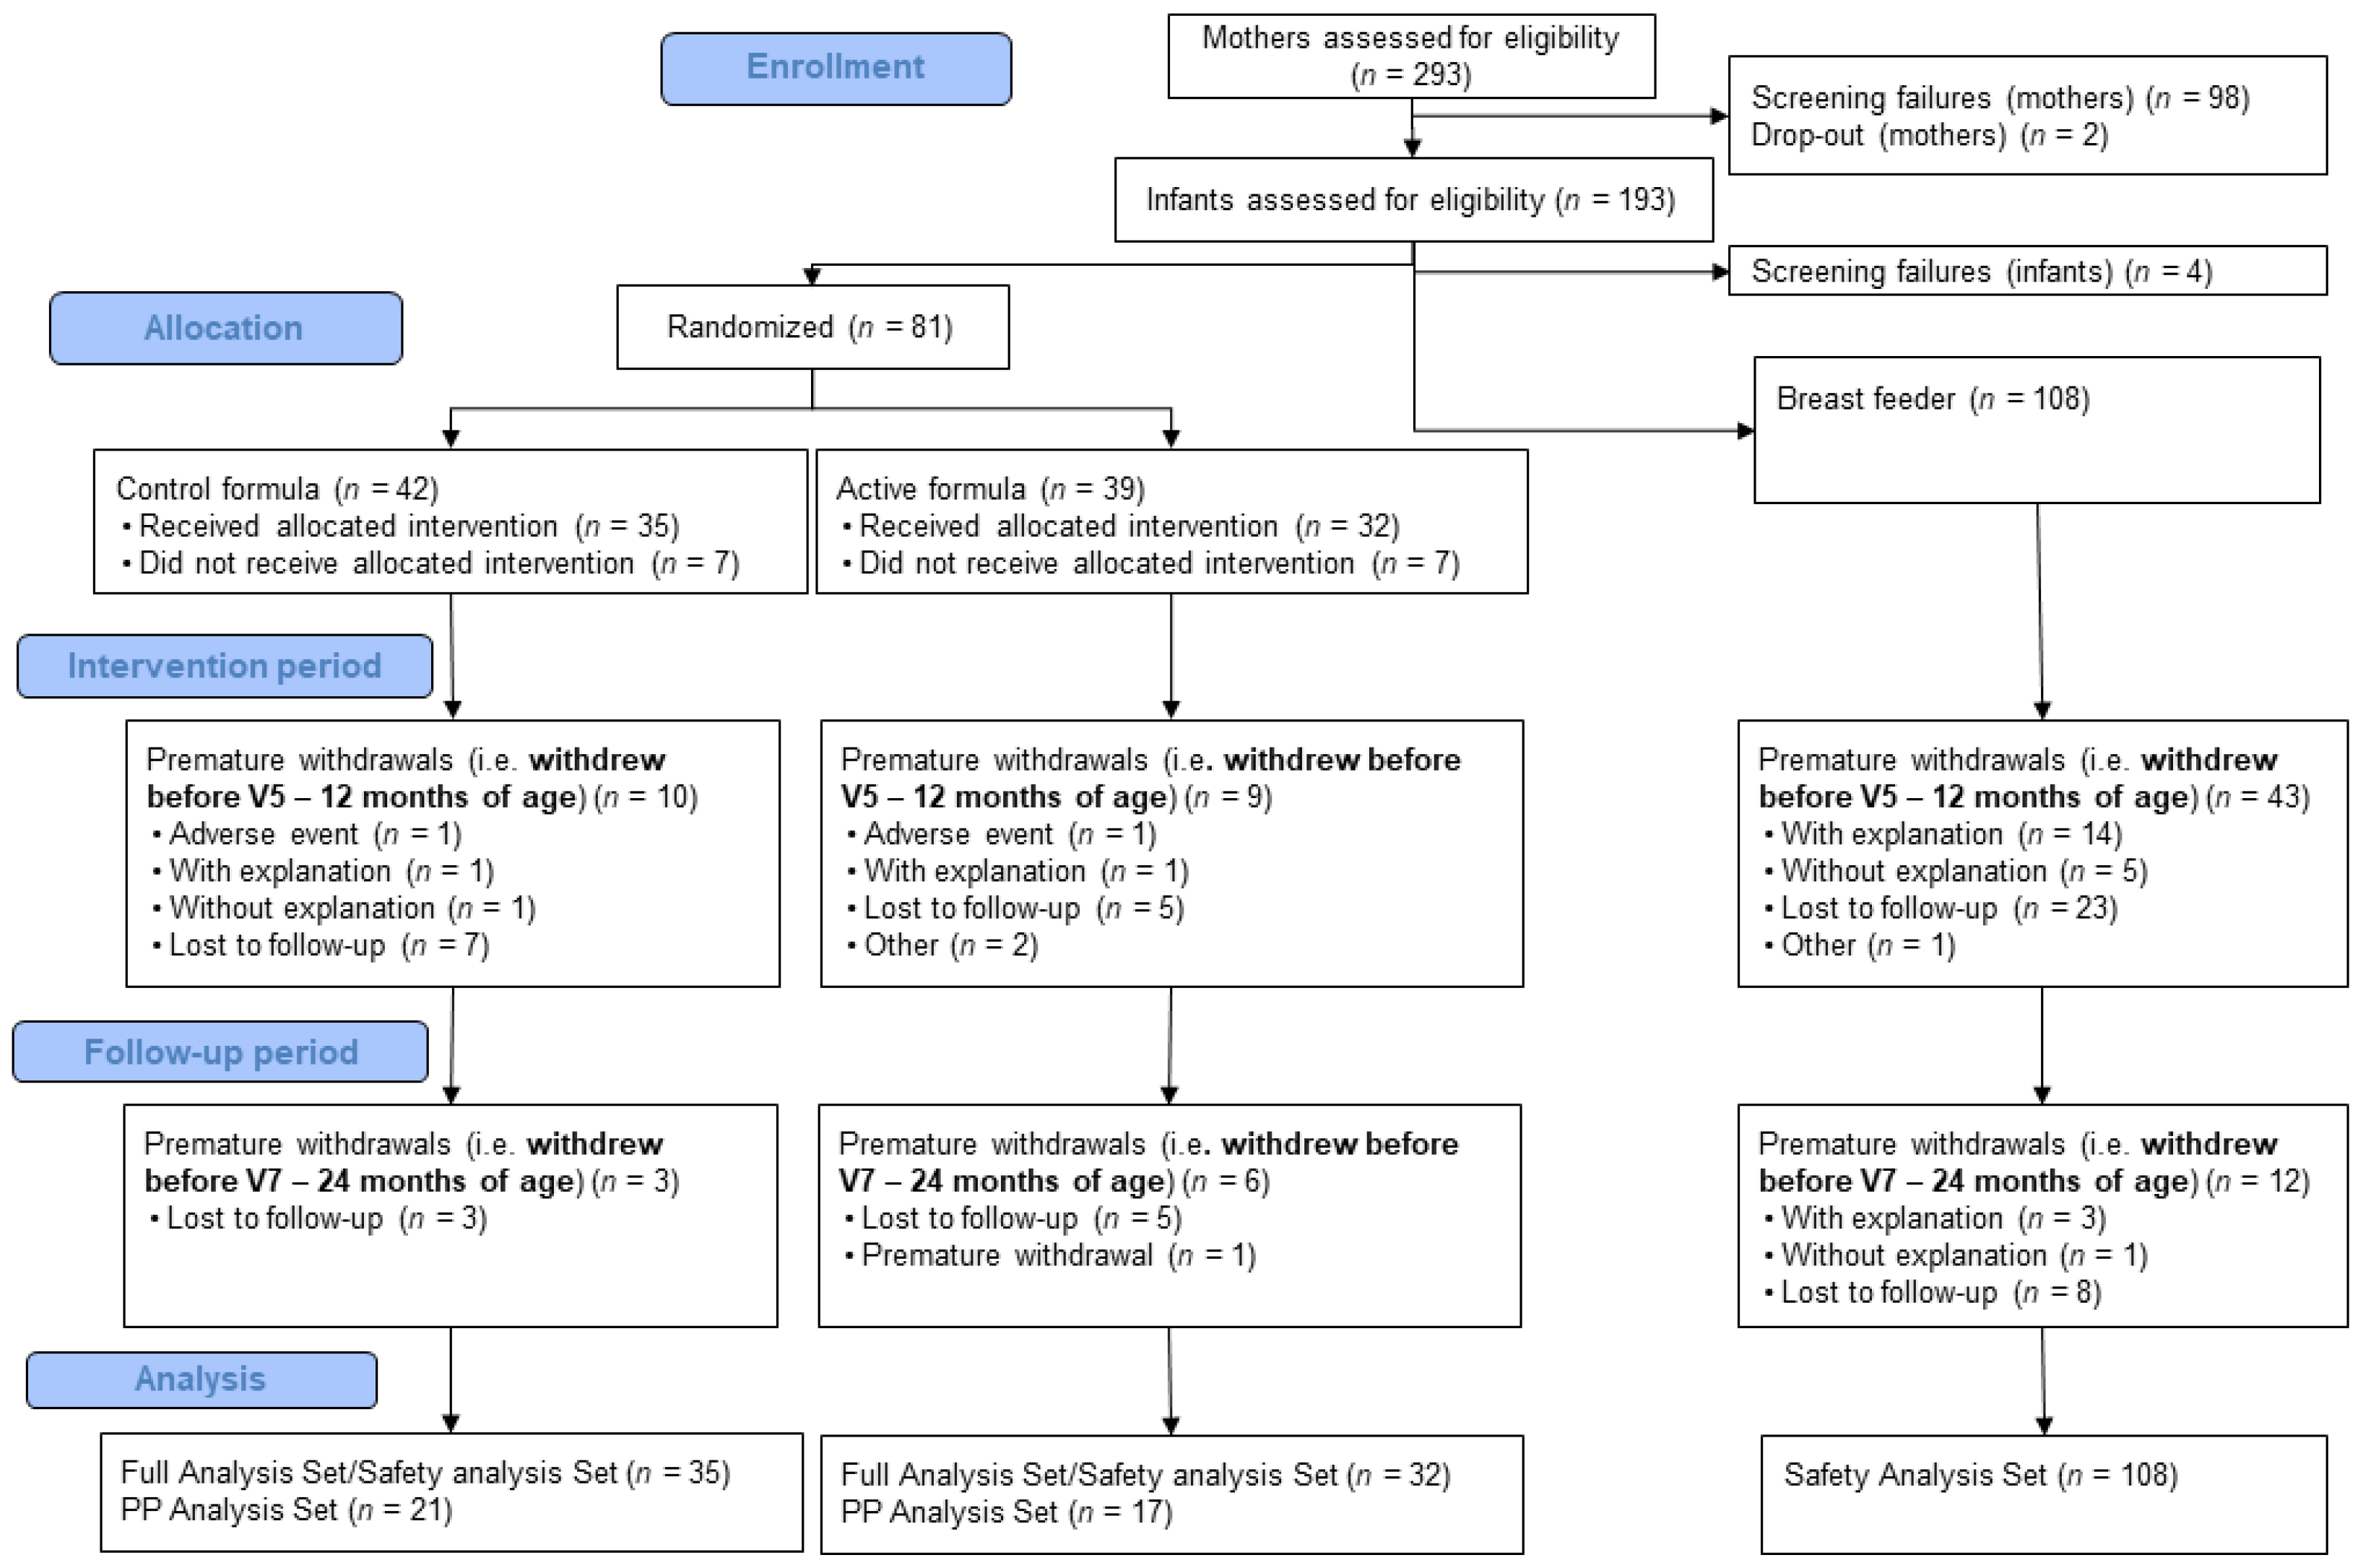
3.1. Participants
3.2. Product Compliance for Intervention
3.3. Neuroimaging Results
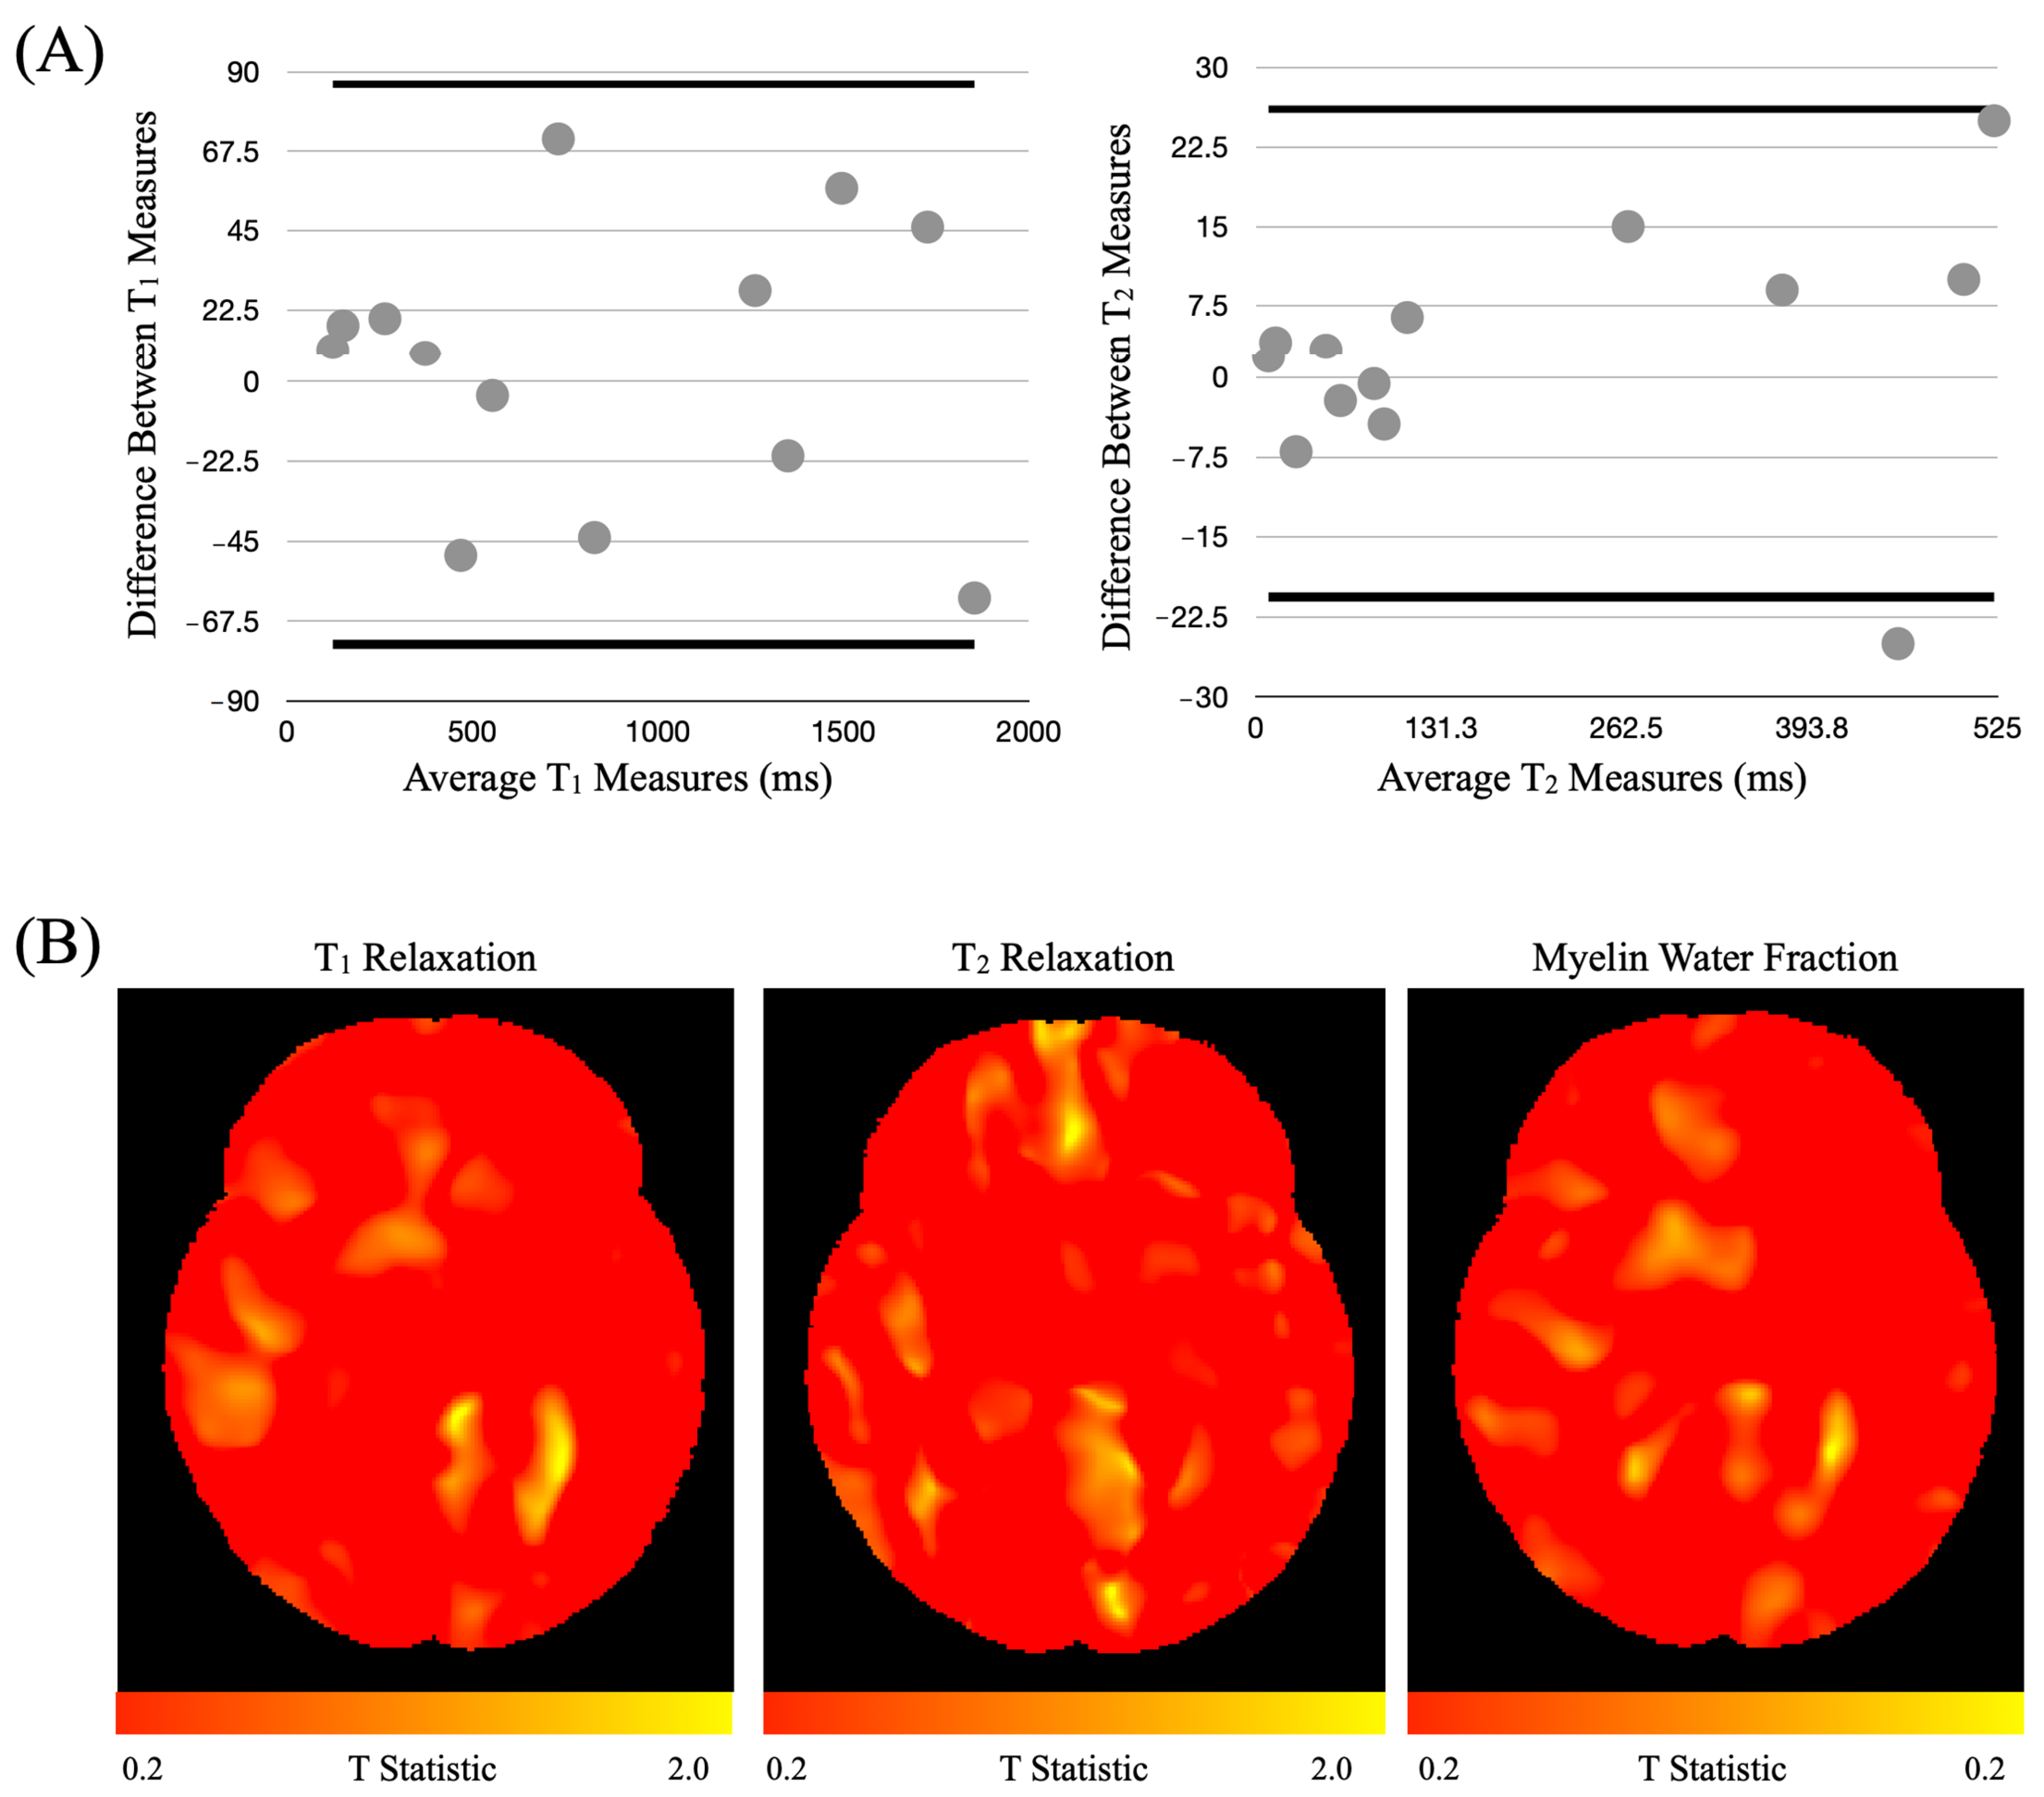
3.3.1. Harmonization Study
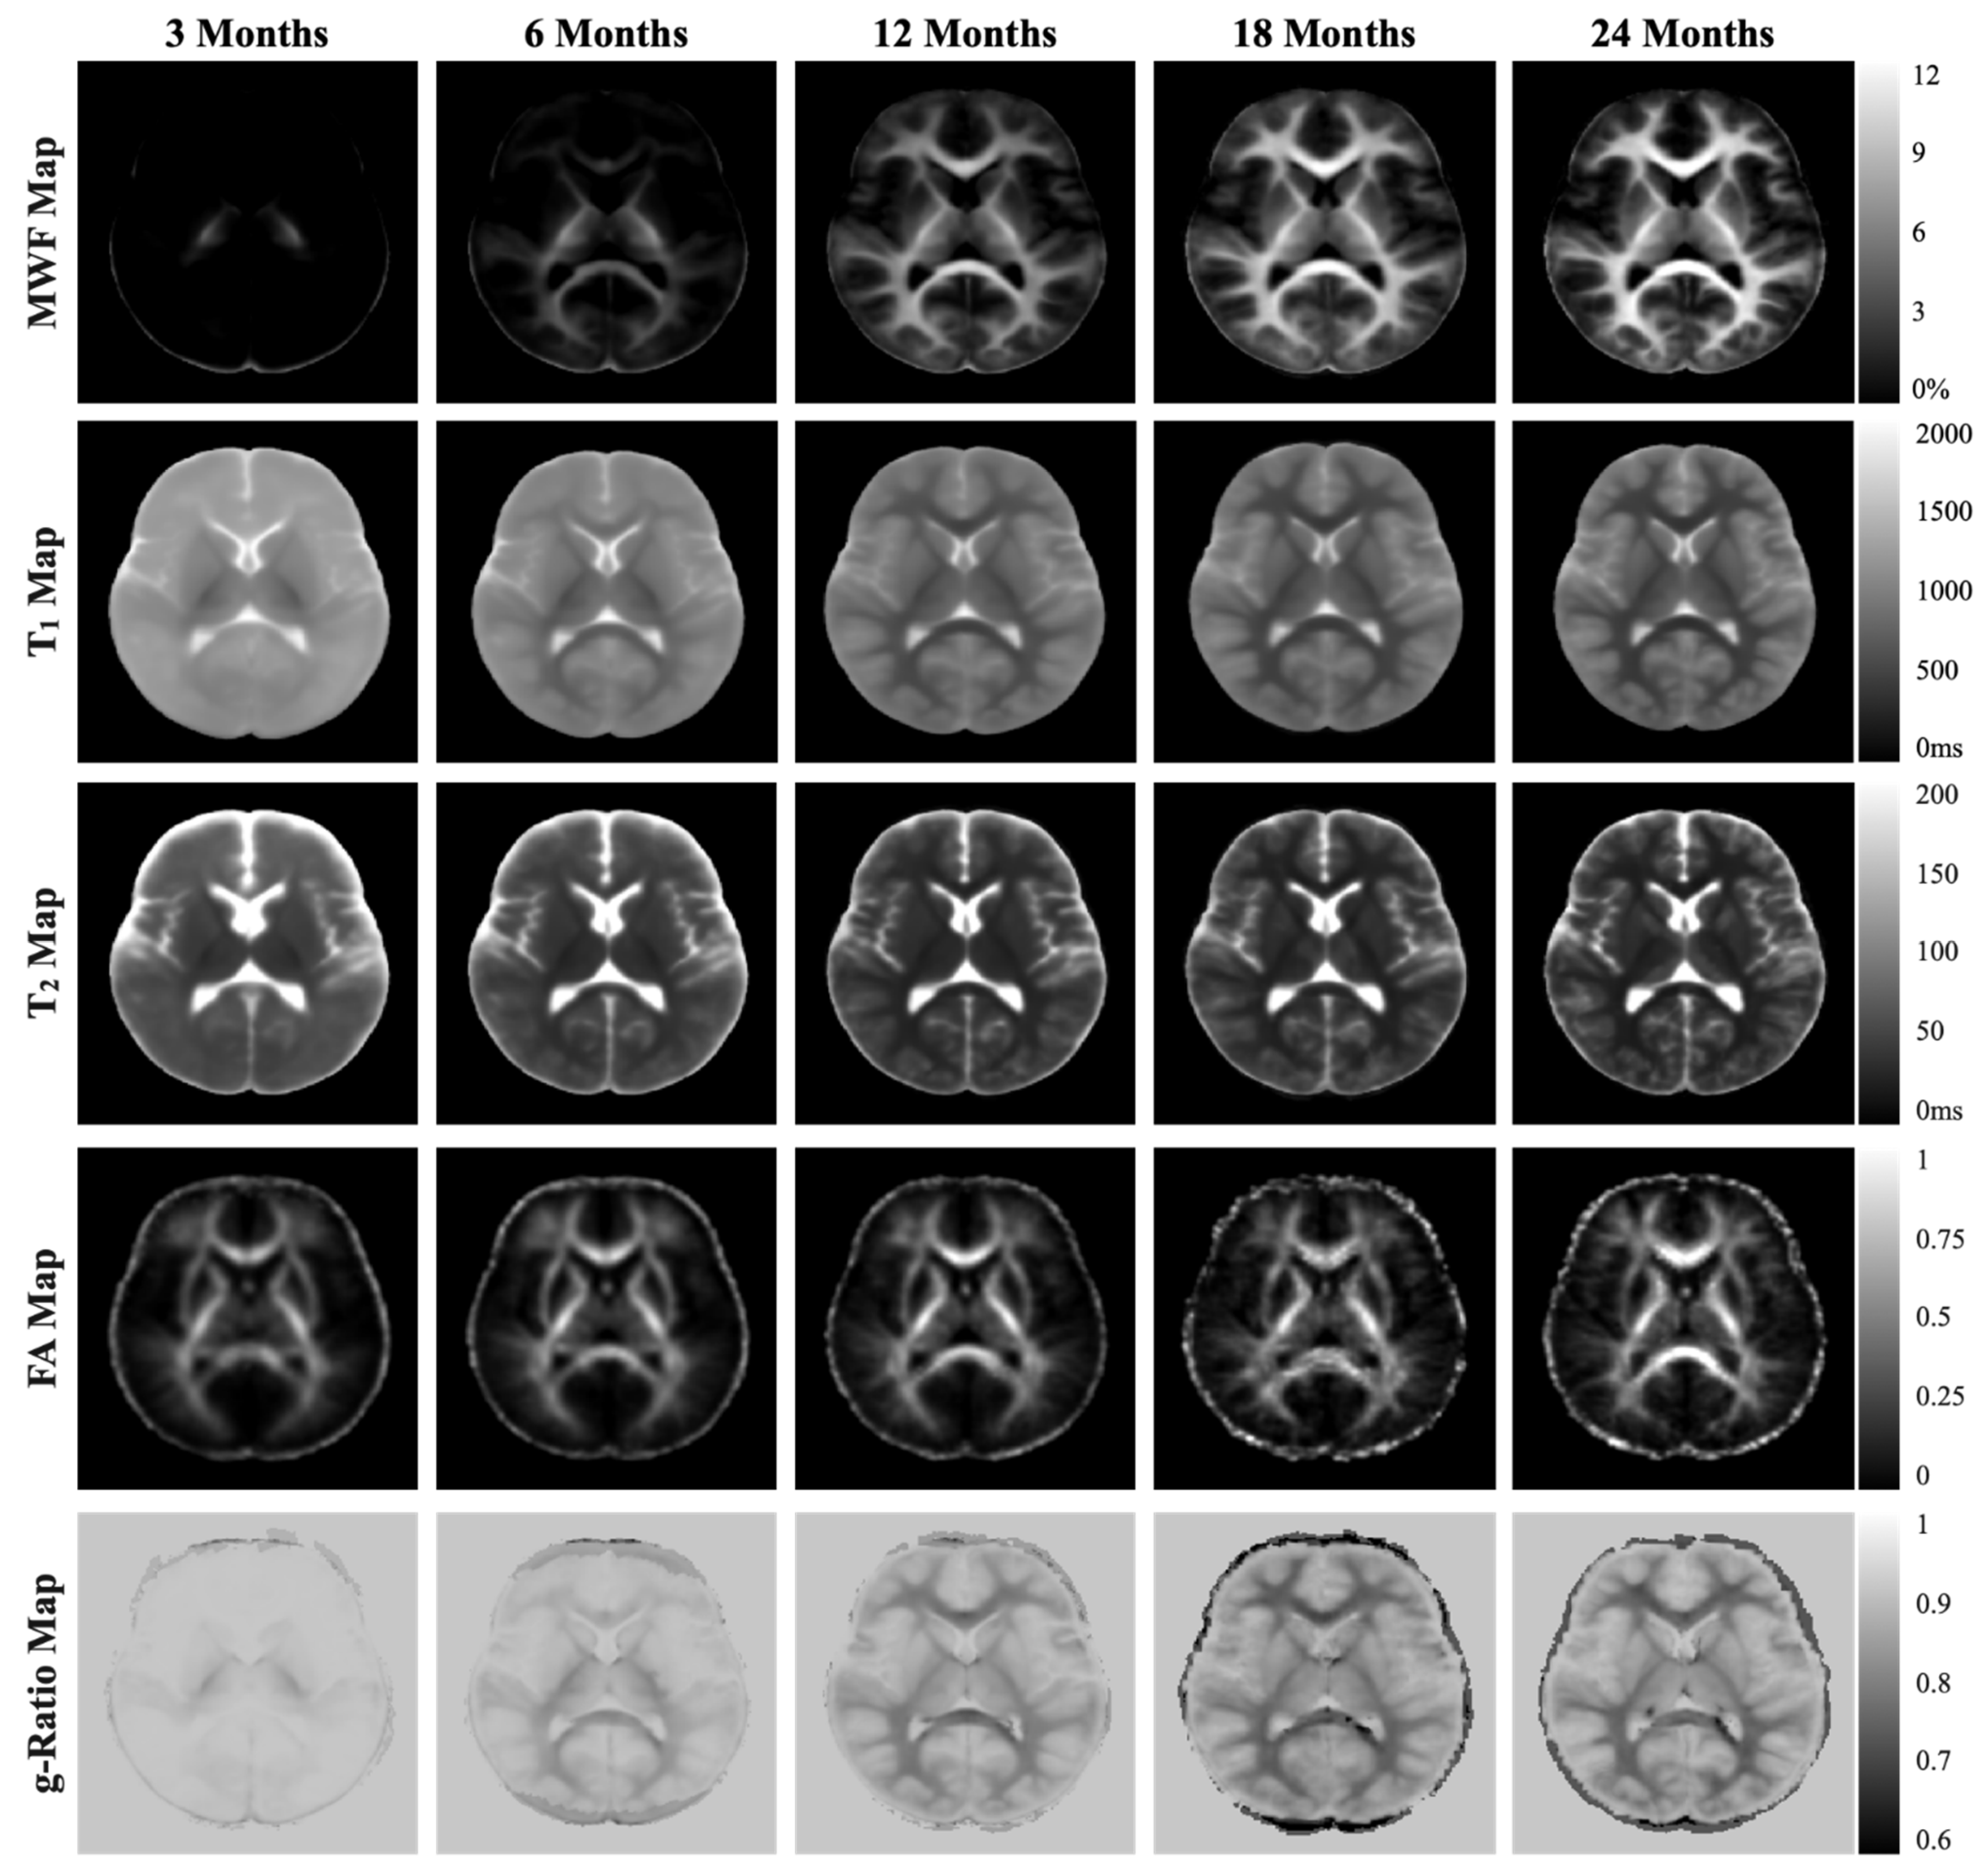
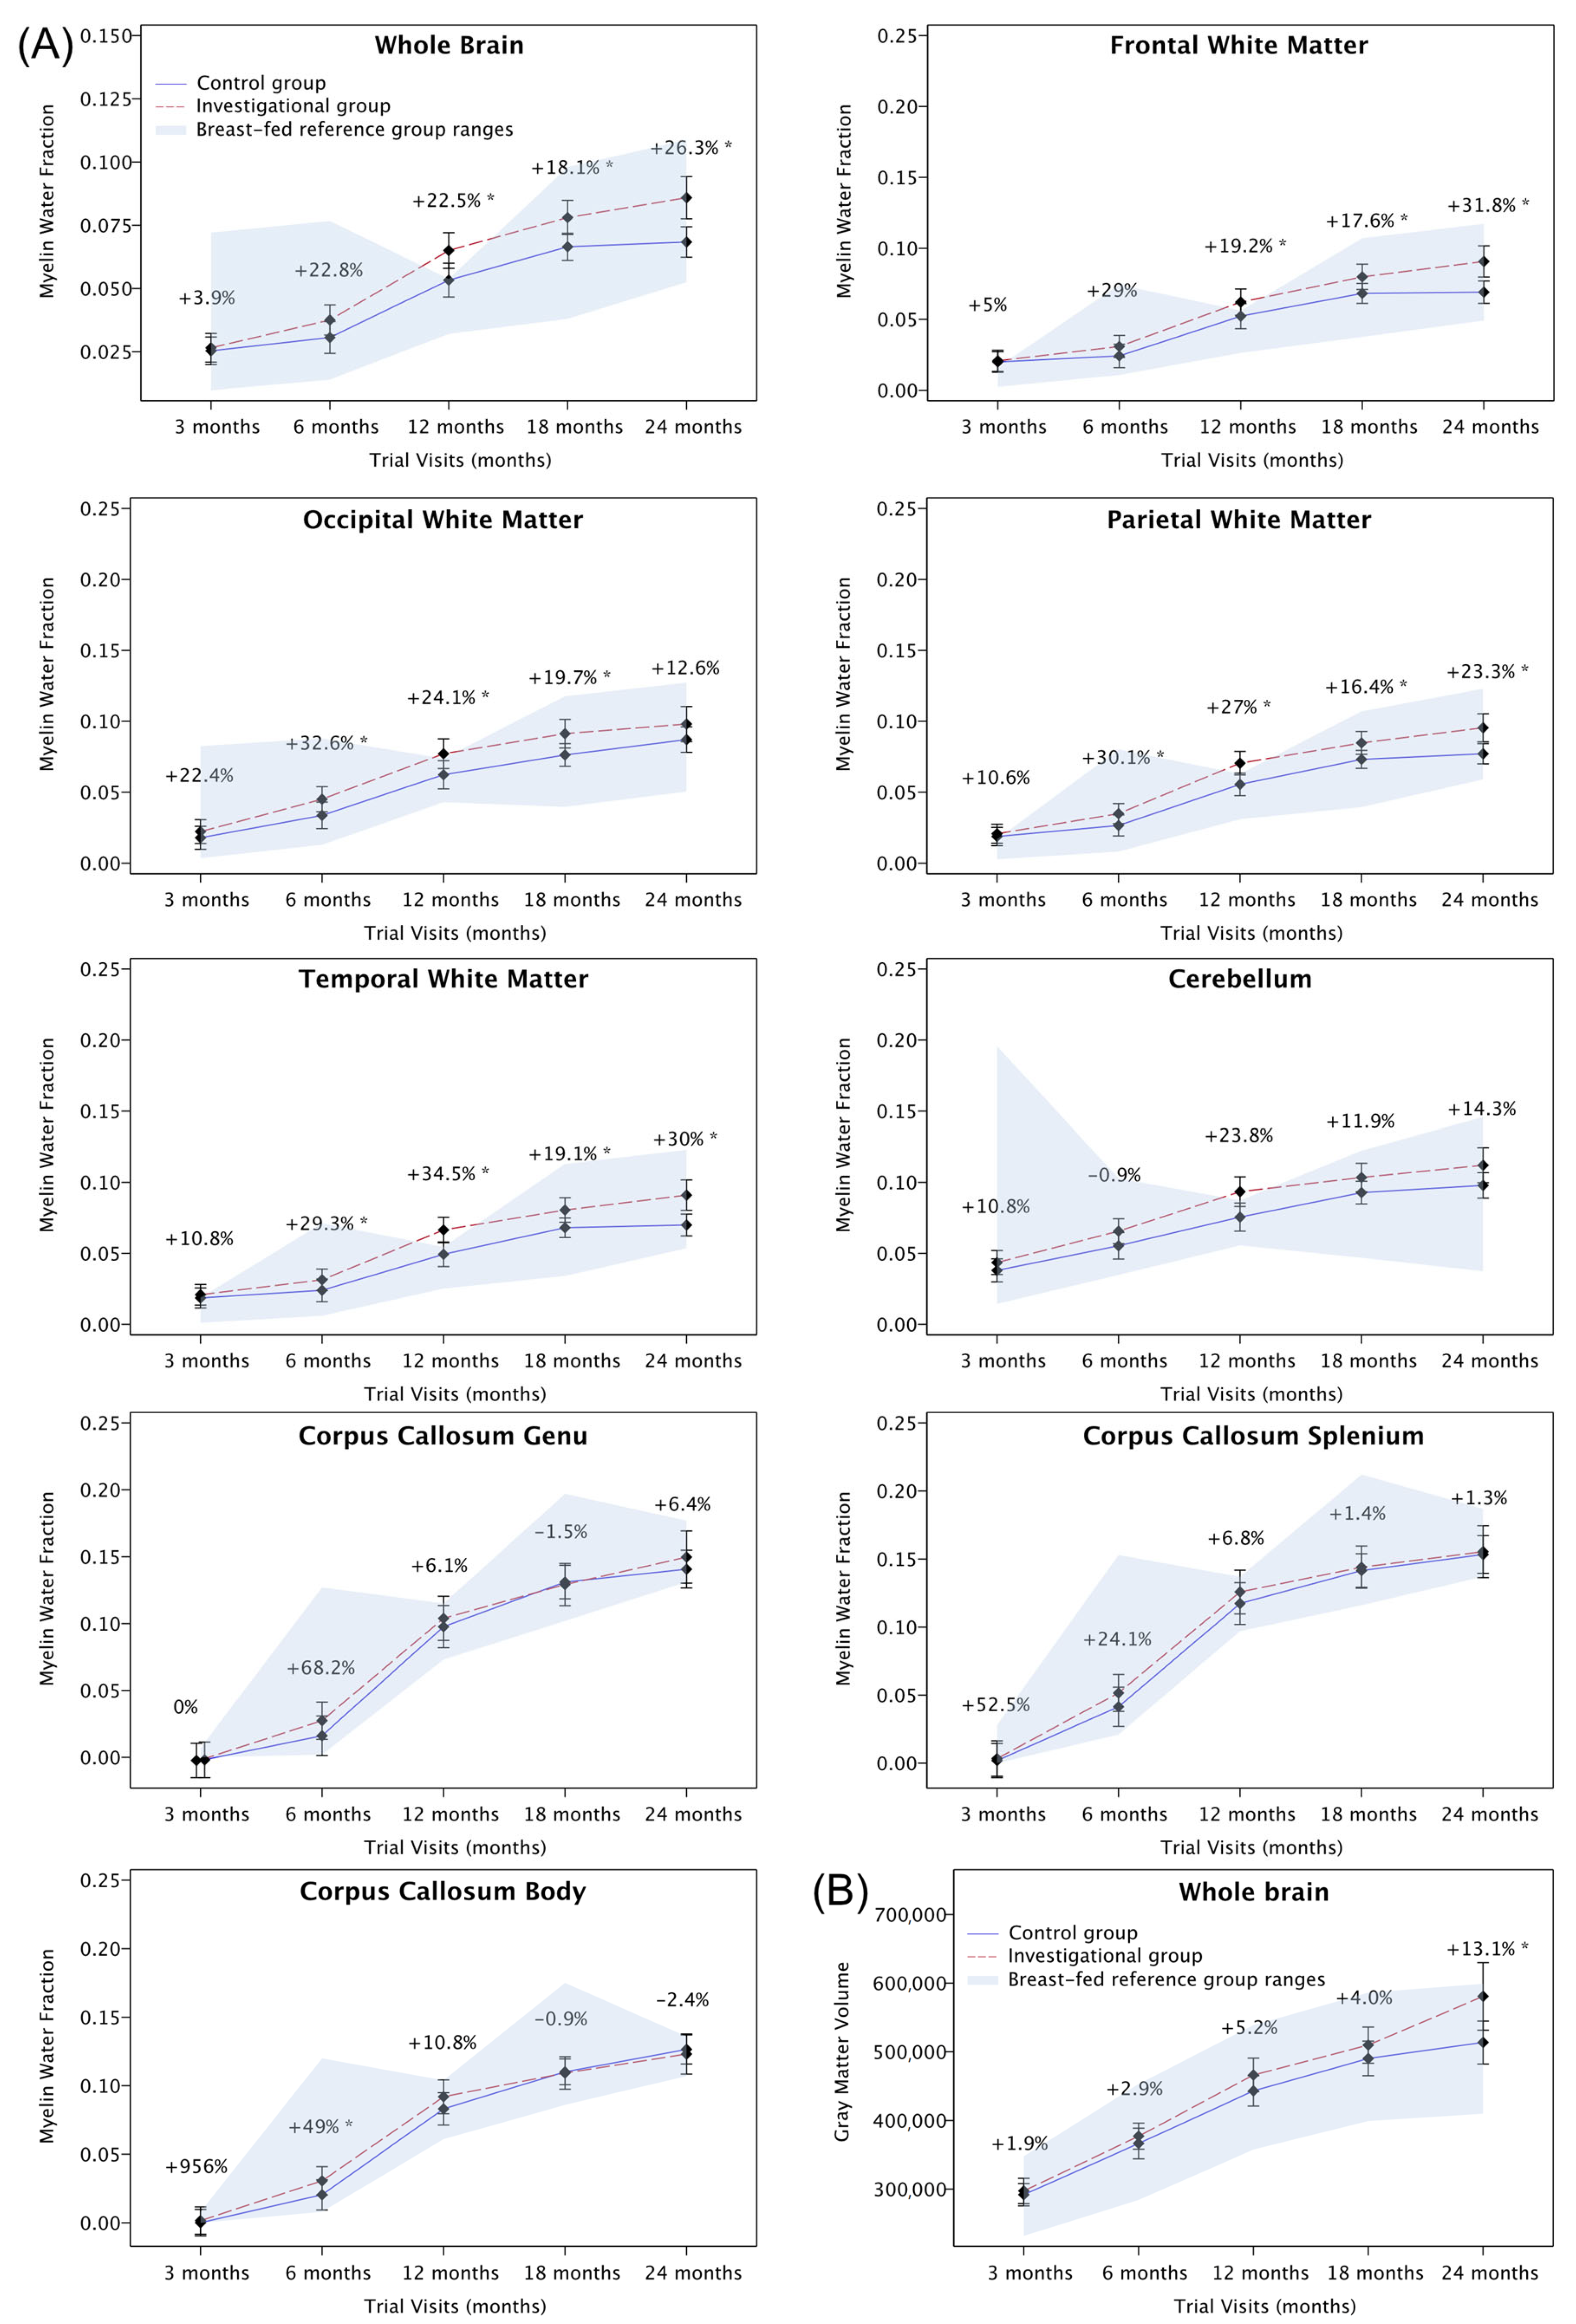
3.3.2. Myelination (Main Outcome)
3.3.3. Gray and White Matter Volume (Secondary Outcomes)
3.3.4. Structural and Functional Connectivity (Secondary Outcomes)
3.4. Cognitive and Behavioral Results (Secondary Outcomes)
3.5. Correlations between Myelin and Developmental Outcomes (Exploratory Analyses)
3.5.1. Motor Development
3.5.2. Language and Cognitive Development
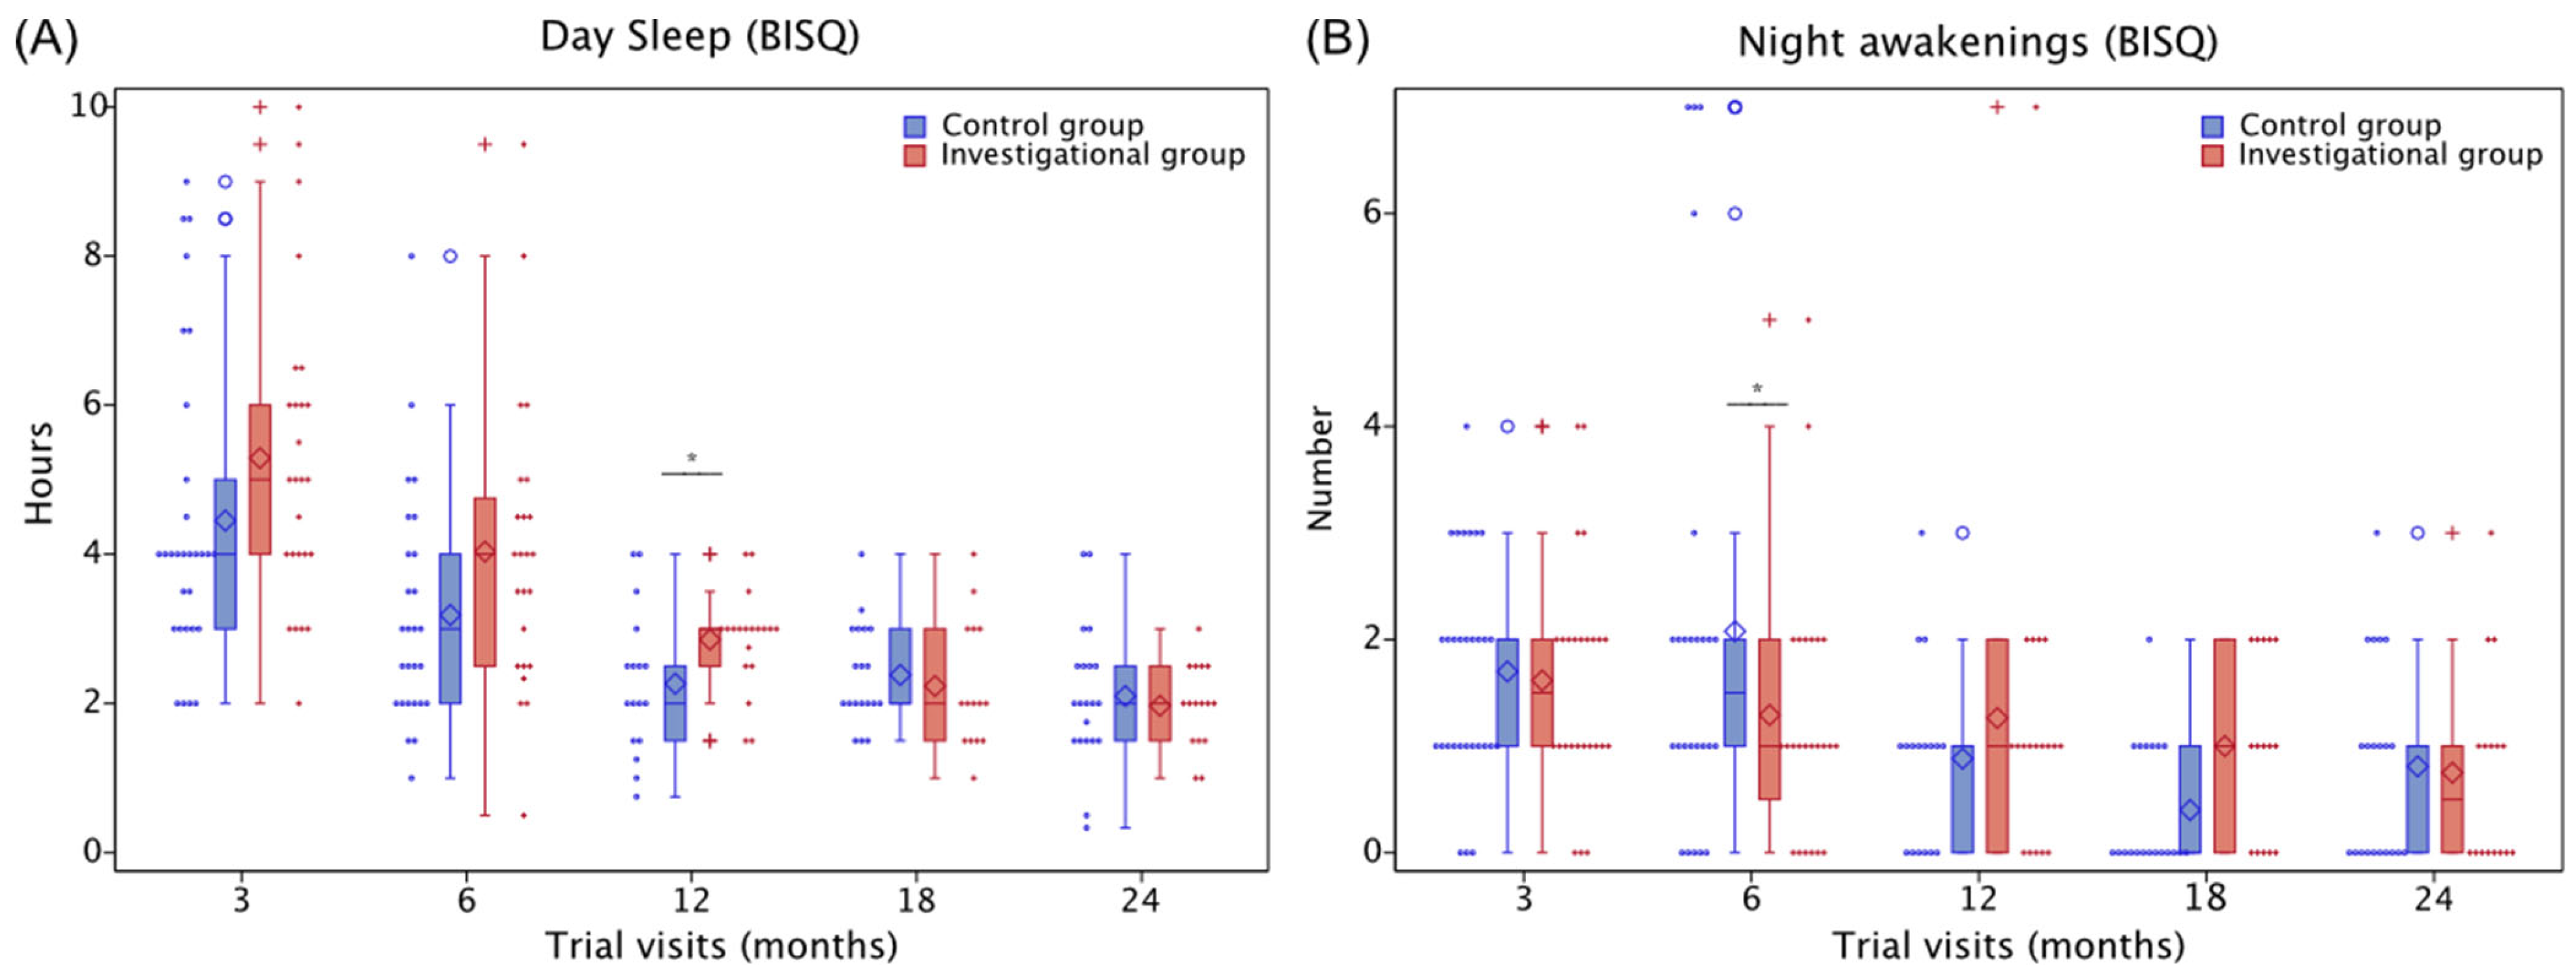
3.5.3. Sleep
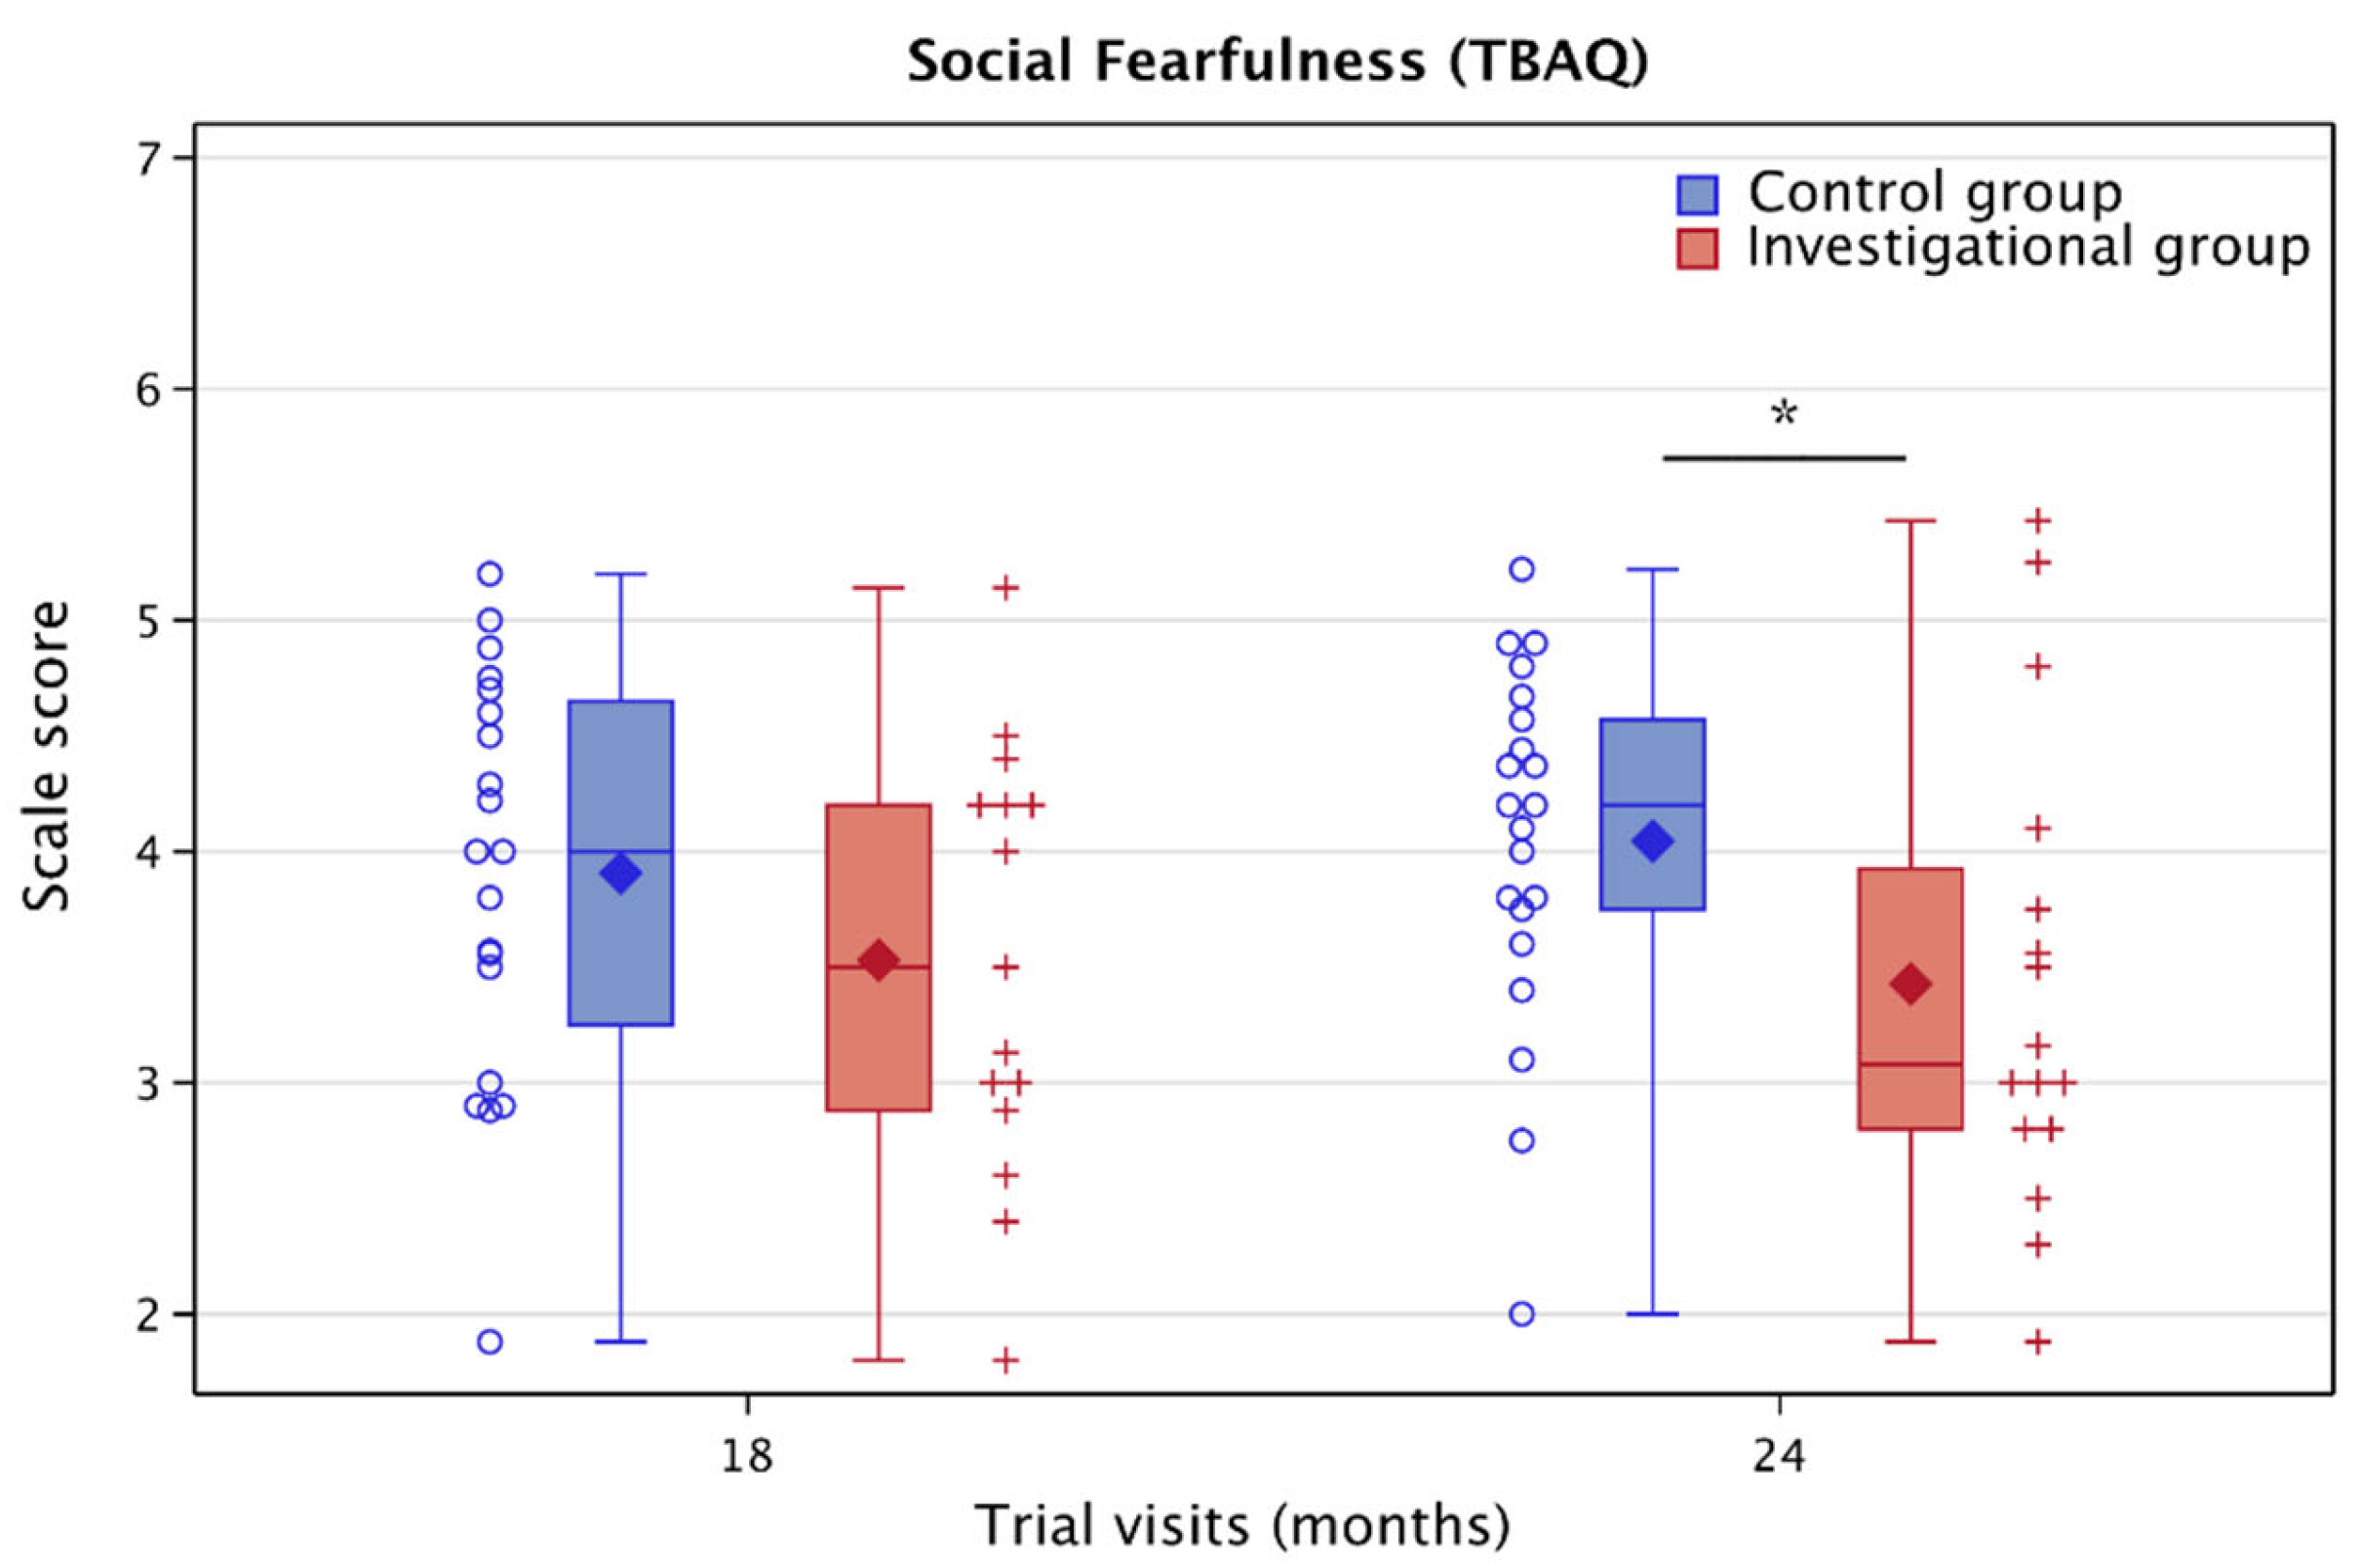
3.5.4. Toddler Behaviors
3.6. Descriptive Results (Exploratory Outcomes)
3.6.1. Physical Growth and Body Composition
3.6.2. Child Activity Level
3.6.3. Maternal Postnatal Depression, Parenting Stress, and Intellectual Ability
3.6.4. Nutrient Intake
4. Discussion
Supplementary Materials
Author Contributions
Funding
Institutional Review Board Statement
Informed Consent Statement
Data Availability Statement
Acknowledgments
Conflicts of Interest
Clinical Trial Registration
References
- Cusick, S.E.; Georgieff, M.K. The Role of Nutrition in Brain Development: The Golden Opportunity of the “First 1000 Days”. J. Pediatr. 2016, 175, 16–21. [Google Scholar] [CrossRef] [PubMed]
- Daelmans, B.; Darmstadt, G.L.; Lombardi, J.; Black, M.M.; Britto, P.R.; Lye, S.; Dua, T.; Bhutta, Z.A.; Richter, L.M. Early childhood development: The foundation of sustainable development. Lancet 2017, 389, 9–11. [Google Scholar] [CrossRef] [PubMed]
- World Health Organization; UNICEF; World Bank Group. Nurturing Care for Early Childhood Development: A Framework for Helping Children Survive and Thrive to Transform Health and Human Potential; World Health Organization: Geneva, Switzerland, 2018. [Google Scholar]
- Pang, W.W.; Tan, P.T.; Cai, S.; Fok, D.; Chua, M.C.; Lim, S.B.; Shek, L.P.; Chan, S.Y.; Tan, K.H.; Yap, F.; et al. Nutrients or nursing? Understanding how breast milk feeding affects child cognition. Eur. J. Nutr. 2020, 59, 609–619. [Google Scholar] [CrossRef] [PubMed]
- Jardí, C.; Hernández-Martínez, C.; Canals, J.; Arija, V.; Bedmar, C.; Voltas, N.; Aranda, N. Influence of breastfeeding and iron status on mental and psychomotor development during the first year of life. Infant Behav. Dev. 2018, 50, 300–310. [Google Scholar] [CrossRef]
- Prado, E.L.; Dewey, K.G. Nutrition and brain development in early life. Nutr. Rev. 2014, 72, 267–284. [Google Scholar] [CrossRef] [PubMed]
- Black, R.E.; Allen, L.H.; Bhutta, Z.A.; Caulfield, L.E.; De Onis, M.; Ezzati, M.; Mathers, C.; Rivera, J.; Maternal and Child Undernutrition Study Group. Maternal and child undernutrition: Global and regional exposures and health consequences. Lancet 2008, 371, 243–260. [Google Scholar] [CrossRef] [PubMed]
- Lozoff, B.; Georgieff, M.K. Iron deficiency and brain development. Semin. Pediatr. Neurol. 2006, 13, 158–165. [Google Scholar] [CrossRef]
- Deoni, S.; Dean III, D.; Joelson, S.; O’Regan, J.; Schneider, N. Early nutrition influences developmental myelination and cognition in infants and young children. NeuroImage 2017, 178, 649–659. [Google Scholar] [CrossRef]
- Schneider, N.; Hauser, J.; Oliveira, M.; Cazaubon, E.; Mottaz, S.C.; O’Neill, B.V.; Steiner, P.; Deoni, S.C.L. Sphingomyelin in Brain and Cognitive Development: Preliminary Data. eNeuro 2019, 6, ENEURO.0421-0418.2019. [Google Scholar] [CrossRef]
- Arija, V.; Jardí, C.; Bedmar, C.; Díaz, A.; Iglesias, L.; Canals, J. Supplementation of Infant Formula and Neurodevelopmental Outcomes: A Systematic Review. Curr. Nutr. Rep. 2022, 11, 283–300. [Google Scholar] [CrossRef]
- Ambrożej, D.; Dumycz, K.; Dziechciarz, P.; Ruszczyński, M. Milk Fat Globule Membrane Supplementation in Children: Systematic Review with Meta-Analysis. Nutrients 2021, 13, 714. [Google Scholar] [CrossRef] [PubMed]
- Hauser, J.; Sultan, S.; Rytz, A.; Steiner, P.; Schneider, N. A blend containing docosahexaenoic acid, arachidonic acid, vitamin B12, vitamin B9, iron and sphingomyelin promotes myelination in an in vitro model. Nutr. Neurosci. 2020, 23, 931–945. [Google Scholar] [CrossRef] [PubMed]
- Schneider, N.; Bruchhage, M.M.K.; O’Neill, B.V.; Hartweg, M.; Tanguy, J.; Steiner, P.; Mutungi, G.; O’Regan, J.; Mcsweeney, S.; D’Sa, V.; et al. A Nutrient Formulation Affects Developmental Myelination in Term Infants: A Randomized Clinical Trial. Front. Nutr. 2022, 9. [Google Scholar] [CrossRef] [PubMed]
- O’Muircheartaigh, J.; Dean, D.C., 3rd; Ginestet, C.E.; Walker, L.; Waskiewicz, N.; Lehman, K.; Dirks, H.; Piryatinsky, I.; Deoni, S.C. White matter development and early cognition in babies and toddlers. Hum. Brain Mapp. 2014, 35, 4475–4487. [Google Scholar] [CrossRef] [PubMed]
- Deoni, S.C.L.; O’Muircheartaigh, J.; Elison, J.T.; Walker, L.; Doernberg, E.; Waskiewicz, N.; Dirks, H.; Piryatinsky, I.; Dean, D.C.; Jumbe, N.L. White matter maturation profiles through early childhood predict general cognitive ability. Brain Struct. Funct. 2016, 221, 1189–1203. [Google Scholar] [CrossRef] [PubMed]
- Dai, X.; Hadjipantelis, P.; Wang, J.L.; Deoni, S.C.L.; Müller, H.G. Longitudinal associations between white matter maturation and cognitive development across early childhood. Hum. Brain Mapp. 2019, 40, 4130–4145. [Google Scholar] [CrossRef] [PubMed]
- Dean, D.C., III; O’muircheartaigh, J.; Dirks, H.; Waskiewicz, N.; Lehman, K.; Walker, L.; Han, M.; Deoni, S.C. Modeling healthy male white matter and myelin development: 3 through 60 months of age. NeuroImage 2014, 84, 742–752. [Google Scholar] [CrossRef]
- Deoni, S.C.; Dean III, D.C.; Piryatinsky, I.; O’muircheartaigh, J.; Waskiewicz, N.; Lehman, K.; Han, M.; Dirks, H. Breastfeeding and early white matter development: A cross-sectional study. NeuroImage 2013, 82, 77–86. [Google Scholar] [CrossRef]
- Bruchhage, M.M.K.; Ngo, G.-C.; Schneider, N.; D’Sa, V.; Deoni, S.C.L. Functional connectivity correlates of infant and early childhood cognitive development. Brain Struct. Funct. 2020, 225, 669–681. [Google Scholar] [CrossRef]
- Bayley, N. Bayley Scales of Infant and Toddler Development, 3rd ed.; Pearson: San Antonio, TX, USA, 2005. [Google Scholar]
- Sadeh, A. A brief screening questionnaire for infant sleep problems: Validation and findings for an Internet sample. Pediatrics 2004, 113, e570–e577. [Google Scholar] [CrossRef]
- Putnam, S.P.; Helbig, A.L.; Gartstein, M.A.; Rothbart, M.K.; Leerkes, E. Development and assessment of short and very short forms of the infant behavior questionnaire-revised. J. Personal. Assess. 2014, 96, 445–458. [Google Scholar] [CrossRef]
- Goldsmith, H.H. Studying temperament via construction of the Toddler Behavior Assessment Questionnaire. Child Dev. 1996, 67, 218–235. [Google Scholar] [CrossRef] [PubMed]
- Mell, T.; Heekeren, H.R.; Marschner, A.; Wartenburger, I.; Villringer, A.; Reischies, F.M. Effect of aging on stimulus-reward association learning. Neuropsychologia 2005, 43, 554–563. [Google Scholar] [CrossRef] [PubMed]
- Reischies, F.M. Pattern of disturbance of different ventral frontal functions in organic depression. Ann. N. Y. Acad. Sci. 1999, 877, 775–780. [Google Scholar] [CrossRef] [PubMed]
- Cox, J.L.; Holden, J.M.; Sagovsky, R. Detection of postnatal depression. Development of the 10-item Edinburgh Postnatal Depression Scale. Br. J. Psychiatry J. Ment. Sci. 1987, 150, 782–786. [Google Scholar] [CrossRef] [PubMed]
- Fields, R.D. Myelination: An Overlooked Mechanism of Synaptic Plasticity? Neuroscientist 2005, 11, 528–531. [Google Scholar] [CrossRef]
- Williamson, J.M.; Lyons, D.A. Myelin Dynamics Throughout Life: An Ever-Changing Landscape? Front. Cell. Neurosci. 2018, 12, 424. [Google Scholar] [CrossRef]
- Fuster, J.M. Frontal lobe and cognitive development. J. Neurocytol. 2002, 31, 373–385. [Google Scholar] [CrossRef]
- Hernandez, M.T.; Sauerwein, H.C.; Jambaqué, I.; De Guise, E.; Lussier, F.; Lortie, A.; Dulac, O.; Lassonde, M. Deficits in executive functions and motor coordination in children with frontal lobe epilepsy. Neuropsychologia 2002, 40, 384–400. [Google Scholar] [CrossRef]
- Best, J.R.; Miller, P.H. A developmental perspective on executive function. Child Dev. 2010, 81, 1641–1660. [Google Scholar] [CrossRef]
- Muircheartaigh, J.; Dean, D.C.; Dirks, H.; Waskiewicz, N.; Lehman, K.; Jerskey, B.A.; Deoni, S.C.L. Interactions between White Matter Asymmetry and Language during Neurodevelopment. J. Neurosci. 2013, 33, 16170. [Google Scholar] [CrossRef] [PubMed]
- Fogassi, L.; Luppino, G. Motor functions of the parietal lobe. Curr. Opin. Neurobiol. 2005, 15, 626–631. [Google Scholar] [CrossRef] [PubMed]
- Turken, A.; Whitfield-Gabrieli, S.; Bammer, R.; Baldo, J.V.; Dronkers, N.F.; Gabrieli, J.D. Cognitive processing speed and the structure of white matter pathways: Convergent evidence from normal variation and lesion studies. NeuroImage 2008, 42, 1032–1044. [Google Scholar] [CrossRef] [PubMed]
- Lu, P.H.; Lee, G.J.; Tishler, T.A.; Meghpara, M.; Thompson, P.M.; Bartzokis, G. Myelin breakdown mediates age-related slowing in cognitive processing speed in healthy elderly men. Brain Cogn. 2013, 81, 131–138. [Google Scholar] [CrossRef]
- Büchel, C.; Raedler, T.; Sommer, M.; Sach, M.; Weiller, C.; Koch, M.A. White matter asymmetry in the human brain: A diffusion tensor MRI study. Cereb. Cortex 2004, 14, 945–951. [Google Scholar] [CrossRef]
- Nagy, Z.; Westerberg, H.; Klingberg, T. Maturation of white matter is associated with the development of cognitive functions during childhood. J. Cogn. Neurosci. 2004, 16, 1227–1233. [Google Scholar] [CrossRef] [PubMed]
- Beaulieu, C.; Plewes, C.; Paulson, L.A.; Roy, D.; Snook, L.; Concha, L.; Phillips, L. Imaging brain connectivity in children with diverse reading ability. NeuroImage 2005, 25, 1266–1271. [Google Scholar] [CrossRef]
- Weinstein, M.; Marom, R.; Berger, I.; Ben Bashat, D.; Gross-Tsur, V.; Ben-Sira, L.; Artzi, M.; Uliel, S.; Leitner, Y.; Geva, R. Neonatal neuropsychology: Emerging relations of neonatal sensory-motor responses to white matter integrity. Neuropsychologia 2014, 62, 209–219. [Google Scholar] [CrossRef]
- Short, S.J.; Elison, J.T.; Goldman, B.D.; Styner, M.; Gu, H.; Connelly, M.; Maltbie, E.; Woolson, S.; Lin, W.; Gerig, G.; et al. Associations between white matter microstructure and infants’ working memory. NeuroImage 2013, 64, 156–166. [Google Scholar] [CrossRef]
- Schmithorst, V.J.; Wilke, M.; Dardzinski, B.J.; Holland, S.K. Cognitive functions correlate with white matter architecture in a normal pediatric population: A diffusion tensor MRI study. Hum. Brain Mapp. 2005, 26, 139–147. [Google Scholar] [CrossRef]
- Reynolds, J.E.; Grohs, M.N.; Dewey, D.; Lebel, C. Global and regional white matter development in early childhood. bioRxiv 2019, 196, 49–58. [Google Scholar] [CrossRef] [PubMed]
- Gilmore, J.H.; Shi, F.; Woolson, S.L.; Knickmeyer, R.C.; Short, S.J.; Lin, W.; Zhu, H.; Hamer, R.M.; Styner, M.; Shen, D. Longitudinal Development of Cortical and Subcortical Gray Matter from Birth to 2 Years. Cereb. Cortex 2011, 22, 2478–2485. [Google Scholar] [CrossRef] [PubMed]
- Tau, G.Z.; Peterson, B.S. Normal development of brain circuits. Neuropsychopharmacology 2010, 35, 147–168. [Google Scholar] [CrossRef] [PubMed]
- Tanaka, K.; Farooqui, A.A.; Siddiqi, N.J.; Alhomida, A.S.; Ong, W.Y. Effects of docosahexaenoic Acid on neurotransmission. Biomol. Ther. 2012, 20, 152–157. [Google Scholar] [CrossRef]
- Zheng, L.; Fleith, M.; Giuffrida, F.; O’Neill, B.V.; Schneider, N. Dietary Polar Lipids and Cognitive Development: A Narrative Review. Adv. Nutr. 2019, 10, 1163–1176. [Google Scholar] [CrossRef]
- Wurtman, R.J. A Nutrient Combination that Can Affect Synapse Formation. Nutrients 2014, 6, 1701–1710. [Google Scholar] [CrossRef]
- Moore, D.M.; D’Mello, A.M.; McGrath, L.M.; Stoodley, C.J. The developmental relationship between specific cognitive domains and grey matter in the cerebellum. Dev. Cogn. Neurosci. 2017, 24, 1–11. [Google Scholar] [CrossRef]
- Takeuchi, H.; Taki, Y.; Nouchi, R.; Yokoyama, R.; Kotozaki, Y.; Nakagawa, S.; Sekiguchi, A.; Iizuka, K.; Yamamoto, Y.; Hanawa, S.; et al. Global associations between regional gray matter volume and diverse complex cognitive functions: Evidence from a large sample study. Sci. Rep. 2017, 7, 10014. [Google Scholar] [CrossRef]
- de Chastelaine, M.; Srokova, S.; Hou, M.; Kidwai, A.; Kafafi, S.S.; Racenstein, M.L.; Rugg, M.D. Cortical thickness, gray matter volume, and cognitive performance: A crosssectional study of the moderating effects of age on their interrelationships. Cereb. Cortex 2023, 33, 6474–6485. [Google Scholar] [CrossRef]
- Lukowski, A.F.; Milojevich, H.M. Sleeping like a baby: Examining relations between habitual infant sleep, recall memory, and generalization across cues at 10 months. Infant Behav. Dev. 2013, 36, 369–376. [Google Scholar] [CrossRef]
- de Rosnay, M.; Cooper, P.J.; Tsigaras, N.; Murray, L. Transmission of social anxiety from mother to infant: An experimental study using a social referencing paradigm. Behav. Res. Ther. 2006, 44, 1165–1175. [Google Scholar] [CrossRef]
- Van Hulle, C.A.; Moore, M.N.; Lemery-Chalfant, K.; Goldsmith, H.H.; Brooker, R.J. Infant stranger fear trajectories predict anxious behaviors and diurnal cortisol rhythm during childhood. Dev. Psychopathol. 2017, 29, 1119–1130. [Google Scholar] [CrossRef]
- Hadders-Algra, M. Early human motor development: From variation to the ability to vary and adapt. Neurosci. Biobehav. Rev. 2018, 90, 411–427. [Google Scholar] [CrossRef] [PubMed]
- Adolph, K.E.; Franchak, J.M. The development of motor behavior. Cogn. Sci. 2017, 8, e1430. [Google Scholar] [CrossRef]
- Scharf, R.J.; Scharf, G.J.; Stroustrup, A. Developmental Milestones. Pediatr. Rev. 2016, 37, 25–37, quiz 38, 47. [Google Scholar] [CrossRef] [PubMed]
- Xiao, L.; Ohayon, D.; McKenzie, I.A.; Sinclair-Wilson, A.; Wright, J.L.; Fudge, A.D.; Emery, B.; Li, H.; Richardson, W.D. Rapid production of new oligodendrocytes is required in the earliest stages of motor-skill learning. Nat. Neurosci. 2016, 19, 1210–1217. [Google Scholar] [CrossRef] [PubMed]
- Sampaio-Baptista, C.; Khrapitchev, A.A.; Foxley, S.; Schlagheck, T.; Scholz, J.; Jbabdi, S.; DeLuca, G.C.; Miller, K.L.; Taylor, A.; Thomas, N.; et al. Motor skill learning induces changes in white matter microstructure and myelination. J. Neurosci. 2013, 33, 19499–19503. [Google Scholar] [CrossRef] [PubMed]
- McKenzie, I.A.; Ohayon, D.; Li, H.; de Faria, J.P.; Emery, B.; Tohyama, K.; Richardson, W.D. Motor skill learning requires active central myelination. Science 2014, 346, 318–322. [Google Scholar] [CrossRef]


| Intervention Group | Reference Group | ||
|---|---|---|---|
| Characteristics | Investigational (N = 39) | Control (N = 42) | Breastfed (N = 108) |
| Children | |||
| Age at enrollment (days), mean (SD) | 31.6 (7.84) Navailable = 39 | 31.3 (6.06) Navailable = 42 | 28.7 (7.64) Navailable = 108 |
| Gestational age (weeks), mean (SD) | 38.8 (1.24) Navailable = 39 | 39.1 (1.16) Navailable = 42 | 39.3 (1.11) Navailable = 108 |
| Female sex, number (%) | 18 (46.2%) Navailable = 39 | 18 (42.9%) Navailable = 42 | 61 (56.5%) Navailable = 108 |
| Weight at birth (kg), mean (SD) | 3.27 (0.45) Navailable = 39 | 3.27 (0.42) Navailable = 42 | 3.43 (0.46) Navailable = 108 |
| Height at birth (cm), mean (SD) | 49.89 (2.61) Navailable = 37 | 50.19 (2.31) Navailable = 39 | 50.37 (2.19) Navailable = 104 |
| Body fat (%), mean (SD) | 17.87 (5.18) Navailable = 39 | 17.32 (4.74) Navailable = 40 | 17.46 (4.49) Navailable = 107 |
| Number of siblings in same household 0 1–2 >3 | 14 (35.9%) 22 (56.4%) 3 (7.7%) Navailable = 39 | 16 (38.1%) 22 (52.4%) 4 (9.5%) Navailable = 42 | 39 (36.1%) 59 (54.6%) 10 (9.3%) Navailable = 108 |
| Primary Caregivers | |||
| Ethnicity of mother | African American 5 (12.8%) Asian 1 (2.6%) Caucasian 22 (56.4%) Mixed race 2 (5.1%) Other 9 (23.1%) | African American 6 (14.3%) Caucasian 21 (50.0%) Mixed 5 (11.9%) Native American, Alaskan Native 2 (4.8%) Other 6 (14.3%) | African American 8 (7.4%) Asian 3 (2.8%) Caucasian 76 (70.4%) Mixed race 8 (7.4%) Native American, Alaskan Native 1 (0.9%) Other 12 (11.1%) |
| Navailable = 39 | Navailable = 40 | Navailable = 108 | |
| Age (years), mean (SD) | |||
| Mother | 28.7 (5.58) Navailable = 39 | 28.2 (4.95) Navailable = 40 | 31.6 (4.84) Navailable = 108 |
| Father | 31.6 (6.95) Navailable = 33 | 29.9 (7.31) Navailable = 28 | 33.5 (5.52) Navailable = 99 |
| Maternal postnatal depression score at enrollment (screening visit), mean (SD) | 4.2 (3.74) Navailable = 25 | 6.0 (4.47) Navailable = 26 | 4.4 (4.09) Navailable = 76 |
| Maternal IQ, mean (SD) | 96.4 (10.07) Navailable = 39 | 97.0 (12.47) Navailable = 41 | 104.1 (13.69) Navailable = 108 |
| Region of Interest | Visit | LSMeans Difference Estimate | 95% Confidence Interval | p-Value | Percentage (%) Increase from Control Level |
|---|---|---|---|---|---|
| Myelin Water Fraction | |||||
| Whole brain | 3 months | 0.001 | (−0.0032; 0.0057) | 0.586 | 3.9 |
| 6 months | 0.007 | (0.0012; 0.0126) | 0.018 * | 22.8 | |
| 12 months | 0.012 | (0.0045; 0.0189) | 0.002 * | 22.5 | |
| 18 months | 0.012 | (0.0052; 0.018) | <0.001 * | 18.1 | |
| 24 months | 0.018 | (0.0086; 0.0264) | <0.001 * | 26.3 | |
| Cerebellum | 3 months | 0.006 | (−0.001; 0.0121) | 0.098 | 15.8 |
| 6 months | 0.01 | (0.0019; 0.0187) | 0.017 * | 18.1 | |
| 12 months | 0.018 | (0.0072; 0.0286) | 0.001 * | 23.8 | |
| 18 months | 0.011 | (0.0012; 0.02) | 0.028 * | 11.9 | |
| 24 months | 0.014 | (0.001; 0.0274) | 0.035 * | 14.3 | |
| Corpus callosum body | 3 months | 0.001 | (−0.0063; 0.0093) | 0.706 | 956.5 |
| 6 months | 0.01 | (0.0002; 0.0201) | 0.045 * | 49.0 | |
| 12 months | 0.009 | (−0.0038; 0.0215) | 0.168 | 10.8 | |
| 18 months | −0.001 | (−0.0121; 0.0103) | 0.875 | −0.9 | |
| 24 months | −0.003 | (−0.019; 0.0122) | 0.669 | −2.4 | |
| Corpus callosum genu | 3 months | 0 | (−0.01; 0.0109) | 0.931 | 0 |
| 6 months | 0.011 | (−0.002; 0.0245) | 0.096 | 68.2 | |
| 12 months | 0.006 | (−0.0107; 0.0231) | 0.464 | 6.1 | |
| 18 months | −0.002 | (−0.0168; 0.013) | 0.803 | −1.5 | |
| 24 months | 0.009 | (−0.0118; 0.0299) | 0.390 | 6.4 | |
| Corpus callosum splenium | 3 months | 0.001 | (−0.0087; 0.0117) | 0.772 | 52.5 |
| 6 months | 0.01 | (−0.0028; 0.0232) | 0.123 | 24.1 | |
| 12 months | 0.008 | (−0.008; 0.025) | 0.308 | 6.8 | |
| 18 months | 0.002 | (−0.0121; 0.0171) | 0.734 | 1.4 | |
| 24 months | 0.002 | (−0.0183; 0.0224) | 0.841 | 1.3 | |
| Frontal white matter | 3 months | 0.001 | (−0.005; 0.0066) | 0.786 | 5.0 |
| 6 months | 0.007 | (−0.0008; 0.0141) | 0.078 | 29.0 | |
| 12 months | 0.01 | (0.0004; 0.0194) | 0.041 * | 19.2 | |
| 18 months | 0.012 | (0.0033; 0.0201) | 0.007 * | 17.6 | |
| 24 months | 0.022 | (0.01; 0.0333) | <0.001 * | 31.8 | |
| Occipital white matter | 3 months | 0.004 | (−0.0022; 0.011) | 0.187 | 22.4 |
| 6 months | 0.011 | (0.003; 0.0198) | 0.009 * | 32.6 | |
| 12 months | 0.015 | (0.0041; 0.0255) | 0.007 * | 24.1 | |
| 18 months | 0.015 | (0.0055; 0.0244) | 0.002 * | 19.7 | |
| 24 months | 0.011 | (−0.0022; 0.0241) | 0.102 | 12.6 | |
| Parietal white matter | 3 months | 0.002 | (−0.0033; 0.0072) | 0.452 | 10.6 |
| 6 months | 0.008 | (0.0016; 0.0151) | 0.015 * | 30.1 | |
| 12 months | 0.015 | (0.0065; 0.0235) | <0.001 * | 27.0 | |
| 18 months | 0.012 | (0.004; 0.0191) | 0.003 * | 16.4 | |
| 24 months | 0.018 | (0.0077; 0.0287) | <0.001 * | 23.3 | |
| Temporal white matter | 3 months | 0.002 | (−0.0034; 0.008) | 0.429 | 10.8 |
| 6 months | 0.007 | (0.0002; 0.0147) | 0.045 * | 29.3 | |
| 12 months | 0.017 | (0.0079; 0.0264) | <0.001 * | 34.5 | |
| 18 months | 0.013 | (0.0044; 0.0207) | 0.003 * | 19.1 | |
| 24 months | 0.021 | (0.0097; 0.0324) | <0.001 * | 30.0 | |
| Gray Matter Volume | |||||
| Whole brain | 3 months | 5521.958 | (−18,011.073; 29,054.9883) | 0.642 | 1.9 |
| 6 months | 10,637.822 | (−17,900.7774; 39,176.422) | 0.461 | 2.9 | |
| 12 months | 23,221.587 | (−9471.0578; 55,914.231) | 0.162 | 5.2 | |
| 18 months | 19,424.425 | (−16,330.1755; 55,179.0258) | 0.283 | 4.0 | |
| 24 months | 67,147.449 | (9087.0565; 125,207.8421) | 0.024 * | 13.1 | |
Disclaimer/Publisher’s Note: The statements, opinions and data contained in all publications are solely those of the individual author(s) and contributor(s) and not of MDPI and/or the editor(s). MDPI and/or the editor(s) disclaim responsibility for any injury to people or property resulting from any ideas, methods, instructions or products referred to in the content. |
© 2023 by the authors. Licensee MDPI, Basel, Switzerland. This article is an open access article distributed under the terms and conditions of the Creative Commons Attribution (CC BY) license (https://creativecommons.org/licenses/by/4.0/).
Share and Cite
Schneider, N.; Hartweg, M.; O’Regan, J.; Beauchemin, J.; Redman, L.; Hsia, D.S.; Steiner, P.; Carmichael, O.; D’Sa, V.; Deoni, S. Impact of a Nutrient Formulation on Longitudinal Myelination, Cognition, and Behavior from Birth to 2 Years: A Randomized Clinical Trial. Nutrients 2023, 15, 4439. https://doi.org/10.3390/nu15204439
Schneider N, Hartweg M, O’Regan J, Beauchemin J, Redman L, Hsia DS, Steiner P, Carmichael O, D’Sa V, Deoni S. Impact of a Nutrient Formulation on Longitudinal Myelination, Cognition, and Behavior from Birth to 2 Years: A Randomized Clinical Trial. Nutrients. 2023; 15(20):4439. https://doi.org/10.3390/nu15204439
Chicago/Turabian StyleSchneider, Nora, Mickaël Hartweg, Jonathan O’Regan, Jennifer Beauchemin, Leanne Redman, Daniel S. Hsia, Pascal Steiner, Owen Carmichael, Viren D’Sa, and Sean Deoni. 2023. "Impact of a Nutrient Formulation on Longitudinal Myelination, Cognition, and Behavior from Birth to 2 Years: A Randomized Clinical Trial" Nutrients 15, no. 20: 4439. https://doi.org/10.3390/nu15204439