
The Effect of High-Intensity Interval Exercise on Short-Term Glycaemic Control, Serum Level of Key Mediator in Hypoxia and Pro-Inflammatory Cytokines in Patients with Type 1 Diabetes—An Exploratory Case Study


Abstract
:1. Introduction
2. Materials and Methods
2.1. Participants
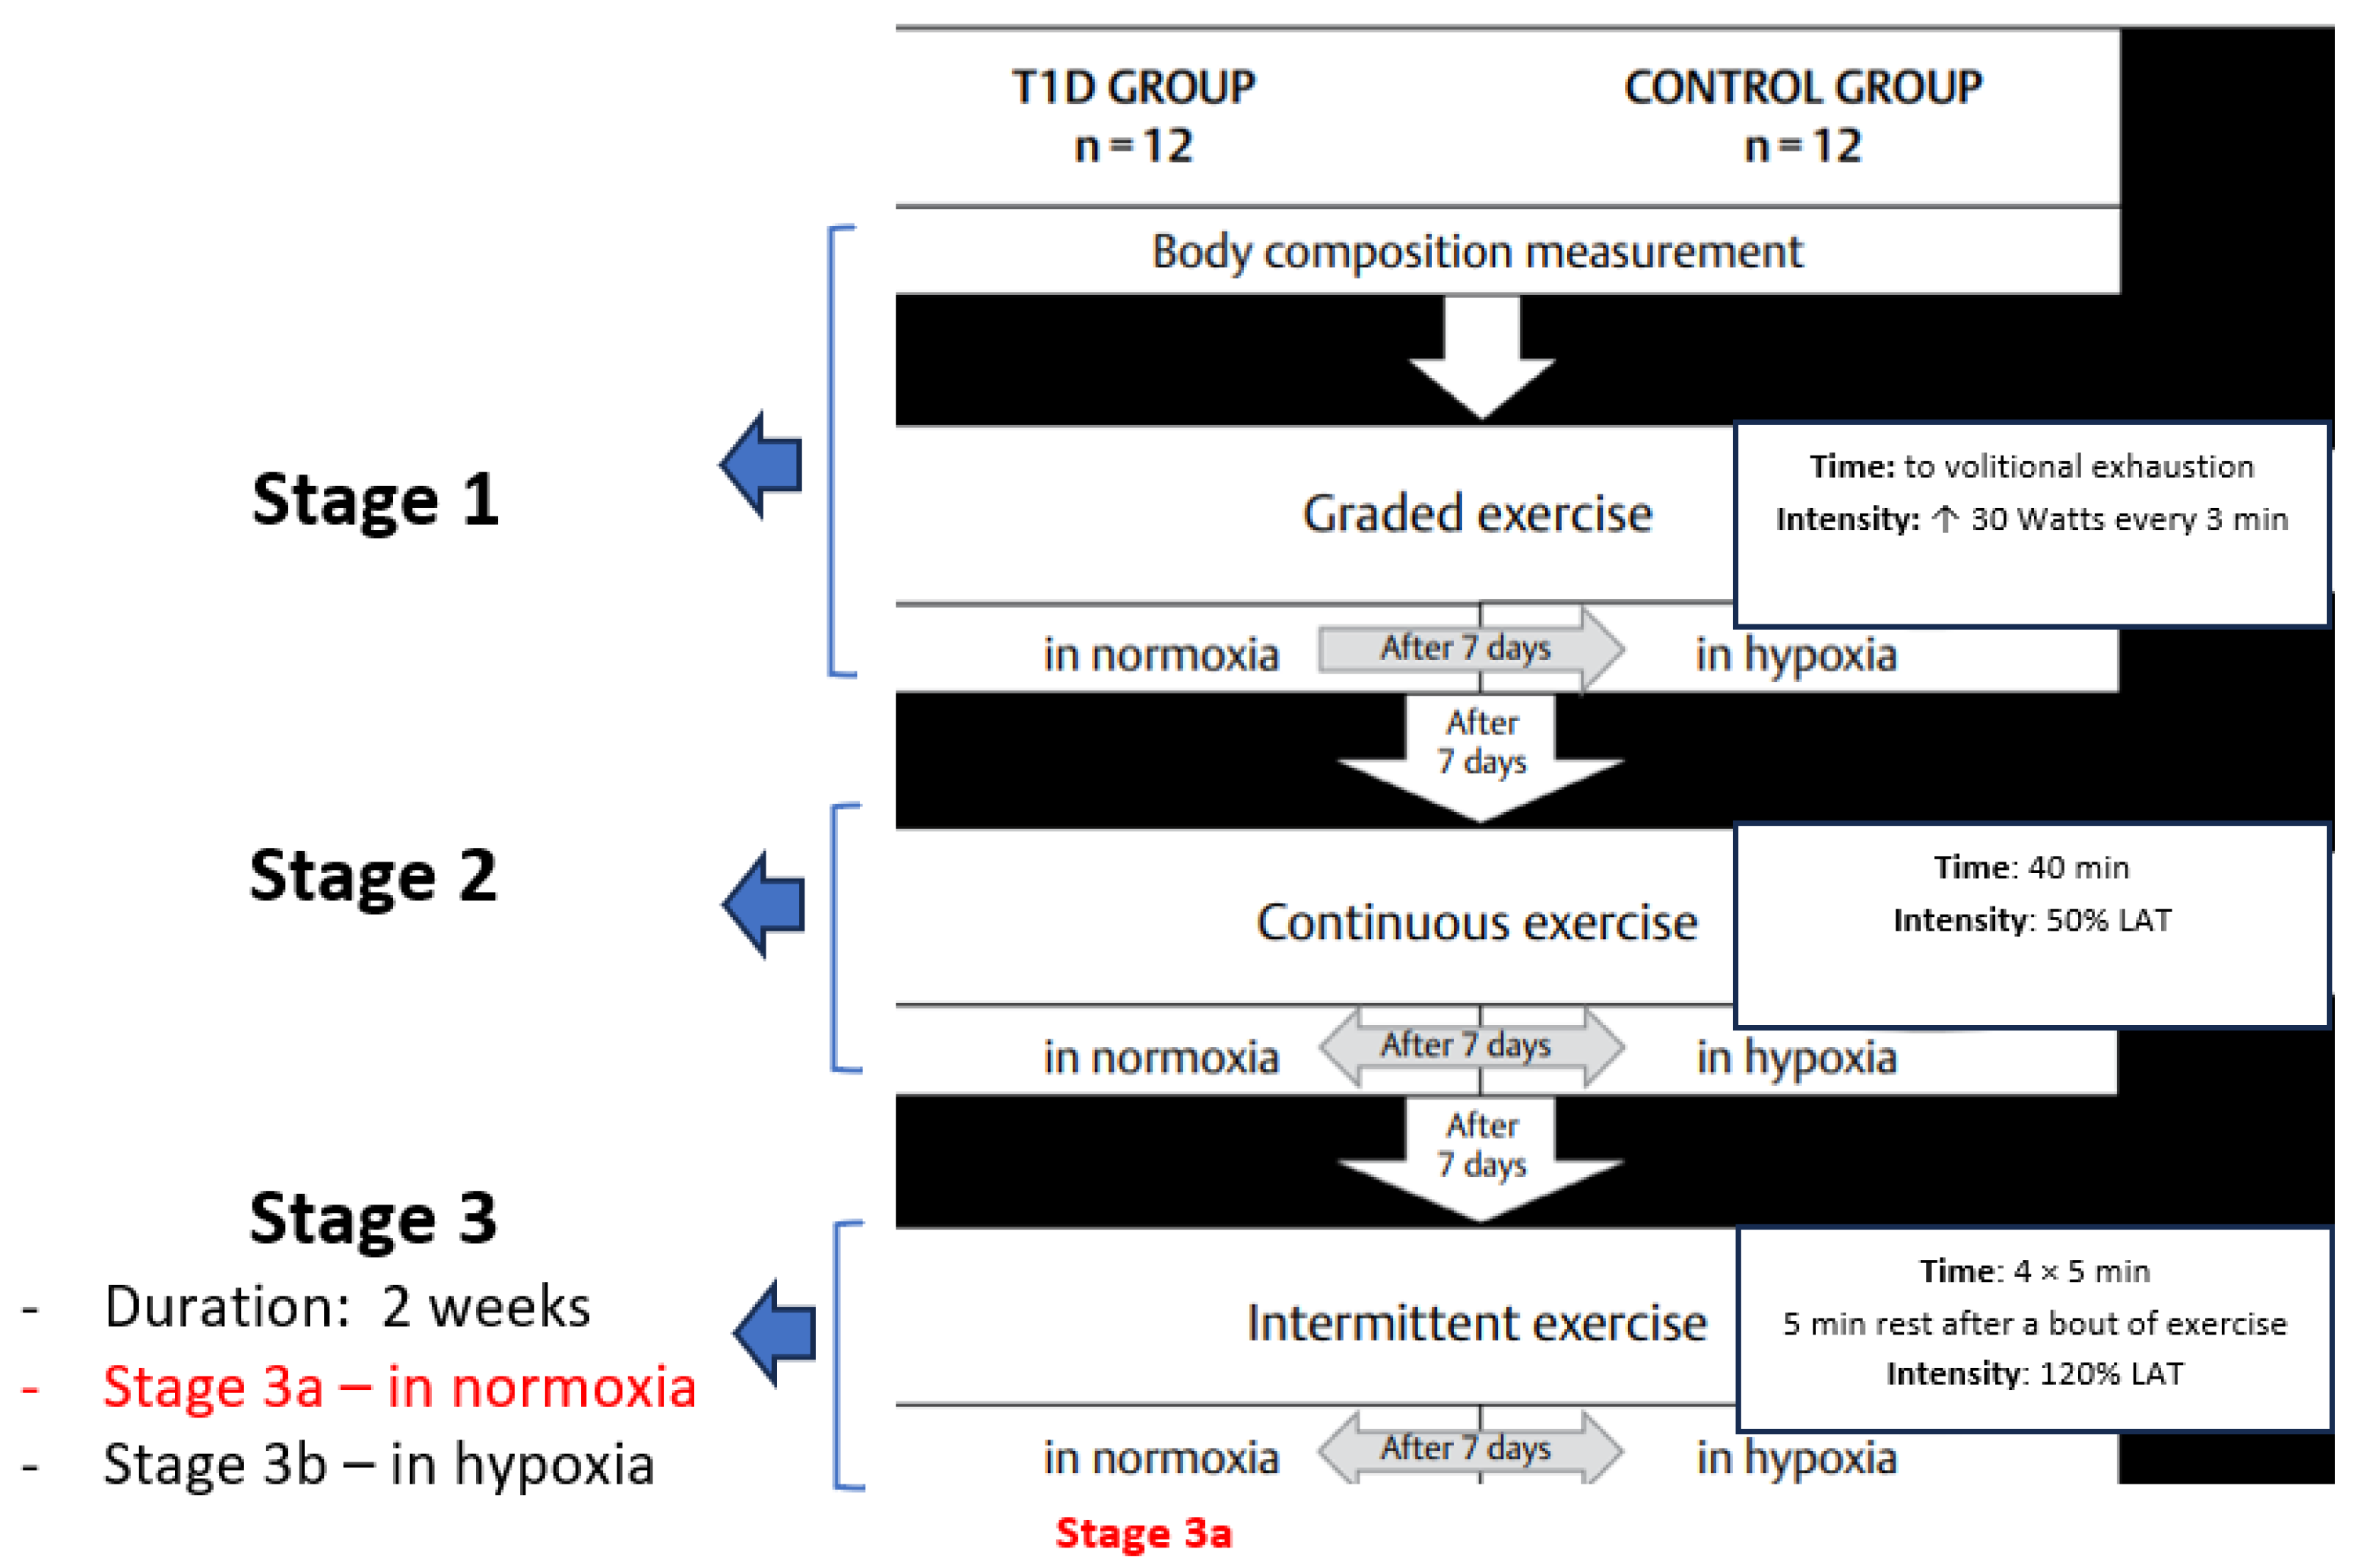
2.2. Study Protocol
2.3. Biochemical Analyses
- V1 represents the pre-HIIE value;
- V2 represents the post-HIIE value.
2.4. Statistical Methods
2.5. Ethics
3. Results
3.1. Participants’ Somatic and Physiological Characteristics
3.2. Macronutrients Intake
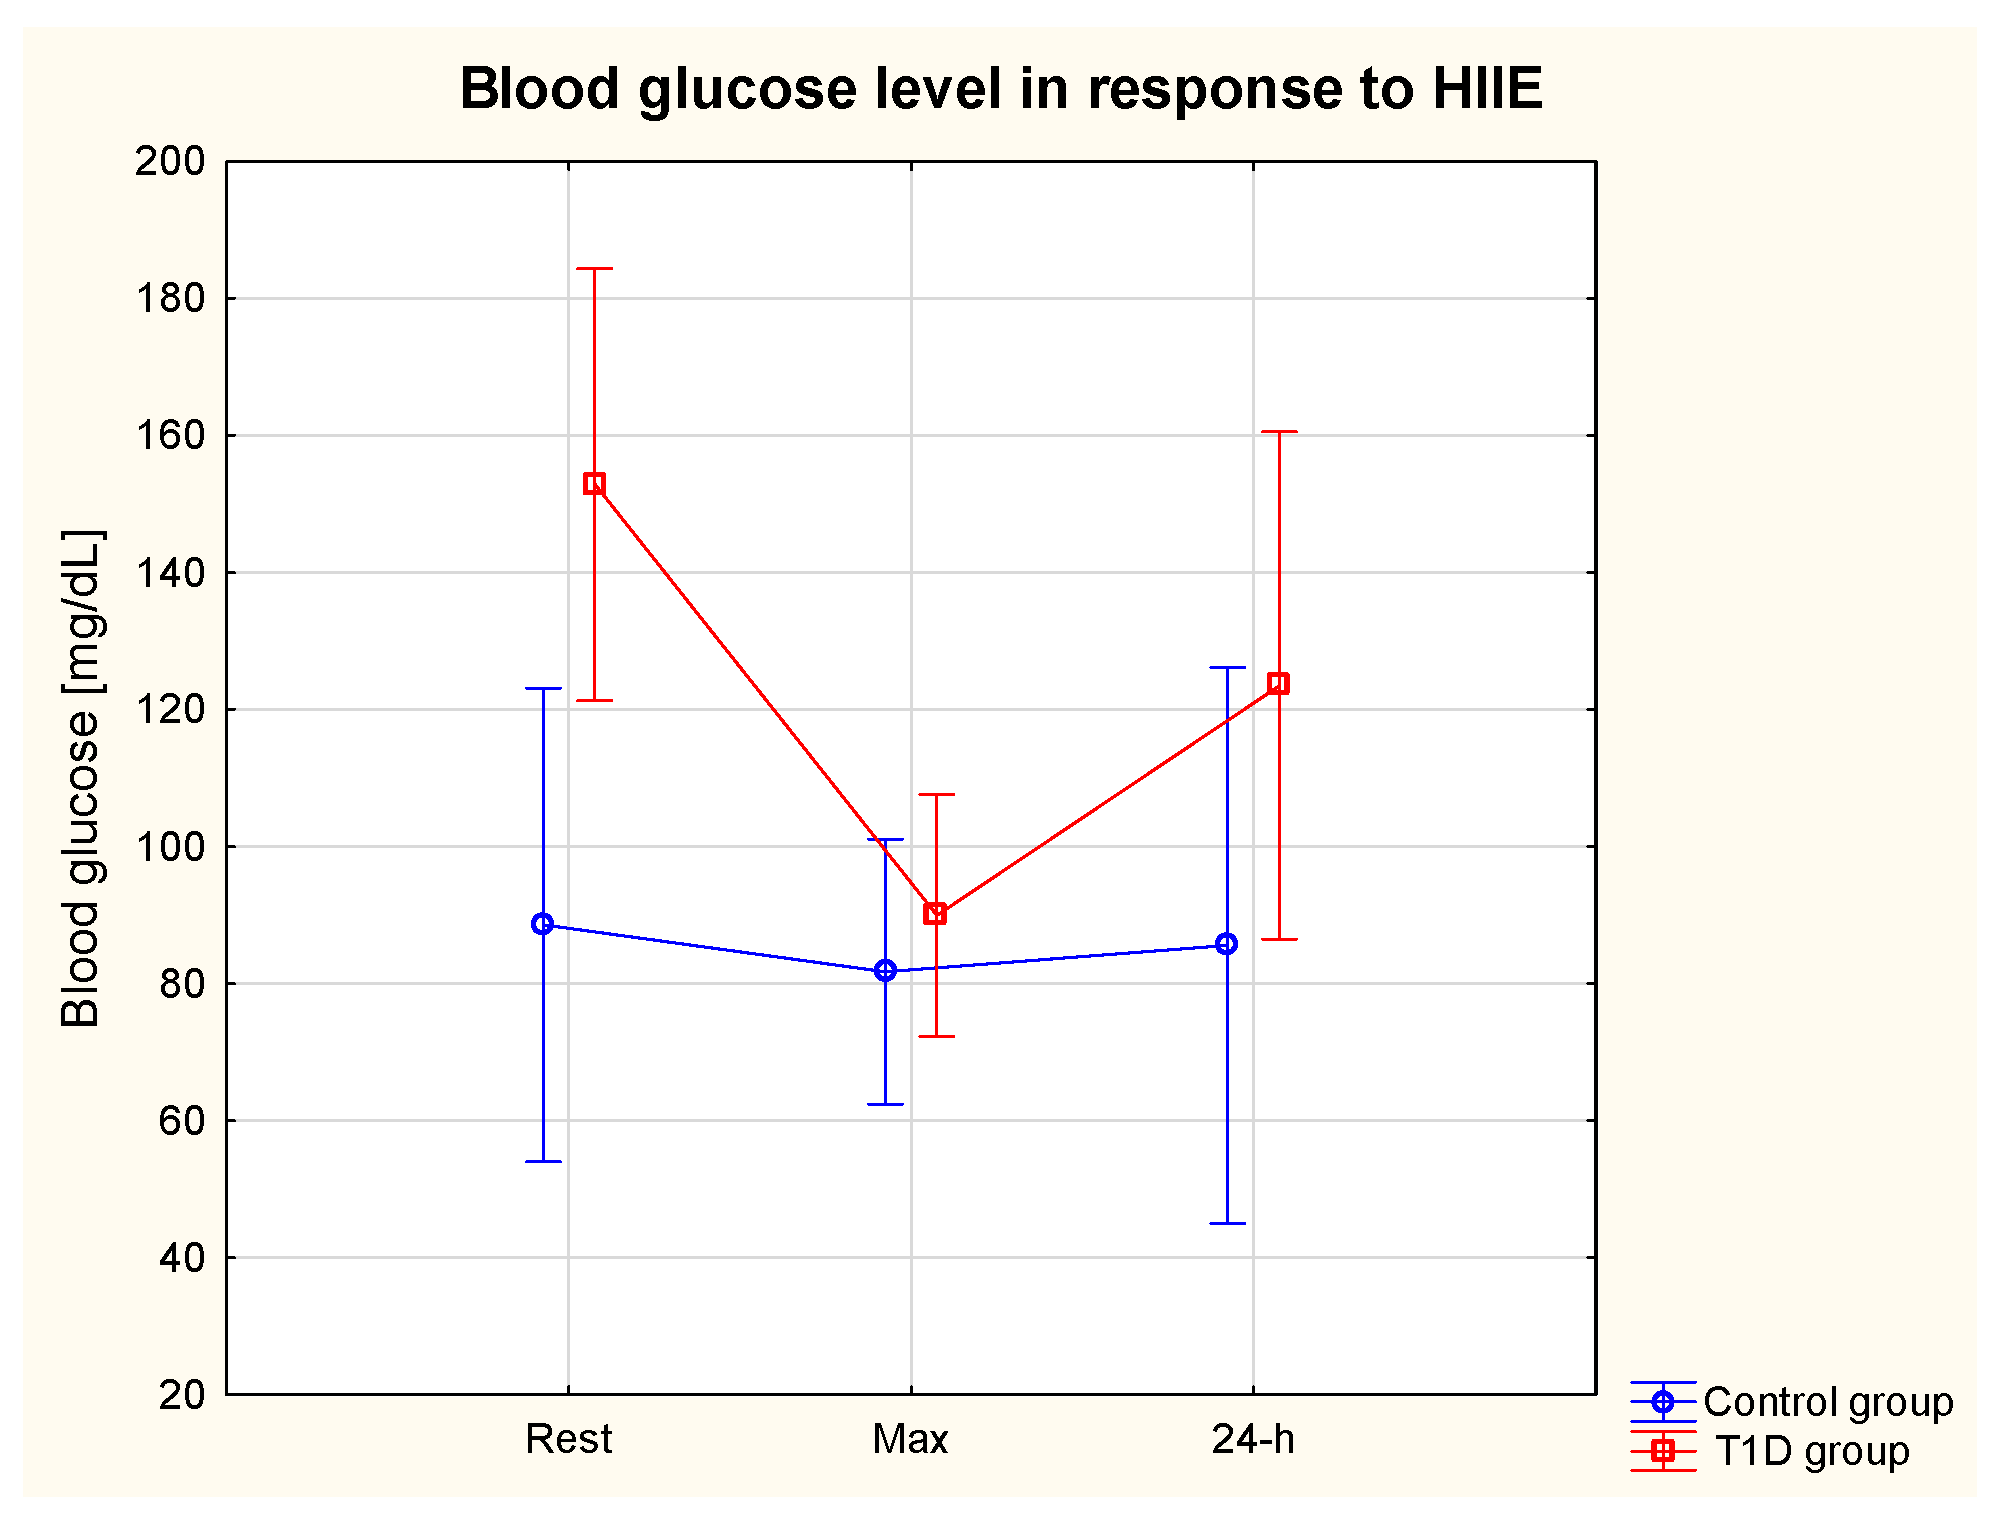
3.3. Glycaemia in Response to HIIE
3.4. Glycaemic Control in 24 h Post-Exercise Period
3.5. HIF-1α, TNF-α and VEGF in Response to HIIE
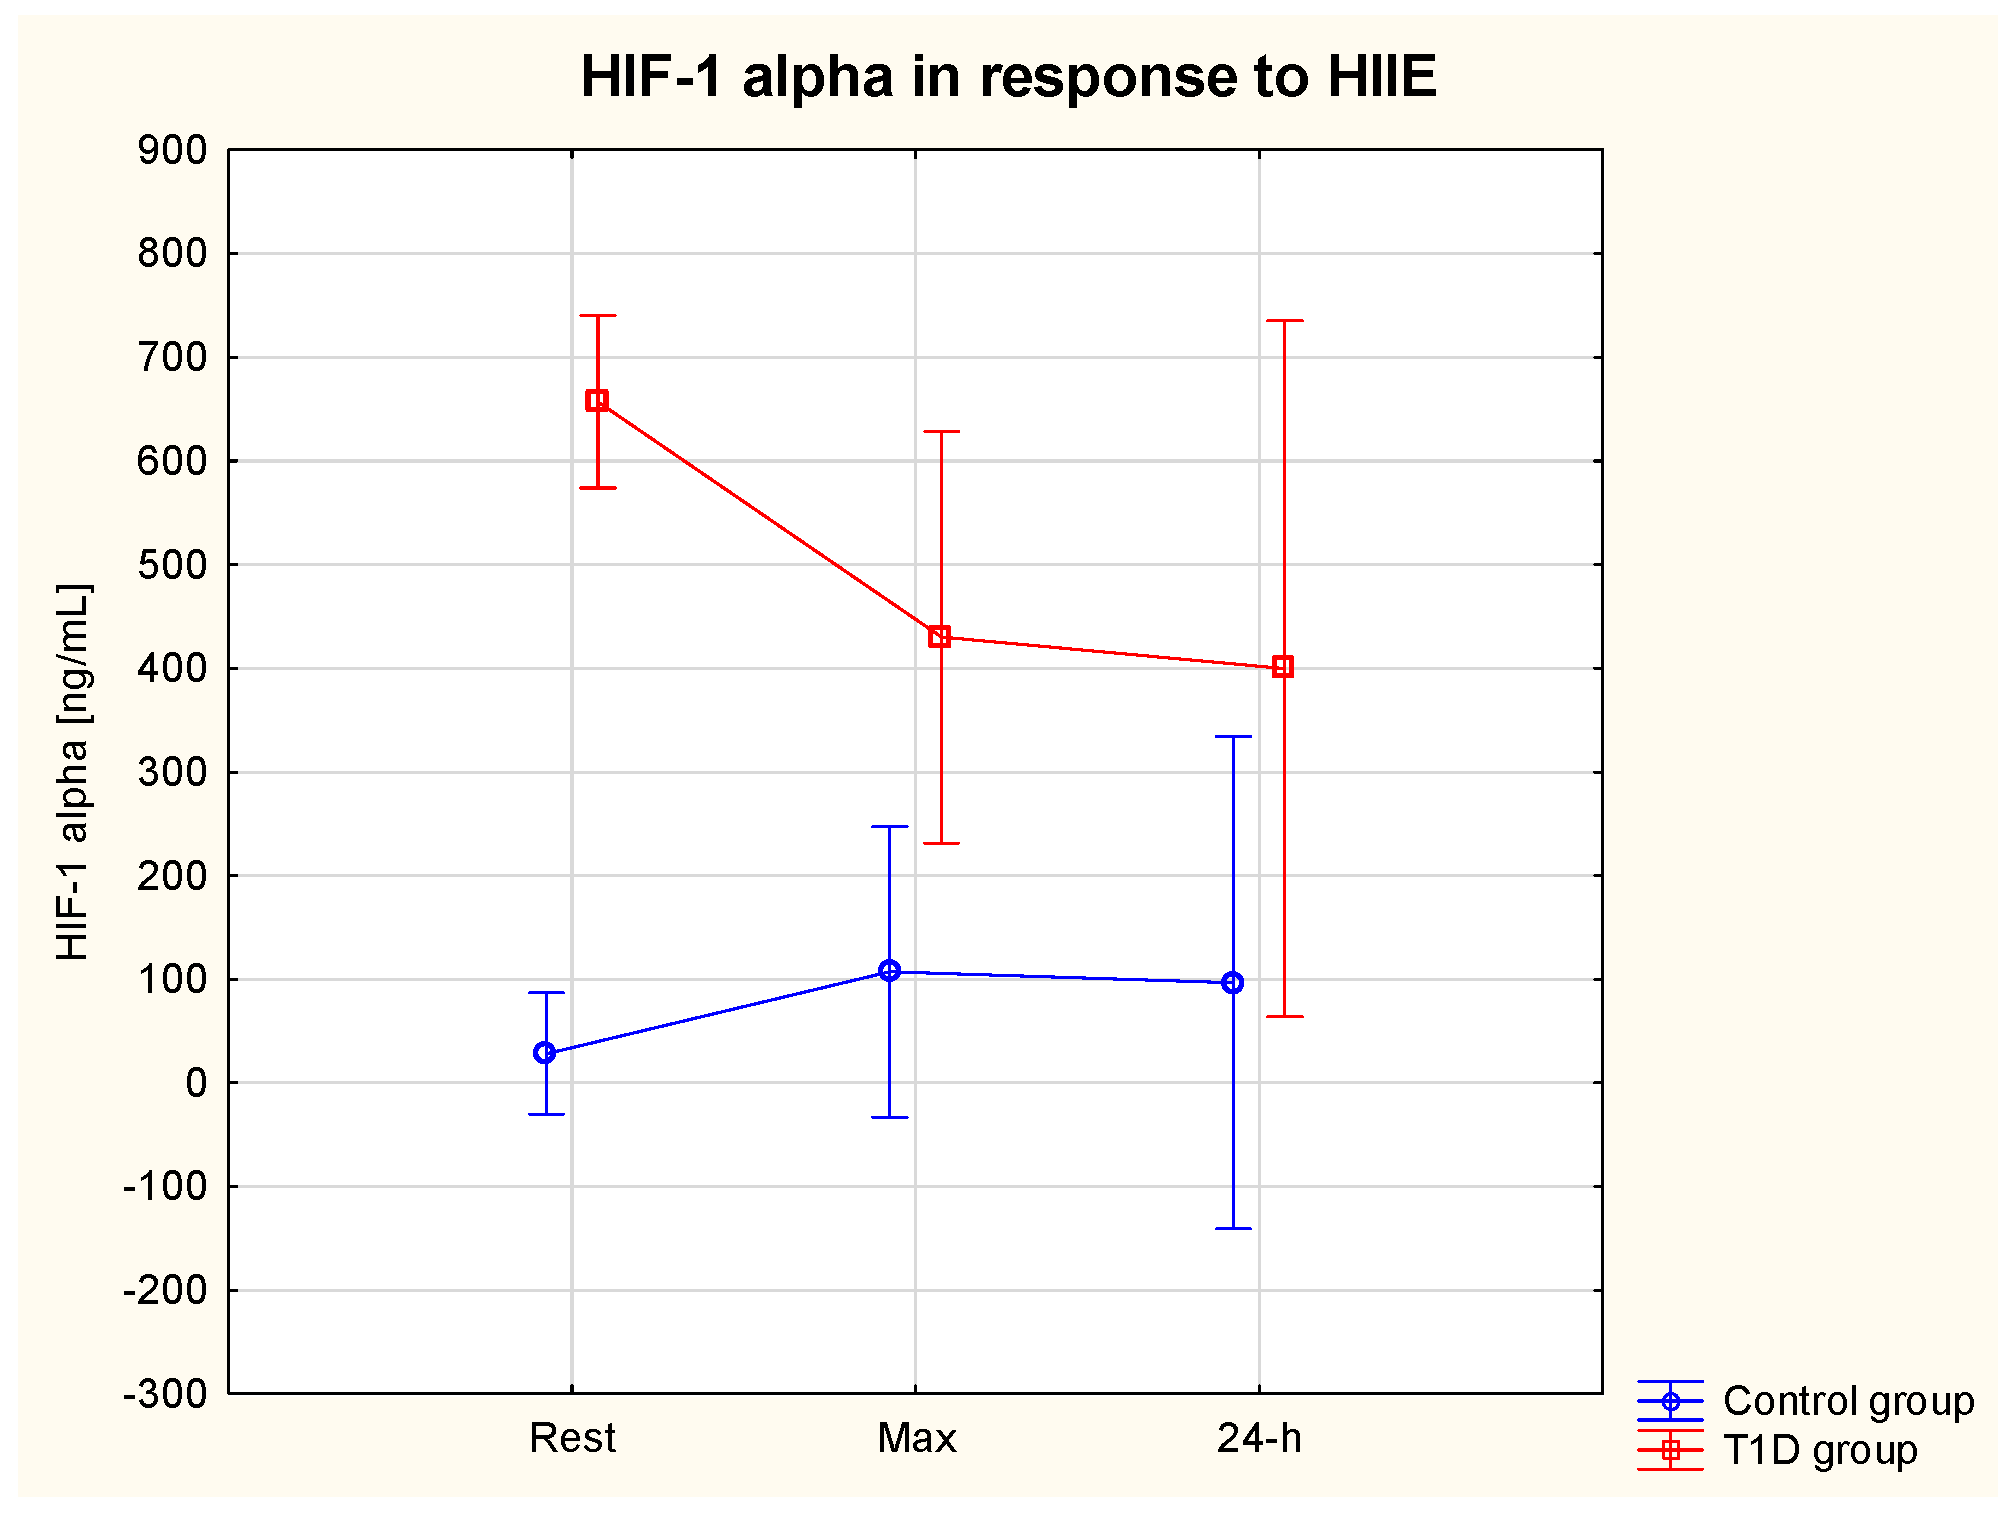
3.5.1. HIF-1α
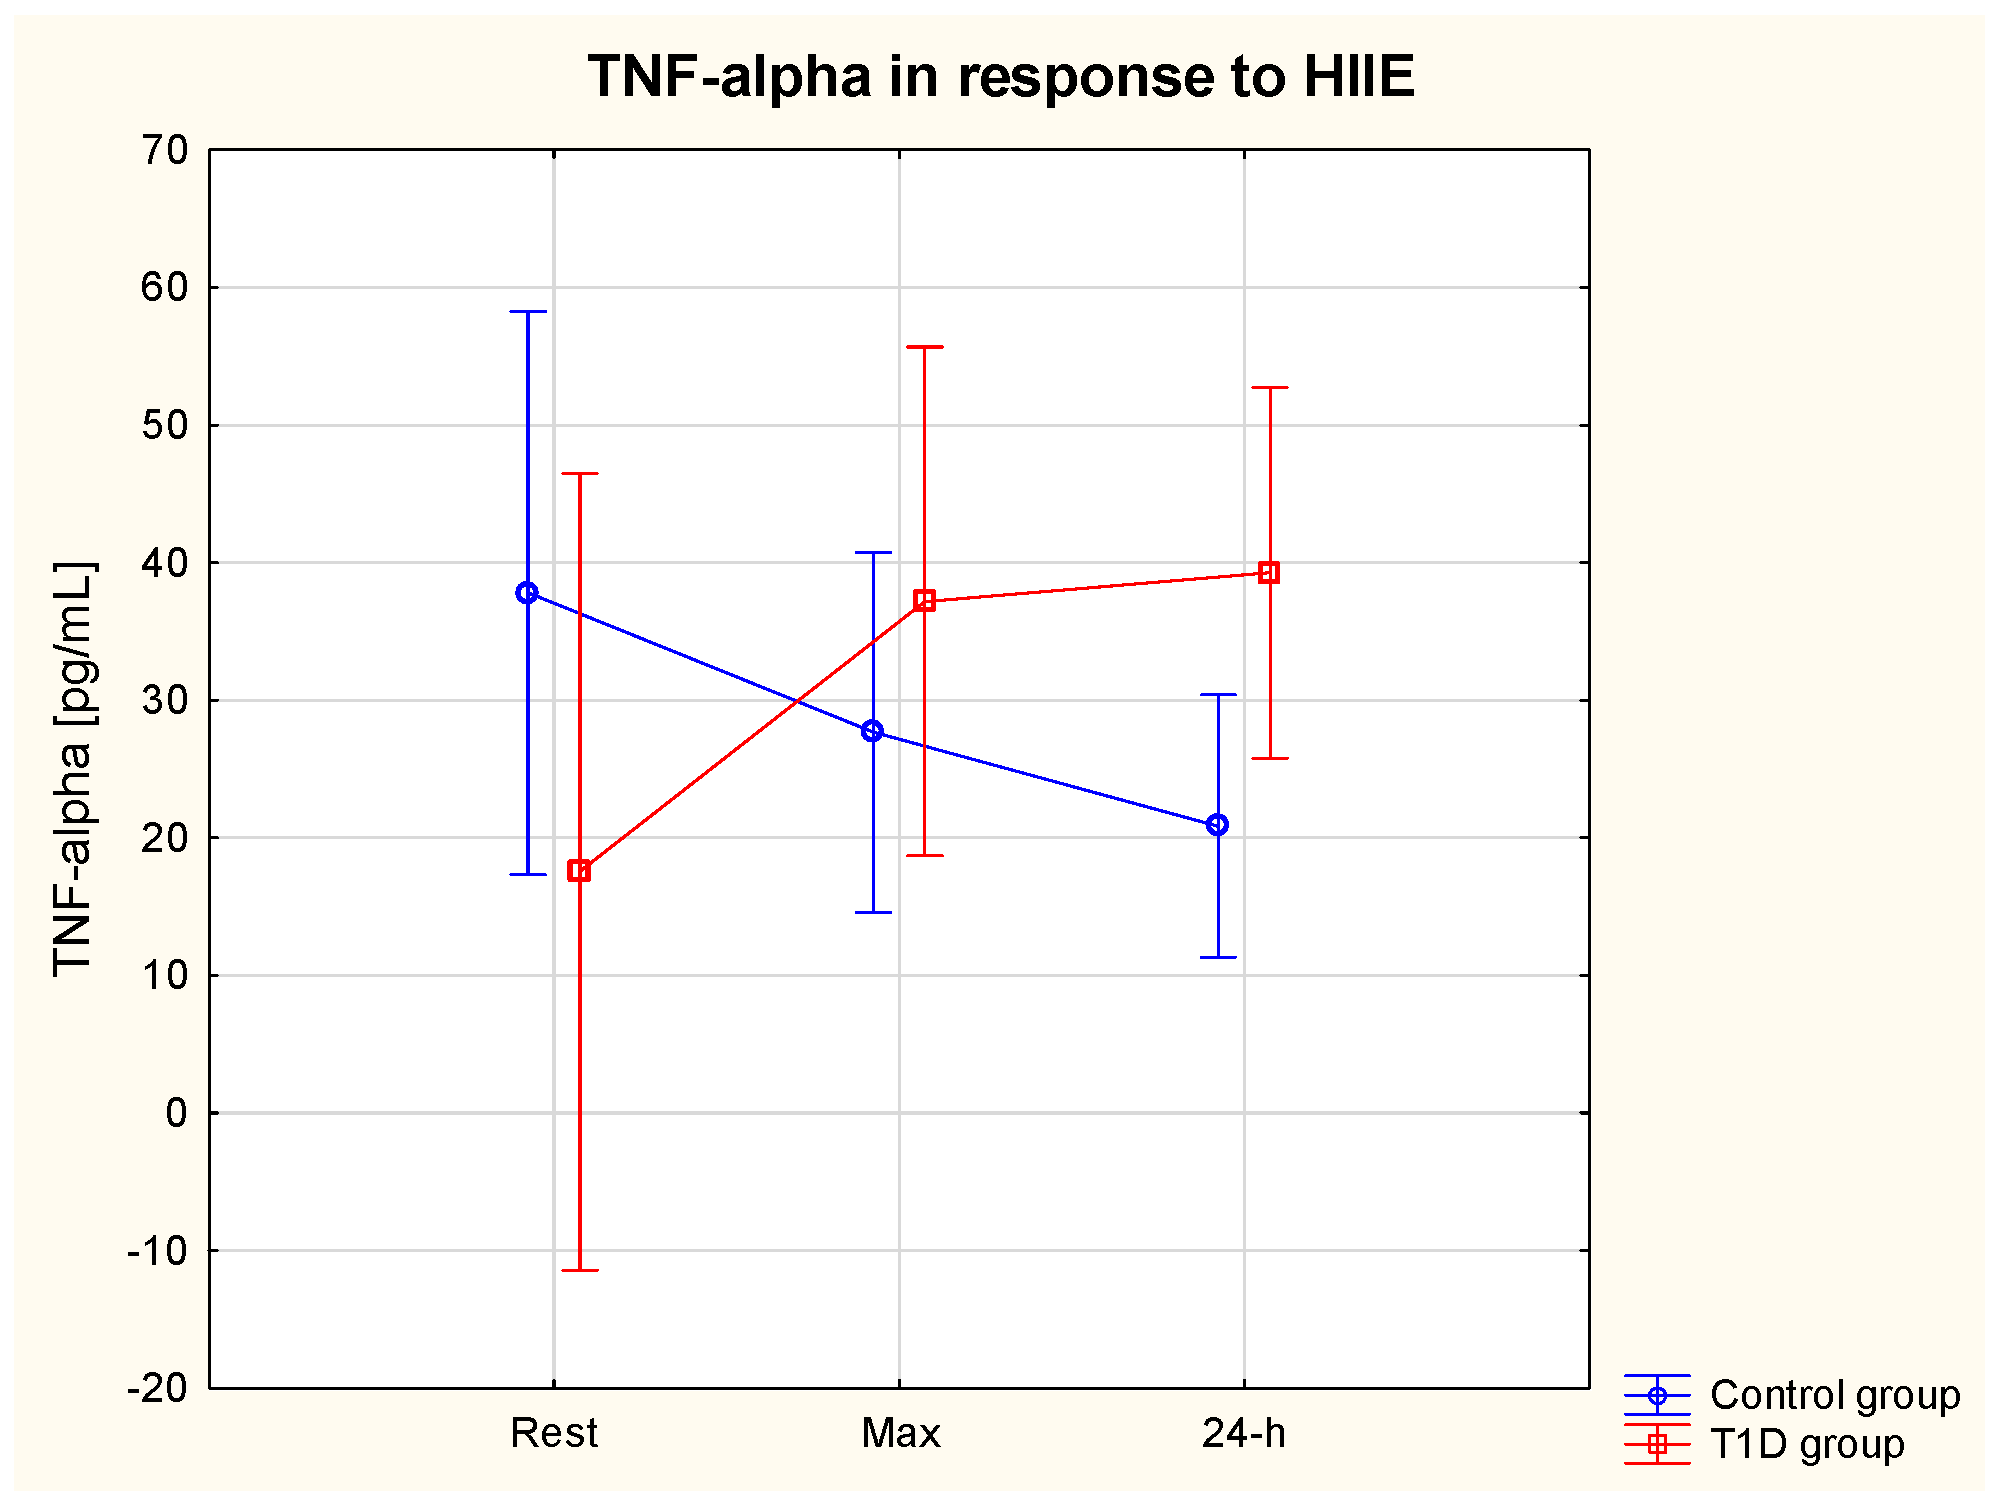
3.5.2. TNF-α
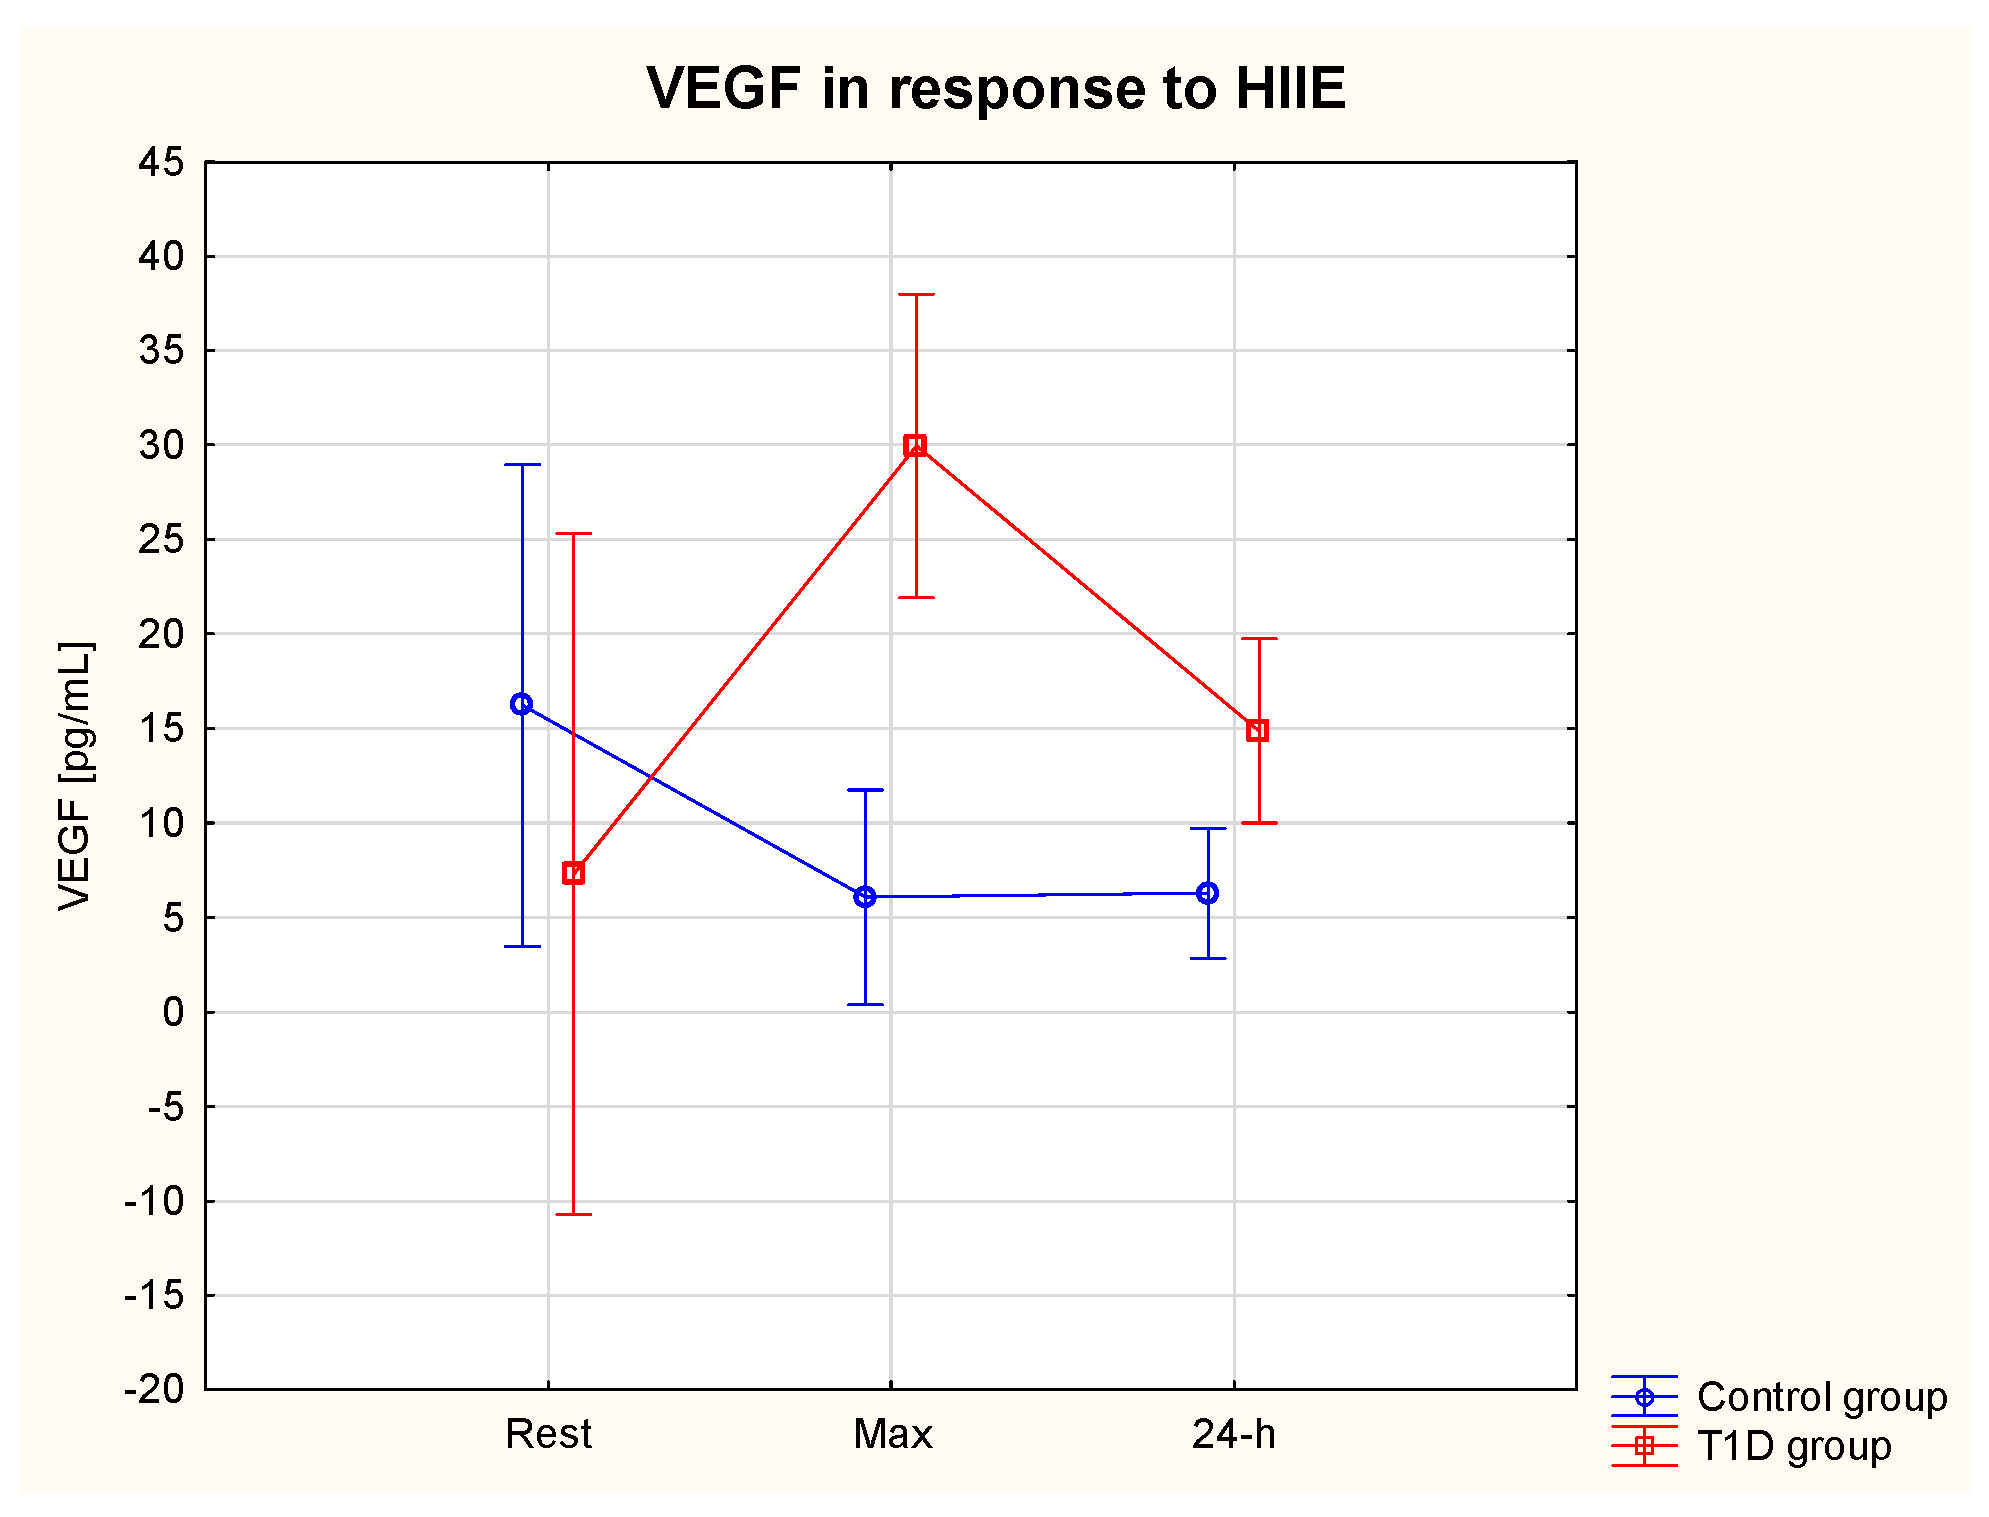
3.5.3. VEGF
4. Discussion
5. Conclusions
6. Limitations
Author Contributions
Funding
Institutional Review Board Statement
Informed Consent Statement
Data Availability Statement
Acknowledgments
Conflicts of Interest
References
- Moganti, K.; Li, F.; Schmuttermaier, C.; Riemann, S.; Kluter, H.; Gratchev, A.; Harmsen, M.C.; Kzhyshkowska, J. Hyperglycemia induces mixed M1/M2 cytokine profile in primary human monocyte-derived macrophages. Immunobiology 2017, 222, 952–959. [Google Scholar] [CrossRef] [PubMed]
- Torres-Castro, I.; Arroyo-Camarena, U.D.; Martinez-Reyes, C.P.; Gomez-Arauz, A.Y.; Duenas-Andrade, Y.; Hernandez-Ruiz, J.; Bejar, Y.L.; Zaga-Clavellina, V.; Morales-Montor, J.; Terrazas, L.I.; et al. Human monocytes and macrophages undergo M1-type inflammatory polarization in response to high levels of glucose. Immunol. Lett. 2016, 176, 81–89. [Google Scholar] [CrossRef]
- Sethi, J.K.; Hotamisligil, G.S. Metabolic Messengers: Tumour necrosis factor. Nat. Metab. 2021, 3, 1302–1312. [Google Scholar] [CrossRef] [PubMed]
- Crespo, J.; Cayón, A.; Fernández-Gil, P.; Hernández-Guerra, M.; Mayorga, M.; Domínguez-Díez, A.; Fernández-Escalante, J.C.; Pons-Romero, F. Gene expression of tumor necrosis factor alpha and TNF-receptors, p55 and p75, in nonalcoholic steatohepatitis patients. Hepatology 2001, 34, 1158–1163. [Google Scholar] [CrossRef] [PubMed]
- Kugelmas, M.; Hill, D.B.; Vivian, B.; Marsano, L.; McClain, C.J. Cytokines and NASH: A pilot study of the effects of lifestyle modification and vitamin E. Hepatology 2003, 38, 413–419. [Google Scholar] [CrossRef] [PubMed]
- Mohamed-Ali, V.; Armstrong, L.; Clarke, D.; Bolton, C.H.; Pinkney, J.H. Evidence for the regulation of levels of plasma adhesion molecules by proinflammatory cytokines and their soluble receptors in type 1 diabetes. J. Intern. Med. 2001, 250, 415–421. [Google Scholar] [CrossRef]
- Al-Isa, A.N.; Thalib, L.; Akanji, A.O. Circulating markers of inflammation and endothelial dysfunction in Arab adolescent subjects: Reference ranges and associations with age, gender, body mass and insulin sensitivity. Atherosclerosis 2010, 208, 543–549. [Google Scholar] [CrossRef]
- Popov, D. Endothelial cell dysfunction in hyperglycemia: Phenotypic change, intracellular signaling modification, ultrastructural alteration, and potential clinical outcomes. Int. J. Diabetes Mellit. 2010, 2, 189–195. [Google Scholar] [CrossRef]
- Haidari, M.; Zhang, W.; Willerson, J.T.; Dixon, R.A. Disruption of Endothelial Adherens Junctions by High Glucose Is Mediated by Protein Kinase C-β-Dependent Vascular Endothelial Cadherin Tyrosine Phosphorylation. Cardiovasc. Diabetol. 2014, 13, 105. [Google Scholar] [CrossRef]
- Domingueti, C.P.; Dusse, L.M.; das Graças Carvalho, M.; de Sousa, L.P.; Gomes, K.B.; Fernandes, A.P. Diabetes mellitus: The linkage between oxidative stress, inflammation, hypercoagulability and vascular complications. J. Diabetes Complicat. 2016, 30, 738–745. [Google Scholar] [CrossRef]
- Folkman, J. Angiogenesis in cancer, vascular, rheumatoid and other disease. Nat. Med. 1995, 1, 27–31. [Google Scholar] [CrossRef] [PubMed]
- Ferrara, N.; Davis-Smyth, T. The biology of vascular endothelial growth factor. Endocr. Rev. 1997, 18, 4–25. [Google Scholar] [CrossRef] [PubMed]
- Melder, R.J.; Koenig, G.C.; Witwer, B.P.; Safabakhsh, N.; Munn, L.L.; Jain, R.K. During angiogenesis, vascular endothelial growth factor and basic fibroblast growth factor regulate natural killer cell adhesion to tumor endothelium. Nat. Med. 1996, 2, 992–997. [Google Scholar] [CrossRef] [PubMed]
- Barleon, B.; Sozzani, S.; Zhou, D.; Weich, H.; Mantovani, A.; Marme, D. Migration of human monocytes in response to vascular endothelial growth factor (VEGF) is mediated via the VEGF receptor flt-1. Blood 1996, 87, 3336–3343. [Google Scholar] [CrossRef] [PubMed]
- Vordermark, D.; Kraft, P.; Katzer, A.; Bölling, T.; Willner, J.; Flentje, M. Glucose requirement for hypoxic accumulation of hypoxia-inducible factor-1alpha (HIF-1alpha). Cancer Lett. 2005, 230, 122–133. [Google Scholar] [CrossRef]
- Staab, A.; Löffler, J.; Said, H.M.; Katzer, A.; Beyer, M.; Polat, B.; Einsele, H.; Flentje, M.; Vordermark, D. Modulation of glucose metabolism inhibits hypoxic accumulation of hypoxia-inducible factor-1alpha (HIF-1alpha). Strahlenther. Onkol. 2007, 183, 366–373. [Google Scholar] [CrossRef]
- Catrina, S.B.; Zheng, X. Hypoxia and hypoxia-inducible factors in diabetes and its complications. Diabetologia 2021, 64, 709–716. [Google Scholar] [CrossRef]
- Sada, K.; Nishikawa, T.; Kukidome, D.; Yoshinaga, T.; Kajihara, N.; Sonoda, K.; Senokuchi, T.; Motoshima, H.; Matsumura, T.; Araki, E. Hyperglycemia Induces Cellular Hypoxia through Production of Mitochondrial ROS Followed by Suppression of Aquaporin-1. PLoS ONE 2016, 6, e0158619. [Google Scholar] [CrossRef]
- Echevarría, M.; Muñoz-Cabello, A.M.; Sánchez-Silva, R.; Toledo-Aral, J.J.; López-Barneo, J. Development of cytosolic hypoxia and hypoxia-inducible factor stabilization are facilitated by aquaporin-1 expression. J. Biol. Chem. 2007, 282, 30207–30215. [Google Scholar] [CrossRef]
- Sugano, R.; Matsuoka, H.; Haramaki, N.; Umei, H.; Murase, E.; Fukami, K.; Iida, S.; Ikeda, H.; Imaizumi, T. Polymorphonuclear leukocytes may impair endothelial function: Results of crossover randomized study of lipid-lowering therapies. Arterioscler. Thromb. Vasc. Biol. 2005, 25, 1262–1267. [Google Scholar] [CrossRef]
- Kennedy, L.; Baynes, W. Non-enzymatic glycosylation and the chronic complications of diabetes: An overview. Diabetologia 1984, 26, 93–98. [Google Scholar] [CrossRef] [PubMed]
- Campos, C. Chronic hyperglycemia and glucose toxicity: Pathology and clinical sequelae. Postgrad. Med. 2012, 124, 90–97. [Google Scholar] [CrossRef] [PubMed]
- American Diabetes Association Professional Practice Committee. 6. Glycemic Targets: Standards of Medical Care in Diabetes—2022. Diabetes Care 2022, 45, S83–S96. [Google Scholar] [CrossRef] [PubMed]
- World Health Organization. Global Report on Diabetes. 2016. Available online: http://apps.who.int/iris/bitstream/handle/10665/204871/9789241565257_eng.pdf?sequence=1&isAllowed=y) (accessed on 26 January 2022).
- Pedersen, B.K.; Saltin, B. Exercise as medicine—Evidence for prescribing exercise as therapy in 26 different chronic diseases. Scand. J. Med. Sci. Sports 2015, 25 (Suppl. S3), 1–72. [Google Scholar] [CrossRef]
- Reddy, R.; Wittenberg, A.; Castle, J.R.; El Youssef, J.; Winters-Stone, K.; Gillingham, M.; Jacobs, P.G. Effect of Aerobic and Resistance Exercise on Glycemic Control in Adults with Type 1 Diabetes. Can. J. Diabetes 2019, 43, 406–414.e1. [Google Scholar] [CrossRef] [PubMed]
- Colberg, R. Nutrition and Exercise Performance in Adults with Type 1 Diabetes. Can. J. Diabetes 2020, 44, 750–758. [Google Scholar] [CrossRef] [PubMed]
- Pancheva, R.; Zhelyazkova, D.; Ahmed, F.; Gillon-Keren, M.; Usheva, N.; Bocheva, Y.; Boyadzhieva, M.; Valchev, G.; Yotov, Y.; Iotova, V. Dietary Intake and Adherence to the Recommendations for Healthy Eating in Patients with Type 1 Diabetes: A Narrative Review. Front. Nutr. 2021, 8, 782670. [Google Scholar] [CrossRef] [PubMed]
- Meyer, K.A.; Kushi, L.H.; Jacobs, D.R., Jr.; Slavin, J.; Sellers, T.A.; Folsom, A.R. Carbohydrates, dietary fiber, and incident type 2 diabetes in older women. Am. J. Clin. Nutr. 2000, 71, 921–930. [Google Scholar] [CrossRef]
- Khosravi-Boroujeni, H.; Saadatnia, M.; Shakeri, F.; Keshteli, A.H.; Esmaillzadeh, A. A case-control study on potato consumption and risk of stroke in central Iran. Arch. Iran. Med. 2013, 16, 172–176. [Google Scholar]
- Mozaffarian, D. Dietary and Policy Priorities for Cardiovascular Disease, Diabetes, and Obesity: A Comprehensive Review. Circulation 2016, 133, 187–225. [Google Scholar] [CrossRef]
- Bohn, B.; Herbst, A.; Pfeifer, M.; Krakow, D.; Zimny, S.; Kopp, F.; Melmer, A.; Steinacker, J.M.; Holl, R.W. Impact of Physical Activity on Glycemic Control and Prevalence of Cardiovascular Risk Factors in Adults with Type 1 Diabetes: A Cross-sectional Multicenter Study of 18,028 Patients. Diabetes Care 2015, 38, 1536–1543. [Google Scholar] [CrossRef] [PubMed]
- Sikora, M.; Zwierzchowska, A.; Jaworska, M.; Solich-Talanda, M.; Mikolajczyk, R.; Zebrowska, A. The effects of physical activity on glycaemic control in children and adolescents with type 1 diabetes mellitus participating in diabetes camps. Balt. J. Health Phys. Act. 2018, 10, 151–161. [Google Scholar] [CrossRef]
- Miller, R.G.; Mahajan, H.D.; Costacou, T.; Sekikawa, A.; Anderson, S.J.; Orchard, T.J. Contemporary Estimate of Total Mortality and Cardiovascular Disease Risk in Young Adults with Type 1 Diabetes: The Pittsburgh Epidemiology of Diabetes Complications Study. Diabetes Care 2016, 39, 2296–2303. [Google Scholar] [CrossRef] [PubMed]
- Kennedy, A.; Nirantharakumar, K.; Chimen, M.; Pang, T.T.; Hemming, K.; Andrews, R.C.; Narendran, P. Does exercise improve glycaemic control in type 1 diabetes? A systematic review and meta-analysis. PLoS ONE 2013, 8, e58861. [Google Scholar] [CrossRef]
- DiPietro, L.; Dziura, J.; Yeckel, C.W.; Neufer, P.D. Exercise and improved insulin sensitivity in older women: Evidence of the enduring benefits of higher intensity training. J. Appl. Physiol. 2006, 100, 142–149. [Google Scholar] [CrossRef]
- O’donovan, G.; Kearney, E.M.; Nevill, A.M.; Woolf-May, K.; Bird, S.R. The effects of 24 weeks of moderate- or high-intensity exercise on insulin resistance. Eur. J. Appl. Physiol. 2005, 95, 522–528. [Google Scholar] [CrossRef]
- O’Donovan, G.; Owen, A.; Bird, S.R.; Kearney, E.M.; Nevill, A.M.; Jones, D.W.; Woolf-May, K. Changes in cardiorespiratory fitness and coronary heart disease risk factors following 24 wk of moderate- or high-intensity exercise of equal energy cost. J. Appl. Physiol. 2005, 98, 1619–1625. [Google Scholar] [CrossRef]
- Guiraud, T.; Nigam, A.; Gremeaux, V.; Meyer, P.; Juneau, M.; Bosquet, L. High-intensity interval training in cardiac rehabilitation. Sports Med. 2012, 42, 587–605. [Google Scholar] [CrossRef]
- Štajer, V.; Milovanović, I.M.; Todorović, N.; Ranisavljev, M.; Pišot, S.; Drid, P. Let’s (Tik) Talk About Fitness Trends. Front. Public Health 2022, 10, 899949. [Google Scholar] [CrossRef]
- Moser, O.; Tschakert, G.; Mueller, A.; Groeschl, W.; Pieber, T.R.; Obermayer-Pietsch, B.; Koehler, G.; Hofmann, P. Effects of High-Intensity Interval Exercise versus Moderate Continuous Exercise on Glucose Homeostasis and Hormone Response in Patients with Type 1 Diabetes Mellitus Using Novel Ultra-Long-Acting Insulin. PLoS ONE 2015, 10, e0136489. [Google Scholar] [CrossRef]
- Mitranun, W.; Deerochanawong, C.; Tanaka, H.; Suksom, D. Continuous vs interval training on glycemic control and macro- and microvascular reactivity in type 2 diabetic patients. Scand. J. Med. Sci. Sports 2014, 24, e69–e76. [Google Scholar] [CrossRef] [PubMed]
- Yardley, J.E.; Kenny, G.P.; Perkins, B.A.; Riddell, M.C.; Balaa, N.; Malcolm, J.; Boulay, P.; Khandwala, F.; Sigal, R.J. Resistance versus aerobic exercise. Diabetes Care 2013, 36, 537–542. [Google Scholar] [CrossRef] [PubMed]
- Sandoval, D.A.; Guy, D.L.A.; Richardson, M.A.; Ertl, A.C.; Davis, S.N. Effects of low and moderate antecedent exercise on counterregulatory responses to subsequent hypoglycemia in type 1 exercise. Diabetes 2004, 53, 1798–1806. [Google Scholar] [CrossRef] [PubMed]
- Younk, L.M.; Mikeladze, M.; Tate, D.; Davis, S.N. Exercise-related hypoglycemia in diabetes mellitus. Expert. Rev. Endocrinol. Metab. 2011, 6, 93–108. [Google Scholar] [CrossRef] [PubMed]
- Żebrowska, A.; Hall, B.; Kochańska-Dziurowicz, A.; Janikowska, G. The effect of high intensity physical exercise and hypoxia on glycemia, angiogenic biomarkers and cardiorespiratory function in patients with type 1 diabetes. Adv. Clin. Exp. Med. 2018, 27, 207–216. [Google Scholar] [CrossRef] [PubMed]
- Żebrowska, A.; Sikora, M.; Konarska, A.; Zwierzchowska, A.; Kamiński, T.; Robins, A.; Hall, B. Moderate intensity exercise in hypoxia increases IGF-1 bioavailability and serum irisin in individuals with type 1 diabetes. Ther. Adv. Endocrinol. Metab. 2020, 27, 11. [Google Scholar] [CrossRef]
- Hirsch, I.B. Insulin analogues. N. Engl. J. Med. 2005, 352, 174–183. [Google Scholar] [CrossRef]
- Cheng, B.; Kuipers, H.; Snyder, A.C.; Keizer, H.A.; Jeukendrup, A.; Hesselink, M. A new approach for the determination of ventilatory and lactate thresholds. Int. J. Sports Med. 1992, 13, 518–522. [Google Scholar] [CrossRef]
- American Diabetes Association Professional Practice Committee. 5. Facilitating Behavior Change and Well-being to Improve Health Outcomes: Standards of Medical Care in Diabetes-2022. Diabetes Care 2022, 45 (Suppl. S1), S60–S82. [Google Scholar] [CrossRef]
- Tanita. Understanding Your Measurements. Available online: https://tanita.eu/understanding-your-measurements (accessed on 13 July 2023).
- Heyward, V. Advanced Fitness Assessment and Exercise Prescription, 4th ed.; Human Kinetics: Champaign, IL, USA, 2001. [Google Scholar]
- Jarosz, M.; Rychlik, E.; Stoś, K.; Charzewska, J. Normy Żywienia Dla Populacji Polski I Ich Zastosowanie; Narodowy Instytut Zdrowia Publicznego—Państwowy Zakład Higieny: Warszawa, Poland, 2020; ISBN 978-83-65870-28-5. [Google Scholar]
- Codella, R.; Terruzzi, I.; Luzi, L. Why should people with type 1 diabetes exercise regularly? Acta Diabetol. 2017, 54, 615–630. [Google Scholar] [CrossRef]
- Oja, L.; Piksööt, J. Physical Activity and Sports Participation among Adolescents: Associations with Sports-Related Knowledge and Attitudes. Int. J. Environ. Res. Public Health 2022, 19, 6235. [Google Scholar] [CrossRef] [PubMed]
- Adamsen, L.; Andersen, C.; Lillelund, C.; Bloomquist, K.; Møller, T. Rethinking exercise identity: A qualitative study of physically inactive cancer patients’ transforming process while undergoing chemotherapy. BMJ Open 2017, 7, e016689. [Google Scholar] [CrossRef] [PubMed]
- McKevitt, S.; Jinks, C.; Healey, E.L.; Quicke, J.G. The attitudes towards, and beliefs about, physical activity in people with osteoarthritis and comorbidity: A qualitative investigation. Musculoskelet. Care 2022, 20, 167–179. [Google Scholar] [CrossRef] [PubMed]
- Abushamat, L.A.; McClatchey, P.M.; Scalzo, R.L.; Reusch, J.E. The Role of Exercise in Diabetes; Feingold, K.R., Anawalt, B., Blackman, M.R., Boyce, A., Chrousos, G., Corpas, E., de Herder, W.W., Dhatariya, K., Dungan, K., Hofland, J., et al., Eds.; MDText.com, Inc.: South Dartmouth, MA, USA, 2000. Available online: https://www.ncbi.nlm.nih.gov/books/NBK549946/ (accessed on 6 January 2023).
- Hasan, S.; Shaw, S.M.; Gelling, L.H.; Kerr, C.J.; A Meads, C. Exercise modes and their association with hypoglycemia episodes in adults with type 1 diabetes mellitus: A systematic review. BMJ Open Diabetes Res. Care 2018, 6, e000578. [Google Scholar] [CrossRef]
- Alarcón-Gómez, J.; Chulvi-Medrano, I.; Martin-Rivera, F.; Calatayud, J. Effect of High-Intensity Interval Training on Quality of Life, Sleep Quality, Exercise Motivation and Enjoyment in Sedentary People with Type 1 Diabetes Mellitus. Int. J. Environ. Res. Public Health 2021, 18, 12612. [Google Scholar] [CrossRef] [PubMed]
- Petersen, K.F.; Price, T.B.; Bergeron, R. Regulation of net hepatic glycogenolysis and gluconeogenesis during exercise: Impact of type 1 diabetes. J. Clin. Endocrinol. Metab. 2004, 89, 4656–4664. [Google Scholar] [CrossRef]
- Riddell, M.C.; Gallen, I.W.; Smart, C.E.; Taplin, C.E.; Adolfsson, P.; Lumb, A.N.; Kowalski, A.; Rabasa-Lhoret, R.; McCrimmon, R.J.; Hume, C.; et al. Exercise management in type 1 diabetes: A consensus statement. Lancet Diabetes Endocrinol. 2017, 5, 377–390, Erratum in Diabetes Endocrinol. 2017, 5, e3. [Google Scholar] [CrossRef] [PubMed]
- McClatchey, P.M.; Williams, I.M.; Xu, Z.; Mignemi, N.A.; Hughey, C.C.; McGuinness, O.P.; Beckman, J.A.; Wasserman, D.H. Perfusion controls muscle glucose uptake by altering the rate of glucose dispersion in vivo. Am. J. Physiol. Endocrinol. Metab. 2019, 317, E1022–E1036. [Google Scholar] [CrossRef]
- Cartee, G.D. Mechanisms for greater insulin-stimulated glucose uptake in normal and insulin-resistant skeletal muscle after acute exercise. Am. J. Physiol. Endocrinol. Metab. 2015, 309, E949–E959. [Google Scholar] [CrossRef]
- Yardley, J.E. Fasting May Alter Blood Glucose Responses to High-Intensity Interval Exercise in Adults with Type 1 Diabetes: A Randomized, Acute Crossover Study. Can. J. Diabetes 2020, 44, 727–733. [Google Scholar] [CrossRef]
- Schmidt, M.I.; Hadji-Georgopoulos, A.; Rendell, M.; Margolis, S.; Kowarski, A. The dawn phenomenon, an early morning glucose rise: Implications for diabetic intraday blood glucose variation. Diabetes Care 1981, 4, 579–585. [Google Scholar] [CrossRef] [PubMed]
- Edge, J.A.; Matthews, D.R.; Dunger, D.B. The dawn phenomenon is related to overnight growth hormone release in adolescent diabetics. Clin. Endocrinol. 1990, 33, 729–737. [Google Scholar] [CrossRef] [PubMed]
- Cockcroft, E.J.; Moudiotis, C.; Kitchen, J.; Bond, B.; Williams, C.A.; Barker, A.R. High-intensity interval exercise and glycemic control in adolescents with type one diabetes mellitus: A case study. Physiol. Rep. 2017, 5, e13339. [Google Scholar] [CrossRef] [PubMed]
- Gallen, I.W.; Hume, C.; Lumb, A. Fueling the athlete with type 1 diabetes. Diabetes Obes. Metab. 2011, 13, 130–136. [Google Scholar] [CrossRef] [PubMed]
- Chu, L.; Hamilton, J.; Riddell, M.C. Clinical management of the physically active patient with type 1 diabetes. Phys. Sportsmed. 2011, 39, 64–77. [Google Scholar] [CrossRef]
- Khaw, K.-T.; Wareham, N.; Luben, R.; Bingham, S.; Oakes, S.; Welch, A.; Day, N. Glycated haemoglobin, diabetes, and mortality in men in Norfolk cohort of european prospective investigation of cancer and nutrition (EPIC-Norfolk). BMJ 2001, 322, 15–18. [Google Scholar] [CrossRef]
- Chiavaroli, L.; Lee, D.; Ahmed, A.; Cheung, A.; A Khan, T.; Blanco, S.; Mirrahimi, A.; A Jenkins, D.J.; Livesey, G.; Wolever, T.M.; et al. Effect of low glycaemic index or load dietary patterns on glycaemic control and cardiometabolic risk factors in diabetes: Systematic review and meta-analysis of randomised controlled trials. BMJ 2021, 374, n1651. [Google Scholar] [CrossRef] [PubMed]
- Jenkins, D.J.A.; Kendall, C.W.C.; Augustin, L.S.A.; Mitchell, S.; Sahye-Pudaruth, S.; Blanco Mejia, S.; Chiavaroli, L.; Mirrahimi, A.; Ireland, C.; Bashyam, B.; et al. Effect of Legumes as Part of a Low Glycemic Index Diet on Glycemic Control and Cardiovascular Risk Factors in Type 2 Diabetes Mellitus: A Randomized Controlled Trial. Arch. Intern. Med. 2012, 172, 1653–1660. [Google Scholar] [CrossRef]
- Giacco, R.; Parillo, M.; Rivellese, A.A.; Lasorella, G.; Giacco, A.; D’Episcopo, L.; Riccardi, G. Long-term dietary treatment with increased amounts of fiber-rich low-glycemic index natural foods improves blood glucose control and reduces the number of hypoglycemic events in type 1 diabetic patients. Diabetes Care 2000, 23, 1461–1466. [Google Scholar] [CrossRef]
- Mann, J.I.; De Leeuw, I.; Hermansen, K.; Karamanos, B.; Karlström, B.; Katsilambros, N.; Riccardi, G.; Rivellese, A.A.; Rizkalla, S.; Slama, G.; et al. Evidence-based nutritional approaches to the treatment and prevention of diabetes mellitus. Nutr. Metab. Cardiovasc. Dis. 2004, 14, 373–394. [Google Scholar] [CrossRef]
- Rose, A.J.; Richter, E.A. Skeletal muscle glucose uptake during exercise: How is it regulated? Physiology 2005, 20, 260–270. [Google Scholar] [CrossRef] [PubMed]
- Khosravi-Boroujeni, H.; Mohammadifard, N.; Sarrafzadegan, N.; Sajjadi, F.; Maghroun, M.; Khosravi, A.; Alikhasi, H.; Rafieian, M.; Azadbakht, L. Potato consumption and cardiovascular disease risk factors among Iranian population. Int. J. Food Sci. Nutr. 2012, 63, 913–920. [Google Scholar] [CrossRef] [PubMed]
- Blaak, E.E.; Antoine, J.-M.; Benton, D.; Björck, I.; Bozzetto, L.; Brouns, F.; Diamant, M.; Dye, L.; Hulshof, T.; Holst, J.J.; et al. Impact of postprandial glycaemia on health and prevention of disease. Obes. Rev. 2012, 13, 923–984. [Google Scholar] [CrossRef]
- Gray, A.; Threlkeld, R.J. Nutritional Recommendations for Individuals with Diabetes; Feingold, K.R., Anawalt, B., Blackman, M.R., Boyce, A., Chrousos, G., Corpas, E., de Herder, W.W., Dhatariya, K., Dungan, K., Hofland, J., et al., Eds.; MDText.com, Inc.: South Dartmouth, MA, USA, 2000. Available online: https://www.ncbi.nlm.nih.gov/books/NBK279012/ (accessed on 13 October 2019).
- Franz, M.J.; Boucher, J.L.; Evert, A.B. Evidence-based diabetes nutrition therapy recommendations are effective: The key is individualization. Diabetes Metab. Syndr. Obes. 2014, 24, 65–72. [Google Scholar] [CrossRef] [PubMed]
- EFSA (European Food Safety Authority). Dietary Reference Values for nutrients. Summary Report. EFSA Support. Publ. 2017, 14, e15121. [Google Scholar] [CrossRef]
- Martínez-González, M.A.; Salas-Salvadó, J.; Estruch, R.; Corella, D.; Fitó, M.; Ros, E.; Predimed Investigators. Benefits of the Mediterranean Diet: Insights from the PREDIMED Study. Prog. Cardiovasc. Dis. 2015, 58, 50–60. [Google Scholar] [CrossRef]
- American Diabetes Association. 5. Lifestyle Management: Standards of Medical Care in Diabetes-2019. Diabetes Care 2019, 42 (Suppl. S1), 46–60. [Google Scholar] [CrossRef]
- Nuttall, F.Q.; Gannon, M.C. Metabolic response of people with type 2 diabetes to a high protein diet. Nutr. Metab. 2004, 13, 6. [Google Scholar] [CrossRef]
- National Kidney Foundation. KDOQI clinical practice guidelines for diabetes and chronic kidney disease. Am. J. Kidney Dis. 2012, 49 (Suppl. S2), S1–S179. [Google Scholar]
- Scott, S.N.; Shepherd, S.O.; Strauss, J.A.; Wagenmakers, A.J.M.; Cocks, M. Home-based high-intensity interval training reduces barriers to exercise in people with type 1 diabetes. Exp. Physiol. 2020, 105, 571–578. [Google Scholar] [CrossRef]
- Huang, L.E.; Arany, Z.; Livingston, D.M.; Bunn, H.F. Activation of hypoxia-inducible transcription factor depends primarily upon re-dox-sensitive stabilization of its alpha subunit. J. Biol. Chem. 1996, 271, 32253–32259. [Google Scholar] [CrossRef]
- Żebrowska, A.; Jastrzębski, D.; Sadowska-Krępa, E.; Sikora, M.; Di Giulio, C. Comparison of the Effectiveness of High-Intensity Interval Training in Hypoxia and Normoxia in Healthy Male Volunteers: A Pilot Study. BioMed Res. Int. 2019, 2019, 7315714. [Google Scholar] [CrossRef] [PubMed]
- Xing, J.; Lu, J. HIF-1α Activation Attenuates IL-6 and TNF-α Pathways in Hippocampus of Rats Following Transient Global Ischemia. Cell Physiol. Biochem. 2016, 39, 511–520. [Google Scholar] [CrossRef] [PubMed]
- Li, G.; Lu, W.-H.; Ai, R.; Yang, J.-H.; Chen, F.; Tang, Z.-Z. The relationship between serum hypoxia-inducible factor 1α and coronary artery calcification in asymptomatic type 2 diabetic patients. Cardiovasc. Diabetol. 2014, 13, 52. [Google Scholar] [CrossRef] [PubMed]
- Rusdiana, R.; Moradi, A.; Widjaja, S.; Sari, M.; Hidayat, H.; Savira, M.; Amelia, R.; Rusmalawaty, R. The Effect of Hypoxia Inducible Factor-1 Alpha and Vascular Endothelial Growth Factor Level in Type 2 Diabetes Microvascular Complications and Development. Med. Arch. 2022, 76, 135–139. [Google Scholar] [CrossRef]
- Xiao, H.; Gu, Z.; Wang, G.; Zhao, T. The possible mechanisms underlying the impairment of HIF-1α pathway signaling in hyperglycemia and the beneficial effects of certain therapies. Int. J. Med. Sci. 2013, 10, 1412–1421. [Google Scholar] [CrossRef]
- Catrina, S.-B.; Okamoto, K.; Pereira, T.; Brismar, K.; Poellinger, L. Hyperglycemia regulates hypoxia-inducible factor-1alpha protein stability and function. Diabetes 2004, 53, 3226–3232. [Google Scholar] [CrossRef]
- Thangarajah, H.; Vial, I.N.; Grogan, R.H.; Yao, D.; Shi, Y.; Januszyk, M.; Galiano, R.D.; Chang, E.I.; Galvez, M.G.; Glotzbach, J.P.; et al. HIF-1alpha dysfunction in diabetes. Cell Cycle 2010, 9, 75–79. [Google Scholar] [CrossRef]
- Ahluwalia, A.; Tarnawski, A.S. Critical role of hypoxia sensor--HIF-1α in VEGF gene activation. Implications for angiogenesis and tissue injury healing. Curr. Med. Chem. 2012, 19, 90–97. [Google Scholar] [CrossRef]
- Brown, M.D.; Hudlicka, O. Modulation of physiological angiogenesis in skeletal muscle by mechanical forces: Involvement of VEGF and metalloproteinases. Angiogenesis 2003, 6, 1–14. [Google Scholar] [CrossRef]
- Shoag, J.; Arany, Z. Regulation of hypoxia-inducible genes by PGC-1 alph a. Arterioscler. Thromb. Vasc. Biol. 2010, 30, 662–666. [Google Scholar] [CrossRef] [PubMed]
- Martin, A.; Komada, M.R.; Sane, D.C. Abnormal angiogenesis in diabetes mellitus. Med. Res. Rev. 2003, 23, 117–145. [Google Scholar] [CrossRef] [PubMed]
- Tooke, J.E. Microvasculature in diabetes. Cardiovasc. Res. 1996, 32, 764–771. [Google Scholar] [CrossRef] [PubMed]
- Waltenberger, J. Impaired collateral vessel development in diabetes: Potential cellular mechanisms and therapeutic implications. Cardiovasc. Res. 2001, 49, 554–560. [Google Scholar] [CrossRef]
- Petersen, A.M.; Pedersen, B.K. The anti-inflammatory effect of exercise. J. Appl. Physiol. 2005, 98, 1154–1162. [Google Scholar] [CrossRef]
- Giraudo, E.; Primo, L.; Audero, E.; Gerber, H.-P.; Koolwijk, P.; Soker, S.; Klagsbrun, M.; Ferrara, N.; Bussolino, F. Tumor necrosis factor-alpha regulates expression of vascular endothelial growth factor receptor-2 and of its co-receptor neuropilin-1 in human vascular endothelial cells. J. Biol. Chem. 1998, 273, 22128–22135. [Google Scholar] [CrossRef]
- Febbraio, M.A.; Steensberg, A.; Starkie, R.L.; McConell, G.K.; Kingwell, B.A. Skeletal muscle interleukin-6 and tumor necrosis factor-alpha release in healthy subjects and patients with type 2 diabetes at rest and during exercise. Metabolism 2003, 52, 939–944. [Google Scholar] [CrossRef]
- Quarta, S.; Massaro, M.; Carluccio, M.A.; Calabriso, N.; Bravo, L.; Sarria, B.; García-Conesa, M.-T. An Exploratory Critical Review on TNF-α as a Potential Inflammatory Biomarker Responsive to Dietary Intervention with Bioactive Foods and Derived Products. Foods 2022, 11, 2524. [Google Scholar] [CrossRef]
- Ovcina-Kurtovic, N.; Kasumagic-Halilovic, E. Serum Levels of Tumor Necrosis Factor—Alpha in Patients with Psoriasis. Mater. Sociomed. 2022, 34, 40–43. [Google Scholar] [CrossRef]
- Feuerer, M.; Herrero, L.; Cipolletta, D.; Naaz, A.; Wong, J.; Nayer, A.; Lee, J.; Goldfine, A.B.; Benoist, C.; Shoelson, S.; et al. Lean, but not obese, fat is enriched for a unique population of regulatory T cells that affect metabolic parameters. Nat. Med. 2009, 15, 930–939. [Google Scholar] [CrossRef]


| T1D Group n = 9 (Female n = 2) | Control Group n = 9 (Female n = 3) | |||||||
|---|---|---|---|---|---|---|---|---|
| Mean | ±SD | Min | Max | Mean | ±SD | Min | Max | |
| Age | 30.2 | 10.9 | 18.0 | 43.0 | 22.4 | 1.4 | 21.0 | 26.0 |
| Body mass (kg) | 74.8 | 14.3 | 51.1 | 99.1 | 70.1 | 9.2 | 58.3 | 91.5 |
| Body height (m) | 1.8 | 0.1 | 1.6 | 1.9 | 1.7 | 0.1 | 1.6 | 1.8 |
| BMI (kg/m2) | 23.8 | 3.6 | 18.1 | 29.9 | 23.5 | 2.5 | 19.9 | 27.9 |
| %BF | 17.5 | 8.3 | 6.5 | 33.5 | 18.7 | 6.3 | 10.1 | 26.4 |
| FFM (kg) | 61.6 | 12.6 | 41.6 | 75.3 | 56.9 | 8.3 | 43.4 | 70.0 |
| VO2peak (mL/kg/min) | 39.0 | 8.2 | 31.0 | 48.0 | 47.8 | 11.1 | 30.0 | 69.0 |
| T1D duration (years) | 12.3 | 9.1 | 4.0 | 27.0 | n.a. | n.a. | n.a. | n.a. |
| HbA1C (%) | 7.3 | 0.8 | 6.1 | 8.8 | n.m. | n.m. | n.m. | n.m. |
| Energy intake (kcal/day) | 2153.7 | 739.1 | 1076 | 3243 | 2778.6 | 769.1 | 2174.7 | 4408.9 |
| CHO intake (g/day) | 241.3 | 98.2 | 113.7 | 365.5 | 353.2 | 146.9 | 250.4 | 663.6 |
| CHO %energy intake | 54.0 | 10.3 | 41.2 | 70.8 | 60.4 | 6.9 | 48.5 | 70.0 |
| Protein intake (g/day) | 116.2 | 58.4 | 51.2 | 224.7 | 111.4 | 27.6 | 82.1 | 159.0 |
| Protein intake (g/kg/day) | 1.6 | 0.8 | 0.7 | 2.8 | 1.6 | 0.4 | 1.2 | 2.2 |
| Protein %energy intake | 26.6 | 9.8 | 13.5 | 42.3 | 20.2 | 5.6 | 13.9 | 30.8 |
| Fat intake (g/day) | 86.2 | 45.0 | 25.8 | 152.7 | 109.2 | 22.6 | 76.7 | 152.1 |
| Fat %energy intake | 19.4 | 7.1 | 10.3 | 29.5 | 19.4 | 2.2 | 16.1 | 22.9 |
| Variables | T1D Group | |
|---|---|---|
| Mean | SD | |
| Fasting glycaemia day 1 (mg/dL) | 164.5 | 78.5 |
| Fasting glycaemia day 2 (mg/dL) | 139.0 | 9.9 |
| Insulin day 1 (units/day) | 35.3 | 10.9 |
| Insulin day 2 (units/day) | 34.5 | 13.5 |
| Digestible CHO day 1 | 157.0 | 104.2 |
| Digestible CHO day 2 | 190.5 | 57.7 |
| Variables | T1D Group | Control Group | T1D Group | Control Group | ||||
|---|---|---|---|---|---|---|---|---|
| Mean | ±SD | Mean | ±SD | %Change: Rest vs. Max | %Change: Rest vs. 24-h | %Change: Rest vs. Max | %Change: Rest vs. 24-h | |
| HIF-1α rest (ng/mL) | 657.0 *** | 210.4 | 28.3 | 11.5 | 34.4% ↓ | 39.1% ↓ | 278.9% ↑ | 242.7% ↑ |
| HIF-1α max (ng/mL) | 430.0 | 163.3 | 107.0 | 56.9 | ||||
| HIF-1α 24 h (ng/mL) | 399.5 | 297.7 | 96.8 | 76.9 | ||||
| TNF-α rest (pg/mL) | 17.6 | 19.4 | 37.8 | 13.0 | 111.0% ↑ | 123.1% ↑ | 26.3% ↓ | 44.3% ↓ |
| TNF-α max (pg/mL) | 37.2 | 9.3 | 27.7 | 10.3 | ||||
| TNF-α 24 h (pg/mL) | 39.3 | 16.5 | 20.9 | 9.5 | ||||
| VEGF rest (pg/mL) | 7.3 | 4.6 | 16.2 | 4.6 | 310.3% ↑ | 103.4% ↑ | 62.9%↓ | 61.4% ↓ |
| VEGF max (pg/mL) | 30.0 * | 25.3 | 6.1 | 3.4 | ||||
| VEGF 24 h (pg/mL) | 14.9 | 3.1 | 6.3 | 3.2 | ||||
Disclaimer/Publisher’s Note: The statements, opinions and data contained in all publications are solely those of the individual author(s) and contributor(s) and not of MDPI and/or the editor(s). MDPI and/or the editor(s) disclaim responsibility for any injury to people or property resulting from any ideas, methods, instructions or products referred to in the content. |
© 2023 by the authors. Licensee MDPI, Basel, Switzerland. This article is an open access article distributed under the terms and conditions of the Creative Commons Attribution (CC BY) license (https://creativecommons.org/licenses/by/4.0/).
Share and Cite
Hall, B.; Żebrowska, A.; Sikora, M.; Siatkowski, S.; Robins, A. The Effect of High-Intensity Interval Exercise on Short-Term Glycaemic Control, Serum Level of Key Mediator in Hypoxia and Pro-Inflammatory Cytokines in Patients with Type 1 Diabetes—An Exploratory Case Study. Nutrients 2023, 15, 3749. https://doi.org/10.3390/nu15173749
Hall B, Żebrowska A, Sikora M, Siatkowski S, Robins A. The Effect of High-Intensity Interval Exercise on Short-Term Glycaemic Control, Serum Level of Key Mediator in Hypoxia and Pro-Inflammatory Cytokines in Patients with Type 1 Diabetes—An Exploratory Case Study. Nutrients. 2023; 15(17):3749. https://doi.org/10.3390/nu15173749
Chicago/Turabian StyleHall, Barbara, Aleksandra Żebrowska, Marcin Sikora, Szymon Siatkowski, and Anna Robins. 2023. "The Effect of High-Intensity Interval Exercise on Short-Term Glycaemic Control, Serum Level of Key Mediator in Hypoxia and Pro-Inflammatory Cytokines in Patients with Type 1 Diabetes—An Exploratory Case Study" Nutrients 15, no. 17: 3749. https://doi.org/10.3390/nu15173749