
Evaluation of Junk Food Consumption and the Risk Related to Consumer Health among the Romanian Population

 ,
,  ,
,  , , , , and
Abstract
:1. Introduction
2. Materials and Methods
2.1. Study Design
2.2. Questionnaire Validation
2.3. Statistical Analysis
3. Results
3.1. Socio-Demographic and Anthropometric Data
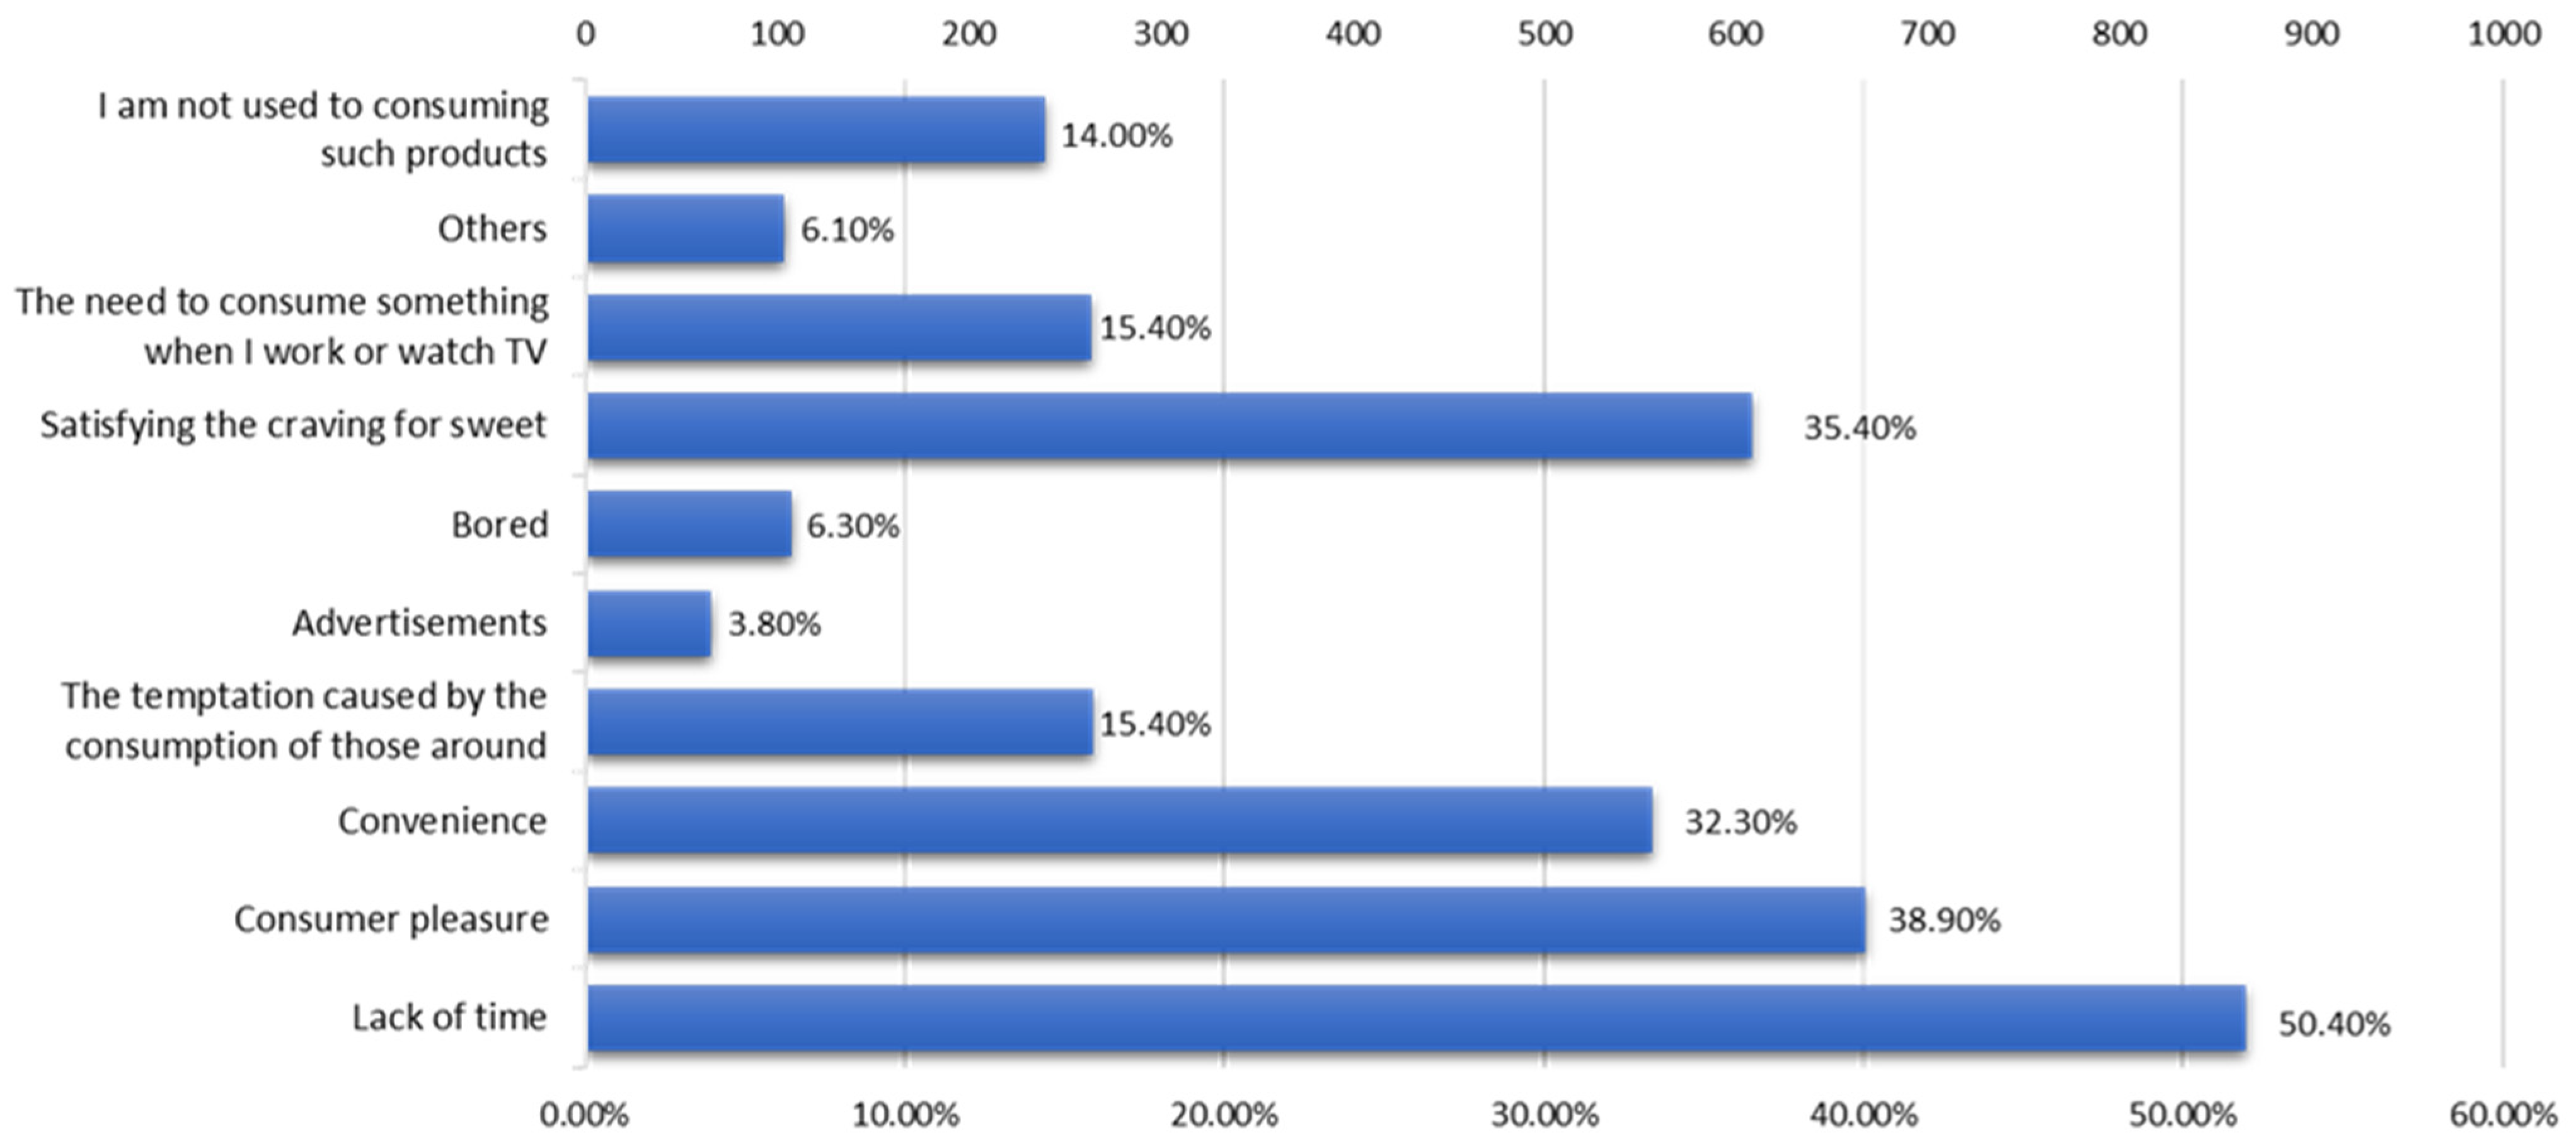
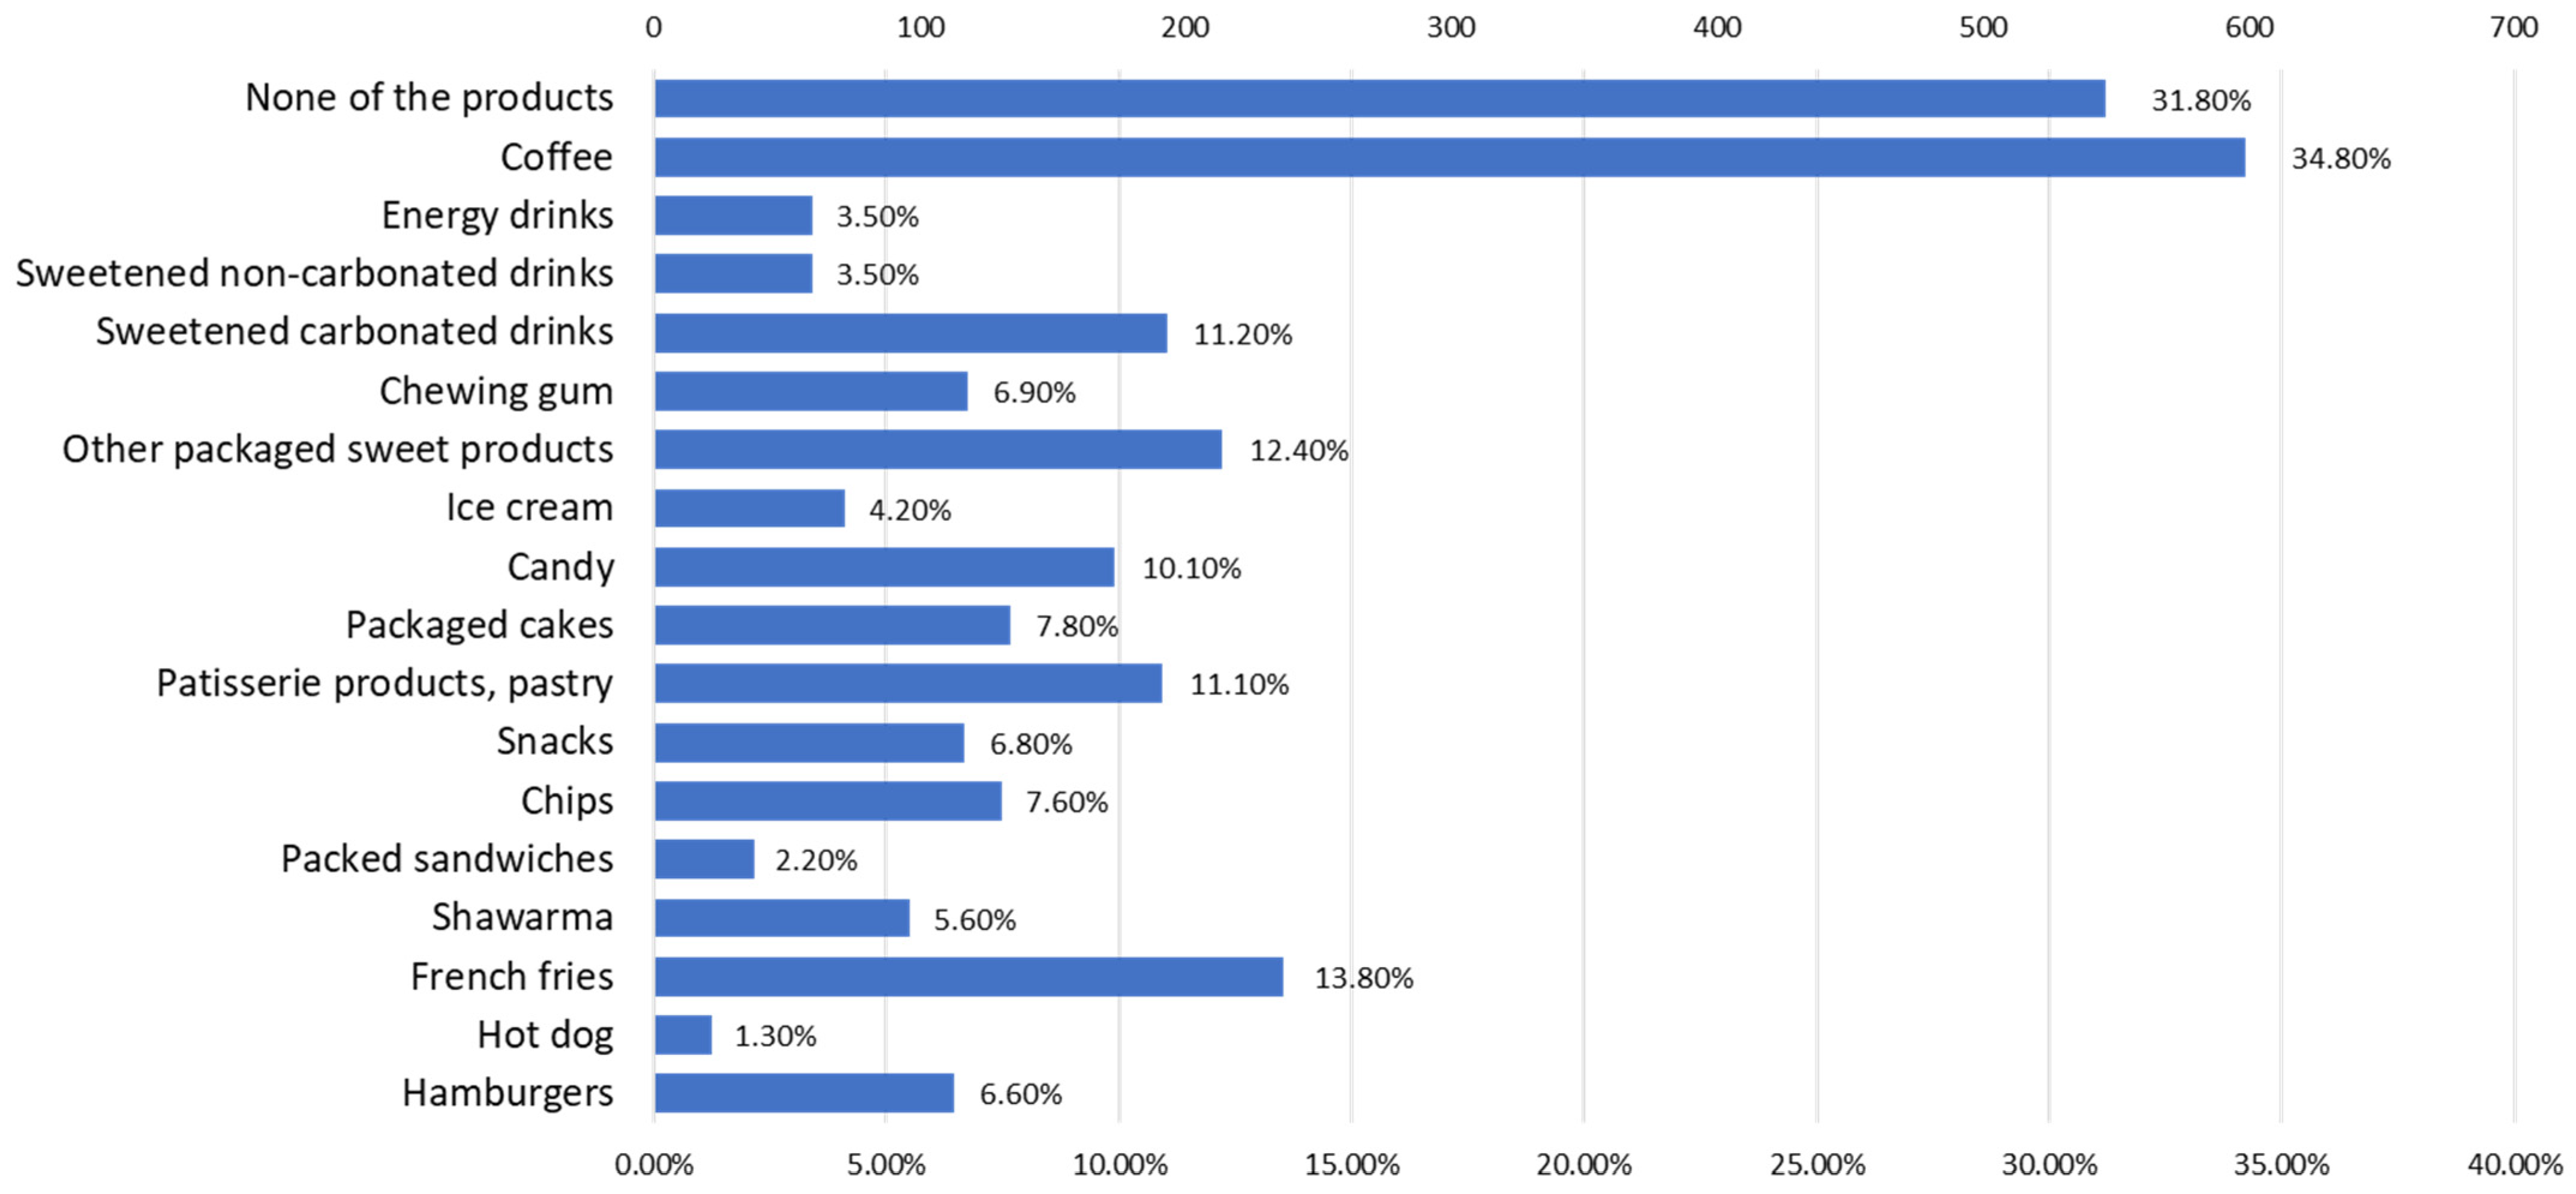
3.2. Consumption of Junk Food Products
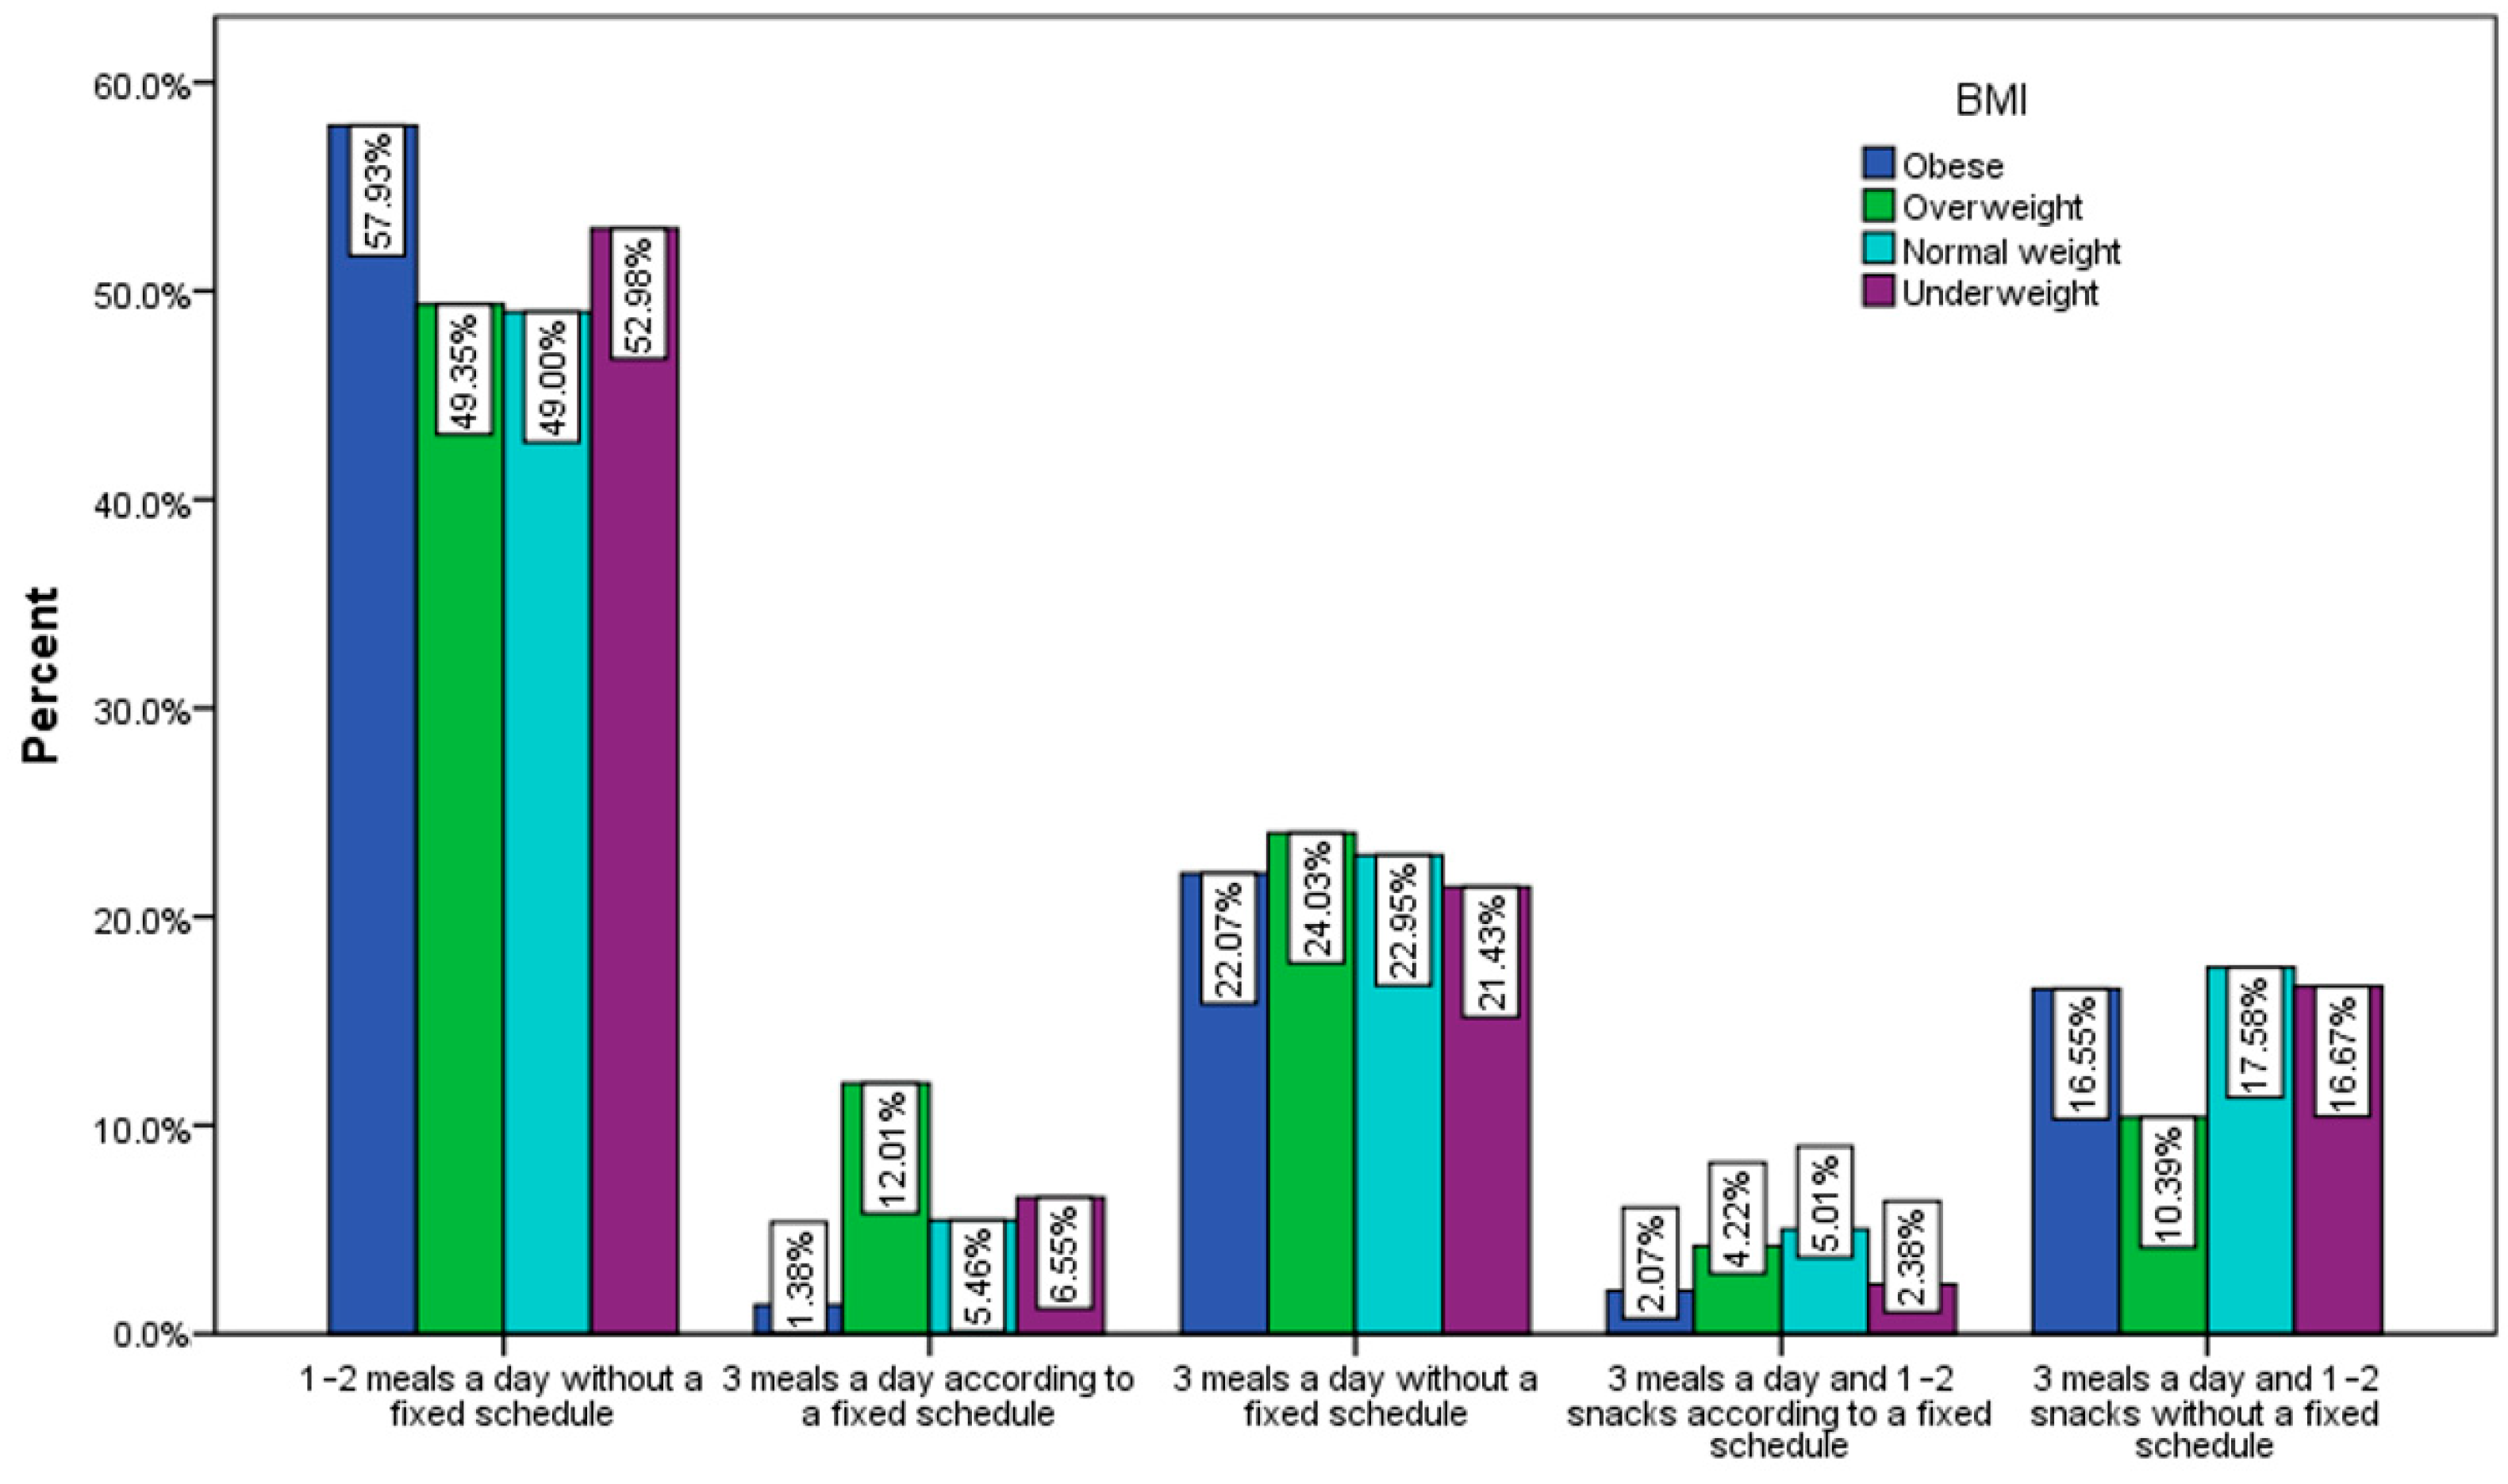
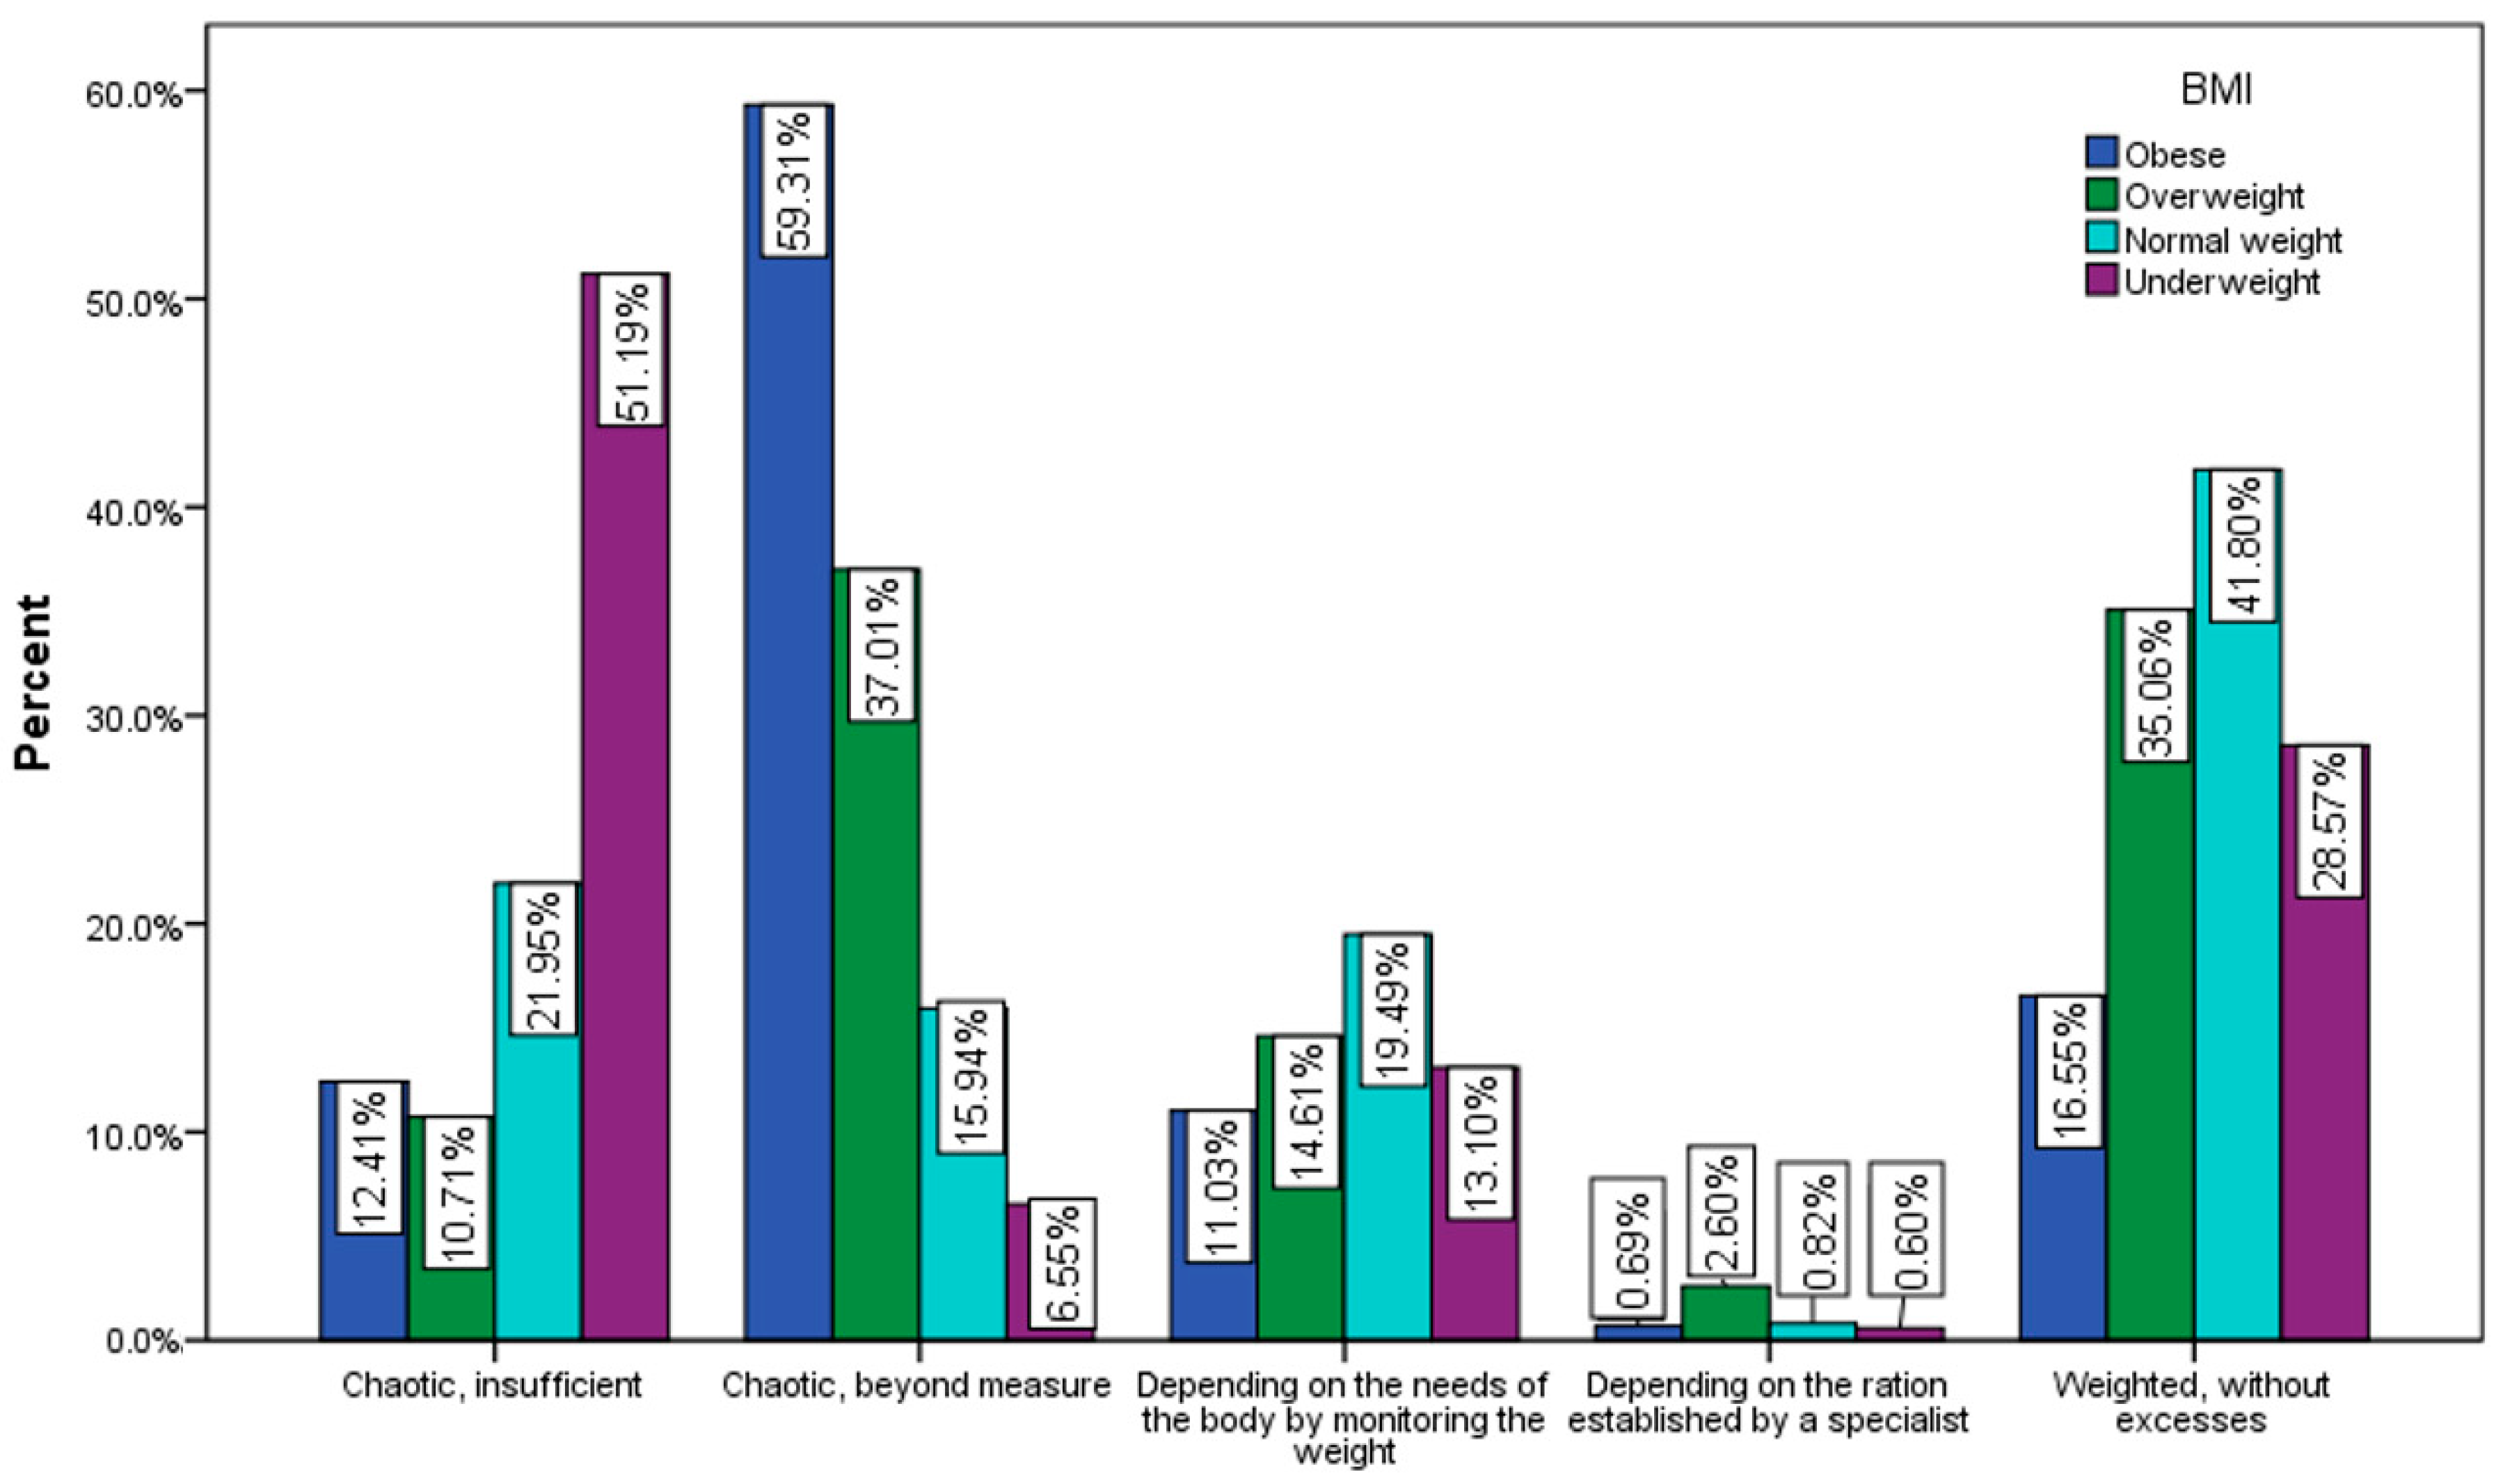
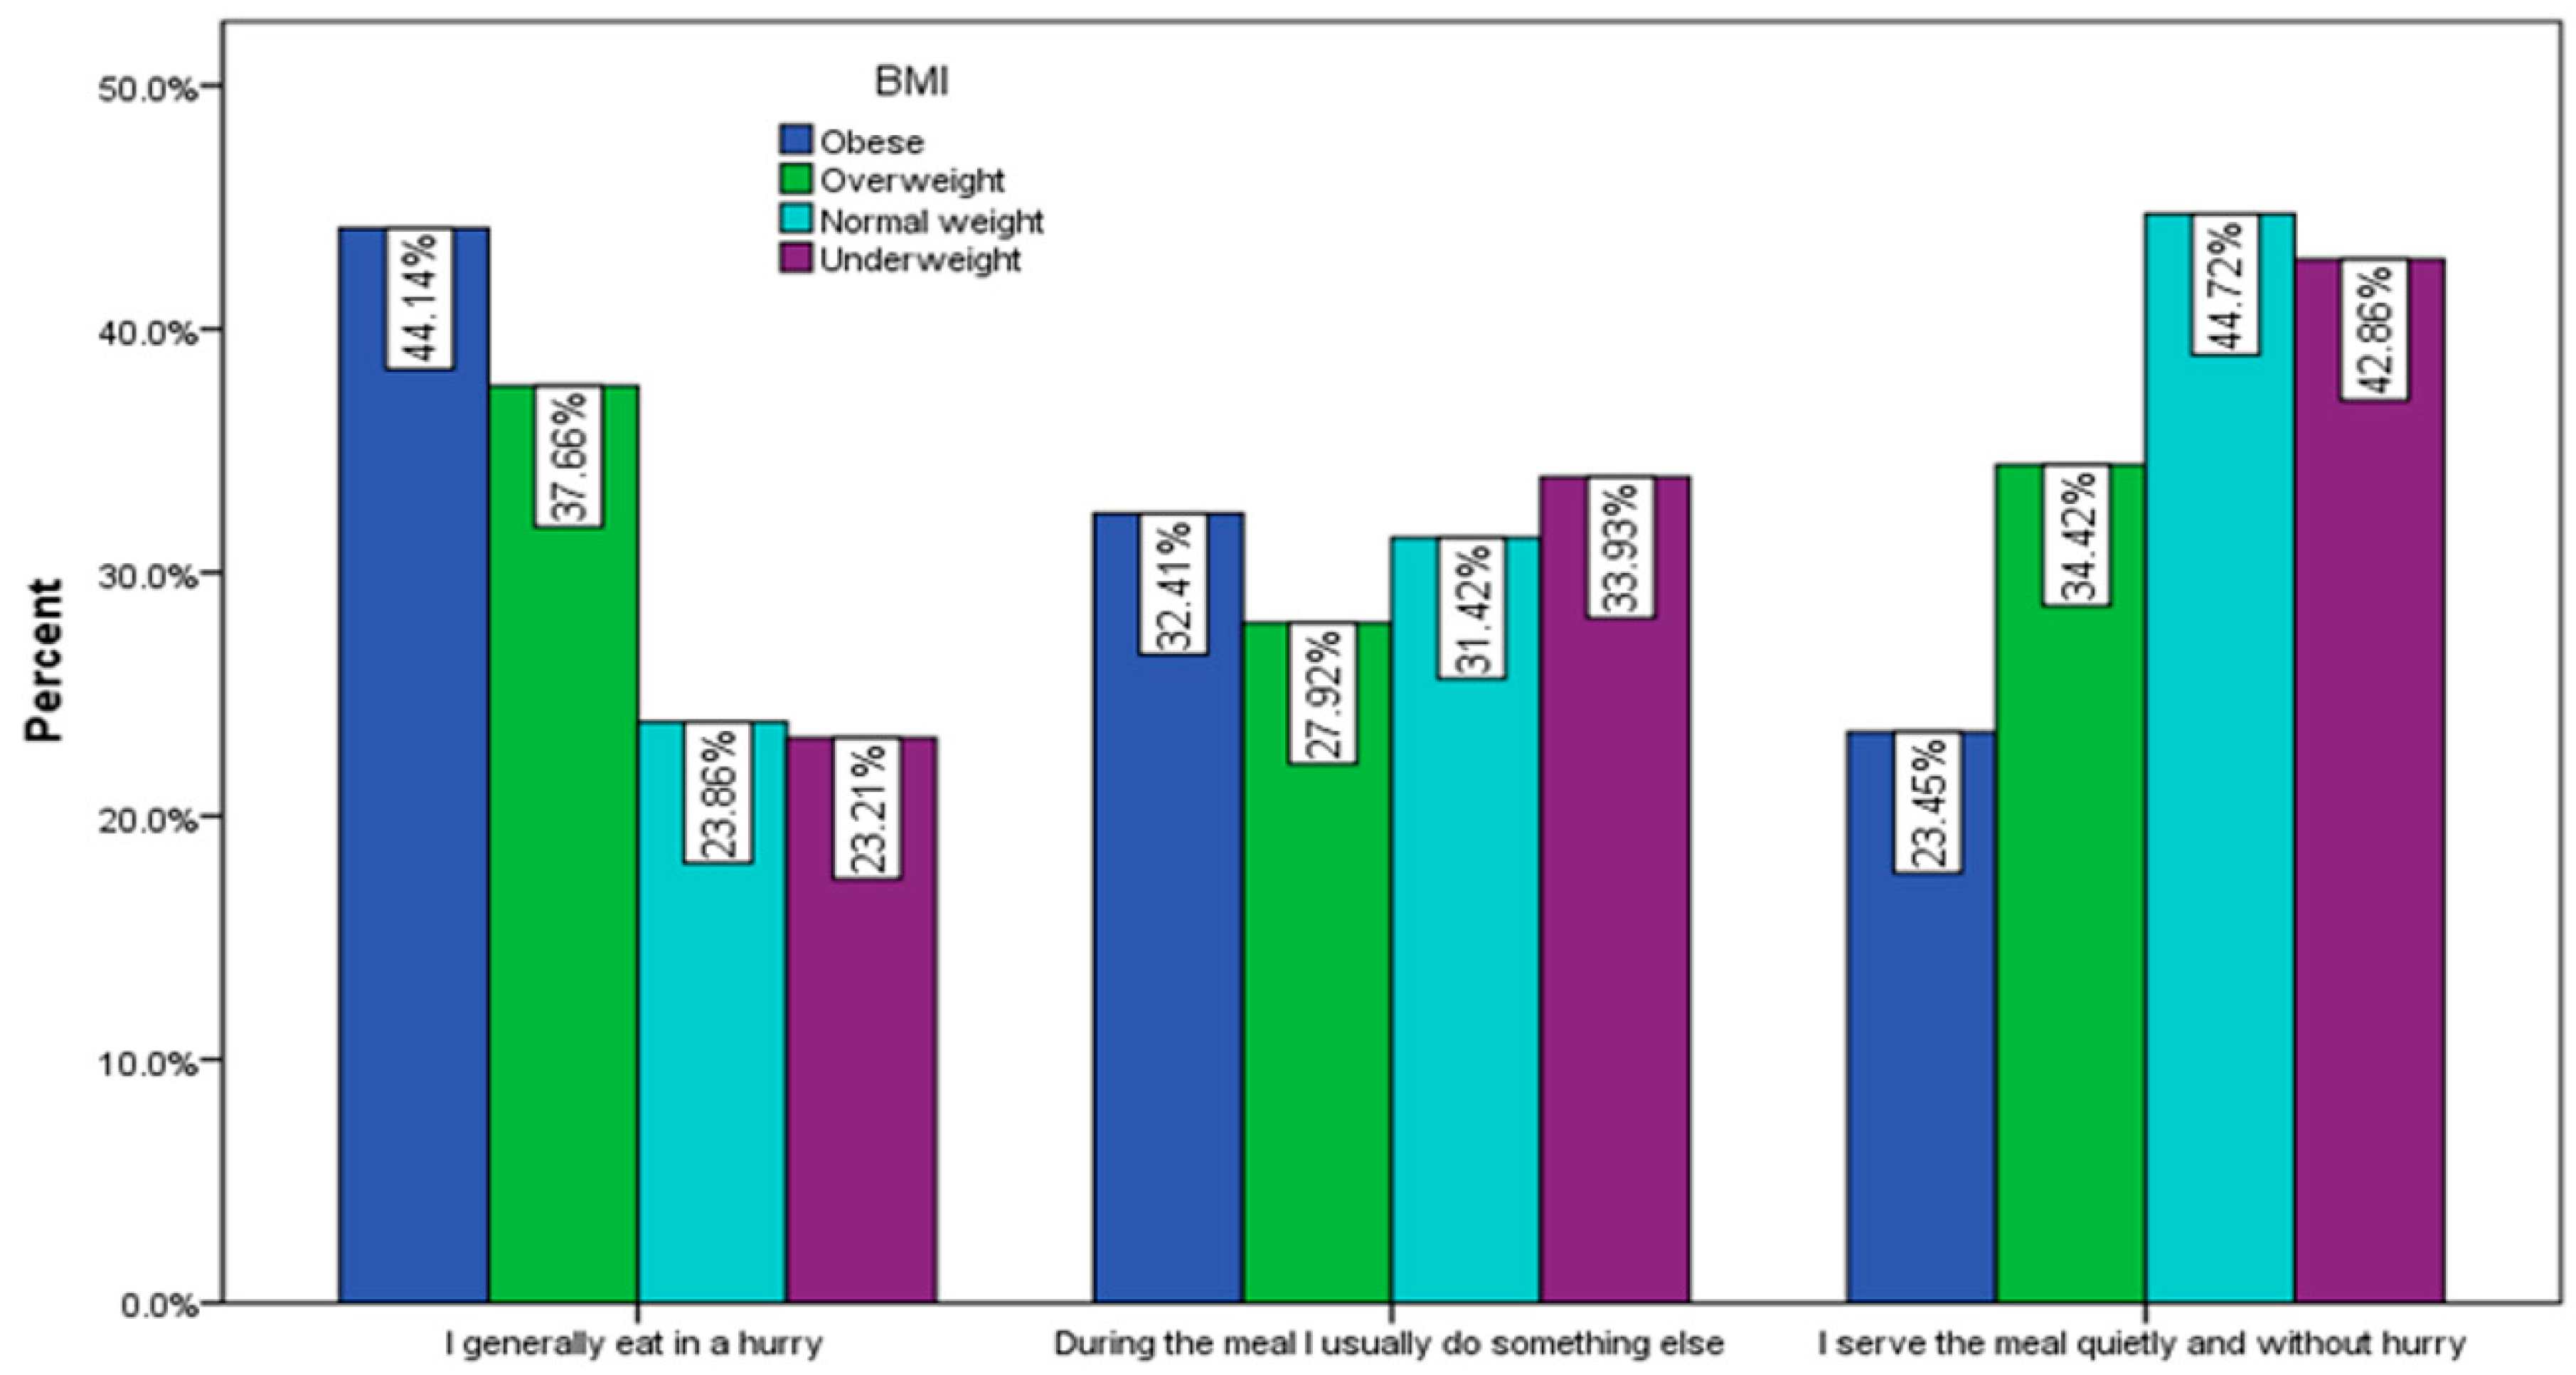
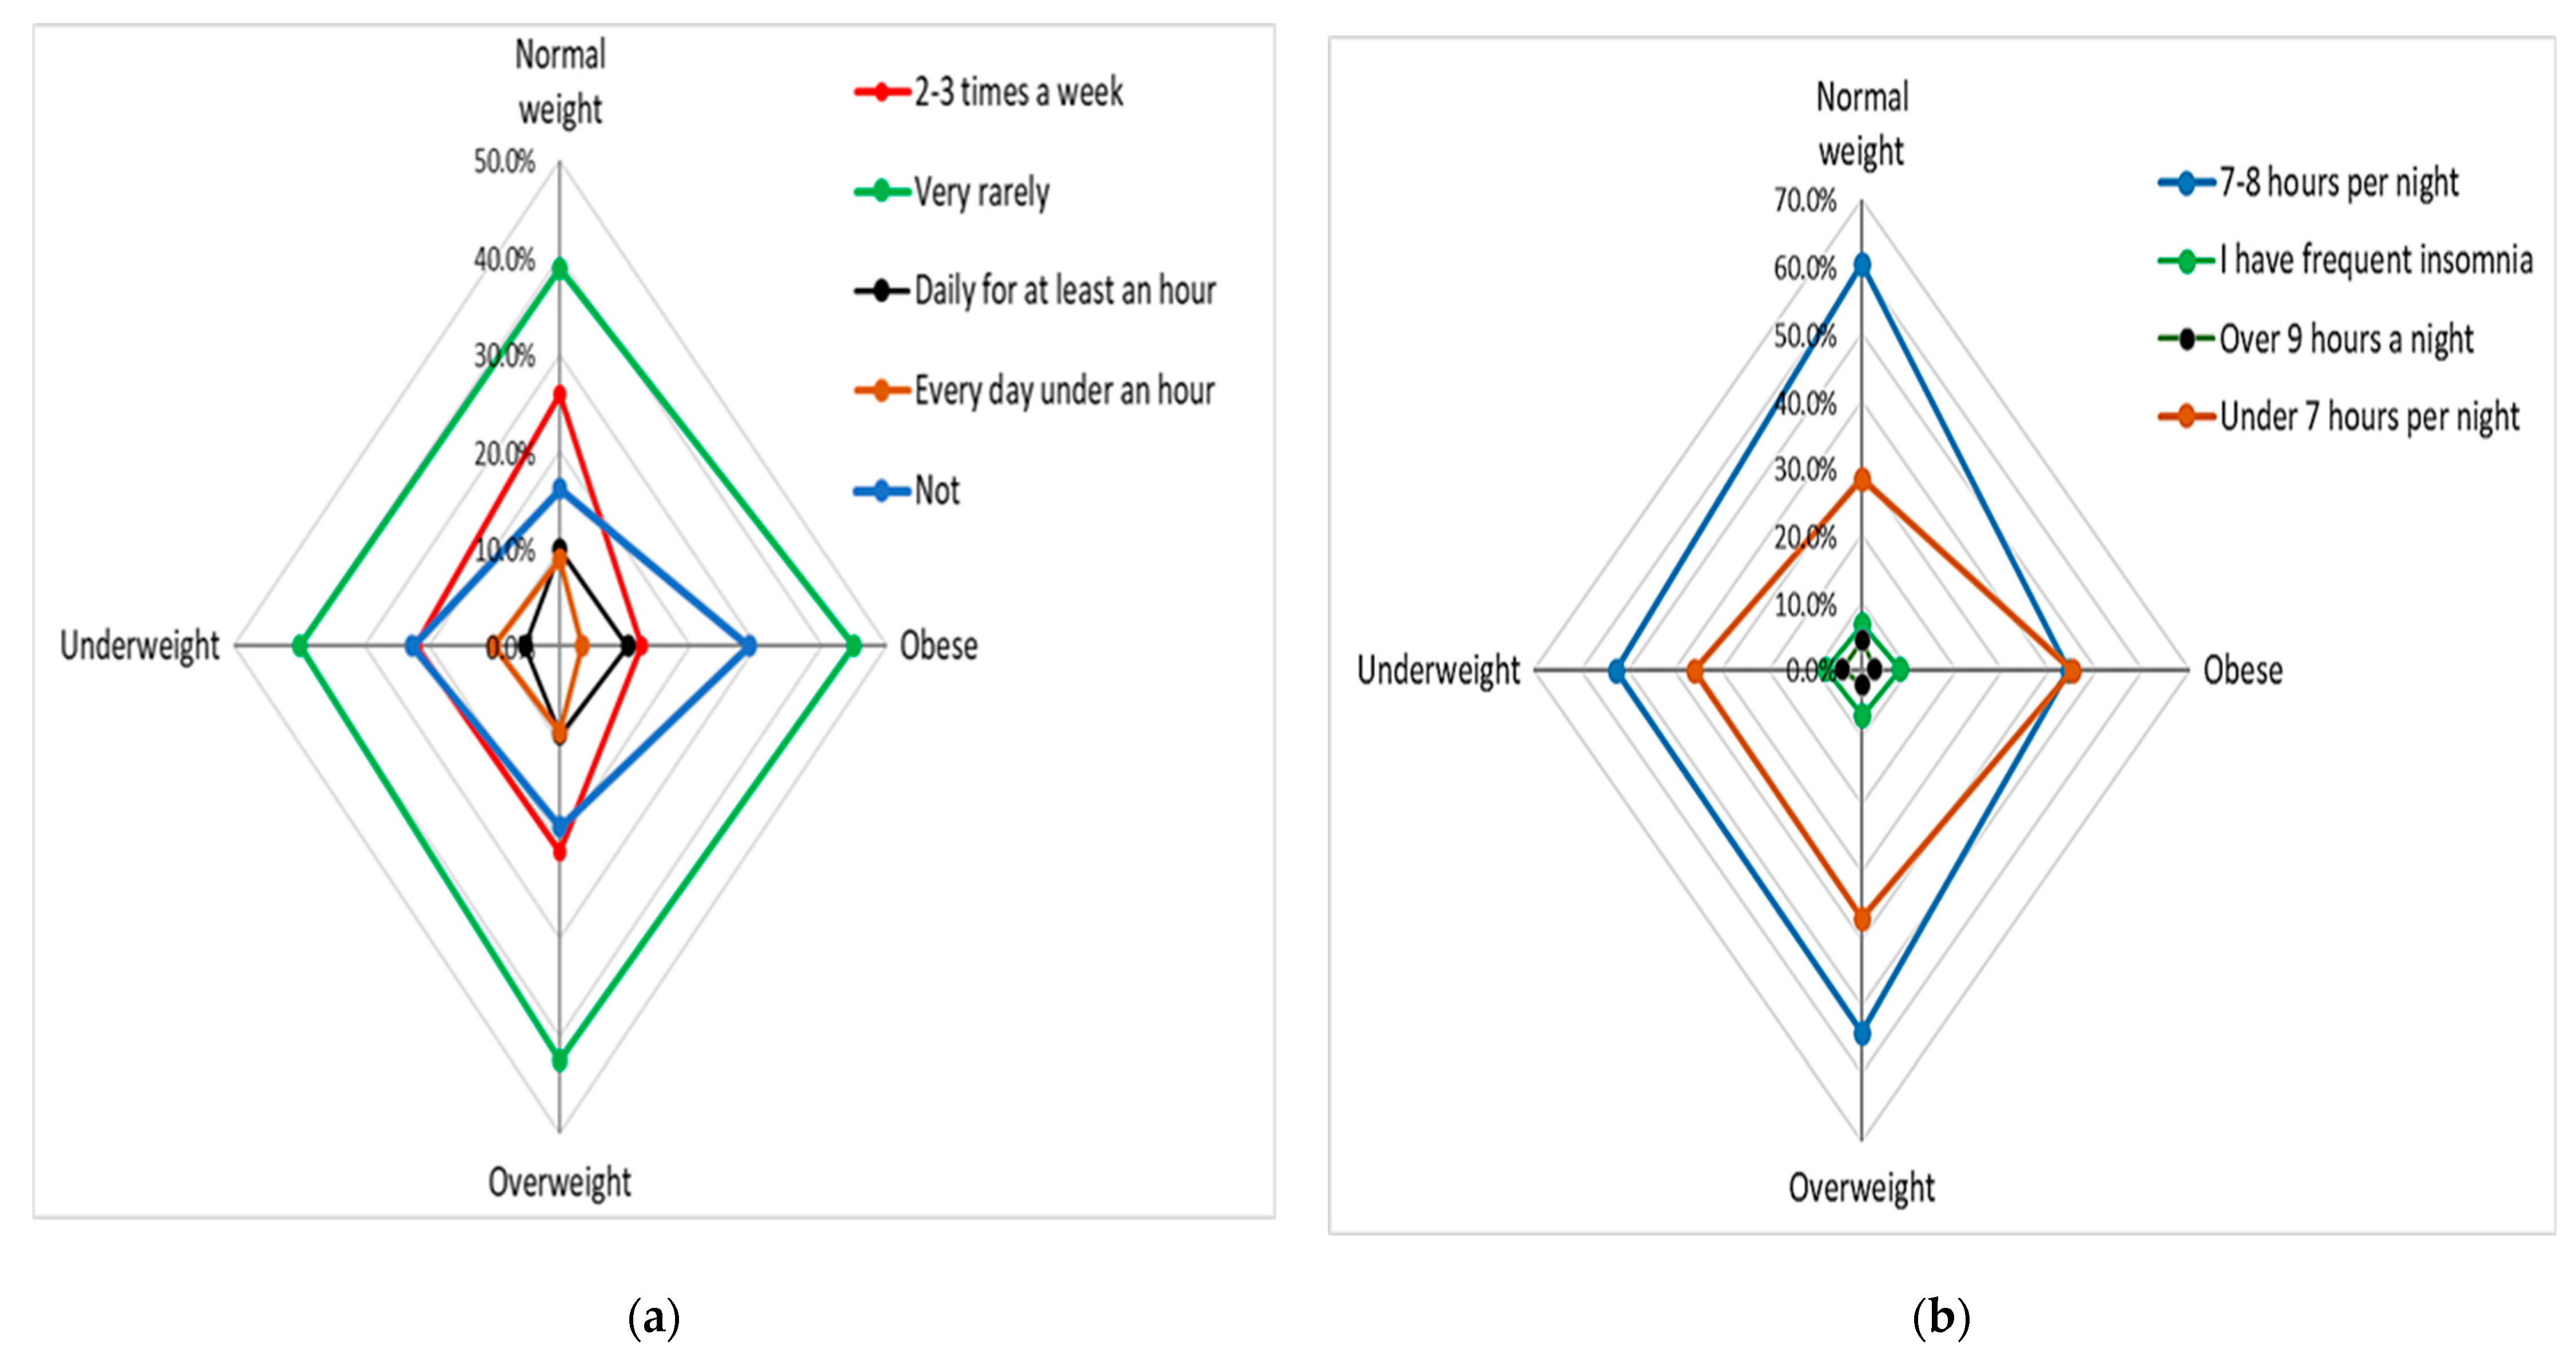
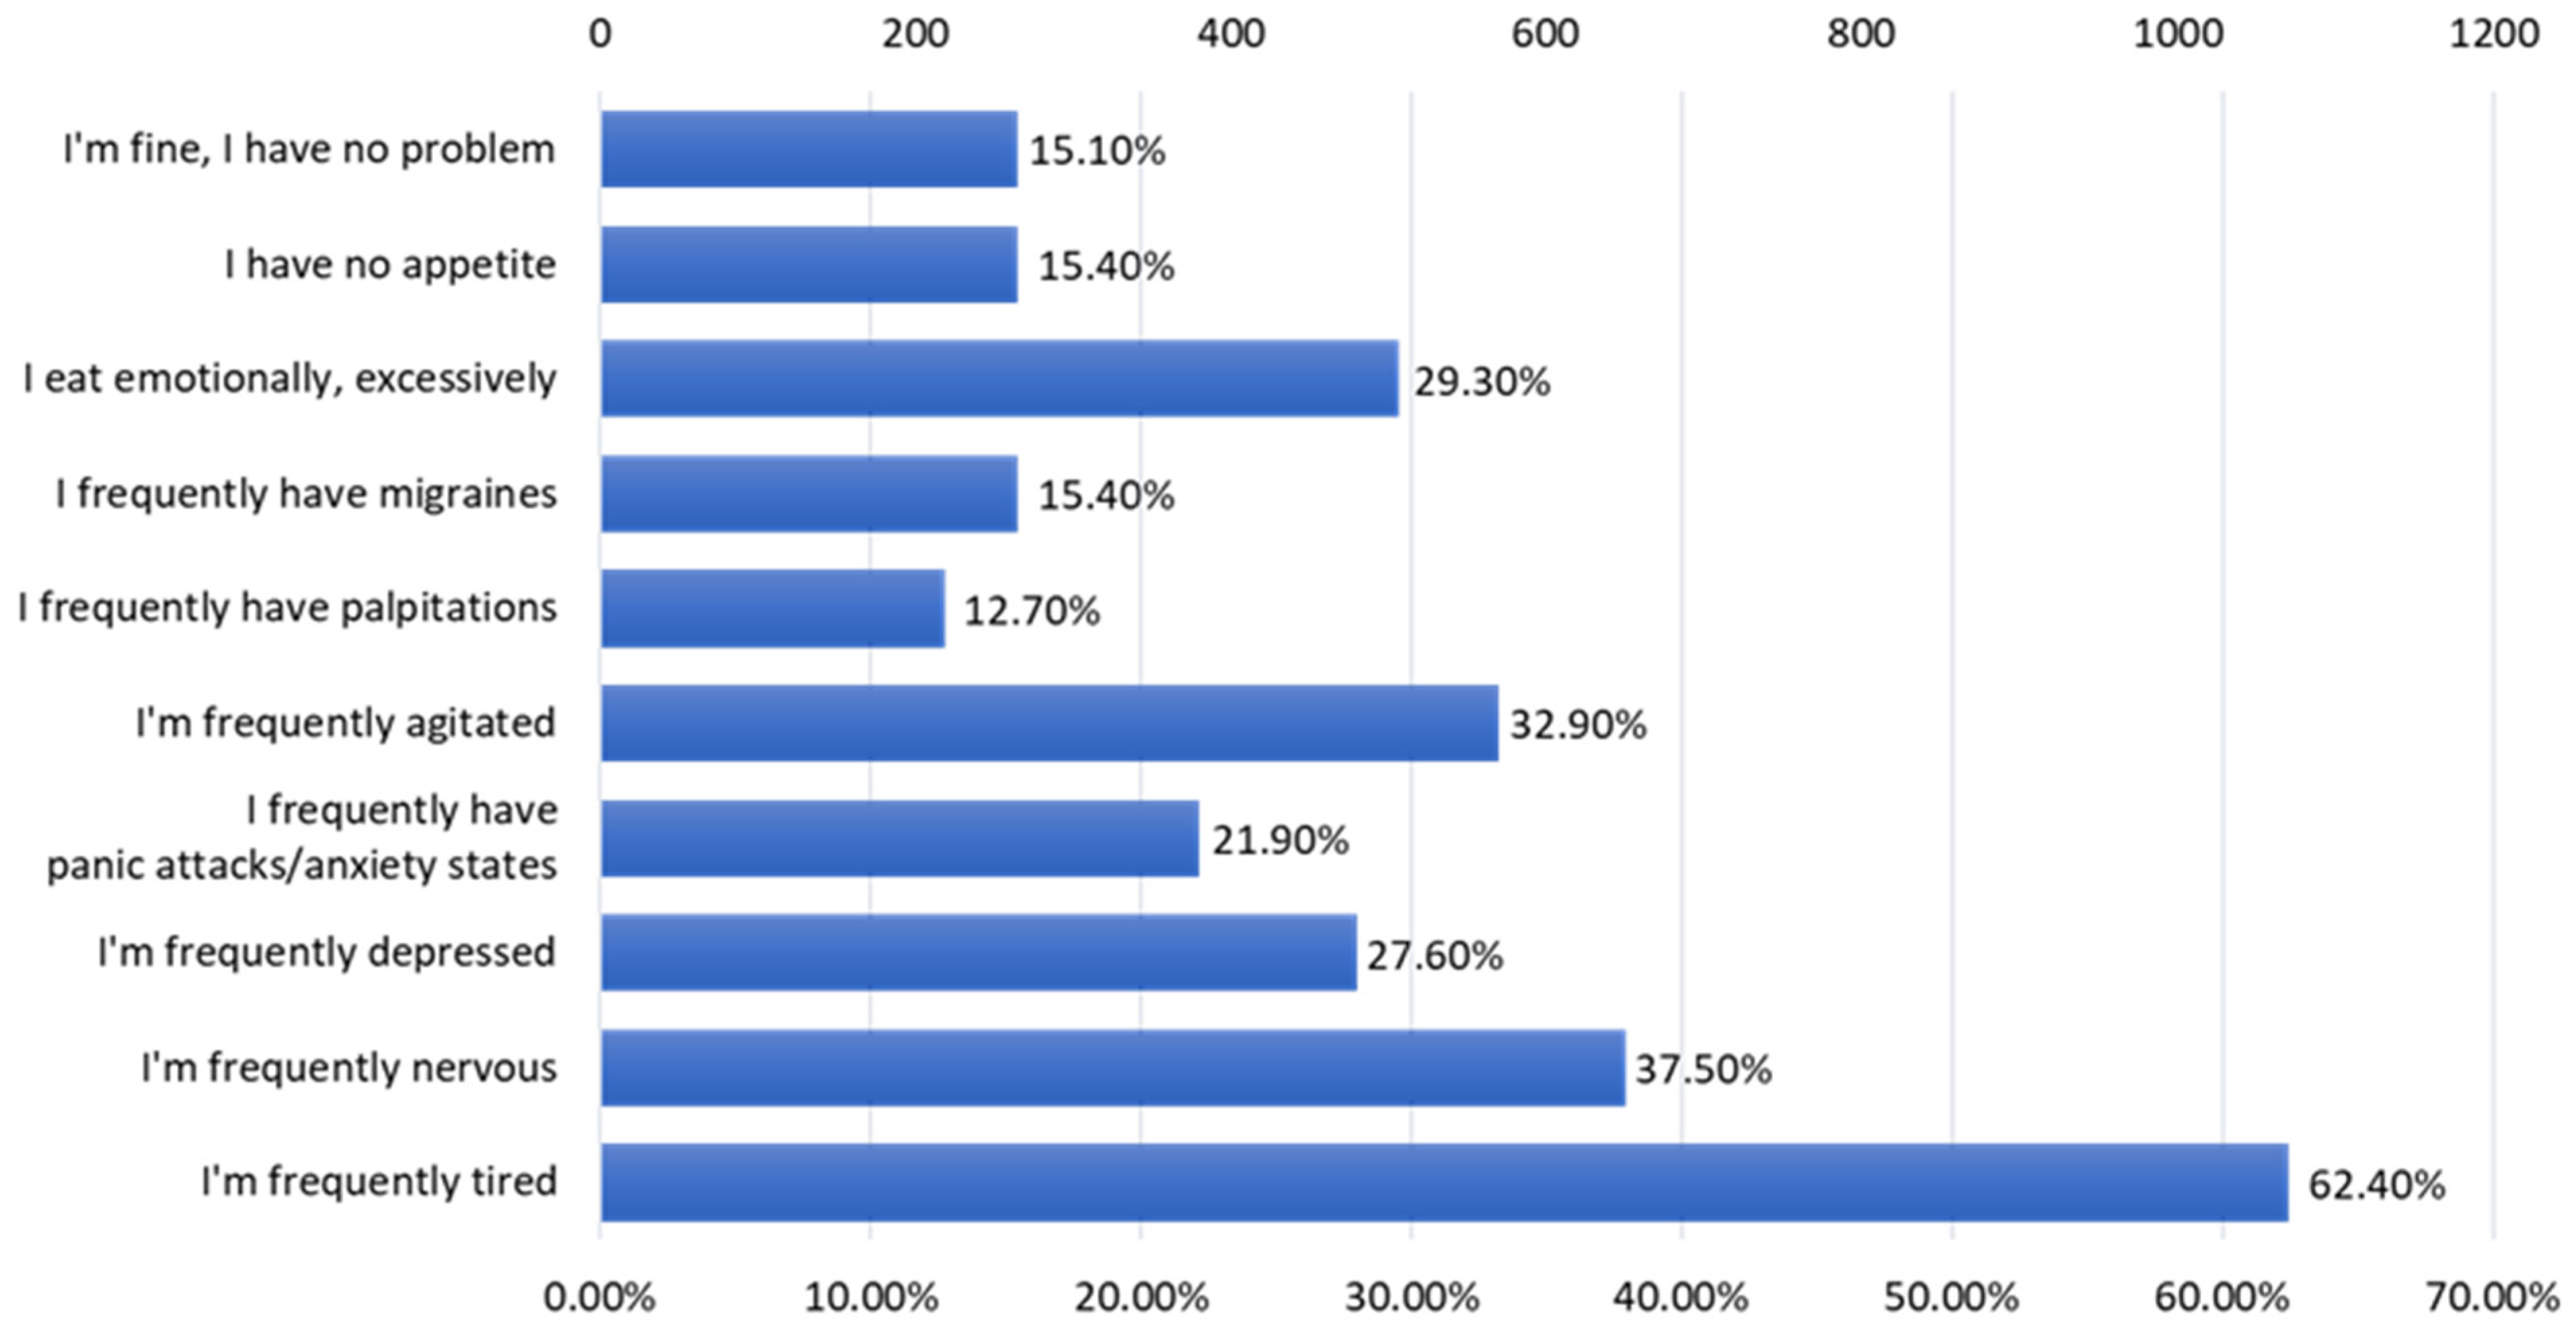
3.3. Adherence to Healthy Diet and Lifestyle Correlated with Junk Food Consumption
4. Discussion
5. Conclusions
Author Contributions
Funding
Institutional Review Board Statement
Informed Consent Statement
Data Availability Statement
Conflicts of Interest
References
- WHO. Protecting Children from Unhealthy Foods and Drinks. Available online: https://www.who.int/westernpacific/news/item/19-12-2016-protecting-children-from-unhealthy-foods-and-drinks (accessed on 11 August 2023).
- Singh, S.A.; Dhanasekaran, D.; Ganamurali, N.; Preethi, L.; Sabarathinam, S. Junk food-induced obesity- a growing threat to youngsters during the pandemic. Obes. Med. 2021, 26, 100364. [Google Scholar] [CrossRef]
- Rouhani, M.H.; Mirseifinezhad, M.; Omrani, N.; Esmaillzadeh, A.; Azadbakht, L. Fast Food Consumption, Quality of Diet, and Obesity among Isfahanian Adolescent Girls. J. Obes. 2012, 2012, 597924. [Google Scholar] [CrossRef]
- Zhu, Y.; Bo, Y.; Liu, Y. Dietary total fat, fatty acids intake, and risk of cardiovascular disease: A dose-response meta-analysis of cohort studies. Lipids Health Dis. 2019, 18, 91. [Google Scholar] [CrossRef] [PubMed]
- Chapman, C.L.; Grigoryan, T.; Vargas, N.T.; Reed, E.L.; Kueck, P.J.; Pietrafesa, L.D.; Bloomfield, A.C.; Johnson, B.D.; Schlader, Z.J. High-fructose corn syrup-sweetened soft drink consumption increases vascular resistance in the kidneys at rest and during sympathetic activation. Am. J. Physiol. Ren. Physiol. 2020, 318, F1053–F1065. [Google Scholar] [CrossRef] [PubMed]
- WHO. Alcohol. Available online: https://www.who.int/news-room/fact-sheets/detail/alcohol (accessed on 11 August 2023).
- European Commission-State of Health in the EU · România · Profilul de țară din 2021 în Ceea ce Privește Sănătatea. Available online: https://health.ec.europa.eu/system/files/2022-01/2021_chp_romania_romanian.pdf (accessed on 10 May 2023).
- Mititelu, M.; Nicolescu, T.O.; Ioniţă, C.A.; Nicolescu, F. Study of Heavy Metals and Organic Pollutants from Some Fishes of Danube River. J. Environ. Prot. Ecol. 2012, 13, 869–874. [Google Scholar]
- Mititelu, M.; Nicolescu, T.O.; Ioniţă, C.A.; Nicolescu, F. Heavy Metals Analisys in Some Wild Edible Mushrooms. J. Environ. Prot. Ecol. 2012, 13, 875–879. [Google Scholar]
- Slavin, J.L.; Lloyd, B. Health benefits of fruits and vegetables. Adv. Nutr. 2012, 3, 506–516. [Google Scholar] [CrossRef]
- Cena, H.; Calder, P.C. Defining a Healthy Diet: Evidence for The Role of Contemporary Dietary Patterns in Health and Disease. Nutrients 2020, 12, 334. [Google Scholar] [CrossRef]
- Muscaritoli, M. The Impact of Nutrients on Mental Health and Well-Being: Insights from the Literature. Front. Nutr. 2021, 8, 656290. [Google Scholar] [CrossRef]
- Munteanu, C.; Schwartz, B. The relationship between nutrition and the immune system. Front. Nutr. 2022, 9, 1082500. [Google Scholar] [CrossRef]
- Carreiro, A.L.; Dhillon, J.; Gordon, S.; Higgins, K.A.; Jacobs, A.G.; McArthur, B.M.; Redan, B.W.; Rivera, R.L.; Schmidt, L.R.; Mattes, R.D. The Macronutrients, Appetite, and Energy Intake. Annu. Rev. Nutr. 2016, 36, 73–103. [Google Scholar] [CrossRef] [PubMed]
- Savarino, G.; Corsello, A.; Corsello, G. Macronutrient balance and micronutrient amounts through growth and development. Ital. J. Pediatr. 2021, 47, 109. [Google Scholar] [CrossRef] [PubMed]
- Acheson, K.J. Diets for body weight control and health: The potential of changing the macronutrient composition. Eur. J. Clin. Nutr. 2013, 67, 462–466. [Google Scholar] [CrossRef] [PubMed]
- Warburton, D.E.; Nicol, C.W.; Bredin, S.S. Health benefits of physical activity: The evidence. Can. Med. Assoc. J. 2006, 174, 801–809. [Google Scholar] [CrossRef] [PubMed]
- U.S. Department of Agriculture; U.S. Department of Health and Human Services. Dietary Guidelines for Americans, 2010, 7th ed.; U.S. Government Printing Office: Washington, DC, USA, 2010. Available online: https://health.gov/sites/default/files/2020-01/DietaryGuidelines2010.pdf (accessed on 14 June 2023).
- Mititelu, M.; Ioniţă, A.C.; Moroşan, E. Research regarding integral processing of mussels from Black Sea. Farmacia 2014, 62, 625–632. [Google Scholar]
- Ioniţă, A.C.; Ghica, M.; Moroşan, E.; Nicolescu, F.; Mititelu, M. In vitro effects of some synthesized aminoacetanilide N’-substituted on human leukocytes separated from peripheral blood. Farmacia 2019, 67, 684–690. [Google Scholar] [CrossRef]
- Mititelu, M.; Stanciu, G.; Drăgănescu, D.; Ioniță, A.C.; Neacșu, S.M.; Dinu, M.; Stefanvan Staden, R.-I.; Moroșan, E. Mussel Shells, a Valuable Calcium Resource for the Pharmaceutical Industry. Mar. Drugs 2022, 20, 25. [Google Scholar] [CrossRef] [PubMed]
- Banerjee, A.; Mukherjee, S.; Maji, B.K. Worldwide flavor enhancer monosodium glutamate combined with high lipid diet provokes metabolic alterations and systemic anomalies: An overview. Toxicol. Rep. 2021, 8, 938–961. [Google Scholar] [CrossRef]
- Bhoge, N.Y. Junk food and human health: A synoptic review. Int. J. Theor. Appl. Sci. 2015, 7, 51–55. [Google Scholar]
- Bhaskar, R.; Ola, M. Junk food: Impact on health. J. Drug Deliv. Ther. 2012, 2, 67–73. [Google Scholar] [CrossRef]
- Schulte, E.M.; Avena, N.M.; Gearhardt, A.N. Which foods may be addictive? The roles of processing, fat content, and glycemic load. PLoS ONE 2015, 10, e0117959. [Google Scholar] [CrossRef] [PubMed]
- Moradi, S.; Hojjati Kermani, M.A.; Bagheri, R.; Mohammadi, H.; Jayedi, A.; Lane, M.M.; Asbaghi, O.; Mehrabani, S.; Suzuki, K. Ultra-Processed Food Consumption and Adult Diabetes Risk: A Systematic Review and Dose-Response Meta-Analysis. Nutrients 2021, 13, 4410. [Google Scholar] [CrossRef] [PubMed]
- Luiten, C.M.; Steenhuis, I.H.; Eyles, H.; Ni Mhurchu, C.; Waterlander, W.E. Ultra-processed foods have the worst nutrient profile, yet they are the most available packaged products in a sample of New Zealand supermarkets--CORRIGENDUM. Public Health Nutr. 2016, 19, 539. [Google Scholar] [CrossRef] [PubMed]
- Nardocci, M.; Polsky, J.Y.; Moubarac, J.C. Consumption of ultra-processed foods is associated with obesity, diabetes and hypertension in Canadian adults. Can. J. Public Health 2021, 112, 421–429. [Google Scholar] [CrossRef]
- Mehar, P.; Bera, R.; Swarnim, S.; Mishra, D. Composition of Common Junk Food Items and Their Contribution to the Dietary Requirement of Children and Adolescents. Indian Pediatr. 2023, 60, 221–223. [Google Scholar] [CrossRef] [PubMed]
- Hall, K.D.; Ayuketah, A.; Brychta, R.; Cai, H.; Cassimatis, T.; Chen, K.Y.; Chung, S.T.; Costa, E.; Courville, A.; Darcey, V.; et al. Ultra-Processed Diets Cause Excess Calorie Intake and Weight Gain: An Inpatient Randomized Controlled Trial of Ad Libitum Food Intake. Cell Metab. 2019, 30, 67–77.e3. [Google Scholar] [CrossRef] [PubMed]
- Poti, J.M.; Braga, B.; Qin, B. Ultra-processed Food Intake and Obesity: What Really Matters for Health-Processing or Nutrient Content? Curr. Obes. Rep. 2017, 6, 420–431. [Google Scholar] [CrossRef] [PubMed]
- Teo, P.S.; Lim, A.J.; Goh, A.T.; Janani, R.; Choy, J.Y.M.; McCrickerd, K.; Forde, C.G. Texture-based differences in eating rate influence energy intake for minimally processed and ultra-processed meals. Am. J. Clin. Nutr. 2022, 116, 244–254. [Google Scholar] [CrossRef]
- Lawshe, C.H. A quantitative approach to content validity. Pers. Psychol. 1975, 28, 563–575. [Google Scholar] [CrossRef]
- Yusoff, M.S.B. ABC of Content Validation and Content Validity Index Calculation. Educ. Med. J. 2019, 11, 49–54. [Google Scholar]
- Ioniță-Mîndrican, C.-B.; Mititelu, M.; Musuc, A.M.; Oprea, E.; Ziani, K.; Neacșu, S.M.; Grigore, N.D.; Negrei, C.; Dumi-trescu, D.-E.; Mireșan, H.; et al. Honey and Other Beekeeping Products Intake among the Romanian Population and Their Therapeutic Use. Appl. Sci. 2022, 12, 9649. [Google Scholar] [CrossRef]
- Năstăsescu, V.; Mititelu, M.; Stanciu, T.I.; Drăgănescu, D.; Grigore, N.D.; Udeanu, D.I.; Stanciu, G.; Neacșu, S.M.; Dinu-Pîrvu, C.E.; Oprea, E.; et al. Food Habits and Lifestyle of Romanians in the Context of the COVID-19 Pan-demic. Nutrients 2022, 14, 504. [Google Scholar] [CrossRef]
- Ionus, E.; Bucur, L.A.; Lupu, C.E.; Gird, C.E. Evaluation of the chemical composition of Ajuga Chamaepitys (L.) schreb. From the spontaneous flora of Romania. Farmacia 2021, 69, 461–466. [Google Scholar] [CrossRef]
- Leahu, A.; Lupu, E.C. Statistical simulation and prediction in software reliability. Analele Univ. Ovidius Constanta Ser. Mat. 2008, 16, 81–90. [Google Scholar]
- Suciu, F.; Stoicescu, I.; Lupu, E.C.; Musuc, A.M.; Popescu, A.; Mititelu, M.; Roșca, A.C.; Dumitrescu, D.-E.; Badea, F.C.; Caraiane, A.; et al. HPLC Analysis of Polyphenolic Compounds in Lysimachia nummularia L. and Comparative Determination of Antioxidant Capacity. Appl. Sci. 2023, 13, 2159. [Google Scholar] [CrossRef]
- Branca, F.; Nikogosian, H.; Lobstein, T. World Health Organization. Regional Office for Europe. In The Challenge of Obesity in the WHO European Region and the Strategies for Response; WHO Regional Office for Europe: Copenhagen, Denmark, 2007; ISBN 9789289014083. [Google Scholar]
- Ashwell, M.; Gibson, S. Waist-to-height ratio as an indicator of early health risk: Simpler and more predictive than us-ing a matrix based on BMI and waist circumference. BMJ Open 2016, 6, e010159. [Google Scholar] [CrossRef] [PubMed]
- Mititelu, M.; Stanciu, T.I.; Udeanu, D.I.; Popa, D.E.; Drăgănescu, D.; Cobelschi, C.; Grigore, N.D.; Pop, A.L.; Ghica, M. The impact of COVID-19 lockdown on the lifestyle and dietary patterns among romanian population. Farmacia 2021, 1, 1–11. [Google Scholar] [CrossRef]
- Bohara, S.S.; Thapa, K.; Bhatt, L.D.; Dhami, S.S.; Wagle, S. Determinants of Junk Food Consumption Among Adolescents in Pokhara Valley, Nepal. Front. Nutr. 2021, 8, 644650. [Google Scholar] [CrossRef]
- Man, C.S.; Hock, L.K.; Ying, C.Y.; Cheong, K.C.; Kuay, L.K.; Huey, T.C.; Baharudin, A.; Abdul Aziz, N.S. Is fast-food consumption a problem among adolescents in Malaysia? An analysis of the National School-Based Nutrition Survey, 2012. J. Health Popul Nutr. 2021, 40, 31. [Google Scholar] [CrossRef]
- Liu, J.; Lee, Y.; Micha, R.; Li, Y.; Mozaffarian, D. Trends in junk food consumption among US children and adults, 2001–2018. Am. J. Clin. Nutr. 2021, 114, 1039–1048. [Google Scholar] [CrossRef]
- Vasiliu, O. Current Status of Evidence for a New Diagnosis: Food Addiction-A Literature Review. Front. Psychiatry 2022, 12, 824936. [Google Scholar] [CrossRef]
- Lustig, R.H. Ultraprocessed Food: Addictive, Toxic, and Ready for Regulation. Nutrients 2020, 12, 3401. [Google Scholar] [CrossRef] [PubMed]
- Carter, A.; Hendrikse, J.; Lee, N.; Yücel, M.; Verdejo-Garcia, A.; Andrews, Z.B.; Hall, W. The Neurobiology of “Food Addiction” and Its Implications for Obesity Treatment and Policy. Annu. Rev. Nutr. 2016, 36, 105–128. [Google Scholar] [CrossRef] [PubMed]
- Gearhardt, A.N.; Schulte, E.M. Is Food Addictive? A Review of the Science. Annu. Rev. Nutr. 2021, 41, 387–410. [Google Scholar] [CrossRef] [PubMed]
- Volkow, N.D.; Wang, G.J.; Tomasi, D.; Baler, R.D. Obesity and addiction: Neurobiological overlaps. Obes. Rev. 2013, 14, 2–18. [Google Scholar] [CrossRef]
- Zeidan, W.; Taweel, H.; Shalash, A.; Husseini, A. Consumption of fruits and vegetables among adolescents in Arab Countries: A systematic review. Int. J. Behav. Nutr. Phys. Act. 2023, 20, 3. [Google Scholar] [CrossRef]
- Abdel-Megeid, F.Y.; Abdelkarem, H.M.; El-Fetouh, A.M. Unhealthy nutritional habits in university students are a risk factor for cardiovascular diseases. Saudi Med. J. 2011, 32, 621–627. [Google Scholar]
- Rodrigues, V.M.; Bray, J.; Fernandes, A.C.; Bernardo, G.L.; Hartwell, H.; Martinelli, S.S.; Uggioni, P.L.; Cavalli, S.B.; Proenca, R.P.D.C. Vegetable consumption and factors associated with increased intake among college students: A scoping review of the last 10 years. Nutrients 2019, 11, 1634. [Google Scholar] [CrossRef]
- Chung, L.M.Y.; Fong, S.S.M.; Law, Q.P.S. Younger Adults Are More Likely to Increase Fruit and Vegetable Consumption and Decrease Sugar Intake with the Application of Dietary Monitoring. Nutrients 2021, 13, 333. [Google Scholar] [CrossRef]
- Chung, L.M.Y.; Fong, S.S.M. Appearance alteration of fruits and vegetables to increase their appeal to and consumption by school-age children: A pilot study. Health Psychol. Open. 2018, 5, 2055102918802679. [Google Scholar] [CrossRef]
- Wallace, T.C.; Bailey, R.L.; Blumberg, J.B.; Burton-Freeman, B.; Chen, C.-Y.O.; Crowe-White, K.M.; Drewnowski, A.; Hooshmand, S.; Johnson, E.; Lewis, R.; et al. Fruits, vegetables, and health: A comprehensive narrative, umbrella review of the science and recommendations for enhanced public policy to improve intake. Crit. Rev. Food Sci. Nutr. 2020, 60, 2174–2211. [Google Scholar] [CrossRef] [PubMed]
- Tarantino, G.; Cataldi, M.; Citro, V. Could Alcohol Abuse and Dependence on Junk Foods Inducing Obesity and/or Illicit Drug Use Represent Danger to Liver in Young People with Altered Psychological/Relational Spheres or Emotional Problems? Int. J. Mol. Sci. 2022, 23, 10406. [Google Scholar] [CrossRef]
- Fuhrman, J. The Hidden Dangers of Fast and Processed Food. Am. J. Lifestyle Med. 2018, 12, 375–381. [Google Scholar] [CrossRef] [PubMed]
- Mesas, A.E.; Girotto, E.; Rodrigues, R.; Martínez-Vizcaíno, V.; Jiménez-López, E.; López-Gil, J.F. Ultra-Processed Food Consumption is Associated with Alcoholic Beverage Drinking, Tobacco Smoking, and Illicit Drug Use in Adolescents: A Nationwide Population-Based Study. Int. J. Ment. Health Addict. 2023, 1557–1882. [Google Scholar] [CrossRef]
- Amadieu, C.; Leclercq, S.; Coste, V.; Thijssen, V.; Neyrinck, A.M.; Bindels, L.B.; Cani, P.D.; Piessevaux, H.; Stärkel, P.; de Timary, P.; et al. Dietary fiber deficiency as a component of malnutrition associated with psychological alterations in alcohol use disorder. Clin. Nutr. 2021, 40, 2673–2682. [Google Scholar] [CrossRef] [PubMed]


| Total Population n (%) | Male n (%) | Female n (%) | |
|---|---|---|---|
| 1754 (100) | 327 (18.6) | 1424 (81.4) | |
| Age (years) | p < 0.0214 | ||
| 18–23 | 826 (48.1) | 204 (54.7) | 622 (46.2) |
| 24–35 | 501 (29.1) | 94 (25.2) | 407 (30.2) |
| 36–45 | 212 (12.3) | 36 (9.7) | 176 (13.1) |
| >45 | 180 (10.5) | 39 (10.4) | 141 (10.5) |
| Residence area | p = 0.5139 | ||
| Urban area | 1390 (80.9) | 306 (82.04) | 1084 (80.5) |
| Rural area | 329 (19.1) | 67 (17.96) | 262 (19.5) |
| Level of education | p = 0.0008 | ||
| General/primary studies | 89 (5.2) | 32 (8.6) | 57 (4.2) |
| Secondary education (baccalaureate degree) | 712 (41.4) | 172 (46.1) | 540 (40.1) |
| Post-secondary studies | 112 (6.5) | 21 (5.6) | 91 (6.8) |
| Higher education (bachelor’s degree) | 482 (28) | 88 (23.6) | 394 (29.3) |
| Postgraduate studies (master’s degree, residency, doctorate, other specializations) | 324 (18.9) | 60 (16.1) | 264 (19.6) |
| Employment status | p = 0.0003 | ||
| Unemployed | 19 (1.1) | 9 (2.4) | 10 (0.7) |
| Socially assisted | 6 (0.3) | 4 (1.1) | 2 (0.1) |
| Householder | 30 (1.7) | 3 (0.8) | 27 (2) |
| Retired | 16 (0.9) | 7 (1.9) | 9 (0.7) |
| Student | 1066 (62) | 242 (64.9) | 824 (61.2) |
| Teleworking | 27 (1.6) | 5 (1.3) | 22 (1.6) |
| I go to work every day | 488 (28.4) | 86 (23.1) | 402 (29.9) |
| I work in a mixed regime (telework and commuting) | 67 (3.9) | 17 (4.6) | 50 (3.7) |
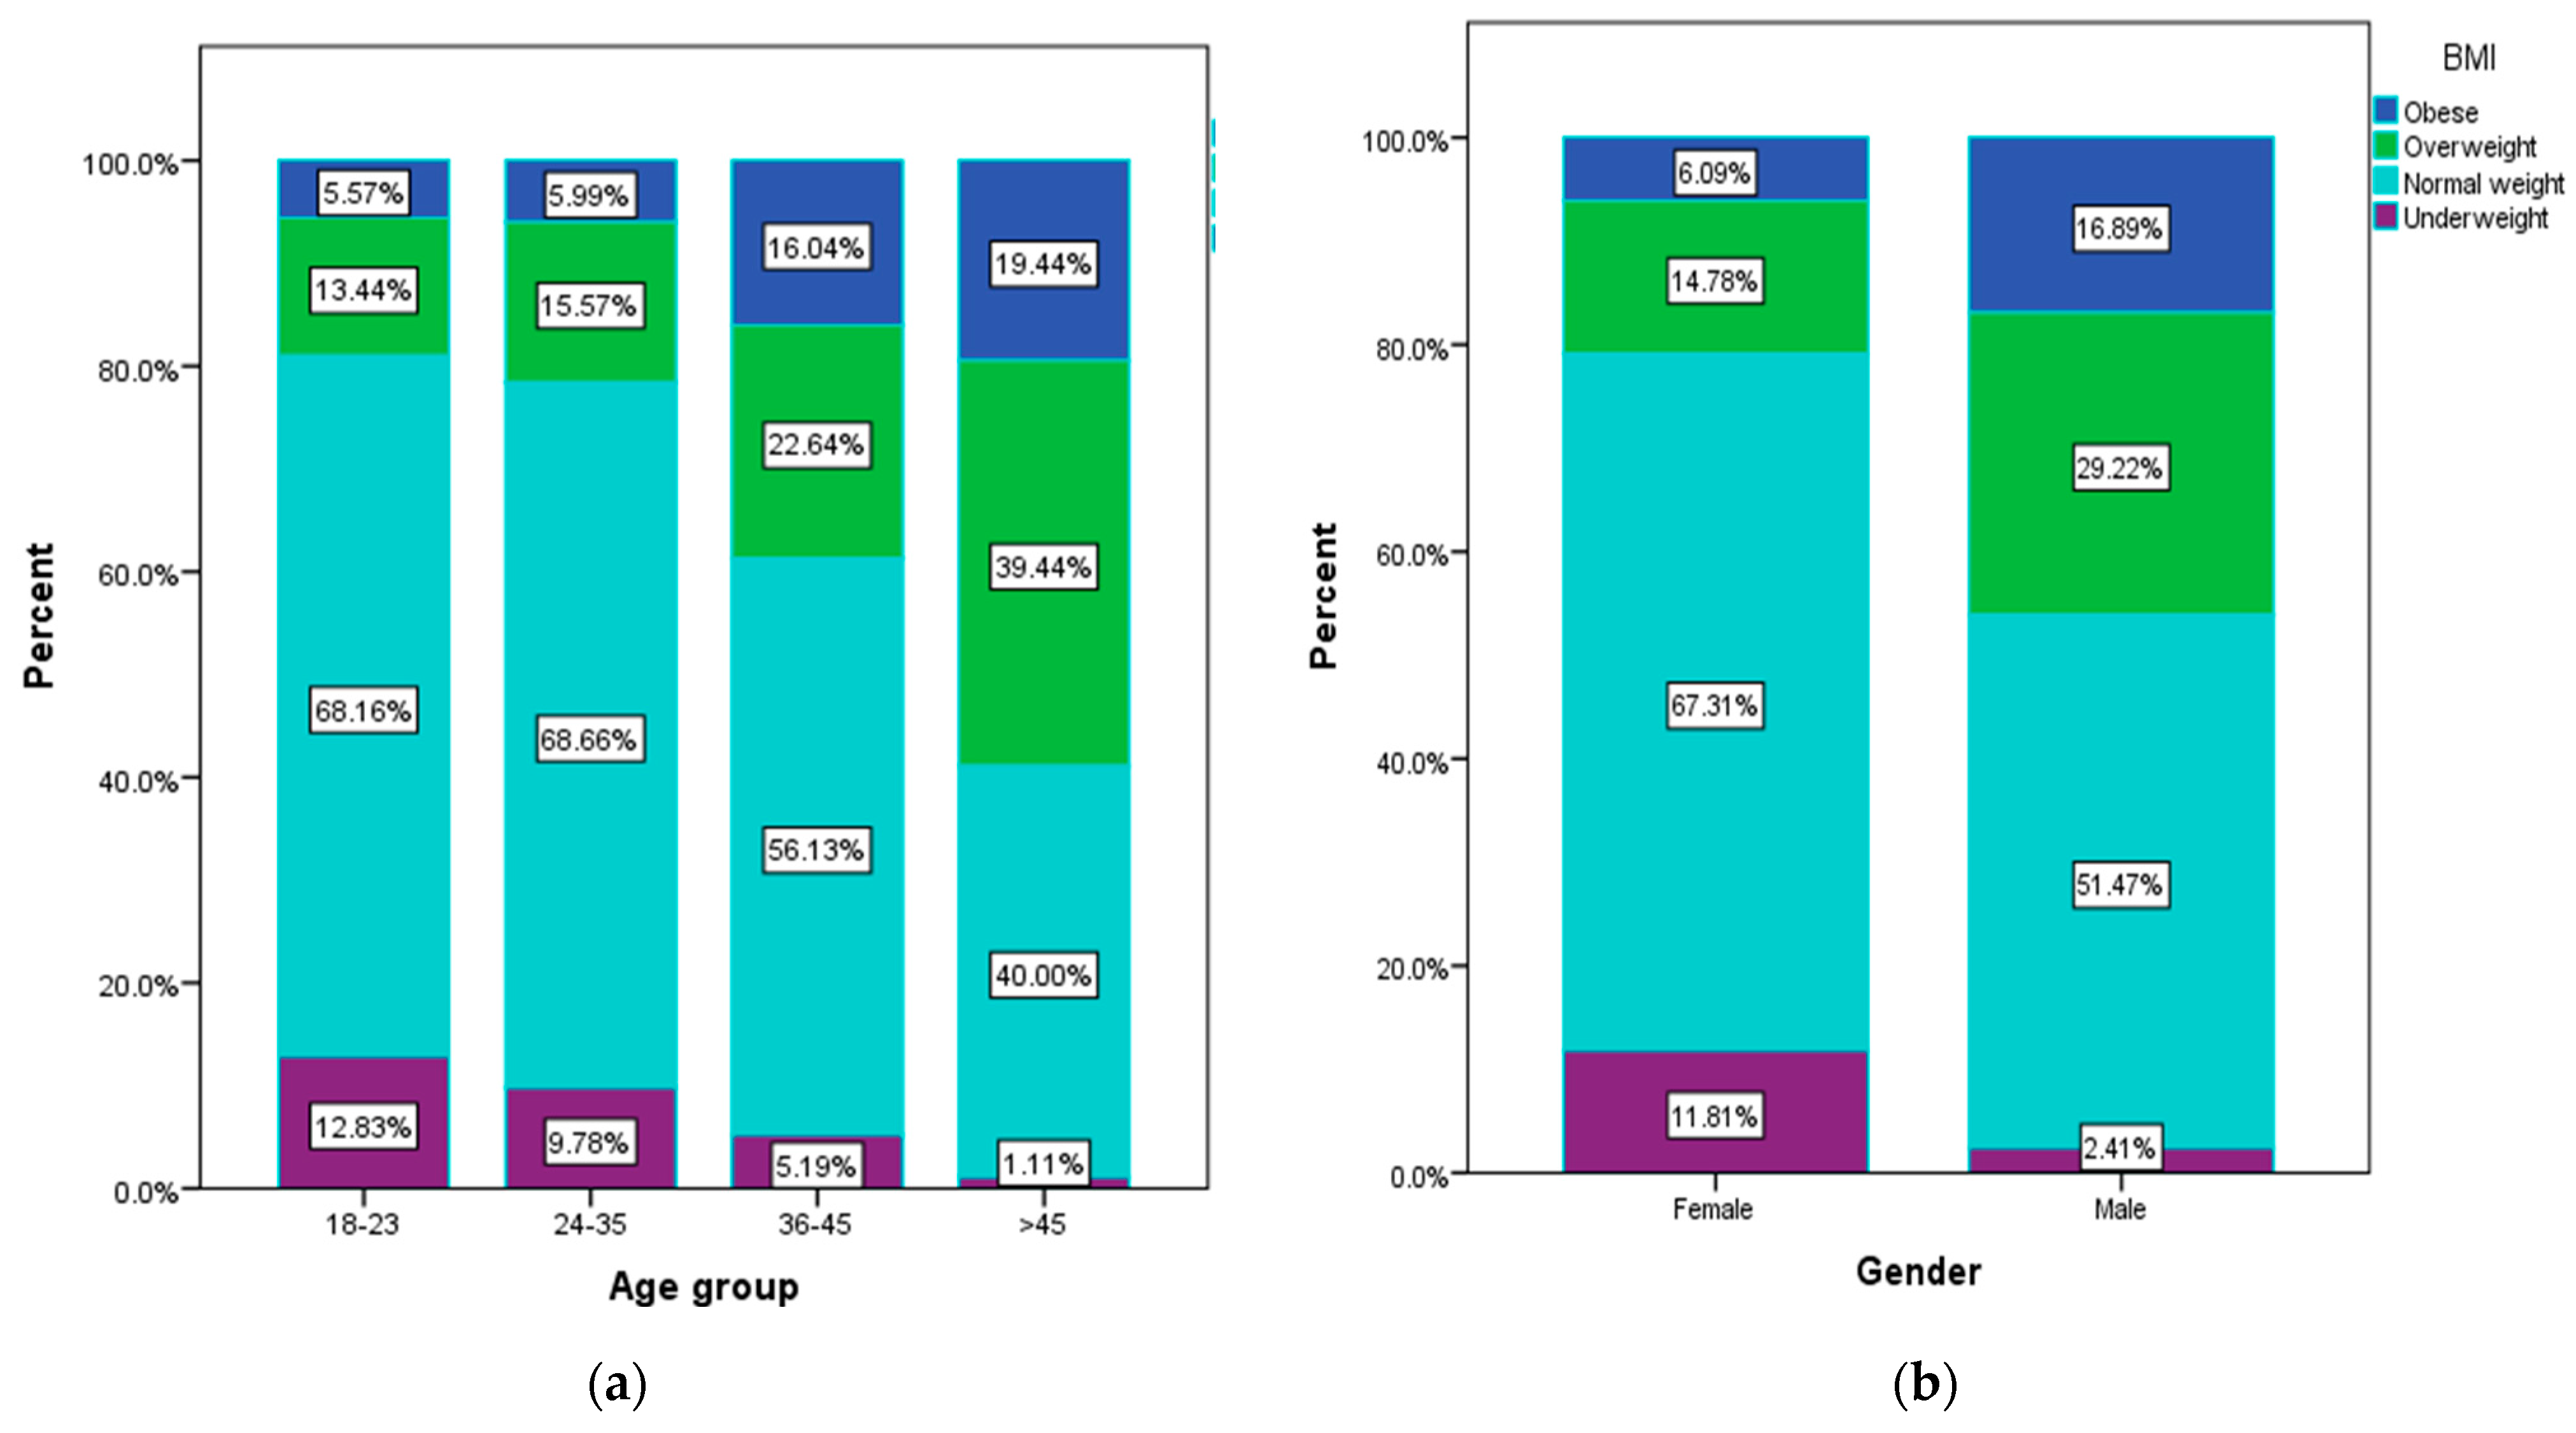
| Body mass index (BMI) | p < 0.0001 | ||
| Within normal limits (18.5–24.9) | 1098 (63.8) | 192 (51.5) | 906 (67.3) |
| Overweight category (25–29.9) | 308 (18) | 109 (29.2) | 199 (14.8) |
| Underweight category (<18.5) | 168 (9.8) | 9 (2.41) | 159 (11.8) |
| Obese (≥30) | 145 (8.4) | 63 (16.9) | 82 (6.1) |
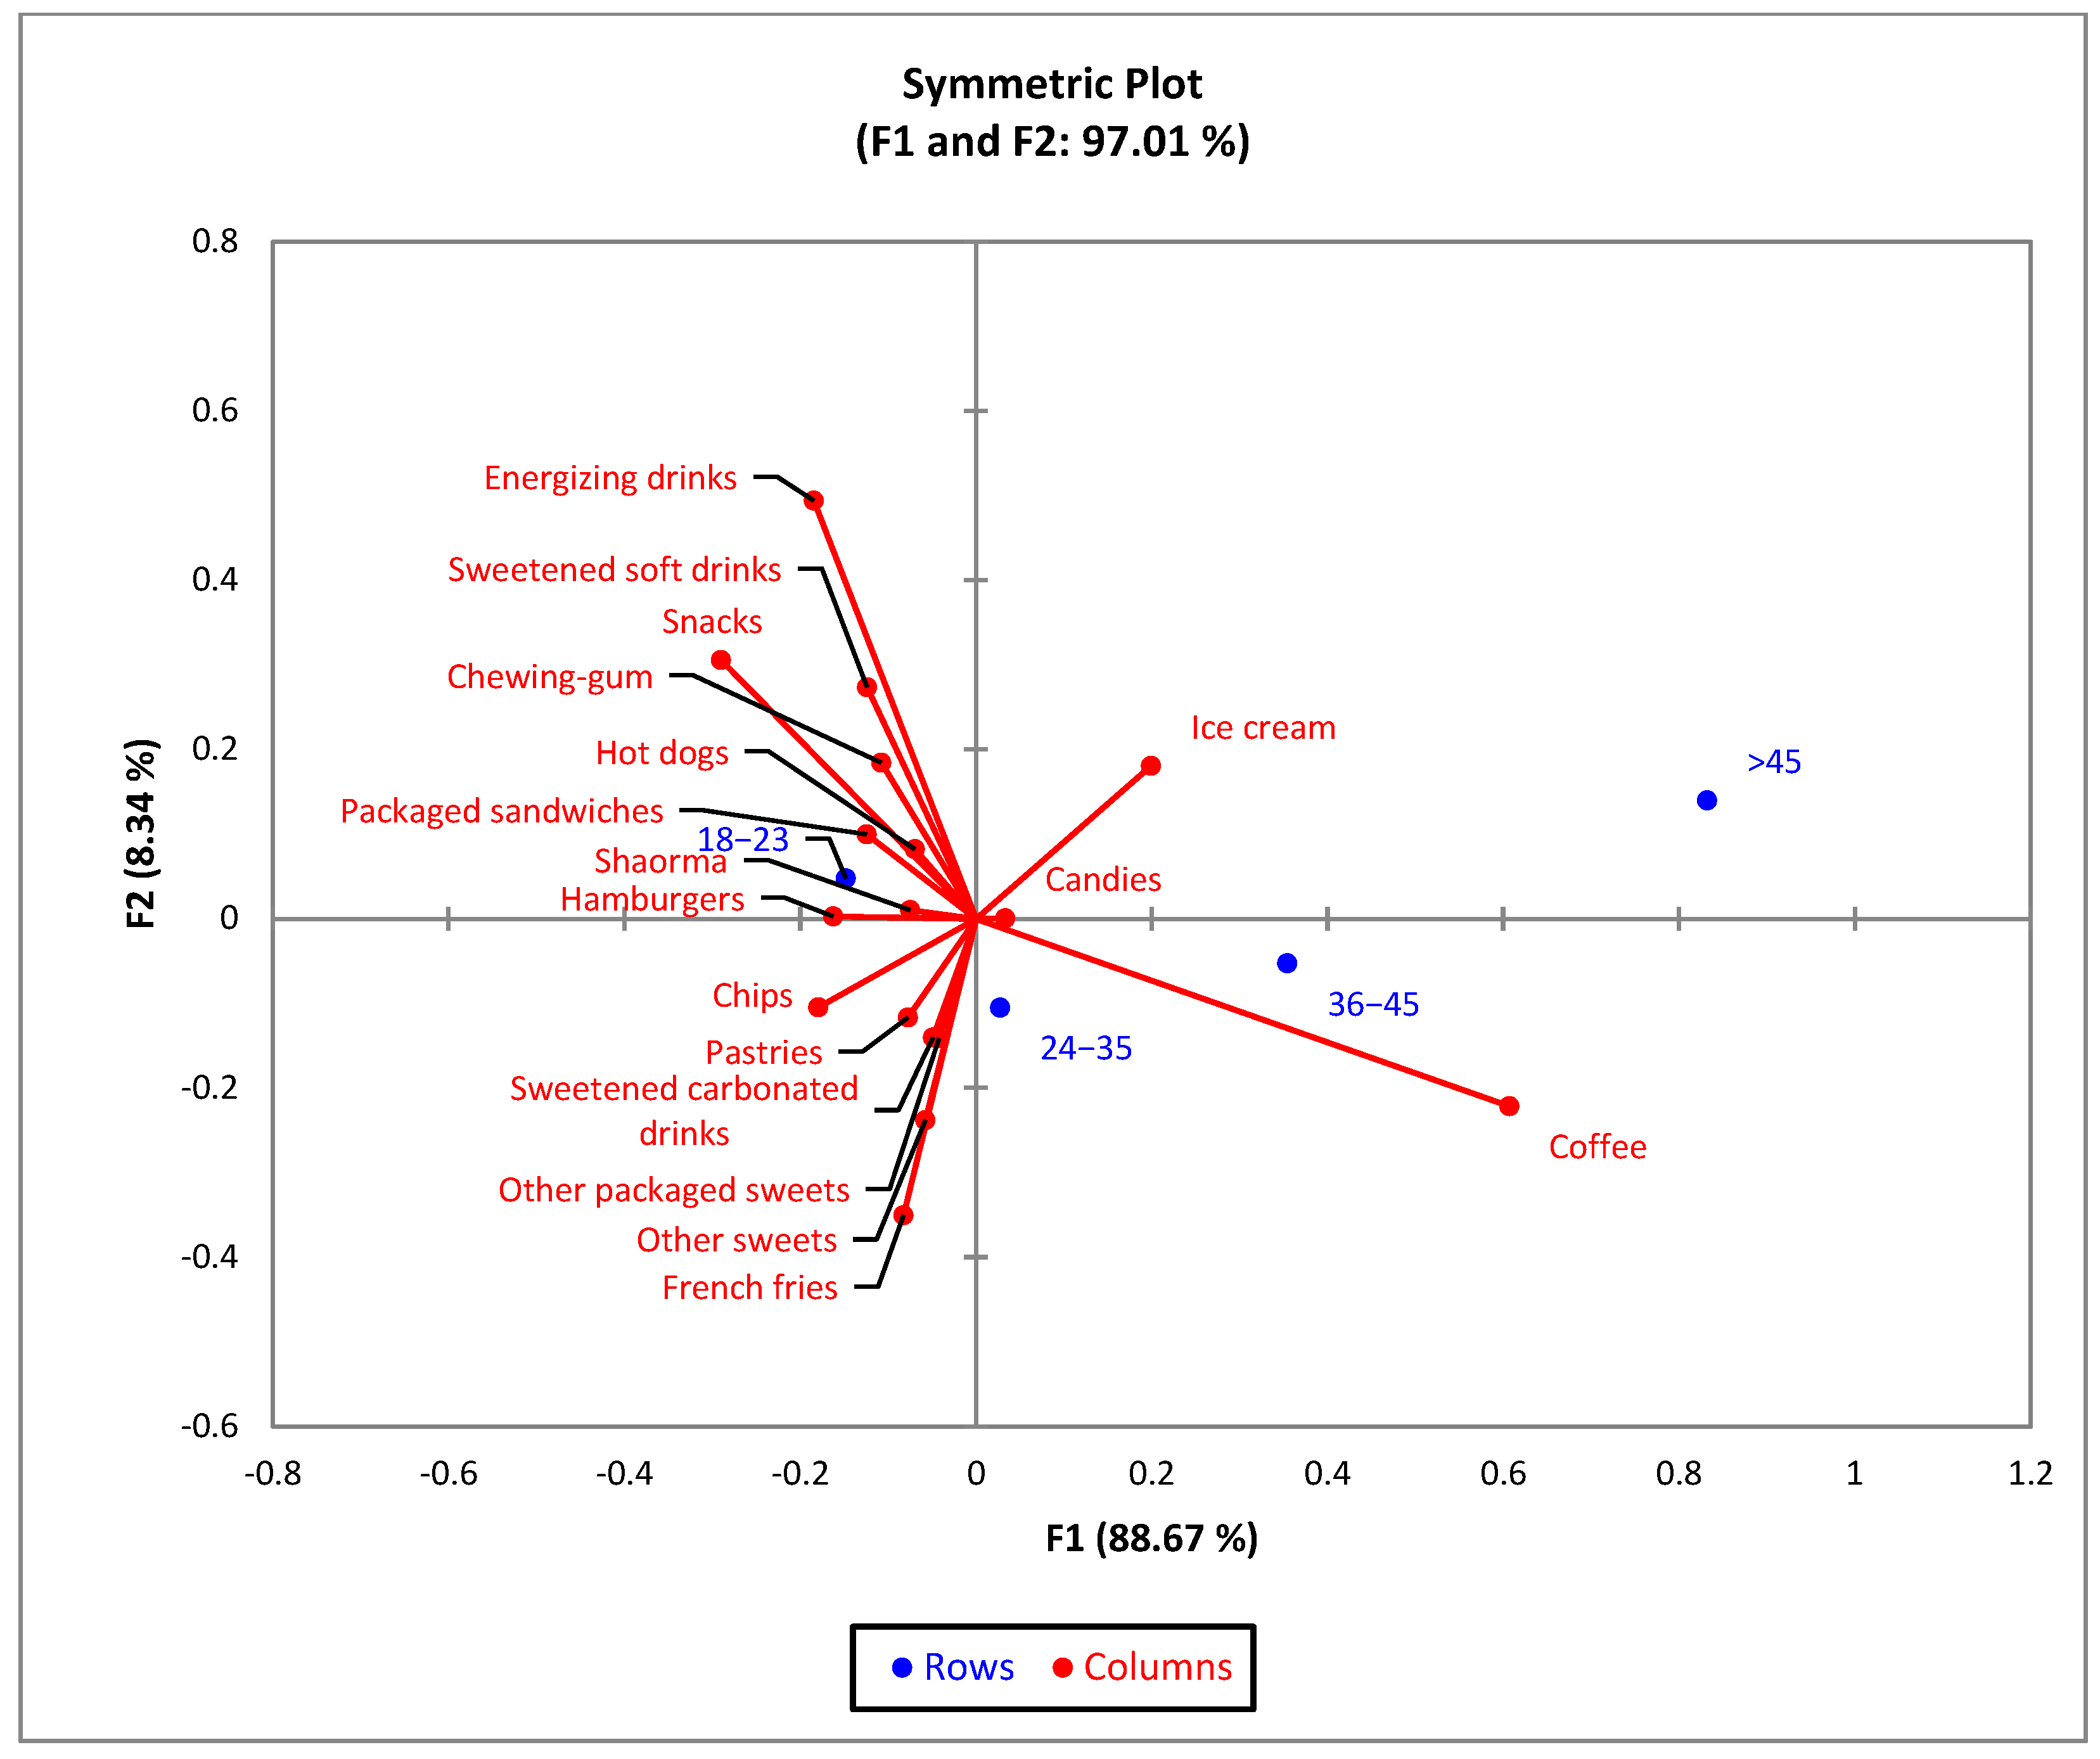
| Type of Consumed Junk Food Products | Age | |||||||
|---|---|---|---|---|---|---|---|---|
| 18–23 (a) | 24–35 (b) | 36–45 (c) | >45 (d) | |||||
| n | % | n | % | n | % | n | % | |
| Hamburgers | 223 b,c,d | 63.4 | 99 c,d | 28.1 | 23 | 6.5 | 7 | 2.0 |
| Hot dogs | 47 c | 64.4 | 21 | 28.8 | 2 | 2.7 | 3 | 4.1 |
| French fries | 454 c,d | 56.3 | 252 c,d | 31.3 | 74 d | 9.2 | 26 | 3.2 |
| Shawarma | 149 c,d | 60.6 | 70 d | 28.5 | 18 | 7.3 | 9 | 3.7 |
| Packaged sandwiches | 144 b,c,d | 64.9 | 57 d | 25.7 | 16 | 7.2 | 5 | 2.3 |
| Chips | 261 b,c,d | 62.3 | 122 c,d | 29.1 | 30 d | 7.2 | 6 | 1.4 |
| Snacks | 313 b,c,d | 70.3 | 109 c,d | 24.5 | 18 | 4.0 | 5 | 1.1 |
| Pastries | 413 b,c,d | 58.0 | 213 c,d | 29.9 | 57 | 8.0 | 29 | 4.1 |
| Other packaged sweets | 147 c,d | 56.5 | 83 c,d | 31.9 | 19 | 7.3 | 11 | 4.2 |
| Candies | 231 c,d | 55.5 | 124 d | 29.8 | 34 | 8.2 | 27 | 6.5 |
| Ice cream | 125 c,d | 50.4 | 66 c,d | 26.6 | 29 | 11.7 | 28 | 11.3 |
| Other sweets | 267 c,d | 55.9 | 159 c,d | 33.3 | 31 | 6.5 | 21 | 4.4 |
| Chewing-gum | 360 b,c,d | 61.9 | 158 c,d | 27.1 | 38 | 6.5 | 26 | 4.5 |
| Sweetened carbonated drinks | 325 b,c,d | 57.5 | 161 d | 28.5 | 59 d | 10.4 | 20 | 3.5 |
| Sweetened soft drinks | 201 b,c,d | 65.3 | 81 c,d | 26.3 | 12 | 3.9 | 14 | 4.5 |
| Energizing drinks | 131 b,c,d | 76.6 | 28 | 16.4 | 9 | 5.3 | 3 | 1.8 |
| Coffee | 450 | 41.7 | 349 a | 32.3 | 144 a | 13.3 | 136 a | 12.6 |
| Do not consume | 52 | 32.1 | 35 | 21.6 | 33 a,b | 20.4 | 42 a,b | 25.9 |
| Type of Consumed Junk Food Products | BMI | |||||||
|---|---|---|---|---|---|---|---|---|
| Underweight (a) | Normal Weight (b) | Overweight (c) | Obese (d) | |||||
| n | % | n | % | n | % | n | % | |
| Hamburgers | 44 | 26.2 | 211 | 19.2 | 60 | 19.5 | 37 | 25.5 |
| Hot dogs | 12 | 7.1 | 36 | 3.3 | 15 | 4.9 | 10 | 6.9 |
| French fries | 94 c | 56.0 | 519 | 47.3 | 127 | 41.2 | 66 | 45.5 |
| Shawarma | 24 | 14.3 | 138 | 12.6 | 54 | 17.5 | 30 b | 20.7 |
| Packaged sandwiches | 18 | 10.7 | 143 | 13.00 | 47 | 15.3 | 14 | 9.7 |
| Chips | 67 b,c,d | 39.9 | 266 | 24.2 | 56 | 18.2 | 30 | 20.7 |
| Snacks | 62 b,c,d | 36.9 | 296 | 27.0 | 61 | 19.8 | 26 | 17.9 |
| Pastries | 96 b,c,d | 57.1 | 451 | 41.1 | 114 | 37.0 | 51 | 35.2 |
| Other packaged sweets | 26 | 15.5 | 172 | 15.7 | 40 | 13.0 | 22 | 15.2 |
| Candies | 51 c | 30.4 | 279 | 25.4 | 57 | 18.5 | 29 | 20.0 |
| Ice cream | 27 | 16.1 | 140 | 12.8 | 46 | 14.9 | 35 b | 24.1 |
| Other sweets | 60 c,d | 35.7 | 318 | 29.0 | 73 | 23.7 | 27 | 18.6 |
| Chewing gum | 65 | 38.7 | 375 | 34.2 | 103 | 33.4 | 39 | 26.9 |
| Sweetened carbonated drinks | 75 b,c | 44.6 | 327 | 29.8 | 101 | 32.8 | 62 | 42.8 |
| Sweetened soft drinks | 45 b,c,d | 26.8 | 196 | 17.9 | 48 | 15.6 | 19 | 13.1 |
| Energizing drinks | 16 | 9.5 | 102 | 9.3 | 34 | 11.0 | 19 | 13.1 |
| Coffee | 94 | 56.0 | 678 | 61.7 | 210 a | 68.2 | 97 | 66.9 |
| Do not consume | 15 | 8.9 | 103 | 9.4 | 25 | 8.1 | 19 | 13.1 |
| Independent Variables | Junk Food Consumption Level | ||||||||
|---|---|---|---|---|---|---|---|---|---|
| Low | Medium | High | |||||||
| OR | 95% CI | p | OR | 95% CI | p | OR | 95% CI | p | |
| Gender | |||||||||
| Male | 1 | 1 | 1 | ||||||
| Female | 1.771 | (1.155–2.715) | 0.009 | 1.420 | (0.909–2.217) | 0.123 | 0.703 | (0.195–0.959) | 0.011 |
| Age (years) | |||||||||
| 18–23 | 0.997 | (0.481–2.068) | 0.994 | 1.474 | (0.670–3.243) | 0.335 | 2.907 | (1.225–6.898) | 0.015 |
| 24–35 | 1.312 | (0.674–2.556) | 0.048 | 2.082 | (1.007–4.305) | 0.048 | 2.670 | (0.965–7.382) | 0.058 |
| 36–45 | 0.882 | (0.444–1.749) | 0.719 | 1.234 | (0.579–2.629) | 0.586 | 0.517 | (0.142–1.882) | 0.317 |
| >45 | 1 | 1 | 1 | ||||||
| Residence area | |||||||||
| Urban area | 1 | 1 | 1 | ||||||
| Rural area | 0.787 | (0.497–1.245) | 0.307 | 0.913 | (0.568–1.468) | 0.706 | 0.898 | (0.490–1.645) | 0.728 |
| Level of education | |||||||||
| General/primary studies | 0.847 | (0.312–2.297) | 0.745 | 1.083 | (0.718–5.472) | 0.186 | 3.304 | (1.003–8.556) | 0.049 |
| Secondary education (baccalaureate degree) | 1.107 | (0.684–1.793) | 0.678 | 2.607 | (1.574–4.308) | <0.001 | 3.258 | (1.693–6.273) | <0.001 |
| Post-secondary studies | 0.797 | (0.378–1.683) | 0.552 | 1.024 | (0.460–2.283) | 0.953 | 1.157 | (0.387–3.46) | 0.795 |
| Higher education (bachelor’s degree) | 1 | 1 | 1 | ||||||
| Postgraduate studies (master’s degree, residency, doctorate, other specializations) | 0.655 | (0.4–1.074) | 0.093 | 0.784 | (0.457–1.343) | 0.375 | 0.897 | (0.419–1.921) | 0.897 |
| Body mass index (BMI) | |||||||||
| Underweight category (<18.5) | 0.922 | (0.444–1.913) | 0.922 | 0.643 | (0.306–1.350) | 0.243 | 0.586 | (0.246–1.393) | 0.226 |
| Normal limits (18.5–24.9) | 1 | 1 | 1 | ||||||
| Overweight category (25–29.9) | 0.635 | (0.285–1.411) | 0.265 | 0.508 | (0.225–1.148) | 0.104 | 0.473 | (0.179–1.249) | 0.131 |
| Obese (≥30) | 0.731 | (0.291–1.834) | 0.504 | 0.617 | (0.241–1.580) | 0.314 | 3.969 | (1.644–9.589) | 0.025 |
| Variable | Adherence to Healthy Diet Mean = 49.47, SD = 6.27, Min = 26, Max = 68 | |||||
|---|---|---|---|---|---|---|
| Unhealthy Diet | Medium Healthy Diet | Healthy Diet | ||||
| n | % | n | % | n | % | |
| Total | 438 | 25.48 | 960 | 55.85 | 321 | 18.67 |
| Gender (χ2 = 4.92, p = 0.085) | ||||||
| Female | 327 | 74.66 | 760 | 79.17 | 259 | 80.69 |
| Male | 111 | 25.34 | 200 | 20.83 | 62 | 19.31 |
| Age (years) (χ2 = 50.2, p < 0.001) | ||||||
| 18–23 | 249 | 56.85 | 459 | 47.81 | 118 | 36.76 |
| 24–35 | 109 | 24.89 | 299 | 31.15 | 93 | 28.97 |
| 36–45 | 54 | 12.33 | 104 | 10.83 | 54 | 16.82 |
| >45 | 26 | 5.94 | 98 | 10.21 | 56 | 17.45 |
| Residence area (χ2 = 1.5, p = 0.471) | ||||||
| Urban area | 346 | 79.00 | 785 | 81.77 | 259 | 80.69 |
| Rural area | 92 | 21.00 | 175 | 18.23 | 62 | 19.31 |
| Level of education (χ2 = 26.08, p = 0.001) | ||||||
| General/primary studies | 29 | 6.62 | 44 | 4.58 | 16 | 4.98 |
| Secondary education (baccalaureate degree) | 198 | 45.21 | 410 | 42.71 | 104 | 32.40 |
| Post-secondary studies | 30 | 6.85 | 60 | 6.25 | 22 | 6.85 |
| Higher education (bachelor’s degree) | 124 | 28.31 | 253 | 26.35 | 105 | 32.71 |
| Postgraduate studies (master’s degree, residency, doctorate, other specializations) | 57 | 13.01 | 193 | 20.10 | 74 | 23.05 |
| Employment status (χ2 = 54.93, p < 0.001) | ||||||
| Unemployed | 8 | 1.83 | 6 | 0.63 | 5 | 1.56 |
| Socially assisted | 4 | 0.91 | 0 | 0.00 | 2 | 0.62 |
| Householder | 7 | 1.60 | 16 | 1.67 | 7 | 2.18 |
| Retired | 1 | .23 | 7 | 0.73 | 8 | 2.49 |
| Student | 299 | 68.26 | 600 | 62.50 | 167 | 52.02 |
| Teleworking | 7 | 1.60 | 11 | 1.15 | 9 | 2.80 |
| I go to work every day | 106 | 24.20 | 281 | 29.27 | 101 | 31.46 |
| I work in a mixed regime (telework and commuting) | 6 | 1.37 | 39 | 4.06 | 22 | 6.85 |
| Body mass index (BMI) (χ2 = 16.39, p = 0.012) | ||||||
| Underweight | 48 | 10.96 | 94 | 9.79 | 26 | 8.10 |
| Normal weight | 266 | 60.73 | 619 | 64.48 | 213 | 66.36 |
| Overweight | 69 | 15.75 | 177 | 18.44 | 62 | 19.31 |
| Obese | 55 | 12.56 | 70 | 7.29 | 20 | 6.23 |
| Independent Variables | Unhealthy Diet | Medium Healthy Diet | ||||
|---|---|---|---|---|---|---|
| OR | 95% CI | p | OR | 95% CI | p | |
| Gender | ||||||
| Male | 1 | 1 | ||||
| Female | 0.705 | (0.496–1.002) | 0.051 | 0.910 | (0.662–1.250) | 0.559 |
| Age (years) | ||||||
| 18–23 | 5.352 | (1.893–9.128) | 0.002 | 2.468 | (1.227–4.964) | 0.011 |
| 24–35 | 3.045 | (1.049–5.836) | 0.040 | 1.908 | (0.926–3.931) | 0.080 |
| 35–45 | 1.786 | (0.601–3.305) | 0.297 | 1.208 | (0.578–2.525) | 0.616 |
| >45 | 1 | 1 | ||||
| Residence area | ||||||
| Urban area | 1 | 1 | ||||
| Rural area | 1.111 | (0.775–1.592) | 0.567 | 0.665 | (0.93–1.675) | 0.665 |
| Level of education | ||||||
| General/primary studies | 1.535 | (0.791–2.980) | 0.206 | 1.141 | (0.617–2.113) | 0.674 |
| Secondary education (baccalaureate degree) | 1.612 | (1.134–2.292) | 0.008 | 1.636 | (1.196–2.238) | 0.002 |
| Post-secondary studies | 1.155 | (0.628–2.122) | 0.643 | 1.132 | (0.660–1.940) | 0.652 |
| Higher education (bachelor’s degree) | 1 | 1 | ||||
| Postgraduate studies (master’s degree, residency, doctorate, other specializations) | 0.652 | (0.423–1.005) | 0.053 | 1.082 | (0.762–1.538) | 0.659 |
| Body mass index (BMI) | ||||||
| Underweight category (<18.5) | 0.676 | (0.406–1.127) | 0.133 | 0.804 | (0.507–1.275) | 0.354 |
| Normal limits (18.5–24.9) | 1 | 1 | ||||
| Overweight category (25–29.9) | 0.603 | (0.335–1.085) | 0.091 | 0.790 | (0.469–1.1331) | 0.375 |
| Obese (≥30) | 1.490 | (1.001–2.999) | 0.049 | 0.968 | (0.500–1.873) | 0.923 |
| Lifestyle Habits | Adherence to Healthy Diet | |||||
|---|---|---|---|---|---|---|
| Unhealthy Diet (a) | Medium Healthy Diet (b) | Healthy Diet (c) | ||||
| n | % | n | % | n | % | |
| Total | 438 | 25.48 | 960 | 55.85 | 321 | 18.67 |
| Exercise frequency (χ2 = 54.58, p < 0.001) | ||||||
| Not | 136 b,c | 31.05 | 152 c | 15.83 | 27 | 8.41 |
| Yes, very rarely | 196 c | 44.75 | 402 c | 41.88 | 92 | 28.66 |
| Yes, 2–3 times a week | 64 | 14.61 | 237 a | 24.69 | 104 a,b | 32.40 |
| Yes, every day under an hour | 22 | 5.02 | 90 a | 9.38 | 36 a | 11.21 |
| Yes, daily for at least an hour | 20 | 4.57 | 79 a | 8.23 | 62 a,b | 19.31 |
| Smoking (χ2 = 71.29, p < 0.001) | ||||||
| Yes, excessive daily | 134 b,c | 30.59 | 163 c | 16.98 | 34 | 10.59 |
| Yes, 1–2 cigarettes daily | 34 | 7.76 | 63 | 6.56 | 17 | 5.30 |
| Yes, 2–3 times a week | 11 | 2.51 | 16 | 1.67 | 4 | 1.25 |
| Yes, occasionally | 49 c | 11.19 | 90 c | 9.38 | 18 | 5.61 |
| Not | 210 | 47.97 | 628 a | 65.42 | 248 a,b | 77.26 |
| Sleep time, hours (χ2 = 54.64, p < 0.001) | ||||||
| I have frequent insomnia | 41 | 9.36 | 60 | 6.25 | 19 | 5.92 |
| Under 7 h per night | 188 b,c | 42.92 | 276 | 28.75 | 87 | 27.10 |
| Over 9 h a night | 24 | 5.48 | 34 | 3.54 | 8 | 2.49 |
| 7–8 h per night | 185 | 42.24 | 590 a | 61.46 | 207 a | 64.49 |
| Frequency of junk food consumption (χ2 = 49.29, p < 0.001) | ||||||
| Very rarely or not at all | 38 | 8.68 | 231 a | 24.06 | 160 a,b | 40.84 |
| 2–3 times a month | 76 | 17.35 | 255 a | 26.56 | 83 a | 25.86 |
| 2–3 times week | 170 b,c | 38.81 | 217 c | 22.60 | 32 | 9.97 |
| Once a week | 94 c | 21.46 | 226 c | 23.54 | 44 | 13.71 |
| Daily | 60 b,c | 13.70 | 31 c | 3.23 | 2 | 0.62 |
| Independent Variables | Unhealthy Diet | Medium Healthy Diet | ||||
|---|---|---|---|---|---|---|
| OR | 95% CI | p | OR | 95% CI | p | |
| Exercise frequency | ||||||
| Not | 1 | 1 | ||||
| Yes, very rarely | 0.423 | (0.261–0.685) | <0.001 | 0.776 | (0.486–1.239) | 0.776 |
| Yes, 2–3 times a week | 0.122 | (0.073–0.205) | <0.001 | 0.405 | (0.253–0.648) | <0.001 |
| Yes, every day under an hour | 0.121 | (0.062–0.238) | <0.001 | 0.444 | (0.253–0.780) | 0.005 |
| Yes, daily for at least an hour | 0.064 | (0.033–0.123) | <0.001 | 0.226 | (0.134–0.384) | <0.001 |
| Smoking | ||||||
| Yes, excessive daily | 4.654 | (3.062–7.076) | <0.001 | 1.893 | (1.272–2.818) | 0.002 |
| Yes, 1–2 cigarettes daily | 3.215 | (1.817–5.688) | <0.001 | 1.463 | (0.840–2.550) | 0.179 |
| Yes, 2–3 times a week | 3.248 | (1.019–6.350) | <0.001 | 1.975 | (1.166–3.344) | 0.011 |
| Yes, occasionally | 2.362 | (1.283–4.349) | 0.006 | 1.580 | (0.523–4.771) | 0.418 |
| Not | Reference | |||||
| Sleep time, hours | ||||||
| I have frequent insomnia | 0.999 | (0.548–1.820) | 0.996 | 0.995 | (0.563–1.759) | 0.995 |
| Under 7 h per night | 1 | |||||
| Over 9 h a night | 1.388 | (0.600–3.214) | 0.444 | 1.340 | 0.598–3.002 | 0.478 |
| 7–8 h per night | 0.414 | (0.300–0.571) | <0.001 | 0.898 | (0.673–1.199) | 0.467 |
| Frequency of junk food consumption | ||||||
| Very rarely or not at all | 1 | 1 | ||||
| 2–3 times a month | 3.855 | (2.407–6.175) | <0.001 | 2.128 | (1.546–2.929) | <0.001 |
| 2–3 times week | 5.368 | (3.333–7.528) | <0.001 | 4.697 | (3.079–7.165) | <0.001 |
| Once a week | 4.995 | (2.438–7.879) | <0.001 | 3.558 | (2.431–5.206) | <0.001 |
| Daily | 8.316 | (3.555–13.865) | <0.001 | 7.736 | (2.533–12.497) | 0.002 |
Disclaimer/Publisher’s Note: The statements, opinions and data contained in all publications are solely those of the individual author(s) and contributor(s) and not of MDPI and/or the editor(s). MDPI and/or the editor(s) disclaim responsibility for any injury to people or property resulting from any ideas, methods, instructions or products referred to in the content. |
© 2023 by the authors. Licensee MDPI, Basel, Switzerland. This article is an open access article distributed under the terms and conditions of the Creative Commons Attribution (CC BY) license (https://creativecommons.org/licenses/by/4.0/).
Share and Cite
Mititelu, M.; Oancea, C.-N.; Neacșu, S.M.; Musuc, A.M.; Gheonea, T.C.; Stanciu, T.I.; Rogoveanu, I.; Hashemi, F.; Stanciu, G.; Ioniță-Mîndrican, C.-B.; et al. Evaluation of Junk Food Consumption and the Risk Related to Consumer Health among the Romanian Population. Nutrients 2023, 15, 3591. https://doi.org/10.3390/nu15163591
Mititelu M, Oancea C-N, Neacșu SM, Musuc AM, Gheonea TC, Stanciu TI, Rogoveanu I, Hashemi F, Stanciu G, Ioniță-Mîndrican C-B, et al. Evaluation of Junk Food Consumption and the Risk Related to Consumer Health among the Romanian Population. Nutrients. 2023; 15(16):3591. https://doi.org/10.3390/nu15163591
Chicago/Turabian StyleMititelu, Magdalena, Carmen-Nicoleta Oancea, Sorinel Marius Neacșu, Adina Magdalena Musuc, Theodora Claudia Gheonea, Tiberius Iustinian Stanciu, Ion Rogoveanu, Fallah Hashemi, Gabriela Stanciu, Corina-Bianca Ioniță-Mîndrican, and et al. 2023. "Evaluation of Junk Food Consumption and the Risk Related to Consumer Health among the Romanian Population" Nutrients 15, no. 16: 3591. https://doi.org/10.3390/nu15163591