

Association between Metabolic Phenotypes of Body Fatness and Incident Stroke: A Prospective Cohort Study of Chinese Community Residents
 , , , , , ,
Abstract
:1. Introduction
2. Materials and Methods
2.1. Study Design and Participants
2.2. Questionnaire Interview and Anthropometric Measurement
2.3. Laboratory Measurement
2.4. Definitions of Metabolic Phenotypes of Body Fatness
2.5. Follow-Up and Outcomes
2.6. Statistical Analysis
3. Results
4. Discussion
5. Conclusions
Supplementary Materials
Author Contributions
Funding
Institutional Review Board Statement
Informed Consent Statement
Data Availability Statement
Acknowledgments
Conflicts of Interest
Abbreviations
| BMI | Body mass index |
| WC | Waist circumference |
| MHNW | Metabolically healthy and normal weight |
| MHUW | Metabolically healthy and underweight |
| MHOW | Metabolically healthy and overweight |
| MHO | Metabolically healthy and obese |
| MUNW | Metabolically unhealthy and normal weight |
| MUUW | Metabolically unhealthy and underweight |
| MUOW | Metabolically unhealthy and overweight |
| MUO | Metabolically unhealthy and obese |
| MHNWC | Metabolically healthy and normal WC |
| MHOWC | Metabolically healthy and oversized WC |
| MUNWC | Metabolically unhealthy and normal WC |
| MUOWC | Metabolically unhealthy and oversized WC |
| CVD | Cardiovascular disease |
| SSACB | Shanghai Suburban Adult Cohort and Biobank |
| MET | Metabolic equivalent task |
| SBP | Systolic blood pressure |
| DBP | Diastolic blood pressure |
| TG | Triglyceride |
| LDL-C | Low-density lipoprotein cholesterol |
| HDL-C | High-density lipoprotein cholesterol |
| FPG | Fasting plasma glucose |
| HbA1c | Glycated hemoglobin |
| EMR | Electronic Medical Record |
| WHO | World Health Organization |
| ICD-10 | 10th Revision of the International Classification of Diseases |
| SD | Standard deviation |
| HR | Hazard ratio |
| CI | Confidence interval |
| CAP | Carotid artery plaque |
References
- Report on Stroke Prevention and Treatment in China Writing Group. Brief report on stroke prevention and treatment in China, 2020. Chin. J. Cerebrovasc. Dis. 2022, 19, 136–144. [Google Scholar] [CrossRef]
- Ma, Q.; Li, R.; Wang, L.; Yin, P.; Wang, Y.; Yan, C.; Ren, Y.; Qian, Z.; Vaughn, M.G.; McMillin, S.E.; et al. Temporal trend and attributable risk factors of stroke burden in China, 1990–2019: An analysis for the Global Burden of Disease Study 2019. Lancet Public Health 2021, 6, e897–e906. [Google Scholar] [CrossRef] [PubMed]
- GBD 2016 Lifetime Risk of Stroke Collaborators; Feigin, V.L.; Nguyen, G.; Cercy, K.; Johnson, C.O.; Alam, T.; Parmar, P.G.; Abajobir, A.A.; Abate, K.H.; Abd-Allah, F.; et al. Global, Regional, and Country-Specific Lifetime Risks of Stroke, 1990 and 2016. N. Engl. J. Med. 2018, 379, 2429–2437. [Google Scholar] [CrossRef] [PubMed]
- The Writing Committee of the Report on Cardiovascular Health and Diseases in China. Report on Cardiovascular Health and Diseases in China 2021: An Updated Summary. Chin. Circ. J. 2022, 37, 553–578. [Google Scholar] [CrossRef]
- Pan, X.F.; Wang, L.; Pan, A. Epidemiology and determinants of obesity in China. Lancet Diabetes Endocrinol. 2021, 9, 373–392. [Google Scholar] [CrossRef]
- Shen, C.; Zhou, Z.; Lai, S.; Tao, X.; Zhao, D.; Dong, W.; Li, D.; Lan, X.; Gao, J. Urban-rural-specific trend in prevalence of general and central obesity, and association with hypertension in Chinese adults, aged 18–65 years. BMC Public Health 2019, 19, 661. [Google Scholar] [CrossRef] [Green Version]
- Yu, H.J.; Ho, M.; Liu, X.; Yang, J.; Chau, P.H.; Fong, D.Y.T. Association of weight status and the risks of diabetes in adults: A systematic review and meta-analysis of prospective cohort studies. Int. J. Obes. 2022, 46, 1101–1113. [Google Scholar] [CrossRef]
- Zhu, J.; Zhang, Y.; Wu, Y.; Xiang, Y.; Tong, X.; Yu, Y.; Qiu, Y.; Cui, S.; Zhao, Q.; Wang, N.; et al. Obesity and Dyslipidemia in Chinese Adults: A Cross-Sectional Study in Shanghai, China. Nutrients 2022, 14, 2321. [Google Scholar] [CrossRef]
- Shiozawa, M.; Kaneko, H.; Itoh, H.; Morita, K.; Okada, A.; Matsuoka, S.; Kiriyama, H.; Kamon, T.; Fujiu, K.; Michihata, N.; et al. Association of Body Mass Index with Ischemic and Hemorrhagic Stroke. Nutrients 2021, 13, 2343. [Google Scholar] [CrossRef]
- Liu, S.; Gao, Z.; Dai, Y.; Guo, R.; Wang, Y.; Sun, Z.; Xing, L.; Zhang, X.; Sun, Y.; Zheng, L. Association of general and abdominal obesity and their changes with stroke in Chinese adults: Results from an 11.8-year follow-up study. Nutr. Metab. Cardiovasc. Dis. 2020, 30, 2001–2007. [Google Scholar] [CrossRef]
- Fan, H.; Li, X.; Zheng, L.; Chen, X.; Lan, Q.; Wu, H.; Ding, X.; Qian, D.; Shen, Y.; Yu, Z.; et al. Abdominal obesity is strongly associated with Cardiovascular Disease and its Risk Factors in Elderly and very Elderly Community-dwelling Chinese. Sci. Rep. 2016, 6, 21521. [Google Scholar] [CrossRef]
- Mirzababaei, A.; Mozaffari, H.; Shab-Bidar, S.; Milajerdi, A.; Djafarian, K. Risk of hypertension among different metabolic phenotypes: A systematic review and meta-analysis of prospective cohort studies. J. Hum. Hypertens. 2019, 33, 365–377. [Google Scholar] [CrossRef]
- Zhou, Z.; Macpherson, J.; Gray, S.R.; Gill, J.M.R.; Welsh, P.; Celis-Morales, C.; Sattar, N.; Pell, J.P.; Ho, F.K. Are people with metabolically healthy obesity really healthy? A prospective cohort study of 381,363 UK Biobank participants. Diabetologia 2021, 64, 1963–1972. [Google Scholar] [CrossRef]
- Caleyachetty, R.; Thomas, G.N.; Toulis, K.A.; Mohammed, N.; Gokhale, K.M.; Balachandran, K.; Nirantharakumar, K. Metabolically Healthy Obese and Incident Cardiovascular Disease Events among 3.5 Million Men and Women. J. Am. Coll. Cardiol. 2017, 70, 1429–1437. [Google Scholar] [CrossRef]
- Keihani, S.; Hosseinpanah, F.; Barzin, M.; Serahati, S.; Doustmohamadian, S.; Azizi, F. Abdominal obesity phenotypes and risk of cardiovascular disease in a decade of follow-up: The Tehran Lipid and Glucose Study. Atherosclerosis 2015, 238, 256–263. [Google Scholar] [CrossRef]
- Gao, M.; Lv, J.; Yu, C.; Guo, Y.; Bian, Z.; Yang, R.; Du, H.; Yang, L.; Chen, Y.; Li, Z.; et al. Metabolically healthy obesity, transition to unhealthy metabolic status, and vascular disease in Chinese adults: A cohort study. PLoS Med. 2020, 17, e1003351. [Google Scholar] [CrossRef]
- Hamer, M.; Stamatakis, E. Metabolically healthy obesity and risk of all-cause and cardiovascular disease mortality. J. Clin. Endocrinol. Metab. 2012, 97, 2482–2488. [Google Scholar] [CrossRef] [Green Version]
- De Lorenzo, A.; Glerian, L.; Amaral, A.C.; Reis, T.B.; Lima, R.S.L. “Metabolically healthy” obesity: Prevalence, clinical features and association with myocardial ischaemia. Obes. Res. Clin. Pract. 2017, 11, 315–323. [Google Scholar] [CrossRef]
- Mirzaei, B.; Abdi, H.; Serahati, S.; Barzin, M.; Niroomand, M.; Azizi, F.; Hosseinpanah, F. Cardiovascular risk in different obesity phenotypes over a decade follow-up: Tehran Lipid and Glucose Study. Atherosclerosis 2017, 258, 65–71. [Google Scholar] [CrossRef]
- Liu, J.T.; Yao, H.Y.; Yu, S.C.; Liu, J.J.; Zhu, G.J.; Han, S.M.; Xu, T. Joint Association of Metabolic Health and Obesity with Ten-Year Risk of Cardiovascular Disease among Chinese Adults. Biomed. Environ. Sci. 2022, 35, 13–21. [Google Scholar] [CrossRef]
- Zhao, Q.; Chen, B.; Wang, R.; Zhu, M.; Shao, Y.; Wang, N.; Liu, X.; Zhang, T.; Jiang, F.; Wang, W.; et al. Cohort profile: Protocol and baseline survey for the Shanghai Suburban Adult Cohort and Biobank (SSACB) study. BMJ Open 2020, 10, e035430. [Google Scholar] [CrossRef] [PubMed]
- Craig, C.L.; Marshall, A.L.; Sjöström, M.; Bauman, A.E.; Booth, M.L.; Ainsworth, B.E.; Pratt, M.; Ekelund, U.; Yngve, A.; Sallis, J.F.; et al. International physical activity questionnaire: 12-country reliability and validity. Med. Sci. Sports Exerc. 2003, 35, 1381–1395. [Google Scholar] [CrossRef] [PubMed] [Green Version]
- Lou, G.; Li, S.; Gong, Q.; Zhu, Y.; Ying, Y.; Wang, Y.; Liu, Y.; Dong, W.; Liu, S.; Li, H. Association between physical activity and risk of stroke among adults aged 40 years and above: A prospective cohort study. Chin. J. Epidemiol. 2021, 42, 1030–1036. [Google Scholar] [CrossRef]
- WS/T 428-2013; National Health and Family Commission; Criteria of Weight for Adults. China Standards Press: Beijing, China, 2013.
- Alberti, K.G.; Zimmet, P.; Shaw, J. Metabolic syndrome—A new world-wide definition. A Consensus Statement from the International Diabetes Federation. Diabet. Med. 2006, 23, 469–480. [Google Scholar] [CrossRef] [PubMed]
- Expert Panel on Detection, Evaluation, and Treatment of High Blood Cholesterol in Adults. Executive Summary of the Third Report of the National Cholesterol Education Program (NCEP) Expert Panel on Detection, Evaluation, and Treatment of High Blood Cholesterol in Adults (Adult Treatment Panel III). JAMA 2001, 285, 2486–2497. [Google Scholar] [CrossRef]
- Defining Adult Overweight & Obesity. Available online: https://www.cdc.gov/obesity/adult/defining.html (accessed on 16 September 2022).
- Tang, M.; Zhao, Q.; Yi, K.; Wu, Y.; Xiang, Y.; Cui, S.; Su, X.; Yu, Y.; Zhao, G.; Jiang, Y. Association between four nontraditional lipids and ischemic stroke: A cohort study in Shanghai, China. Lipids Health Dis. 2022, 21, 72. [Google Scholar] [CrossRef]
- Bae, Y.S.; Choi, S.; Lee, K.; Son, J.S.; Lee, H.; Cho, M.H.; Koo, H.Y.; Cho, I.Y.; Chang, J.; Kim, K.; et al. Association of Concurrent Changes in Metabolic Health and Weight on Cardiovascular Disease Risk: A Nationally Representative Cohort Study. J. Am. Heart Assoc. 2019, 8, e011825. [Google Scholar] [CrossRef]
- Cho, Y.K.; Kang, Y.M.; Yoo, J.H.; Lee, J.; Park, J.Y.; Lee, W.J.; Kim, Y.J.; Jung, C.H. Implications of the dynamic nature of metabolic health status and obesity on risk of incident cardiovascular events and mortality: A nationwide population-based cohort study. Metabolism 2019, 97, 50–56. [Google Scholar] [CrossRef]
- Hosseinpanah, F.; Tasdighi, E.; Barzin, M.; Mahdavi, M.; Ghanbarian, A.; Valizadeh, M.; Azizi, F. The association between transition from metabolically healthy obesity to metabolic syndrome, and incidence of cardiovascular disease: Tehran lipid and glucose study. PLoS ONE 2020, 15, e0239164. [Google Scholar] [CrossRef]
- Lee, J.; Kwak, S.Y.; Park, D.; Kim, G.E.; Park, C.Y.; Shin, M.J. Prolonged or Transition to Metabolically Unhealthy Status, Regardless of Obesity Status, Is Associated with Higher Risk of Cardiovascular Disease Incidence and Mortality in Koreans. Nutrients 2022, 14, 1644. [Google Scholar] [CrossRef]
- Linton, M.F.; Yancey, P.G.; Davies, S.S.; Jerome, W.G.; Linton, E.F.; Song, W.L.; Doran, A.C.; Vickers, K.C. The Role of Lipids and Lipoproteins in Atherosclerosis. In Endotext [Internet]; Feingold, K.R., Anawalt, B., Boyce, A., Chrousos, G., de Herder, W.W., Dhatariya, K., Dungan, K., Hershman, J.M., Hofland, J., Kalra, S., et al., Eds.; MDText.com, Inc.: South Dartmouth, MA, USA, 2000; Updated 3 January 2019. [Google Scholar]
- Shen, P.; Zhou, Y.; Song, A.; Wan, Y.; Fan, Z.; Xu, R. The association of metabolic health obesity with incidence of carotid artery plaque in Chinese adults. Nutr. Metab. Cardiovasc. Dis. 2021, 31, 2376–2381. [Google Scholar] [CrossRef]
- Polak, J.F.; Szklo, M.; Kronmal, R.A.; Burke, G.L.; Shea, S.; Zavodni, A.E.; O’Leary, D.H. The value of carotid artery plaque and intima-media thickness for incident cardiovascular disease: The multi-ethnic study of atherosclerosis. J. Am. Heart Assoc. 2013, 2, e000087. [Google Scholar] [CrossRef] [Green Version]
- Piché, M.E.; Poirier, P.; Lemieux, I.; Després, J.P. Overview of Epidemiology and Contribution of Obesity and Body Fat Distribution to Cardiovascular Disease: An Update. Prog. Cardiovasc. Dis. 2018, 61, 103–113. [Google Scholar] [CrossRef]
- Zhang, C.; Rexrode, K.M.; van Dam, R.M.; Li, T.Y.; Hu, F.B. Abdominal obesity and the risk of all-cause, cardiovascular, and cancer mortality: Sixteen years of follow-up in US women. Circulation 2008, 117, 1658–1667. [Google Scholar] [CrossRef]
- Vecchié, A.; Dallegri, F.; Carbone, F.; Bonaventura, A.; Liberale, L.; Portincasa, P.; Frühbeck, G.; Montecucco, F. Obesity phenotypes and their paradoxical association with cardiovascular diseases. Eur. J. Intern. Med. 2018, 48, 6–17. [Google Scholar] [CrossRef]
- Antonopoulos, A.S.; Tousoulis, D. The molecular mechanisms of obesity paradox. Cardiovasc. Res. 2017, 113, 1074–1086. [Google Scholar] [CrossRef]
- Kwon, H.; Yun, J.M.; Park, J.H.; Cho, B.L.; Han, K.; Joh, H.K.; Son, K.Y.; Cho, S.H. Incidence of cardiovascular disease and mortality in underweight individuals. J. Cachexia Sarcopenia Muscle 2021, 12, 331–338. [Google Scholar] [CrossRef]
- Ma, S.; Xi, B.; Yang, L.; Sun, J.; Zhao, M.; Bovet, P. Trends in the prevalence of overweight, obesity, and abdominal obesity among Chinese adults between 1993 and 2015. Int. J. Obes. 2021, 45, 427–437. [Google Scholar] [CrossRef]
- Yao, F.; Bo, Y.; Zhao, L.; Li, Y.; Ju, L.; Fang, H.; Piao, W.; Yu, D.; Lao, X. Prevalence and Influencing Factors of Metabolic Syndrome among Adults in China from 2015 to 2017. Nutrients 2021, 13, 4475. [Google Scholar] [CrossRef]
- Yang, W.; Li, J.P.; Zhang, Y.; Fan, F.F.; Xu, X.P.; Wang, B.Y.; Xu, X.; Qin, X.H.; Xing, H.X.; Tang, G.F.; et al. Association between Body Mass Index and All-Cause Mortality in Hypertensive Adults: Results from the China Stroke Primary Prevention Trial (CSPPT). Nutrients 2016, 8, 384. [Google Scholar] [CrossRef]
- Yaribeygi, H.; Farrokhi, F.R.; Butler, A.E.; Sahebkar, A. Insulin resistance: Review of the underlying molecular mechanisms. J. Cell. Physiol. 2019, 234, 8152–8161. [Google Scholar] [CrossRef] [PubMed]


| Characteristic | All Subjects | BMI | p Value | |||
|---|---|---|---|---|---|---|
| Underweight (18.5 ≤ BMI < 24.0 kg/m2) | Normal Weight (18.5 ≤ BMI < 24.0 kg/m2) | Overweight (24.0 ≤ BMI < 28.0 kg/m2) | Obesity (BMI ≥ 28.0 kg/m2) | |||
| N | 34,294 | 904 (2.64) | 15,347 (44.75) | 13,488 (39.33) | 4555 (13.28) | |
| Age (years) | 56.05 ± 11.26 | 48.99 ± 15.24 | 54.69 ± 11.74 | 57.59 ± 10.06 | 57.45 ± 10.91 | <0.001 |
| Male (%) | 13,844 (40.37) | 263 (29.09) | 5502 (35.85) | 6109 (45.29) | 1970 (43.25) | <0.001 |
| Education degree (%) | ||||||
| ≤6 years | 4871 (14.20) | 92 (10.18) | 1889 (12.31) | 2067 (15.32) | 823 (18.07) | <0.001 |
| 7–12 years | 26,314 (76.73) | 561 (62.06) | 11,749 (76.56) | 10,596 (78.56) | 3048 (74.82) | |
| ≥13 years | 3109 (9.07) | 251 (27.77) | 1709 (11.14) | 825 (6.12) | 324 (7.11) | |
| Marital status (%) | ||||||
| Married | 31,883 (92.97) | 788 (87.17) | 14,258 (92.90) | 12,621 (93.57) | 4216 (92.56) | <0.001 |
| Other a | 2411 (7.03) | 116 (12.83) | 1089 (7.10) | 867 (6.43) | 339 (7.44) | |
| Retired (%) | 19,783 (57.69) | 404 (44.69) | 8371 (54.54) | 8246 (61.14) | 2762 (60.64) | |
| Place of residence | ||||||
| Non-urban | 19,658 (57.32) | 458 (50.66) | 8835 (57.57) | 7841 (58.13) | 2524 (55.41) | <0.001 |
| Urban | 14,636 (42.68) | 446 (49.34) | 6512 (42.43) | 5647 (41.87) | 2031 (44.59) | |
| Smoking index, packet year (%) | ||||||
| None-smoker | 26,242 (76.52) | 747 (82.63) | 12,011 (78.26) | 10,037 (74.41) | 3447 (75.68) | <0.001 |
| <20.0 | 2241 (6.53) | 51 (5.64) | 927 (6.04) | 960 (7.12) | 303 (6.65) | |
| 20.0–39.9 | 3160 (9.21) | 63 (6.97) | 1279 (8.33) | 1370 (10.16) | 448 (9.84) | |
| ≥40 | 2651 (7.73) | 43 (4.76) | 1130 (7.36) | 1121 (8.31) | 357 (7.84) | |
| Alcohol drinking (%) | ||||||
| Never | 29,672 (86.52) | 833 (92.15) | 13,573 (88.44) | 11,398 (84.50) | 3868 (84.92) | <0.001 |
| Former | 359 (1.05) | 8 (0.88) | 115 (0.75) | 170 (1.26) | 66 (1.45) | |
| Current | 4263 (12.43) | 63 (6.97) | 1659 (10.81) | 1920 (14.23) | 621 (13.63) | |
| Physical activities (%) | ||||||
| Low | 10,593 (30.89) | 378 (41.81) | 4767 (31.06) | 4024 (29.83) | 1424 (31.26) | <0.001 |
| Moderate | 21,084 (61.48) | 488 (53.98) | 9517 (62.01) | 8350 (61.91) | 2729 (59.91) | |
| High | 2617 (7.63) | 38 (4.20) | 1063 (6.93) | 1114 (8.26) | 402 (8.83) | |
| Fruit intake (g/d) | 57.14 (28.57–120.0) | 82.86 (28.57–150.0) | 71.43 (28.57–142.86) | 57.14 (28.57–107.14) | 57.14 (28.57–100.0) | <0.001 |
| Vegetable intake (g/d) | 242.85 (128.57–400.0) | 228.57 (124.05–342.86) | 235.15 (128.57–400.0) | 242.86 (128.57–401.64) | 244.83 (128.58–392.86) | 0.026 |
| Fish intake (g/d) | 41.97 (20.87–64.29) | 41.73 (20.87–63.72) | 42.86 (20.87–65.71) | 41.73 (20.87–63.72) | 41.73 (20.87–63.72) | 0.249 |
| Unprocessed meat intake (g/d) | 44.50 (27.89–72.44) | 46.16 (29.42–78.58) | 44.51 (28.57–71.69) | 43.97 (27.45–72.25) | 43.69 (25.43–73.59) | 0.135 |
| Processed meat intake (%) | ||||||
| Never | 17,574 (51.25) | 473 (52.32) | 7854 (51.18) | 7005 (51.94) | 2242 (49.22) | 0.020 |
| 1–3 times/month | 13,874 (40.46) | 352 (38.94) | 6247 (40.71) | 5395 (40.0) | 1880 (41.27) | |
| 1–3 times/week | 2716 (7.92) | 76 (8.41) | 1188 (7.74) | 1033 (7.66) | 419 (9.20) | |
| 4–7 times/week | 130 (0.38) | 3 (0.33) | 58 (0.38) | 55 (0.41) | 14 (0.31) | |
| BMI (kg/m2) | 24.38 ± 3.35 | 17.53 ± 0.81 | 21.87 ± 1.43 | 25.75 ± 1.12 | 30.13 ± 2.13 | <0.001 |
| WC (cm) | 81.62 ± 9.42 | 66.01 ± 6.19 | 75.95 ± 6.78 | 85.06 ± 6.21 | 93.62 ± 7.53 | <0.001 |
| SBP (mmHg) | 133.41 ± 19.38 | 119.24 ± 16.74 | 128.99 ± 18.86 | 136.72 ± 18.50 | 141.29 ± 18.96 | <0.001 |
| DBP (mmHg) | 79.99 ± 10.51 | 73.42 ± 9.68 | 77.67 ± 10.14 | 81.67 ± 10.13 | 84.19 ± 10.50 | <0.001 |
| Anti-hypertensive medications (%) | 10,863 (31.68) | 96 (10.62) | 3378 (22.01) | 5110 (37.89) | 2279 (50.03) | <0.001 |
| TG (mmol/L) | 1.34 (0.98–1.92) | 0.91 (0.76–1.16) | 1.18 (0.88–1.61) | 1.50 (1.10–2.12) | 1.68 (1.24–2.40) | <0.001 |
| HDL-C (mmol/L) | 1.41 ± 0.36 | 1.69 ± 0.38 | 1.49 ± 0.35 | 1.34 ± 0.33 | 1.28 ± 0.37 | <0.001 |
| LDL-C (mmol/L) | 2.78 ± 0.83 | 2.47 ± 0.76 | 2.75 ± 0.81 | 2.82 ± 0.85 | 2.81 ± 0.87 | <0.001 |
| Statins (%) | 2547 (7.43) | 13 (1.44) | 720 (4.69) | 1212 (8.99) | 602 (13.22) | <0.001 |
| FPG (mmol/L) | 4.72 (4.26–5.37) | 4.56 (4.22–4.92) | 4.64 (4.23–5.21) | 4.79 (4.28–5.51) | 4.92 (4.34–5.75) | <0.001 |
| HbA1c (%) | 5.6 (5.3–6.0) | 5.4 (5.1–5.7) | 5.5 (5.3–5.9) | 5.7 (5.4–6.1) | 5.8 (5.5–6.3) | <0.001 |
| Metabolic status (%) | ||||||
| Metabolically healthy | 18,759 (54.70) | 801 (88.61) | 10,508 (68.47) | 6028 (44.69) | 1422 (31.22) | <0.001 |
| Metabolically unhealthy | 15,535 (45.30) | 103 (11.39) | 4839 (31.53) | 7460 (55.31) | 3133 (68.78) | |
| Number of metabolic abnormalities | 1.50 ± 1.12 | 0.56 ± 0.76 | 1.14 ± 1.01 | 1.75 ± 1.08 | 2.13 ± 1.08 | <0.001 |
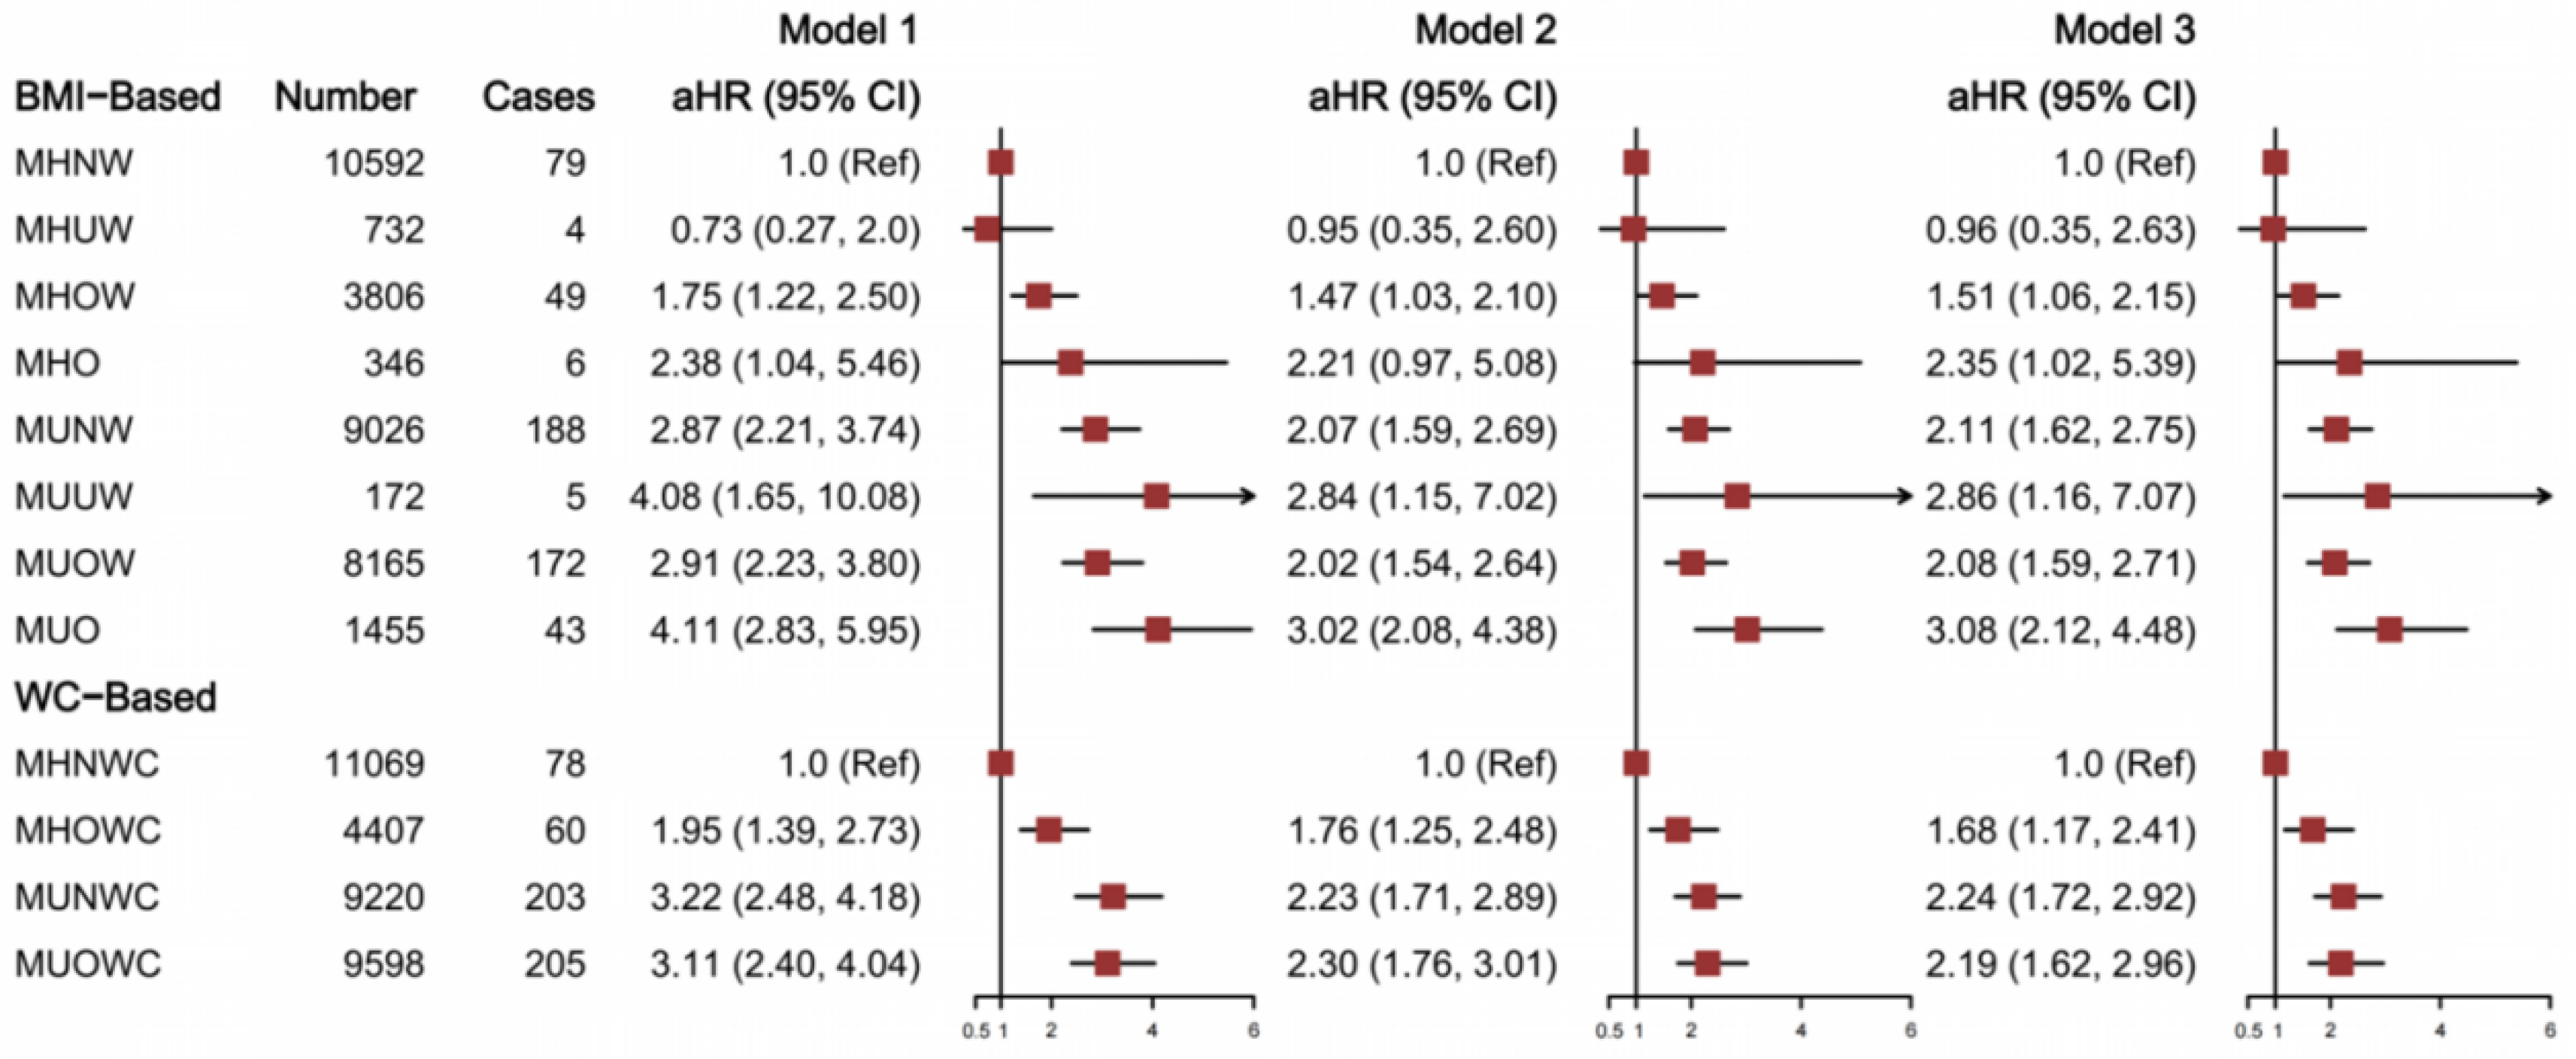
| Phenotypes | Cases/Participants | Model 1 a | Model 2 b | Model 3 c | Male e | Female e |
|---|---|---|---|---|---|---|
| HR (95% CI) | HR (95% CI) | HR (95% CI) | HR (95% CI) | HR (95% CI) | ||
| Based on BMI | ||||||
| MHNW | 84/10,508 | 1.00 | 1.00 | 1.00 | 1.00 | 1.00 |
| MHUW | 5/801 | 0.78 (0.32, 1.92) | 0.99(0.40, 2.44) | 1.01 (0.41, 2.49) | 0.38 (0.05, 2.76) | 1.61 (0.57, 4.56) |
| MHOW | 84/6028 | 1.76 (1.30, 2.38) *** | 1.45 (1.07, 1.97) * | 1.47 (1.09, 2.0) * | 1.57 (1.07, 2.30) * | 1.29 (0.78, 2.12) |
| MHO | 18/1422 | 1.60 (0.96, 2.67) | 1.30 (0.78, 2.16) | 1.33 (0.80, 2.22) | 1.63 (0.87, 3.06) | 0.96 (0.40, 2.29) |
| MUNW | 115/4839 | 3.06 (2.31, 4.05) *** | 2.48 (1.87, 3.29) *** | 2.49 (1.87, 3.30) *** | 2.18 (1.48, 3.23) *** | 2.73 (1.79, 4.15) *** |
| MUUW | 4/103 | 5.15 (1.89, 14.04) ** | 4.23 (1.55, 11.54) ** | 3.92 (1.44, 10.72) ** | 4.61 (1.11, 19.07) * | 3.38 (0.81, 14.07) |
| MUOW | 158/7460 | 2.73 (2.10, 3.56) *** | 2.10 (1.61, 2.73) *** | 2.14 (1.64, 2.79) *** | 2.16 (1.53, 3.06) *** | 2.01 (1.32, 3.06) ** |
| MUO | 78/3133 | 3.22 (2.37, 4.38) *** | 2.56 (1.88, 3.49) *** | 2.60 (1.91, 3.55) *** | 2.45 (1.61, 3.72) *** | 2.65 (1.66, 4.23) *** |
| Based on WC d | ||||||
| MHNWC | 114/13,160 | 1.00 | 1.00 | 1.00 | 1.00 | 1.00 |
| MHOWC | 77/5599 | 1.60 (1.20, 2.13) ** | 1.43 (1.06, 1.92) * | 1.41 (1.02, 1.94) * | 1.31 (0.85, 2.02) | 1.67 (1.01, 2.76) * |
| MUNWC | 167/7129 | 2.79 (2.20, 3.54) *** | 2.21 (1.74, 2.81) *** | 2.25 (1.76, 2.87) *** | 1.94 (1.46, 2.58) *** | 2.86 (1.81, 4.53) *** |
| MUOWC | 188/8406 | 2.65 (2.09, 3.34) *** | 2.23 (1.76, 2.84) *** | 2.16 (1.63, 2.87) *** | 1.65 (1.14, 2.39) ** | 2.94 (1.86, 4.66) *** |
| Variables | Number of Metabolic Abnormalities | p for Trend | ||||
|---|---|---|---|---|---|---|
| 0 | 1 | 2 | 3 | 4 | ||
| BMI group (kg/m2) | ||||||
| <24.0 | 1.00 | 1.74 (1.05, 2.88) | 3.05 (1.84, 5.06) | 4.77 (2.75, 8.28) | 6.88 (3.49, 13.59) | <0.001 |
| ≥24.0 | 1.00 | 1.71 (0.91, 3.19) | 2.29 (1.23, 4.25) | 2.66 (1.42, 5.01) | 3.05 (1.55, 6.02) | <0.001 |
| WC group a | ||||||
| Normal WC | 1.00 | 1.58 (1.00, 2.50) | 2.77 (1.75, 4.38) | 3.46 (2.09, 5.74) | 5.65 (3.10, 10.29) | <0.001 |
| Oversized WC | 1.00 | 2.28 (1.04, 4.98) | 2.82 (1.30, 6.12) | 3.63 (1.66, 7.94) | 3.53 (1.53, 8.12) | <0.001 |
Publisher’s Note: MDPI stays neutral with regard to jurisdictional claims in published maps and institutional affiliations. |
© 2022 by the authors. Licensee MDPI, Basel, Switzerland. This article is an open access article distributed under the terms and conditions of the Creative Commons Attribution (CC BY) license (https://creativecommons.org/licenses/by/4.0/).
Share and Cite
Tang, M.; Zhao, Q.; Yi, K.; Wu, Y.; Xiang, Y.; Zaid, M.; Cui, S.; Su, X.; Yu, Y.; Zhao, G.; et al. Association between Metabolic Phenotypes of Body Fatness and Incident Stroke: A Prospective Cohort Study of Chinese Community Residents. Nutrients 2022, 14, 5258. https://doi.org/10.3390/nu14245258
Tang M, Zhao Q, Yi K, Wu Y, Xiang Y, Zaid M, Cui S, Su X, Yu Y, Zhao G, et al. Association between Metabolic Phenotypes of Body Fatness and Incident Stroke: A Prospective Cohort Study of Chinese Community Residents. Nutrients. 2022; 14(24):5258. https://doi.org/10.3390/nu14245258
Chicago/Turabian StyleTang, Minhua, Qi Zhao, Kangqi Yi, Yiling Wu, Yu Xiang, Maryam Zaid, Shuheng Cui, Xuyan Su, Yuting Yu, Genming Zhao, and et al. 2022. "Association between Metabolic Phenotypes of Body Fatness and Incident Stroke: A Prospective Cohort Study of Chinese Community Residents" Nutrients 14, no. 24: 5258. https://doi.org/10.3390/nu14245258