Article

Fetuin-A and Its Association with Anthropometric, Atherogenic, and Biochemical Parameters and Indices among Women with Polycystic Ovary Syndrome

by
Karolina Kulik-Kupka
1,†,
Marzena Jabczyk
1,†,
Justyna Nowak
2,*,
Paweł Jagielski
3,
Bartosz Hudzik
2,4 and
Barbara Zubelewicz-Szkodzińska
1,5
1
Department of Nutrition-Related Disease Prevention, Department of Metabolic Disease Prevention, Faculty of Health Sciences in Bytom, Medical University of Silesia, 41-900 Bytom, Poland
2
Department of Cardiovascular Disease Prevention, Department of Metabolic Disease Prevention, Faculty of Health Sciences in Bytom, Medical University of Silesia, 41-900 Bytom, Poland
3
Department of Nutrition and Drug Research, Institute of Public Health, Faculty of Health Sciences, Jagiellonian University Medical College, 31-066 Cracow, Poland
4
Third Department of Cardiology, Silesian Center for Heart Disease, Faculty of Medical Sciences in Zabrze, Medical University of Silesia, 41-800 Zabrze, Poland
5
Department of Endocrinology, District Hospital, 41-940 Piekary Slaskie, Poland
*
Author to whom correspondence should be addressed.
These authors contributed equally to this work.
Nutrients 2022, 14(19), 4034; https://doi.org/10.3390/nu14194034
Submission received: 29 July 2022 / Revised: 22 September 2022 / Accepted: 25 September 2022 / Published: 28 September 2022
(This article belongs to the Section Nutrition in Women)

Abstract

:
Background: Polycystic ovary syndrome (PCOS) contributes to metabolic and endocrine complications for women of reproductive age. We set out to assess the relationship between fetuin-A and anthropometric parameters, anthropometric indices, body composition, and atherogenic indices, as well as carbohydrate and lipid profile in women with polycystic ovary syndrome (PCOS). Methods. The study included 49 women with PCOS, aged between 18 and 39 years. All patients were tested for fetuin-A, fasting glucose and insulin, and lipid parameters, after oral-glucose administration were done. All of them underwent anthropometric measurements and body composition analyses such as BMI (Body Mass Index), WHR (Waist to Hip Ratio), WHtR (Waist to Height Ratio), BAI (Body Adiposity Index), VAI (Visceral Adiposity Index), LAP (Lipid Accumulation Product), BRI (Body Roundness Index), ABSI (A Body Shape Index), ABSI z-core (ABSI with added mortality risk in correlation with age and gender), AIP (Atherogenic Risk of Plasma), AC (Atherogenic Coefficient), Castelli risk index-I, and Castelli risk index-II. Results: Obesity was diagnosed in 18 patients (36.7%) based on BMI index and 7 patients (14.3%) based on BAI index. Significantly increased risk of metabolic complications was observed among 26 patients (53.1%) based on waist circumferences. Based on VAI index, risk of metabolic disease was observed among 17 women (34.7%). Dyslipidemia such as hypercholesterolemia, hypertriglyceridemia, and mixed hyperlipidemia was detected among 14 patients (28.6%), and insulin resistance was observed among 29 (59.2%). There was a positive correlation between fetuin-A and total cholesterol (r = 0.30, p = 0.0034). There was no statistically significant correlation between fetuin-A and all of the anthropometric measurements and anthropometric indices, atherogenic indices, and other biochemical parameters. Conclusion: Fetuin-A correlates with hypercholesterolemia. It is necessary to conduct further research regarding the relationship between fetuin-A concentrations and body composition, anthropometric indices, and metabolic disorders in women with PCOS. Surprisingly, the effects of concentration of fetuin-A and anthropometric indices (BAI, VAI, LAP, ABSI, ABSI z-core) in woman with PCOS have not been closely examined. Future studies that take these variables into account will need to be undertaken. More information on the relationship between fetuin-A concentrations and anthropometric indices would aid us in establishing a greater degree of accuracy on this matter.

1. Introduction

Polycystic ovary syndrome (PCOS) is a condition of the endocrine system that affects 5–10% of women of childbearing age. Approximately 7–8% of women of reproductive age are affected by PCOS, which is considered the most common cause of female infertility [1]. The diagnosis of PCOS is still a matter of debate. Several concepts of PCOS, metabolic and hormonal, have been considered. Its phenotype is heterogenous, and the most recent diagnostic criteria do not include any indicators that would reflect metabolic dysregulation [2].
Women with PCOS oftentimes suffer from other concomitant disorders such as dyslipidemia, hypertension, chronic inflammation, and obesity. Moreover, insulin resistance (IR) is present in up to 70% of PCOS women [2]. In several human studies, it has been found that altered (increased or decreased) or unchanged circulating fetuin-A levels in obese patients appear to be closely linked to metabolic syndrome (MetS), non-alcoholic fatty liver disease (NAFLD), cardiovascular disease (CVD), and PCOS. Furthermore, there has also been reported an association with impaired glucose intolerance and IR [2,3,4,5]. Although hyperinsulinemia and IR are associated with PCOS pathogenesis, it is not a criterion in PCOS definition. Moreover, those conditions are not seen in all cases [6]. Fetuin-A directly interacts with the insulin receptor and alters insulin signaling via a wide variety of mechanisms, including disruption of insulin-stimulated phosphorylation of the insulin receptor and insulin receptor substrate-1 [7]. Visceral obesity enhances the risk of IR, increases fatty acids synthesis, increases the rate of type 2 diabetes mellitus, and causes cardiovascular complications [2,8,9,10]. Android adipose tissue distribution may also be associated with hyperandrogenemia and decreased concentration of sex hormone binding globulin (SHBG) [11]. This is why PCOS patients have also been shown to have an increased risk of metabolic syndrome [12]. Moreover, it has been reported that increased androgen levels enhance the release of fetuin-A via androgen receptors (AR) in liver cells [6]. Increased androgen levels may affect fetuin-A levels in PCOS. Therefore, elevated fetuin-A levels, by playing a role in many inflammatory processes and hyperandrogenemia, may increase the risk of IR [6].
Recently, many studies have tried to explain the possible mechanisms of metabolic disorders, which is why we look for fetuin-A secretion in PCOS women.
Fetuin-A is a 64 kDa glycoprotein produced in the liver, adipose tissue, and the placenta. It acts as an inhibitor of insulin action through the inhibition of auto-phosphorylation of insulin receptor tyrosine kinase and glucose transporter 4 (GLUT4), causing development of diabetes, insulin resistance, metabolic syndrome, and cardiovascular disease (CVD) [13]. Fetuin-A is a mediator involved in the regulation of calcium metabolism, through reducing and suppressing systemic calcification [14,15]. Decreased serum fetuin levels have been linked to stiffening and calcification of the artery walls. CVDs have become the leading causes of mortality worldwide. Due to the fact that fetuin-A constitutes as one of the most involved inhibitors of calcification, it may be a predictive factor for cardiovascular disease [14]. Notably, low serum fetuin-A levels are linked to ectopic calcification, CVD, chronic lymphocytic leukemia, malnutrition, inflammation, and sepsis, whereas increased levels of fetuin-A play an anti-inflammatory role through inhibiting the secretion of proinflammatory mediators in macrophages [16]. Hence, fetuin-A exhibits atherogenic effects in metabolic syndrome and has been described as significant in the protection against atherosclerotic calcification [14,17]. In contrast, elevated circulating concentrations of fetuin-A have been shown to be related with PCOS, NAFLD, obesity, IR, T2DM, aging, and severity of psoriasis [16]. Moreover, fetuin-A also exerts the features of adipokine and hepatokine, whereas serum paraoxonase-1 (PON-1) enzyme is associated with antioxidant high-density lipoprotein (HDL). The PON-1 gene is expressed mainly in the liver. Decreased serum PON-1 levels may lead to IR, caused by PCOS [18,19].
There are two main sources of fetuin-A: subcutaneous adipose and visceral tissue [20]. It has been stated that visceral tissue secretes a higher amount of fetuin-A, and this mechanism of secretion is more sensitive to nutritional and physiological alterations [20,21]. As mentioned in the literature review [20], several nutrients may alter fetuin-A release. The authors have reported that fatty acids, dietary energy restrictions, exercise, and fasting induce the adipocyte-fetuin-A gene and protein expression, which result is increased secretion of fetuin-A [20]. It has also been shown to stimulate the synthesis of proinflammatory cytokines by macrophages and adipocytes. Therefore, it is regarded as both hepatokine and adipokine [21].
Several studies have found that sometimes adiponectin concentration is lower in women with PCOS compared with the control group matched for BMI. It is believed that fat cell metabolism is associated with ovarian steroidogenesis. Adiponectin pathway disturbance may affect the onset of hyperandrogenism in women with PCOS [22]. Studies comparing associations of fetuin-A concentrations in PCOS are conflicting [23,24,25]. Moreover, the abdominal fat that can express and secrete the adipokine and hepatokine fetuin-A [18] may have a stronger association with morbidity than adiposity [25]. However, the abdominal fat distribution may not have been estimated through BMI. Anthropometric indices (WC, WHR, WHtR) are used to estimate central obesity [25]. Indeed, the assessment of visceral obesity with new anthropometric indices (BAI, VAI, LAP, BRI, ABSI) compared to BMI could be a better evaluation in predicting either metabolic or cardiovascular complication [26,27]. Values of VAI > 1.675 may differentiate metabolically healthy PCOS women from unhealthy PCOS women [27]. The mentioned anthropometric indices are simple, cost-effective, noninvasive methods to evaluate and asses the cardiometabolic risk in PCOS women [26,27]. According to the higher rate of atherosclerosis and the prevalence of cardiovascular diseases in patients with PCOS, screening and management of CVD risk is crucial [15]. Moreover, values of Atherogenic Index Plasma (AIP) have been shown as promising for determining risk of MetS, hypertension, T2DM, and CVD, and other modern diseases. Both AIP and Castelli’s risk index-I (TC/HDL-C) and Castelli’s risk index-II (LDL-C/HDL-C) have also been measured in the study because the parameters of lipid profile may play an important role in metabolic diseases [28], including PCOS.
The aim of this study was to evaluate the relationship between fetuin-A concentration and anthropometric measurements and indices, body composition, and atherogenic indices, as well as glucose and lipid parameters, in patients with PCOS.

2. Methods

2.1. Study Population

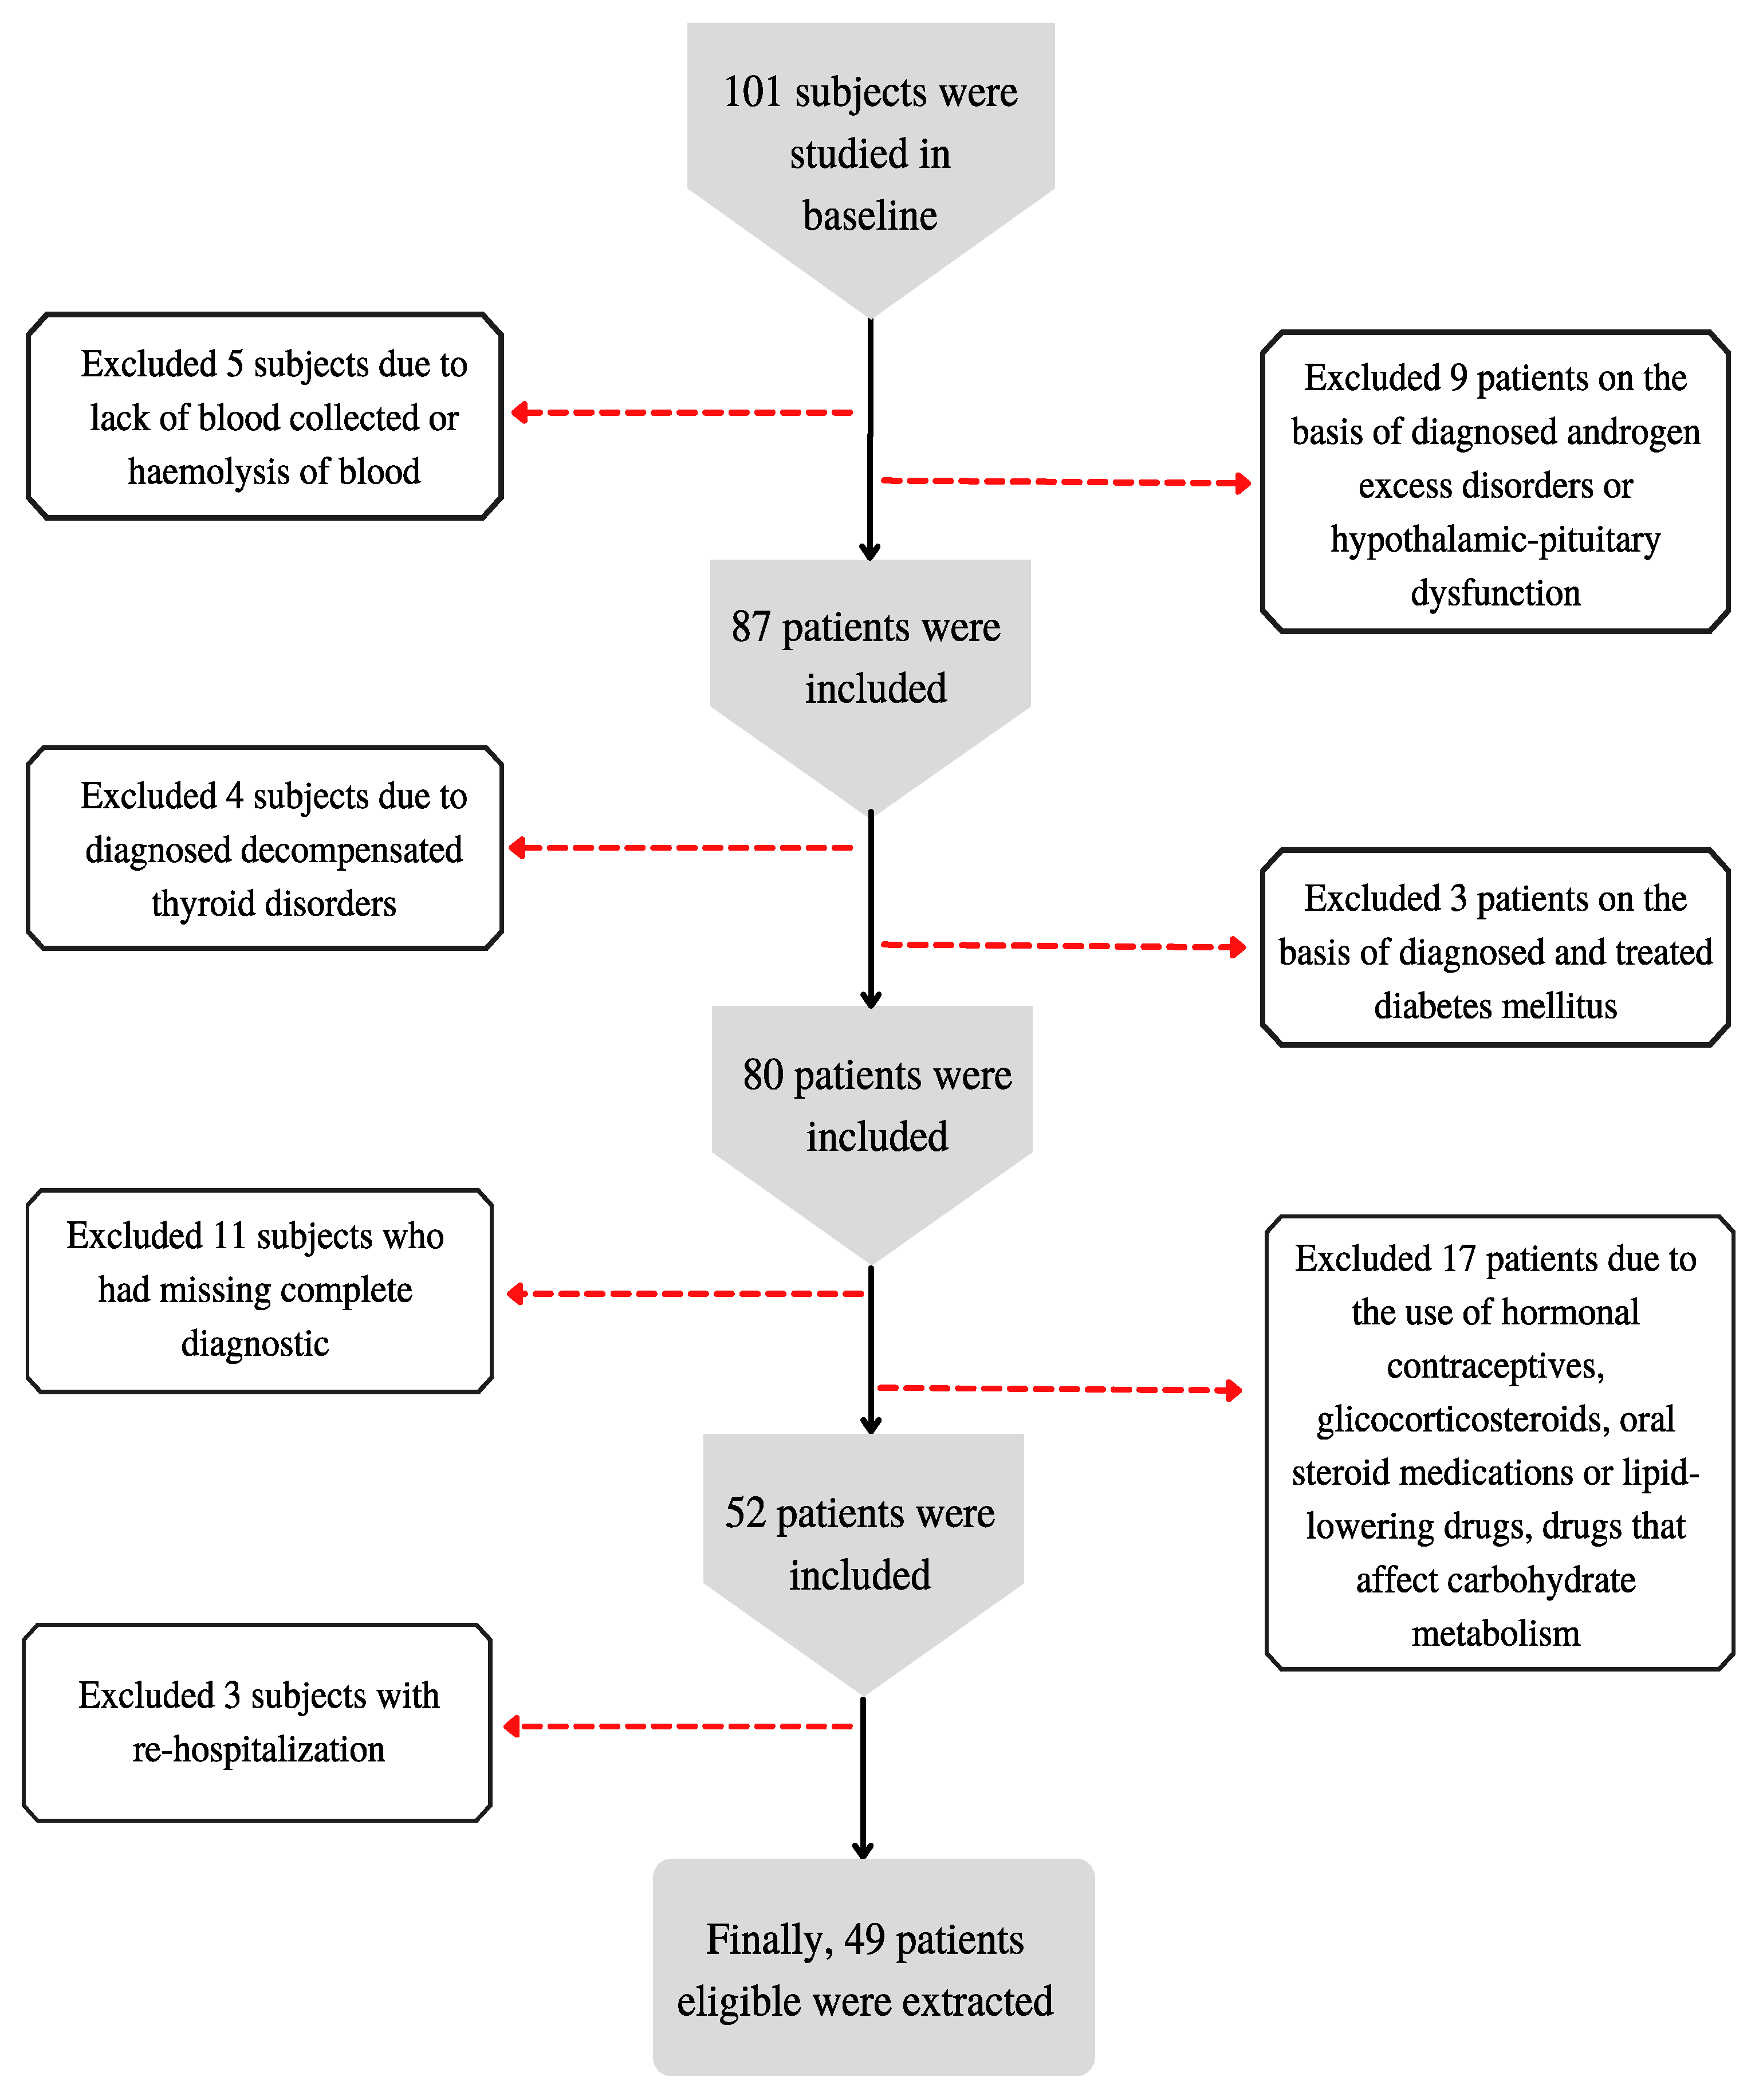
This cross-sectional study consisted of 101 woman (aged 18–39; the median age was 25 years) who met the inclusion criteria for the study.
Criteria for selecting the subjects were as follows: diagnosed PCOS based on the Rotterdam criteria from 2003 (at least two of the following three criteria were met: oligo ovulation or anovulation, clinical and/or biochemical hyperandrogenism, polycystic ovaries visualized on ultrasound—12 or more follicles 2–9 mm in diameter in each ovary and/or increased ovary volume > 10 mL [1]); patient consent to the examination; aged between 18 and 40.
Exclusion criteria were as follows: the patient’s lack of consent to participate in the study; condition after implantation of cardiac pacemaker; pregnancy; lower limbs prostheses; foot dressings; no blood collected as part of routine or haemolysis of the blood; use of hormonal contraceptives, glicocorticosteroids, oral steroid medications or lipid-lowering drugs, or drugs that affect carbohydrate metabolism; previously diagnosed and treated diabetes mellitus; decompensated thyroid disorders; androgen excess disorders (congenital or late-onset Cushing’s disease/syndrome, congenital adrenal hyperplasia, androgen-secreting tumors, idiopathic hirsutism, hyperprolactinemia); depressive disorders and treatment of depression; diagnostic incomplete; re-hospitalization.
A small sample was chosen because of the expected difficulty in obtaining women who met the inclusion criteria. The algorithm for qualifying patients for the study is presented in Figure 1.
The study conforms to the Declaration of Helsinki and was reviewed by the bioethics committee of the Medical University of Silesia (KNW/0022/KB1/143/15). Informed consent for data analysis was obtained from all participants.

2.2. Methods

Data for this study were collected between 2015 and 2018 at the Department of Endocrinology, Piekary Medical Centre, St. Luke’s Local Hospital in Piekary Śląskie, Poland.
Blood samples were taken from patients as part of routine measurements in the morning, before breakfast by qualified staff of the Department. One milliliter of blood, collected as part of routine tests, was preserved for further analysis and, after centrifugation, was frozen and stored at −70 degrees Celsius until the fetuin-A determinations were made. Other biochemical parameters (glucose levels, HbA1c, creatinine, GFR, total cholesterol, HDL, LDL, TG, CRP) and morphology (Hb, RBC, WBC, HCT, PLT, MCV, MCH, MCHC) were also determined and used for the calculation of three atherogenic indices: Castelli’s risk index-I (TC/HDL-C) and Castelli’s risk index-II (LDL-C/HDL-C), Atherogenic coefficient (AC) (TC-HDL-C/HDL-C), and Atherogenic index of plasma (AIP) (log(TG/HDL-C)).
Fasting anthropometric parameters were measured with the use of standard methods. These measurements included body weight (kg), height (cm), waist circumference (cm), and hip circumference (cm). Anthropometric indices calculated from these measurements included: BMI (Body Mass Index) = body weight (kg)/height (m2), WHR (Waist to Hip Ratio) = waist circumference (cm)/hip circumference (cm), WHtR (Waist to Height Ratio) = waist circumference (cm)/height (cm), BAI (Body Adiposity Index) = (hip circumference (cm)/height (m1.5)) − 18, VAI (Visceral Adiposity Index) = (waist circumference (cm)/(36.58 + [1.89 × BMI])) × (triglyceride concentration (mmol/L)/0.81) × (1.52/HDL concentration (mmol/L)), LAP (Lipid Accumulation Product) = (waist circumference (cm) − 58) × (triglyceride concentration (mmol/L)), BRI (Body Roundness Index) = 365.2 − 365.5 × √(1 − ((WC/2π)2)/[(0.5 × height)]2), ABSI (A Body Shape Index) = WC(m)/((BMI)2/3) × (height (m)1/2). The ABSI was also converted to z-scores, which include mortality risk in correlation with age and gender [26,29,30,31].
Body composition analysis was performed using the TANITA BC 420 MA analyzer (TANITA, Japan) with a certificate MDD 93/42 EEC for medical devices.
The tested measurements and anthropometric measurements, cut-off values, and standards are presented in Table 1.
Criteria for diagnosing hypertension, dyslipidemia (hypercholesterolemia, hypertriglyceridemia, mixed hyperlipidemia) [36], impaired fasting glucose, impaired glucose tolerance, diabetes mellitus, insulin resistance [37], and hypothyroids were as follows: hypertension: ≥140/90 without diagnosed hypertension or diagnosed hypertension, hypercholesterolemia: TC ≥ 4.921 mmol/L, hypertriglyceridemia: TG ≥ 1.694 mmol/L, mixed, hyperlipidemia: TC ≥ 4.921 mmol/L and TG ≥ 1.694 mmol/L, impaired fasting glucose 100–125 mg/dL, impaired glucose tolerance: at 120 min of OGTT blood glucose 140–199 mg/dL, diabetes mellitus—one of the following criteria: (1). symptoms of hyperglycaemia and random glycemia > 200 mg/dL, (2). two times fasting blood glucose ≥ 126 mg/dL, (3). 120-min glycemia OGTT ≥ 200 mg/dL, insulin resistance—as a limit value is HOMA-IR > 2, hypertension: TSH > 4.0 µIU/mL, fT3 < 3.0 pmol/L, fT4 < 10 pmol/L.

2.3. Laboratory Measurements

Fasting fetuin-A concentrations were determined in duplicates using the ELISA method. The BioVendor kit (Human Fetuin-A Elisa BioVendor, Czech Republic) was utilized. The intra-assay and inter-assay coefficient of variation were 2.9% and 4.7%, respectively. The tests were performed in accordance with the manufacturer’s instructions.
The value of the HOMA-IR (Homeostatic model assessment) index was calculated using the following formula:
HOMA-IR = fasting insulinemia (mU/mL) × fasting glycemia (mmol/L)/22.5.

2.4. Statistical Analysis

Statistical analysis was performed using the STATISTICA 13 PL software (Tulsa, OK, USA).
Continuous variables are expressed as means ± standard deviations (for normally distributed data) or median and interquartile range (for nonparametric data). The Shapiro–Wilk test was used to test the distribution. Normally distributed data were compared using the Student’s t-test, while nonparametric data were compared using the Mann–Whitney U test. A correlation between variables was evaluated using Pearson’s correlation coefficient (normal distribution) and Spearman’s rank correlation coefficient (non-normal distribution). A p value of less than 0.05 was considered significant.

3. Results

Characteristics of the Study Group

A total of 49 women with PCOS diagnosis were included in the study. The median age of women was 25.00 (22.00–29.00) years. Baseline clinical and laboratory characteristic as well as anthropometric parameters and body composition of the study group are shown in Table 2 and Table 3.
Obesity was diagnosed in 18 patients (36.7%) based on BMI index and 7 patients (14.3%) based on BAI index. A significantly increased risk of metabolic complications was observed among 26 patients (53.1%) based on waist circumferences. Based on VAI index, risk of metabolic disease was observed among 17 women (34.7%).
Dyslipidemia, such as hypercholesterolemia, hypertriglyceridemia, and mixed hyperlipidemia was detected among 14 patients (28.6%), and insulin resistance was observed among 29 (59.2%). More information about risk of health and health conditions in the analyzed group are presented in Table 4.
There was an observed positive correlation between fetuin-A and total cholesterol (R = 0.302, p = 0.035). No significant correlation was found between fetuin-A concentration and the remaining laboratory results, nor with the anthropometric measurements/indices or the body composition analysis (Table 5).
There is no significant difference in mean concentration of fetuin-A among the groups of women regarding anthropometric parameters and indices and health status (Table 6).

4. Discussion

Overweight and obesity affect a large number of women (38–88%) suffering from PCOS. Therefore, it is important to determine the risk factors and complications related to overweight and obesity in women with this disorder. All of the above affect the clinical state and endocrine function in these women [38]. Our study is the first to assess the link between a significant amount of anthropometric measurements, indices, and body compositions, as well as atherogenic indices and fetuin-A concentrations in PCOS patients. Ix et al. focused on elderly patients (70–79 years of age) and showed a relationship between fetuin-A concentration and increased visceral adipose tissue during five-year follow-up. However, no relationship was found with respect to other studied elements of body composition [39]. Brix et al. examined patients with morbid obesity and found that fetuin-A concentration decreased in patients who lost weight after bariatric surgery [40]. Kozakowski et al. examined 40 PCOS women (26 lean and 15 obese) [41]. Based on BMI, no significant differences in fetuin-A concentration were found between the groups of obese and lean PCOS patients. Similarly, we did not find any relationship between the concentration of fetuin-A and body composition parameters, anthropometric parameters, and anthropometric indices. However, no previous study has investigated a correlation between anthropometric indices (VAI, BAI, LAP, BRI, ABSI, ABSI z-core) and serum of fetuin-A concentration in woman with PCOS. Moreover, to date only a few studies have used AIP indicators in woman with PCOS to analyze the risk of cardiometabolic disease. We found one study that examined the values of the HOMA-IR, Castelli Index, and AIP in PCOS [42]. Nawrocka-Rutkowska et al. highlights that the Castelli index and AIP are useful additional parameters to determine the risk of cardiometabolic disease in PCOS patients, especially with insulin resistance. Similarly, Kheirollahi et al. found that the use of indices (TG/HDL-C), Castelli index-I (TC/HDL-C), and TG is recommended in the assessment of insulin resistance risk among Iranian woman with PCOS [43].
IR is highly prevalent in PCOS (50–70%) [19]. By exerting the effect on ovarian androgen synthesis and decreased synthesis of sex hormone binding globulin (SHBG), insulin resistance may be responsible for the development of hyperandrogenism [44]. Fetuin-A, as a physiological inhibitor of insulin receptor tyrosine kinase, aggravates the risk of IR and type 2 diabetes [21]. Aroner et al. studied 455 patients with diabetes mellitus and 1957 healthy persons aged between 45 and 84. They found a strong correlation between higher concentrations of fetuin-A and the risk of diabetes mellitus in women. Regarding men, the correlation was not as strong as in women [45]. Similar results were obtained by Iyidir et al. in relation to gestational diabetes mellitus. The study group consisted of 26 pregnant women with gestational diabetes mellitus and 24 healthy pregnant women. Fetuin-A concentration were also evaluated in 18 women with gestational diabetes mellitus after delivery. Women with gestational diabetes were reported to have higher fetuin-A concentrations when compared to women after delivery [46]. Nevertheless, when considering patients with PCOS, the importance of fetuin-A in the pathogenesis of insulin resistance and dyslipidemia is not clear. In a study by Enli et al., 22 PCOS women aged 16–36 and 21 healthy women aged 18–36 were examined. PCOS women had significantly higher fetuin-A concentrations in comparison to healthy women. A positive correlation was found between fetuin-A concentration and insulin concentration and HOMA-IR index and FAI index [23]. Contrary to this, we did not find similar correlations in our study. Abali et al. [24] examined 35 PCOS women and 37 healthy women. As a result, no significant correlation was noted between fasting glucose, HOMA-IR, HBA1C, and fetuin-A concentrations in either study groups; however, a significant correlation was observed between fetuin-A concentrations and fasting insulin in healthy women. There was a significant difference in the concentration of fetuin-A between the study groups, which was also reported by Enli et al. [23]. In a study by Gulhan et al., there was no difference in fetuin-A concentration in the studied groups (44 women with PCOS aged 17–36 and 44 controls aged 18–38). However, a correlation between fetuin-A concentration and glycemia in PCOS patients was found [25]. We did not find any correlation between fetuin-A concentration and HOMA-IR, fasting insulin, fasting glucose, HbA1C, or glucose tolerance test results.
In addition to symptoms related to PCOS, they previously described diabetes mellitus, obesity, or insulin resistance; there are also others components (e.g., hypertension and dyslipidemia) that may increase the risk of cardiovascular disorders in PCOS. Some of them are coincident with metabolic syndrome components (central obesity, hypertriglyceridemia, decreased HDL cholesterol, hypertension, and abnormal glucose concentration). Therefore, PCOS patients also have an increased risk of metabolic syndrome [12,47]. We demonstrated that total cholesterol increased with the elevation of the fetuin-A concentration. Similar results were reported by Abali et al., who found a significant relationship between fetuin-A concentration and total cholesterol, LDL cholesterol, and triglyceride concentration, but no correlation between fetuin-A concentration and other parameters (e.g., BMI, HDL, fasting glucose, fasting insulin, HOMA-IR, or HBA1C) [24]. There is lack of correlation between fetuin-A and IR and BMI, but the positive correlation with TC remains unexplained. The hypothesis led by Ix et al. suggests that fetuin-A, by acting as a physiological tyrosine kinase inhibitor, can lead to hyperlipidemia through decreased insulin activity, resulting in increased lipolysis in the adipose tissue. By this mechanism the free fatty acids may be effluxed [24,48]. Low fetuin-A concentrations may predict cardiovascular risk. Moreover, fetuin-A may be a potent inhibitor in vascular calcification. It is possible that the upleveled calcification may shift the improvements in dyslipidemia [48]. Due to its possible complex explanation and underlying mechanism, the clinical relevance of the correlation between fetuin-A levels and its influential part on total cholesterol need to be confirmed in future studies.

5. Study Strength and Limitations

The study has a few limitations. Firstly, the study group was small, rendering not significant. However, the large number of exclusion criteria resulted in a very homogeneous group. Notwithstanding, studies on fetuin-A all had a similar number of participants to our study, from 11 patients with PCOS to 88 patients. The wide spectrum of PCOS clinical presentations may have various outcomes. In reviewing the literature, no data were found on the association between fetuin-A concentration and anthropometric indices (VAI, BAI, LAP, ABSI, ABSI z-core). This study provided an important opportunity to advance the understanding of fetuin-A concentrations and body composition, anthropometric indices, and metabolic disorders in woman with PCOS. Future studies that take these variables into account will need to be undertaken. More information on the relationship between fetuin-A concentrations and anthropometric indices would help us to establish a greater degree of accuracy in this matter.

6. Conclusions

Our study evaluated relationship between fetuin-A concentration with other metabolic parameters and indices in women with PCOS. We found that fetuin-A correlates with hypercholesterolemia. No significant correlation was found between fetuin-A concentration and the anthropometric measurements/indices, atherogenic indices, glucose parameter, or the body composition analysis. Based on our results, fetuin-A would not be a possible marker for PCOS women to evaluate cardiometabolic risk, especially glucose parameters and anthropometric parameters/indices. The effects of concentration of fetuin-A and anthropometric indices (BAI, VAI, LAP, ABSI, ABSI z-core) in woman with PCOS have not been closely examined before. It is necessary to conduct further research regarding the relationship between fetuin-A concentrations and body composition, anthropometric indices, and metabolic disorders in women with PCOS.

Author Contributions

Conceptualization, K.K.-K., M.J., J.N. and B.Z.-S.; methodology, K.K.-K., M.J., J.N. and B.H.; software, B.H. and P.J.; validation, K.K.-K., M.J., J.N. and B.Z.-S.; formal analysis, M.J., J.N. and B.Z.-S.; investigation, K.K.-K. and J.N.; resources, J.N. and B.Z.-S.; data curation, J.N. and P.J.; writing—original draft preparation, K.K.-K., M.J., J.N., B.Z.-S. and B.H.; writing—review and editing, M.J., J.N., B.Z.-S. and B.H.; visualization, J.N., M.J. and B.Z.-S.; supervision, J.N., B.Z.-S. and B.H.; project administration, J.N.; funding acquisition, J.N. and B.Z.-S. All authors have read and agreed to the published version of the manuscript.

Funding

This research received no external funding.

Institutional Review Board Statement

The study was conducted according to the guidelines of the Declaration of Helsinki and was approved by the bioethics board at the Medical University of Silesia (KNW/0022/KB1/143/15).

Informed Consent Statement

Informed consent was obtained from all subjects involved in the study.

Data Availability Statement

All data are available via email from [email protected].

Conflicts of Interest

All authors declare no conflict of interest with regard to this manuscript.

References

  1. Li, F.; Yao, L.; Wu, H.; Cao, S. Analysis on endocrine and metabolic features of different phenotypes of polycystic ovary syndrome patients. Pak. J. Pharm. Sci. 2016, 29, 1735–1738. [Google Scholar] [PubMed]
  2. Yoo, H.J.; Choi, K.M. Hepatokines as a link between obesity and cardiovascular diseases. Diabetes Metab. J. 2015, 39, 10–15. [Google Scholar] [CrossRef] [PubMed]
  3. El-Deeb, T.S.; Bakkar, S.M.; Eltoony, L.; Zakhary, M.M.; Kamel, A.A.; Nafee, A.M.; Hetta, H.F. The adipokine Chemerin and Fetuin-a serum levels in type 2 diabetes mellitus: Relation to obesity and inflammatory markers. Egypt J. Immunol. 2018, 25, 191–202. [Google Scholar] [PubMed]
  4. Díaz, M.; Gallego-Escuredo, J.M.; López-Bermejo, A.; de Zegher, F.; Villarroya, F.; Ibáñez, L. Low-dose spironolactone-pioglitazone-metformin normalizes circulating Fetuin-a concentrations in adolescent girls with polycystic ovary syndrome. Int. J. Endocrinol. 2018, 2018, 4192940. [Google Scholar] [CrossRef] [PubMed]
  5. Khadir, A.; Kavalakatt, S.; Madhu, D.; Hammad, M.; Devarajan, S.; Tuomilehto, J.; Tiss, A. Fetuin-A levels are increased in the adipose tissue of diabetic obese humans but not in circulation. Lipids Health Dis. 2018, 17, 291. [Google Scholar] [CrossRef]
  6. Bayramoğlu, E.; Çetinkaya, S.; Özalkak, S.; Kurnaz, E.; Demirci, G.; Öztürk, H.S.; Savaş-Erdeve, Ş.; Aycan, Z. Evaluation of the pathophysiological role of Fetuin A levels in adolescents with polycystic ovary syndrome. J. Pediatr. Endocrinol. Metab. 2021, 34, 911–916. [Google Scholar] [CrossRef]
  7. Ramanjaneya, M.; Bensila, M.; Bettahi, I.; Jerobin, J. Dynamic Changes in Circulating Endocrine FGF19 Subfamily and Fetuin-A in Response to Intralipid and Insulin Infusions in Healthy and PCOS Woman. Front. Endocrinol. 2020, 11, 1568500. [Google Scholar] [CrossRef]
  8. Gupta, V.; Mishra, S.; Mishra, S.; Gupta, V. A ratio, Insulin resistance and metabolic risk in women with polycystic ovarian syndrome. Diabetes Metab. Syndr. 2017, 11 (Suppl. S2), S697–S701. [Google Scholar] [CrossRef]
  9. Gunning, M.N.; Fauser, B.C.J.M. Are women with polycystic ovary syndrome at increased cardiovascular disease risk later in life? Climacteric 2017, 20, 222–227. [Google Scholar] [CrossRef]
  10. Panico, A.; Messina, G.; Lupoli, G.A.; Lupoli, R.; Cacciapuoti, M.; Moscatelli, F.; Esposito, T.; Villano, I.; Valenzano, A.; Monda, V.; et al. Quality of life in overweight (obese) and normal-weight women with polycystic ovary syndrome. Patient Prefer. Adherence 2017, 11, 423–429. [Google Scholar] [CrossRef] [Green Version]
  11. Cosar, E.; Üçok, K.; Akgün, L.; Koken, G.; Sahin, F.K.; Arioz, D.T.; Baş, O. Body fat composition and distribution in women with polycystic ovary syndrome. Gynecol. Endocrinol. 2008, 24, 428–432. [Google Scholar] [CrossRef] [PubMed]
  12. Zheng, J.; Yin, Q.; Cao, J.; Zhang, B. Obesity contributes more to increasing ApoB/ApoA1 ratio than hyperandrogenism in PCOS women aged 20–38 years in China. Exp. Ther. Med. 2017, 13, 1337–1342. [Google Scholar] [CrossRef] [PubMed]
  13. Naito, C.; Hashimoto, M.; Watanabe, K.; Shirai, R.; Takahashi, Y.; Kojima, M.; Watanabe, R.; Sato, K.; Iso, Y.; Matsuyama, T.-A.; et al. Facilitatory effects of fetuin-A on atherosclerosis. Atherosclerosis 2016, 246, 344–351. [Google Scholar] [CrossRef]
  14. Bourebaba, L.; Marycz, K. Pathophysiological Implication of Fetuin-A Glycoprotein in the Development of Metabolic Disorders: A Concise Review. J. Clin. Med. 2019, 8, 2033. [Google Scholar] [CrossRef]
  15. Sangouni, A.A.; Sasanfar, B.; Ghadiri-Anari, A.; Hosseinzadeh, M. Effect of l-carnitine supplementation on liver fat content and cardiometabolic indices in overweight/obese women with polycystic ovary syndrome: A randomized controlled trial. Clin. Nutr. ESPEN 2021, 46, 54–59. [Google Scholar] [CrossRef] [PubMed]
  16. Mancuso, E.; Spiga, R.; Rubino, M.; Averta, C.; Rotundo, S.; Segura-Garcìa, C.; Mannino, G.C.; Sesti, G.; Andreozzi, F. Effects of Alpha-2-HS-glycoprotein on cognitive and emotional assessment in prediabetic and diabetic subjects. J. Affect. Disord. 2021, 282, 700–706. [Google Scholar] [CrossRef]
  17. Westenfeld, R.; Schäfer, C.; Krüger, T.; Haarmann, C.; Schurgers, L.J.; Reutelingsperger, C.; Ivanovski, O.; Drueke, T.; Massy, Z.A.; Ketteler, M.; et al. Fetuin-A protects against atherosclerotic calcification in CKD. J. Am. Soc. Nephrol. 2009, 20, 1264–1274. [Google Scholar] [CrossRef]
  18. Gurbuz, T.; Alanya Tosun, S.; Cebi, A.; Gokmen, O.; Usta, M. Investigating Fetuin-A and Paraoxonase-1 Activity as Markers in Polycystic Ovary Syndrome Based on Body Mass Index: A Prospective Case-Control Study. Cureus 2021, 13, e18553. [Google Scholar] [CrossRef]
  19. bin Ali, A.; Zhang, Q.; Lim, Y.K.; Fang, D.; Retnam, L.; Lim, S.K. Expression of major HDL-associated antioxidant PON-1 is gender dependent and regulated during inflammation. Free Radic. Biol. Med. 2003, 34, 824–829. [Google Scholar] [CrossRef]
  20. Icer, M.A.; Yıldıran, H. Effects of fetuin-A with diverse functions and multiple mechanisms on human health. Clin. Biochem. 2021, 88, 1–10. [Google Scholar] [CrossRef]
  21. Pérez-Sotelo, D.; Roca-Rivada, A.; Larrosa-García, M.; Castelao, C.; Baamonde, I.; Baltar, J.; Crujeiras, A.B.; Seoane, L.M.; Casanueva, F.F.; Pardo, M. Visceral and subcutaneous adipose tissue express and secrete functional alpha2hsglycoprotein (fetuin a) especially in obesity. Endocrine 2017, 55, 435–446. [Google Scholar] [CrossRef] [PubMed]
  22. Sartori, C.; Lazzeroni, P.; Merli, S.; Patianna, V.D.; Viaroli, F.; Cirillo, F.; Amarri, S.; Street, M.E. From Placenta to Polycystic Ovarian Syndrome: The Role of Adipokines. Mediat. Inflamm. 2016, 2016, 4981916. [Google Scholar] [CrossRef] [PubMed]
  23. Enli, Y.; Fenkci, S.M.; Fenkci, V.; Oztekin, O. Serum Fetuin-A levels, insulin resistance and oxidative stress in women with polycystic ovary syndrome. Gynecol. Endocrinol. 2013, 29, 1036–1039. [Google Scholar] [CrossRef] [PubMed]
  24. Abali, R.; Celik, C.; Tasdemir, N.; Guzel, S.; Alpsoy, S.; Yuksel, A.; Celik, E. The serum protein α2-Heremans-Schmid glycoprotein/fetuin-a concentration and carotid intima-media thickness in women with polycystic ovary syndrome. Eur. J. Obstet. Gynecol. Reprod. Biol. 2013, 169, 45–49. [Google Scholar] [CrossRef]
  25. Gulhan, I.; Bozkaya, G.; Oztekin, D.; Uyar, I.; Kebapcilar, A.G.; Pamuk, B. Serum Fetuin-A levels in women with polycystic ovary syndrome. Arch. Gynecol. Obstet. 2012, 286, 1473–1476. [Google Scholar] [CrossRef]
  26. Głuszek, S.; Cieśla, E.; Głuszek-Osuch, M.; Kozieł, D.; Kiebzak, W.; Wypchło, Ł.; Suliga, E. Anthropometric indices and cut-off points in the diagnosis of metabolic disorders. PLoS ONE 2020, 15, e0235121. [Google Scholar] [CrossRef]
  27. Brończyk-Puzoń, A.; Jagielski, P.; Kulik-Kupka, K.; Koszowska, A.; Nowak, J.; Zubelewicz-Szkodzińska, B. Usefulness of a new anthropometric indicator—VAI (Visceral Adiposity Index) in the evaluation of metabolic and hormonal disorders in women with polycystic ovary syndrome. Adv. Clin. Exp. Med. 2017, 26, 825–828. [Google Scholar] [CrossRef]
  28. Li, Y.-W.; Kao, T.-W.; Chang, P.-K.; Chen, W.-L.; Wu, L.-W. Atherogenic index of plasma as predictors for metabolic syndrome, hypertension and diabetes mellitus in Taiwan citizens: A 9-year longitudinal study. Sci. Rep. 2021, 11, 9900. [Google Scholar] [CrossRef]
  29. Walczyk, T. Anthropometric indicators of obesity. Are the new indicators a better predictor of body fat content than BMI? J. Educ. Health Sport 2021, 11, 11–23. [Google Scholar] [CrossRef]
  30. Wilczyński, M.; Domańska-Senderowska, D.; Kassassir-Ćwiklak, S.A.; Janas, Ł.; Malinowski, J.; Wilczyński, R. A body shape index (ABSI) and endometrial pathology. Women Health 2021, 61, 313–321. [Google Scholar] [CrossRef]
  31. Bawadi, H.; Abouwatfa, M.; Alsaeed, S.; Kerkadi, A.; Shi, Z. Body Shape Index Is a Stronger Predictor of Diabetes. Nutrients 2019, 11, 1018. [Google Scholar] [CrossRef] [PubMed]
  32. World Health Organization. Waist Circumference and Waist-Hip Ratio; Report of a WHO Expert Consultation; World Health Organization: Geneva, Switzerland, 2011. [Google Scholar]
  33. Weir, C.B.; Jan, A. BMI Classification Percentile and Cut Off Points. [Updated 2021 Jun 29]. In StatPearls [Internet]; StatPearls Publishing: Treasure Island, FL, USA, 2022. Available online: https://www.ncbi.nlm.nih.gov/books/NBK541070/ (accessed on 12 July 2022).
  34. Lizak, D.; Budzowski, A.; Seń, M.; Czarny, W. Anthropometric measures of body composition used in obesity diagnosis—An overview. Hyg. Pub. Health 2016, 51, 124–280. [Google Scholar]
  35. Ahn, N.; Baumeister, S.E.; Amann, U.; Rathmann, W.; Peters, A.; Huth, C.; Thorand, B.; Meisinger, C. Visceral adiposity index (VAI), lipid accumulation product (LAP), and product of triglycerides and glucose (TyG) to discriminate prediabetes and diabetes. Sci. Rep. 2019, 9, 9693. [Google Scholar] [CrossRef]
  36. Gumprecht, J. Zalecenia kliniczne u chorych na cukrzycę 2016. Stanowisko Polskiego Towarzystwa Diabetologicznego. Diabetol. Klin. 2016, 5, A1–A76. [Google Scholar]
  37. Kośmicki, M. Zaburzenia lipidowe u pacjentów z chorobami układu sercowo- naczyniowego. Część I: Leczenie statynami. Przew. Lek. 2000, 3, 35–46. [Google Scholar]
  38. Barber, T.M.; McCarthy, M.I.; Wass, J.A.H.; Franks, S. Obesity and polycystic ovary syndrome. Clin. Endocrinol. 2006, 65, 137–145. [Google Scholar] [CrossRef] [PubMed]
  39. Ix, J.H.; Wassel, C.L.; Chertow, G.M.; Koster, A.; Johnson, K.C.; Tylavsky, F.A.; Cauley, J.A.; Cummings, S.R.; Harris, T.B.; Shlipak, M.G.; et al. Health Aging and Body Composition Study: Fetuin-A and change in body composition in older persons. J. Clin. Endocrinol. Metab. 2009, 94, 4492–4498. [Google Scholar] [CrossRef]
  40. Brix, J.M.; Stingl, H.; Höllerl, F.; Schernthaner, G.H.; Kopp, H.P.; Schernthaner, G. Elevated Fetuin-A concentrations in morbid obesity decrease after dramatic weight loss. J. Clin. Endocrinol. Metab. 2010, 95, 4877–4881. [Google Scholar] [CrossRef]
  41. Kozakowski, J.; Jeske, W.; Zgliczyński, W. Fetuin-A levels in lean and obese women with polycystic ovary syndrome. Endokrynol. Pol. 2014, 65, 371–376. [Google Scholar] [CrossRef]
  42. Nawrocka-Rutkowska, J.; Szydłowska, I.; Jakubowska, K.; Olszewska, M.; Chlubek, S.; Szczuko, M.; Starczewski, A. The role of Oxidative Stress in the Risk of Cardiovascular Disease and Identification of Risk Factors Using AIP and Castelli Atherogenicity Indicators in Patients with PCOS. Biomedicines 2022, 10, 1700. [Google Scholar] [CrossRef]
  43. Kheirollahi, A.; Teimouri, M.; Karimi, M.; Vatannejad, A.; Moradi, N.; Borumandnia, N.; Sadeghi, A. Evalutation of lipid ratios and triglyceride-glucose index as risk markers of insulin resistance in Iranian polycystic ovary syndrome women. Lipids Health Dis. 2020, 19, 235. [Google Scholar] [CrossRef] [PubMed]
  44. Galluzzo, A.; Amato, M.C.; Giordano, C. Insulin resistance and polycystic ovary syndrome. Nutr. Metab. Cardiovasc. Dis. 2008, 18, 511–518. [Google Scholar] [CrossRef] [PubMed]
  45. Aroner, S.A.; Mukamal, K.J.; St-Jules, D.E.; Budoff, M.J.; Katz, R.; Criqui, M.H.; Allison, M.A.; de Boer, I.H.; Siscovick, D.S.; Ix, J.H.; et al. Fetuin-A and Risk of Diabetes Independent of Liver Fat Content: The Multi-Ethnic Study of Atherosclerosis. Am. J. Epidemiol. 2017, 185, 54–64. [Google Scholar] [CrossRef] [Green Version]
  46. Iyidir, O.T.; Degertekin, C.K.; Yilmaz, B.A.; Altinova, A.E.; Toruner, F.B.; Bozkurt, N.; Ayvaz, G.; Akturk, M. Serum levels of fetuin A are increased in women with gestational diabetes mellitus. Arch. Gynecol. Obstet. 2015, 291, 933–937. [Google Scholar] [CrossRef]
  47. Ehrmann, D.A.; Liljenquist, D.R.; Kasza, K.; Azziz, R.; Legro, R.S.; Ghazzi, M.N. Prevalence and predictors of the metabolic syndrome in women with polycystic ovary syndrome. J. Clin. Endocrinol. Metab. 2006, 91, 48–53. [Google Scholar] [CrossRef] [PubMed]
  48. Ix, J.H.; Shlipak, M.G.; Brandenburg, V.M.; Ali, S.; Ketteler, M.; Whooley, M.A. Association Between Human Fetuin-A and the Metabolic Syndrome. Circulation 2006, 113, 1760–1767. [Google Scholar] [CrossRef] [PubMed] [Green Version]
Figure 1. Patient qualification algorithm for the study.
Nutrients 14 04034 g001
Table 1. Interpretation of anthropometric parameters and indices.
Tested Measurements and Anthropometric IndicatorsStandardsInterpretation of StandardsReferences
WC (cm)>88 cmsignificantly increased risk of metabolic complications[32]
BMI Index (kg/m2)<18.5 kg/m2underweight[33]
18.5–24.9 kg/m2normal body weight
25.0–29.9 kg/m2overweight
30.0–34.9 kg/m2I obesity
35.0–39.9 kg/m2II obesity
≥40.0 kg/m2III obesity
WHR≥0.85increasing the risk of metabolic complications[32]
WHtR≥0.5abdominal obesity[32]
increased risk
cardiovascular diseases
and diabetes
BAI [%]<21%underweight[34]
21–33%standard
>33%overweight
>39%obesity
VAI>1.675risk of metabolic diseases[27]
LAP<41.30discrimination of prediabetes/diabetes[35]
BRI<4.910risk of metabolic diseases[26]
ABSI<0.076risk of diabetes and CVD[26,29]
ABSI z-score<−0.868mortality risk—very low[29,30,31]
−0.868 and −0.272mortality risk—low
−0.272 and +0.229mortality risk—average
0.229 and 0.798mortality risk—high
>0.798mortality risk—very high
WC, waist circumference; BMI, body mass index; WHR, waist to hip ratio; WHtR, waist to height ratio; BAI, body adiposity index; VAI, visceral adiposity index; LAP, lipid accumulation product; BRI, body roundness index; ABSI, a body shape index; CVD, cardiovascular diseases.
Table 2. Baseline clinical and laboratory characteristic.
ParameterTotal Group (N)
Age (years)26.29 ± 5.97 (49)
Biochemical parameters
Fetuin (µg/mL)226.75 (201.16–289.71) (49)
TSH (uIU/mL)2.19 ± 1.07 (49)
Fasting insulin (pmol/L)77.13 (48.07–106.91) (49)
Fasting glucose (mmol/L)5.04 ± 0.68 (49)
Glucose after 120 min (glucose tolerance test) (mmol/L)6.47 (5.36–7.77) (40)
Glucose after 60 min (glucose tolerance test) (mmol/L)8.01 ± 2.42 (39)
Insulin after 60 min (glucose tolerance test) (pmol/L)703.15 (325.03–835.17) (36)
HbA1c (%)5.16 ± 0.91 (25)
HOMA-IR index2.65 (1.40–4.08) (49)
Total cholesterol (mmol/L)4.94 ± 1.05 (49)
HDL cholesterol (mmol/L)1.67 ± 0.49 (49)
LDL cholesterol (mmol/L)2.41 (2.06–3.29) (49)
Triglycerides (mmol/L)0.93 (0.67–1.63) (49)
CRP (mg/L)14.29 (3.81–49.52) (47)
Atherogenic indices
Castelli’s risk index-I2.92 (2.23–3.87) (49)
Castelli’s risk index-II1.65 (1.06–2.33) (49)
Atherogenic Index of plasma−0.19 ± 0.33 (49)
Atherogenic coefficient1.92 (1.23–2.87) (49)
TSH, thyroid-stimulating hormone; HOMA-IR, homeostatic model assessment; HBA1C, glycated hemoglobin (A1c); HDL cholesterol, high density lipoprotein; LDL cholesterol, low-density lipoprotein; ±SD, standard deviation; Q1, lower of quartile; Q3, upper of quartile.
Table 3. Anthropometric and body composition measurements.
ParameterTotal Group (N)
Body weight (kg)77.42 ± 21.03 (49)
Height (cm)164.91 ± 5.84 (49)
Waist circumference (cm)91.11 ± 18.87 (49)
Hip circumference (cm)108.12 ± 13.30 (49)
BMI index (kg/m2)28.34 ± 7.13 (49)
WHR0.84 ± 0.10 (49)
WHtR0.55 ± 0.11 (49)
BAI (%)33.04 ± 5.69 (49)
VAI1.22 (0.64–2.29) (49)
LAP36.16 (9.83–67.80) (49)
BRI4.63 ± 2.38 (49)
ABSI0.08 ± 0.01 (49)
Body composition
Body fat mass (kg)48.37 ± 6.13 (49)
Percent of body fat (%)37.73 ± 10.26 (49)
Lean body mass (kg)48.37 ± 6.13 (49)
Muscle mass (kg)46.11 ± 6.15 (49)
Water content (kg)34.76 ± 5.38 (49)
Water content (%)46.45 ± 6.34 (49)
BMI, body mass index; WHR, waist to hip ratio; WHtR, waist to height ratio; BAI, body adiposity index; VAI, visceral adiposity index; LAP, lipid accumulation product; BRI, body roundness index; ABSI, body shape index; ±SD, standard deviation; Q1, lower of quartile; Q3, upper of quartile.
Table 4. Interpretation of anthropometric parameters and health status of the study group.
Weight status by BMI:
Underweight, n (%)1 (2.0)
Normal weight, n (%)17 (34.7)
Overweight, n (%)13 (26.5)
Obesity, n (%)18 (36.7)
Weight status by BAI:
Underweight, n (%)0 (0.0)
Normal weight, n (%)24 (49.0)
Overweight, n (%)18 (36.7)
Obesity, n (%)7 (14.3)
Waist circumference (WC):
Significantly increased risk of metabolic complications, n (%)26 (53.1)
WHR:
Increasing the risk of metabolic complications, n (%)22 (44.9)
WHtR:
Abdominal obesity increased risk of cardiovascular diseases and diabetes, n (%)30 (61.2)
VAI:
Risk of metabolic diseases, n (%)17 (34.7)
LAP:
Discrimination of prediabetes/diabetes, n (%)27 (55.10)
BRI:
Discrimination of prediabetes/diabetes, n (%)28 (57.14)
ABSI:
Risk of diabetes and cardiovascular disease, n (%)21 (42.9)
ABSI z-score:
Mortality risk—very low, n (%)14 (28.6)
Mortality risk—low, n (%)7 (14.3)
Mortality risk—average, n (%)12 (24.5)
Mortality risk—high, n (%)6 (12.2)
Mortality risk—very high, n (%)10 (20.4)
Hypertension, n (%)4 (8.2)
Dyslipidemia:
Hypercholesterolemia, n (%)10 (20.4)
Hypertriglyceridemia, n (%)2 (4.1)
Mixed hyperlipidemia, n (%)2 (4.1)
Impaired fasting glucose, n (%)5 (10.2)
Impaired glucose tolerance, n (%)9 (18.4)
Diabetes mellitus, n (%)3 (6.1)
Hypothyroidism, n (%)23 (46.9)
Insulin resistance, n (%)29 (59.2)
BMI, body mass index; WHR, waist to hip ratio; WHtR, waist to height ratio; BAI, body adiposity index; VAI, visceral adiposity index; LAP, lipid accumulation product; BRI, body roundness index; ABSI, body shape index.
Table 5. Correlation between fetuin-A and selected anthropometric and biochemical parameters.
NRp-Value
Body weight (kg)49−0.100.48
Waist circumference (cm)49−0.060.66
Hip circumference (cm)49−0.070.61
BMI index (kg/m2)49−0.060.65
WHR490.010.93
WHtR49−0.040.78
Percent of body fat (%)49−0.200.17
BAI (%)49−0.010.90
VAI490.080.57
LAP490.080.58
BRI49−0.040.78
ABSI490.030.83
Castelli’s risk index-I490.040.75
Castelli’s risk index-II490.030.82
Atherogenic Index of plasma490.070.62
Atherogenic coefficient490.040.75
Fasting insulin (pmol/L)49−0.080.56
Fasting glucose (mmol/L)49−0.110.42
Glucose after 120 min (mmol/L) (glucose tolerance test)400.040.80
Glucose after 60 min (mmol/L) (glucose tolerance test)390.080.62
Insulin after 60 min (pmol/L) (glucose tolerance test)36−0.060.70
HbA1c (%)25−0.130.52
HOMA-IR index490.090.50
Total cholesterol (mmol/L)490.300.03
HDL cholesterol (mmol/L)490.090.53
LDL cholesterol (mmol/L)490.140.30
Triglycerides (mmol/L)490.150.29
BMI, body mass index; WHR, waist to hip ratio; WHtR, waist to height ratio; BAI, body adiposity index; VAI, visceral adiposity index; LAP, lipid accumulation product; BRI, body roundness index; ABSI, body shape index; HOMA-IR, homeostatic model assessment; HBA1c, glycated hemoglobin (A1c); HDL cholesterol, high density lipoprotein; LDL cholesterol, low-density lipoprotein.
Table 6. Concentration of fetuin-A according to anthropometric parameters and indices and health status.
Concentration of Fetuin-A [µg/mL]
NMean ± SDp-Value
BMINormal weight17249.24 ± 55.870.58
Excess weight (overweight + obesity)31246.73 ± 63.28
BAINormal weight24238.03 ± 53.090.36
Excess weight (overweight + obesity)25259.82 ± 66.14
WC≤88 cm23246.47 ± 61.570.81
>88 cm26251.51 ± 60.63
WHRWHR < 0.8527250.36 ± 60.180.75
WHR ≥ 0.8522247.66 ± 62.24
WHtRWHtR < 0.519239.52 ± 58.230.37
WHtR ≥ 0.530255.24 ± 62.06
VAIVAI ≤ 1.67532244.16 ± 58.600.51
VAI > 1.67517258.54 ± 64.65
LAPLAP < 41.3027238.99 ± 56.730.24
LAP ≥ 41.3022261.62 ± 63.89
BRIBRI < 4.91028251.97 ± 60.120.63
BRI ≥ 4.91021245.39 ± 62.25
ABSIABSI < 0.07621257.6 ± 68.80.50
ABSI ≥ 0.07628242.8 ± 53.9
ABSI z-scoreABSI <−0.86814251.82 ± 66.340.89
ABSI −0.868 and −0.2727269.11 ± 77.39
ABSI −0.272 and +0.22912236.84 ± 46.87
ABSI 0.229 and 0.7986237.30 ± 62.74
ABSI > 0.79810253.32 ± 60.46
HOMA-IRLack of insulin resistance20252.48 ± 52.700.51
Insulin resistance (EGIR—The European Group for the Study of Insulin Resistance)29246.85 ± 66.67
HOMA-IR, homeostatic model assessment, WC, waist circumference, BMI, body mass index; WHR, waist to hip ratio; WHtR, waist to height ratio; BAI, body adiposity index; VAI, visceral adiposity index; LAP, lipid accumulation product; BRI, body roundness index; ABSI, body shape index.
Publisher’s Note: MDPI stays neutral with regard to jurisdictional claims in published maps and institutional affiliations.

