
Meeting 24-Hour Movement and Dietary Guidelines: Prevalence, Correlates and Association with Weight Status among Children and Adolescents: A National Cross-Sectional Study in China

 , , , , ,
  , and
, and 
Abstract
:1. Introduction
2. Methods
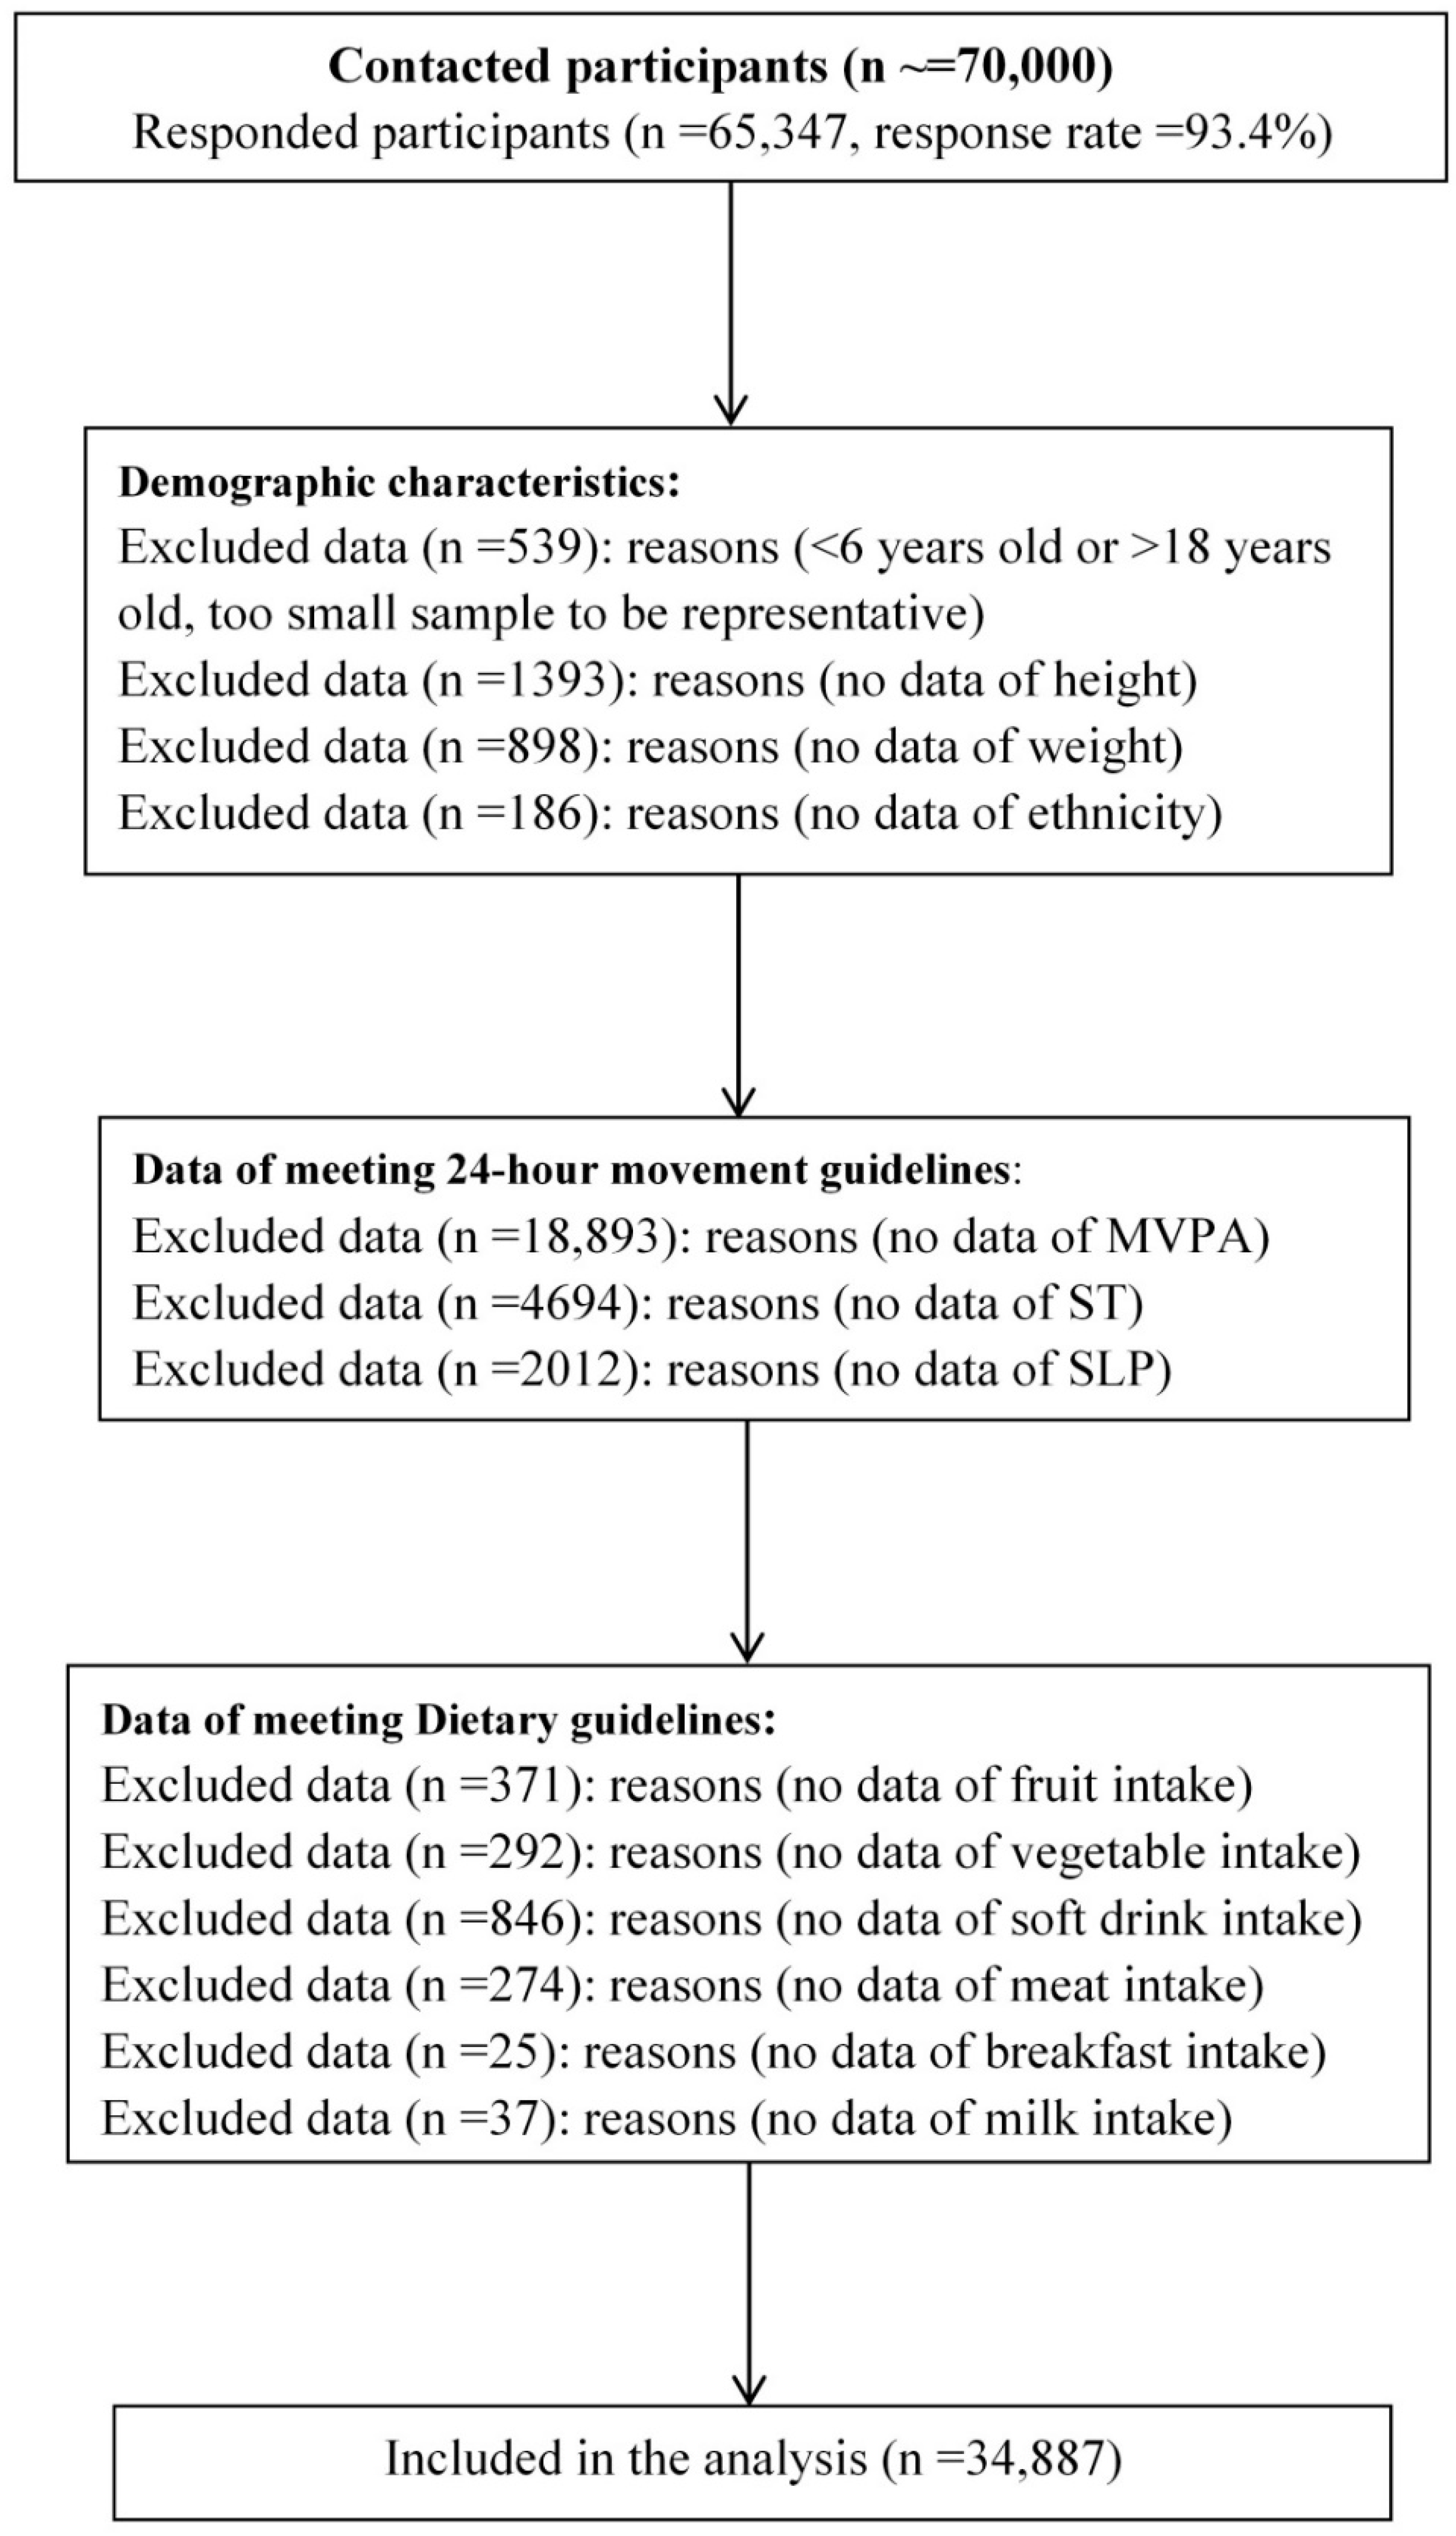
2.1. Participants
2.2. Measurement
2.2.1. Demographic Information
2.2.2. 24 h Movement Behaviors
2.2.3. Dietary Behaviors
2.2.4. Weight Status
2.3. Statistical Analysis
3. Results
3.1. Sample Characteristics
3.2. Prevalence and Correlates of Meeting 24 h Movement Guidelines
3.3. Relationships between Meeting 24 h Movement and Dietary Guidelines and Weight Status
4. Discussion
5. Conclusions
Author Contributions
Funding
Institutional Review Board Statement
Informed Consent Statement
Data Availability Statement
Acknowledgments
Conflicts of Interest
Abbreviations
References
- Katzmarzyk, P.T.; Chaput, J.-P.; Fogelholm, M.; Hu, G.; Maher, C.; Maia, J.; Olds, T.; Sarmiento, O.L.; Standage, M.; Tremblay, M.S.; et al. International Study of Childhood Obesity, Lifestyle and the Environment (ISCOLE): Contributions to Understanding the Global Obesity Epidemic. Nutrients 2019, 11, 848. [Google Scholar] [CrossRef] [PubMed] [Green Version]
- Liang, Y.; Hou, D.; Zhao, X.; Wang, L.; Hu, Y.; Liu, J.; Cheng, H.; Yang, P.; Shan, X.; Yan, Y.; et al. Childhood obesity affects adult metabolic syndrome and diabetes. Endocrine 2015, 50, 87–92. [Google Scholar] [CrossRef] [PubMed]
- Weihrauch-Blüher, S.; Schwarz, P.; Klusmann, J.-H. Childhood obesity: Increased risk for cardiometabolic disease and cancer in adulthood. Metabolism 2019, 92, 147–152. [Google Scholar] [CrossRef]
- Lauby-Secretan, B.; Scoccianti, C.; Loomis, D.; Grosse, Y.; Bianchini, F.; Straif, K. Body Fatness and Cancer—Viewpoint of the IARC Working Group. N. Engl. J. Med. 2016, 375, 794–798. [Google Scholar] [CrossRef] [PubMed] [Green Version]
- Zhang, Y.-X.; Wang, Z.-X.; Wang, M.; Xie, L. Prevalence of thinness among children and adolescents in Shandong, China. Eur. J. Nutr. 2016, 55, 809–813. [Google Scholar] [CrossRef] [PubMed]
- Black, R.E.; Victora, C.G.; Walker, S.P.; Bhutta, Z.A.; Christian, P.; de Onis, M.; Ezzati, M.; Grantham-McGregor, S.; Katz, J.; Martorell, R.; et al. Maternal and child undernutrition and overweight in low-income and middle-income countries. Lancet 2013, 382, 427–451. [Google Scholar] [CrossRef]
- Bentham, J.; Di Cesare, M.; Bilano, V.; Bixby, H.; Zhou, B.; Stevens, G.A.; Riley, L.M.; Taddei, C.; Hajifathalian, K.; Lu, Y.; et al. Worldwide Trends in Body-Mass Index, Underweight, Overweight, and Obesity from 1975 to 2016: A Pooled Analysis of 2416 Population-Based Measurement Studies in 128.9 Million Children, Adolescents, and Adults. Lancet 2017, 390, 2627–2642. [Google Scholar] [CrossRef] [Green Version]
- Tzioumis, E.; Adair, L.S. Childhood Dual Burden of Under- and Overnutrition in Low- and Middle-inCome Countries: A Critical Review. Food Nutr. Bull. 2014, 35, 230–243. [Google Scholar] [CrossRef] [Green Version]
- Yang, L.; Bovet, P.; Ma, C.; Zhao, M.; Liang, Y.; Xi, B. Prevalence of underweight and overweight among young adolescents aged 12-15 years in 58 low-income and middle-income countries. Pediatr. Obes. 2019, 14, e12468. [Google Scholar] [CrossRef]
- Carson, V.; Chaput, J.-P.; Janssen, I.; Tremblay, M.S. Health associations with meeting new 24-hour movement guidelines for Canadian children and youth. Prev. Med. 2017, 95, 7–13. [Google Scholar] [CrossRef]
- Saunders, T.J.; Gray, C.E.; Poitras, V.J.; Chaput, J.-P.; Janssen, I.; Katzmarzyk, P.T.; Olds, T.; Gorber, S.C.; Kho, M.; Sampson, M.; et al. Combinations of physical activity, sedentary behaviour and sleep: Relationships with health indicators in school-aged children and youth. Appl. Physiol. Nutr. Metab. 2016, 41, S283–S293. [Google Scholar] [CrossRef] [PubMed] [Green Version]
- Shang, X.; Li, Y.; Liu, A.; Zhang, Q.; Hu, X.; Du, S.; Ma, J.; Xu, G.; Li, Y.; Guo, H.; et al. Dietary Pattern and Its Association with the Prevalence of Obesity and Related Cardiometabolic Risk Factors among Chinese Children. PLoS ONE 2012, 7, e43183. [Google Scholar] [CrossRef] [PubMed]
- Ip, P.; Ho, F.K.-W.; Louie, L.H.-T.; Chung, T.W.-H.; Cheung, Y.-F.; Lee, S.-L.; Hui, S.S.-C.; Ho, W.K.-Y.; Ho, D.S.-Y.; Wong, W.H.-S.; et al. Childhood Obesity and Physical Activity-Friendly School Environments. J. Pediatr. 2017, 191, 110–116. [Google Scholar] [CrossRef]
- Al-Khudairy, L.; Loveman, E.; Colquitt, J.L.; Mead, E.; Johnson, R.E.; Fraser, H.; Olajide, J.; Murphy, M.; Velho, R.M.; O’Malley, C.; et al. Diet, physical activity and behavioural interventions for the treatment of overweight or obese adolescents aged 12 to 17 years. Cochrane Database Syst. Rev. 2017, 6, CD012691. [Google Scholar] [CrossRef] [Green Version]
- Kantanista, A.; Osiński, W. Underweight in 14 to 16 year-old girls and boys: Prevalence and associations with physical activity and sedentary activities. Ann. Agric. Environ. Med. 2014, 21, 114–119. [Google Scholar] [PubMed]
- Tremblay, M.S.; Carson, V.; Chaput, J.-P.; Gorber, S.C.; Dinh, T.; Duggan, M.; Faulkner, G.; Gray, C.E.; Gruber, R.; Janson, K.; et al. Canadian 24-Hour Movement Guidelines for Children and Youth: An Integration of Physical Activity, Sedentary Behaviour, and Sleep. Appl. Physiol. Nutr. Metab. 2016, 41, S311–S327. [Google Scholar] [CrossRef] [PubMed]
- Chen, S.-T.; Liu, Y.; Tremblay, M.S.; Hong, J.-T.; Tang, Y.; Cao, Z.-B.; Zhuang, J.; Zhu, Z.; Wu, X.; Wang, L.; et al. Meeting 24-h movement guidelines: Prevalence, correlates, and the relationships with overweight and obesity among Chinese children and adolescents. J. Sport Health Sci. 2021, 10, 349–359. [Google Scholar] [CrossRef] [PubMed]
- Willumsen, J.; Bull, F. Development of WHO Guidelines on Physical Activity, Sedentary Behavior, and Sleep for Children Less Than 5 Years of Age. J. Phys. Act. Health 2020, 17, 96–100. [Google Scholar] [CrossRef] [PubMed] [Green Version]
- Lee, E.-Y.; Carson, V.; Jeon, J.; Spence, J.C.; Tremblay, M.S. Levels and correlates of 24-hour movement behaviors among South Koreans: Results from the Korea National Health and Nutrition Examination Surveys, 2014 and 2015. J. Sport Health Sci. 2019, 8, 376–385. [Google Scholar] [CrossRef]
- Katzmarzyk, P.T.; Staiano, A.E. Relationship Between Meeting 24-Hour Movement Guidelines and Cardiometabolic Risk Factors in Children. J. Phys. Act. Health 2017, 14, 779–784. [Google Scholar] [CrossRef]
- Roman-Viñas, B.; Chaput, J.-P.; Katzmarzyk, P.T.; Fogelholm, M.; Lambert, E.V.; Maher, C.; Maia, J.; Olds, T.; Onywera, V.; Sarmiento, O.L.; et al. Proportion of children meeting recommendations for 24-hour movement guidelines and associations with adiposity in a 12-country study. Int. J. Behav. Nutr. Phys. Act. 2016, 13, 123. [Google Scholar] [CrossRef] [PubMed] [Green Version]
- Shi, Y.; Huang, W.Y.; Sit, C.H.-P.; Wong, S.H.-S. Compliance With 24-Hour Movement Guidelines in Hong Kong Adolescents: Associations With Weight Status. J. Phys. Act. Health 2020, 17, 287–292. [Google Scholar] [CrossRef] [PubMed]
- Janssen, I.; Roberts, K.C.; Thompson, W. Adherence to the 24-Hour Movement Guidelines among 10- to 17-year-old Canadians. Health Promot. Chronic Dis. Prev. Can. 2017, 37, 369–375. [Google Scholar] [CrossRef] [PubMed]
- Keast, D.R.; Gallant, K.M.H.; Albertson, A.M.; Gugger, C.K.; Holschuh, N.M. Associations between Yogurt, Dairy, Calcium, and Vitamin D Intake and Obesity among U.S. Children Aged 8–18 Years: NHANES, 2005–2008. Nutrients 2015, 7, 1577–1593. [Google Scholar] [CrossRef]
- Roblin, L. Childhood obesity: Food, nutrient, and eating-habit trends and influences. Appl. Physiol. Nutr. Metab. 2007, 32, 635–645. [Google Scholar] [CrossRef]
- Lee, G.; Ham, O.K. Factors Affecting Underweight and Obesity Among Elementary School Children in South Korea. Asian Nurs. Res. 2015, 9, 298–304. [Google Scholar] [CrossRef] [Green Version]
- Amine, E.K.; Baba, N.H.; Belhadj, M.; Deurenberg Yap, M.; Djazayery, A.; Forrestre, T.; Galuska, D.A.; Herman, S.; James, W.P.T.; M’Buyamba Kabangu, J.R.; et al. Diet, nutrition and the prevention of chronic diseases. World Health Organ Tech Rep Ser. 2003, 916, 1–149. [Google Scholar]
- Melaku, Y.A.; Gill, T.K.; Appleton, S.L.; Taylor, A.W.; Adams, R.; Shi, Z. Prospective Associations of Dietary and Nutrient Patterns with Fracture Risk: A 20-Year Follow-Up Study. Nutrients 2017, 9, 1198. [Google Scholar] [CrossRef] [Green Version]
- Popkin, B.M. Synthesis and implications: China’s nutrition transition in the context of changes across other low- and middle-income countries. Obes. Rev. 2014, 15, 60–67. [Google Scholar] [CrossRef] [Green Version]
- Mirmiran, P.; Ziadlou, M.; Karimi, S.; Hosseini-Esfahani, F.; Azizi, F. The association of dietary patterns and adherence to WHO healthy diet with metabolic syndrome in children and adolescents: Tehran lipid and glucose study. BMC Public Health 2019, 19, 1457. [Google Scholar] [CrossRef]
- Chaput, J.-P. Sleep patterns, diet quality and energy balance. Physiol. Behav. 2014, 134, 86–91. [Google Scholar] [CrossRef] [PubMed]
- Chaput, J.-P.; Klingenberg, L.; Astrup, A.; Sjödin, A.M. Modern sedentary activities promote overconsumption of food in our current obesogenic environment. Obes. Rev. 2011, 12, e12–e20. [Google Scholar] [CrossRef] [PubMed]
- Gupta, C.C.; Vincent, G.E.; Coates, A.M.; Khalesi, S.; Irwin, C.; Dorrian, J.; Ferguson, S.A. A Time to Rest, a Time to Dine: Sleep, Time-Restricted Eating, and Cardiometabolic Health. Nutrients 2022, 14, 420. [Google Scholar] [CrossRef] [PubMed]
- Zhen, S.; Ma, Y.; Zhao, Z.; Yang, X.; Wen, D. Dietary pattern is associated with obesity in Chinese children and adolescents: Data from China Health and Nutrition Survey (CHNS). Nutr. J. 2018, 17, 68. [Google Scholar] [CrossRef] [PubMed] [Green Version]
- Chen, Y.; Ma, L.; Ma, Y.; Wang, H.; Luo, J.; Zhang, X.; Luo, C.; Wang, H.; Zhao, H.; Pan, D.; et al. A national school-based health lifestyles interventions among Chinese children and adolescents against obesity: Rationale, design and methodology of a randomized controlled trial in China. BMC Public Health 2015, 15, 210. [Google Scholar] [CrossRef] [Green Version]
- Dong, Y.; Zou, Z.; Wang, H.; Dong, B.; Hu, P.; Ma, Y.; Song, Y.; Ma, J. National School-Based Health Lifestyles Intervention in Chinese Children and Adolescents on Obesity and Hypertension. Front. Pediatr. 2021, 9, 615283. [Google Scholar] [CrossRef]
- Liu, A.-L.; Ma, G.-S.; Zhang, Q.; Ma, W.-J. Reliability and validity of a 7-day physical activity questionnaire for elementary students. Chin. J. Epidemiol. 2003, 24, 901–904. [Google Scholar]
- Liu, Y.; Wang, M.; Tynjälä, J.; Lv, Y.; Villberg, J.; Zhang, Z.; Kannas, L. Test-retest reliability of selected items of Health Behaviour in School-aged Children (HBSC) survey questionnaire in Beijing, China. BMC Med. Res. Methodol. 2010, 10, 73. [Google Scholar] [CrossRef] [Green Version]
- Yang, Y.-D.; Xie, M.; Zeng, Y.; Yuan, S.; Tang, H.; Dong, Y.; Zou, Z.; Dong, B.; Wang, Z.; Ye, X.; et al. Impact of short-term change of adiposity on risk of high blood pressure in children: Results from a follow-up study in China. PLoS ONE 2021, 16, e0257144. [Google Scholar] [CrossRef]
- Zhai, F.Y.; Du, S.F.; Wang, Z.H.; Zhang, J.G.; Du, W.W.; Popkin, B.M. Dynamics of the Chinese diet and the role of urbanicity, 1991–2011. Obes. Rev. Off. J. Int. Assoc. Study Obes. 2014, 15 (Suppl. 1), 16–26. [Google Scholar] [CrossRef] [Green Version]
- Yang, Y.; Dong, B.; Zou, Z.; Wang, S.; Dong, Y.; Wang, Z.; Ma, J. Association between Vegetable Consumption and Blood Pressure, Stratified by BMI, among Chinese Adolescents Aged 13–17 Years: A National Cross-Sectional Study. Nutrients 2018, 10, 451. [Google Scholar] [CrossRef] [PubMed] [Green Version]
- Gui, Z.-H.; Zhu, Y.-N.; Cai, L.; Sun, F.-H.; Ma, Y.-H.; Jing, J.; Chen, Y.-J. Sugar-Sweetened Beverage Consumption and Risks of Obesity and Hypertension in Chinese Children and Adolescents: A National Cross-Sectional Analysis. Nutrients 2017, 9, 1302. [Google Scholar] [CrossRef] [PubMed] [Green Version]
- Cole, T.J.; Bellizzi, M.C.; Flegal, K.M.; Dietz, W.H. Establishing a standard definition for child overweight and obesity worldwide: International survey. BMJ 2000, 320, 1240–1243. [Google Scholar] [CrossRef] [PubMed] [Green Version]
- Chen, C.; Lu, F.C. Department of Disease Control Ministry of Health, PR China The guidelines for prevention and control of overweight and obesity in Chinese adults. Biomed. Environ. Sci. 2004, 17, 1–36. [Google Scholar]
- Wang, L.; Zhou, B.; Zhao, Z.; Yang, L.; Zhang, M.; Jiang, Y.; Li, Y.; Zhou, M.; Wang, L.; Huang, Z.; et al. Body-mass index and obesity in urban and rural China: Findings from consecutive nationally representative surveys during 2004-18. Lancet 2021, 398, 53–63. [Google Scholar] [CrossRef]
- Niu, X.-T.; Yang, Y.-C.; Wang, Y.-C. Does the Economic Growth Improve Public Health? A Cross-Regional Heterogeneous Study in China. Front. Public Health 2021, 9, 704155. [Google Scholar] [CrossRef]
- Zhang, X.; van der Lans, I.; Dagevos, H. Impacts of fast food and the food retail environment on overweight and obesity in China: A multilevel latent class cluster approach. Public Health Nutr. 2012, 15, 88–96. [Google Scholar] [CrossRef] [Green Version]
- Tang, D.; Bu, T.; Feng, Q.; Liu, Y.; Dong, X. Differences in Overweight and Obesity between the North and South of China. Am. J. Health Behav. 2020, 44, 780–793. [Google Scholar] [CrossRef]
- Ju, L.; Yu, D.; Piao, W.; Fang, H.; Guo, Q.; Xu, X.; Li, S.; Cheng, X.; Cai, S.; Zhao, L. Cooking Oil and Salt Intakes Among Children Aged 6−17 Years—China, 2016−2017. China CDC Wkly. 2021, 3, 657–660. [Google Scholar] [CrossRef]
- Li, C.; Li, M. The Policy Information Gap and Resettlers’ Well-Being: Evidence from the Anti-Poverty Relocation and Resettlement Program in China. Int. J. Environ. Res. Public Health 2020, 17, 2957. [Google Scholar] [CrossRef]
- Hou, D.; Wang, X. Measurement of Agricultural Green Development Level in the Three Provinces of Northeast China Under the Background of Rural Vitalization Strategy. Front. Public Health 2022, 10, 824202. [Google Scholar] [CrossRef] [PubMed]
- Gan, X.; Xu, W.; Yu, K. Economic Growth and Weight of Children and Adolescents in Urban Areas: A Panel Data Analysis on Twenty-Seven Provinces in China, 1985–2014. Child. Obes. 2020, 16, 86–93. [Google Scholar] [CrossRef] [PubMed]
- Chen, P.; Wang, D.; Shen, H.; Yu, L.; Gao, Q.; Mao, L.; Jiang, F.; Luo, Y.; Xie, M.; Zhang, Y.; et al. Physical activity and health in Chinese children and adolescents: Expert consensus statement (2020). Br. J. Sports Med. 2020, 54, 1321–1331. [Google Scholar] [CrossRef] [PubMed]
- Wang, H.; Zhai, F. Programme and policy options for preventing obesity in China. Obes. Rev. Off. J. Int. Assoc. Study Obes. 2013, 14 (Suppl. 2), 134–140. [Google Scholar] [CrossRef] [Green Version]
- Yuan, Y.-Q.; Li, F.; Dong, R.-H.; Chen, J.-S.; He, G.-S.; Li, S.-G.; Chen, B. The Development of a Chinese Healthy Eating Index and Its Application in the General Population. Nutrients 2017, 9, 977. [Google Scholar] [CrossRef] [Green Version]
- Kadam, I.; Neupane, S.; Wei, J.; Fullington, L.A.; Li, T.; An, R.; Zhao, L.; Ellithorpe, A.; Jiang, X.; Wang, L. A Systematic Review of Diet Quality Index and Obesity among Chinese Adults. Nutrients 2021, 13, 3555. [Google Scholar] [CrossRef]
- Colquitt, J.L.; Loveman, E.; O’Malley, C.; Azevedo, L.B.; Mead, E.; Al-Khudairy, L.; Ells, L.J.; Metzendorf, M.-I.; Rees, K. Diet, physical activity, and behavioural interventions for the treatment of overweight or obesity in preschool children up to the age of 6 years. Cochrane Database Syst. Rev. 2016, 3, CD012105. [Google Scholar] [CrossRef] [Green Version]
- Mead, E.; Brown, T.; Rees, K.; Azevedo, L.B.; Whittaker, V.; Jones, D.; Olajide, J.; Mainardi, G.M.; Corpeleijn, E.; O’Malley, C.; et al. Diet, physical activity and behavioural interventions for the treatment of overweight or obese children from the age of 6 to 11 years. Cochrane Database Syst. Rev. 2017, 6, CD012651. [Google Scholar] [CrossRef] [Green Version]
- Hjorth, M.F.; Chaput, J.-P.; Damsgaard, C.T.; Dalskov, S.-M.; Andersen, R.; Astrup, A.; Michaelsen, K.F.; Tetens, I.; Ritz, C.; Sjödin, A. Low Physical Activity Level and Short Sleep Duration Are Associated with an Increased Cardio-Metabolic Risk Profile: A Longitudinal Study in 8-11 Year Old Danish Children. PLoS ONE 2014, 9, e104677. [Google Scholar] [CrossRef]
- Zhang, J.; Zhang, Y.; Jiang, Y.; Sun, W.; Zhu, Q.; Ip, P.; Zhang, D.; Liu, S.; Chen, C.; Chen, J.; et al. Effect of Sleep Duration, Diet, and Physical Activity on Obesity and Overweight Elementary School Students in Shanghai. J. Sch. Health 2018, 88, 112–121. [Google Scholar] [CrossRef]
- Meng, L.P.; Liu, A.L.; Hu, X.; Zhang, Q.; Du, S.M.; Fang, H.Y.; Ma, J.; Xu, G.F.; Li, Y.; Guo, H.W.; et al. Report on childhood obesity in China (10): Association of sleep duration with obesity. Biomed. Environ. Sci. 2012, 25, 133–140. [Google Scholar] [CrossRef] [PubMed]
- Wang, Y.; Zhu, R.; Wang, Y.; Long, J.H.; Zhang, Y.J. Levels of 24-hour movement and associations with childhood obesity in Chi-nese school students. Chin. J. Sch. Health 2021, 42, 606–610. [Google Scholar]
- Yen, Y.; Shi, Y.; Soeung, B.; Seng, R.; Dy, C.; Suy, R.; Ngin, K. The associated risk factors for underweight and overweight high school students in Cambodia. Diabetes Metab. Syndr. Clin. Res. Rev. 2018, 12, 737–742. [Google Scholar] [CrossRef] [PubMed]
- Park, S.K.; Jung, J.Y.; Oh, C.-M.; McIntyre, R.S.; Lee, J.-H. Association Between Sleep Duration, Quality and Body Mass Index in the Korean Population. J. Clin. Sleep Med. 2018, 14, 1353–1360. [Google Scholar] [CrossRef] [PubMed]
- Chaput, J.-P.; Lambert, M.; Gray-Donald, K.; McGrath, J.; Tremblay, M.S.; O’Loughlin, J.; Tremblay, A. Short Sleep Duration Is Independently Associated With Overweight and Obesity in Quebec Children. Can. J. Public Health 2011, 102, 369–374. [Google Scholar] [CrossRef] [PubMed]
- Lim, S.S.; Vos, T.; Flaxman, A.D.; Danaei, G.; Shibuya, K.; Adair-Rohani, H.; AlMazroa, M.A.; Amann, M.; Anderson, H.R.; Andrews, K.G.; et al. A comparative risk assessment of burden of disease and injury attributable to 67 risk factors and risk factor clusters in 21 regions, 1990–2010: A systematic analysis for the Global Burden of Disease Study 2010. Lancet 2012, 380, 2224–2260. [Google Scholar] [CrossRef] [Green Version]
- LeDoux, T.A.; Hingle, M.D.; Baranowski, T. Relationship of fruit and vegetable intake with adiposity: A systematic review. Obes. Rev. Off. J. Int. Assoc. Study Obes. 2011, 12, e143–e150. [Google Scholar] [CrossRef]
- Bes-Rastrollo, M.; Martínez-González, M.A.; Sánchez-Villegas, A.; Arrillaga, C.D.L.F.; Martínez, J.A. Association of fiber intake and fruit/vegetable consumption with weight gain in a Mediterranean population. Nutrition 2006, 22, 504–511. [Google Scholar] [CrossRef]
- Heo, M.; Kim, R.S.; Wylie-Rosett, J.; Allison, D.B.; Heymsfield, S.B.; Faith, M.S. Inverse Association between Fruit and Vegetable Intake and BMI even after Controlling for Demographic, Socioeconomic and Lifestyle Factors. Obes. Facts 2011, 4, 449–455. [Google Scholar] [CrossRef] [Green Version]
- Auerbach, B.J.; Wolf, F.M.; Hikida, A.; Vallila-Buchman, P.; Littman, A.; Thompson, D.; Louden, D.; Taber, D.R.; Krieger, J. Fruit Juice and Change in BMI: A Meta-analysis. Pediatrics 2017, 139, e20162454. [Google Scholar] [CrossRef] [Green Version]
- Sakaki, J.R.; Li, J.; Gao, S.; Ha, K.; Tamimi, R.M.; Chavarro, J.E.; Chen, M.; Sun, Q.; Hart, J.E.; Chun, O.K. Associations between fruit juice and milk consumption and change in BMI in a large prospective cohort of U.S. adolescents and preadolescents. Pediatr. Obes. 2021, 16, e12781. [Google Scholar] [CrossRef] [PubMed]
- Wojcicki, J.M.; Heyman, M.B. Reducing Childhood Obesity by Eliminating 100% Fruit Juice. Am. J. Public Health 2012, 102, 1630–1633. [Google Scholar] [CrossRef] [PubMed]
- Yang, N.; Kim, K. Is the Perceived Fruit Accessibility Related to Fruit Intakes and Prevalence of Overweight in Disadvantaged Youth: A Cross-Sectional Study. Nutrients 2020, 12, 3324. [Google Scholar] [CrossRef] [PubMed]
- Van Dam, R.M.; Seidell, J.C. Carbohydrate intake and obesity. Eur. J. Clin. Nutr. 2007, 61, S75–S99. [Google Scholar] [CrossRef] [Green Version]
- Bosy-Westphal, A.; Müller, M.J. Impact of carbohydrates on weight regain. Curr. Opin. Clin. Nutr. Metab. Care 2015, 18, 389–394. [Google Scholar] [CrossRef]
- Sharma, S.P.; Chung, H.J.; Kim, H.J.; Hong, S.T. Paradoxical Effects of Fruit on Obesity. Nutrients 2016, 8, 633. [Google Scholar] [CrossRef]
- Yang, Q.; Zhang, Z.; Gregg, E.W.; Flanders, W.D.; Merritt, R.; Hu, F.B. Added Sugar Intake and Cardiovascular Diseases Mortality Among US Adults. JAMA Intern. Med. 2014, 174, 516–524. [Google Scholar] [CrossRef] [Green Version]
- You, J.; Choo, J. Adolescent Overweight and Obesity: Links to Socioeconomic Status and Fruit and Vegetable Intakes. Int. J. Environ. Res. Public Health 2016, 13, 307. [Google Scholar] [CrossRef] [Green Version]
- Singh, D.R.; Sunuwar, D.R.; Dahal, B.; Sah, R.K. The association of sleep problem, dietary habits and physical activity with weight status of adolescents in Nepal. BMC Public Health 2021, 21, 938. [Google Scholar] [CrossRef]
- Elliott, S.S.; Keim, N.L.; Stern, J.S.; Teff, K.; Havel, P.J. Fructose, weight gain, and the insulin resistance syndrome. Am. J. Clin. Nutr. 2002, 76, 911–922. [Google Scholar] [CrossRef]
- Malik, V.S.; Schulze, M.B.; Hu, F.B. Intake of sugar-sweetened beverages and weight gain: A systematic review1–3. Am. J. Clin. Nutr. 2006, 84, 274–288. [Google Scholar] [CrossRef] [PubMed]
- Rehm, C.D.; Drewnowski, A.; Monsivais, P. Potential Population-Level Nutritional Impact of Replacing Whole and Reduced-Fat Milk With Low-Fat and Skim Milk Among US Children Aged 2–19 Years. J. Nutr. Educ. Behav. 2015, 47, 61–68. [Google Scholar] [CrossRef] [PubMed] [Green Version]
- Thompson, F.E.; Dennison, B.A. Dietary sources of fats and cholesterol in US children aged 2 through 5 years. Am. J. Public Health 1994, 84, 799–806. [Google Scholar] [CrossRef] [PubMed] [Green Version]
- White, M.J.; Armstrong, S.C.; Kay, M.C.; Perrin, E.M.; Skinner, A. Associations between milk fat content and obesity, 1999 to 2016. Pediatr. Obes. 2020, 15, e12612. [Google Scholar] [CrossRef] [PubMed]
- Nicholl, A.; Deering, K.E.; Evelegh, K.; Lyons-Wall, P.; Lawrence, D.; Mori, T.A.; Kratz, M.; O’Sullivan, T.A. Whole-fat dairy products do not adversely affect adiposity or cardiometabolic risk factors in children in the Milky Way Study: A double-blind randomized controlled pilot study. Am. J. Clin. Nutr. 2021, 114, 2025–2042. [Google Scholar] [CrossRef] [PubMed]
- Astrup, A. Yogurt and dairy product consumption to prevent cardiometabolic diseases: Epidemiologic and experimental studies. Am. J. Clin. Nutr. 2014, 99, 1235S–1242S. [Google Scholar] [CrossRef] [Green Version]
- Hasnain, S.R.; Singer, M.R.; Bradlee, M.L.; Moore, L.L. Beverage Intake in Early Childhood and Change in Body Fat from Preschool to Adolescence. Child. Obes. 2014, 10, 42–49. [Google Scholar] [CrossRef] [Green Version]
- Moore, L.L.; Bradlee, M.L.; Gao, D.; Singer, M. Low Dairy Intake in Early Childhood Predicts Excess Body Fat Gain. Obesity 2006, 14, 1010–1018. [Google Scholar] [CrossRef]
- Gunther, C.W.; Lyle, R.M.; Legowski, P.A.; James, J.M.; McCabe, L.D.; McCabe, G.P.; Peacock, M.; Teegarden, D. Fat oxidation and its relation to serum parathyroid hormone in young women enrolled in a 1-y dairy calcium intervention. Am. J. Clin. Nutr. 2005, 82, 1228–1234. [Google Scholar] [CrossRef] [Green Version]
- Melanson, E.L.; Sharp, T.A.; Schneider, J.; Donahoo, W.T.; Grunwald, G.K.; Hill, J.O. Relation between calcium intake and fat oxidation in adult humans. Int. J. Obes. 2003, 27, 196–203. [Google Scholar] [CrossRef] [Green Version]
- Zemel, M.B. Regulation of Adiposity and Obesity Risk By Dietary Calcium: Mechanisms and Implications. J. Am. Coll. Nutr. 2002, 21, 146S–151S. [Google Scholar] [CrossRef] [PubMed]
- Layman, D.K. The Role of Leucine in Weight Loss Diets and Glucose Homeostasis. J. Nutr. 2003, 133, 261S–267S. [Google Scholar] [CrossRef] [PubMed]


| Variables | Overall (n = 34,887) | Boys (n = 18,074) | Girls (n = 16,813) | p | ||||||
|---|---|---|---|---|---|---|---|---|---|---|
| N | Freq/Mean | 95%CI/SD | N | Freq/Mean | 95%CI/SD | N | Freq/Mean | 95%CI/SD | ||
| Regions | ||||||||||
| Central China | 3633 | 10.40% | (10.1%, 10.7%) | 1937 | 10.70% | (10.3%, 11.2%) | 1696 | 10.10% | (9.6%, 10.5%) | 0.007 |
| Northwest China | 1036 | 3.00% | (2.8%, 3.2%) | 519 | 2.90% | (2.6%, 3.1%) | 517 | 3.10% | (2.8%, 3.3%) | |
| North China | 6149 | 17.60% | (17.2%, 18%) | 3222 | 17.80% | (17.3%, 18.4%) | 2927 | 17.40% | (16.8%, 18%) | |
| Southwest China | 6288 | 18.00% | (17.6%, 18.4%) | 3192 | 17.70% | (17.1%, 18.2%) | 3096 | 18.40% | (17.8%, 19%) | |
| Northeast China | 5954 | 17.10% | (16.7%, 17.5%) | 3016 | 16.70% | (16.1%, 17.2%) | 2938 | 17.50% | (16.9%, 18.1%) | |
| East China | 6951 | 19.90% | (19.5%, 20.3%) | 3697 | 20.50% | (19.9%, 21%) | 3254 | 19.40% | (18.8%, 20%) | |
| South China | 4876 | 14.00% | (13.6%, 14.3%) | 2491 | 13.80% | (13.3%, 14.3%) | 2385 | 14.20% | (13.7%, 14.7%) | |
| Age | 34,887 | 11.42 | 3.22 | 18,074 | 11.32 | 3.2 | 16,813 | 11.52 | 3.23 | <0.001 |
| BMI (kg/m2) | 34,887 | 18.76 | 3.84 | 18,074 | 19.09 | 4.03 | 16,813 | 18.41 | 3.59 | <0.001 |
| Grade | <0.001 | |||||||||
| Primary school | 18,664 | 53.50% | (53%, 54%) | 10,009 | 55.40% | (54.7%, 56.1%) | 8655 | 51.50% | (50.7%, 52.2%) | |
| Secondary school | 8944 | 25.60% | (25.2%, 26.1%) | 4560 | 25.20% | (24.6%, 25.9%) | 4384 | 26.10% | (25.4%, 26.7%) | |
| High school | 7279 | 20.90% | (20.4%, 21.3%) | 3505 | 19.40% | (18.8%, 20%) | 3774 | 22.40% | (21.8%, 23.1%) | |
| Ethnicity | 0.128 | |||||||||
| Non-Han | 1837 | 5.30% | (5%, 5.5%) | 920 | 5.10% | (4.8%, 5.4%) | 917 | 5.50% | (5.1%, 5.8%) | |
| Han | 33,050 | 94.70% | (94.5%, 95%) | 17,154 | 94.90% | (94.6%, 95.2%) | 15,896 | 94.50% | (94.2%, 94.9%) | |
| Residence | ||||||||||
| Urban | 15,705 | 45.00% | (44.5%, 45.5%) | 8086 | 44.70% | (44%, 45.5%) | 7619 | 45.30% | (44.6%, 46.1%) | 0.278 |
| Rural | 19,182 | 55.00% | (54.5%, 55.5%) | 9988 | 55.30% | (54.5%, 56%) | 9194 | 54.70% | (53.9%, 55.4%) | |
| Family structure | <0.001 | |||||||||
| Single child | 23,969 | 68.70% | (68.2%, 69.2%) | 13,190 | 73.00% | (72.3%, 73.6%) | 10,779 | 64.10% | (63.4%, 64.8%) | |
| Non-single child | 10,918 | 31.30% | (30.8%, 31.8%) | 4884 | 27.00% | (26.4%, 27.7%) | 6034 | 35.90% | (35.2%, 36.6%) | |
| Father’s age | <0.001 | |||||||||
| ≤30 | 890 | 2.60% | (2.4%, 2.7%) | 489 | 2.70% | (2.5%, 2.9%) | 401 | 2.40% | (2.2%, 2.6%) | |
| 30–40 | 17,526 | 50.20% | (49.7%, 50.8%) | 9064 | 50.10% | (49.4%, 50.9%) | 8462 | 50.30% | (49.6%, 51.1%) | |
| 40–50 | 10,976 | 31.50% | (31%, 32%) | 5484 | 30.30% | (29.7%, 31%) | 5492 | 32.70% | (32%, 33.4%) | |
| >50 | 1017 | 2.90% | (2.7%, 3.1%) | 446 | 2.50% | (2.2%, 2.7%) | 571 | 3.40% | (3.1%, 3.7%) | |
| not reported | 4478 | 12.80% | (12.5%, 13.2%) | 2591 | 14.30% | (13.8%, 14.9%) | 1887 | 11.20% | (10.8%, 11.7%) | |
| Mother’s age | <0.001 | |||||||||
| ≤30 | 2184 | 6.30% | (6%, 6.5%) | 1111 | 6.10% | (5.8%, 6.5%) | 1073 | 6.40% | (6%, 6.8%) | |
| 30–40 | 18,784 | 53.80% | (53.3%, 54.4%) | 9558 | 52.90% | (52.2%, 53.6%) | 9226 | 54.90% | (54.1%, 55.6%) | |
| 40–50 | 5899 | 16.90% | (16.5%, 17.3%) | 2825 | 15.60% | (15.1%, 16.2%) | 3074 | 18.30% | (17.7%, 18.9%) | |
| >50 | 303 | 0.90% | (0.8%, 1%) | 120 | 0.70% | (0.6%, 0.8%) | 183 | 1.10% | (0.9%, 1.3%) | |
| not reported | 7717 | 22.10% | (21.7%, 22.6%) | 4460 | 24.70% | (24.1%, 25.3%) | 3257 | 19.40% | (18.8%, 20%) | |
| Father’s education | <0.001 | |||||||||
| Primary and below | 2219 | 6.40% | (6.1%, 6.6%) | 1119 | 6.20% | (5.8%, 6.5%) | 1100 | 6.50% | (6.2%, 6.9%) | |
| Secondary/high school | 20,630 | 59.10% | (58.6%, 59.6%) | 10,651 | 58.90% | (58.2%, 59.6%) | 9979 | 59.40% | (58.6%, 60.1%) | |
| College and above | 9402 | 26.90% | (26.5%, 27.4%) | 4763 | 26.40% | (25.7%, 27%) | 4639 | 27.60% | (26.9%, 28.3%) | |
| not reported | 2636 | 7.60% | (7.3%, 7.8%) | 1541 | 8.50% | (8.1%, 8.9%) | 1095 | 6.50% | (6.1%, 6.9%) | |
| Mother’s education | <0.001 | |||||||||
| Primary and below | 3113 | 8.90% | (8.6%, 9.2%) | 1596 | 8.80% | (8.4%, 9.3%) | 1517 | 9.00% | (8.6%, 9.5%) | |
| Secondary/high school | 20,536 | 58.90% | (58.3%, 59.4%) | 10,536 | 58.30% | (57.6%, 59%) | 10,000 | 59.50% | (58.7%, 60.2%) | |
| College and above | 8552 | 24.50% | (24.1%, 25%) | 4353 | 24.10% | (23.5%, 24.7%) | 4199 | 25.00% | (24.3%, 25.6%) | |
| not reported | 2686 | 7.70% | (7.4%, 8%) | 1589 | 8.80% | (8.4%, 9.2%) | 1097 | 6.50% | (6.2%, 6.9%) | |
| Household income/month | <0.001 | |||||||||
| <CNY 5000 | 9431 | 27.00% | (26.6%, 27.5%) | 4655 | 25.80% | (25.1%, 26.4%) | 4776 | 28.40% | (27.7%, 29.1%) | |
| CNY 5000–12,000 | 8779 | 25.20% | (24.7%, 25.6%) | 4549 | 25.20% | (24.5%, 25.8%) | 4230 | 25.20% | (24.5%, 25.8%) | |
| ≥CNY 12,000 | 3209 | 9.20% | (8.9%, 9.5%) | 1654 | 9.20% | (8.7%, 9.6%) | 1555 | 9.20% | (8.8%, 9.7%) | |
| not reported | 13,468 | 38.60% | (38.1%, 39.1%) | 7216 | 39.90% | (39.2%, 40.6%) | 6252 | 37.20% | (36.5%, 37.9%) | |
| Family Chronic disease history | <0.001 | |||||||||
| no | 23,064 | 66.10% | (65.6%, 66.6%) | 11,688 | 64.70% | (64%, 65.4%) | 11,376 | 67.70% | (67%, 68.4%) | |
| yes | 3333 | 9.60% | (9.2%, 9.9%) | 1654 | 9.20% | (8.7%, 9.6%) | 1679 | 10.00% | (9.5%, 10.4%) | |
| not reported | 8490 | 24.30% | (23.9%, 24.8%) | 4732 | 26.20% | (25.5%, 26.8%) | 3758 | 22.40% | (21.7%, 23%) | |
| Child’s Weight status | <0.001 | |||||||||
| underweight | 3956 | 11.30% | (11%, 11.7%) | 1693 | 9.40% | (8.9%, 9.8%) | 2263 | 13.50% | (13%, 14%) | |
| normal weight | 23,222 | 66.60% | (66.1%, 67.1%) | 11,478 | 63.50% | (62.8%, 64.2%) | 11,744 | 69.90% | (69.2%, 70.5%) | |
| overweight/obesity | 7709 | 22.10% | (21.7%, 22.5%) | 4903 | 27.10% | (26.5%, 27.8%) | 2806 | 16.70% | (16.1%, 17.3%) | |
| Father’s Weight status | <0.001 | |||||||||
| underweight | 581 | 1.70% | (1.5%, 1.8%) | 278 | 1.50% | (1.4%, 1.7%) | 303 | 1.80% | (1.6%, 2%) | |
| normal weight | 14,006 | 40.10% | (39.6%, 40.7%) | 7015 | 38.80% | (38.1%, 39.5%) | 6991 | 41.60% | (40.8%, 42.3%) | |
| overweight/obesity | 14,352 | 41.10% | (40.6%, 41.7%) | 7361 | 40.70% | (40%, 41.4%) | 6991 | 41.60% | (40.8%, 42.3%) | |
| not reported | 5948 | 17.00% | (16.7%, 17.4%) | 3420 | 18.90% | (18.4%, 19.5%) | 2528 | 15.00% | (14.5%, 15.6%) | |
| Mother’s Weight status | <0.001 | |||||||||
| underweight | 1280 | 3.70% | (3.5%, 3.9%) | 702 | 3.90% | (3.6%, 4.2%) | 578 | 3.40% | (3.2%, 3.7%) | |
| normal weight | 20,643 | 59.20% | (58.7%, 59.7%) | 10,396 | 57.50% | (56.8%, 58.2%) | 10,247 | 60.90% | (60.2%, 61.7%) | |
| overweight/obesity | 7022 | 20.10% | (19.7%, 20.6%) | 3519 | 19.50% | (18.9%, 20.1%) | 3503 | 20.80% | (20.2%, 21.5%) | |
| not reported | 5942 | 17.00% | (16.6%, 17.4%) | 3457 | 19.10% | (18.6%, 19.7%) | 2485 | 14.80% | (14.2%, 15.3%) | |
| 24 h Movement Guidelines | Overall (n = 34,887) | |||
|---|---|---|---|---|
| Meeting N (%) | 95%CI | |||
| MVPA | 12,466(35.7%) | (35.2%, 36.2%) | ||
| ST | 6215(17.8%) | (17.4%, 18.2%) | ||
| SLP | 12,704(36.4%) | (35.9%, 36.9%) | ||
| MVPA + ST | 1945(5.6%) | (5.3%, 5.8%) | ||
| MVPA + SLP | 4646(13.3%) | (13%, 13.7%) | ||
| ST+SLP | 2183(6.3%) | (6%, 6.5%) | ||
| All | 716(2.1%) | (1.9%, 2.2%) | ||
| Children 6–11 years old (n = 18,979) | Adolescent 12–17-year-olds (n = 15,908) | |||
| Meeting N (%) | 95%CI | Meeting N (%) | 95%CI | |
| MVPA | 6806(35.9%) | (35.2%, 36.5%) | 5660(35.6%) | (34.8%, 36.3%) |
| ST | 2255(11.9%) | (11.4%, 12.3%) | 3960(24.9%) | (24.2%, 25.6%) *** |
| SLP | 6875(36.2%) | (35.5%, 36.9%) | 5829(36.6%) | (35.9%, 37.4%) |
| MVPA + ST | 680(3.6%) | (3.3%, 3.9%) | 1265(8%) | (7.5%, 8.4%) *** |
| MVPA + SLP | 2573(13.6%) | (13.1%, 14%) | 2073(13%) | (12.5%, 13.6%) *** |
| ST+SLP | 830(4.4%) | (4.1%, 4.7%) | 1353(8.5%) | (8.1%, 8.9%) |
| All | 281(1.5%) | (1.3%, 1.7%) | 435(2.7%) | (2.5%, 3%) |
| Boys (n = 18,074) | Girls (n = 16,813) | |||
| Meeting N (%) | 95%CI | Meeting N (%) | 95%CI | |
| MVPA | 7222(40%) | (39.2%, 40.7%) | 5244(31.2%) | (30.5%, 31.9%) *** |
| ST | 2869(15.9%) | (15.3%, 16.4%) | 3346(19.9%) | (19.3%, 20.5%) *** |
| SLP | 6755(37.4%) | (36.7%, 38.1%) | 5949(35.4%) | (34.7%, 36.1%) *** |
| MVPA + ST | 1060(5.9%) | (5.5%, 6.2%) | 885(5.3%) | (4.9%, 5.6%) * |
| MVPA + SLP | 2760(15.3%) | (14.8%, 15.8%) | 1886(11.2%) | (10.7%, 11.7%) *** |
| ST+SLP | 1023(5.7%) | (5.3%, 6%) | 1160(6.9%) | (6.5%, 7.3%) *** |
| All | 400(2.2%) | (2%, 2.4%) | 316(1.9%) | (1.7%, 2.1%) * |
| Dietary Guidelines | Overall (n = 34,887) | |||
|---|---|---|---|---|
| Meeting N (%) | 95%CI | |||
| Breakfast | 29,439(84.4%) | (84%, 84.8%) | ||
| Fruit | 9109(26.1%) | (25.7%, 26.6%) | ||
| Vegetable | 2856(8.2%) | (7.9%, 8.5%) | ||
| Meat intake | 7344(21.1%) | (20.6%, 21.5%) | ||
| Soft drink intake | 11,225(32.2%) | (31.7%, 32.7%) | ||
| Milk intake | 15,370(44.1%) | (43.5%, 44.6%) | ||
| Children 6–11 years old (n = 18,979) | Adolescent 12–17-year-olds (n = 15,908) | |||
| Meeting N (%) | 95%CI | Meeting N (%) | 95%CI | |
| Breakfast | 17,266(91%) | (90.6%, 91.4%) | 12,173(76.5%) | (75.9%, 77.2%) *** |
| Fruit | 5328(28.1%) | (27.4%, 28.7%) | 3781(23.8%) | (23.1%, 24.4%) *** |
| Vegetable | 1449(7.6%) | (7.3%, 8%) | 1407(8.8%) | (8.4%, 9.3%) *** |
| Meat intake | 3556(18.7%) | (18.2%, 19.3%) | 3788(23.8%) | (23.2%, 24.5%) *** |
| Soft drink intake | 6909(36.4%) | (35.7%, 37.1%) | 4316(27.1%) | (26.4%, 27.8%) *** |
| Milk intake | 9121(48.1%) | (47.3%, 48.8%) | 6249(39.3%) | (38.5%, 40%) *** |
| Boys (n = 18,074) | Girls (n = 16,813) | |||
| Meeting N (%) | 95%CI | Meeting N (%) | 95%CI | |
| Breakfast | 15,291(84.6%) | (84.1%, 85.1%) | 14,148(84.1%) | (83.6%, 84.7%) |
| Fruit | 4539(25.1%) | (24.5%, 25.7%) | 4570(27.2%) | (26.5%, 27.9%) *** |
| Vegetable | 1550(8.6%) | (8.2%, 9%) | 1306(7.8%) | (7.4%, 8.2%) ** |
| Meat intake | 4608(25.5%) | (24.9%, 26.1%) | 2736(16.3%) | (15.7%, 16.8%) *** |
| Soft drink intake | 5206(28.8%) | (28.1%, 29.5%) | 6019(35.8%) | (35.1%, 36.5%) *** |
| Milk intake | 8202(45.4%) | (44.7%, 46.1%) | 7168(42.6%) | (41.9%, 43.4%) *** |
| Model 1 | Model 2 | |||||||
|---|---|---|---|---|---|---|---|---|
| Underweight | Overweight/Obesity | Underweight | Overweight/Obesity | |||||
| OR (95%CI) | p | OR (95%CI) | p | 95%CI | p | 95%CI | p | |
| None | 1.22(0.95,1.58) | 0.123 | 1.26(1.03,1.54) | 0.026 | 1.23(0.95,1.58) | 0.117 | 1.22(1.00,1.49) | 0.053 |
| MVPA | 1.09(0.84,1.41) | 0.538 | 1.33(1.09,1.64) | 0.006 | 1.10(0.85,1.43) | 0.479 | 1.30(1.06,1.60) | 0.011 |
| ST | 1.09(0.83,1.44) | 0.537 | 1.35(1.09,1.67) | 0.006 | 1.08(0.82,1.42) | 0.589 | 1.32(1.06,1.64) | 0.012 |
| SLP | 1.35(1.04,1.75) | 0.023 | 1.18(0.96,1.45) | 0.114 | 1.35(1.04,1.75) | 0.023 | 1.15(0.94,1.41) | 0.186 |
| ST+MVPA | 1.20(0.88,1.63) | 0.248 | 1.27(1.00,1.61) | 0.052 | 1.20(0.88,1.62) | 0.253 | 1.25(0.98,1.59) | 0.068 |
| SLP+MVPA | 1.04(0.79,1.36) | 0.780 | 1.24(1.01,1.53) | 0.043 | 1.05(0.80,1.37) | 0.730 | 1.22(0.99,1.5) | 0.067 |
| ST+SLP | 1.29(0.96,1.74) | 0.087 | 1.02(0.80,1.30) | 0.865 | 1.28(0.95,1.71) | 0.106 | 1.00(0.79,1.27) | 0.999 |
| MVPA+SLP+ST | 1 | 1 | 1 | 1 | ||||
| Breakfast | 0.95(0.86,1.05) | 0.280 | 1.07(0.99,1.16) | 0.070 | 0.94(0.85,1.04) | 0.248 | 1.07(0.99,1.15) | 0.097 |
| Fruit | 1.03(0.96,1.12) | 0.412 | 0.94(0.91,1.07) | 0.051 | 1.02(0.94,1.11) | 0.637 | 0.93(0.87,0.99) | 0.022 |
| Vegetable | 0.99(0.87,1.12) | 0.855 | 0.95(0.87,1.05) | 0.319 | 0.97(0.86,1.10) | 0.659 | 0.96(0.87,1.05) | 0.478 |
| Meat intake | 0.98(0.90,1.07) | 0.712 | 1.01(0.94,1.08) | 0.817 | 0.98(0.90,1.07) | 0.596 | 1.01(0.95,1.08) | 0.727 |
| Soft drink intake | 0.91(0.85,0.98) | 0.010 | 1.01(0.96,1.07) | 0.665 | 0.91(0.84,0.98) | 0.010 | 1.01(0.95,1.07) | 0.850 |
| Milk intake | 1.08(1.01,1.64) | 0.024 | 1.15(1.09,1.22) | <0.001 | 1.07(1.00,1.15) | 0.063 | 1.16(1.10,1.23) | <0.001 |
Publisher’s Note: MDPI stays neutral with regard to jurisdictional claims in published maps and institutional affiliations. |
© 2022 by the authors. Licensee MDPI, Basel, Switzerland. This article is an open access article distributed under the terms and conditions of the Creative Commons Attribution (CC BY) license (https://creativecommons.org/licenses/by/4.0/).
Share and Cite
Yang, Y.; Yuan, S.; Liu, Q.; Li, F.; Dong, Y.; Dong, B.; Zou, Z.; Ma, J.; Baker, J.S.; Li, X.; et al. Meeting 24-Hour Movement and Dietary Guidelines: Prevalence, Correlates and Association with Weight Status among Children and Adolescents: A National Cross-Sectional Study in China. Nutrients 2022, 14, 2822. https://doi.org/10.3390/nu14142822
Yang Y, Yuan S, Liu Q, Li F, Dong Y, Dong B, Zou Z, Ma J, Baker JS, Li X, et al. Meeting 24-Hour Movement and Dietary Guidelines: Prevalence, Correlates and Association with Weight Status among Children and Adolescents: A National Cross-Sectional Study in China. Nutrients. 2022; 14(14):2822. https://doi.org/10.3390/nu14142822
Chicago/Turabian StyleYang, Yide, Shuqian Yuan, Qiao Liu, Feifei Li, Yanhui Dong, Bin Dong, Zhiyong Zou, Jun Ma, Julien S. Baker, Xianxiong Li, and et al. 2022. "Meeting 24-Hour Movement and Dietary Guidelines: Prevalence, Correlates and Association with Weight Status among Children and Adolescents: A National Cross-Sectional Study in China" Nutrients 14, no. 14: 2822. https://doi.org/10.3390/nu14142822