The Relationship of Obesity, Nutritional Status and Muscle Wasting in Patients Assessed for Liver Transplantation

 , , and
Abstract
:1. Introduction
2. Methods
2.1. Ethics Consideration
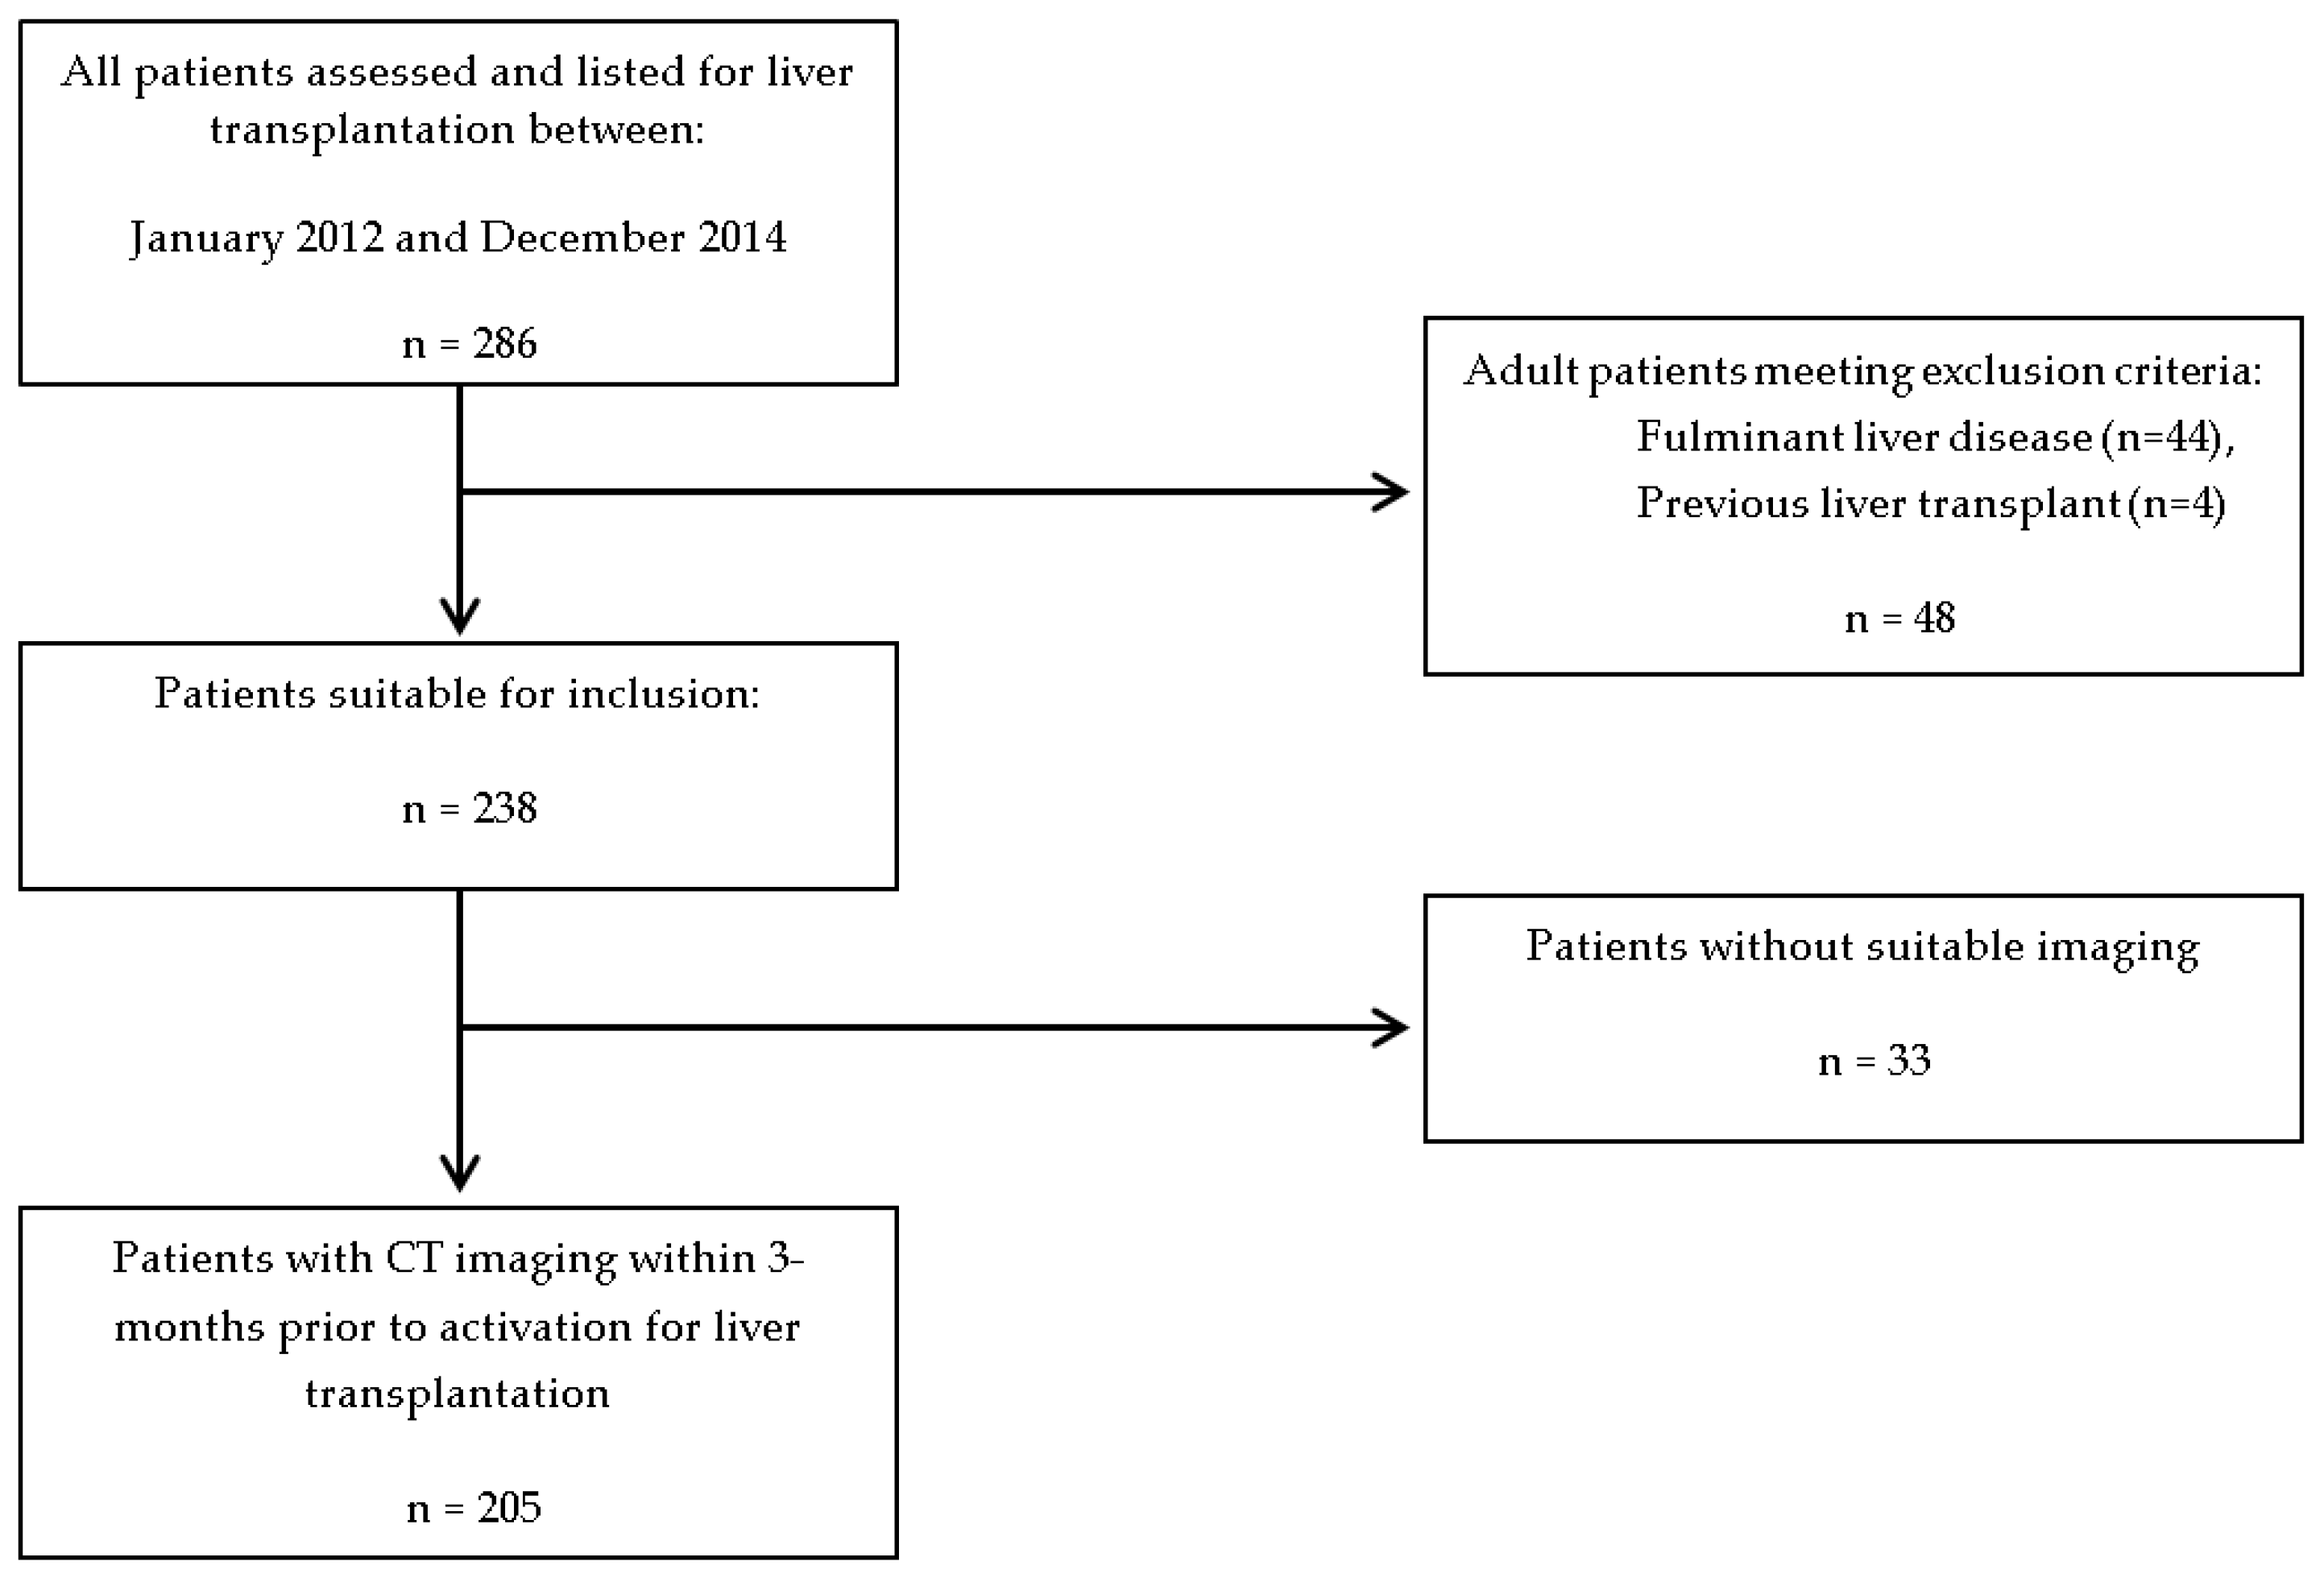
2.2. Patient Cohort
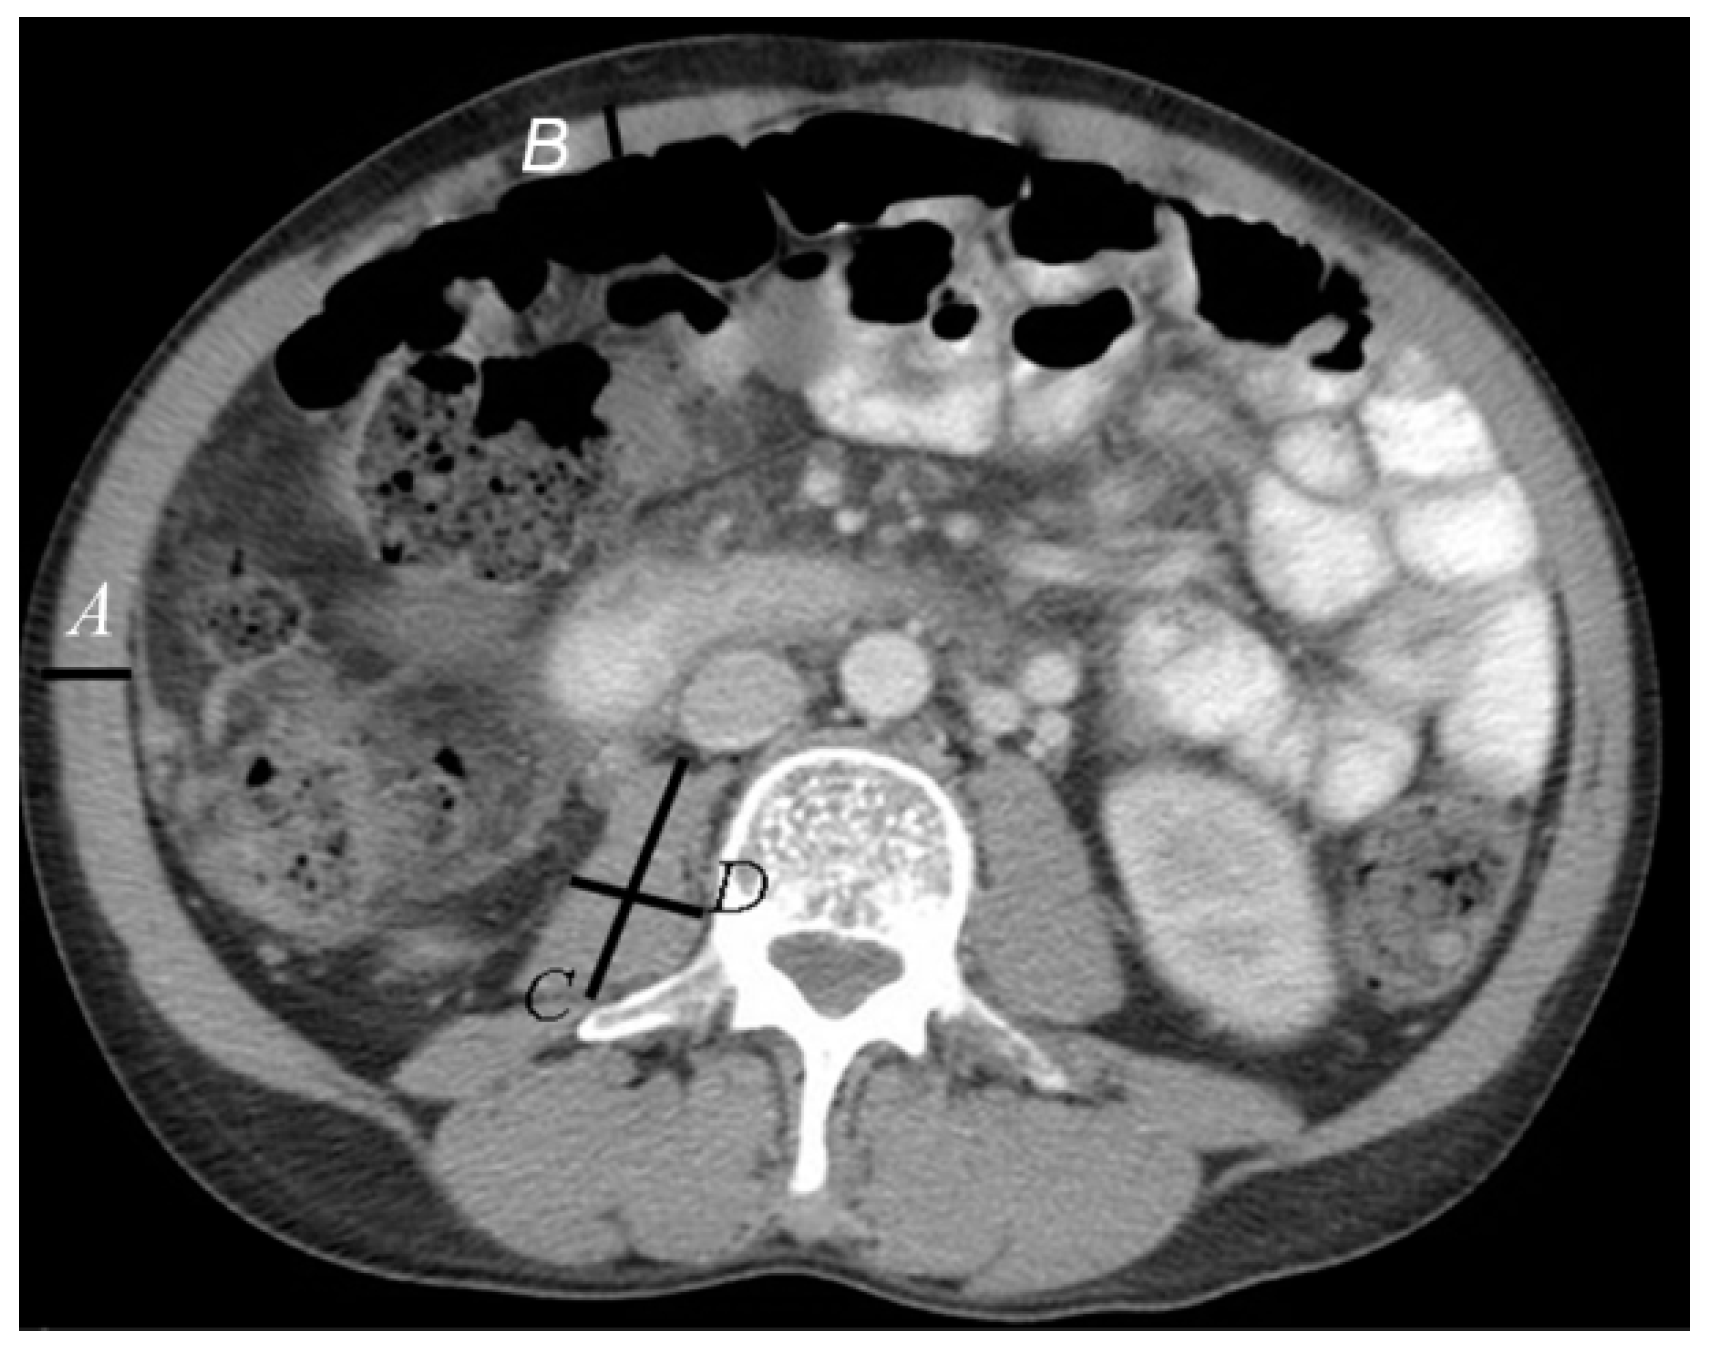
2.3. Assessment
3. Results
3.1. Demographics
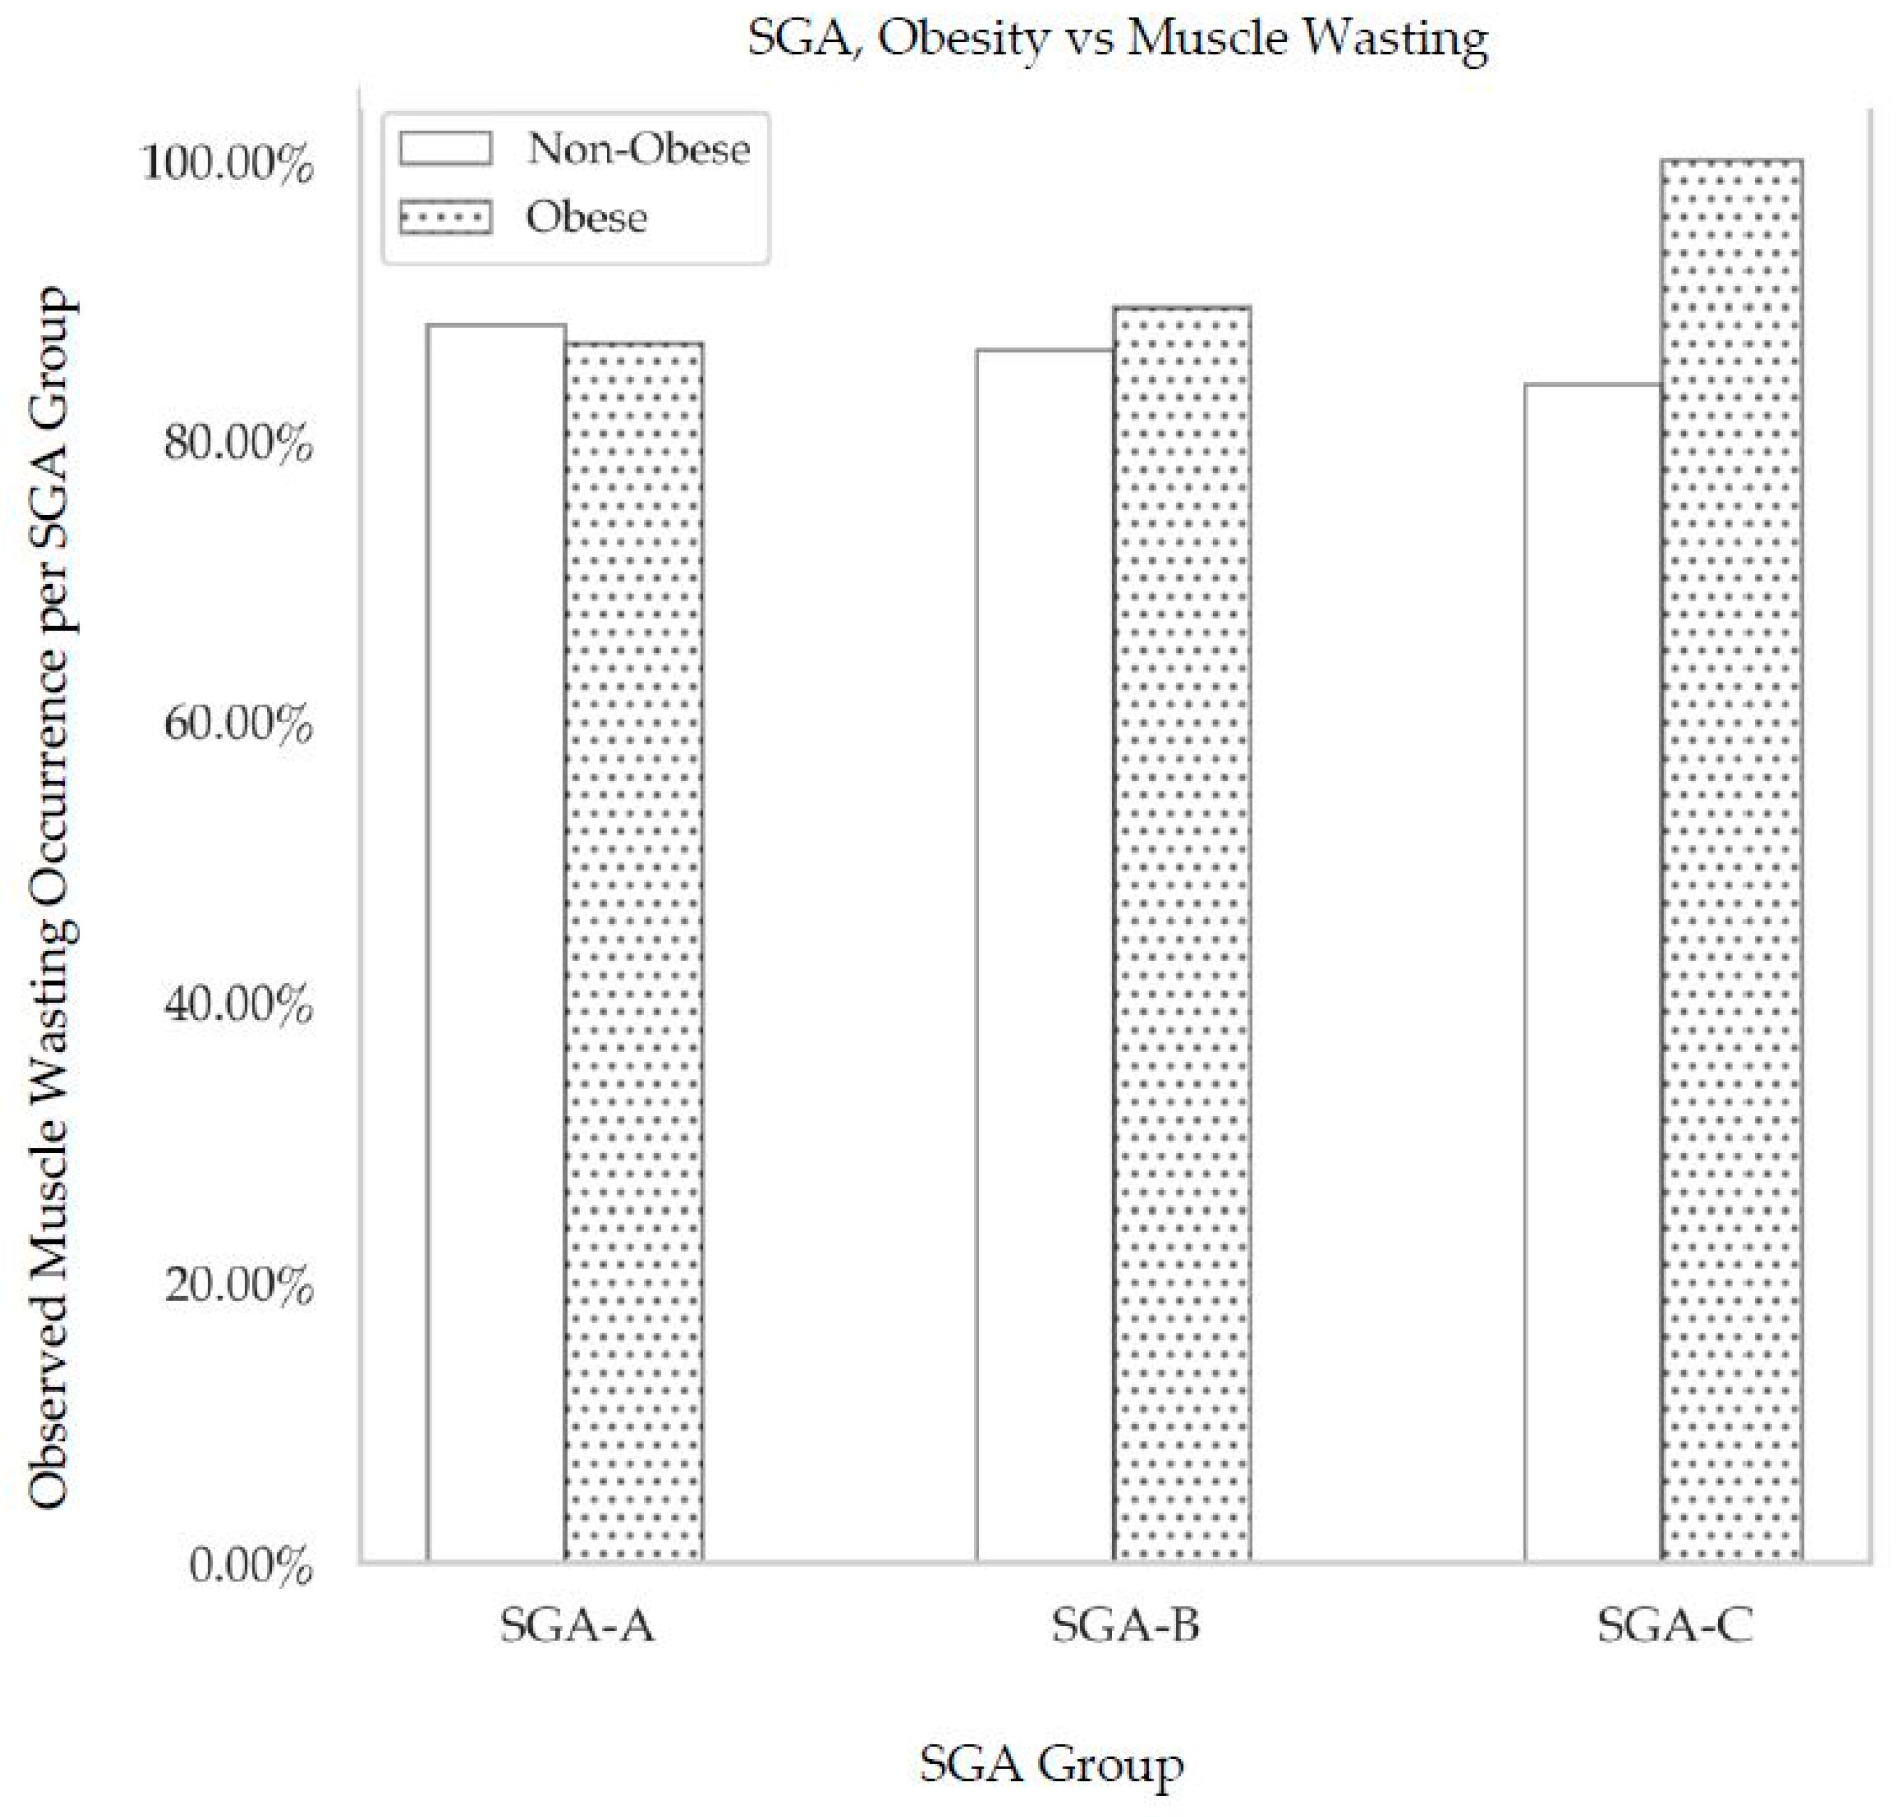
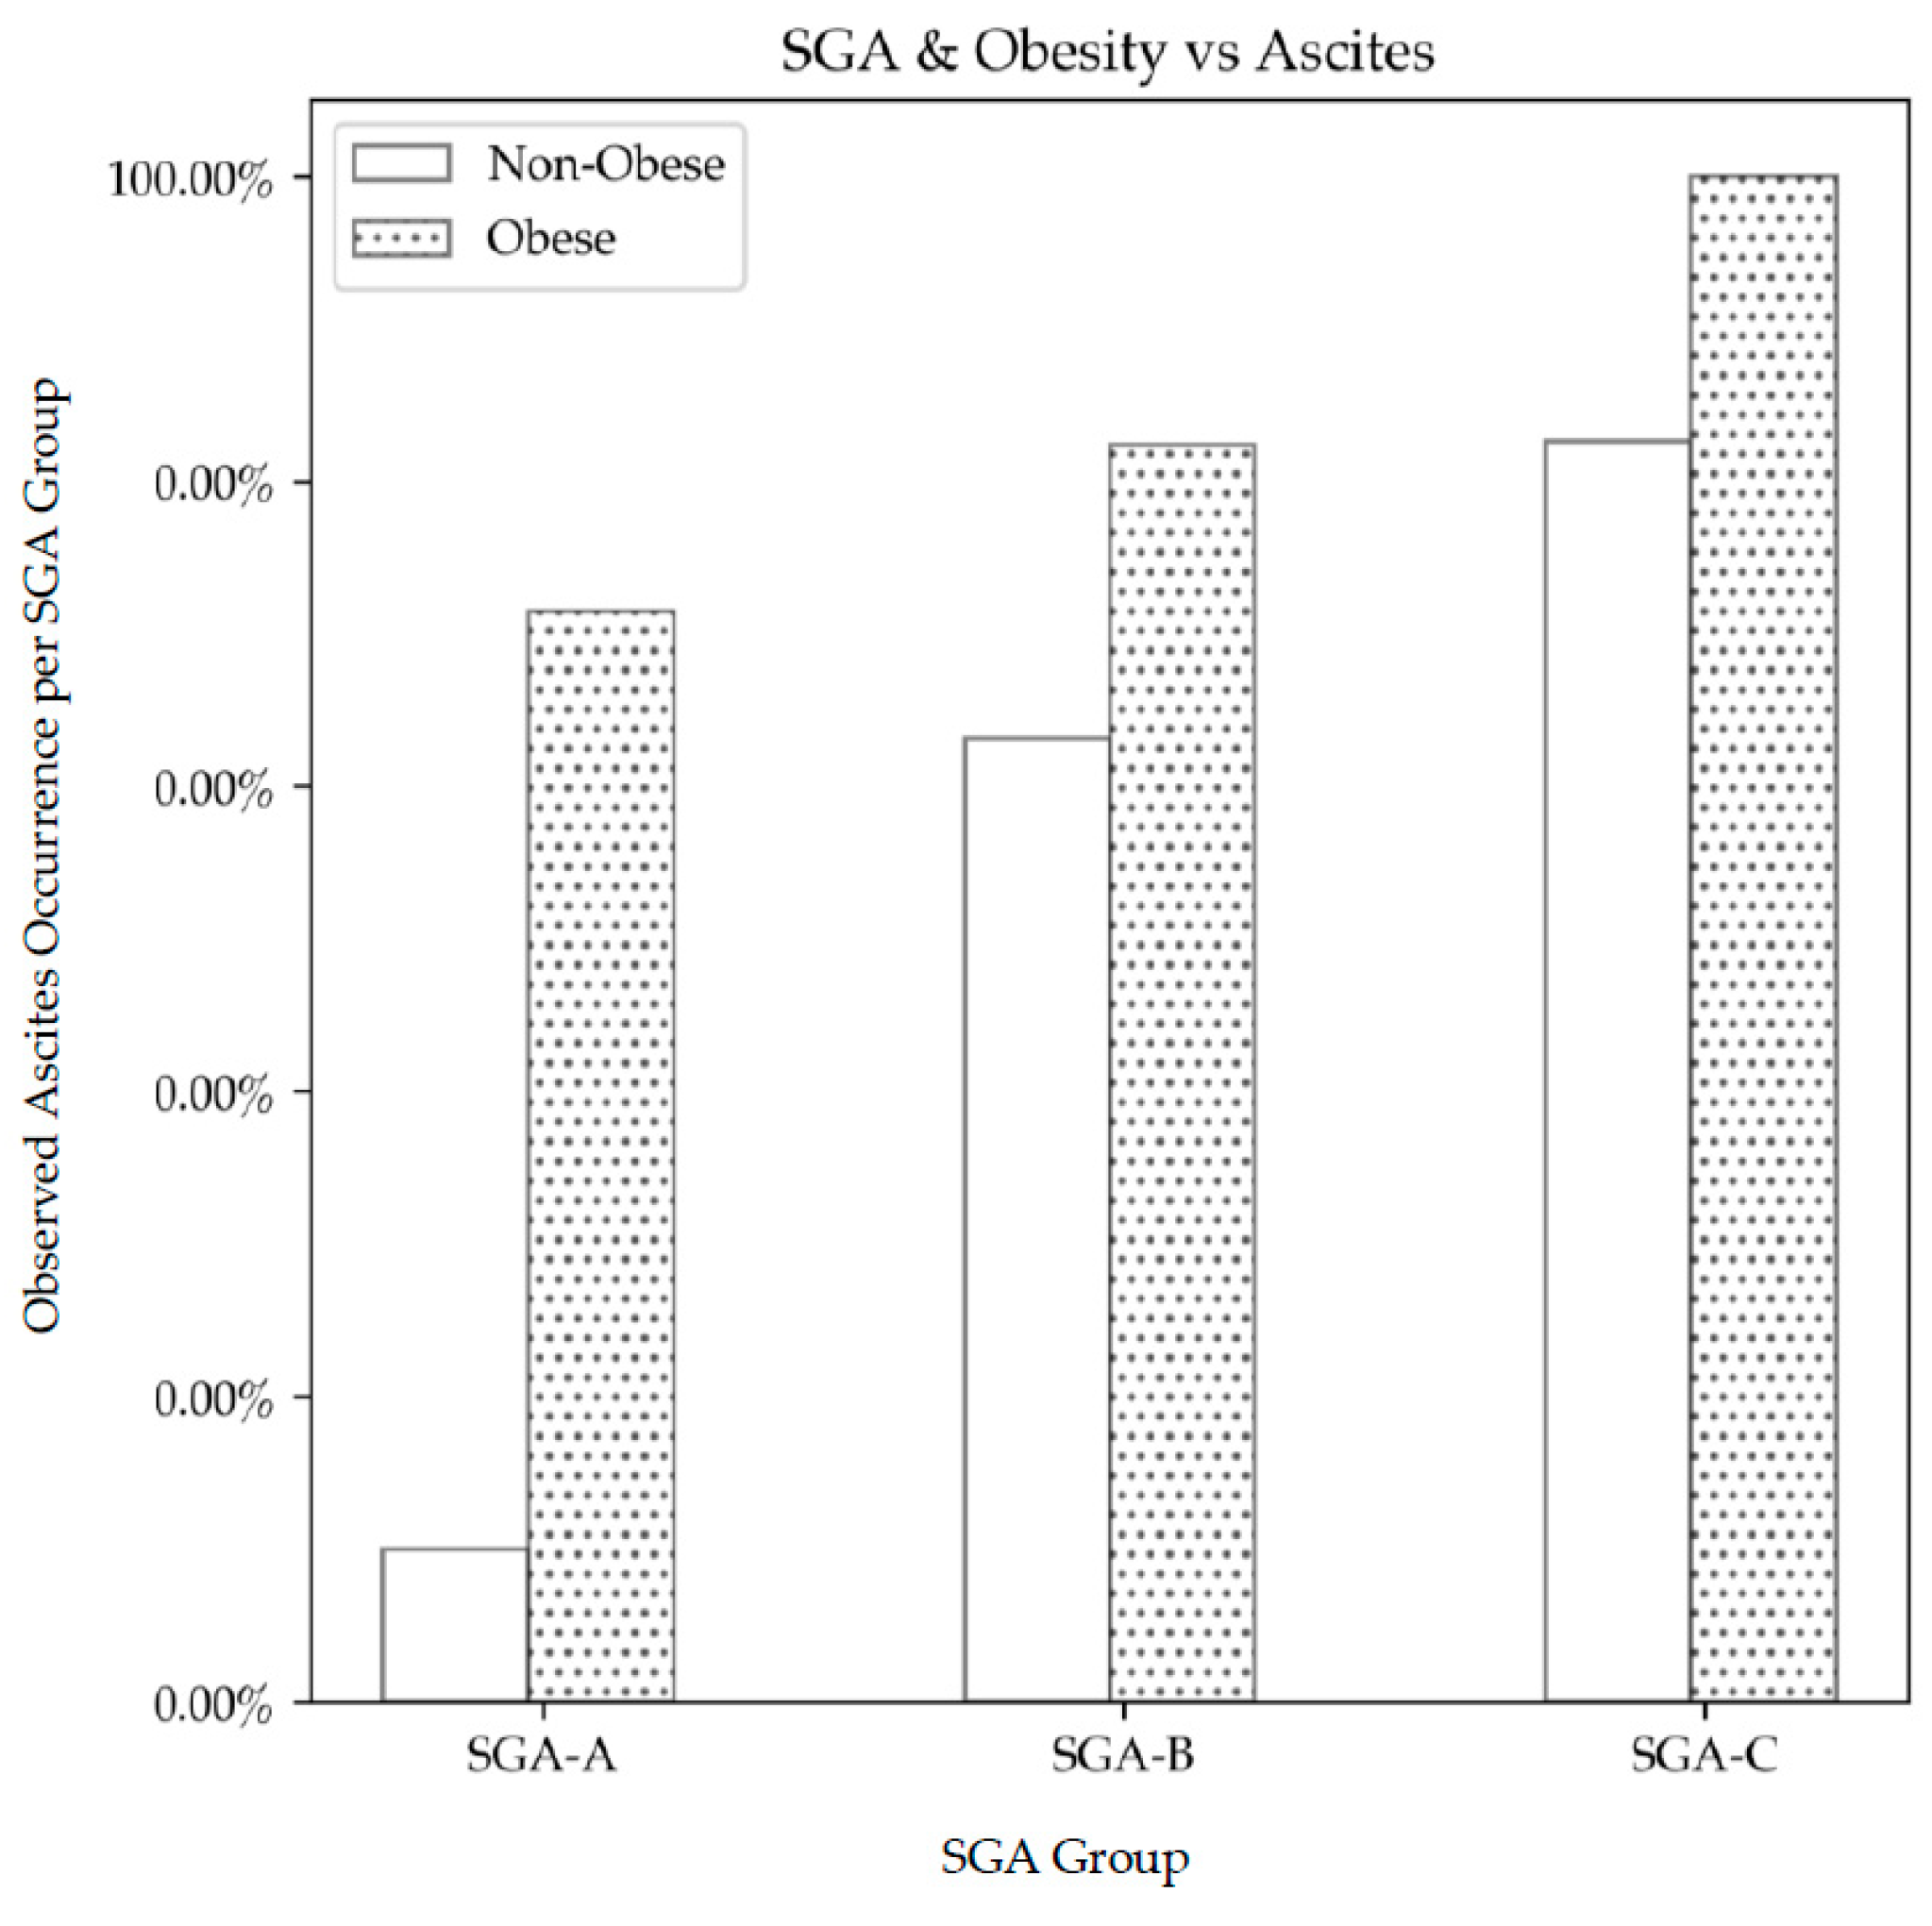
3.2. Obesity, SGA and Sarcopenia,
3.3. Clinical Significance of Muscle Wasting
3.4. cTPA-Defined Muscle Wasting and other Muscle Groups
3.5. Serum Testosterone Concentrations and Muscle Wasting
3.6. Survival on the Waiting List
4. Discussion
5. Conclusions
Author Contributions
Funding
Conflicts of Interest
References
- Periyalwar, P.; Dasarathy, S. Malnutrition in Cirrhosis: Contribution and Consequences of Sarcopenia on Metabolic and Clinical Responses. Clin. Liver Dis. 2012, 16, 95–131. [Google Scholar] [CrossRef] [PubMed] [Green Version]
- Juakiem, W.; Torres, D.; Harrison, S.A. Nutrition in Cirrhosis and Chronic Liver Disease. Clin. Liver Dis. 2014, 18, 179–190. [Google Scholar] [CrossRef] [PubMed]
- Merli, M.; Berzigotti, A.; Zelber-Sagi, S.; Dasarathy, S.; Montagnese, S.; Genton, L.; Plauth, M.; Parés, A. EASL Clinical Practice Guidelines on nutrition in chronic liver disease. J. Hepatol. 2019, 70, 172–193. [Google Scholar] [CrossRef] [PubMed]
- Cheung, K.; Lee, S.S.; Raman, M. Prevalence and Mechanisms of Malnutrition in Patients with Advanced Liver Disease, and Nutrition Management Strategies. Clin. Gastroenterol. Hepatol. 2012, 10, 117–125. [Google Scholar] [CrossRef] [PubMed]
- Iwasa, M.; Iwata, K.; Hara, N.; Hattori, A.; Ishidome, M.; Sekoguchi-Fujikawa, N.; Mifuji-Moroka, R.; Sugimoto, R.; Fujita, N.; Kobayashi, Y.; et al. Nutrition therapy using a multidisciplinary team improves survival rates in patients with liver cirrhosis. Nutrition 2013, 29, 1418–1421. [Google Scholar] [CrossRef] [PubMed]
- Hasse, J.; Strong, S.; Gorman, M.A.; Liepa, G. Subjective global assessment: Alternative nutrition-assessment technique for liver-transplant candidates. Nutrition 1993, 9, 339–343. [Google Scholar] [PubMed]
- Vieira, P.M.; De-Souza, D.; Oliveira, L.C. Nutritional assessment in hepatic cirrhosis; clinical, anthropometric, biochemical and hematological parameters. Nutr. Hosp. 2013, 28, 1615–1621. [Google Scholar]
- Alvares-da-Silva, M.R.; Reverbel de Silveira, T. Comparison between handgrip strength, subjective global assessment, and prognostic nutritional index in assessing malnutrition and predicting clinical outcome in cirrhotic outpatients. Nutrition 2005, 21, 113–117. [Google Scholar] [CrossRef]
- Bharadwaj, S.; Ginova, S.; Tandon, P.; Gohel, T.D.; Guirguis, J.; Vallabh, H.; Jevenn, A.; Hanouneh, I. Malnutrition: Laboratory markers vs. nutritional assessment. Gastroenterol. Rep. 2016, 4, 272–280. [Google Scholar] [CrossRef]
- Montano-Loza, A.J.; Angulo, P.; Meza-Junco, J.; Prado, C.M.; Sawyer, M.B.; Beaumont, C.; Esfandiari, N.; Ma, M.; Baracos, V.E. Sarcopenic obesity and myosteatosis are associated with higher mortality in patients with cirrhosis. J. Cachexia Sarcopenia Muscle 2016, 7, 126–135. [Google Scholar] [CrossRef]
- Berzigotti, A.; Garcia-Tsao, G.; Bosch, J.; Grace, N.D.; Burroughs, A.K.; Morillas, R.; Escorsell, A.; Garcia-Pagan, J.C.; Patch, D.; Matloff, D.S.; et al. Obesity is an independent risk factor for clinical decompensation in patients with cirrhosis. Hepatology 2011, 54, 555–561. [Google Scholar] [CrossRef] [PubMed] [Green Version]
- Detsky, A.S.; McLaughlin, J.R.; Baker, J.P.; Johnston, N.; Whittaker, S.; Mendelson, R.A.; Jeejeebhoy, K.N. What is subjective global assessment of nutritional status? J. Parenter. Enter. Nutr. 1983, 11, 8–13. [Google Scholar] [CrossRef] [PubMed]
- Keith, J.N. Bedside Nutrition Assessment Past, Present, and Future: A Review of the Subjective Global Assessment. Nutr. Clin. Pract. 2008, 23, 410–416. [Google Scholar] [CrossRef] [PubMed]
- Teiusanu, A.; Andrei, M.; Arbanas, T.; Nicolaie, T.; Diculescu, M. Nutritional Status in Cirrhotic Patients. Mædica 2012, 7, 284–289. [Google Scholar] [PubMed]
- Schiavo, L.; Busetto, L.; Cesaretti, M.; Zelber-Sagi Deutsch, L.; Iannelli, A. Nutritional issues in patients with obesity and cirrhosis. World J. Gastroenterol. 2018, 24, 3330–3346. [Google Scholar] [CrossRef] [PubMed]
- Nepal, B.; Brown, L. Projection of older Australians with a history of midlife obesity and overweight 2010–2050. Obesity 2013, 21, 2579–2581. [Google Scholar] [CrossRef] [PubMed]
- El-Atem, N.A.; Wojcik, K.; Horsfall, L.; Irvine, K.M.; Johnson, T.; McPhail, S.M.; Powell, E.E. Patterns of service utilisation within Australian hepatology clinics: High prevalence of advanced liver disease. Intern. Med. J. 2016, 46, 420–426. [Google Scholar] [CrossRef] [PubMed]
- Roubenoff, R. Sarcopenia: Effects on Body Composition and Function. J. Gerentol. 2003, 58, 1012–1017. [Google Scholar] [CrossRef]
- Durand, F.; Buyse, S.; Francoz, C.; Laouénan, C.; Bruno, O.; Belghiti, J.; Moreau, R.; Vilgrain, D.; Valla, D. Prognostic value of muscle atrophy in cirrhosis using psoas muscle thickness on computed tomography. J. Hepatol. 2014, 60, 1151–1157. [Google Scholar] [CrossRef]
- Narci, M.V.; Maffulli, N. Sarcopenia: Characteristics, mechanisms and functional significance. Br. Med. Bull. 2010, 95, 139–159. [Google Scholar] [CrossRef]
- Cruz-Jentoft, A.J.; Baeyens, J.P.; Bauer, J.M.; Boirie, Y.; Cederholm, T.; Landi, F.; Martin, F.C.; Michel, J.; Rolland, Y.; Schneider, S.M.; et al. Sarcopenia: European consensus on definition and diagnosis: Report of the European Working Group on Sarcopenia in Older People. Age Ageing 2010, 39, 412–423. [Google Scholar] [CrossRef] [PubMed] [Green Version]
- Santilli, V.; Bernetti, A.; Mangone, M.; Paoloni, M. Clinical definition of sarcopenia. Clin. Cases Miner. Bone Metab. 2014, 11, 177–180. [Google Scholar] [CrossRef] [PubMed]
- Sinclair, M.; Gow, P.J.; Grossmann, M.; Angus, P.W. Review article: sarcopenia in cirrhosis—Aetiology, implications and potential therapeutic interventions. Aliment. Pharmacol. Ther. 2016, 43, 765–777. [Google Scholar] [CrossRef] [PubMed]
- Bhanji, R.A.; Montano-Loza, A.J.; Watts, K.D. Sarcopenia in cirrhosis: Looking beyond the skeletal muscle loss to see the systemic disease. Hepatology 2019. [Google Scholar] [CrossRef] [PubMed]
- Dasarathy, S.; Merli, M. Sarcopenia from mechanism to diagnosis and treatment in liver disease. J. Hepatol. 2016, 65, 1232–1244. [Google Scholar] [CrossRef] [PubMed] [Green Version]
- Van Vugt, J.L.; Levolger, S.; De Bruin, R.W.; van Rosmalen, J.; Metselaar, H.J.; Jzermans, J.N.M.I. Systematic Review and Meta-Analysis of the Impact of Computed Tomography–Assessed Skeletal Muscle Mass on Outcome in Patients Awaiting or Undergoing Liver Transplantation. Am. J. Transpl. 2016, 16, 2277–2292. [Google Scholar] [CrossRef] [PubMed]
- Carias, S.; Castellanos, A.L.; Vilchez, V.; Nair, R.; Dela Cruz, A.C.; Watkins, J.; Barrett, T.; Trushar, P.; Esser, K.; Gedaly, R. Nonalcoholic steatohepatitis is strongly associated with sarcopenic obesity in patients with cirrhosis undergoing liver transplant evaluation. J. Gastroenterol. Hepatol. 2016, 31, 628–633. [Google Scholar] [CrossRef] [PubMed]
- Giusto, M.; Lattanzi, B.; Albanese, C.; Galtieri, A.; Farcomeni, A.; Giannelli, V.; Lucidi, C.; Di Martino, M.; Catalano, C.; Merli, M. Sarcopenia in liver cirrhosis: The role of computed tomography scan for the assessment of muscle mass compared with dual-energy X-ray absorptiometry and anthropometry. Eur. J. Gastroenterol. Hepatol. 2015, 27, 328–334. [Google Scholar] [CrossRef] [PubMed]
- Peterson, S.J.; Braunschweig, C. Prevalence of Sarcopenia and Associated Outcomes in the Clinical Setting. Nutr. Clin. Pract. 2016, 31, 40–48. [Google Scholar] [CrossRef] [PubMed]
- Montano-Loza, A.J.; Meza-Junco, J.; Prado, C.M.M.; Lieffers, J.R.; Baracos, V.E.; Bain, V.G.; Sawyer, M.B. Muscle Wasting is Associated with Mortality in Patients with Cirrhosis. Clin. Gastroenterol. Hepatol. 2012, 10, 166–173. [Google Scholar] [CrossRef]
- Jones, K.I.; Doleman, B.; Scott, S.; Lund, J.N.; Williams, J.P. Simple psoas cross-sectional area measurement is a quick and easy method to assess sarcopenia and predicts major surgical complications. Colorectal Dis. 2015, 17, O20–O26. [Google Scholar] [CrossRef] [PubMed]
- Ferenci, P.; Lockwood, A.; Mullen, K.; Tarter, R.; Weissenborn, K.; Blei, A. Hepatic encephalopathy—definition, nomenclature, diagnosis, and quantification: Final report of the working party at the 11th World Congresses of Gastroenterology, Vienna, 1998. Hepatology 2002, 35, 16–21. [Google Scholar] [CrossRef] [PubMed]
- Brown, R.S., Jr.; Kumar, K.S.; Russo, M.W.; Kinkhabwala, M.; Rudow, D.L.; Harren, P.; Lobritto, S.; Emond, J.C. Model for end-stage liver disease and Child-Turcotte-Pugh score as predictors of pretransplantation disease severity, posttransplantation outcome, and resource utilization in United Network for Organ Sharing status 2A patients. Liver Transplant. 2002, 8, 278–284. [Google Scholar] [CrossRef] [PubMed]
- Kamath, P.S.; Wiesner, R.H.; Malinchoc, M.; Kremers, W.; Therneau, T.M.; Kosberg, C.L.; D’Amico, G.; Dickson, E.R.; Kim, W.R. A model to predict survival in patients with end-stage liver disease. Hepatology 2001, 33, 464–470. [Google Scholar] [CrossRef] [PubMed]
- Heidelbaugh, J.J.; Bruderly, M. Cirrhosis and Chronic Liver Failure: Part I. Diagnosis and Evaluation. Am. Fam. Physician 2006, 74, 756–762. [Google Scholar] [PubMed]
- Chalasani, N.; Younossi, Z.; Lavine, J.E.; Diehl, A.M.; Brunt, E.M.; Cusi, K.; Charlton, M.; Sanyal, A.J. The diagnosis and management of nonalcoholic fatty liver disease: Practice guidance from the American Association for the Study of Liver Diseases. Hepatology 2018, 67, 328–357. [Google Scholar] [CrossRef] [PubMed]
- Galle, P.R.; Forner, A.; Llovet, J.M.; Mazzaferro, V.; Piscaglia, F.; Raoul, J.; Schirmacher, P.; Vilgrain, V. EASL Clinical Practice Guidelines: Management of hepatocellular carcinoma. J. Hepatol. 2018, 69, 182–236. [Google Scholar] [CrossRef] [Green Version]
- Madden, A.; Wicks, C. A Practical Guide to Nutrition in Liver Disease, 2nd ed.; Liver Interest Group of the British Dietetic Association: Birmingham, UK, 1994. [Google Scholar]
- Nuttall, F.Q. Body Mass Index, Obesity, BMI and Health: A Critical Review. Nutr. Today 2015, 50, 117–128. [Google Scholar] [CrossRef]
- Seabold, S.; Perktold, J. Statsmodels: Econometric and statistical modelling with python. In Proceedings of the 9th Python in Science Conference (SciPy), Austin, TX, USA, 28 June–3 July 2010. [Google Scholar]
- Tandon, P.; Ney, M.; Irwin, I.; MaLeah, M.M.; Bain, G.G.; Esfandiari, N.; Baracos, V.; Montano-Loza, A.J.; Myers, P.R. Severe muscle depletion in patients on the liver transplant wait list: Its prevalence and independent prognostic value. Liver Transplant. 2012, 18, 1209–1216. [Google Scholar] [CrossRef]
- Montano-Loza, A.J.; Duarte-Rojo, A.; Meza-Junco, J.; Baracos, V.E.; Sawyer, M.B.; Pang, J.X.; Beaumont, C.; Esfandiari, N.; Myers, R.P. Inclusion of Sarcopenia Within MELD (MELD-Sarcopenia) and the Prediction of Mortality in Patients with Cirrhosis. Clin. Trans. Gastroenterol. 2015, 6, e102. [Google Scholar] [CrossRef]
- Barazzoni, R.; Bischoff, S.; Boirie, L.; Cederholm, T.; Dicker, D.I.; Toplak, H.; Van Gossum, A.; Yumuk, V.; Vettor, R. Sarcopenic obesity: Time to meet the challenge. Clin. Nutr. 2018, 37, 1787–1793. [Google Scholar] [CrossRef] [PubMed]
- Frank, A. Futility and avoidance: Medical professionals in the treatment of obesity. JAMA 1993, 269, 2132–2133. [Google Scholar] [CrossRef]
- Foster, G.D.; Wadden, T.A.; Makris, A.P.; Davidson, D.; Sanderson, R.S.; Allison, D.B.; Kessler, A. Primary care physicians’ attitudes about obesity and its treatment. Obesity 2012, 11, 1168–1177. [Google Scholar] [CrossRef] [PubMed]
- Sheean, P.M.; Peterson, S.J.; Perez, S.G.; Troy, K.L.; Patel, A.; Sclamberg, J.S.; Ajanaku, F.C.; Braunschweig, C.A. The prevalence of sarcopenia in patients with respiratory failure classified as normally nourished using subjective global assessment and computed tomography. J. Parenter. Enter. Nutr. 2014, 38, 873–879. [Google Scholar] [CrossRef] [PubMed]
- Eslamparast, T.; Montano-Loza, A.J.; Raman, M.; Tandon, P. Sarcopenic obesity in cirrhosis—The confluence of 2 prognostic titans. Liver Int. 2018, 38, 1706–1717. [Google Scholar] [CrossRef] [PubMed]
- Tandon, P.; Raman, M.; Mourtzakis, M.; Merli, M. A Practical Approach to Nutritional Screening and Assessment in Cirrhosis. Hepatology 2017, 65, 1044–1057. [Google Scholar] [CrossRef]
- Aldridge, D.R.; Tranah, E.J.; Shawcross, D.L. Pathogenesis of hepatic encephalopathy: Role of ammonia and systemic inflammation. J. Clin. Exp. Hepatol. 2015, 5 (Suppl. S1), S7–S20. [Google Scholar] [CrossRef]
- Merli, M.; Giusto, M.; Lucidi, C.; Giannelli, V.; Pentassuglio, I.; di Gregorio, V.; Lattanzi, B.; Riggio, O. Muscle depletion increases the risk of overt and minimal hepatic encephalopathy: Results of a prospective study. Metab. Brain Dis. 2013, 28, 281–284. [Google Scholar] [CrossRef]
- Thandassery, R.B.; Montano-Loza, A.J. Role of Nutrition and Muscle in Cirrhosis. Curr. Treat. Options Gastroenterol. 2016, 14, 257–273. [Google Scholar] [CrossRef]
- Engelman, C.; Schob, S.; Nonnenmacher, I.; Werlich, L.; Aehling, N.; Ullrich, S.; Kaiser, T.; Krohn, S.; Herber, A.; Sucher, R.; et al. Loss of paraspinal muscle mass is a gender-specific consequence of cirrhosis that predicts complications and death. Aliment. Pharmacol. Ther. 2018, 48, 1271–1281. [Google Scholar] [CrossRef]
- Krell, R.W.; Kaul, D.R.; Martin, A.R.; Englesbe, M.J.; Sonnenday, C.J.; Cai, S.; Malani, P.N. The Association between Sarcopenia and the Risk of Serious Infection among Adults Undergoing Liver Transplantation. Liver Transplant. 2013, 19, 1396–1402. [Google Scholar] [CrossRef] [PubMed]
- Sinclair, M.; Grossmann, M.; Hoermann, R.; Angus, P.; Gow, P. Testosterone therapy increases muscle mass in men with cirrhosis and low testosterone: A randomised controlled trial. J. Hepatol. 2018, 65, 906–913. [Google Scholar] [CrossRef] [PubMed]
- Sinclair, M.; Grossmann, M.; Gow, P.J.; Angus, P.W. Testosterone in men with advanced liver disease: Abnormalities and implications. J. Gastroenterol. Hepatol. 2014, 30, 244–251. [Google Scholar] [CrossRef] [PubMed]
- Sinclair, M.; Grossmann, M.; Angus, P.W.; Hoermann, R.; Hey, P.; Scodellaro, T.; Gow, P.J. Low testosterone as a better predictor of mortality than sarcopenia in men with advanced liver disease. J. Gastroenterol. Hepatol. 2016, 31, 661–667. [Google Scholar] [CrossRef] [PubMed]
- Allan, C.A.; McLachlan, R.I. Androgens and obesity. Curr. Opin. Endocrinol. Diabetes Obes. 2010, 17, 224–232. [Google Scholar] [CrossRef] [PubMed]
- Tang Fui, M.N.; Dupuis, P.; Grossmann, M. Lowered testosterone in male obesity: Mechanisms, morbidity and management. Asian J. Androl. 2014, 16, 223–231. [Google Scholar]
- Carey, E.J.; Lai, J.C.; Wang, C.W.; Dasarathy, S.; Lobach, I.; Montano-Loza, A.J.; Dunn, M.A.; Fitness, Life Enhancement, and Exercise in Liver Transplantation Consortium. A multicenter study to define sarcopenia in patients with end-stage liver disease. Liver Transplant. 2017, 23, 625–633. [Google Scholar] [CrossRef] [PubMed]


| All | Muscle Wasting | No Muscle Wasting | |
|---|---|---|---|
| Gender | |||
| Males | 143 | 139 | 4 * |
| Females | 62 | 39 | 23 |
| Age-years (mean±SEM) | 52.8 ± 0.7 | 52.9 ± 1.0 | 52.0 ± 2.0 |
| CTP: (% A/B/C) | 17/38/45 | 17/31/41 | 0/7/4 * |
| MELD (mean ± SEM) | 16.8 ± 0.5 | 17.7 ± 1.0 | 17.9 ± 0.5 |
| HCC | |||
| Primary diagnosis (%) | 2 | 2 | 0 |
| Secondary diagnosis (%) | 20 | 19 | 1 |
| Aetiology | |||
| Viral (%) | 48 | 42 | 6 |
| EtOH (%) | 14 | 12 | 1 |
| NASH (%) | 7 | 6 | 1 |
| Cholestatic (%) | 15 | 12 | 3 |
| Other (%) | 12 | 10 | 2 |
| SGA | |||
| A (well-nourished) (%) | 41 | 36 ** | 5 |
| B (moderately malnourished) (%) | 79 | 68 ** | 11 |
| C (severely malnourished) (%) | 30 | 26 ** | 4 |
| HE | |||
| None (%) | 45 | 39 | 3 * |
| Grade 1–2 (%) | 39 | 36 | 6 |
| BMI (mean ± SEM) | 27.9 ± 0.4 | 27.7±0.4 | 27.6 ± 1.1 |
| Corrected psoas muscle area (mm2/m2) (mean ± SEM) | 301.1 ± 7.5 | 273.4 ± 6.0 * | 483.8 ± 15.5 * |
| % Patients with Significant Muscle Wasting per SGA Group | |||
|---|---|---|---|
| Participant Groups (% of Group) | SGA A | SGA B | SGA C |
| All Patients (86%) | |||
| Males | 17 | 36 | 12 |
| Females | 7 | 9 | 5 |
| Obese Patients (89%) | |||
| Males | 34 | 34 | 5 |
| Females | 11 | 5 | 0 |
| Non-obese Patients (86%) | |||
| Males | 10 | 39 | 14 |
| Females | 4 | 12 | 7 |
| Variable (n = 205) | Mean | Univariate | ||
|---|---|---|---|---|
| Muscle Wasting | No Muscle Wasting | OR (95% CI) | p-Value | |
| Gender | ||||
| Male (n) | 139 | 4 | 20.5 (6.7–62.8) | <0.0001 |
| Female (n) | 39 | 23 | ||
| Age (SEM) | 52.9 ± 0.8 | 52 ± 1.7 | 1.0 (0.97–1.05) | 0.68 |
| MELD | 16.3 ± 6.0 | 16.4 ± 5.9 | 0.97 (0.91–1.03) | 0.32 |
| CTP (%A/ B/ C) | 17/31/41 | 0/7/4 | 0.91 (0.724–1.134) | 0.39 |
| Albumin (SEM) (g/L) | 32.3 ± 0.5 | 33.2 ± 1.4 | 0.98(0.916–1.044) | 0.50 |
| BMI (kg/m2) (SEM) | 28.0 ± 0.4 | 27.6 ± 1.1 | 1.01 (0.928–1.101) | 0.80 |
| Psoas muscle area (mm2/m2) (SEM) | 275 ± 6.0 | 484 ± 15.5 | 0.97 (0.59–0.980) | <0.0001 |
| Anterior abdominal muscle (mm) (SEM) | 6.0 ± 0.2 | 6.9 ± 0.6 | 0.90 (0.796–1.03) | 0.12 |
| Lateral abdominal muscle (mm) (SEM) | 15.2 ± 0.4 | 17.6 ± 0.7 | 0.91 (0.84–0.98) | 0. 02 |
| Testosterone (SEM) (nmol/L) | 12.1 ± 1.0 | 13.7 ± 1.3 | 1.2 (1.07–1.40) | 0.004 |
| ALT (U/L) | 81 ± 13 | 77 ± 11 | 0.99 (0.998–1.00) | 0.29 |
© 2019 by the authors. Licensee MDPI, Basel, Switzerland. This article is an open access article distributed under the terms and conditions of the Creative Commons Attribution (CC BY) license (http://creativecommons.org/licenses/by/4.0/).
Share and Cite
Vidot, H.; Kline, K.; Cheng, R.; Finegan, L.; Lin, A.; Kempler, E.; Strasser, S.I.; Bowen, D.G.; McCaughan, G.W.; Carey, S.; et al. The Relationship of Obesity, Nutritional Status and Muscle Wasting in Patients Assessed for Liver Transplantation. Nutrients 2019, 11, 2097. https://doi.org/10.3390/nu11092097
Vidot H, Kline K, Cheng R, Finegan L, Lin A, Kempler E, Strasser SI, Bowen DG, McCaughan GW, Carey S, et al. The Relationship of Obesity, Nutritional Status and Muscle Wasting in Patients Assessed for Liver Transplantation. Nutrients. 2019; 11(9):2097. https://doi.org/10.3390/nu11092097
Chicago/Turabian StyleVidot, Helen, Katharine Kline, Robert Cheng, Liam Finegan, Amelia Lin, Elise Kempler, Simone I. Strasser, David Geoffrey Bowen, Geoffrey William McCaughan, Sharon Carey, and et al. 2019. "The Relationship of Obesity, Nutritional Status and Muscle Wasting in Patients Assessed for Liver Transplantation" Nutrients 11, no. 9: 2097. https://doi.org/10.3390/nu11092097