Article

Association of Infant Feeding Patterns with Taste Preferences in European Children and Adolescents: A Retrospective Latent Profile Analysis

1
Leibniz Institute for Prevention Research and Epidemiology—BIPS, Achterstr. 30, 28359 Bremen, Germany
2
Institute for Public Health and Nursing Research—IPP, University of Bremen, 28359 Bremen, Germany
3
Research and Education Institute of Child Health, 2035 Lefcosia, Cyprus
4
Department of Chronic Diseases, National Institute for Health Development, 11619 Tallin, Estonia
5
Institute of Food Sciences, National Research Council, 83100 Avellino, Italy
6
GENUD (Growth, Exercise, Nutrition and Development) Research Group, Instituto Agroalimentario de Aragón (IA2), Instituto de Investigación Sanitaria Aragón (IIS Aragón), Centro de Investigación Biomédica en Red Fisiopatología de la Obesidad y Nutrición (CIBERObn), University of Zaragoza, 50009 Zaragoza, Spain
7
Department of Pediatrics, Medical School, University of Pécs, 7623 Pécs, Hungary
8
Department of Biomedicine and Public Health, School of Health and Education, University of Skövde, 54128 Skövde, Sweden
9
Department. of Pediatrics, Institute of Clinical Sciences, Sahlgrenska Academy at University of Gothenburg, 40530 Gothenburg, Sweden
10
Department of Preventive and Predictive Medicine, Fondazione IRCCS, Istituto Nazionale dei Tumori, 20133 Milan, Italy
11
Faculty of Mathematics/Computer Science, University of Bremen, 28359 Bremen, Germany
*
Author to whom correspondence should be addressed.
Shared first authorship.
Nutrients 2019, 11(5), 1040; https://doi.org/10.3390/nu11051040
Submission received: 14 April 2019 / Revised: 4 May 2019 / Accepted: 6 May 2019 / Published: 9 May 2019
(This article belongs to the Special Issue Dietary Behavior and Physical Activity in Children and Adolescents)

Abstract

:
The aim was to investigate associations between the duration of infant feeding practices (FP) and taste preferences (TP) in European children and adolescents. A total of 5526 children (6–16 years old) of the I.Family study completed a Food and Beverage Preference Questionnaire to measure their preferences for sweet, fatty and bitter tastes. Mothers retrospectively reported the FPs duration in months: exclusive breastfeeding (EBF), exclusive formula milk feeding (EFMF), combined breastfeeding (BF&FMF) and the age at the introduction of complementary foods (CF). Using logistic regression analyses and latent class analysis (latent profiles of FP and CF were identified), we explored associations between profiles and TP, adjusting for various covariates, including the Healthy Diet Adherence Score (HDAS). A total of 48% of children had short durations of EBF (≤4 months) and BF&FMF (≤6 months) and were introduced to CF early (<6 months). No significant relationship was observed between the single FPs and TP, even when considering common profiles of FP. HDAS was inversely associated with sweet and fatty TP, but positively with bitter TP. Contrary to our hypotheses, we did not observe associations between FP and children’s TP later in life. Further studies with higher FP variation and longitudinal design are needed to investigate the causal associations between infant FP and taste preferences later in life.

1. Introduction

Taste preference (TP) is one of the factors that affect the children’s food intake and eating habits [1]. Humans can perceive 6 main basic tastes: (1) Sweet taste is caused by sugar and its derivatives such as fructose or lactose, but other substances such as amino acids and alcohol in fruit juices or alcoholic drinks can also activate the sensory cells that respond to sweetness; (2) Sour taste is mostly perceived via acidic solutions such as lemon juice or organic acids and is caused by hydrogen ions; (3) Salty taste is mainly perceived through foods containing table salt. Its chemical basis is the salt crystal, which consists of sodium and chloride. The sensation of saltiness can be caused by other mineral salts such as potassium or magnesium salts [2]; (4) Bitter taste is brought by a variety of components such as 6-n-propylthiouracil (PROP), sinigrin and goitrin, found in cruciferous vegetables (e.g., broccoli). There are 25 bitter taste receptors in humans but the most studied is TAS2R38. Genetic variations in this receptor cause different responses in taste sensitivity to bitter compounds from one human to another [3]; (5) Umami taste is caused by glutamic acid or aspartic acid and is similar to the taste of meat broth. It is also found in some plants, such as ripe tomatoes or asparagus [4]; (6) Fatty taste, called Oleogustus, has been described as the sixth basic taste. The stimuli devoted to the detection of dietary fat taste are the Non-Esterified Fatty Acids (NEFA). In particular, medium and long-chain fatty acids have a distinct taste sensation compared to other basic tastes (sweet, bitter, sour and salty) [5,6].
Evidence for the influencing role of genetic and environmental factors on the development of TP is well established [7]. Infants prefer the sweet taste and reject the sour and bitter tastes [7], while the preference for salt appears at about 4 months postnatally [8,9]. TP are learned during contact with food and the eating environment. An infant’s experience with flavors begins in the mother’s womb and during lactation, when flavors from the mother’s diet are transmitted to her amniotic fluid, and later to her colostrum and milk. The infant-feeding method parents choose, whether it is breast or formula milk, will later influence their child-feeding practices [10,11] and the development of their children’s food preferences and food acceptance patterns [12].
The fundamental role of breastfeeding on different physiological functions and on the infant’s early immunity has been recognized through international nutritional policies, such as the World Health Organization guidelines on early life feeding, which recommends the exclusive breastfeeding of infants up to the age of 6 months and at least for the first 4 months of life [13]. Exclusive breastfeeding is crucial for the growth and development of infants [14], has a long term impact in shaping children’s eating behaviors, and predicts the Body Mass Index (BMI) during childhood [15] and later in adult life [16]. Previous studies have pointed out the positive influence of breastfeeding duration on food variety and higher intake of fruits and vegetables in preschoolers [17,18], including in 4 European cohorts [19] and in school-aged children [20,21]. Vital compounds in the human milk provide a specific taste, such as lactose for the sweet taste, glutamate for the umami or savory taste, sodium for the salty taste, urea for the bitter taste and long-chain fatty acids for the fatty taste [22,23].
The introduction of formula milk and other complementary foods represents a crucial period for establishing infants’ taste preferences and attitudes towards food, as well as for obesity prevention [24]. Children who were fed exclusively with formula milk do not benefit from the rich flavor profile of their mother’s milk: their flavor experience is poorer as they don’t experience the flavors from the variety of foods in the mother’s diet. Various types and brands of formula milk products offer a diversity of flavors: milk-based formulas are described as having low levels of sweetness and ‘sour and cereal-type’; soy-based formulas are described as tasting sweeter, more sour and bitter, and having a ‘hay/beany’ odor, whereas the hydrolysate formulas are extremely unpalatable to adults due to their sourness and bitterness [25]. Formula-fed infants learn to prefer the flavors associated with the formula milk they were fed and this has been found to influence taste preferences later in life [3,25]. Infant formulas might differ in protein, fat and carbohydrate composition and/or structure, and these differences may, in turn, affect growth, health outcomes and taste preferences [26].
Scott et al. demonstrated that breastfeeding duration is directly associated with the food variety at two years of age [18], independent of factors that are known to influence diet quality in children, such as maternal age and education [27,28]. Another study found that having been breastfed was positively associated with a healthier dietary pattern amongst older Australian children [20]. Burnier et al. [29] investigated longitudinal data from the Quebec Longitudinal Study of Child Development and observed that 3 or more months of exclusive breastfeeding appeared to be a predictive factor for the higher consumption of vegetables in preschool age children. Nicklaus and colleagues found that 2–8 year old children who were breastfed for at least three or more months were more likely to eat vegetables compared to those who were breastfed for a shorter time [30]. A number of animal studies [31,32] and experimental studies in humans [33,34] indicated that breastfeeding is associated with a greater acceptability of new food and flavors during the weaning period. Breastfeeding can contribute towards reducing infants’ fears to try new foods and facilitate the transition from milk feeding to solid food eating with lower resistance. Consequently, this can lead to an intake of a higher food variety in breastfed children [3,21,35,36].
Although research has shown that breastfeeding influences infants’ food acceptance [22,37,38,39], to our knowledge, no studies have examined whether it shapes taste preferences in later stages of life. This study seeks to fill this gap by examining how breastfeeding practices—in comparison to formula milk feeding—during infancy, affect food TP in later childhood and adolescence, in a population-based cohort of normal, healthy developing children aged 6 to 16 years old, in 7 European countries: Cyprus, Estonia, Germany, Hungary, Italy, Spain and Sweden.
To be exact, we examined the association between infant feeding practices duration (FP): (1) exclusive breastfeeding (EBF), (2) exclusive formula milk feeding (EFMF) and (3) combined strategy (BF&FMF), and taste preferences (TP) evaluated in our study: sweet, fatty and bitter. We further considered a latent class analysis to identify feeding patterns from a combination of feeding practices and food introduction, and their association with taste preferences.

2. Materials and Methods

2.1. Study Sample

I.Family builds on the IDEFICS (Identification and prevention of Dietary and lifestyle-induced health Effects in Children and InfantS) study, whereby it additionally engages the families of the children who were examined during the IDEFICS baseline (T0) and/or follow-up survey (T1) [40,41]. During the IDEFICS study in 2007/2008, 16,229 children aged 2–9 years from Belgium, Cyprus, Estonia, Germany, Hungary, Italy, Spain and Sweden participated in the baseline survey (T0). Two years later (T1), 13,596 children were examined, 11,041 of whom had previously participated in T0 (68%). In 2013/2014, I.Family (T3) collected further data on the lifestyle-related diseases of 7105 (52% of T1) children, who were then between 7 and 17 years old [42]. Data of 5526 children aged 6–16 years old who completed the Food and Beverage Preference Questionnaire (FBP) during I.Family were used. For the purpose of this investigation, Belgian participants were excluded as their data on food and beverage preference were not collected. Further, retrospective information from the Pregnancy and Early Childhood Questionnaire concerning breastfeeding and formula milk feeding practices and their respective durations during infancy and early childhood reported by mothers in both the IDEFICS study and I.Family were linked. Parents provided written informed consent for all examinations. Each child was informed orally about the measurements by field workers and asked for his/her consent immediately before the examination.

2.2. Core Questionnaire

Information on sex, age, country, migration and socio-economic status (SES) of I.Family participants were collected using a self-administered questionnaire. A validated [43,44] and reproducibility tested [45] food frequency questionnaire (FFQ) containing 59 food and beverage items was completed for each participant. The response categories were ‘never/less than once a week’, ‘1–3 times a week’, ‘4–6 times a week’, ‘1 time/day’, ‘2 times a day’, ‘3 times a day’ and ‘I have no idea’. Based on the FFQ data, a Healthy Diet Adherence Score (HDAS) was developed for all 7 countries [46,47], as a proxy-indicator of children’s adherence to healthy dietary guidelines including a high consumption of fruits and vegetables, of whole meals, fish consumption of 2–3 times per week and a reduced intake of refined sugars and fat. The HDAS was used for the present analyses as a continuous variable and ranged from 0 to 50. A higher score represented a higher adherence to healthy dietary guidelines. The self-reported educational level of parents was assessed based on the International Standard Classification of Education (ISCED) [48] and used as a proxy indicator for SES. For the present analyses, it was classified into two main categories: “low-medium education”, and “high education”. Children’s migration background was assessed based on whether the parents were born outside the respective country of residence and recorded as the migration status in the categories “both parents”, “one parent”, “none of the parents”.
All questionnaires were developed in English and translated into the respective national languages. They were then back-translated into English to check for translation errors. Children aged 12 years and above self-completed the questionnaire, while parents proxy-reported the relevant questions for children below 12 years of age. The cut-off of 12 years was chosen because children have been shown to be reliable reporters of their food intake at this age [49].

2.3. Food and Beverage Preference Questionnaire

The questionnaire was constructed as part of the I.Family survey to assess the preferences for sweet, fatty, bitter and salty tasting foods and beverages and was administered to children and adolescents. It contained food photographs of 63 items, including single foods (e.g., broccoli, banana, lettuce), mixed foods (e.g., lasagna, donut), condiments (e.g., nougat spread, butter), and drinks (e.g., fruit juice, lemonade). Using a 1–5 point Likert (smiley) scale, children indicated how much they like the taste of the food given in the photograph, with 1 meaning “do not like at all” and 5 meaning “I like it very much”. Participants were also given the chance to indicate if they had never tried (don’t know) a specific food/drink item (Figure 1). A pre-test was conducted in every center to ensure the availability of all food items across countries. Furthermore, the FBP questionnaire has been shown to provide valid data that are useful for characterizing taste phenotypes in epidemiological studies [50]. For the present analyses, the preferences for sweet and fatty taste were used as proxy-indicators for unhealthy foods [51,52], while bitter taste was used as a proxy-indicator for healthy foods [3]. Our study only focused on taste preferences that are linked to current obesogenic dietary intake in children, characterized by nutrient-dense foods high in fat and sugar and low in fiber [53,54], hence, salty and sour taste were not assessed. Umami taste is under discussion for healthy (e.g., tomatoes) and unhealthy food preferences (e.g., crisps); thus we also did not consider the preference for umami taste. For the sake of clarity, the term “taste preference” will be used instead of preferences for sweet, fatty and bitter tasting foods and beverages, hereafter.

2.4. Taste Preference Scores

The food and beverages included in our analyses were chosen based on factor analyses conducted by Jilani and colleagues [55] that assigned foods to respective taste modalities. In accordance with the factor analyses, we computed scores for the liking of three specific taste modalities: sweet, fatty and bitter, by calculating the mean liking of the foods and drinks included in each of the 3 categories. To control for differences of age and sex in the liking of each taste, the scores were first calculated separately for boys under 12 years old, girls under 12 years, boys aged 12 years and above and girls aged 12 years and above. The cut off of 12 years was chosen as the median age where children enter the age of puberty and further physiological and anatomical developments occur [56]. The scores were then merged into one unique score for each taste modality, in order to assess the association between taste preference scores and infant FP, independent of the age and sex of subjects. The sum of the ratings for the foods and drinks was then calculated and divided by the total number of foods and drinks that were included in the specific taste modality group. The taste preference scores were then categorized as “high” vs. “low”, depending on the children’s answers. Based on the median value, those who reported 4 or 5 on the smiley scale were included in the “high” preference category, while children who reported 3 or below on the Likert scale were categorized in the “low” preference category. Due to missing values in the taste preference scores, the sample size varied. For instance, when analyzing the sweet score, the sample size was higher than for the bitter score, because children recognized the sweet tasting foods more than the bitter tasting ones.

2.5. Pregnancy and Early Childhood Questionnaire

During the IDEFICS surveys (2007/2008 and 2009/2010) and the I.Family survey (2013/2014), mothers were asked to retrospectively report on the feeding strategies they had chosen during infancy and the early life stage of their children. The FP included the duration of
  • Exclusive breastfeeding (EBF): calculated as the difference in months between age at start of other forms of feeding (formula or other complementary foods) and the age at the start of EBF (at birth); EBF was then classified in categories “None”, “Up to 4 months” and “More than 4 months”,
  • Combined breastfeeding (BF&FMF): calculated as the total duration of breastfeeding after birth (breastfeeding combined with any other type of feeding, formula or complementary foods) and classified as “None“, ”Up to 6 months” and “More than 6 months”.
  • Exclusive formula milk feeding (EFMF): calculated as the difference of total duration of formula milk feeding in combination with other types of feeding and the duration of either EBF or BF&FMF. It was then categorized as “None”, “Up to 6 months”, “More than 6 months”.
The categories for the infant feeding variables were chosen to try and accommodate the restricted sample size for smaller categories and to facilitate the interpretability of the results. The cut off of 4 months for EBF was chosen based on the WHO recommendations to breastfeed infants exclusively with breastmilk for at least the first 4 months of life [13]., As the introduction of complementary foods and the duration of FP in many countries varies, the cut off of 6 months was chosen for the BF&FMF and EFMF. This is in accordance with WHO observations and findings of other studies [13,22]. Mothers also provided information on the age at first introduction of any of the five food categories: cereals (or foods containing rye, wheat or barley), vegetables, fruits, meat and cow milk. These categories were then merged into one unique variable—the minimum age at the first introduction of any food category—which was then categorized as “up to 6 months”, “later than 6 months” and “missing”. This was again based on WHO observations of the introduction of complementary feeding [13]. From here on, we will refer to these categories as complementary food introduction (CF).

2.6. Statistical Analyses

Descriptive analyses of FP during infancy were conducted by calculating the mean, median and range of the duration of EBF, BF&FMF and EFMF. Furthermore, the following study characteristics were described, i.e., N and proportions, based on categories of BF&FMF for categorical covariates included in the analyses, such as age groups, sex, SES, migration status, the age of the first introduction of complementary food categories, preference scores for each taste modality and country. In order to evaluate the association between each of the three different FP (independent variables) and taste preferences (dependent variables), i.e., sweet, fatty and bitter, logistic regression analyses to calculate Odds Ratios (OR) and 95% confidence limits adjusted for covariates (country, age, sex, HDAS, CF introduction, parents’ migration status and SES) were conducted. As a combined analysis showed a high multicollinearity of feeding practices and did not yield interpretable results, a latent class analysis (LCA) was conducted in order to identify latent profiles considering categories of FP and age of complementary food introduction [57]. LCA was conducted considering three, four or five latent profiles of seven variables (three FP variables and four separate variables for the introduction of food items). The different LCA were compared by considering the Bayesian Information Criterium (BIC) and a clear distinction of latent profiles in terms of conditional probabilities. The chosen profiles were then used in logistic regression models as independent variables for each of the TP to again calculate Odds Ratios and 95% confidence limits adjusted for the remaining covariates. All statistical analyses were performed using the statistical software SAS, version 9.3 (Statistical Analyses System, SAS Institute Inc., Cary, NC, USA). The latent class analysis was conducted using the PROC LCA Macro (version 1.3.2, University Park: The Methodology Center, Penn State, PA, USA) [58] in SAS 9.3. Level of significance was set to α = 0.05.

3. Results

3.1. Study Characteristics

The descriptive analyses of the three main feeding practices, as shown in Table 1, indicated that the median for EBF was 4 months, ranging from not breastfed at all to 36 months of EBF. The BF&FMF had a median of 6 months, varying from 0 to 36 months of total breastfeeding (BF combined with other types of feeding). The EFMF had a maximum of 48 months, with a median of 0 months of formula milk feeding.
Half of the study population was female (Table 2) and the mean age was 11.6 years (SD = 1.9), whereby 53.3 % of the participants were less than 12 years old. Both parents of a small proportion of the children were migrants (5.4%), while 9.8 % had one parent who was a migrant. Half of the children (50.5%) came from highly educated families and 78.1% of them were introduced to complementary foods early (≤6 months). The HDAS ranged from 0 to 44, with a median of 18.
Almost 42% of the study population was breastfed for up to 6 months, while 43.6% had a longer duration of more than 6 months and 14.4% were never breastfed. Looking at the proportions of taste preference categories (low vs. high) according to BF&FMF, the children reported high sweet and fatty taste preferences, independent of the duration of BF&FMF during infancy. The contrary was however shown for bitter taste preferences.

3.2. Association between Exclusive Breastfeeding and Taste Preference

The results of the logistic regression analyses showed no associations between EBF and preferences for sweet, fatty and bitter tastes (Table 3). An increase in the HDAS was observed to significantly decrease the chance for high sweet taste preferences (OR = 0.88, 95%CI [0.82; 0.96]) and high-fat taste preferences (OR = 0.88, 95%CI [0.81; 0.95]), while on the other hand significantly increasing the chance for a high bitter taste preference (OR = 1.31, 95%CI [1.20; 1.43]). A late introduction to complementary foods (≤6 months) was found to significantly decrease the odds for a high-fat taste preference (OR = 0.81, 95%CI [0.68; 0.95]). Compared to having parents with a high SES, having parents with a low/medium SES significantly increased the odds for a high-fat taste preference (OR = 1.14, 95%CI [1.009; 1.30]).

3.3. Association between Combined Breastfeeding and Taste Preference

The logistic regression analyses did not show an association between the duration of BF&FMF and taste preferences (sweet, fatty and bitter) (Table 4). As observed for EBF, significant associations were observed between HDAS and taste preferences, with having a higher HDAS significantly decreasing the odds for high sweet and fatty taste preference but significantly increasing the odds for high bitter taste preference (Table 4). A late introduction of complementary foods significantly decreased the odds for a high-fat taste preference (OR = 0.82, 95%CI [0.70; 0.97]) compared to an introduction of complementary foods before the age of 6 months. Having parents with a low/medium SES again significantly increased the odds for a high-fat taste preference (OR = 1.14, 95%CI [1.004; −1.29]).

3.4. Association between Exclusive Formula Feeding and Taste Preference

No significant association was observed between the EFMF duration and preferences for sweet, fatty and bitter taste (Table 5). HDAS was again significantly associated with sweet and fatty taste preferences, (OR = 0.88, 95%CI [0.81; 0.96]) and OR = 0.88, 95%CI [0.81; 0.95]) respectively, as well as with a high bitter taste preference (OR = 1.31, 95%CI [1.20; 1.42]). Furthermore, a late introduction of complementary foods decreased the chance for a high preference of fatty taste (OR = 0.82, 95%CI [0,70; 0.97]) at a later age, compared to an early introduction. Compared to having a high SES background, having a low/medium SES background increased the odds to prefer a high-fat taste (OR = 1.14, 95%CI [1.00; 1.29]).

3.5. Association between Latent Profiles of Feeding Practices and Taste Preferences

With regard to the four latent profiles, the LCA showed the lowest BIC and a clear interpretable distinction of conditional probabilities for the respective variables. Results of the latent class profiles are presented in Table 6, where names of the profiles were chosen according to the highest conditional probabilities. Almost half of the children and adolescents (48%) had a short duration of EBF (up to 4 months), then were breastfed in combination with formula milk and introduced to complementary foods early (before 6 months). About a quarter (24%) were exclusively breastfed for a long period, were never exclusively fed formula milk and had a late introduction to complementary foods (later than 6 months). A total of 14% were fed formula milk as the main alternative to breastmilk and were as well introduced to complementary foods at a later age. Only 13% were exclusively fed formula milk and were introduced to complementary foods early.
Profile number 4 was considered to reflect the least advisable feeding strategy (no breastfeeding, only formula milk, early introduction) and served as a reference for the logistic regression analyses presented in Table 7. No significant associations of profiles of feeding practices with taste preferences for sweet, fatty and bitter tastes were observed. Again, the HDAS was significantly negatively associated with sweet (OR = 0.88, 95%CI [0.82; 0.96]) and fatty taste preferences (OR = 0.88, 95%CI [0.81; 0.95]) and significantly positively associated with a bitter taste preference (OR = 1.31, 95%CI [1.20; 1.43]). In addition, children from low/medium SES families were observed to have a higher chance of having a high-fat taste preference (OR = 1.14, 95%CI [1.00; 1.29]).

4. Discussion

To our knowledge, this is the first study assessing the association between different infant FPs and children’s taste preferences in later stages in life which included retrospective and current data from 7 European countries. Our results indicate that European children were predominantly breastfed exclusively for at least 4 months, which is in line with the WHO guidelines [13]. In addition, almost half of the subjects had a long duration of BF&FMF and only a minority (13%) was exclusively fed FM. The feeding strategy parents used seemed not to play a role in the development of taste preferences later in life, irrespective of whether it was EBF, EFMF or a combination. Using both single logistic regression analyses and LCA methods, in which latent profiles of all FP and introduction of complementary food categories were identified, a higher quality diet (HDAS) was observed to be associated with lower chances for a high sweet and high-fat taste preference and increased chances for high bitter taste preference. This suggests that current food choices can actually mold children’s preferences for sweet, fat and bitter tastes, independent of their infant feeding patterns. SES also seemed to play a role, as children who came from a lower SES background were more likely to prefer the fatty taste compared to those from a higher SES background. Our results indicate that a variation in food choice and parental education can affect children’s behaviors towards healthy food choices and preferences.
Our findings are supported by the current evidence, which suggests that children have innate preferences for sweet taste as signalers of high energy foods [3,8]. Further, Schwartz et al. reported that infants’ sweet acceptance was not related to longer durations of EBF [22]. In a longitudinal study, Desor and colleagues measured the sweet preference in children at the age of 11–15 years and again when they were 19–25 years of age, and found that the preferred levels of sucrose decreased over time [59]. Other studies have suggested that children learn to prefer flavors associated with a high dietary fat content [60,61]. Previous findings from the IDEFICS study indicated that children from low educational backgrounds tended to eat more high energy-dense foods, such as sugar-rich and fat-rich foods, compared to those whose parents had a high education [62]. In contrast, children of parents with a higher education tended to eat more fruits and vegetables, generally eating less unhealthy foods. They were also more likely to eat breakfast on a daily basis, emphasizing the influence of parental education on children’s eating habits [47,63,64,65,66,67]. Furthermore, a higher number of fruits and vegetables at 14 months has been shown to increase the preference for these foods and improve the quality of the diet at 3.7 years of age [68]. Our results, which are supported by the current evidence, suggest that taste preferences in children are learned via food experience and are significantly influenced by the food choice and diet literacy of parents. Thus, public health education programs should emphasize the role of food variety in shaping children’s preferences for bitter tasting foods in the long term. Particular attention needs to be paid to parents and other caretakers of low to medium socio-economic status families in order to help them reduce their children’s preferences for high energy-dense foods.

5. Strengths and Limitations

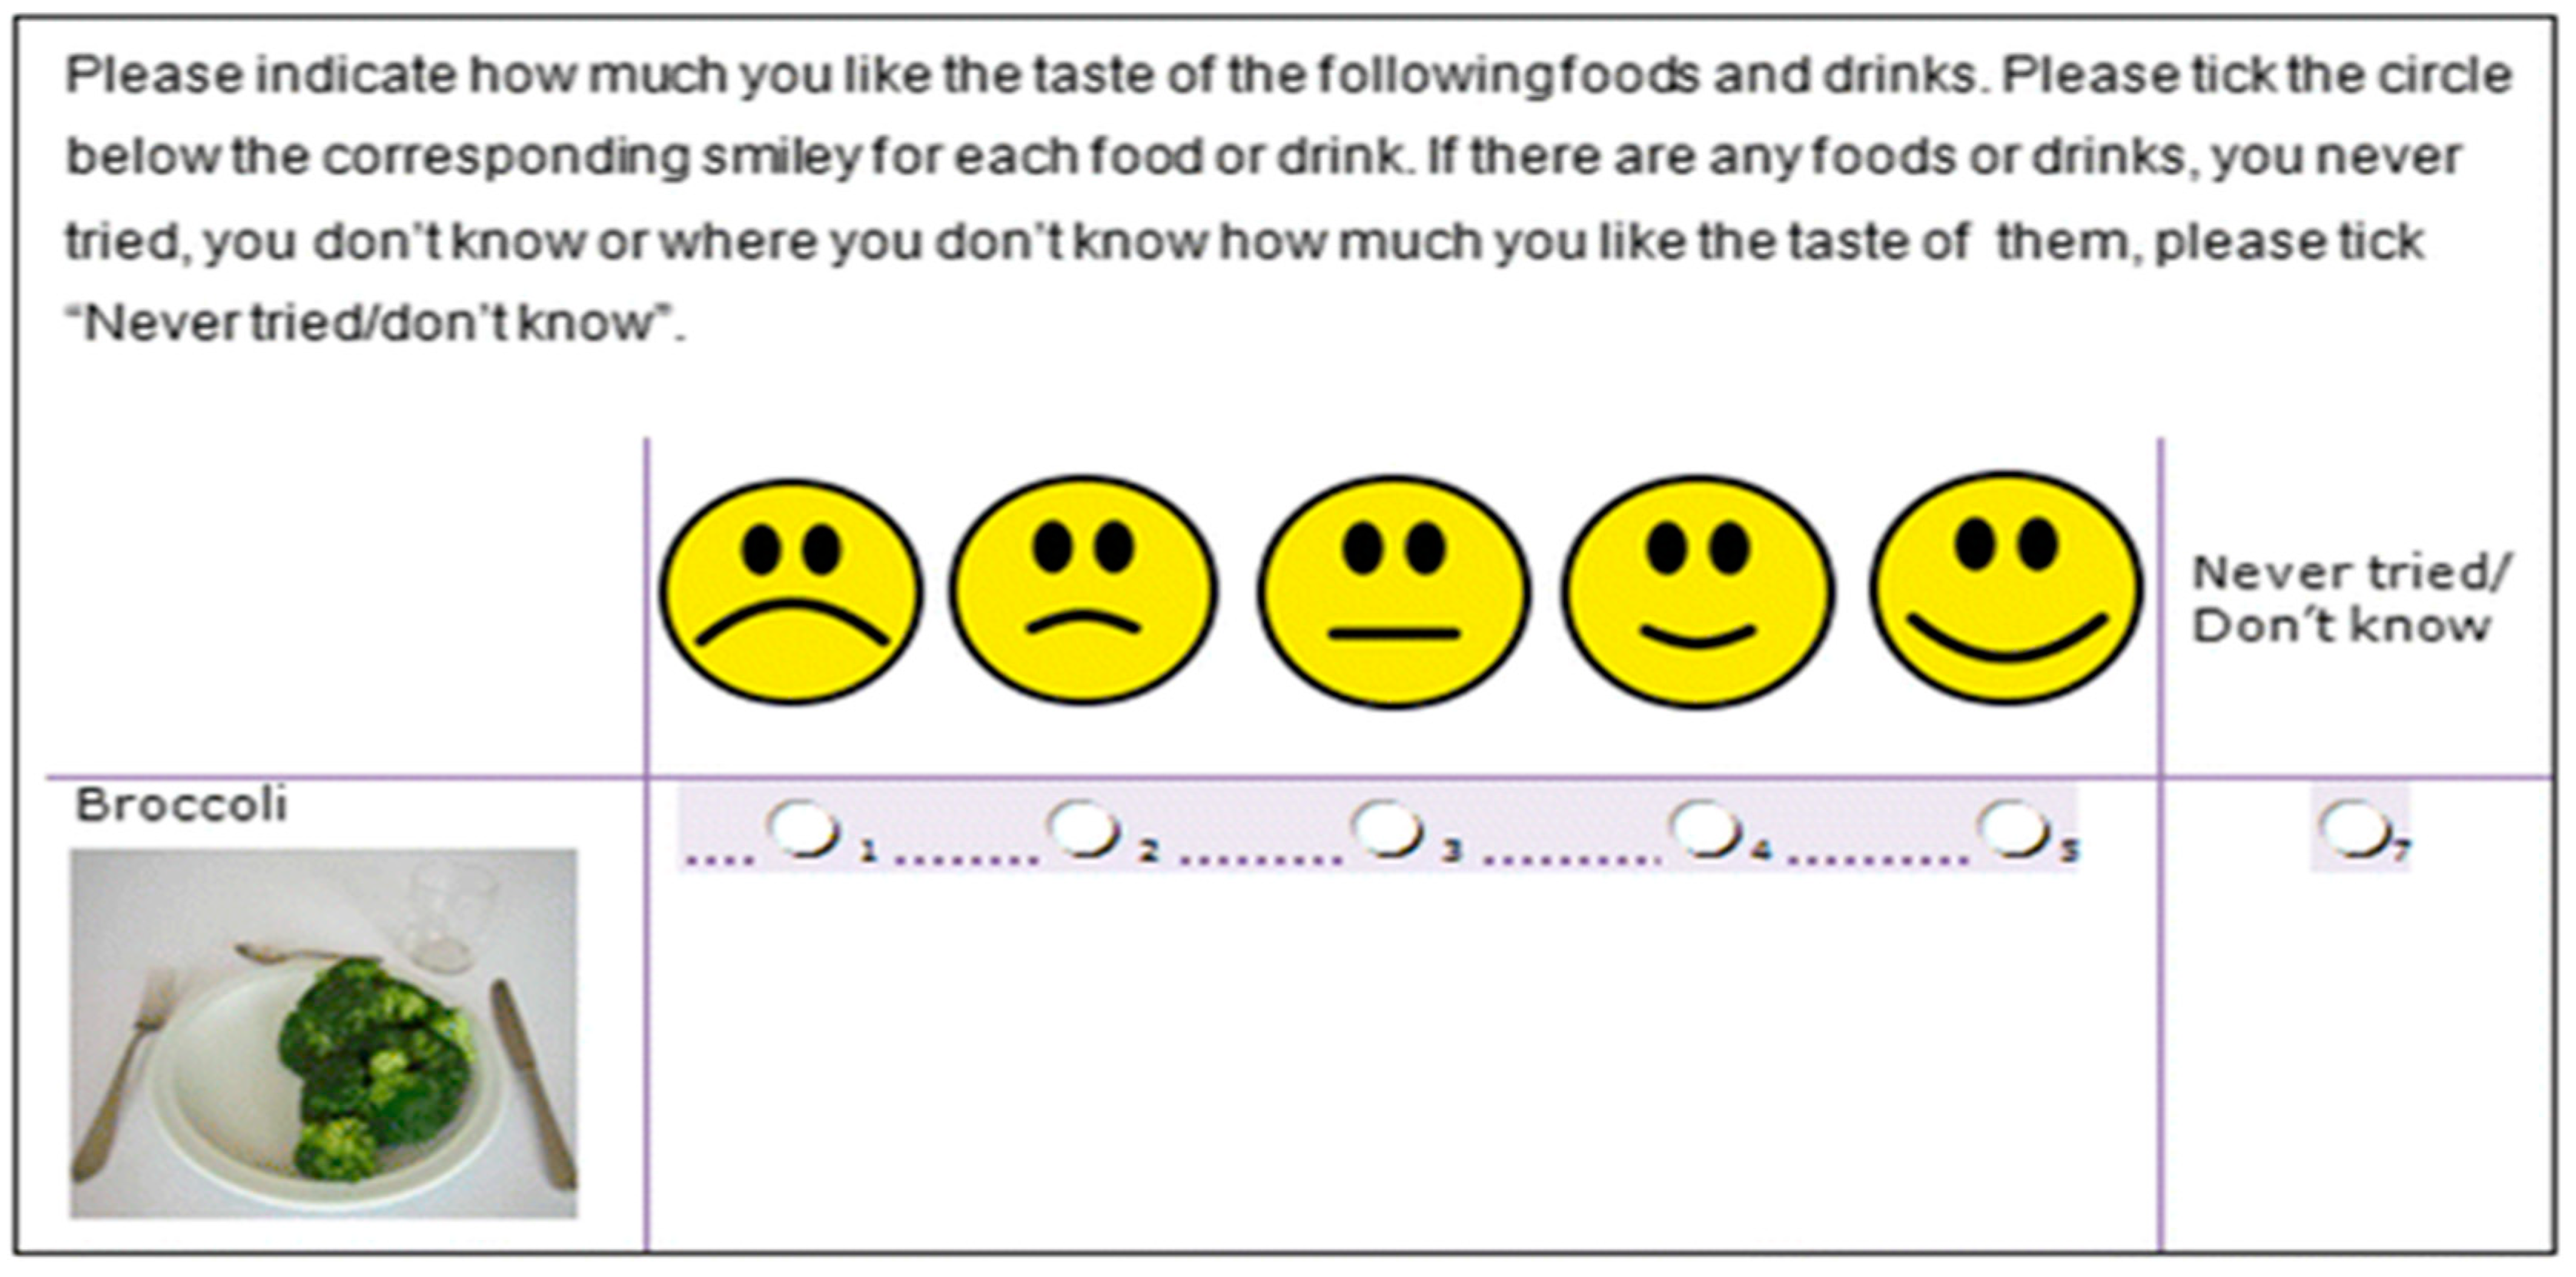
One of the main strengths of our study is the large sample size of 5526 children and adolescents from 7 European countries, which allowed us to have a detailed picture of FP and its potential association with taste preferences in later stages of life. The standardized protocol and the pre-test conducted in a subsample of children showed that the Food and Beverage Preference Questionnaire is a feasible instrument for assessing preferences of food and beverages in children and adolescents.
Furthermore, having information on covariates such as country of residence, age, sex, HDAS, the timing of the first introduction of complementary feeding, parental education level and migration status allowed us to make adjustments and to control for confounding.
Nevertheless, there are important methodological limits concerning our research. The scale of the taste preference was slightly limited as it was calculated based on measuring the food preference with only 5 points. This limited our ability to clearly distinguish between extreme taste preferences. Further, in the BF&FMF category, information on the proportion of actual formula milk and breastmilk feeding was not provided. Thus, we have to acknowledge this as a limitation as it hampers a critical discussion on the potential effects of a mixed strategy of feeding on taste preference.
Since mothers self-reported the details of their infants’ FP (age at starting and termination of infant feeding, the timing of the first introduction of complementary foods) and as adolescents tend to self-report a lower preference for energy-dense (fatty and sweet) foods and beverages [69,70], we cannot entirely exclude social desirability bias. As we used retrospective information on feeding practices, recall bias also potentially affected our data. The reproducibility testing of the early infant parameters showed a weak reproducibility of maternal reports on early infant nutrition, a further potential limitation [71]. Nevertheless, research has shown that mothers recall breastfeeding duration accurately [72,73], while the recall of age at introduction of complementary food is less satisfactory [73]. Moreover, the parents of half of our sample had a high educational status, a fact which might also bias the results with regard to socio-economic status. In addition, we did not have information on other confounding factors such as the role of the maternal diet during breastfeeding and the family diet, factors that have been found to influence taste preference and food intake in children [3,55,74]. Lastly, our research was conducted using only cross-sectional data enriched with retrospective information. We strongly recommend further longitudinal research, e.g., through birth cohorts, that can evaluate the effects of FP during infancy and changes of taste preferences during different stages of life, particularly accounting for the interplay between food choice and socio-economic background.

6. Conclusions

In contrast to our hypotheses, we did not observe an association between infant feeding practices and taste preferences in school children and adolescents, neither regarding the single FPs or as a mixed strategy, nor considering common profiles of FP. Instead, the current diet quality through food choice and educational status of parents consistently showed an association with the current taste preference for sweet, fatty or bitter tastes. Hence, further studies with higher FP variations and using longitudinal data are necessary in order to investigate causal associations between infant feeding practices and taste preferences in later stages of life.

Author Contributions

The authors’ responsibilities were as follows: E.S. wrote the paper; E.S., C.B. and A.H. had primary responsibility for the final content; E.S. and C.B. performed the data analysis. H.J., M.T., T.V., P.R., L.A.M., D.M., G.E., S.M., V.P. and W.A. participated in the coordination of the data collection and the project administration. All authors were responsible for critical revisions and final approval of the manuscript. This manuscript represents original work that has not been published previously and is not currently being considered by another journal. If accepted, it will not be published elsewhere, including electronically in the same form, in English or in any other language, without the written consent of the copyright holder.

Funding

This research was funded by the European Community within the Sixth RTD Framework Programme Contract No. 016181 (FOOD) and Seventh RTD Framework Programme Contract No. 266044.

Acknowledgments

This work was done as part of the IDEFICS (http://www.idefics.eu) and I. Family studies (http://www.ifamilystudy.eu/).We thank the IDEFICS and I.Family children and their parents for participating in this extensive examination. We are grateful for the support from school boards, headmasters, and communities.

Conflicts of Interest

The authors declare that they have no conflict of interest.

References

  1. Drewnowski, A. Taste preferences and food intake. Annu. Rev. Nutr. 1997, 17, 237–253. [Google Scholar] [CrossRef] [PubMed]
  2. IQWiG (Institute for Quality and Efficiency in Health Care). How Does Our Sense of Taste Work? IQWiG (Institute for Quality and Efficiency in Health Care): Cologne, Germany, 2011. [Google Scholar]
  3. Mennella, J.A. Ontogeny of taste preferences: Basic biology and implications for health. Am. J. Clin. Nutr. 2014, 99, 704s–711s. [Google Scholar] [CrossRef]
  4. Ikeda, K. New seasonings. Chem. Senses 2002, 27, 847–849. [Google Scholar] [CrossRef] [PubMed]
  5. Running, C.A.; Craig, B.A.; Mattes, R.D. Oleogustus: The unique taste of fat. Chem. Senses 2015, 40, 507–516. [Google Scholar] [CrossRef]
  6. Besnard, P.; Passilly-Degrace, P.; Khan, N.A. Taste of fat: A sixth taste modality? Physiol. Rev. 2016, 96, 151–176. [Google Scholar] [CrossRef] [PubMed]
  7. Birch, L.L. Development of food preferences. Annu. Rev. Nutr. 1999, 19, 41–62. [Google Scholar] [CrossRef]
  8. Beauchamp, G.K.; Cowart, B.J.; Mennella, J.A.; Marsh, R.R. Infant salt taste: Developmental, methodological, and contextual factors. Dev. Psychobiol. 1994, 27, 353–365. [Google Scholar] [CrossRef]
  9. Beauchamp, G.K.; Cowart, B.J.; Moran, M. Developmental changes in salt acceptability in human infants. Dev. Psychobiol. 1986, 19, 17–25. [Google Scholar] [CrossRef]
  10. Fisher, J.O.; Birch, L.L.; Smiciklas-Wright, H.; Picciano, M.F. Breast-feeding through the first year predicts maternal control in feeding and subsequent toddler energy intakes. J. Am. Diet. Assoc. 2000, 100, 641–646. [Google Scholar] [CrossRef] [Green Version]
  11. Li, R.; Scanlon, K.S.; May, A.; Rose, C.; Birch, L. Bottle-feeding practices during early infancy and eating behaviors at 6 years of age. Pediatrics 2014, 134 (Suppl. 1), S70–S77. [Google Scholar] [CrossRef]
  12. Sullivan, S.A.; Birch, L.L. Infant dietary experience and acceptance of solid foods. Pediatrics 1994, 93, 271–277. [Google Scholar]
  13. Michaelsen, K.F.; Europe, W.R.O.f.; Europe, W.H.O.R.O.f. Feeding and Nutrition of Infants and Young Children: Guidelines for the Who European Region, with Emphasis on the Former Soviet Countries; WHO Regional Office for Europe: Copenhagen, Denmark, 2000. [Google Scholar]
  14. Carling, S.J.; Demment, M.M.; Kjolhede, C.L.; Olson, C.M. Breastfeeding duration and weight gain trajectory in infancy. Pediatrics 2015, 135, 111–119. [Google Scholar] [CrossRef] [PubMed]
  15. Imai, C.M.; Gunnarsdottir, I.; Thorisdottir, B.; Halldorsson, T.I.; Thorsdottir, I. Associations between infant feeding practice prior to six months and body mass index at six years of age. Nutrients 2014, 6, 1608–1617. [Google Scholar] [CrossRef]
  16. De Kroon, M.L.; Renders, C.M.; Buskermolen, M.P.; Van Wouwe, J.P.; van Buuren, S.; Hirasing, R.A. The terneuzen birth cohort. Longer exclusive breastfeeding duration is associated with leaner body mass and a healthier diet in young adulthood. BMC Pediatr. 2011, 11, 33. [Google Scholar] [CrossRef] [PubMed]
  17. Okubo, H.; Miyake, Y.; Sasaki, S.; Tanaka, K.; Hirota, Y. Feeding practices in early life and later intake of fruit and vegetables among Japanese toddlers: The Osaka maternal and child health study. Public Health Nutr. 2016, 19, 650–657. [Google Scholar] [CrossRef] [PubMed]
  18. Scott, J.; Chih, T.; Oddy, W. Food variety at 2 years of age is related to duration of breastfeeding. Nutrients 2012, 4, 1464–1474. [Google Scholar] [CrossRef] [PubMed]
  19. De Lauzon-Guillain, B.; Jones, L.; Oliveira, A.; Moschonis, G.; Betoko, A.; Lopes, C.; Moreira, P.; Manios, Y.; Papadopoulos, N.G.; Emmett, P.; et al. The influence of early feeding practices on fruit and vegetable intake among preschool children in 4 European birth cohorts. Am. J. Clin. Nutr. 2013, 98, 804–812. [Google Scholar] [CrossRef] [Green Version]
  20. Grieger, J.A.; Scott, J.; Cobiac, L. Dietary patterns and breast-feeding in Australian children. Public Health Nutr. 2011, 14, 1939–1947. [Google Scholar] [CrossRef] [Green Version]
  21. Skinner, J.D.; Carruth, B.R.; Bounds, W.; Ziegler, P.; Reidy, K. Do food-related experiences in the first 2 years of life predict dietary variety in school-aged children? J. Nutr. Educ. Behav. 2002, 34, 310–315. [Google Scholar] [CrossRef]
  22. Schwartz, C.; Chabanet, C.; Laval, C.; Issanchou, S.; Nicklaus, S. Breast-feeding duration: Influence on taste acceptance over the first year of life. Br. J. Nutr. 2013, 109, 1154–1161. [Google Scholar] [CrossRef]
  23. Andreas, N.J.; Kampmann, B.; Le-Doare, K.M. Human breast milk: A review on its composition and bioactivity. Early Hum. Dev. 2015, 91, 629–635. [Google Scholar] [CrossRef]
  24. De Cosmi, V.; Scaglioni, S.; Agostoni, C. Early taste experiences and later food choices. Nutrients 2017, 9, 107. [Google Scholar] [CrossRef]
  25. Mennella, J.A.; Beauchamp, G.K. Flavor experiences during formula feeding are related to preferences during childhood. Early Hum. Dev. 2002, 68, 71–82. [Google Scholar] [CrossRef] [Green Version]
  26. Trabulsi, J.C.; Mennella, J.A. Diet, sensitive periods in flavour learning, and growth. Int. Rev. Psychiatry (Abingdon Engl.) 2012, 24, 219–230. [Google Scholar] [CrossRef] [Green Version]
  27. North, K.; Emmett, P. Multivariate analysis of diet among three-year-old children and associations with socio-demographic characteristics. The Avon longitudinal study of pregnancy and childhood (alspac) study team. Eur. J. Clin. Nutr. 2000, 54, 73–80. [Google Scholar] [CrossRef]
  28. Robinson, S.; Marriott, L.; Poole, J.; Crozier, S.; Borland, S.; Lawrence, W.; Law, C.; Godfrey, K.; Cooper, C.; Inskip, H. Dietary patterns in infancy: The importance of maternal and family influences on feeding practice. Br. J. Nutr. 2007, 98, 1029–1037. [Google Scholar] [CrossRef]
  29. Burnier, D.; Dubois, L.; Girard, M. Exclusive breastfeeding duration and later intake of vegetables in preschool children. Eur. J. Clin. Nutr. 2011, 65, 196–202. [Google Scholar] [CrossRef] [PubMed]
  30. Nicklaus, S. The role of food experiences during early childhood in food pleasure learning. Appetite 2016, 104, 3–9. [Google Scholar] [CrossRef]
  31. Galef, B.G.; Henderson, P.W. Mother’s milk: A determinant of the feeding preferences of weaning rat pups. J. Comp. Physiol. Psychol. 1972, 78, 213–219. [Google Scholar] [CrossRef]
  32. Galef, B.G.; Sherry, D.F. Mother’s milk: A medium for transmission of cues reflecting the flavor of mother’s diet. J. Comp. Physiol. Psychol. 1973, 83, 374–378. [Google Scholar] [CrossRef]
  33. Mennella, J.A.; Forestell, C.A.; Morgan, L.K.; Beauchamp, G.K. Early milk feeding influences taste acceptance and liking during infancy. Am. J. Clin. Nutr. 2009, 90, 780s–788s. [Google Scholar] [CrossRef] [PubMed]
  34. Mennella, J.A.; Beauchamp, G.K. Mothers’ milk enhances the acceptance of cereal during weaning. Pediatr. Res. 1997, 41, 188–192. [Google Scholar] [CrossRef]
  35. Galloway, A.T.; Lee, Y.; Birch, L.L. Predictors and consequences of food neophobia and pickiness in young girls. J. Am. Diet. Assoc. 2003, 103, 692–698. [Google Scholar] [CrossRef] [Green Version]
  36. Cooke, L.J.; Wardle, J.; Gibson, E.L.; Sapochnik, M.; Sheiham, A.; Lawson, M. Demographic, familial and trait predictors of fruit and vegetable consumption by pre-school children. Public Health Nutr. 2004, 7, 295–302. [Google Scholar] [CrossRef] [PubMed] [Green Version]
  37. Mennella, J.A.; Daniels, L.M.; Reiter, A.R. Learning to like vegetables during breastfeeding: A randomized clinical trial of lactating mothers and infants. Am. J. Clin. Nutr. 2017, 106, 67–76. [Google Scholar] [CrossRef] [PubMed]
  38. Hausner, H.; Nicklaus, S.; Issanchou, S.; Molgaard, C.; Moller, P. Breastfeeding facilitates acceptance of a novel dietary flavour compound. Clin. Nutr. (Edinb. Scotl.) 2010, 29, 141–148. [Google Scholar] [CrossRef] [PubMed]
  39. Forestell, C.A.; Mennella, J.A. Early determinants of fruit and vegetable acceptance. Pediatrics 2007, 120, 1247–1254. [Google Scholar] [CrossRef] [PubMed]
  40. Ahrens, W.; Bammann, K.; Siani, A.; Buchecker, K.; De Henauw, S.; Iacoviello, L.; Hebestreit, A.; Krogh, V.; Lissner, L.; Mårild, S.; et al. The idefics cohort: Design, characteristics and participation in the baseline survey. Int. J. Obes. 2011, 35 (Suppl. 1), S3–S15. [Google Scholar] [CrossRef]
  41. Hebestreit, A.; Intemann, T.; Siani, A.; De Henauw, S.; Eiben, G.; Kourides, Y.A.; Kovacs, E.; Moreno, L.A.; Veidebaum, T.; Krogh, V.; et al. Dietary patterns of european children and their parents in association with family food environment: Results from the i.Family study. Nutrients 2017, 9, 126. [Google Scholar] [CrossRef]
  42. Ahrens, W.; Siani, A.; Adan, R.; De Henauw, S.; Eiben, G.; Gwozdz, W.; Hebestreit, A.; Hunsberger, M.; Kaprio, J.; Krogh, V.; et al. Cohort profile: The transition from childhood to adolescence in European children-how i.Family extends the idefics cohort. Int. J. Epidemiol. 2017, 46, 1394–1395j. [Google Scholar] [CrossRef]
  43. Bel-Serrat, S.; Mouratidou, T.; Pala, V.; Huybrechts, I.; Börnhorst, C.; Fernández-Alvira, J.; Moreno, L. Relative validity of the children’s eating habits questionnaire–food frequency section among young european children: The idefics study. Public Health Nutr. 2014, 17, 266–276. [Google Scholar] [CrossRef]
  44. Huybrechts, I.; Börnhorst, C.; Pala, V.; Moreno, L.A.; Barba, G.; Lissner, L.; Fraterman, A.; Veidebaum, T.; Hebestreit, A.; Sieri, S.; et al. Evaluation of the children’s eating habits questionnaire used in the idefics study by relating urinary calcium and potassium to milk consumption frequencies among european children. Int. J. Obes. 2011, 35 (Suppl. 1), S69–S78. [Google Scholar] [CrossRef]
  45. Lanfer, A.; Hebestreit, A.; Ahrens, W.; Krogh, V.; Sieri, S.; Lissner, L.; Eiben, G.; Siani, A.; Huybrechts, I.; Loit, H.M.; et al. Reproducibility of food consumption frequencies derived from the children’s eating habits questionnaire used in the idefics study. Int. J. Obes. 2011, 35 (Suppl. 1), S61–S68. [Google Scholar] [CrossRef]
  46. Arvidsson, L.; Eiben, G.; Hunsberger, M.; De Bourdeaudhuij, I.; Molnar, D.; Jilani, H.; Thumann, B.; Veidebaum, T.; Russo, P.; Tornatitis, M.; et al. Bidirectional associations between psychosocial well-being and adherence to healthy dietary guidelines in european children: Prospective findings from the idefics study. BMC Public Health 2017, 17, 926. [Google Scholar] [CrossRef]
  47. Jilani, H.S.; Pohlabeln, H.; Buchecker, K.; Gwozdz, W.; De Henauw, S.; Eiben, G.; Molnar, D.; Moreno, L.A.; Pala, V.; Reisch, L.; et al. Association between parental consumer attitudes with their children’s sensory taste preferences as well as their food choice. PLoS ONE 2018, 13, e0200413. [Google Scholar] [CrossRef]
  48. UNESCO. International Standard Classification of Education 2012. Available online: http://uis.Unesco.Org/sites/default/files/documents/international-standard-classification-of-education-isced-2011-en.Pdf (accessed on 27 October 2016).
  49. Livingstone, M.B.; Robson, P.J. Measurement of dietary intake in children. Proc. Nutr. Soc. 2000, 59, 279–293. [Google Scholar] [CrossRef] [PubMed] [Green Version]
  50. Jilani, H.P.H.; De Henauw, S.; Eiben, G.; Hunsberger, M.; Molnar, D.; Moreno, L.; Pala, V.; Russo, P.; Solea, A.; Veidebaum, T.; et al. Relative validity of a food and beverage preference questionnaire to characterise taste phenotypes in children, adolescents and adult. Nutrient 2019. under revision. [Google Scholar]
  51. Ricketts, C.D. Fat preferences, dietary fat intake and body composition in children. Eur. J. Clin. Nutr. 1997, 51, 778–781. [Google Scholar] [CrossRef] [PubMed] [Green Version]
  52. Ventura, A.K.; Mennella, J.A. Innate and learned preferences for sweet taste during childhood. Curr. Opin. Clin. Nutr. Metab. Care 2011, 14, 379–384. [Google Scholar] [CrossRef]
  53. Paes, V.M.; Ong, K.K.; Lakshman, R. Factors influencing obesogenic dietary intake in young children (0–6 years): Systematic review of qualitative evidence. BMJ Open 2015, 5, e007396. [Google Scholar] [CrossRef] [PubMed]
  54. Johnson, L.; Mander, A.P.; Jones, L.R.; Emmett, P.M.; Jebb, S.A. Energy-dense, low-fiber, high-fat dietary pattern is associated with increased fatness in childhood. Am. J. Clin. Nutr. 2008, 87, 846–854. [Google Scholar] [CrossRef] [Green Version]
  55. Jilani, H.S.; Intemann, T.; Bogl, L.H.; Eiben, G.; Molnar, D.; Moreno, L.A.; Pala, V.; Russo, P.; Siani, A.; Solea, A.; et al. Familial aggregation and socio-demographic correlates of taste preferences in european children. BMC Nutr. 2017, 3, 87. [Google Scholar] [CrossRef]
  56. Parent, A.-S.; Teilmann, G.; Juul, A.; Skakkebaek, N.E.; Toppari, J.; Bourguignon, J.-P. The timing of normal puberty and the age limits of sexual precocity: Variations around the world, secular trends, and changes after migration. Endocr. Rev. 2003, 24, 668–693. [Google Scholar] [CrossRef] [PubMed]
  57. Lanza, S.T.; Flaherty, B.P.; Collins, L.M. Latent class and latent transition analysis. In Handbook of Psychology; Weiner, I.B., Ed.; John Wiley & Sons, Inc.: New York, NY, USA, 2003. [Google Scholar]
  58. Lanza, S.T.; Dziak, J.J.; Huang, L.; Xu, S.; Collins, L.M. PROC LCA & PROC LTA Users’ Guide (Version 1.3.2); The Methodology Center; Penn State: University Park, PA, USA, 2011. [Google Scholar]
  59. Desor, J.A.; Beauchamp, G.K. Longitudinal changes in sweet preferences in humans. Physiol. Behav. 1987, 39, 639–641. [Google Scholar] [CrossRef]
  60. Johnson, S.L.; McPhee, L.; Birch, L.L. Conditioned preferences: Young children prefer flavors associated with high dietary fat. Physiol. Behav. 1991, 50, 1245–1251. [Google Scholar] [CrossRef]
  61. Kern, D.L.; McPhee, L.; Fisher, J.; Johnson, S.; Birch, L.L. The postingestive consequences of fat condition preferences for flavors associated with high dietary fat. Physiol. Behav. 1993, 54, 71–76. [Google Scholar] [CrossRef]
  62. Fernandez-Alvira, J.M. Parental education and frequency of food consumption in European children: The idefics study. Public Health Nutr. 2013, 16, 487–498. [Google Scholar] [CrossRef] [PubMed]
  63. Van Ansem, W.J.; Schrijvers, C.T.; Rodenburg, G.; van de Mheen, D. Maternal educational level and children’s healthy eating behaviour: Role of the home food environment (cross-sectional results from the inpact study). Int. J. Behav. Nutr. Phys. Act. 2014, 11, 113. [Google Scholar] [CrossRef] [PubMed]
  64. Cribb, V.L.; Jones, L.R.; Rogers, I.S.; Ness, A.R.; Emmett, P.M. Is maternal education level associated with diet in 10-year-old children? Public Health Nutr. 2011, 14, 2037–2048. [Google Scholar] [CrossRef] [PubMed] [Green Version]
  65. Sausenthaler, S.; Standl, M.; Buyken, A.; Rzehak, P.; Koletzko, S.; Bauer, C.P.; Schaaf, B.; von Berg, A.; Berdel, D.; Borte, M.; et al. Regional and socio-economic differences in food, nutrient and supplement intake in school-age children in germany: Results from the giniplus and the lisaplus studies. Public Health Nutr. 2011, 14, 1724–1735. [Google Scholar] [CrossRef]
  66. Sausenthaler, S.; Kompauer, I.; Mielck, A.; Borte, M.; Herbarth, O.; Schaaf, B.; von Berg, A.; Heinrich, J. Impact of parental education and income inequality on children’s food intake. Public Health Nutr. 2007, 10, 24–33. [Google Scholar] [CrossRef]
  67. Lehto, E.; Ray, C.; Te Velde, S.; Petrova, S.; Duleva, V.; Krawinkel, M.; Behrendt, I.; Papadaki, A.; Kristjansdottir, A.; Thorsdottir, I.; et al. Mediation of parental educational level on fruit and vegetable intake among schoolchildren in ten european countries. Public Health Nutr. 2015, 18, 89–99. [Google Scholar] [CrossRef]
  68. Mallan, K.M.; Fildes, A.; Magarey, A.M.; Daniels, L.A. The relationship between number of fruits, vegetables, and noncore foods tried at age 14 months and food preferences, dietary intake patterns, fussy eating behavior, and weight status at age 3.7 years. J. Acad. Nutr. Diet. 2016, 116, 630–637. [Google Scholar] [CrossRef]
  69. Perl, M.A.; Mandic, M.L.; Primorac, L.; Klapec, T.; Perl, A. Adolescent acceptance of different foods by obesity status and by sex. Physiol. Behav. 1998, 65, 241–245. [Google Scholar] [CrossRef]
  70. Tilgner, L.; Wertheim, E.H.; Paxton, S.J. Effect of social desirability on adolescent girls’ responses to an eating disorders prevention program. Int. J. Eat. Disord. 2004, 35, 211–216. [Google Scholar] [CrossRef]
  71. Herrmann, D.; Suling, M.; Reisch, L.; Siani, A.; De Bourdeaudhuij, I.; Maes, L.; Santaliestra-Pasias, A.M.; Veidebaum, T.; Molnar, D.; Pala, V.; et al. Repeatability of maternal report on prenatal, perinatal and early postnatal factors: Findings from the idefics parental questionnaire. Int. J. Obes. (Lond.) 2011, 35 (Suppl. 1), S52–S60. [Google Scholar] [CrossRef]
  72. Natland, S.T.; Andersen, L.F.; Nilsen, T.I.L.; Forsmo, S.; Jacobsen, G.W. Maternal recall of breastfeeding duration twenty years after delivery. BMC Med. Res. Methodol. 2012, 12, 179. [Google Scholar] [CrossRef] [PubMed]
  73. Li, R.; Scanlon, K.S.; Serdula, M.K. The validity and reliability of maternal recall of breastfeeding practice. Nutr. Rev. 2005, 63, 103–110. [Google Scholar] [CrossRef] [PubMed]
  74. Birch, L.L. The relationship between children’s food preferences and those of their parents. J. Nutr. Educ. 1980, 12, 14–18. [Google Scholar] [CrossRef]
Figure 1. A screenshot of a food item from the Food and Beverage Preference Questionnaire [55].
Nutrients 11 01040 g001
Table 1. The duration of feeding practices during infancy.
Types of Feeding Practices (N = 5526)
Duration in Months
Mean/SDMedianMin/Max
Exclusive Breastfeeding (EBF)3.3/2.74.00.0/36.0
Combined Breastfeeding (BF&FMF) 7.2/6.36.00.0/36.0
Exclusive Formula Milk Feeding (EFMF) 4.1/8.100.0/48.0
Table 2. The study characteristics of participants according to the duration of combined breastfeeding (BF&FMF).
Combined Breastfeeding (BF&FMF)All
VariablesNoneUp to 6 MonthsMore Than 6 Months
N%N%N%N%
All798100.02318100.02410100.05526100.0
Age Groups
<12 years 40450.6118451.1135956.4294753.3
≥12 years39449.4113448.9105143.6257946.7
Sex
Boys 41051.4114749.5120349.9276049.9
Girls38848.6117150.5120750.1276650.1
SES
Low –Medium 51164.0130656.392138.2273849.5
High 28736.0101243.7148961.8278850.5
Migrant Status
Both Parents 698.61074.61225.12985.4
One parent 9411.827611.91707.15409.8
Neitherparent63579.6193583.5211887.9468884.8
Complementary Food Introduction
Missing 769.51536.6863.63155.7
≤6 months 59274.2189281.6183376.1431778.1
>6 months13016.327311.849120.489416.2
Sweet Taste Preference
Low 35043.995041.091838.1221840.1
High 44856.1136859.0148561.6330159.7
Missing 1000070.370.1
Fatty Taste Preference
Low 31739.785536.994839.3212038.4
High 48160.3146363.1146060.6340461.6
Missing 1000020.120.0
Bitter Taste Preference
Low 54668.4158368.3162467.4375367.9
High 22327.966628.770729.3159628.9
Missing 1293.6693.0793.31773.2
Country
Italy17021.365228.12249.3104618.9
Estonia577.126511.455423.087615.9
Cyprus22828.650821.91697.090516.4
Sweden415.12089.043318.068212.3
Germany18122.731013.431513.180614.6
Hungary607.524210.450921.181114.7
Spain617.61335.72068.54007.2
¹ Missing values were generated when calculating the taste preference scores for each taste group. N is the number of participants in the BF&FMF categories.
Table 3. The association between exclusive breastfeeding (EBF) duration and taste preferences in 6–16 year old children and adolescents who participated in the IDEFICS/I.Family studies.
Sweet Taste (N = 5191)Fatty Taste (N = 5196)Bitter Taste (N = 5029)
OR95% CIOR95% CIOR95% CI
EBF
(ref: None)1.00 1.00 1.00
≤4 months 1.120.971.291.040.901.210.980.841.15
>4 months1.100.951.291.020.871.190.950.801.12
Healthy Diet Adherence Score (HDAS) $0.880.820.960.880.810.951.311.201.43
Complementary Food Introduction
(ref. ≤6 months)
>6 months0.910.771.070.810.680.951.020.861.22
Missing0.880.671.140.820.621.071.020.751.38
SES
(ref. high)
Low- medium 1.110.981.261.141.0091.300.880.771.017
$ OR is calculated for difference in one unit from the mean. (Logistic regression models were adjusted also for age, sex, migrant background and country—OR not reported).
Table 4. The association between combined breastfeeding (BF&FMF) duration and taste preference in 6–16 year old children and adolescents who participated in the IDEFICS/I.Family studies.
Sweet Taste (N = 5191)Fatty Taste (N = 5196)Bitter Taste (N = 5029)
OR95% CIOR95% CIOR95% CI
BF&FMF
(ref. None)1.00 1.00 1.00
≤6 months 1.110.931.321.150.961.370.980.811.19
>6 months 1.100.921.321.030.851.241.090.891.33
HDAS $0.880.810.960.880.810.951.311.201.43
Complementary Food Introduction
(ref. ≤6 months)
>6 months 0.910.781.070.820.700.970.990.831.18
Missing 0.880.671.150.820.631.081.010.741.37
SES
(ref. High)
Low- medium 1.110.981.261.141.0041.290.900.781.03
$ OR is calculated for difference in one unit from the mean. (Logistic regression models were adjusted also for age, sex, migration status and country—OR not reported.
Table 5. The association between exclusive formula milk feeding (EFMF) duration and taste preference in 6–16 years old children and adolescents who participated in the IDEFICS/I.Family studies.
Sweet Taste (N = 5191)Fatty Taste (N = 5196)Bitter Taste (N = 5029)
OR95% CIOR95% CIOR95% CI
EFMF
(ref. None)
≤6 months 1.0010.841.181.090.921.290.850.711.02
>6 months 1.0090.851.181.0080.851.180.950.801.13
HDAS $0.880.820.960.880.810.961.311.201.43
Complementary Food Introduction
(ref. ≤6 months)
>6 months 0.910.781.070.810.690.951.0040.841.19
Missing 0.870.671.140.820.621.071.010.751.37
SES
(ref. High)
Low- medium 1.100.971.251.141.0041.290.900.781.03
$ OR is calculated for difference in one unit from the mean. (Logistic regression models were adjusted also for age, sex, migration status and country—OR not reported).
Table 6. The latent class profiles and highest conditional probabilities (ρ-estimate) of categories within each profile.
Latent Profiles of Feeding Practices Frequency%
1. Long period of EBF and mixed breastfeeding, no exclusive use of formula milk, late introduction of complementary foods 133424.14
VariableCategoryρ-estimate
Mixed feedingmore than 6 months0.869
Exclusive breastfeedingmore than 4 months0.853
Exclusive formula milk feeding None0.952
Introduction of vegetablesafter month 60.674
Introduction of fruitafter month 60.562
Introduction of meatafter month 60.981
Introduction of cow milkafter month 60.988
2. Predominantly formula milk feeding (mixed and exclusive) and late introduction of complementary foods 77414.01
VariableCategoryρ-estimate
Mixed feeding0–6 months0.702
Exclusive breastfeeding0–4 months0.464
Exclusive formula milk feeding more than 6 months0.619
Introduction of vegetablesafter month 60.832
Introduction of fruitafter month 60.657
Introduction of meatafter month 60.997
Introduction of cow milkafter month 60.973
3. Short duration of EBF and mixed BF without exclusive formula milk use, early introduction of main complementary foods 270048.86
VariableCategoryρ-estimate
Mixed feeding0–6 months0.541
Exclusive breastfeeding0–4 months0.627
Exclusive formula milk feeding None0.764
Introduction of vegetablesbefore month 60.964
Introduction of fruitbefore month 60.988
Introduction of meatbefore month 60.681
Introduction of cow milkafter month 60.824
4. No breastfeeding, but exclusive formula milk use, early introduction of main complementary foods. 71812.99
VariableCategoryρ-estimate
Mixed feedingNone0.841
Exclusive breastfeedingNone0.994
Exclusive formula milk feeding more than 6 months0.583
Introduction of vegetablesbefore month 60.911
Introduction of fruitbefore month 60.983
Introduction of meatbefore month 60.645
Introduction of cow milkafter month 60.806
Table 7. The results of logistic regression models investigating the association between latent profiles of feeding practices (FP) and taste preferences of 6–16 year old children and adolescents who participated in the IDEFICS/I.Family studies.
Sweet Taste (N = 5191)Fatty Taste (N = 5196)Bitter Taste (N = 5029)
VariablesOR95% CIOR95% CIOR95%CI
Profile of FP
(ref: profile 4)1.00 1.00 1.00
Profile 1 0.990.811.200.970.791.191.090.881.36
Profile 2 0.900.721.131.130.901.431.050.821.35
Profile 3 1.090.911.301.110.921.331.060.871.29
HDAS $0.880.820.960.880.810.951.311.201.43
SES (ref: high)
Low/medium1.110.971.251.141.0041.290.890.781.02
$ OR is calculated for difference in one unit from the mean. (Logistic regression models were adjusted also for age, sex, migration status and country—OR not reported).

