Beverage Consumption among Adults in the Balearic Islands: Association with Total Water and Energy Intake
by
 , , and
Asli Emine Özen
1 ,
,
Maria Del Mar Bibiloni
2,
Cristina Bouzas
2,
Antoni Pons
2 and
Josep A. Tur
2,* 1
Department of Gastronomy and Culinary Arts, Reha Midilli Foça Faculty of Tourism, Dokuz Eylül University, Foça-Izmir 35680, Turkey
2
Research Group on Community Nutrition and Oxidative Stress, University of the Balearic Islands & CIBEROBN, 07122 Palma de Mallorca, Spain
*
Author to whom correspondence should be addressed.
Nutrients 2018, 10(9), 1149; https://doi.org/10.3390/nu10091149
Submission received: 7 July 2018
/
Revised: 18 August 2018
/
Accepted: 21 August 2018
/
Published: 23 August 2018
(This article belongs to the Special Issue The Impact of Beverages on Ingestive Behavior)
Abstract
:The paper seeks to describe beverage consumption and examine the association between beverage consumption and total water intake and total energy intake of the adult population in the Balearic Islands. Beverage consumption, total water intake, and total energy intake were obtained by using two 24-h diet recalls from a cross-sectional nutritional survey carried out in the Balearic Islands (n = 1386). The contribution of beverages to total water intake and total energy intake were also assessed. Beverages accounted for 65–71% of total water intake and 29–35% of it provided by drinking water. Food moisture contributed 31–37% of total water intake. The mean daily total water intake from all sources was around 2.2 L for men and 1.9 L for women and slightly lower than the proposed adequate intake (AI) recommendations of the European Food Safety Authority (EFSA). The mean total energy intake was 2222 kcal/day and beverages contributed 10.3% of total energy intake for men and 9.5% for women. Energy intake from beverages varied with age. In both sexes, milk was the main beverage contributed to total energy intake. The energy contribution of caloric soft drinks was 1.8% for men and 1.2% for women and energy intake from these beverages was significantly higher among younger adults. Water was the main beverage in the diet, followed by milk and hot beverages. Beverages were mainly consumed in the main meal times (breakfast, lunch, and dinner) in both sexes. The main findings of this study indicate that consumption of sugar-sweetened beverages (caloric soft drinks and commercial fruit juice) is higher among young adults, consumption of alcoholic beverages is higher among males aged 26 and older, and TWI (total water intake) is lower than the EFSA recommendations. These findings may be used to develop effective, healthy eating and drinking policies and campaigns.
1. Introduction
Water intake is very essential for human life because water accounts for 50–60% of adult body mass and we need water for the enzymatic and chemical reactions and excretion of metabolic waste from our body [1]. While in our early ancestors’ diet consisted of only drinking water and breast milk [2,3], our beverage choices are vast.
The European Food Safety Authority (EFSA) estimates that 70–80% of total water intake (TWI) comes from drinking water and beverages, while the remaining 20–30% is obtained from food moisture [4]. However, estimates of the Spanish population fall slightly outside these estimations [5]. The contribution of foods and beverages to the TWI for the Spanish population are 32% and 68% [5], respectively. Still, drinking water is the main source of water in the diet of all age groups, and consumption of other beverages varies according to age [6,7,8,9,10,11,12].
Many beverages contribute to total energy intake (TEI). The average energy contribution of beverages to TEI among European countries varies from 7 to 16% (e.g., 7% in Italy [13], 8% in France [14], 12% in Spain [5], and 16% in the UK [15]). Alcoholic beverages are the main contributors to energy intake, followed by milk [14,15].
Recent studies of TWI and beverage consumption and the association between beverage consumption and energy intake among Spaniards have been published [5,12]. A recent study suggested that the population of the Balearic Islands is undergoing a nutrition transition [16]. We, therefore, investigated beverage consumption and TWI, with special attention to the types of beverages consumed and their calorie contribution to total energy intake in a nationally representative sample from the Balearic Islands.
2. Methods
2.1. Study Population
Subjects of this study were participants in the OBEX (Obesity and oxidative stress) project which is a population based cross-sectional nutritional survey. The data collection took place between 2009 and 2010. The sample population was derived from residents aged 16–65 years registered in the official population census of the Balearic Islands. The sampling technique included stratification according to municipality size, age, and sex of inhabitants, and the samples were randomization into subgroups, with the Balearic Islands municipalities being the primary sampling units, and individuals within these municipalities comprising the final sample units. The theoretical sample size was set at 1500 individuals and the one specific relative precision of 5% (type I error = 0.05; type II error = 0.10), and the final sample was 1386 (92.4% participation). Pregnant women were excluded from this study. This study was conducted according to the guidelines laid down in the Declaration of Helsinki, and all procedures involving human subjects were approved by the Balearic Islands’ Ethics Committee (Palma de Mallorca, Spain) No. IB/1128/09/PI. Written informed consent was obtained from all subjects and, when they were under 18 years, also from their parents or legal tutors.
2.2. General Questionnaire and Anthropometrics
A questionnaire collected the following information: age, marital status, educational level (grouped according to years and type of education: low, <6 years at school; medium, 6–12 years of education; high, >12 years of education), and socioeconomic level (classified as low, medium, and high according to the methodology described by the Spanish Society of Epidemiology) [17].
Information about smoking habits and alcohol consumption was collected and grouped as non-smoker, ex-smoker, smoker, and non-drinker, occasional drinker, daily drinker (1–2 drinks/day), and heavy drinker (more than three drinks/day).
Anthropometric [18] and blood pressure (BP) [19] measurements have been described in full elsewhere. BMI was computed as weight/height2 (kg/m2) and study participants were categorized as healthy weight (BMI < 24.9 kg/m2), overweight (25 kg/m2 < BMI < 29.9 kg/m2), and obese (BMI ≥ 30 kg/m2) [20]. Hypertension was defined as either having a systolic blood pressure (SBP) of ≥140 mmHg or diastolic blood pressure (DBP) of ≥90 mmHg, currently under antihypertensive treatment, or previously diagnosed for hypertension.
2.3. Physical Activity Assessment
Physical activity (PA) was evaluated according to guidelines for data processing and analysis of the International Physical Activity Questionnaire [21] in the short form. The PA levels were estimated by using metabolic equivalents of task (MET). MET scores for different level activities were established based on the Compendium of Physical Activities [22]. On the basis of their total weekly MET scores, the subjects were divided into three groups: “low”, “moderate”, and “high” levels of PA.
2.4. Assessment of Beverage Consumption and Energy Intake
Beverage, food, and energy intakes were assessed by averaging two non-consecutive 24 h dietary recalls. To prevent seasonal variations, 24 h dietary recalls were administered in the warm season (May–September) and in the cold season (November–March). Furthermore, to account for day-to-day intake variability, the two 24-h recalls were administered from Monday to Sunday. Participants reported all foods and beverages consumed throughout the day: breakfast, second breakfast, lunch, afternoon snack, dinner, and outside of meal times. A manual of sets of photographs [23] was used for the estimation of portion size. Well-trained dieticians administered the recalls and verified and quantified the information obtained from the 24 h recalls.
Beverages were categorized into 11 groups; water (tap water and bottled water), full-fat milk, low/non-fat milk (semi-skimmed and skimmed milk), 100% fruit juice (all kinds of natural fruit juice), commercial fruit juice (all kinds of fruit juice sweetened with sugar), caloric soft drinks (all kinds of carbonated soft drinks, sugar added iced tea and energy beverages), diet soda (low calorie carbonated soft drinks), coffee, tea, alcoholic beverages (wine, beer, vodka, whisky, liquor), and other beverages (beer without alcohol, diet milkshake, soy milk, rice milk, oat milk, fermented milk drink with sugar, fermented milk drink, kefir, horchata, chocolate milkshake, isotonic drinks). Total milk included full-fat milk and low/non-fat milk, hot beverages included coffee and tea, and total fruit juice included all kinds of fruit juice were also calculated. TWI and TEI were calculated using a computer program (ALIMENTA®, NUCOX, Palma, Spain) based on Spanish [24,25] and European Food Composition Tables [26], and complemented with food composition data available for the Balearic food items [27]. Total water intake was calculated as drinking water plus water from all other beverages and moisture from all foods. Identification of underreporting participants was based on the Goldberg cut-off [28]. Adults whose reported energy intake (EI)/basal metabolic rate (BMR) was <0.9585 were classified as under-reporters (n = 328), and they were excluded from the current study.
2.5. Statistics
Statistical analyses were performed using SPSS for Windows, version 24.0 (SPSS Inc., Chicago, IL, USA). For descriptive purposes, absolute numbers and percentages of participants were calculated for demographic and lifestyle characteristics and differences tested by χ2. Average daily beverage consumption, TWI (g/day) and TEI (kcal/day) were calculated and differences across means were evaluated by using analysis of variance. Differences in mean daily water, beverage and energy intake across age groups within sex were assessed by using student t-tests with Bonferroni correction for multiple testing. Partial correlations between the consumption of different types of beverages and TWI, water intake from beverages and foods, TEI, energy intake from beverages and foods were adjusted for gender, age, and BMI. For all statistical tests, p < 0.05 was taken as the significant level.
3. Results
3.1. Description of the Survey Sample
Survey respondents ranged from 16 to 65 years (mean 32 years) (Table 1). Overweight prevalence was higher among men (41%) than women (32%). Men were likely to be single heavy drinker and have hypertension; women reported engaging in less physical activity.
3.2. Contribution of Beverages and Food Moisture to Daily Diet
Daily mean beverage consumption was stratified by gender and age as presented in Table 2. Consumption of full-fat milk, fruit juice, and caloric soft drinks tended to decrease with age in both sexes. Men consumed two times more caloric soft drinks (p < 0.001) and alcoholic beverage (p < 0.001) than women, while tea (p < 0.001) consumption was much higher in women.
The contribution of foods and beverages to daily TWI (g/day) and TEI (kcal/day), by gender and age group, are presented in Table 3. In total, beverages accounted for 71.1% and 65.4% of TWI for men and women, respectively, while the contribution of all foods to TWI was 28.9% for men and 34.6% for women. The mean daily TWI from all sources was around 2.2 L for men and 1.9 L for women. Energy intake from beverages was higher in men than in women and slightly increased with age. The mean TEI of the study population was 2222 (±19) kcal/day, and beverages contributed 9.5% of TEI for females and 10.3% for males.
3.3. Contribution of Beverage Type to Diet
The contribution of beverages to daily water and energy intake by gender and age is presented in Table 4. Water was the most consumed beverage for both sexes and drinking water alone accounted for 31.7% of the TWI for men and 29.2% of the TWI for women. Among other beverages, hot beverages (mainly coffee) and milk were the main sources of TWI for both sexes.
In both males and females, milk was the principal beverage contributor of TEI. Among younger adults, the contribution of commercial fruit juice and caloric soft drinks to TEI was higher, while the energy contribution of alcoholic beverages was higher in middle-aged men.
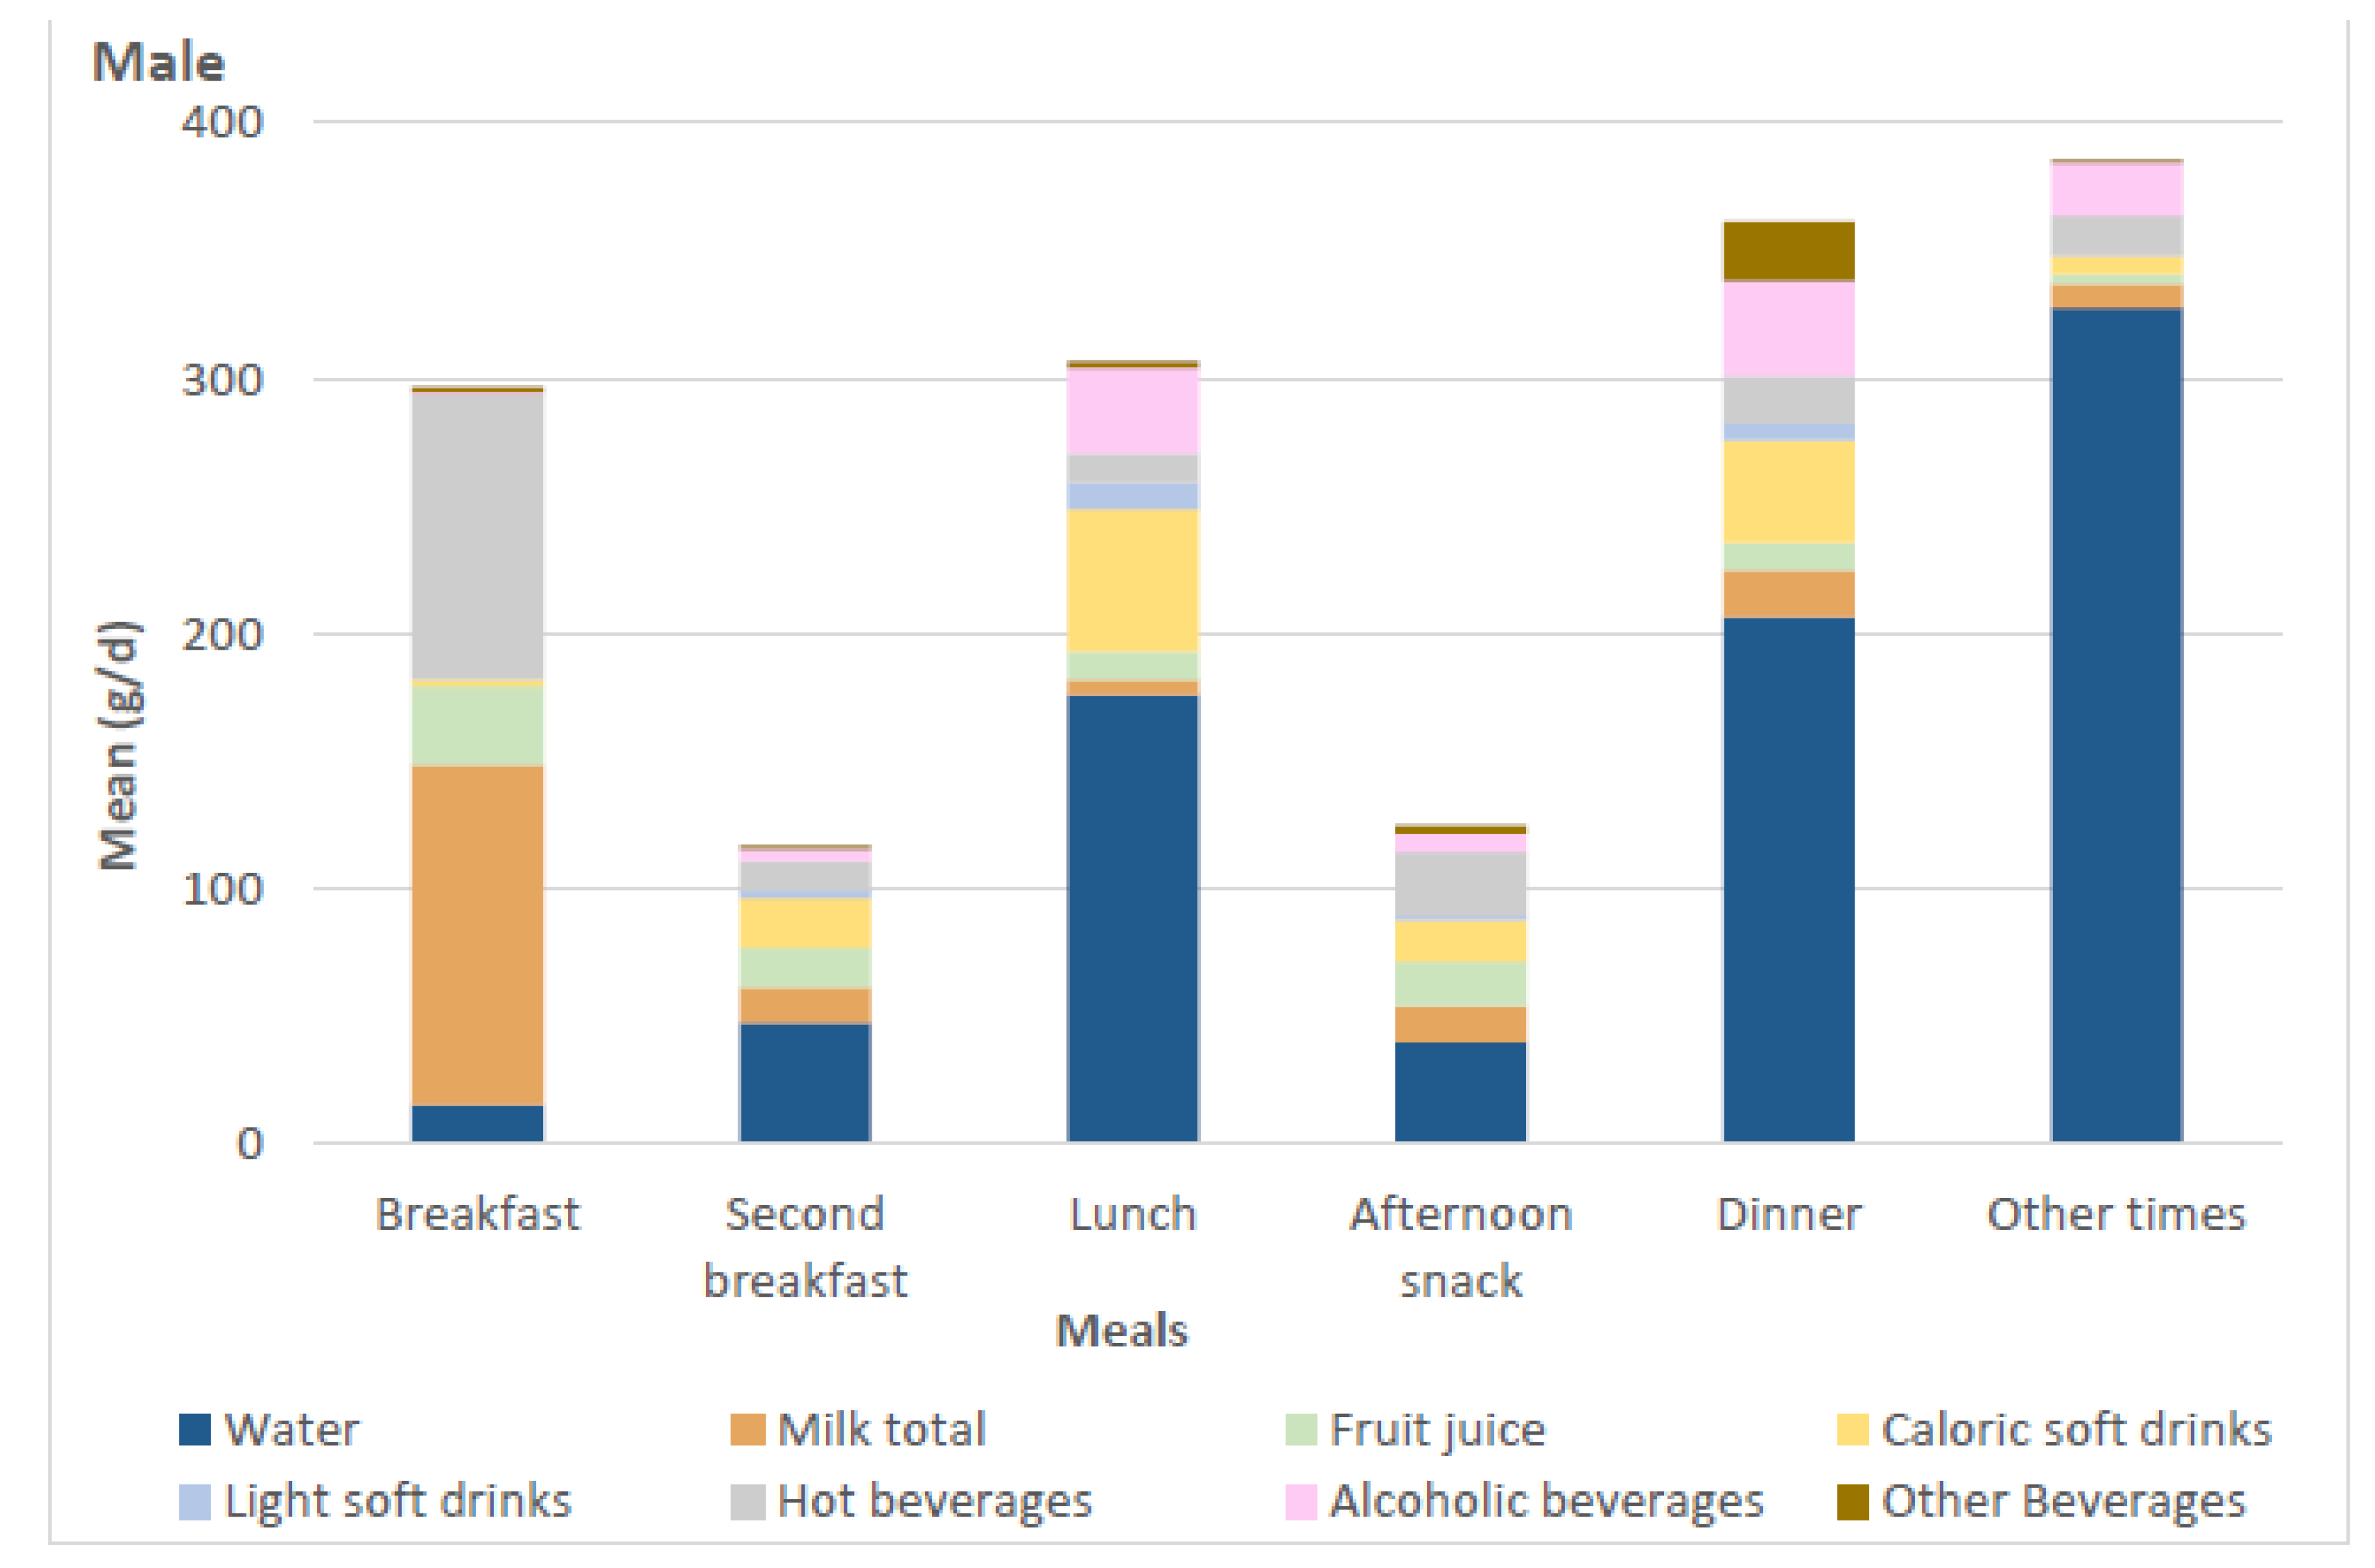
3.4. Distribution of Beverages during Day
Figure 1 shows the mean daily consumption of beverages during each meal time for males and females. Milk, fruit juices, and hot beverages (coffee and tea) were mainly consumed for breakfast in both sexes. Alcoholic beverages were mainly consumed during lunch and dinner. Other beverages were more evenly spread throughout the day, with slightly higher consumption during lunch and dinner. The main part of the water consumption was concentrated in the afternoon, and the highest water intake was observed outside of the meal times.
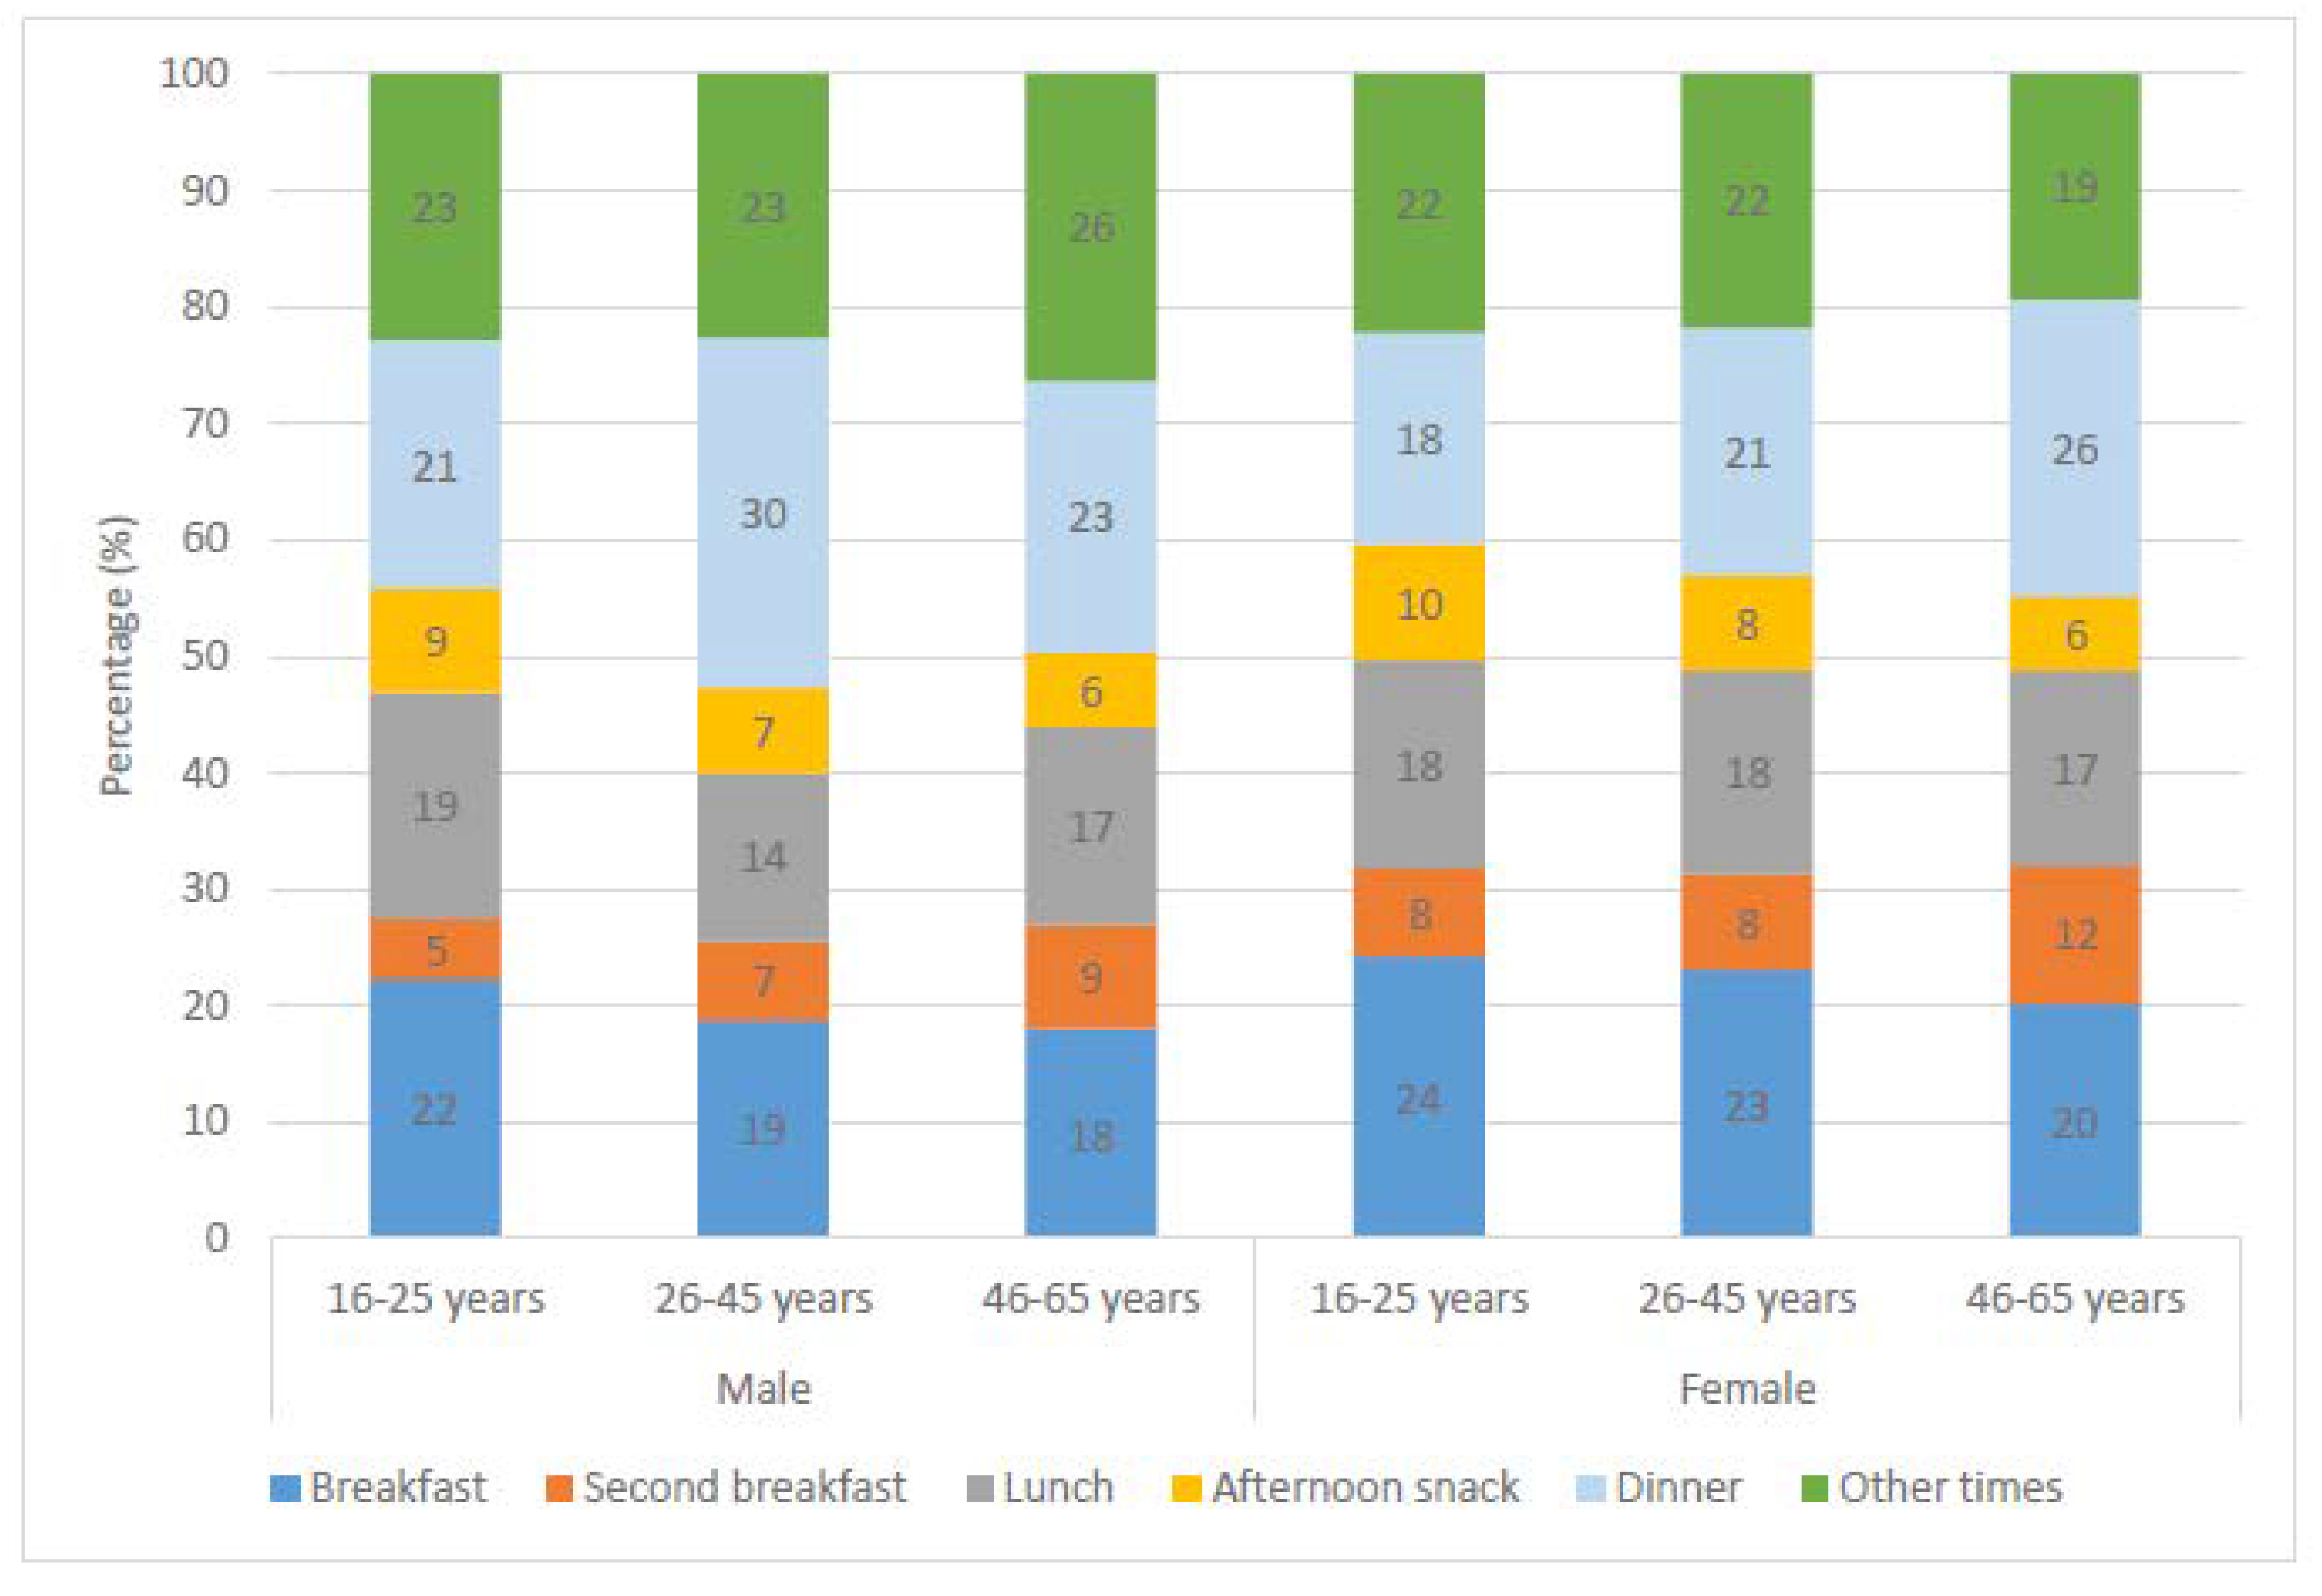
Percentage of total beverage consumption during each meal time is presented in Figure 2. Beverage consumption during dinner was significantly higher in middle-aged men than others, while a higher proportion of older women preferred to consume their beverages during dinner.
In Table 5, we assessed the correlation between the consumption of different types of beverages and TWI, water from beverages and foods, TEI, energy intake from beverages and foods. Water consumption was highly correlated with the total beverage consumption, water intake from beverages and TWI. Consumption of caloric soft drinks was associated with energy intake from foods and beverages and also TEI. In other cases, correlation coefficients were generally unremarkable.
4. Discussion
The present study investigated the beverage consumption and TWI and TEI from beverages among Balearic adults. The results show that mean TWI was 2.2 L for men and 1.9 L for women in the study population and slightly lower than the proposed AIs of water, which are 2.5 L for males and 2 L for females by the EFSA [4]. Water recommendations of EFSA are applied only to conditions of moderate environmental temperature and moderate physical activity levels [4]. TWI below the recommended values might be related with the low physical activity level of the study population. We observed that more than half of the study population had a low physical activity level.
According to the estimation of EFSA, beverages contribute 70–80% of TWI and foods contribute 20–30% of TWI [4]. While men met these estimations, among women water intake from foods was higher, 35%. This difference can be explained with the high vegetable consumption of women as these contain a high amount of food moisture. We observe that women consumed more vegetables (172 g/day) than men did (142 g/day) (data not shown), and this finding is in line with a previous study [29].
In this study, water was the principal beverage, and water accounted for 31% of TWI. In parallel to our findings, drinking water was the main beverage among the entire Spanish population [12,30]. Within other beverages, hot beverages were the main contributor to TWI, followed by milk and caloric soft drinks.
Energy intake from beverages varied within sex and age-specific groups and mean energy intake of the whole population is 9.8% which was lower than those of the entire Spanish population [12]. Overall, milk is the main beverage, accounting for energy intake, followed by alcoholic beverages and caloric soft drinks. In general, energy contribution of caloric soft drinks was 1.8% for men and 1.2% for women in our study population, but energy intake from these beverages was significantly higher among younger adults, especially in men (2.7% of TEI). In addition to caloric soft drinks, energy intake from commercial fruit juice was higher among younger adults. In comparison with the US population (5.7%) [31], energy intake from caloric soft drinks is lower in the Balearic population, but in view of the adverse health effect of caloric soft drinks [32,33,34], high consumption of these beverages among younger people should be discouraged by health authorities.
Another issue to be raised is the higher energy intake from alcoholic beverages of adults aged 26 and older, particularly men. Many older adults have chronic health conditions, and therefore, they take numerous medications; alcohol intake may interact with these medications [35]. Mean daily alcoholic beverage intake of the study population was below the recommended limits of alcohol and low to moderate alcohol consumption has some health benefits [36,37]. However the body composition changes with age and the amount of total body water decreases, which results in higher blood alcohol concentration in older than younger adults for the same amount of alcohol intake [38]. Close attention needs to be paid by health authorities for identifying high alcohol consumption of older adults since they are at a greater risk of alcohol-related harm than younger drinkers.
Adults in the Balearic Islands consumed more beverages during main meal times. Type of beverages varied between different meal times. Hot beverages, milk, and fruit juices were mainly consumed at breakfast, while water consumption was the lowest during breakfast. Fruit juice and milk have more effects on hunger and satiety than water, and these beverages satisfy thirst like water [39]. This might explain the beverage preferences of the study population and low water consumption during breakfast. Similar to our findings, milk and fruit juices were commonly consumed beverages for breakfast in Norway [40].
Earlier studies have suggested that consumption of sugar-sweetened beverages was related to high levels of energy intake [41,42]. In line with this, consumption of caloric soft drinks was positively correlated with TEI and also energy intake from food. Consumption of caloric soft drinks not only adds empty calories to the diet, but also regular consumption of these energy-dense beverages may affect the food choices and total caloric intake [43].
Some of the strengths of the present study consist of the use of a large and representative sample of Balearic adults. Misreporting of energy intake is an acknowledged problem in all dietary assessment methods [44,45]; Goldberg cut-off methods [28] were applied to exclude under-reporters. Several limitations of the present study need to be mentioned. First, the food and beverage intake and physical activity (IPAQ questionnaire) data are gathered using self-reported questionnaires and might be influenced by recording errors. Estimation of portion size is a usual weakness of self-reported dietary assessment methods; however, we used a manual of sets of photographs to avoid this weakness. Another limitation of the study is its cross-sectional design, which limits conclusions regarding causality. We used two 24 h dietary recalls. Dietary intakes estimated by means of two 24 h dietary recalls are not suitable for determining the usual intake distributions [46]; therefore, we do not attempt to describe the usual intake distributions of daily water intake. We present population means and standard errors for the beverage consumption, TWI, and TEI.
5. Conclusions
Although the energy contribution of beverages is low among the Balearic Islands population, there are some issues requiring the attention of health authorities for promoting healthy drinking. The main findings of this study indicate that consumption of sugar-sweetened beverages (caloric soft drinks and commercial fruit juice) is higher among young adults, consumption of alcoholic beverages is higher among males aged 26 and older, and TWI is lower than the EFSA recommendations. These findings may be used to develop effective, healthy eating and drinking policies and campaigns.
Author Contributions
A.E.O. and J.A.T. conceived, designed and devised the study; M.d.M.B. collected and supervised the samples; A.E.O., M.d.M.B., C.B., and J.A.T. analyzed the data and wrote the manuscript; all read and approved the final manuscript; A.P. and J.A.T. obtained funding.
Funding
The study was supported by the Instituto de Salud Carlos III (Program for the Promotion of Biomedical Research and Health Sciences, projects 05/1276, 08/1259, 11/01791, 14/00636 and 17/01827, Red Predimed RETIC RD06/0045/1004, and CIBEROBN CB12/03/30038), grant to research group No. 35/2011 (Balearic Islands Government), COST Action CA16112, and UE-FEDER funds. The funders had no role in the design or conduct of the study; collection, management, analysis and interpretation of the data; or preparation, review and approval of the manuscript.
Conflicts of Interest
None of the authors have any financial or non-financial competing interests to disclose.
Abbreviations
| AI | adequate intake |
| BMR | basal metabolic rate |
| DBP | diastolic blood pressure |
| EFSA | European Food Safety Authority |
| EI | energy intake |
| FFQ | food frequency questionnaire |
| IPAQ | International Physical Activity Questionnaire |
| MD | Mediterranean diet |
| MET | metabolic equivalent |
| PA | physical activity |
| BP | systolic blood pressure |
| SPSS | Statistical Package for the Social Sciences |
| TEI | total energy intake; |
| TWI | total water intake |
References
- World Health Organisation. Nutrients in Drinking Water; World Health Organisation: Geneva, Switzerland, 2005. [Google Scholar]
- Wolf, A.; Bray, G.A.; Popkin, B.M. A short history of beverages and how our body treats them. Obes. Rev. 2008, 9, 151–164. [Google Scholar] [CrossRef] [PubMed]
- Popkin, B.M. Patterns of beverage use across the lifecycle. Physiol. Behav. 2010, 100, 4–9. [Google Scholar] [CrossRef] [PubMed] [Green Version]
- Agostoni, C.; Bresson, J.-L.; Fairweather-Tait, S.; Flynn, A.; Golly, I.; Korhonen, H.; Lagiou, P.; Løvik, M.; Marchelli, R.; Martin, A.; et al. Scientific Opinion on Dietary reference values for water. EFSA J. 2010, 8. [Google Scholar] [CrossRef] [Green Version]
- Nissensohn, M.; Sánchez-Villegas, A.; Galan, P.; Turrini, A.; Arnault, N.; Mistura, L.; Ortiz-Andrellucchi, A.; Edelenyi, F.S.; D’Addezio, L.; Serra-Majem, L. Beverage Consumption Habits among the European Population: Association with Total Water and Energy Intakes. Nutrients 2017, 9, 383. [Google Scholar] [CrossRef] [PubMed]
- Storey, M.L.; Forshee, R.A.; Anderson, P.A. Beverage consumption in the US population. J. Am. Diet. Assoc. 2006, 106, 1992–2000. [Google Scholar] [CrossRef] [PubMed]
- Garriguet, D. Beverage consumption of children and teens. Health Rep. 2008, 19, 17–22. [Google Scholar] [PubMed]
- Garriguet, D. Beverage consumption of Canadian adults. Health Rep. 2008, 9, 23–29. [Google Scholar]
- Barquera, S.; Hernandez-Barrera, L.; Tolentino, M.L.; Espinosa, J.; Ng, S.W.; Rivera, J.A.; Popkin, B.M. Energy intake from beverages is increasing among Mexican adolescents and adults. J. Nutr. 2008, 138, 2454–2461. [Google Scholar] [CrossRef] [PubMed]
- Barquera, S.; Campirano, F.; Bonvecchio, A.; Hernández-Barrera, L.; Rivera, J.A.; Popkin, B.M. Caloric beverage consumption patterns in Mexican children. Nutr. J. 2010, 21. [Google Scholar] [CrossRef] [PubMed]
- Bellisle, F.; Thornton, S.N.; Hebel, P.; Denizeau, M.; Tahiri, M. A study of fluid intake from beverages in a sample of healthy French children, adolescents and adults. Eur. J. Clin. Nutr. 2010, 84, 350–355. [Google Scholar] [CrossRef] [PubMed]
- Nissensohn, M.; Sánchez-Villegas, A.; Ortega, R.M.; Aranceta-Bartrina, J.; Gil, Á.; González-Gross, M.; Varela-Moreiras, G.; Serra-Majem, L. Beverage Consumption Habits and Association with Total Water and Energy Intakes in the Spanish Population: Findings of the ANIBES Study. Nutrients 2016, 8, 232. [Google Scholar] [CrossRef] [PubMed]
- Mistura, L.; D’Addezio, L.; Turrini, A. Beverage Consumption Habits in Italian Population: Association with Total Water Intake and Energy Intake. Nutrients 2016, 8, 674. [Google Scholar] [CrossRef] [PubMed]
- de Edelenyi, F.S.; Druesne-Pecollo, N.; Arnault, N.; González, R.; Buscail, C.; Galan, P. Characteristics of Beverage Consumption Habits among a Large Sample of French Adults: Associations with Total Water and Energy Intakes. Nutrients 2016, 8, 627. [Google Scholar] [CrossRef] [PubMed]
- Gibson, S.; Shirreffs, S.M. Beverage consumption habits “24/7” among British adults: Association with total water intake and energy intake. Nutr. J. 2013, 12. [Google Scholar] [CrossRef] [PubMed]
- Tur, J.A.; Serra-Majem, L.; Romaguera, D.; Pons, A. Does the diet of the Balearic population, a Mediterranean type diet, still provide adequate antioxidant nutrient intakes? Eur. J. Nutr. 2005, 44, 204–213. [Google Scholar] [CrossRef] [PubMed]
- La Medición de la Clase Social en Ciencias de la Salud. Available online: https://www.seepidemiologia.es/documents/dummy/LA%20MEDICION%20DE%20LA%20CLASE%20SOCIAL-4.pdf (accessed on 10 March 2012).
- Ozen, A.E.; BibiloniMdel, M.; Pons, A.; Tur, J.A. Sociodemographic and lifestyle determinants of functional food consumption in an adult population of the Balearic Islands. Ann. Nutr. Metab. 2013, 63, 200–207. [Google Scholar] [CrossRef] [PubMed]
- González, M.; del Mar Bibiloni, M.; Pons, A.; Llompart, I.; Tur, J.A. Inflammatory markers and metabolic syndrome among adolescents. Eur. J. Clin. Nutr. 2012, 66, 1141–1145. [Google Scholar] [CrossRef] [PubMed] [Green Version]
- Body Mass Index-BMI. Available online: http://www.euro.who.int/en/health-topics/disease-prevention/nutrition/a-healthy-lifestyle/body-mass-index-bmi (accessed on 28 July 2018).
- IPAQ International Physical Activity Questionnaire. Guide-Lines for Data Processing and Analysis of the International Physical Activity Questionnaire (IPAQ). Available online: https://sites.google.com/site/theipaq (accessed on 20 July 2012).
- The Compendium of Physical Activities Tracking Guide. Available online: http://prevention.sph.sc.edu/tools/docs/documents_compendium.pdf (accessed on 20 July 2012).
- Gómez, C.; Kohen, V.L.; Nogueira, T.L. GuíaVisual de Alimentos y Raciones; EDIMSA: Madrid, Spain, 2007. [Google Scholar]
- Moreiras, O.; Carbajal, A.; Cabrera, L.; Cuadrado, C. Tablas de Composicion de Alimentos, 7th ed.; Piramide: Madrid, Spain, 2003. [Google Scholar]
- Mataix, V.J.; Manas, A.M. Tabla de Composicion de AlimentosEspañoles, 4th ed.; Editorial Universidad de Granada: Granada, Spain, 2003. [Google Scholar]
- Feinberg, M.; Favier, J.C.; Ireland-Ripert, J. Repertoire General des Aliments (Food Composition Tables); Tec & Doc Lavoisier: Paris, France, 1995. [Google Scholar]
- Ripoll, L. Cocina de las Islas Baleares, 5th ed.; L. Ripoll Pub. Co.: Palma de Mallorca, Spain, 1992. [Google Scholar]
- Black, A.E. Critical evaluation of energy intake using the goldberg cut-off for energy intake: Basal metabolic rate. A practical guide to its calculation, use and limitations. Int. J. Obes. 2000, 24, 1119–1130. [Google Scholar] [CrossRef]
- Salas, R.; del Mar Bibiloni, M.; Zapata, M.E.; Coll, J.L.; Pons, A.; Tur, J.A. Balearic adults have low intakes of fruits and vegetables compared with the dietary guidelines for adults in Spain. Nutr. Res. 2013, 33, 204–210. [Google Scholar] [CrossRef] [PubMed]
- Ferreira-Pêgo, C.; Babio, N.; Fenández-Alvira, J.M.; Iglesia, I.; Moreno, L.A.; Salas-Salvadó, J. Fluid intake from beverages in Spanish adults; cross-sectional study. Nutr. Hosp. 2014, 29, 1171–1178. [Google Scholar] [CrossRef] [PubMed]
- Drewnowski, A.; Rehm, C.D.; Constant, F. Water and beverage consumption among adults in the United States: Cross-sectional study using data from NHANES 2005–2010. BMC Public Health 2013, 13. [Google Scholar] [CrossRef] [PubMed]
- Vartanian, L.R.; Schwartz, M.B.; Brownell, K.D. Effects of soft drink consumption on nutrition and health: A systematic review and meta-analysis. Am. J. Public Health 2007, 97, 667–675. [Google Scholar] [CrossRef] [PubMed]
- Malik, V.S.; Popkin, B.M.; Bray, G.A.; Despres, J.P.; Willett, W.C.; Hu, F.B. Sugar-sweetened beverages and risk of metabolic syndrome and type 2 diabetes: A meta-analysis. Diabetes Care 2010, 33, 2477–2483. [Google Scholar] [CrossRef] [PubMed]
- Hu, B.F. Resolved: There is sufficient scientific evidence that decreasing sugar-sweetened beverage consumption will reduce the prevalence of obesity and obesity-related diseases. Obes. Rev. 2013, 14, 606–619. [Google Scholar] [CrossRef] [PubMed]
- Denton, F.T.; Spencer, B.G. Chronic health conditions: Changing prevalence in an aging population and some implications for the delivery of health care services. Can. J. Aging 2010, 29, 11–21. [Google Scholar] [CrossRef] [PubMed]
- Krenz, M.; Korthuis, R.J. Moderate ethanol ingestion and cardiovascular protection: From epidemiologic associations to cellular mechanisms. J. Mol. Cell. Cardiol. 2012, 52, 93–104. [Google Scholar] [CrossRef] [PubMed] [Green Version]
- Arranz, S.; Chiva-Blanch, G.; Valderas-Martínez, P.; Medina-Remón, A.; Lamuela-Raventós, R.M.; Estruch, R. Wine, beer, alcohol and polyphenols on cardiovascular disease and cancer. Nutrients 2012, 4, 759–781. [Google Scholar] [CrossRef] [PubMed] [Green Version]
- Dufour, M.C.; Archer, L.; Gordis, E. Alcohol and the elderly. Clin. Geriatr. Med. 1992, 8, 127–141. [Google Scholar] [CrossRef]
- Almiron-Roig, E.; Drewnowski, A. Hunger, thirst, and energy intakes following consumption of caloric beverages. Physiol. Behav. 2003, 79, 767–773. [Google Scholar] [CrossRef]
- Paulsen, M.M.; Myhre, J.B.; Andersen, L.F. Beverage Consumption Patterns among Norwegian Adults. Nutrients 2016, 8, 561. [Google Scholar] [CrossRef] [PubMed]
- Mathias, K.C.; Slining, M.M.; Popkin, B.M. Foods and beverages associated with higher intake of sugar-sweetened beverages. Am. J. Prev. Med. 2013, 44, 351–357. [Google Scholar] [CrossRef] [PubMed]
- An, R. Beverage consumption in relation to discretionary food intake and diet quality among US adults, 2003 to 2012. J. Acad. Nutr. Diet. 2016, 116, 28–37. [Google Scholar] [CrossRef] [PubMed]
- Bell, E.A.; Castellanos, V.H.; Pelkman, C.L.; Thorwart, M.L.; Rolls, B.J. Energy density of foods affects energy intake in normal-weight women. Am. J. Clin. Nutr. 1998, 67, 412–420. [Google Scholar] [CrossRef] [PubMed] [Green Version]
- Macdiarmid, J.; Blundell, J. Assessing dietary intake: Who, what and why of under-reporting. Nutr. Res. Rev. 1998, 11, 231–253. [Google Scholar] [CrossRef] [PubMed]
- Livingstone, M.B.; Black, A.E. Markers of the validity of reported energy intake. J. Nutr. 2003, 133, 895S–920S. [Google Scholar] [CrossRef]
- National Cancer Institute (NIH). Usual Dietary Intakes. Available online: https://epi.grants.cancer.gov/diet/usualintakes/ (accessed on 29 July 2018).
Figure 1.
Daily mean beverage consumption during different meals by gender.


Figure 2.
Percentage of total beverage consumption during different meals by gender and age group.


Table 1.
Socio-demographic and lifestyle characteristics of study population.
| Characteristics | Male (n = 410) | Female (n = 654) | |||
|---|---|---|---|---|---|
| n | % | n | % | χ2 | |
| Age (years) | <0.001 | ||||
| 16–25 | 201 | 49 | 228 | 36 | |
| 26–45 | 150 | 37 | 290 | 45 | |
| 46–65 | 57 | 14 | 122 | 19 | |
| BMI | <0.001 | ||||
| Healthy weight | 232 | 57 | 445 | 68 | |
| Overweight | 143 | 35 | 159 | 24 | |
| Obese | 35 | 9 | 49 | 8 | |
| Marital Status | 0.003 | ||||
| Not married | 304 | 75 | 426 | 67 | |
| Married | 103 | 25 | 213 | 33 | |
| Education Level | ns | ||||
| Low | 136 | 34 | 185 | 29 | |
| Medium | 144 | 36 | 224 | 35 | |
| High | 124 | 31 | 228 | 36 | |
| Employment Status | ns | ||||
| Low | 174 | 43 | 240 | 37 | |
| Medium | 40 | 10 | 81 | 13 | |
| High | 195 | 48 | 324 | 50 | |
| Smoking status | ns | ||||
| Non smoker | 241 | 61 | 374 | 59 | |
| Ex-smoker | 48 | 12 | 82 | 13 | |
| Smoker | 108 | 27 | 174 | 28 | |
| Alcohol consumption | <0.001 | ||||
| Non drinkers | 91 | 23 | 207 | 32 | |
| Very occasional drinkers | 151 | 37 | 263 | 41 | |
| Daily drinkers | 125 | 31 | 140 | 22 | |
| Heavy drinkers | 37 | 9 | 29 | 5 | |
| Hypertension | 0.038 | ||||
| No hypertension | 288 | 71 | 483 | 76 | |
| Have hypertension | 116 | 29 | 149 | 24 | |
| Physical Activity | <0.001 | ||||
| Low | 164 | 41 | 431 | 67 | |
| Moderate | 132 | 33 | 174 | 30 | |
| High | 102 | 26 | 43 | 7 | |
BMI: Body Mass Index; Not married includes: single, divorced, widowed, and separated. ns: Not statistically significant.
Table 2.
Mean daily beverage consumption (g/day) by gender and age group.
| Beverages | Male | Female | ||||||||
|---|---|---|---|---|---|---|---|---|---|---|
| 16–25 | 26–45 | 46–65 | Total | p Value | 16–25 | 26–45 | 46–65 | Total | p Value | |
| Mean (SE) 1 | Mean (SE) 1 | Mean (SE) 1 | Mean (SE) 1 | Mean (SE) 1 | Mean (SE) 1 | Mean (SE) 1 | Mean (SE) 1 | |||
| Water | 839.5 (57.3) | 817.7 (69.2) | 845.3 (110.7) | 831.4 (40.7) | ns | 709.8 (47.5) | 636.0 (38.7) | 748.8 (79.3) | 688.5 (28.5) | ns |
| Milk total | 228.8 (15.3) a | 194.8 (14.6) ab | 150.6 (20.1) b | 205.6 (9.7) * | 0.021 | 176.4 (9.4) | 165.4 (8.2) | 181.1 (11.6) | 173.4 (5.4) | ns |
| Full-fat milk | 111.8 (11.8) a | 85.9 (9.9) ab | 59.4 (12.5) b | 95.2 (7.1) *** | 0.032 | 94.0 (8.8) a | 61.0 (6.1) b | 47.7 (9.4) b | 70.0 (4.5) | <0.001 |
| Low/non-fat milk | 117.0 (13.1) | 108.9 (14.0) | 91.2 (17.0) | 110.4 (8.6) | ns | 82.5 (7.9) a | 104.4 (7.5) ab | 133.4 (10.8) b | 103.4 (5.0) | 0.001 |
| Fruit juice total | 111.4 (14.6) a | 83.0 (12.9) ab | 49.1 (13.5) b | 92.3 (8.8) *** | 0.049 | 96.5 (9.3) a | 63.8 (7.0) b | 36.0 (8.7) b | 70.4 (4.9) | <0.001 |
| 100% fruit juice | 22.7 (7.3) | 28.9 (6.2) | 21.1 (8.2) | 24.8 (4.4) | ns | 20.3 (4.0) | 23.7 (3.9) | 26.9 (2.7) | 23.1 (2.7) | ns |
| Commercial fruit juice | 88.7 (13.2) a | 54.1 (11.8) ab | 28.1 (9.3) b | 67.5 (8.0) * | 0.019 | 76.3 (8.9) a | 40.1 (6.1) b | 11.1 (4.1) c | 47.5 (4.4) | <0.001 |
| Caloric soft drinks | 219.5 (24.7) a | 84.9 (9.3) b | 48.1 (17.4) b | 145.4 (14.0) *** | <0.001 | 129.4 (17.8) a | 68.6 (9.7) b | 19.6 (6.9) c | 79.7 (7.8) | <0.001 |
| Light soft drinks | 11.8 (5.5) a | 38.9 (9.3) b | 10.5 (7.4) a | 21.5 (4.5) * | 0.014 | 19.3 (10.6) | 36.6 (7.5) | 14.4 (6.4) | 25.7 (5.1) | ns |
| Hot beverages total | 207.7 (21.8) | 181.0 (20.4) | 174.2 (26.8) | 194.7 (13.6) | ns | 219.0 (17.8) | 190.1 (11.2) | 202.5 (17.7) | 202.1 (8.7) | ns |
| Coffee | 194.7 (20.8) | 152.3 (19.3) | 142.6 (25.8) | 173.0 (13.0) *** | ns | 193.5 (17.5) a | 128.2 (8.7) b | 121.6 (13.1) b | 150.4 (7.8) | <0.001 |
| Tea | 12.9 (5.7) | 28.7 (7.1) | 31.6 (10.7) | 21.7 (4.1) *** | ns | 25.4 (5.6) a | 61.96 (8.3) b | 80.9 (14.4) b | 51.7 (5.0) | <0.001 |
| Alcoholic beverages | 46.3 (15.8) a | 161.0 (37.0) b | 179.2 (36.8) b | 107.0 (16.7) ** | 0.001 | 25.0 (11.0) | 51.1 (7.2) | 52.4 (10.3) | 41.9 (5.4) | ns |
| Other beverages | 3.6 (2.2) a | 45.0 (9.5) b | 33.4 (13.7) b | 22.9 (4.2) *** | <0.001 | 13.9 (4.5) a | 28.72 (4.6) ab | 34.2 (8.4) b | 24.3 (3.0) | 0.031 |
| Total beverage | 1668.6 (57.8) | 1606.3 (86.5) | 1490.4 (115.2) | 1620.7 (45.4) * | ns | 1390.2 (52.8) | 1242.7 (42.0) | 1290.9 (79.3) | 1307.3 (30.4) | ns |
* p < 0.05, ** p < 0.01, *** p < 0.001 (Significantly different from females). Superscript lowercase letters denote significant differences across age group within sex (analysis of variance with Bonferroni correction). ns: not statistically significant. 1 Standard Error Means.
Table 3.
Contribution of food and beverages to total water (g/day) and energy (kcal/day) intake by gender and age group.
Table 3.
Contribution of food and beverages to total water (g/day) and energy (kcal/day) intake by gender and age group.
| Age Group | Water from Beverages | Water from Foods | Total Water Intake (TWI) | Energy from Beverages | Energy from Foods | Total Energy Intake (TEI) | |||||
|---|---|---|---|---|---|---|---|---|---|---|---|
| Mean (SE) 1 | % | Mean (SE) 1 | % | Mean (SE) 1 | Mean (SE) 1 | % | Mean (SE) 1 | % | Mean (SE) 1 | ||
| Male | 16–25 years | 1604.7 (57.1) | 78.4 | 544.8 (39.3) a | 21.6 | 2149.6 (62.5) | 262.7 (13.1) | 10.1 | 2359.1 (48.4) a | 89.9 | 2621.8 (51.0) a |
| 26–45 years | 1542.7 (84.2) | 66.8 | 749.2 (37.9) b | 33.2 | 2291.9 (84.9) | 258.3 (15.0) | 10.6 | 2192.6 (51.9) b | 89.6 | 2450.9 (54.6) a | |
| 46–65 years | 1438.6 (114.8) | 63.1 | 824.8 (50.8) b | 36.9 | 2263.4 (125.8) | 233.8 (18.6) | 10.5 | 1976.8 (59.6) c | 89.5 | 2210.6 (64.1) b | |
| Total | 1558.7 (44.6) *** | 71.1 | 658.4 (44.6) | 28.9 | 2217.1 (47.0) *** | 257.1 (8.9) *** | 10.3 | 2244.5 (32.6) *** | 89.7 | 2499.5 (33.9) *** | |
| Female | 16–25 years | 1343.6 (52.2) | 73.5 | 530.0 (28.7) a | 26.5 | 1873.6 (54.9) | 205.7 (9.7) | 9.6 | 1931.6 (33.1) a | 90.4 | 2137.3 (35.0) a |
| 26–45 years | 1202.6 (41.8) | 62.1 | 724.9 (22.8) b | 37.9 | 1925.7 (44.6) | 190.2 (7.4) | 9.4 | 1863.1 (28.5) a | 90.6 | 2050.5 (29.3) a | |
| 46–65 years | 1249.3 (78.9) | 58.8 | 825.7 (33.1) c | 41.2 | 2074.9 (87.2) | 172.6 (10.4) | 9.3 | 1704.4 (34.4) b | 90.4 | 1877.0 (35.4) b | |
| Total | 1264.8 (30.2) | 65.4 | 673.4 (16.2) | 34.6 | 1937.4 (32.4) | 192.4 (5.2) | 9.5 | 1857.2 (18.9) | 90.5 | 2048.1 (19.4) | |
| Total | 1380.4 (25.7) | 68.1 | 667.5 (14.0) | 31.9 | 2047.4 (27.3) | 217.6 (4.8) | 9.8 | 2008.1 (18.0) | 90.2 | 2222.0 (18.9) |
*** p < 0.001 (Significantly different from females). Superscript lowercase letters denote significant differences across age group within sex (analysis of variance with Bonferroni correction). 1 Standard Error Means.
Table 4.
Contribution of beverages to total water and energy intake by gender and age group.
| Contribution to Water Intake | Contribution to Energy Intake | |||||||||||||||
|---|---|---|---|---|---|---|---|---|---|---|---|---|---|---|---|---|
| Male | Female | Male | Female | |||||||||||||
| Age Group | Age Group | Age Group | Age Group | |||||||||||||
| 16–25 | 26–45 | 46–65 | Total | 16–25 | 26–45 | 46–65 | Total | 16–25 | 26–45 | 46–65 | Total | 16–25 | 26–45 | 46–65 | Total | |
| Total intake, Mean(SE) 1 | 2149.6 (62.5) | 2291.9 (84.9) | 2263.4 (125.8) | 2217.1 (47.0) *** | 1873.6 (54.9) | 1925.7 (44.6) | 2074.9 (87.2) | 1937.4 (32.4) | 2621.8 (51.0) a | 2450.9 (54.6) a | 2210.6 (64.1) b | 2499.5 (33.9) *** | 2137.3 (35.0) a | 2050.5 (29.3) a | 1877.0 (35.4) b | 2048.1 (19.4) |
| From Beverages (%) | 78.4 | 66.8 | 63.1 | 71.1 | 73.5 | 62.1 | 58.8 | 65.4 | 10.1 | 10.6 | 10.5 | 10.3 | 9.6 | 9.4 | 9.3 | 9.5 |
| Water (%) | 33.3 | 29.6 | 32.1 | 31.7 | 31.5 | 27.3 | 28.5 | 29.2 | 0.0 | 0.0 | 0.0 | 0.0 | 0.0 | 0.0 | 0.0 | 0.0 |
| Milk total (%) | 11.1 | 8.3 | 6.4 | 9.4 | 10 | 8.5 | 9.5 | 9.3 | 4.7 | 4.3 | 3.8 | 4.5 | 4.6 | 4.1 | 4.4 | 4.4 |
| Full-fat milk (%) | 5.5 | 3.6 | 2.6 | 2.5 | 5.5 | 3.2 | 2.5 | 2.2 | 2.7 | 2.4 | 1.8 | 2.5 | 2.8 | 1.9 | 1.8 | 2.2 |
| Low/non-fat milk (%) | 5.6 | 4.8 | 3.8 | 2 | 4.5 | 5.3 | 7.0 | 2.2 | 2.0 | 1.9 | 2.0 | 2.0 | 1.9 | 2.2 | 2.6 | 2.2 |
| Fruit juice total (%) | 5.2 | 3.5 | 2.2 | 4.1 | 5.3 | 3.1 | 1.5 | 3.6 | 2.0 | 1.5 | 1.3 | 1.7 | 2.1 | 1.4 | 1.0 | 1.6 |
| 100% fruit juice (%) | 0.9 | 1.4 | 0.8 | 1.1 | 1.2 | 1.2 | 1.1 | 1.1 | 0.4 | 0.6 | 0.4 | 0.5 | 0.5 | 0.6 | 0.7 | 0.6 |
| Commercial fruit juice (%) | 4.3 | 2.0 | 2.0 | 1.3 | 4.1 | 1.9 | 0.4 | 2.4 | 1.6 | 1.0 | 0.7 | 1.3 | 1.8 | 0.9 | 0.3 | 1.1 |
| Caloric soft drinks (%) | 10.9 | 3.6 | 1.9 | 6.9 | 7.1 | 3.7 | 0.8 | 4.3 | 2.7 | 1.0 | 0.8 | 1.8 | 1.7 | 1.0 | 0.8 | 1.2 |
| Light soft drinks (%) | 0.8 | 1.8 | 0.6 | 1.1 | 1.0 | 2.0 | 1.0 | 1.4 | 0.0 | 0.0 | 0.0 | 0.0 | 0.0 | 0.0 | 0.0 | 0.0 |
| Hot beverages total (%) | 11.7 | 8.8 | 7.8 | 10.2 | 14.2 | 11.2 | 10.9 | 12.2 | 0.1 | 0.2 | 0.3 | 0.2 | 0.2 | 0.4 | 0.6 | 0.4 |
| Coffee (%) | 11.2 | 7.4 | 6.6 | 9.2 | 12.8 | 7.9 | 6.7 | 9.4 | 0.1 | 0.1 | 0.2 | 0.1 | 0.1 | 0.2 | 0.2 | 0.1 |
| Tea (%) | 0.5 | 1.4 | 1.3 | 0.9 | 1.4 | 3.3 | 4.2 | 2.7 | 0.1 | 0.1 | 0.1 | 0.1 | 0.1 | 0.3 | 0.4 | 0.3 |
| Alcoholic beverages (%) | 1.8 | 6.9 | 8.4 | 4.6 | 0.9 | 2.6 | 3.1 | 2.1 | 0.4 | 2.6 | 3.7 | 1.7 | 0.5 | 1.5 | 1.6 | 1.2 |
| Other beverages (%) | 0.2 | 1.4 | 1.1 | 0.8 | 0.8 | 1.5 | 1.4 | 1.2 | 0.2 | 0.9 | 0.7 | 0.5 | 0.5 | 1.0 | 0.9 | 0.8 |
*** p < 0.001 (Significantly different from females). Superscript lowercase letters denote significant differences across age group within sex (analysis of variance with Bonferroni correction). 1 Standard Error Means.
Table 5.
Partial correlation between the consumption of different types of beverages and TWI, water from beverages and foods, TEI, energy intake from beverages and foods (adjusted for gender, age, BMI, and PA).
Table 5.
Partial correlation between the consumption of different types of beverages and TWI, water from beverages and foods, TEI, energy intake from beverages and foods (adjusted for gender, age, BMI, and PA).
| Beverages | Total Beverage | Water from Beverages | Water from Foods | TWI | Energy from Beverages | Energy from Foods | TEI |
|---|---|---|---|---|---|---|---|
| Water | 0.837 * | 0.853 * | 0.107 * | 0.851 * | −0.163 * | 0.051 * | −0.016 |
| Full-fat milk | 0.142 * | 0.130 * | −0.166 * | 0.047 * | 0.374 * | 0.092 * | 0.186 * |
| Low/non-fat milk | 0.140 * | 0.135 * | −0.087 * | 0.083 * | 0.079 * | 0.021 | 0.033 |
| 100% fruit juice | −0.052 | −0.057 | 0.003 | −0.055 | 0.050 | −0.070 * | −0.052 |
| Commercial fruit juice | −0.074 * | −0.086 * | −0.014 | −0.088 * | 0.165 * | 0.020 | 0.070 * |
| Caloric soft drinks | 0.107 * | 0.082 * | −0.189 * | −0.019 | 0.340 * | 0.178 * | 0.275 * |
| Light soft drinks | 0.070 * | 0.076 * | −0.068 * | 0.037 | −0.077 * | 0.009 | −0.016 |
| Coffee | 0.296 * | 0.291 * | −0.567 * | −0.012 | 0.181 * | 0.080 * | 0.134 * |
| Tea | 0.059 | 0.062 * | 0.079 * | 0.098 * | −0.033 | 0.031 | 0.021 |
| Alcoholic beverages | 0.191 * | 0.179 * | −0.101 * | 0.117 * | 0.141 * | 0.108 * | 0.153 * |
| Other beverages | 0.047 | 0.025 | −0.111 * | 0.079 * | 0.068 * | −0.042 | −0.019 |
* p < 0.05 (statistically significant); TWI: Total Water Intake; TEI: Total Energy Intake; BMI: Body Mass Index; PA: Physical Activity.
© 2018 by the authors. Licensee MDPI, Basel, Switzerland. This article is an open access article distributed under the terms and conditions of the Creative Commons Attribution (CC BY) license (http://creativecommons.org/licenses/by/4.0/).
Share and Cite
MDPI and ACS Style
Özen, A.E.; Bibiloni, M.D.M.; Bouzas, C.; Pons, A.; Tur, J.A. Beverage Consumption among Adults in the Balearic Islands: Association with Total Water and Energy Intake. Nutrients 2018, 10, 1149. https://doi.org/10.3390/nu10091149
AMA Style
Özen AE, Bibiloni MDM, Bouzas C, Pons A, Tur JA. Beverage Consumption among Adults in the Balearic Islands: Association with Total Water and Energy Intake. Nutrients. 2018; 10(9):1149. https://doi.org/10.3390/nu10091149
Chicago/Turabian StyleÖzen, Asli Emine, Maria Del Mar Bibiloni, Cristina Bouzas, Antoni Pons, and Josep A. Tur. 2018. "Beverage Consumption among Adults in the Balearic Islands: Association with Total Water and Energy Intake" Nutrients 10, no. 9: 1149. https://doi.org/10.3390/nu10091149
Note that from the first issue of 2016, this journal uses article numbers instead of page numbers. See further details here.