
Importance of Overlooked Crop Biomass Components in Sugarcane Nitrogen Nutrition Studies


1
CIRAD, UPR Recyclage et Risque, 97743 Saint-Denis, La Réunion, France
2
Recyclage et Risque, University of Montpellier, CIRAD, 34000 Montpellier, Hérault, France
3
Runéo, 97400 Saint-Denis, Réunion, France
4
CIRAD, UMR Eco&Sols, 34398 Montpellier, Hérault, France
*
Author to whom correspondence should be addressed.
Nitrogen 2024, 5(1), 62-78; https://doi.org/10.3390/nitrogen5010005
Submission received: 28 November 2023
/
Revised: 11 January 2024
/
Accepted: 23 January 2024
/
Published: 26 January 2024
Abstract
:Sugarcane crops typically have a high fertiliser nitrogen (N) input, with low N recovery efficiencies. Nitrogen is essential to crop productivity, but excess application can have negative environmental consequences. Despite the importance of coordinating N fertiliser input with crop N requirements, certain components of the sugarcane plant are typically not considered when evaluating N nutrition. The objective of this study was to establish which sugarcane crop components should be included in these evaluations given their impact on N mass accumulation and on fertiliser N recovery efficiencies. The respective biomass, N mass, and fertiliser N recovery efficiency were evaluated for sugarcane shoots, tillers, strawfall, root, and stool components over two experimental years, for fertilised (urea) and unfertilised treatments. The root component comprised, respectively, 57–65% of the aboveground N mass of fertilised sugarcane, and 74–104% of the unfertilised sugarcane. The sugarcane N requirements and uptake were shown to be more progressive over the growth-cycle when considering the strawfall and tiller components. This study emphasises the importance of evaluating belowground biomass in sugarcane N studies, and suggests that the tiller and strawfall components should also be considered when evaluating the evolution of N mass and fertiliser N recovery efficiency.
1. Introduction
Nitrogen is critical to crop growth and productivity. It is the most important soil-derived nutrient in terms of its quantitative contribution to sugarcane dry biomass over the crop growth cycle [1]. However, N fertilisers are frequently overused leading to the application of excess N to agroecosystems. This can have substantial negative environmental consequences [2,3] such as the leaching of nitrates and greenhouse gas emissions. Sugarcane crops typically obtain only 20–40% of the nitrogen (N) they require from the fertiliser, and as much as 60 % of fertiliser N may be lost from the soil–crop system [4,5,6]. A better coordination of crop N requirements and N supply with respect to the timing and quantities of fertiliser N used can lead to lower nutrient losses with their consequent environmental impacts [7].
One means of attempting to achieve this coordination is through the evaluation of the N accumulation of a given a crop, which gives an indication of when N is being taken up by the plant, as well as the “active” N uptake period, where the N accumulation gradient is greatest [8]. In this study, we use the term “N mass” for this metric, as it is calculated as a function of crop biomass and N concentration.
A second important nutritive metric is the fertiliser N recovery efficiency or NRE, which is the calculated percentage of fertiliser N recovered in the crop aboveground biomass during the crop-growing season. This can be calculated using 15N isotopes or, as is commonly used in Agronomy, by using the “difference” method, and is referred to here as “dNRE”. The dNRE corresponds to the broadest measure of NRE and is based on the difference between the N mass accumulated in the aboveground biomass (N content per unit biomass) of N-fertilised crops, and unfertilised crops [9,10,11]. The NRE calculation requires a precise estimation of the crop biomass as well as the corresponding N content of this biomass. The NRE is variable over the sugarcane growth cycle [8,12,13], and measures of the N mass and NRE should therefore be assessed over the sugarcane growth cycle rather than only at harvest [13].
In a pivotal study on sugarcane N nutrition, Wood et al. [14] recommended that the early plateau of N accumulation needs to be further interrogated, and in addition, that accurate estimations of N mass accumulation “must consider the losses of N in trash and losses of N due to stalk death”. In order to address this gap in understanding, these sugarcane components have been evaluated, alongside the belowground biomass component. The partitioning of N, and its accumulation in the different sugarcane crop components over its growth, can lead to a better quantitative and temporal understanding of the crop’s N requirements.
Typically, only the sugarcane aboveground biomass is studied, partly due to the methodological challenge of sampling the belowground biomass [15,16,17].
The sugarcane belowground compartment is suspected to accumulate N throughout the growth cycle and to supply N back to the sugarcane over subsequent ratoons. However, there is very limited information documenting the effect of N fertilisation on root biomass and on belowground N mass accumulation [1,16,17]. It has been suggested in a recent study reviewing various definitions of nitrogen use efficiency, that the entire plant should be considered (including roots), in order to obtain a ‘more complete picture’ or a more representative measure of NRE [7].
Tillers are secondary shoots which emerge from the axillary buds of an existing sugarcane stalk to form additional stalks [18]. The survival of tillers until harvest is strongly dependent on the density of established primary shoots, since excessive tillering results in a competition between stalks for light and nutrients, which leads to the death of certain stalks [19,20]. Tillers are a component of the sugarcane system which has received little attention in terms of the loss of biomass of a sugarcane plantation [19], and even less so in terms of the loss of N mass via tiller senescence over the sugarcane growth cycle.
Sugarcane crop residue, also referred to as “trash” or “post-harvest residue”, retained on the soil surface after harvest, represents an additional N source, which can be up to 30–50 kg N ha−1 [21,22,23]. However, it is not clear to what extent N is distributed to strawfall, or leaves which detach and fall to the soil surface, over the growth cycle. This remains a potentially overlooked component of the sugarcane system. This component is evaluated in this study and is termed “strawfall”, referring to the (dry) leaf-fall which falls to the ground from approximately mid-growth cycle until the following harvest. The equivalent and well-documented component of N biogeochemical cycles in forestry, for example, would be “litterfall” [24].
A better understanding of the role of the typically overlooked sugarcane components in the accumulation could lead to a better understanding of the crop’s N requirements over the growth cycle, and of how to better coordinate N supply.
The hypotheses of this study were that (1) N would be distributed to the various overlooked sugarcane components over the growth cycle, and not only to the aboveground biomass; (2) fertilisation would influence this allocation of N to the different sugarcane components, by increasing N distribution to the overlooked components; and (3) the consideration of the overlooked sugarcane components would impact the N-recovery efficiency calculations.
The aim of this study was therefore to investigate the relative importance of distinct biomass components in estimating the accumulation of N mass and N recovery efficiency throughout the growth cycle of sugarcane ratoons. The sugarcane components evaluated over the two experimental years were the shoot, tiller, strawfall, root, and stool components.
2. Materials and Methods
2.1. Study Site and Experimental Design
The experiment took place at a highly monitored site in Reunion Island (20°54′12.2″ S, 55°31′46.6″ E), which is part of the SOERE-PRO network (https://valor-pro.hub.inrae.fr/presentation-de-l-observatoire-soere-pro, accessed on 25 November 2023). This site has a tropical climate with an average annual temperature of 25 °C and an annual precipitation of 1650 mm. The soil is a silt-clay nitisol (FAO 1998) with a clayey texture greater than 30%, an average bulk density of 1.3 g cm−3, an average cation exchange capacity (CEC) of 108.6 mmol/kg, and a topsoil organic carbon content of 2%. The soil profile has two primary descriptive categories: the soil horizon between the surface and a depth of 40 cm, and the soil horizon between 40 cm and the bedrock at 100 cm. The 0–40 cm soil horizon has a clay-silt texture, low porosity, strong compactness, and higher biological activity with the presence of many roots and turricles, with the presence of ants and earthworms. The 40–100 cm soil horizon has a silty-clay texture, with medium porosity, strong compactness, and lower biological activity than the surface horizons with fewer roots, and no faunal activity (Table A1). The trial was planted in March 2014 with one sugarcane variety (R579) and a 1.5 m row spacing. The trial was irrigated throughout the crop cycle (29 mm week−1) except for the final two months before harvest. The measurements in the present study were conducted over two years and sugarcane growth cycles, during the fourth (October 2017–October 2018) and fifth ratoons (October 2018–October 2019) of the sugarcane experimental plantation.
This experiment consisted of two treatments, unfertilised and urea-fertilised sugarcane, over three experimental plots. Each experimental plot contained six rows of sugarcane 28 m long, with a total plot area of 250 m2. Within these plots, there were six repeats of unfertilised 2 m linear subplots (2 m × 1.5 m), and nine repeats of 2 m linear urea-fertilised subplots. In the fertilised treatment, 88 kg N ha−1 was applied at the start of each sugarcane ratoon, directly after the previous growth-cycle harvest. A further 57 kg N ha−1 was applied at five months after the start of the first experimental year (fourth ratoon) and 62 kg N ha−1 at four months after the start of the second experimental year (fifth ratoon). All treatments were supplied with 37 kg P ha−1 and 199 kg K ha−1 at five months after the start of the first experimental year and at five months after the start of the second experimental year.
2.2. Shoot Estimation from Inventories and Sampling
The shoot biomass was estimated monthly from inventories and allometric relationships according to the methodology outlined in Poultney et al. [13]. Briefly, monthly inventories of sugarcane height and basal diameter were taken at 2 m linear (2 m × 1.5 m) microplots, starting at three months after harvest. Three microplots were placed each in three different plots within the experimental trial.
In order to determine the N content of the sugarcane aboveground biomass at the plot scale, an N dilution curve was constructed by harvesting sugarcane stalks each month from the unfertilised microplots and the fertilised treatments, starting at three months after harvest. Six sugarcane plants (aboveground stalks and leaves) were harvested from the unfertilised subplot, and six sugarcane plants were harvested from the urea-fertilised plots, as established in the methodological paper by Poultney et al. [13].
2.3. Tiller Estimation from Inventories and Sampling
The tillers were considered as the secondary shoots that did not survive from the start of the ratoon to the following harvest. This corresponds to studies by Bell and Garside [19] and Singels et al. [20], where primary shoots were found to occur up until 2 months after harvest, followed by a rapid addition of secondary and higher order tillers until approximately 3 months after harvest. The sampling in our study begins at 3 months, where the smallest sugarcane stalks attached to larger already-established stalks were considered to be tillers. For each month in our study, the number of tillers was considered as the difference between the number of sugarcane stalks at that month and at the final sampling date before harvest, representing the stalks which survived over the entire growth cycle. The tiller biomass was the sum of the biomass of the lowest biomass sugarcane stalks at each month for each treatment.
2.4. Strawfall Sampling from Catchment
The strawfall component in this study was measured using 1.5 m × 1.5 m ‘catchment’ nets that were placed on the soil between sugarcane rows in each treatment plot. Three catchment nets were placed in the fertilised and unfertilised treatments, respectively. The nets were placed on the soil between sugarcane rows, and at relatively central positions within the sugarcane plots. Sugarcane leaves that fell onto these catchment nets, and the portion of dry leaves that made contact with the nets, were harvested twice every month.
2.5. Root and Stool Sampling
The sugarcane root biomass was estimated with the auger method [25,26]. Soil cores were sampled using a mechanic auger (with an inner diameter of 90 mm) composed of gouges coupled with a percussion hammer (Cobra TT, Eijkelkamp, Giesbeek, The Netherlands). Root biomass was estimated from 9 soil cores corresponding to 3 repetitions and in the centre of 3 horizontal positions relative to the sugarcane row (0–25 cm, 25–50 cm, and 50–75 cm) to a depth of 50 cm. In the field, the soil cores were divided into three layers: 0–10 cm, 10–30 cm, and 30–50 cm. In the laboratory, roots were separated from soil by placing each sample into a bucket of water and swirling the water to create a vortex. Soil was manually disaggregated from the roots, and the roots would float to the surface of the water in the bucket. The floating roots were then collected using a 500 µm sieve.
The stool or pseudo-rhizome was collected only at the end of the growth cycle of the second experimental year. A single, entire sugarcane plant was harvested at the centre of the 15N subplots, and the stalks and the rest of the aboveground biomass components were removed, as well as the roots attached to the stool. Soil was also separated from the stool by swirling the stool in a bucket of water, as for the roots, as well as by scrubbing out the soil using a brush.
2.6. Nitrogen Concentration, N Mass, and Fertiliser N Recovery Efficiency
After harvest, the sugarcane stalks, as well as the other sugarcane components (tillers, strawfall, roots, and stools) were cut into small pieces (approximately 10 cm × 1 cm) and dried at 60 °C for a minimum of 72 h until a constant weight was obtained on an analytical scale. The dried sugarcane biomass components were then ground to 1 mm using a Universal Cutting Mill (Pulverisette 19, Fritsch, Idar-Oberstein, Germany) and analysed for N with an elemental analyzer (Vario Max Cube CNS, Elementar, Hanau, Germany).
The N mass of each of these biomass components was then calculated as the biomass multiplied by the corresponding N concentration. For the aboveground biomass at the plot scale, the N dilution curve was used.
The fertiliser N recovery efficiency by the difference method (dNRE) was then calculated as the difference between the N mass of the fertilised treatment, and the N mass of the unfertilised treatment, divided by the total N applied by the fertiliser. The N mass and dNRE were determined step by step, by introducing each of the sugarcane components, the “stalks” (which was the shoot minus tillers), the shoot (the conventional measure with tillers), the aboveground biomass (shoot with strawfall added), and the total biomass (aboveground biomass with the root biomass added, as well as the stool biomass for the second experimental year).
2.7. Statistical Analysis of Sugarcane N Mass Components
Statistical analyses and graphical representations were conducted using R statistical software version 4.1.0 (R Core Team 2023) [27] with a significant level set at p < 0.05. The difference between N mass (kg N ha−1) calculated without additional biomass components, and when each of the biomass components were considered (tillers, stalks, roots, and stools) was tested using an analysis of variance (ANOVA). When the F test was significant in the ANOVA, the Tukey honestly significant difference (HSD) test was performed to compare the averages of the biomass components at each of the sampling dates.
3. Results
3.1. Sugarcane Aboveground Biomass and Nitrogen Mass over the Growth Cycle
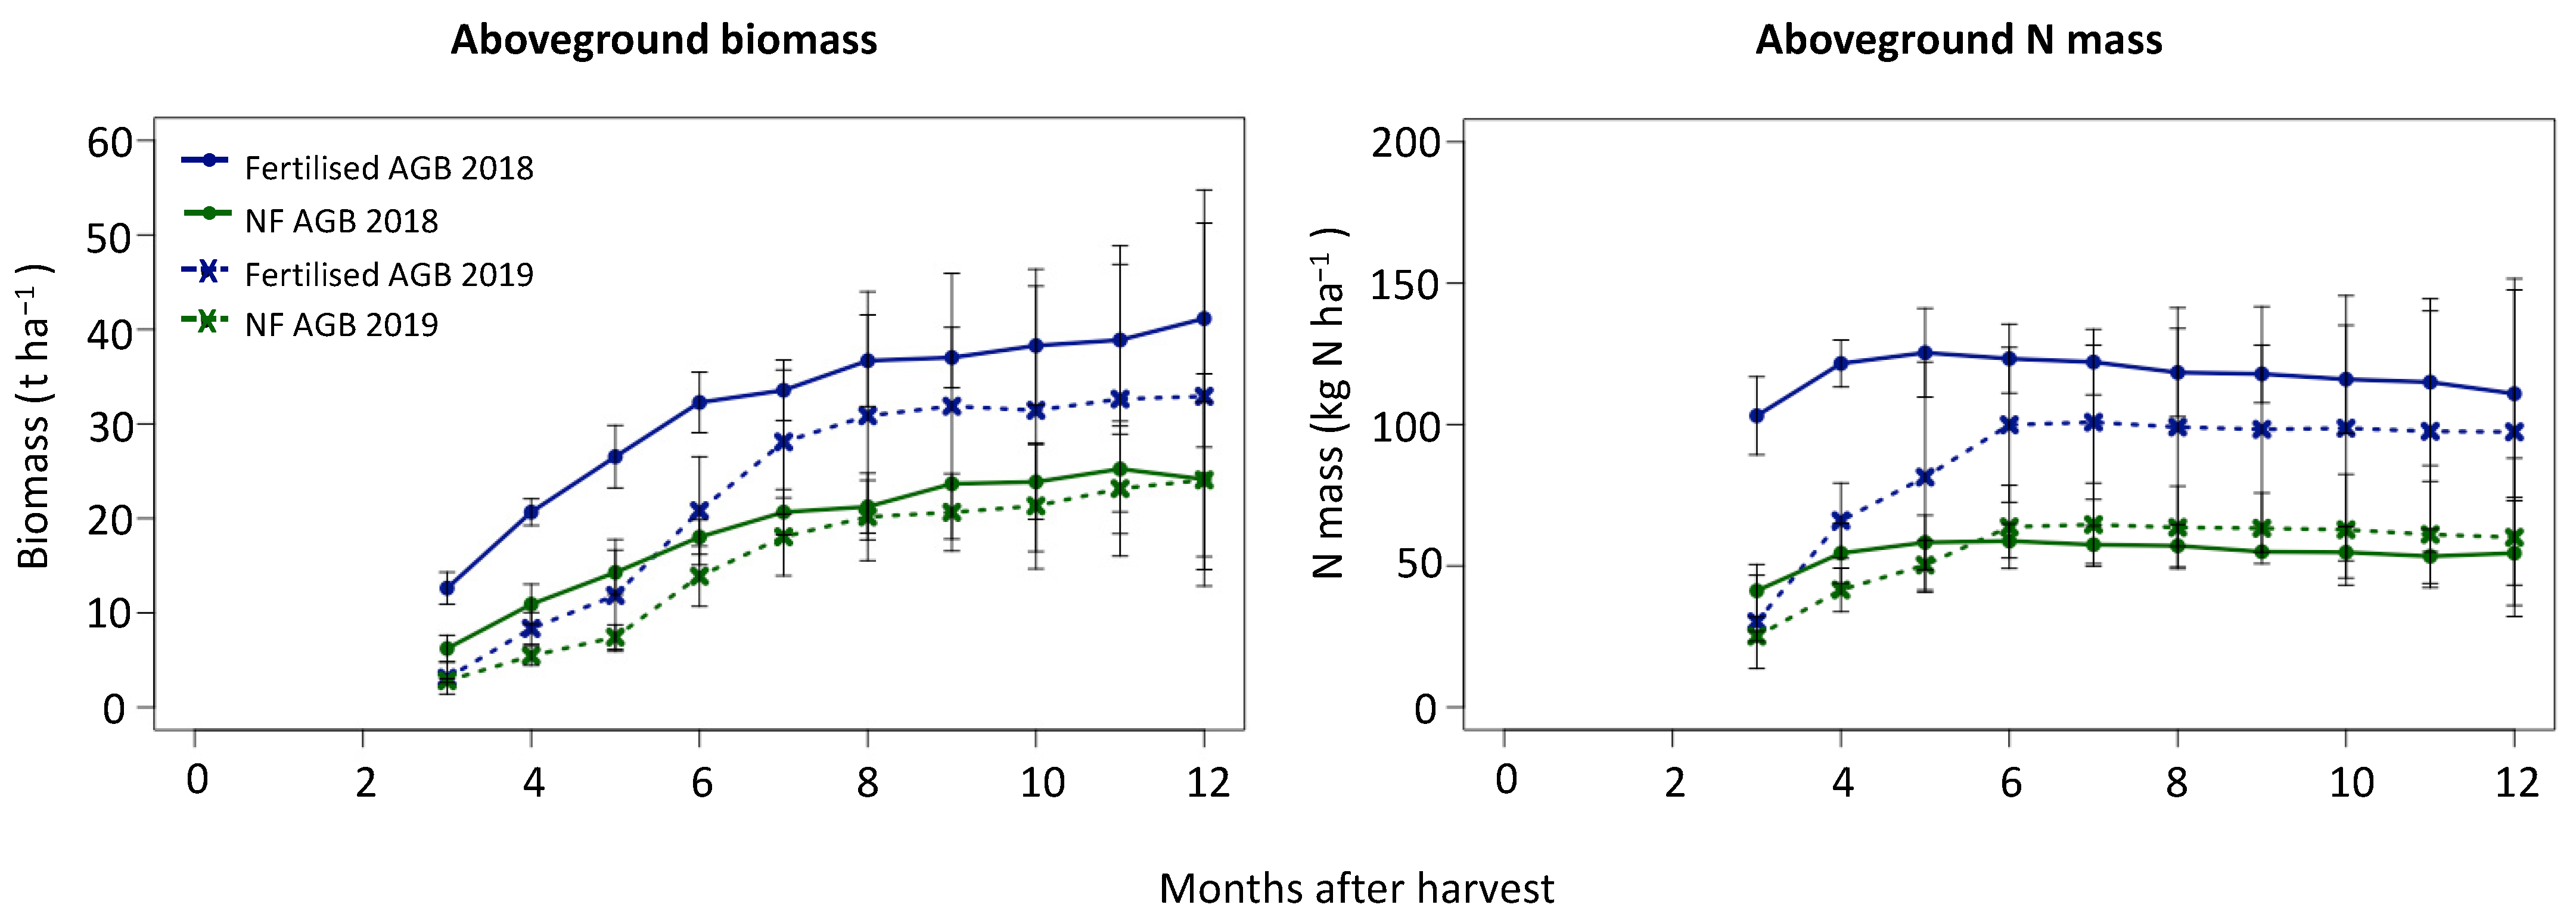
The dry aboveground biomass reached 41.1 t ha−1 and 32.9 t ha−1 for the fertilised treatment, and 24.1 t ha−1 and 24.0 t ha−1 for the unfertilised treatment at the end of the first and second years, respectively (Figure 1). The aboveground N mass was approximately double for the fertilised compared to the unfertilised treatments over the first year, and approximately 1.5 times greater over the second year, on average (Figure 1). The final N mass was higher for the second experimental year than the first, and there was a lag in the N uptake over the second year. The fertilised treatment reached an N mass of 110.9 kg N ha−1 and 97.4 kg N ha−1, and the unfertilised treatment 54.5 kg N ha−1 and 60.2 kg N ha−1, at the end of the first and second years, respectively. There was a steep gradient in N mass accumulation until 5 and 6 months over the first and second years for the fertilised treatment, indicating the active N uptake period. This occurred until 5 months for the unfertilised treatment.
3.2. Tiller Biomass Component
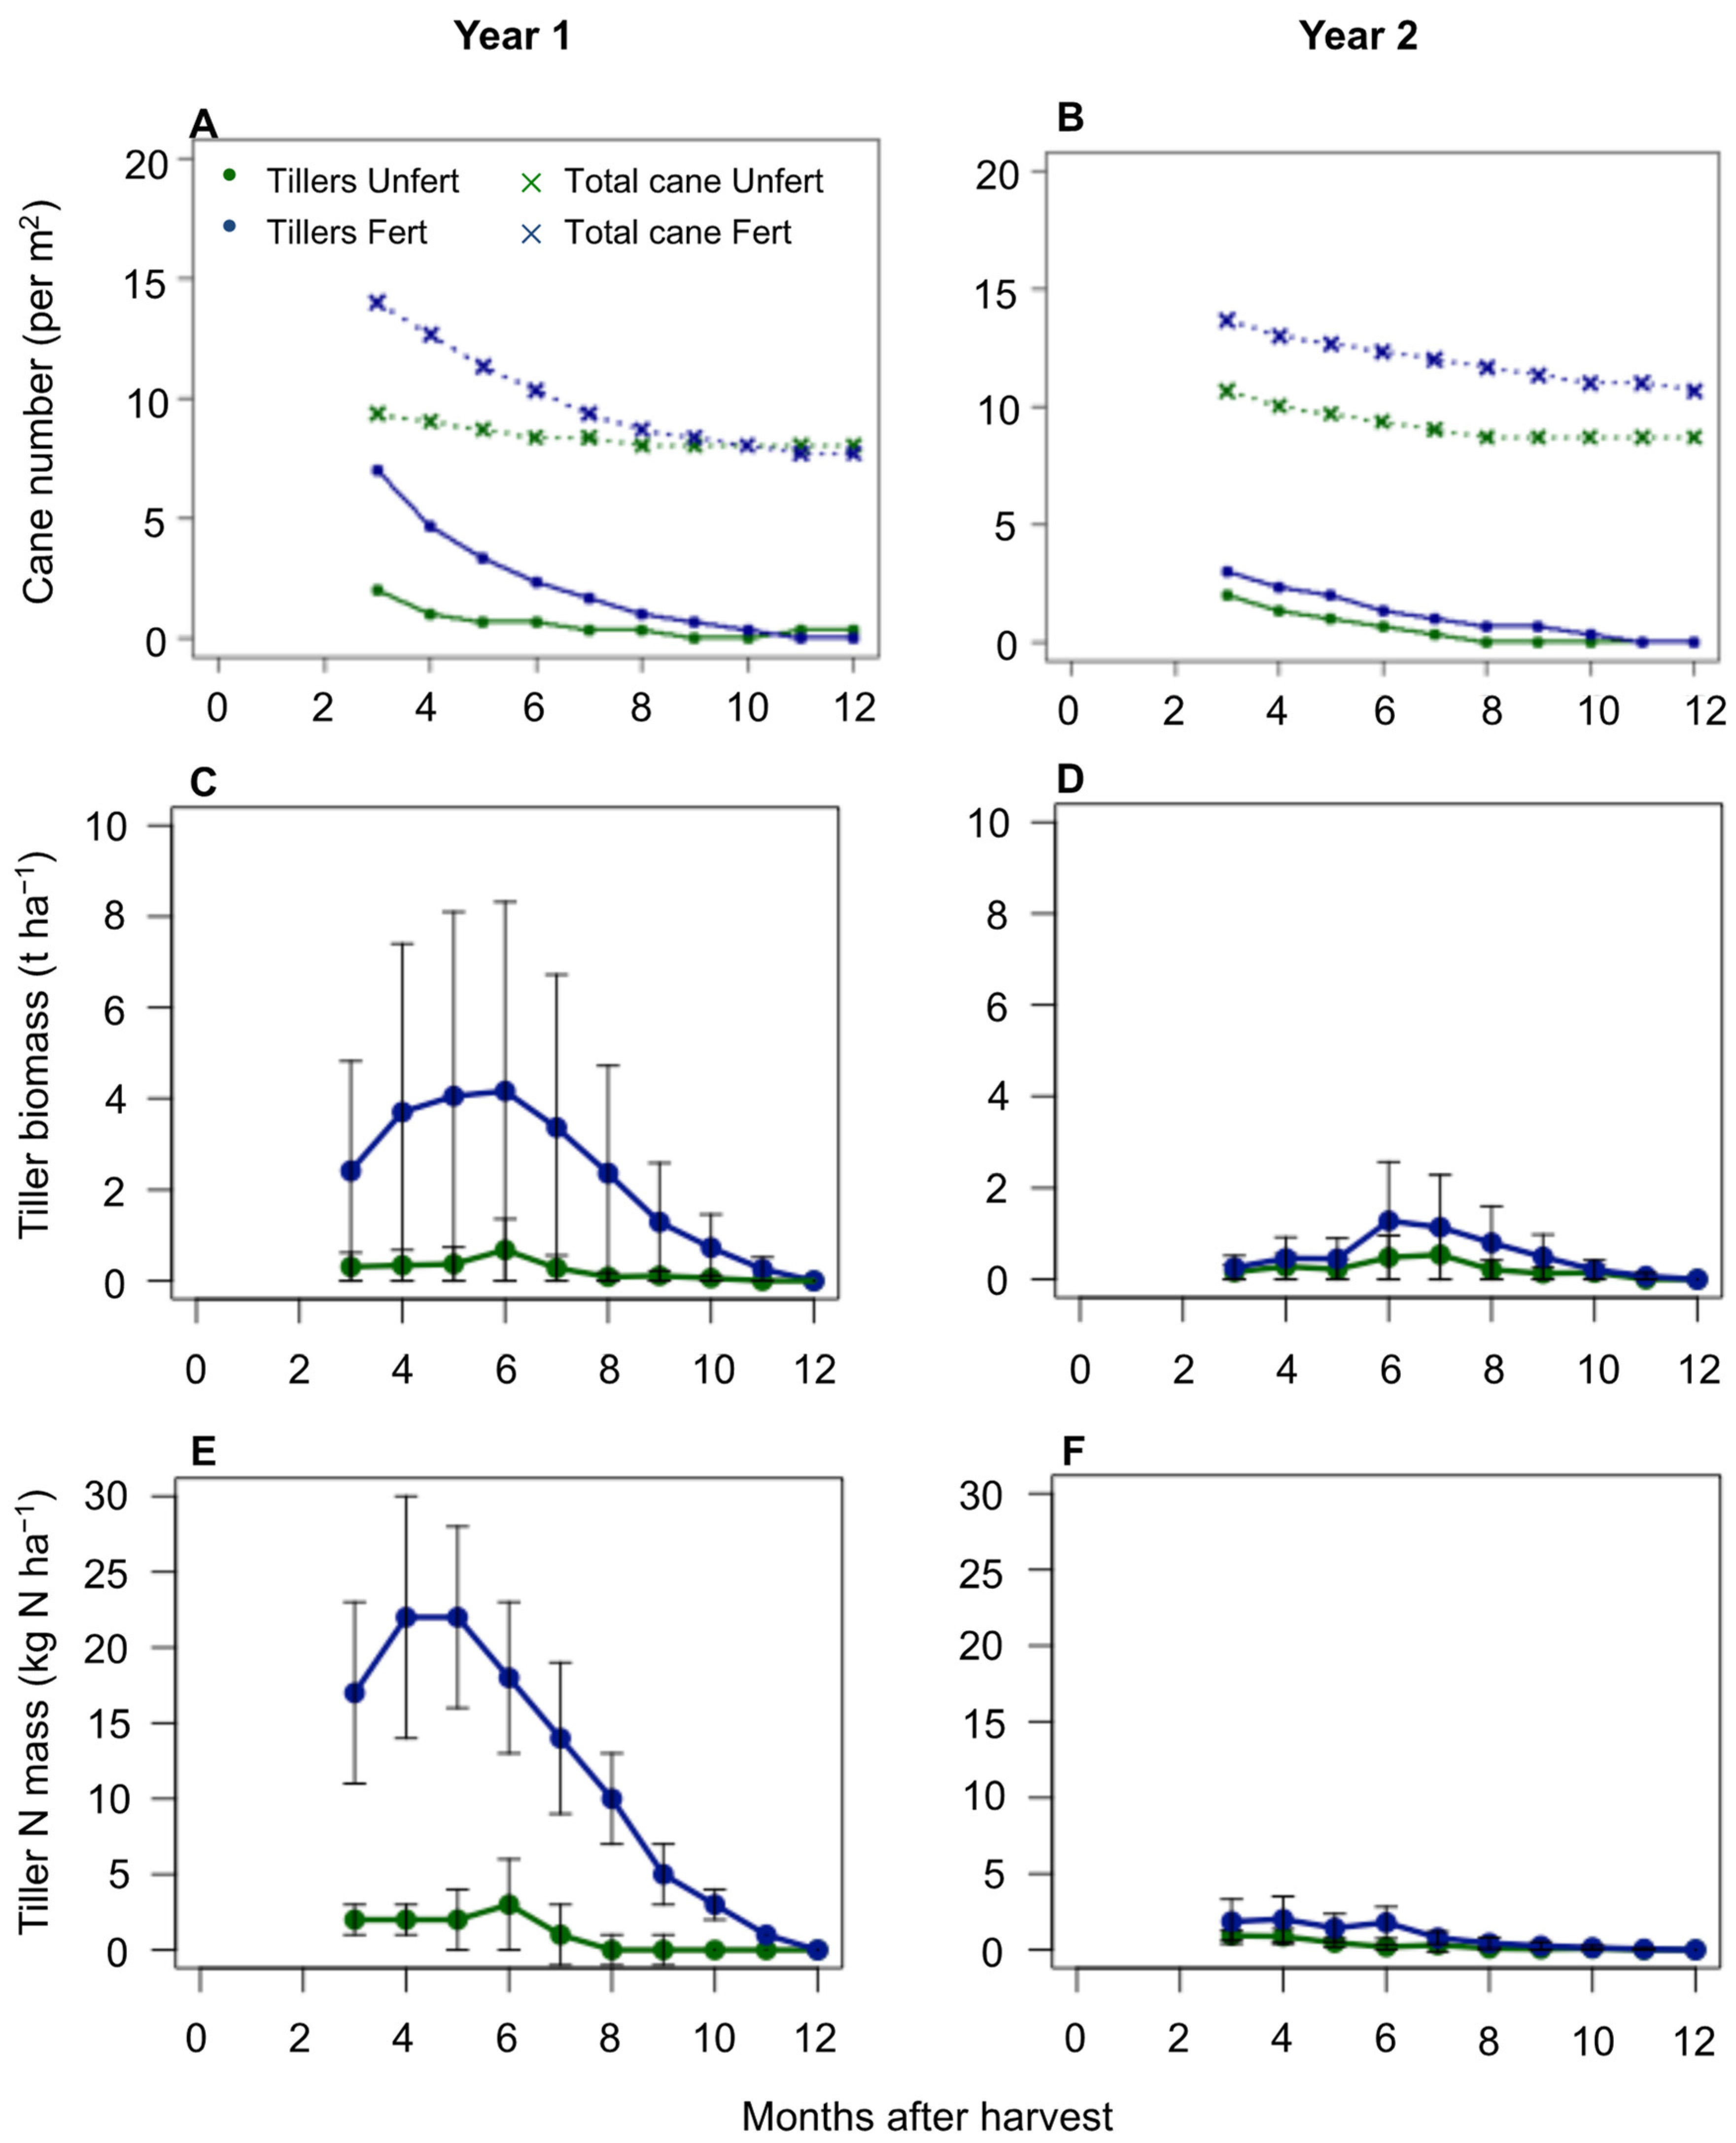
There were more tillers over the first experimental year than the second experimental year for the fertilised treatment, but a similar number for the unfertilised treatment (Figure 2). At 3 months after the start of the ratoon, there were six and three tillers per metre squared for the fertilised treatment, and two tillers per metre squared for the unfertilised treatment which did not survive to the following harvest, for the first and second experimental years, respectively.
The tiller biomass and N mass were therefore also higher for the fertilised treatment over the first experimental year than the second, with the peak difference between 3 and 8 months after the start of the ratoon. The fertilised treatment had an average tiller dry biomass of 4.2 t ha−1 and 1.3 t ha−1, and the unfertilised treatment 0.7 t ha−1 and 0.5 t ha−1 at 6 months after the start of each of the ratoons. The tiller N mass followed a similar trend to that of the biomass over the two experimental years. At 3 months after the start of the ratoon, the fertilised treatment tillers had an average N mass of 16.8 kg N ha−1 and 1.9 kg N ha−1, peaking at 4 months with an N mass of 21.8 kg N ha−1 and 2.0 kg N ha−1, and decreasing thereafter until the final harvest.
3.3. Strawfall Biomass Component
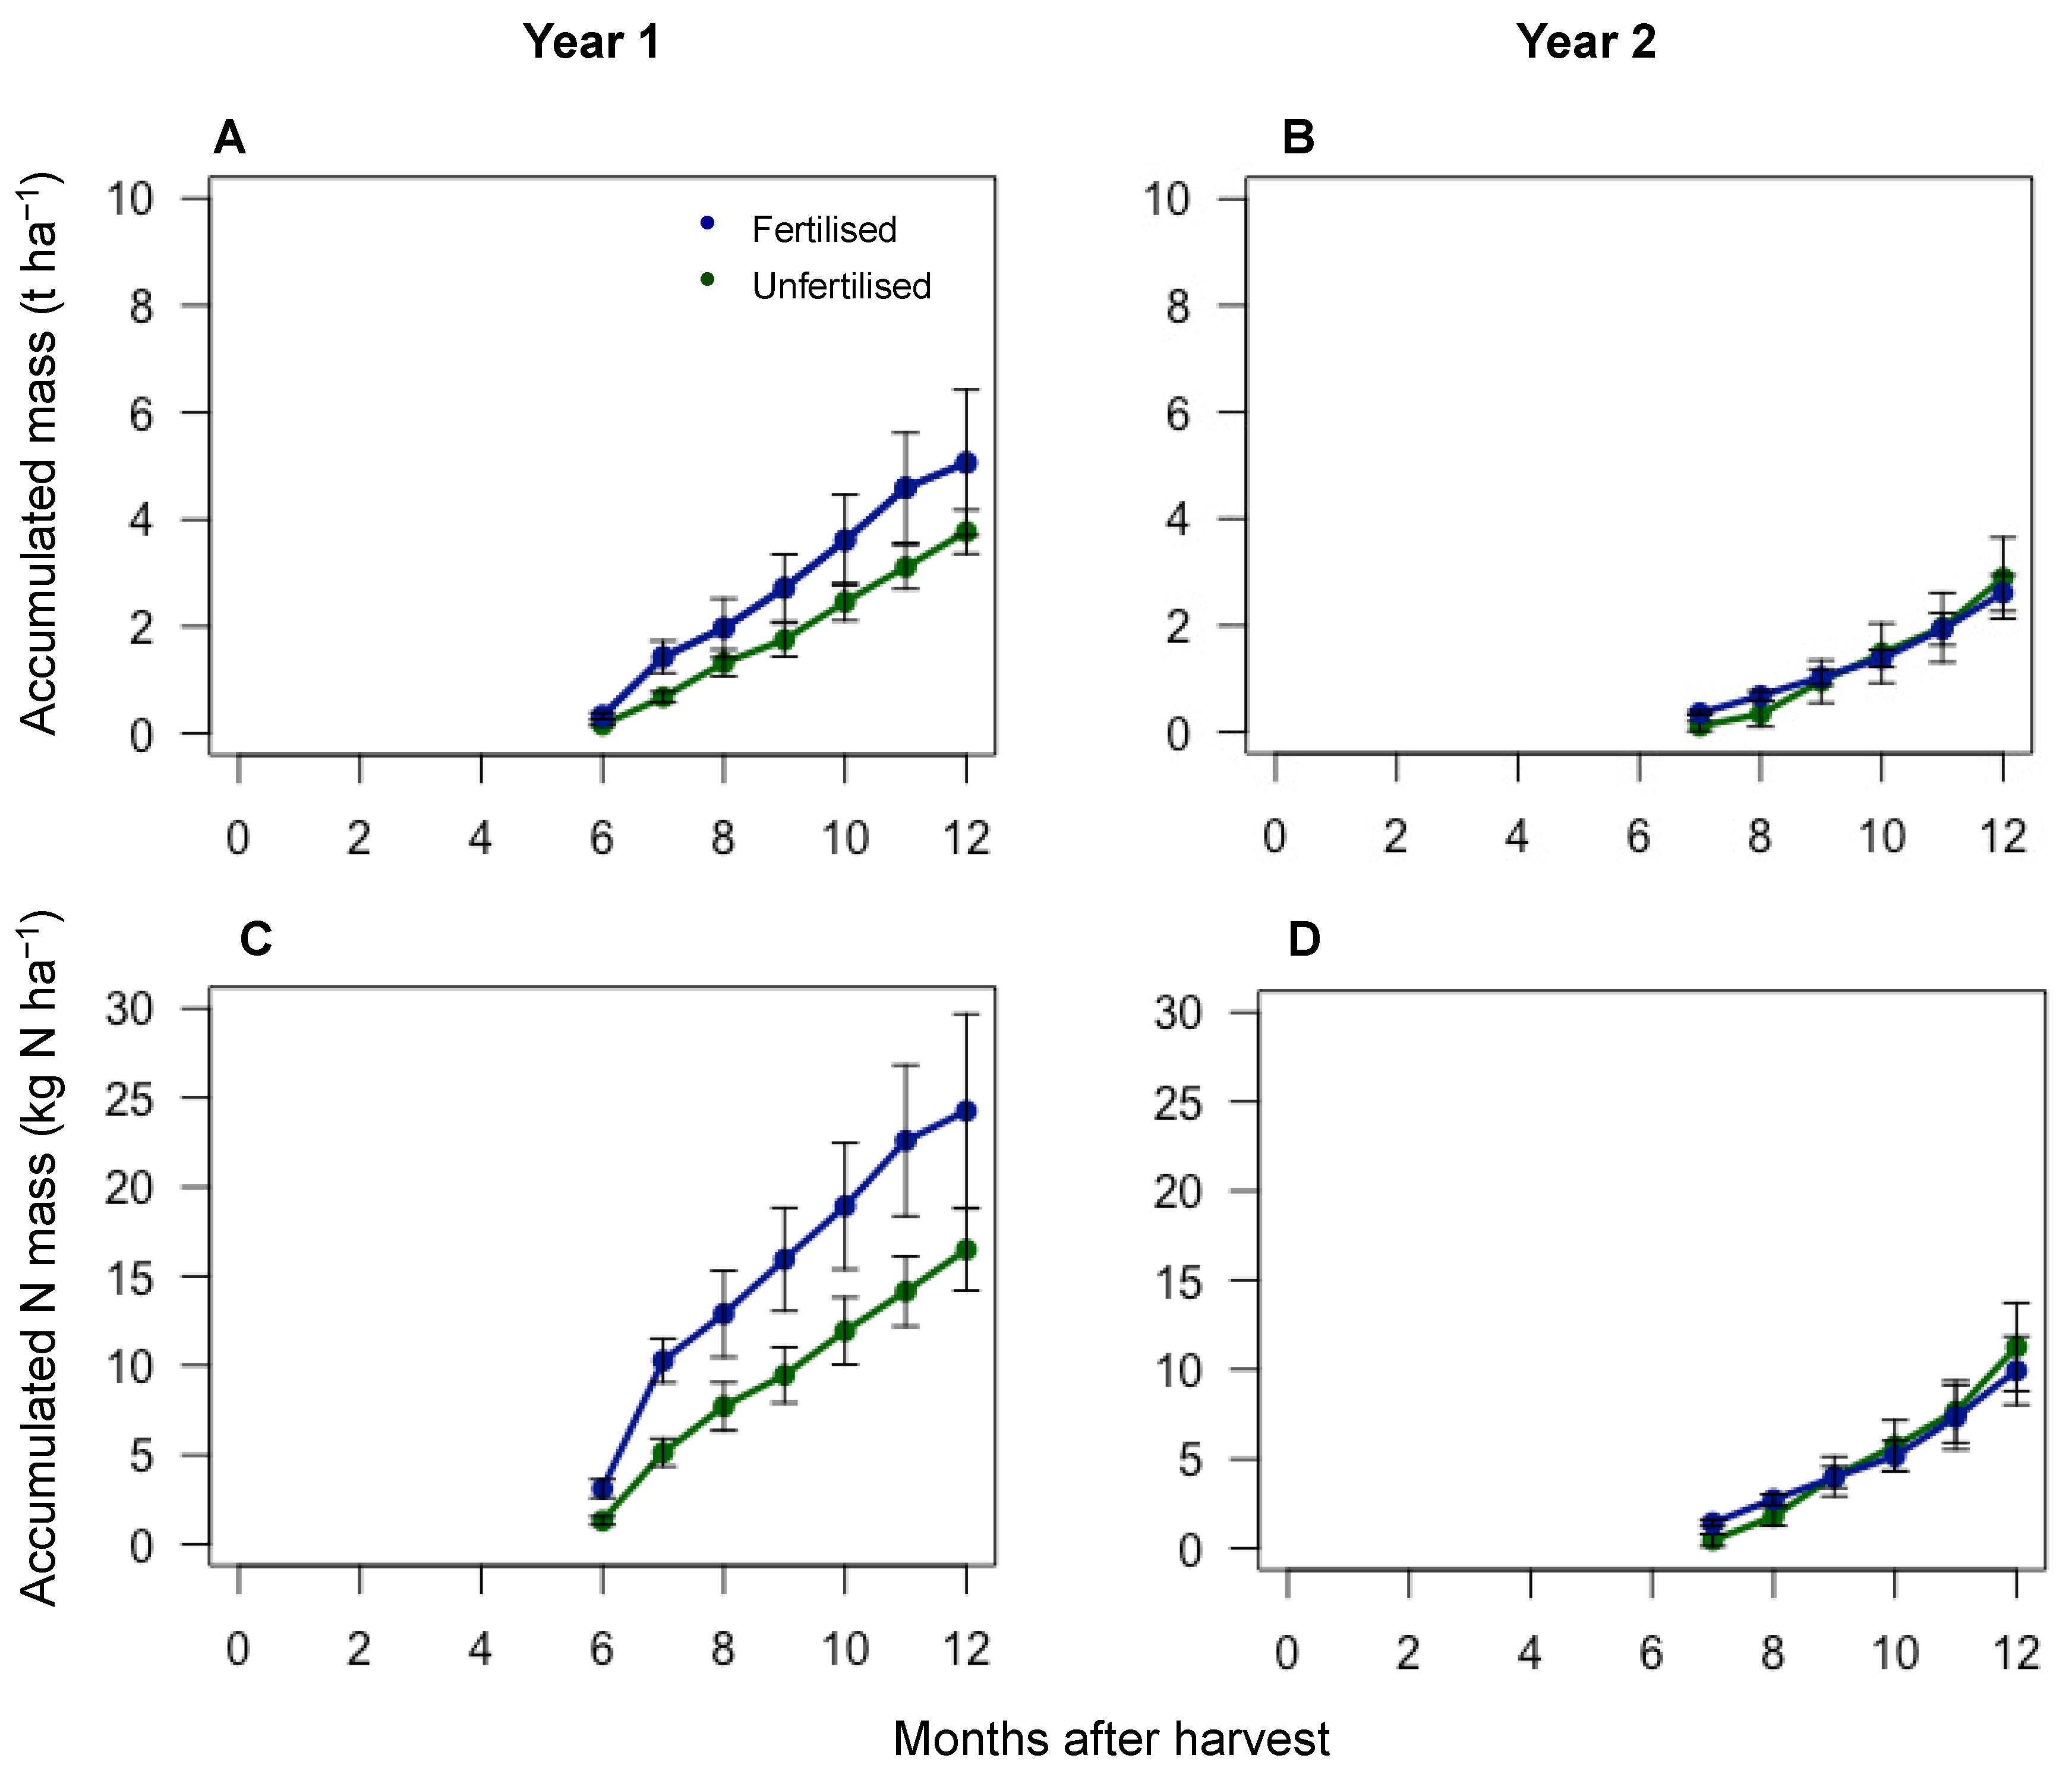
The strawfall began to fall from the sugarcane shoots at 6 and 7 months after the start of the first and second years, respectively. The accumulated strawfall biomass was higher for both the fertilised and unfertilised treatments over the first experimental year than the second (Figure 3). The accumulated strawfall for the fertilised treatment was 5.0 t ha−1 and 2.6 t ha−1 for the fertilised treatment and 3.8 t ha−1 and 2.9 t ha−1 for the unfertilised treatment, at the end of the first and second experimental years, respectively. The N mass was also higher over the first year than the second. The strawfall N mass reached 24.2 kg N ha−1 and 9.9 kg N ha−1 at 12 months for the fertilised treatment, and 16.5 kg N ha−1 and 11.2 kg N ha−1 at 12 months for the unfertilised treatment, at the end of the first and second years, respectively.
3.4. Belowground Biomass Component
The root biomass at final harvest was similar at the end of the first and second experimental years, with dry masses of 9.2 t ha−1 and 10.9 t ha−1, respectively (Table 1). Roots were harvested from the unfertilised treatment only at the end of the second experimental year, and had a dry biomass of 12.8 t ha−1, which was higher than the fertilised treatment. The root N mass was similar for the fertilised treatment at the final harvest of both experimental years, being 57.7 kg N ha−1 and 55.5 kg N ha−1, respectively. The N mass was 61.2 kg N ha−1 for the unfertilised treatment at the end of the second experimental year, which was higher than the fertilised treatment.
The sugarcane stool (or rhizome) was only harvested at final harvest at the end of the second experimental year. The stool component contributed less to the belowground biomass than the roots, but still had a substantial contribution of 2.5 t ha−1 and 3.8 t ha−1 in the fertilised and unfertilised treatments, respectively. This corresponded to a substantial N mass (although again lower than the roots) of 20.8 kg N ha−1 and 17.5 kg N ha−1 for the fertilised and unfertilised treatments, respectively.
3.5. Total Nitrogen Mass for Different Sugarcane Components
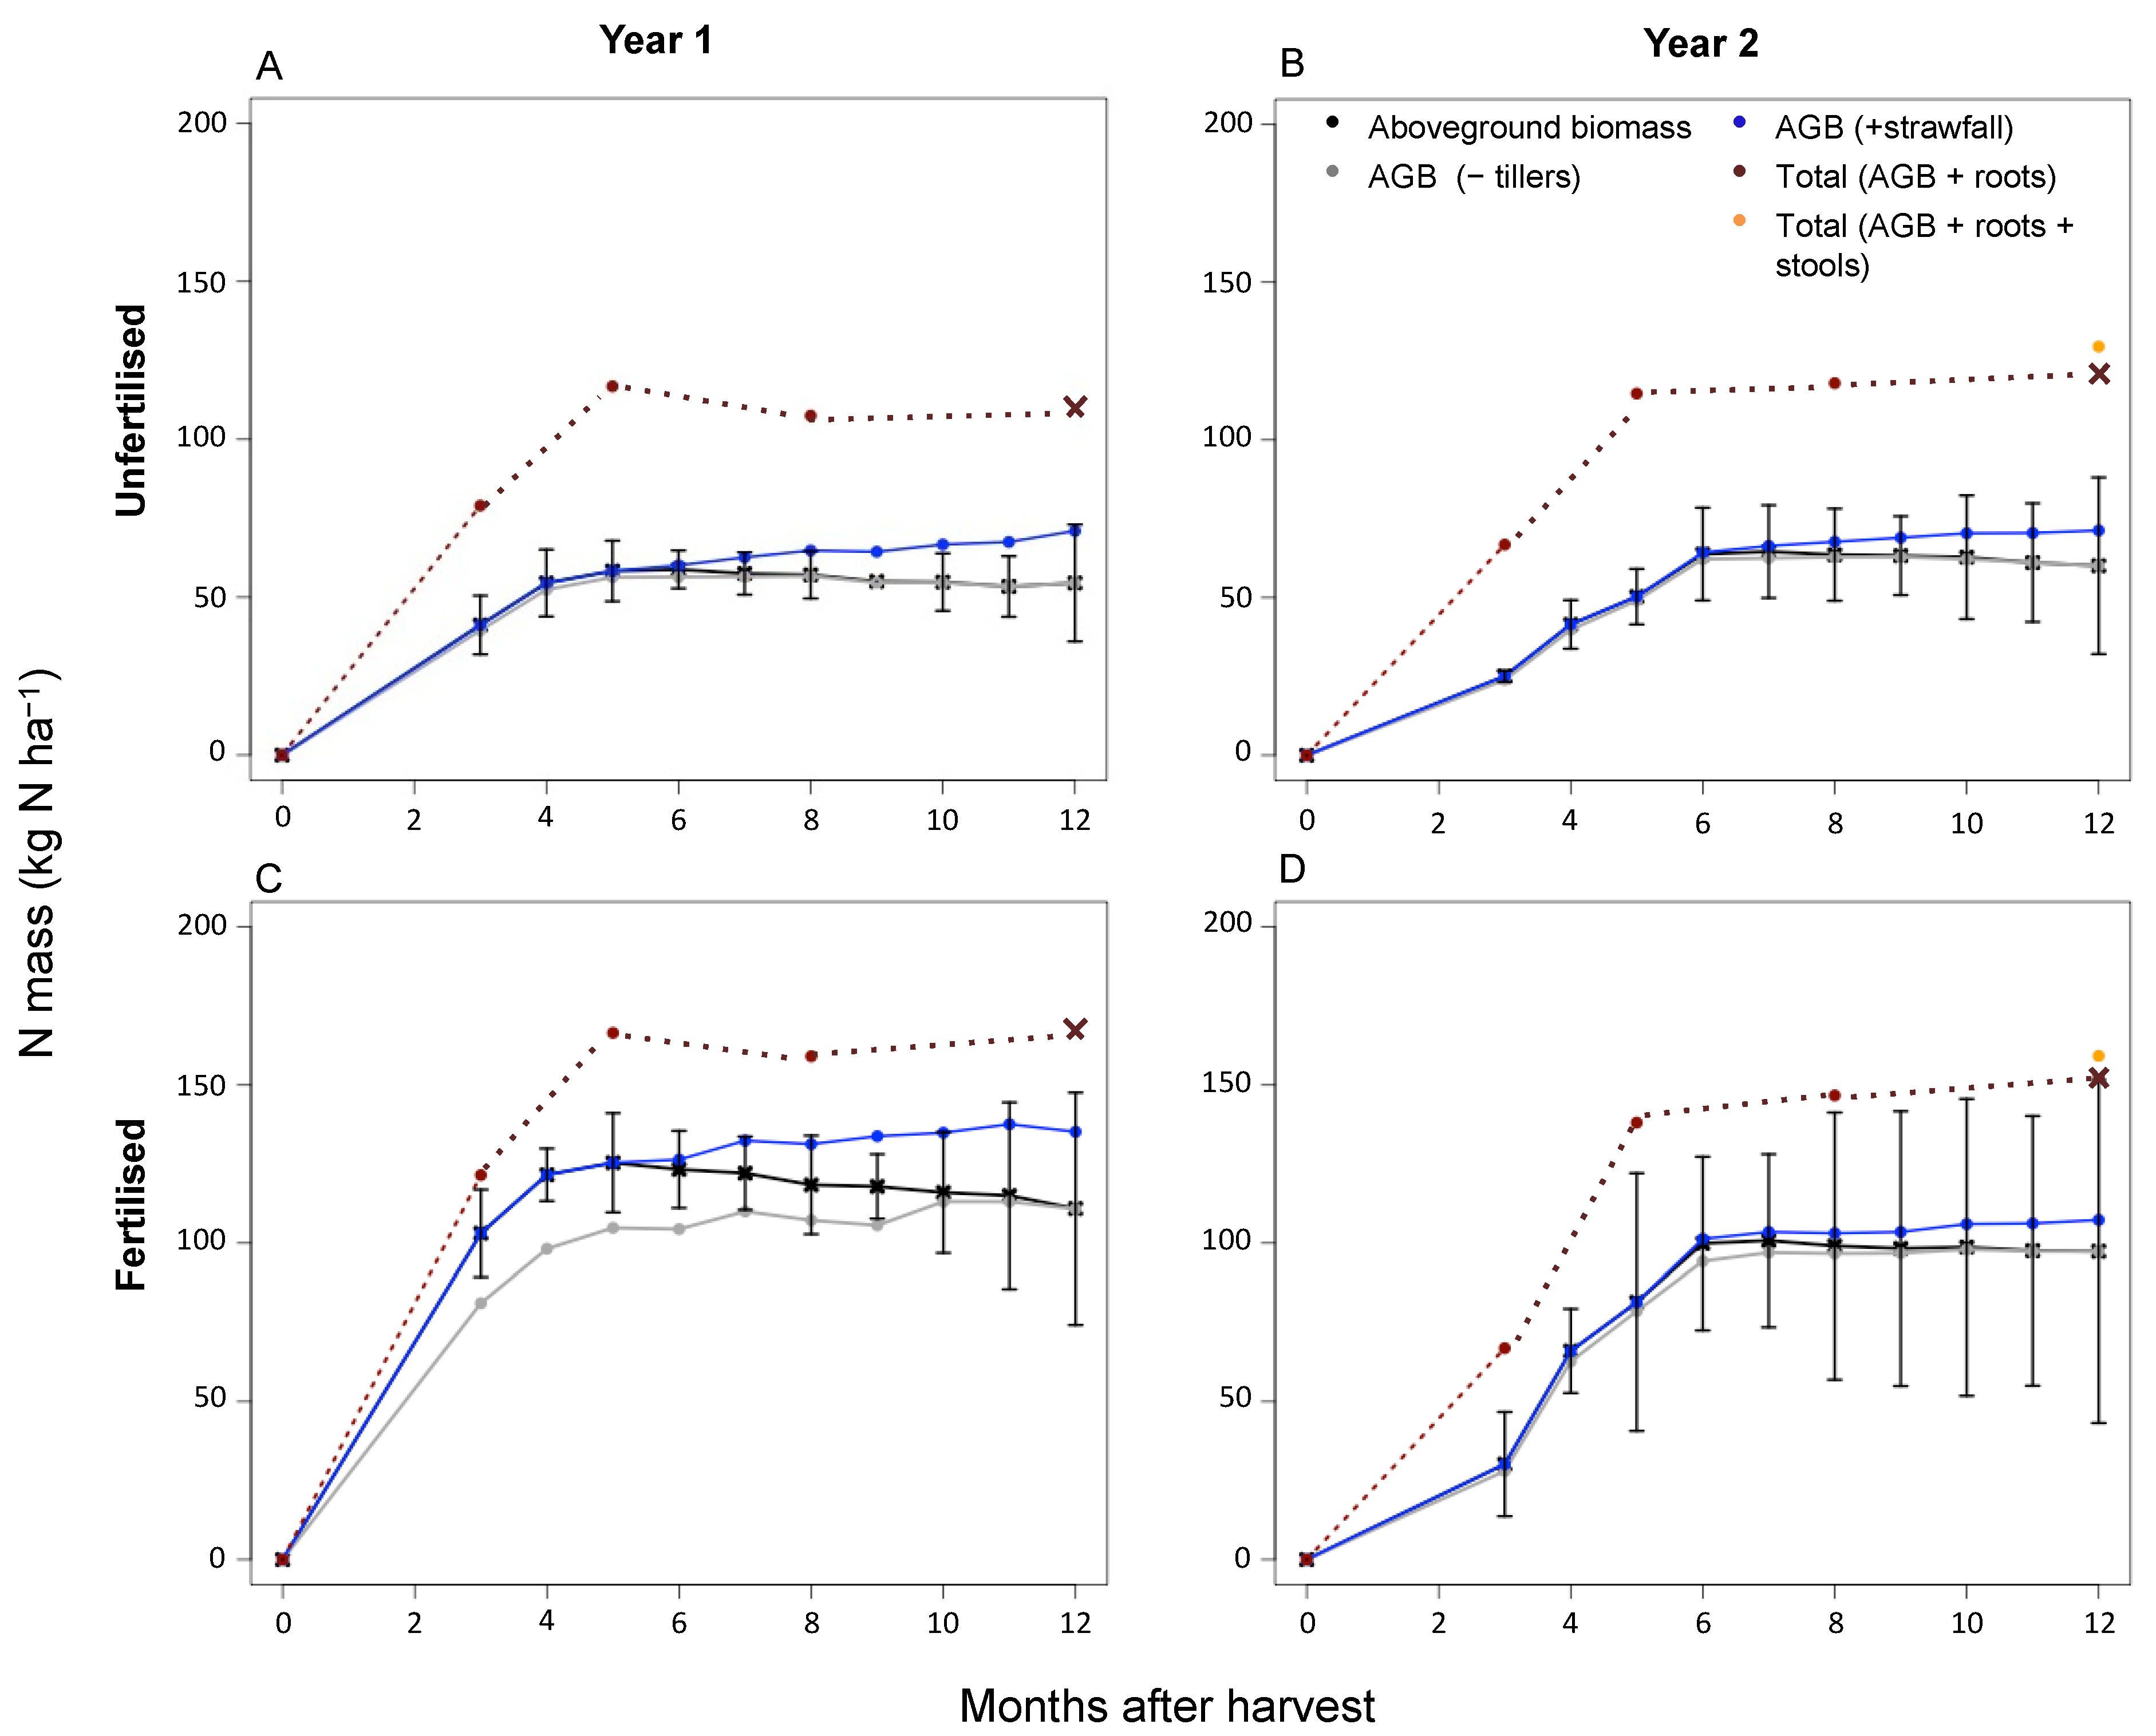
The evolution of the total N mass of the sugarcane changed when the various biomass components were included over each sugarcane growth cycle (Figure 4). The tiller and strawfall components had a larger impact over the first year than the second. When the tiller component was included, the sugarcane N mass decreased by 12 kg ha−1 and 3 kg ha−1 for the fertilised treatment, and by 1 kg ha−1 for the first and second years, respectively. When strawfall was added, the sugarcane total N mass increased progressively from 6 months until harvest, with an N mass increase of 15 kg ha−1 and 3 kg ha−1 for the fertilised treatment, and 10 kg ha−1 and 3 kg ha−1 for the unfertilised treatment, at the end of the first and second years, respectively.
The sugarcane biomass increased substantially over both experimental years when root biomass was considered (Figure 4). The total sugarcane biomass increased by 9.2 t ha−1 (a factor of 1.5) and 10.9 t ha−1 for the fertilised treatment, at the end of the first and second years, respectively. There was only an unfertilised treatment sampling at the end of the second year, where sugarcane total biomass increased by 12.8 t ha−1. The baseline total N mass was more than double for the fertilised than the unfertilised treatments when the root N mass was added. The total N mass increased by 56.4 kg ha−1 and 55.5 kg ha−1 for the fertilised treatment, at the end of the first and second years, respectively. The total N mass of the unfertilised treatment increased by 61.2 kg ha−1, more than doubling, when root N mass was added at the end of the second year.
3.6. Comparison between N Mass Components
An ANOVA test was used to test the variability of the N mass when the different compartments were considered, and for both the unfertilised and fertilised treatments, there was a significant effect of the biomass N component considered on the N mass (p < 0.01) and time (months after the start of the first experimental year) (p < 0.01). When this was further interrogated using a Tukey HSD test, the significant differences between components (p < 0.01) were specifically between the aboveground biomass and total biomass (when the roots were also considered), for both the unfertilised and fertilised treatments, at each of the measuring dates.
3.7. Fertiliser N Recovery Efficiency
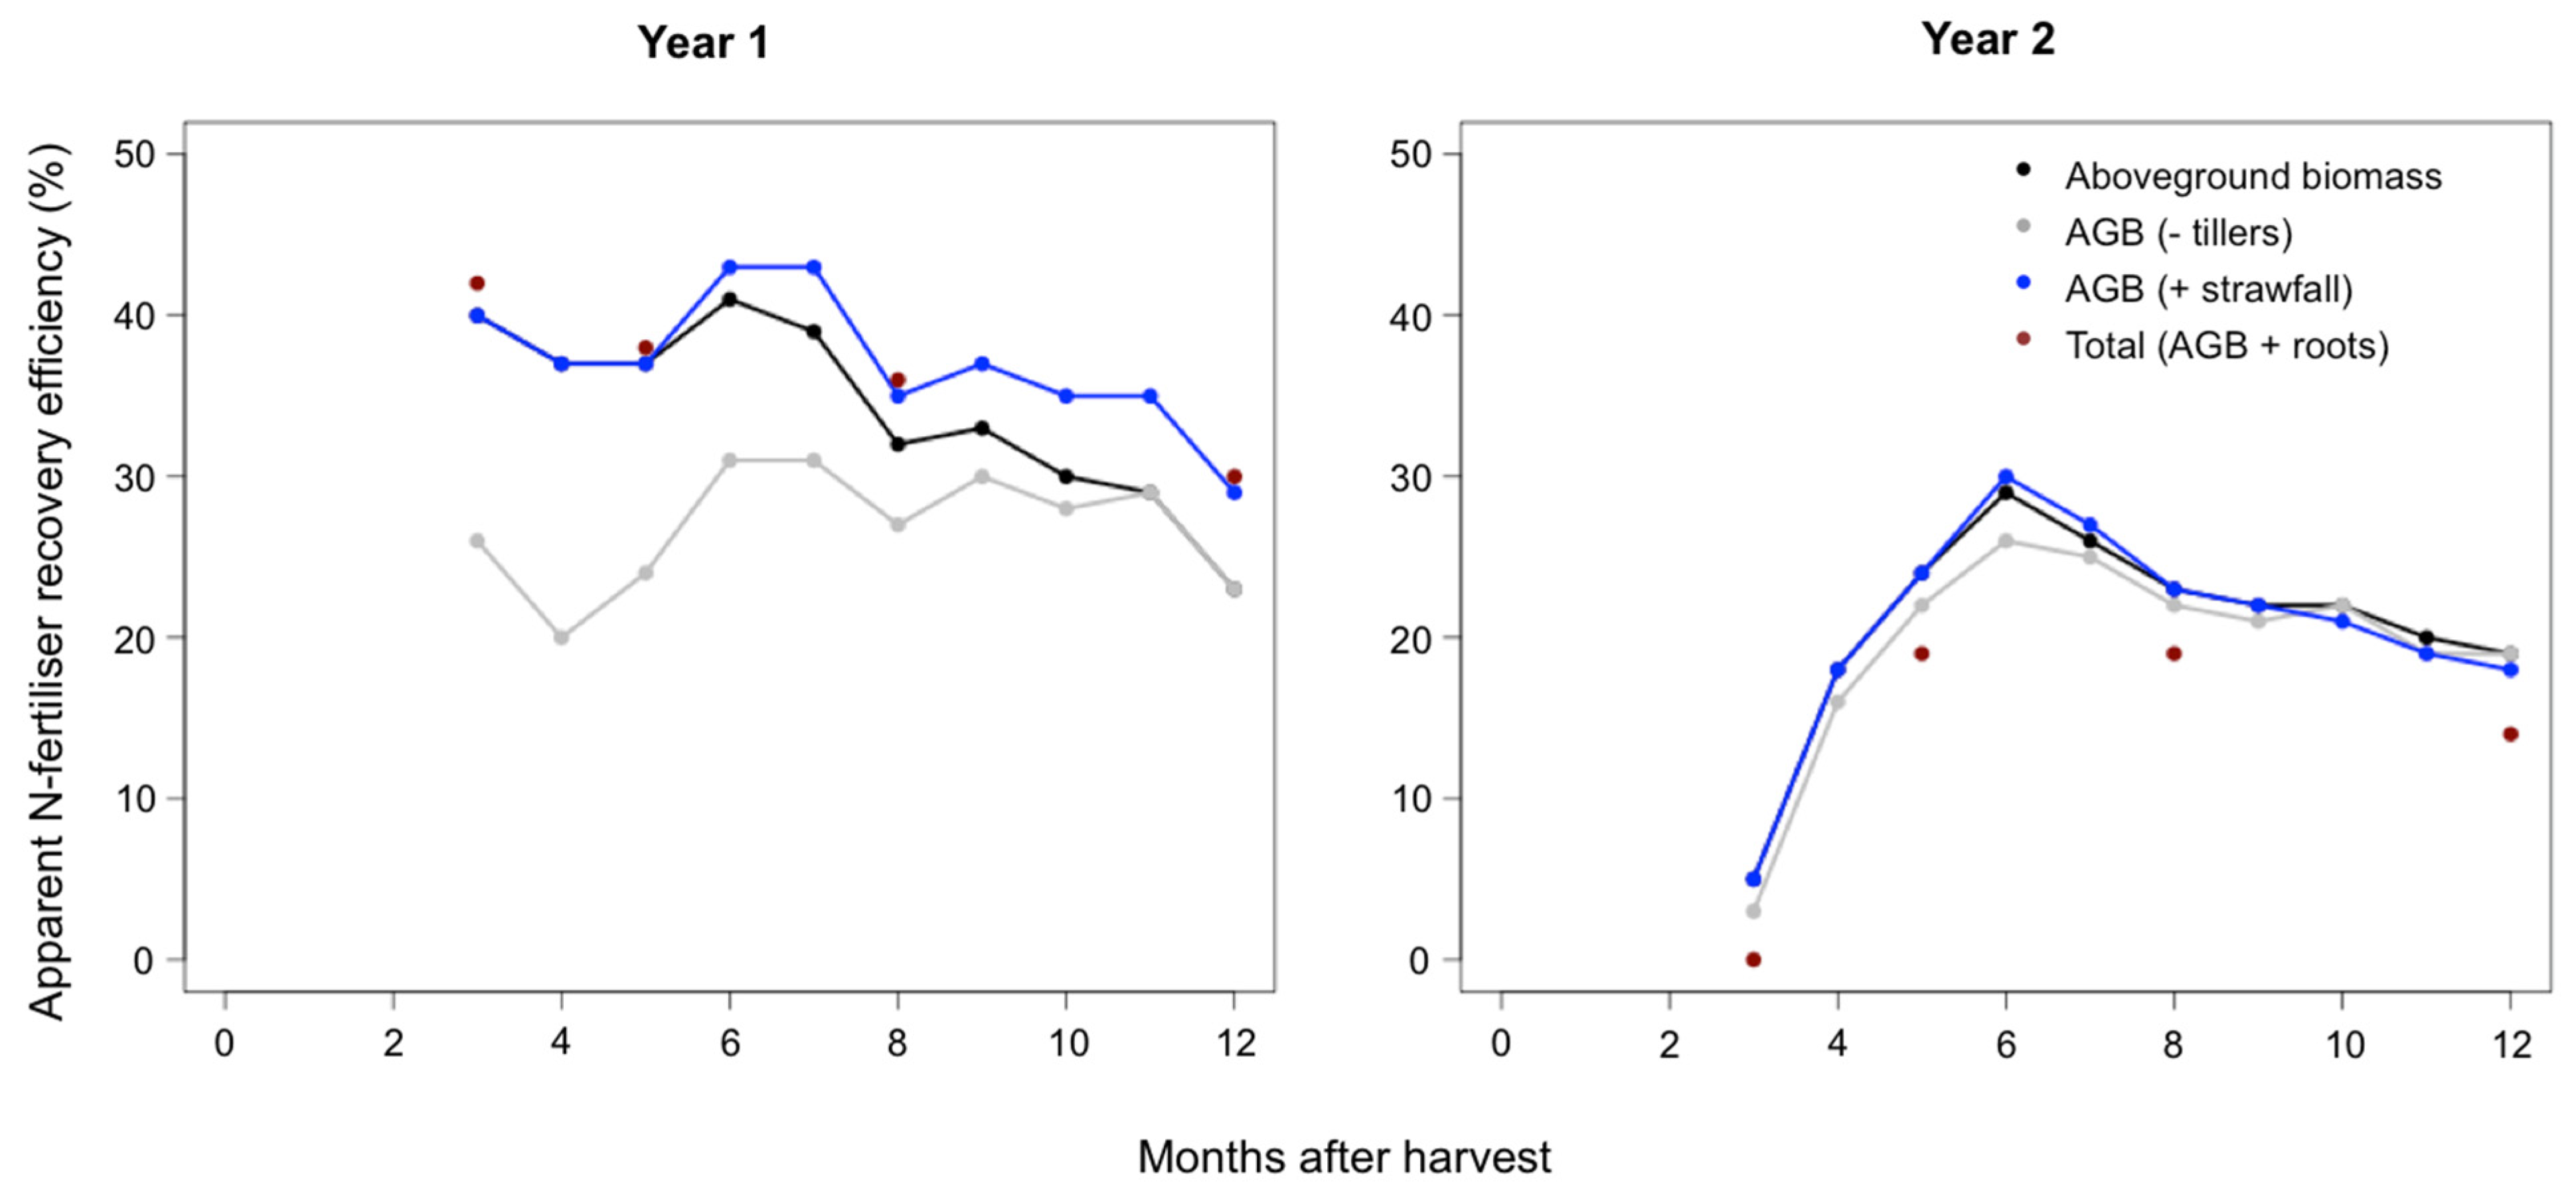
The baseline fertiliser N recovery, when the tiller, strawfall, and belowground biomass components were not considered, was on average 34% over the first experimental year, and 21% over the second experimental year (Figure 5). There was a decrease in the dNRE over the growth cycle of both experimental years. Over the first experimental year, dNRE had a relatively high value of 40.0% at 3 months after the start of the ratoon, remained relatively constant until 7 months, and then declined to 31.9% at 8 months and further to 23.4% at final harvest. Over the second experimental year, the dNRE was 4.6% at 3 months after the start of the ratoon and first fertilisation application, and increased after the second fertilisation to a maximum of 29.1% at 6 months after the start of the ratoon. The dNRE then declined to 18.9% at the final harvest of the second experimental year. When sugarcane stalks were considered over the first experimental year, and the tiller component N mass was removed from the aboveground N mass, the dNRE decreased by a maximum of 14.2% at 3 months and showed an average decrease of 7.1% over the growth cycle. The impact of the tiller component on the dNRE was considerably lower over the second experimental year, with a decrease of 1.1% at 3 months and an average decrease of 0.9% over the growth cycle. When the strawfall component was considered, the NRE increased by 5.4% at the final harvest of the first experimental year, but only by 0.9% at the end of the second experimental year.
When the belowground biomass component was considered, there was an increase in NRE of 6.2% at final harvest over the first experimental year, with an average increase of 3.2% over the growth cycle. Over the second experimental year, there was a decrease of 4.9% at harvest, with an average decrease of 4.3% over the growth cycle.
4. Discussion
The consideration of the typically overlooked sugarcane N mass components has an impact on the accumulation of N mass of sugarcane over the growth cycle, and challenges the traditional perception of sugarcane N uptake essentially being over the first 3–6 months after harvest.
4.1. Overlooked Biomass Components Impact Nitrogen Nutrition Evaluation
Each of the typically overlooked sugarcane components impacted the N mass accumulation, either leading to an increase or decrease in the sugarcane crop N mass. There was a substantial decrease in the number of sugarcane stalks in the fertilised treatment over the early stages of the growth cycle, as a result of tiller senescence. In turn, this led to an overall decrease in the N mass accumulation of the sugarcane over the first 8 months, of up to 15.3% for the fertilised treatment. However, there was a far lower senescence of tillers in the unfertilised treatment, where the N mass accumulation decreased by an average of only 3.0% over the two years.
The first-year trend of tiller senescence for the fertilised sugarcane was coherent with studies such as Bell and Garside [19] and Singels et al. [28], where there was a progressive loss of stalks from 3 months after the start of the ratoon, with a peak loss between 3 and 5 months, until stalk numbers stabilised at or near the number recorded at harvest. The reason that tiller senescence had a larger impact for the fertilised sugarcane than the unfertilised plants was likely as a result of there being a higher stalk number at the start of the growth cycle in the fertilised treatment. This is coherent with the observation that the increased availability of N stimulates tillering in sugarcane [29,30]. Tiller survival depends on shading and competition for light [19,20]. Therefore, the higher initial stalk number in the fertilised treatment typically leads to higher tiller senescence, given the negative relationship between the density of established primary shoots and the number of surviving tillers [19].
The incorporation of the strawfall component of the sugarcane system resulted in an overall increase in the sugarcane N mass, for both the fertilised and unfertilised sugarcane. The total N mass accumulated in the sugarcane increased by 9–18% for the fertilised sugarcane, and 16–23% for the unfertilised sugarcane. This suggests that there is a higher proportion of N uptake by the sugarcane after 6 months of growth until harvest than what is usually calculated. Fertilisation, however, did not further increase the distribution of N to this component of the sugarcane.
The contribution of stools to the sugarcane N mass was considerable, leading to an increase of 6.5% and 13.7% for the fertilised and unfertilised treatments. However, this contribution to N mass remained far lower than that of the roots. The stool N mass was slightly higher in the study by Takeda et al. [6] than ours, with an average N mass of 13.5 kg N ha−1 for a fertiliser N input of 150 kg N ha−1. However, their root N mass was far lower than in our study. It is not clear in the methodology of Takeda et al. [6] if the fine roots surrounding the stool are considered as part of the stool biomass or the root biomass (as in our study), which may partially explain this discrepancy, where there is a higher proportion of N mass considered to be in the roots than in the stool according to our study, and the inverse in their studies.
The estimated root N mass had a large impact on sugarcane N nutrition evaluation. Considering this component led to a very considerable increase in the total crop biomass and N mass over the two sugarcane growth cycles. The N mass of the roots comprised approximately two thirds (65%) and half (57%) of the N mass of the aboveground sugarcane N mass at the final harvest for the fertilised treatment, and therefore increased the total sugarcane N mass by these proportions at the end of the first and second years, respectively. This was higher for the unfertilised treatment, where the root N mass was approximately equal (104%) to, and three quarters of (74%), the aboveground N at the final harvest. This was consistent with Versini et al. [17], where for the same experimental site as our study (but the third ratoon), the N mass in the roots accounted for 70% of the N mass of the aboveground component for the fertilised treatment, and between 67% and 54% of the N mass of the aboveground component at another experimental site for two fertiliser doses, slightly lower (99 kg N ha−1) and higher (165 kg N ha−1) than the fertiliser application dose for our experimental site. However, the study by Vieira-Megda et al. [31] had a far lower proportion of root N mass, which accounted for only 7–19% of the shoot N mass at harvest at an experimental site in Brazil. The root N mass in the study by Takeda et al. [6] was far lower than in our study, 3.7 kg N ha−1 for a fertiliser N input of 150 kg N ha−1. This may be as a result of the aforementioned discrepancy, where the fine roots may have been classified as contributing to the stool component rather than the root biomass.
The evaluation of these frequently overlooked sugarcane biomass components can therefore lead to a more complete understanding of N nutrition in sugarcane.
4.2. Revisiting N Uptake over the Sugarcane Growth Cycle
When the mostly overlooked sugarcane biomass components are considered, the traditional interpretation of sugarcane N mass accumulation, and therefore of sugarcane N uptake over the growth cycle, is challenged.
The final sugarcane aboveground biomass, when the additional biomass components are not considered, has an accumulated N mass at the end of the growth cycle which is within the range of values from a number of sugarcane plantations documented in Australia and Brazil, which range between 66 kg N ha−1 and 190 kg N ha−1 for fertilised plantations [6,32,33,34,35]. These studies only report N mass values of the aboveground sugarcane biomass, without evaluating strawfall or tillers. When the tiller and strawfall components are considered in our study, there is an overall increase in the sugarcane N mass.
The active N uptake period is where the gradient of N mass accumulation is at its greatest, and thereafter the N mass accumulation reaches a plateau, implying a far lower rate of N mass accumulation. When the baseline sugarcane N mass (without the typically overlooked components) was considered, the active N uptake period was between 3 and 6 months after the start of the ratoon for the two experimental years in our study. This is the period typically believed to be when the sugarcane actively takes up N, and is in a coherent range of values with studies such as Ng Kee Kwong and Deville [8], Wood et al. [14], and Franco et al. [35], where the active N uptake occurred up to between 5 and 7 months after the start of the ratoon.
However, when the tiller and strawfall components were considered in our study, there was a more gradual and progressive accumulation of N mass over the sugarcane growth cycle. The tiller senescence resulted in a more progressive slope and N uptake period over the first 6–8 months. The strawfall component resulted in an increased N mass from 6 months to the end of the growth cycle. This suggests that sugarcane N demands do not necessarily cease after 3–6 months, which previously was perceived to be the important period of sugarcane N uptake. This may still be the period of “most active” N uptake, but the N accumulation does appear to continue after this period.
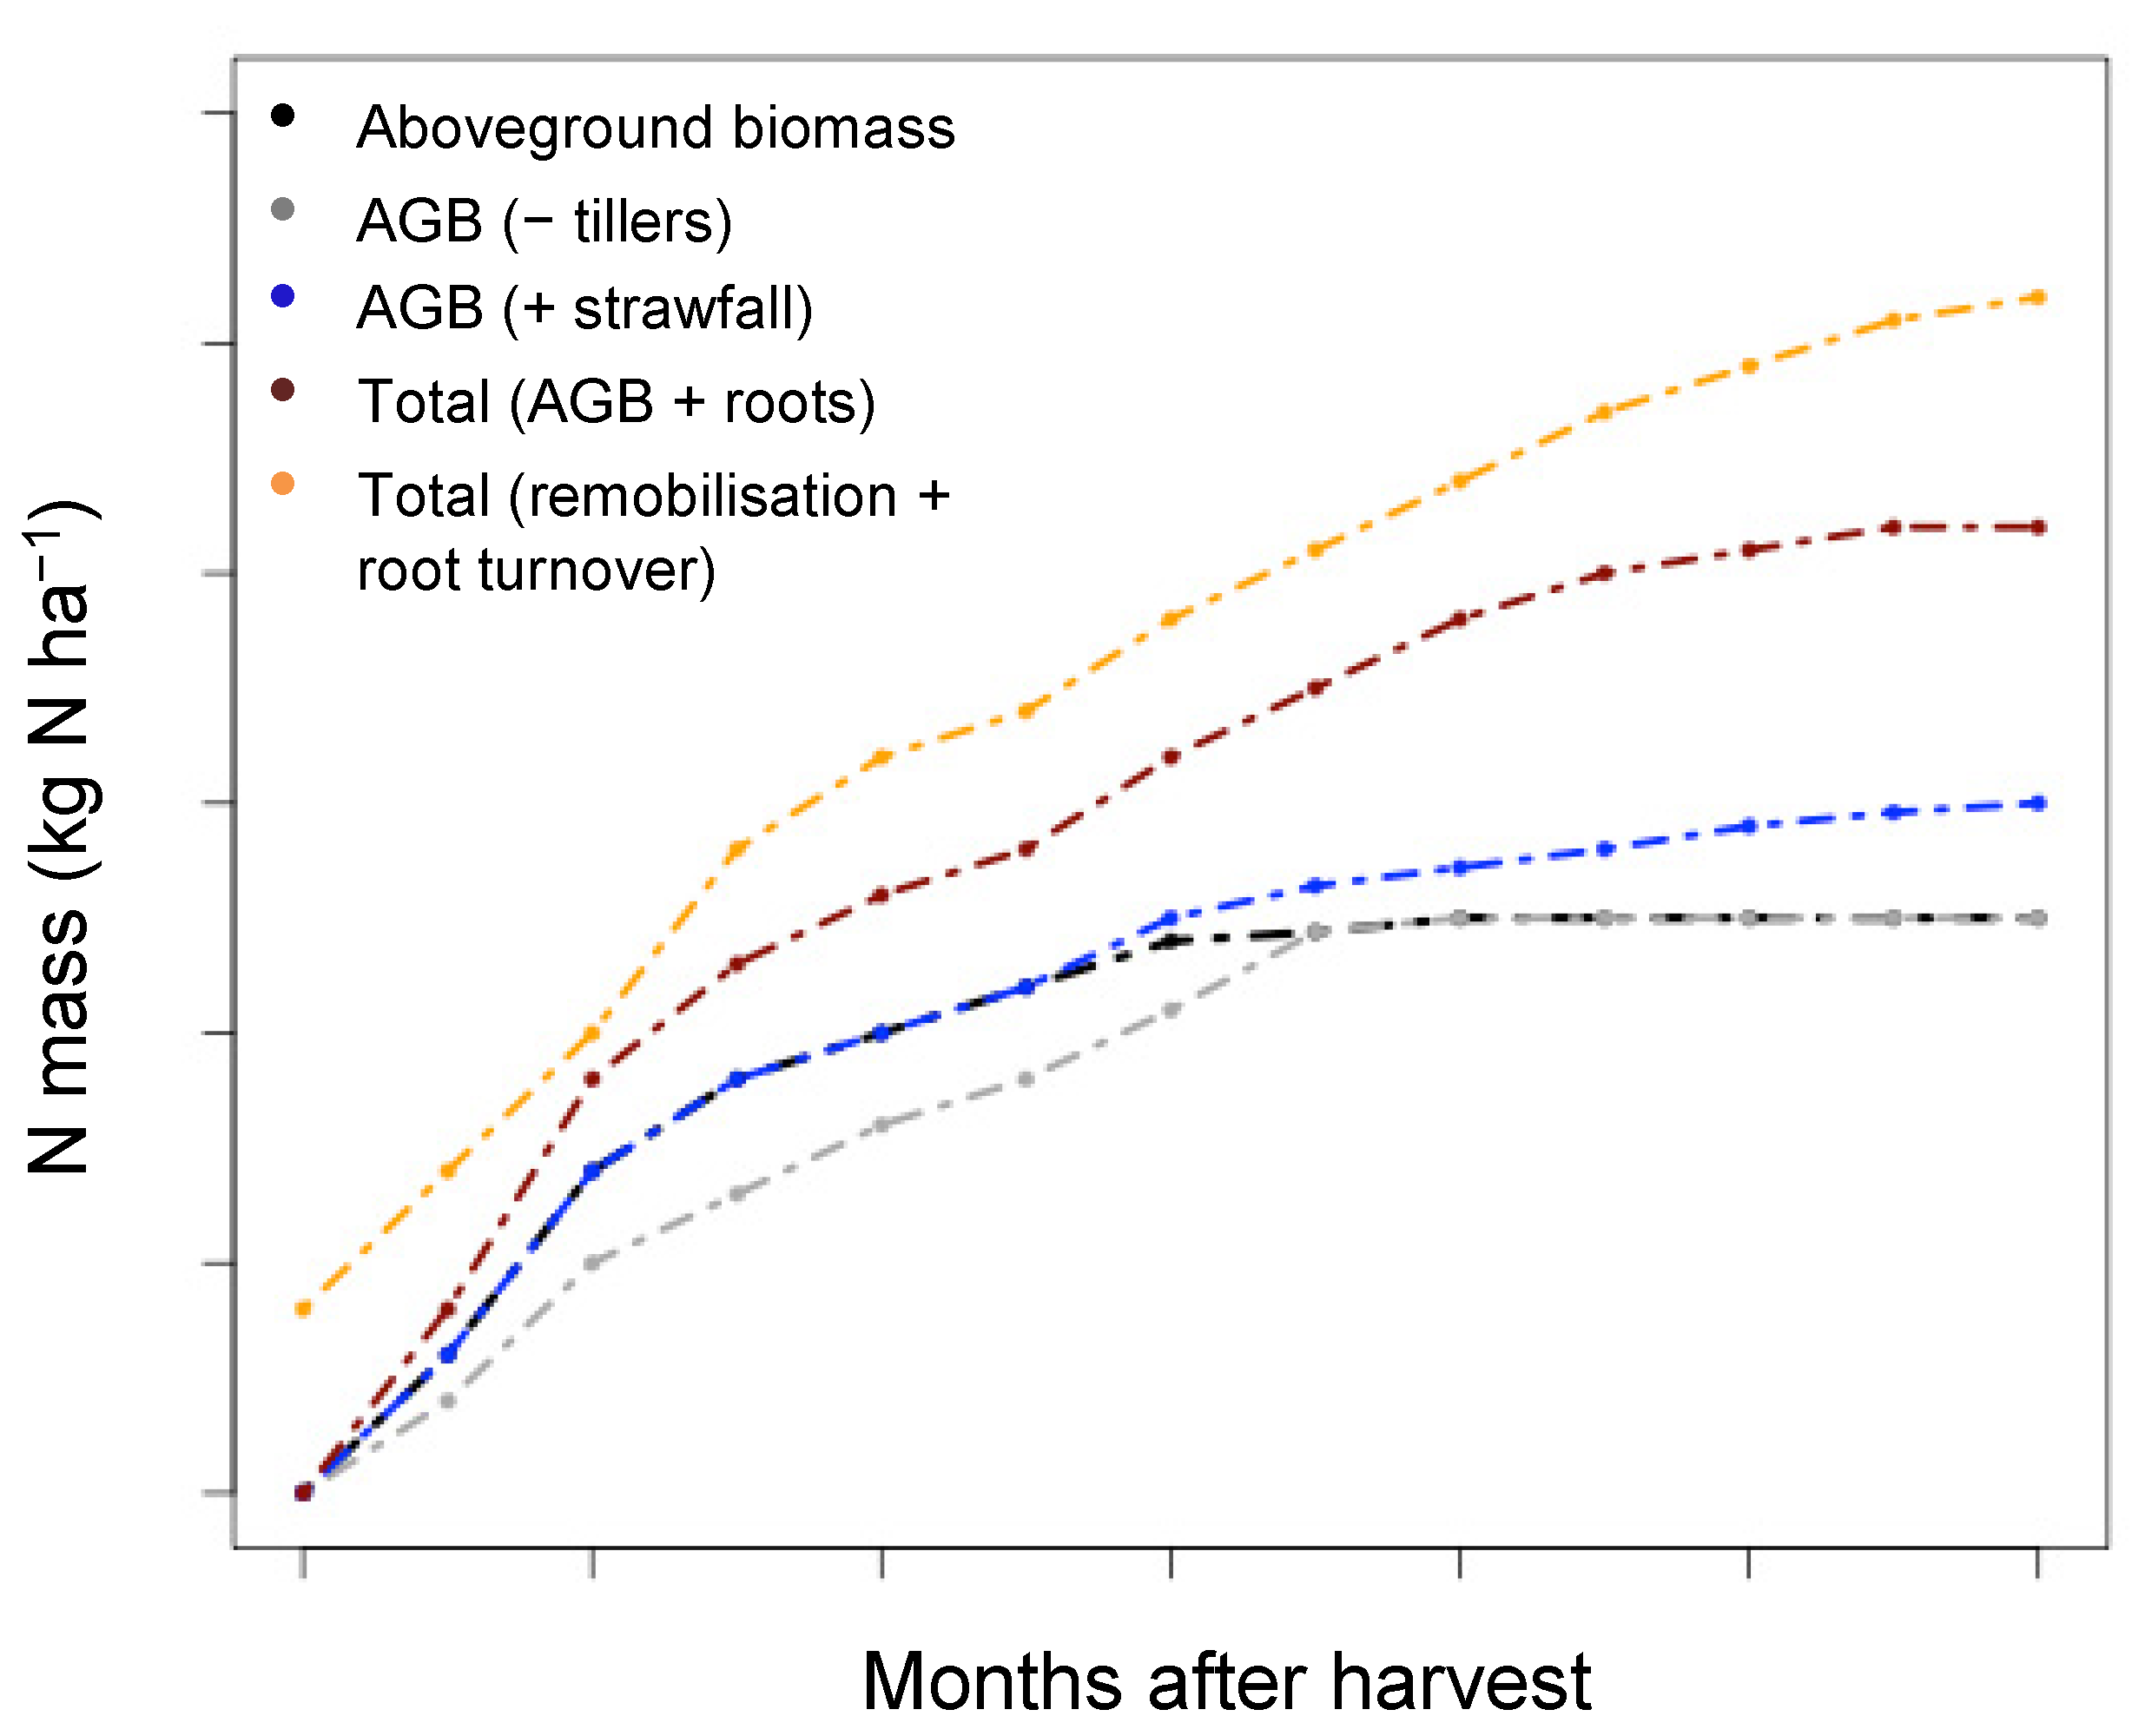
When the root component was considered, the total N mass increased to a large extent over the entire growth cycle, underlying the importance of this component in sugarcane N nutritional studies. Yet, little is known with regard to root mortality and the rate of root turnover is not known for sugarcane [1,15]. Theoretically, a proportion of surviving roots after harvest could contribute to ratoon nutrition through N remobilisation from belowground to aboveground biomass components, hence an estimated starting N mass value greater than zero in the theoretical scenario of Figure 6. Secondly, root turnover over the growth cycle could impact the N mass. In this theoretical scenario, the sugarcane N uptake period becomes even more progressive, and the accumulated N mass is higher than previously calculated. Further studies dealing with sugarcane internal N translocation and root turnover could have a further considerable influence on the traditional view of sugarcane N requirements and N uptake over the growth cycle. One current study shows that this mechanism of remobilisation from the belowground components to the aboveground components of the sugarcane can indeed play a role [36].
4.3. Implication of Biomass Component Integration on Fertiliser Nitrogen Recovery Efficiency
The fertiliser N recovery efficiency was not high for this sugarcane system, in a midrange of values, with the NRE being slightly higher over the first experimental year than in the second. Typically, the NRE of sugarcane fertilized with urea can range between 5% and 40% [21,33,37]. In our study, the NRE was impacted by the consideration of the sugarcane biomass components.
The fertiliser N recovery efficiency decreased over the sugarcane growth cycle, for both experimental years, from approximately 40.0% to 23.4% for the first, and from a maximum of 29.1% (at 6 months) to 18.9% for the second experimental year. This tendency for dNRE to decrease over the crop growth cycle has been documented for the iNRE calculated using 15N isotopes, in the few studies on iNRE over the sugarcane growth cycle [8,12], but not necessarily for the dNRE.
The total dNRE (aboveground and belowground biomass combined) was not impacted in a major way by the addition of the root component. This is because the N masses of the unfertilised and fertilised treatments are relatively similar in value, which is coherent with studies such as Versini et al. [17]. Therefore, since the difference method of determining dNRE is based on the difference in crop N mass between fertilised and unfertilised treatments, the addition of the root N component does not increase, or have a major impact on the dNRE, given the similar root N mass values between treatments. Over the second year, the unfertilised treatment root N mass is greater than that of the fertilised treatment, and this therefore led to a slight lowering of the dNRE.
These results could be quite different when using the 15N isotopes to determine the NRE, where the contribution of root N to the crop total NRE will likely be higher , and result in a higher NRE value. There is likely to be a clearer discrimination between the contribution of aboveground and belowground biomass to the NRE, as the use of 15N tracers allow the different N-pools to be quantified and followed more precisely in the different components of crop agroecosystems [7,38,39].
The strawfall component resulted in an increase in the dNRE, which was more pronounced over the first experimental year. If the strawfall is not considered over the experimental year, the dNRE could be underestimated by approximately 5.4% at harvest. However, for the second experimental year, the difference was negligible (decrease by <1%).
The senescence of tillers over the early growth stages of the sugarcane led to a decrease in the dNRE. The consideration of the tiller component was most important over the first experimental year for the fertilised treatment, and the dNRE would be overestimated by approximately 15% at 3 months after harvest, and 8% at 6 months after harvest. This was a result of the high initial tiller count in the fertilised treatment and the high level of senescence in this treatment, likely due to competition for sunlight. The unfertilised treatment had a low tiller senescence, and this discrepancy between the fertilised and unfertilised treatments is what led to the decrease of dNRE over the first 6 months of the sugarcane growth cycle.
It is not clear why the impact of the strawfall and tiller components was far less substantial over the second experimental year. However, one plausible reason could be as a result of perturbation to the sugarcane system over the second year due to a caterpillar invasion, which subsided after a few months. This led to a more delayed accumulation of biomass and N mass over the second year, and possibly a more “conservative” functioning of the sugarcane system, with lower tiller senescence and a lower level of strawfall, which begun a month later over the growth cycle than the first experimental year.
In the study by Meier et al. [21], the iNRE (measured using the 15N isotopic approach) was 2–4% from surface trash. They suggested further that if 30% of plant N is assumed to occur in the roots (van Dillewjin [40], as cited by Meier et al. [21]), the NRE would increase to 6–8% for the fertiliser and 3–6% for the trash. A limitation of their study, as they suggested, was that “15N in early-detached leaves was not measured”, as was evaluated in our study. The consideration of roots may not have a great effect on the dNRE with the difference method, but it may have an important impact on NRE values using the isotopic approach [7,21].
In summary, the tiller component can lead to a decrease in the dNRE, especially over the early stages of the growth cycle, the strawfall component can lead to an increase in dNRE in the dNRE later in the growth cycle, and the root component does not have a major effect. However, the root component should be evaluated as it has a strong impact on the N mass accumulation, and is likely to have a greater influence in NRE evaluation using 15N isotopes.
5. Conclusions
We conclude that the typically overlooked sugarcane components of strawfall, tillers, and roots play an important role in the evaluation of N nutrition in sugarcane. The traditional perception of sugarcane’s N requirements being only over the initial 3–6 months is challenged when considering these additional crop components. The incorporation of tiller senescence and strawfall results in a more progressive pattern of N uptake over the growth cycle. There is typically higher tiller senescence and a loss of N early in the growth cycle, which is somewhat balanced out with an increase in N in the strawfall, which detaches from the crop later in the growth cycle. The source of this N is therefore unclear, whether it is from the fertiliser or a redistribution of N from the tiller senescence. 15N isotopic tracer studies could give more insight into these dynamics, the transfer of fertiliser N to the crop components, and potentially the mobilisation of N between them.
The root component contributes to the N mass accumulation to a large extent. There is still much to be uncovered with regard to this important sugarcane component, and further studies into N remobilisation from the roots to the aboveground biomass, as well as root turnover, could be very insightful and give more detailed insights into the N dynamics of the sugarcane crop.
Author Contributions
Conceptualization, D.M.N.P., L.T. and A.V.; methodology, D.M.N.P., L.T. and A.V.; formal analysis, D.M.N.P., L.T. and A.V.; writing—original draft preparation, D.M.N.P.; writing—review and editing, L.T. and A.V. All authors have read and agreed to the published version of the manuscript.
Funding
D.M.N.P was funded by RUNEO, grant number CIFRE n°2017/0450. L.T. and A.V. were funded by the Conseil Régional de La Réunion, the French Ministry of Agriculture and Food and the European Union (Feder program, grant n°GURTDI 20151501-0000735) within the framework of the project “Services et impacts des activités agricoles en milieu tropical”.
Data Availability Statement
The raw data supporting the conclusions of this article will be made available by the authors on request.
Acknowledgments
We would like to acknowledge the technicians who assisted in this study, Didier Baret, Philip Nirlo, Géraud Moussard, and the Recyclage & Risque laboratory platform for sample analyses.
Conflicts of Interest
The authors declare no conflicts of interest.
Appendix A

Table A1.
Soil properties per soil horizon.
| Horizon | Depth | Clay | Silt | Sand | Bulk Density | Wp pF2.0 | Wp pF3.0 | Wp pF4.2 | C | N | C:N | pHwater | pHKCL | CEC | K+ | Na+ | Ca2+ | Mg2+ | P |
|---|---|---|---|---|---|---|---|---|---|---|---|---|---|---|---|---|---|---|---|
| cm | % | % | % | g·cm−2 | Dry Weight % | Dry Weight % | Dry Weight % | g·kg−1 | g·kg−1 | Ratio | meq/100g | meq/100g | meq/100g | meq/100g | meq/100g | mg·kg−1 | |||
| A | 0–10 | 43 | 46 | 11 | 1.36 | 36 | 28 | 22 | 21.4 | 1.8 | 12.0 | 6.1 | 4.8 | 10.6 | 0.7 | 0.2 | 6.7 | 2.9 | 117 |
| 10–20 | 42 | 47 | 11 | 1.29 | 38 | 29 | 23 | 18.7 | 1.6 | 11.4 | 6.1 | 4.7 | 10.1 | 0.6 | 0.1 | 6.6 | 2.7 | 90 | |
| 20–40 | 45 | 43 | 12 | 1.34 | 42 | 32 | 26 | 11.7 | 1.1 | 10.5 | 6.1 | 4.8 | 8.8 | 0.2 | 0.3 | 5.8 | 2.4 | 39 | |
| B | 55–65 | 37 | 44 | 18 | 1.31 | 49 | 37 | 27 | 5.0 | 0.5 | 9.9 | 6.4 | 5.0 | 8.2 | 0.0 | 0.5 | 5.2 | 2.1 | 19 |
| 75–85 | 31 | 45 | 25 | 1.28 | 49 | 37 | 26 | 3.5 | 0.4 | 9.8 | 6.4 | 4.9 | 8.0 | 0.0 | 0.5 | 4.9 | 2.1 | 19 |
References
- Robinson, N.; Vogt, J.; Lakshmanan, P.; Schmidt, S. Nitrogen physiology of sugarcane. In Physiology, Biochemistry and Functional Biology of Sugarcane; Botha, P.H.M., Ed.; John Wiley & Sons: Hoboken, NJ, USA, 2013; pp. 169–195. [Google Scholar]
- Dobermann, A.R. Nitrogen Use Efficiency-State of the Art; Agronomy—Faculty Publications, University of Nebraska-Lincoln: Lincoln, NE, USA, 2005; p. 316. [Google Scholar]
- McLellan, E.L.; Cassman, K.G.; Eagle, A.J.; Woodbury, P.B.; Sela, S.; Tonitto, C.; Marjerison, R.D.; Van Es, H.M. The nitrogen balancing act: Tracking the environmental performance of food production. BioScience 2018, 68, 194–203. [Google Scholar] [CrossRef]
- Vallis, I.; Catchpoole, V.R.; Hughes, R.M.; Myers, R.J.K.; Ridge, D.R.; Weier, K.L. Recovery in plants and soils of 15N applied as subsurface bands of urea to sugarcane. Aust. J. Agric. Res. 1996, 47, 355–370. [Google Scholar] [CrossRef]
- Otto, R.; Castro, S.A.Q.; Mariano, E.; Castro, S.G.Q.; Franco, H.C.J.; Trivelin, P.C.O. Nitrogen use efficiency for sugarcane-biofuel production: What is next? Bioenergy Res. 2016, 9, 1272–1289. [Google Scholar] [CrossRef]
- Takeda, N.; Friedl, J.; Rowlings, D.; De Rosa, D.; Scheer, C.; Grace, P. No sugar yield gains but larger fertiliser 15N loss with increasing N rates in an intensive sugarcane system. Nutr. Cycl. Agroecosyst. 2021, 121, 99–113. [Google Scholar] [CrossRef]
- Congreves, K.A.; Otchere, O.; Ferland, D.; Farzadfar, S.; Williams, S.; Arcand, M.M. Nitrogen Use Efficiency Definitions of Today and Tomorrow. Front. Plant Sci. 2021, 12, 637108. [Google Scholar] [CrossRef]
- Kwong, K.N.K.; Deville, J. The course of fertilizer nitrogen uptake by rainfed sugarcane in Mauritius. J. Agric. Sci. 1994, 122, 385–391. [Google Scholar] [CrossRef]
- Cassman, K.G.; Dobermann, A.R.; Walters, D.T. Agroecosystems, Nitrogen-use Efficiency, and Nitrogen Management. AMBIO J. Hum. Environ. 2002, 31, 132–140. [Google Scholar] [CrossRef] [PubMed]
- Harmsen, K.; Moraghan, J.T. A comparison of the isotope recovery and difference methods for determining nitrogen fertilizer efficiency. Plant Soil 1988, 105, 55–67. [Google Scholar] [CrossRef]
- Ferchaud, F.; Vitte, G.; Machet, J.-M.; Beaudoin, N.; Catterou, M.; Mary, B. The fate of cumulative applications of 15N-labelled fertiliser in perennial and annual bioenergy crops. Agric. Ecosyst. Environ. 2016, 223, 76–86. [Google Scholar] [CrossRef]
- Courtaillac, N.; Baran, R.; Oliver, R.; Casabianca, H.; Ganry, F. Efficiency of nitrogen fertilizer in the sugarcane-vertical system in Guadeloupe according to growth and ratoon age of the cane. Nutr. Cycl. Agroecosyst. 1998, 52, 9–17. [Google Scholar] [CrossRef]
- Poultney, D.M.N.; Christina, M.; Versini, A. Optimising non-destructive sampling methods to study nitrogen use efficiency throughout the growth-cycle of giant C4 crops. Plant Soil 2020, 453, 597–613. [Google Scholar] [CrossRef]
- Wood, A.W.; Muchow, R.C.; Robertson, M.J. Growth of sugarcane under high input conditions in tropical Australia. III. Accumulation, partitioning and use of nitrogen. Field Crops Res. 1996, 48, 223–233. [Google Scholar] [CrossRef]
- Smith, D.M.; Inman-Bamber, N.G.; Thorburn, P.J. Growth and function of the sugarcane root system. Field Crops Res. 2005, 92, 169–183. [Google Scholar] [CrossRef]
- Bell, M.J.; Moody, P.; Salter, B.; Connellan, J.; Garside, A.L. Agronomy and physiology of nitrogen use in Australian sugarcane crops. In A Review of Nitrogen Use Efficiency in Sugarcane; Sugar Research Australia: Broadwater, Australia, 2015. [Google Scholar]
- Versini, A.; Poultney, D.; Bachir, H.; Février, A.; Paillat, J. Effect of Nitrogen Fertilisation on Sugarcane Root Development and Nitrogen Accumulation in Ratoon Crops of Reunion Island. Sugar Tech 2020, 22, 1110–1121. [Google Scholar] [CrossRef]
- Bonnett, G.D. Developmental Stages (Phenology). In Physiology, Biochemistry and Functional Biology of Sugarcane; Moore, P.H., Botha, F.C., Eds.; Wiley-Blackwell: Hoboken, NJ, USA, 2013. [Google Scholar]
- Bell, M.J.; Garside, A.L. Shoot and stalk dynamics and the yield of sugarcane crops in tropical and subtropical Queensland, Australia. Field Crops Res. 2005, 92, 231–248. [Google Scholar] [CrossRef]
- Singels, A.; Smit, M.A.; Redshaw, K.A.; Donaldson, R.A. The effect of crop start date, crop class and cultivar on sugarcane canopy development and radiation interception. Field Crops Res. 2005, 92, 249–260. [Google Scholar] [CrossRef]
- Meier, E.A.; Thorburn, P.J.; Wegener, M.K.; Basford, K.E. The availability of nitrogen from sugarcane trash on contrasting soils in the wet tropics of North Queensland. Nutr. Cycl. Agroecosyst. 2006, 75, 101–114. [Google Scholar] [CrossRef]
- Robertson, F.A.; Thorburn, P.J. Management of sugarcane harvest residues: Consequences for soil carbon and nitrogen. Aust. J. Soil Res. 2007, 45, 13–23. [Google Scholar] [CrossRef]
- Trivelin, P.C.O.; Franco, H.C.J.; Otto, R.; Ferreira, D.A.; Vitti, A.C.; Fortes, C.; Faroni, C.E.; Oliveira, E.C.A.; Cantarella, H. Impact of sugarcane trash on fertilizer requirements for São Paulo. Braz. Sci. Agric. 2013, 70, 345–352. [Google Scholar] [CrossRef]
- Vitousek, P.M. Litterfall, nutrient cycling, and nutrient limitation in tropical forests. Ecology 1984, 65, 285–298. [Google Scholar] [CrossRef]
- Oliveira, M.; van Noordwijk, G.M.; Gaze, S.; Brouwer, G.; Bona, S.; Mosca, G.; Hairiah, K. Auger sampling, ingrowth cores and pinboard methods. In Root Methods: A Handbook; Smit, A.L., Bengough, A.G., Engels, C., van Noordwijk, M., Pellerin, S., Van de Geijn, S.C., Eds.; Springer: Berlin, Germany, 2000. [Google Scholar]
- Otto, R.; Trivelin, P.C.O.; Franco, H.C.J.; Faroni, C.E.; Vitti, A.C. Root system distribution of sugar cane as related to nitrogen fertilization, evaluated by two methods: Monolith and probes. Rev. Bras. Ciência Solo 2009, 33, 601–611. [Google Scholar] [CrossRef]
- R Core Team. R: A Language and Environment for Statistical Computing; R Foundation for Statistical Computing: Vienna, Austria, 2023; Available online: http://www.R-project.org/ (accessed on 22 January 2024).
- Singels, A.; Smit, M.A. Sugarcane response to row spacing-induced competition for light. Field Crops Res. 2009, 113, 149–155. [Google Scholar] [CrossRef]
- Kwong, K.N.K.; Paul, J.P.; Deville, J. Drip-fertigation–a means for reducing fertilizer nitrogen to sugarcane. Exp. Agric. 1999, 35, 31–37. [Google Scholar] [CrossRef]
- Garside, A.L.; Bell, M.J.; Berthelsen, J.E.; Halpin, N.V. Effect of breaks and nitrogen fertiliser on shoot development, maintenance, and cane yield in an irrigated plant crop of Q117. In Proceedings of the Conference of the Australian Society of Sugar Cane Technologists, Bundaberg, Queensland, Australia, 2–5 May 2000. [Google Scholar]
- Vieira-Megda, M.X.; Mariano, E.; Leite, J.M.; Franco, H.C.J.; Vitti, A.C.; Megda, M.M.; Khan, S.A.; Mulvaney, R.L.; Trivelin, P.C.O. Contribution of fertilizer nitrogen to the total nitrogen extracted by sugarcane under Brazilian field conditions. Nutr. Cycl. Agroecosyst. 2015, 101, 241–257. [Google Scholar] [CrossRef]
- Muchow, R.C.; Robertson, M.J. Relating Crop Nitrogen Uptake to Sugarcane Yield; Watson Ferguson and Company: Tingalpa, Australia, 1994. [Google Scholar]
- Basanta, M.V.; Dourado-Neto, D.; Reichardt, K.; Bacchi, O.O.S.; Oliveira, J.C.M.; Trivelin, P.C.O.; Timm, L.C.; Tominaga, T.T.; Correchel, V.; Cássaro, F.A.M.; et al. Management effects on nitrogen recovery in a sugarcane crop grown in Brazil. Geoderma 2003, 116, 235–248. [Google Scholar] [CrossRef]
- Thorburn, P.J.; Webster, A.J.; Biggs, J.S. Nitrogen needs of sugarcane crops: Lessons from testing the N replacement concept. Proc. Aust. Soc. Sugar Cane Technol. 2009, 31, 104–115. [Google Scholar]
- Franco, H.C.J.; Otto, R.; Faroni, C.E.; Vitti, A.C.; de Oliveira, E.C.A.; Trivelin, P.C.O. Nitrogen in sugarcane derived from fertilizer under Brazilian field conditions. Field Crops Res. 2011, 121, 29–41. [Google Scholar] [CrossRef]
- Chevalier, L.; Christina, M.; Poultney, D.; Chaput, M.; Versini, A. Internal translocation of N in sugarcane: Belowground storage and remobilisation at regrowth? In Proceedings of the XXXI International Society of Sugar Cane Technologists, ISSCT, Hyderabad, India, 20–23 February 2023; pp. 193–197. [Google Scholar]
- Fortes, C.; Trivelin, P.C.O.; Vitti, A.C.; Ferreira, D.A.; Franco, H.C.J.; Otto, R. Recovery of nitrogen (15N) by sugarcane from previous crop residues and urea fertilisation under a minimum tillage system. Sugar Tech 2011, 13, 42–46. [Google Scholar] [CrossRef]
- Trivelin, P.C.O.; Lara Cabezas, W.A.R.; Victoria, R.L.; Reichardt, K. Evaluation of a 15N plot design for estimating plant recovery of fertilizer nitrogen applied to sugar cane. Sci. Agric. 1994, 51, 226–234. [Google Scholar] [CrossRef]
- Versini, A.; Zeller, B.; Derrien, D.; Mazoumbou, J.C.; Mareschal, L.; Saint-André, L.; Ranger, J.; Laclau, J.P. The role of harvest residues to sustain tree growth and soil nitrogen stocks in a tropical Eucalyptus plantation. Plant Soil 2014, 376, 245–260. [Google Scholar] [CrossRef]
- Dillewijn, C.V. Botany of Sugarcane; Chronica Botanica: Waltham, MA, USA, 1952. [Google Scholar]
Figure 1.
Aboveground biomass over the sugarcane growth cycle for unfertilised (NF AGB) and urea-fertilised (Fertilised AGB) treatments for the first (2018) and second experimental years (2019), and the total aboveground N mass over the sugarcane growth cycle for the two respective treatments over the first and second experimental years.

Figure 2.
Tiller component for the first experimental year (left) and the second experimental year (right), for fertilised and unfertilised treatments. (A,B) Number of tillers and number of cane stalks (on average per m2); (C,D) tiller biomass; and (E,F) N biomass of the tiller component.
Figure 2.
Tiller component for the first experimental year (left) and the second experimental year (right), for fertilised and unfertilised treatments. (A,B) Number of tillers and number of cane stalks (on average per m2); (C,D) tiller biomass; and (E,F) N biomass of the tiller component.

Figure 3.
Strawfall accumulated dry biomass and N mass for the 2017–2018 growing season (left) and the 2018–2019 growing season (right). (A,B) Accumulated strawfall biomass; (C,D) accumulated strawfall N mass.
Figure 3.
Strawfall accumulated dry biomass and N mass for the 2017–2018 growing season (left) and the 2018–2019 growing season (right). (A,B) Accumulated strawfall biomass; (C,D) accumulated strawfall N mass.

Figure 4.
Nitrogen mass for the first experimental (left) and second experimental year (right). The N mass for the unfertilised treatment is displayed in the two top graphs (A,B); the N mass for the fertilised treatment is shown in the two bottom graphs (C,D). For each treatment, the N mass is plotted for the aboveground biomass, the aboveground biomass with tiller senescence deducted (AGB − tillers), the aboveground biomass with strawfall added (AGB + strawfall), the total sugarcane biomass with roots added (Total AGB + roots), and the total sugarcane biomass with roots and stools for the second experimental year added (Total AGB + roots + stools). For the total N mass, the final value (dark-red cross) was the value calculated when the root component was measured, and the previous points were estimated values (using the root-to-shoot N mass ratio as determined for this experimental site by Versini et al. (2020) [17].

Figure 5.
Fertiliser nitrogen recovery efficiency for the first (Year 1) and second (Year 2) year of experiment, for the different N biomass components (aboveground biomass (AGB), aboveground biomass with tiller senescence deducted (AGB − tillers), aboveground biomass with strawfall added (AGB + strawfall), and total aboveground biomass with roots added (Total AGB + roots).

Figure 6.
Theoretical figure showing sugarcane N mass considering different N mass components for the urea-fertilised treatment. This is shown for the baseline aboveground biomass (Aboveground biomass), as well as the aboveground biomass after tiller senescence is subtracted (AGB − tillers), after strawfall is added (AGB + strawfall), after belowground biomass is added (AGB + roots), and after N is remobilised from the roots and root turnover is included (remobilisation + root turnover).

Table 1.
Dry biomass and nitrogen mass of the belowground biomass component (roots and stool) at final harvest for the second experimental year. The root to shoot ratio is also given, for biomass and nitrogen mass.
Table 1.
Dry biomass and nitrogen mass of the belowground biomass component (roots and stool) at final harvest for the second experimental year. The root to shoot ratio is also given, for biomass and nitrogen mass.
| Treatment | Root Biomass (t ha−1) | Shoot Biomass (t ha−1) | R:S Ratio (Biomass) | Root N Mass (kg N ha−1) | Shoot N Mass (kg N ha−1) | R:S Ratio (N Mass) | Stool Mass (t ha−1) | Stool N Mass (kg N ha−1) |
|---|---|---|---|---|---|---|---|---|
| Fertilised | 10.9 ± 1.5 | 32.9 | 0.33 | 55.5 | 97.4 | 0.57 | 2.5 ± 0.4 | 20.8 |
| Unfertilised | 12.8 ± 1.0 | 24.1 | 0.53 | 61.2 | 70.2 | 0.74 | 3.8 ± 0.9 | 17.5 |
Disclaimer/Publisher’s Note: The statements, opinions and data contained in all publications are solely those of the individual author(s) and contributor(s) and not of MDPI and/or the editor(s). MDPI and/or the editor(s) disclaim responsibility for any injury to people or property resulting from any ideas, methods, instructions or products referred to in the content. |
© 2024 by the authors. Licensee MDPI, Basel, Switzerland. This article is an open access article distributed under the terms and conditions of the Creative Commons Attribution (CC BY) license (https://creativecommons.org/licenses/by/4.0/).
Share and Cite
MDPI and ACS Style
Poultney, D.M.N.; Thuriès, L.; Versini, A. Importance of Overlooked Crop Biomass Components in Sugarcane Nitrogen Nutrition Studies. Nitrogen 2024, 5, 62-78. https://doi.org/10.3390/nitrogen5010005
AMA Style
Poultney DMN, Thuriès L, Versini A. Importance of Overlooked Crop Biomass Components in Sugarcane Nitrogen Nutrition Studies. Nitrogen. 2024; 5(1):62-78. https://doi.org/10.3390/nitrogen5010005
Chicago/Turabian StylePoultney, Daniel M.N., Laurent Thuriès, and Antoine Versini. 2024. "Importance of Overlooked Crop Biomass Components in Sugarcane Nitrogen Nutrition Studies" Nitrogen 5, no. 1: 62-78. https://doi.org/10.3390/nitrogen5010005