
Influence of Anodic Aluminum Oxide Nanostructures on Resistive Humidity Sensing

Department of Mechanical Engineering, National Cheng Kung University, Tainan 701, Taiwan
*
Author to whom correspondence should be addressed.
Nanomanufacturing 2024, 4(1), 58-68; https://doi.org/10.3390/nanomanufacturing4010004
Submission received: 19 November 2023
/
Revised: 17 January 2024
/
Accepted: 1 March 2024
/
Published: 8 March 2024
(This article belongs to the Special Issue Feature Papers for Nanomanufacturing in 2023)
Abstract
:Humidity nanosensors play a vital role in modern technology industries, including weather forecasts, industrial manufacturing, agriculture, food and chemistry storage. In recent years, research on humidity sensors has focused on different materials such as ceramics, polymers, carbon-based materials, semiconductors, MXenes or triboelectric nanogenerators, each with their own advantages and disadvantages. Among them, anodic aluminum oxide (AAO) is a well-known ceramic humidity sensor material with a long history of research and development. AAO humidity sensors offer advantages such as simple manufacturing processes, controllable nanostructures, high thermal stability and biocompatibility. However, traditional AAO fabrication still has disadvantages like high costs and longer process times. Hence, finding a low-cost and efficient method to fabricate AAO for controlling different nanostructures to meet the requirements is consistently a major research topic. From our previous studies, we have studied the relationship between the AAO capacitive humidity sensor and its nanostructures. In this paper, we explore the effect of an AAO nanoporous structure controlled by an anodization voltage of 20–40 V on the resistive-type humidity sensor performance instead of a capacitive one. We efficiently apply one-step hybrid pulse anodization at 25 °C to significantly reduce the processing time compared to the traditional two-step process under 0–10 °C. The AAO nanostructures and their impact on sensor measurements of humidity at 20–80 RH% will be discussed in detail. An electrical resistive sensing mechanism is established for further performance improvement by controlling anodization voltage.
1. Introduction
Research on humidity sensors is an important subject, finding applications in weather forecasting, agriculture, industry and the preservation of food and medicine [1,2,3]. As a result, precise humidity measurement has remained a hot topic in past decades. Humidity measurement can be categorized into optical and electrical sensing [4,5,6,7]. Optical humidity sensing can be further divided into visible light or using microfiber knot resonators for detection [8,9]. The humidity sensors based on visible wavelength shift offer real-time recognition advantages by the naked eyes, but unfortunately, the sensitivity of optical sensors remains lower in sensor performance, making them less mainstream in practical applications. On the other hand, electrical sensing can be categorized into six main types based on materials and principles: ceramics [10,11,12,13], polymers [7,14,15], carbon-based materials [16,17,18,19,20], semiconductors [21,22], MXenes [23,24] and triboelectric nanogenerators (TENG) [25,26]. Each category has its own pros and cons. Research on humidity sensing using ceramics is usually accompanied by thermal stability and biocompatibility, as well as with a relatively green process during fabrication. Polymer materials have been extensively explored, and their characteristics are well-suited for flexible or wearable devices. However, it is still challenging to enhance the sensitivity in both ceramic and polymer sensors. Carbon-based material and semiconductor sensors exhibit excellent sensitivity, but they come with longer processing times, higher costs and often involve the use of toxic chemicals. In terms of MXene, an emerging two-dimensional material undergoes structural changes with different humidity levels, but it also faces the issue of poor sensing performance. Triboelectric generator humidity sensing is innovative for boasting self-powered sensing potential. However, the current power generation performance is not yet fully self-sufficient, and sensor performance is still lower than the traditional materials. Hence, achieving a balance among various characteristics to develop a low-cost, time-efficient, non-toxic and high-performance humidity sensor would significantly contribute to accurate humidity measurement.
Ceramic materials possess good thermal stability among various types of humidity sensors, and their manufacturing processes are relatively environmentally friendly. Anodic aluminum oxide (AAO) is a well-known nanomaterial template for various electrical and optical sensing mechanisms and methods [27,28,29]. Also, AAO humidity sensors have gained significant research attention over the past several decades. In 2000, Nahar et al. [30] published the first comprehensive paper on measuring environmental humidity using AAO and established the measurement mechanism of AAO humidity sensors. By 2009, Park et al. [31] had proposed the use of interdigitated electrodes on AAO sensors to achieve better sensing performance. In 2012, Kashi et al. [32] suggested that different anodization potentials could yield an optimal pore size for achieving a high response, and this could be improved by pore widening. In 2014–2015, Chung’s team [33,34] introduced the improvement of sensor responses by applying an external magnetic field and changing the oxalic acid concentration during anodization, substantially enhancing humidity sensor responses. In 2015, Blade et al. [35] combined sputtering processes to produce AAO humidity sensors on paper, leveraging the flexible characteristics of cellulose. In 2021, Chung et al. [36] proposed that large areas and low voltage AAO structures possess a high specific surface area, leading to a better response of capacitive humidity sensing. Despite the comprehensive research on AAO, the fabrication process often involves time-consuming and costly two-step anodization [30,31,32,33,37,38] or sputtering [35] with a high-purity aluminum target. In addition, many studies employ a capacitive measurement approach, with limited exploration of resistance-based AAO humidity sensing. However, the signal of capacitive AAO sensors follows a natural function curve as relative humidity increases, with lower sensitivity at low humidity. In contrast, resistive humidity sensing exhibits better sensitivity at low humidity, making it worthy of investigation. Furthermore, AAO is able to directly grow on aluminum alloy substrates, providing better advantages for integrating sensors directly on the aluminum outer covering of industrial products for environmental detection.
In this paper, we plan to study and measure the resistive-type AAO humidity sensors prepared through one-step anodization at 20–40 V within a relative humidity (RH) of 20% to 80%. Also, deep investigation of the influence of anodizing voltage dependent AAO nanostructures on sensor performance is performed. Simultaneously, the pros and cons are discussed for resistance and capacitance-based AAO sensors, and methods are proposed for improving the measurement and process structure of AAO humidity sensors. Achieving good sensor performance by improving the traditional two-step and high-purity aluminum for AAO fabrication through low-cost material and rapid processing with performance enhancements will be helpful in this field.
2. Materials and Methods
In our experiment, 1050 aluminum alloy with a thickness of 1 mm was used as the substrate. It was initially cut to a size of 2.5 × 2.5 cm to match the dimensions of the custom-made electrochemical mold. The aluminum substrate was then electropolished in a perchloric acid and ethanol solution to reduce surface roughness, allowing for the smooth growth of AAO nanopores in subsequent anodization. Based on our previous research, the first step of electropolishing was performed for 1 min using a perchloric acid and ethanol solution in a 1:1 volume ratio at 0 °C. The second step involved electropolishing for 5 min using a perchloric acid and ethanol solution in a 1:4 volume ratio at 0 °C. Both steps were conducted using a two-electrode system with a potential of 20 V applied between the positive and negative electrode at a distance of 5 cm. Once it was confirmed that the aluminum surface was approaching a mirror-like status, the anodization process was initiated. In this anodization process, a three-electrode system supplied potentials of 20/−2 V, 30/−2 V and 40/−2 V in 0.3 M oxalic acid for 2 h at 25 °C. The AA1050 specimen served as the working electrode, platinum mesh as the counter electrode, and a saturated calomel electrode (SCE) as the reference electrode. The unique hybrid pulse anodization (HPA) method developed by our laboratory [33,36] was used for the anodization process. It effectively reduces the Joule heating generated during the anodization process, allowing the process to take place at room temperature. Following the anodization process, the prepared AAO was coated with a Pt membrane of 10 nm in thickness, forming a metal–ceramic–metal structure of the AAO sensor.
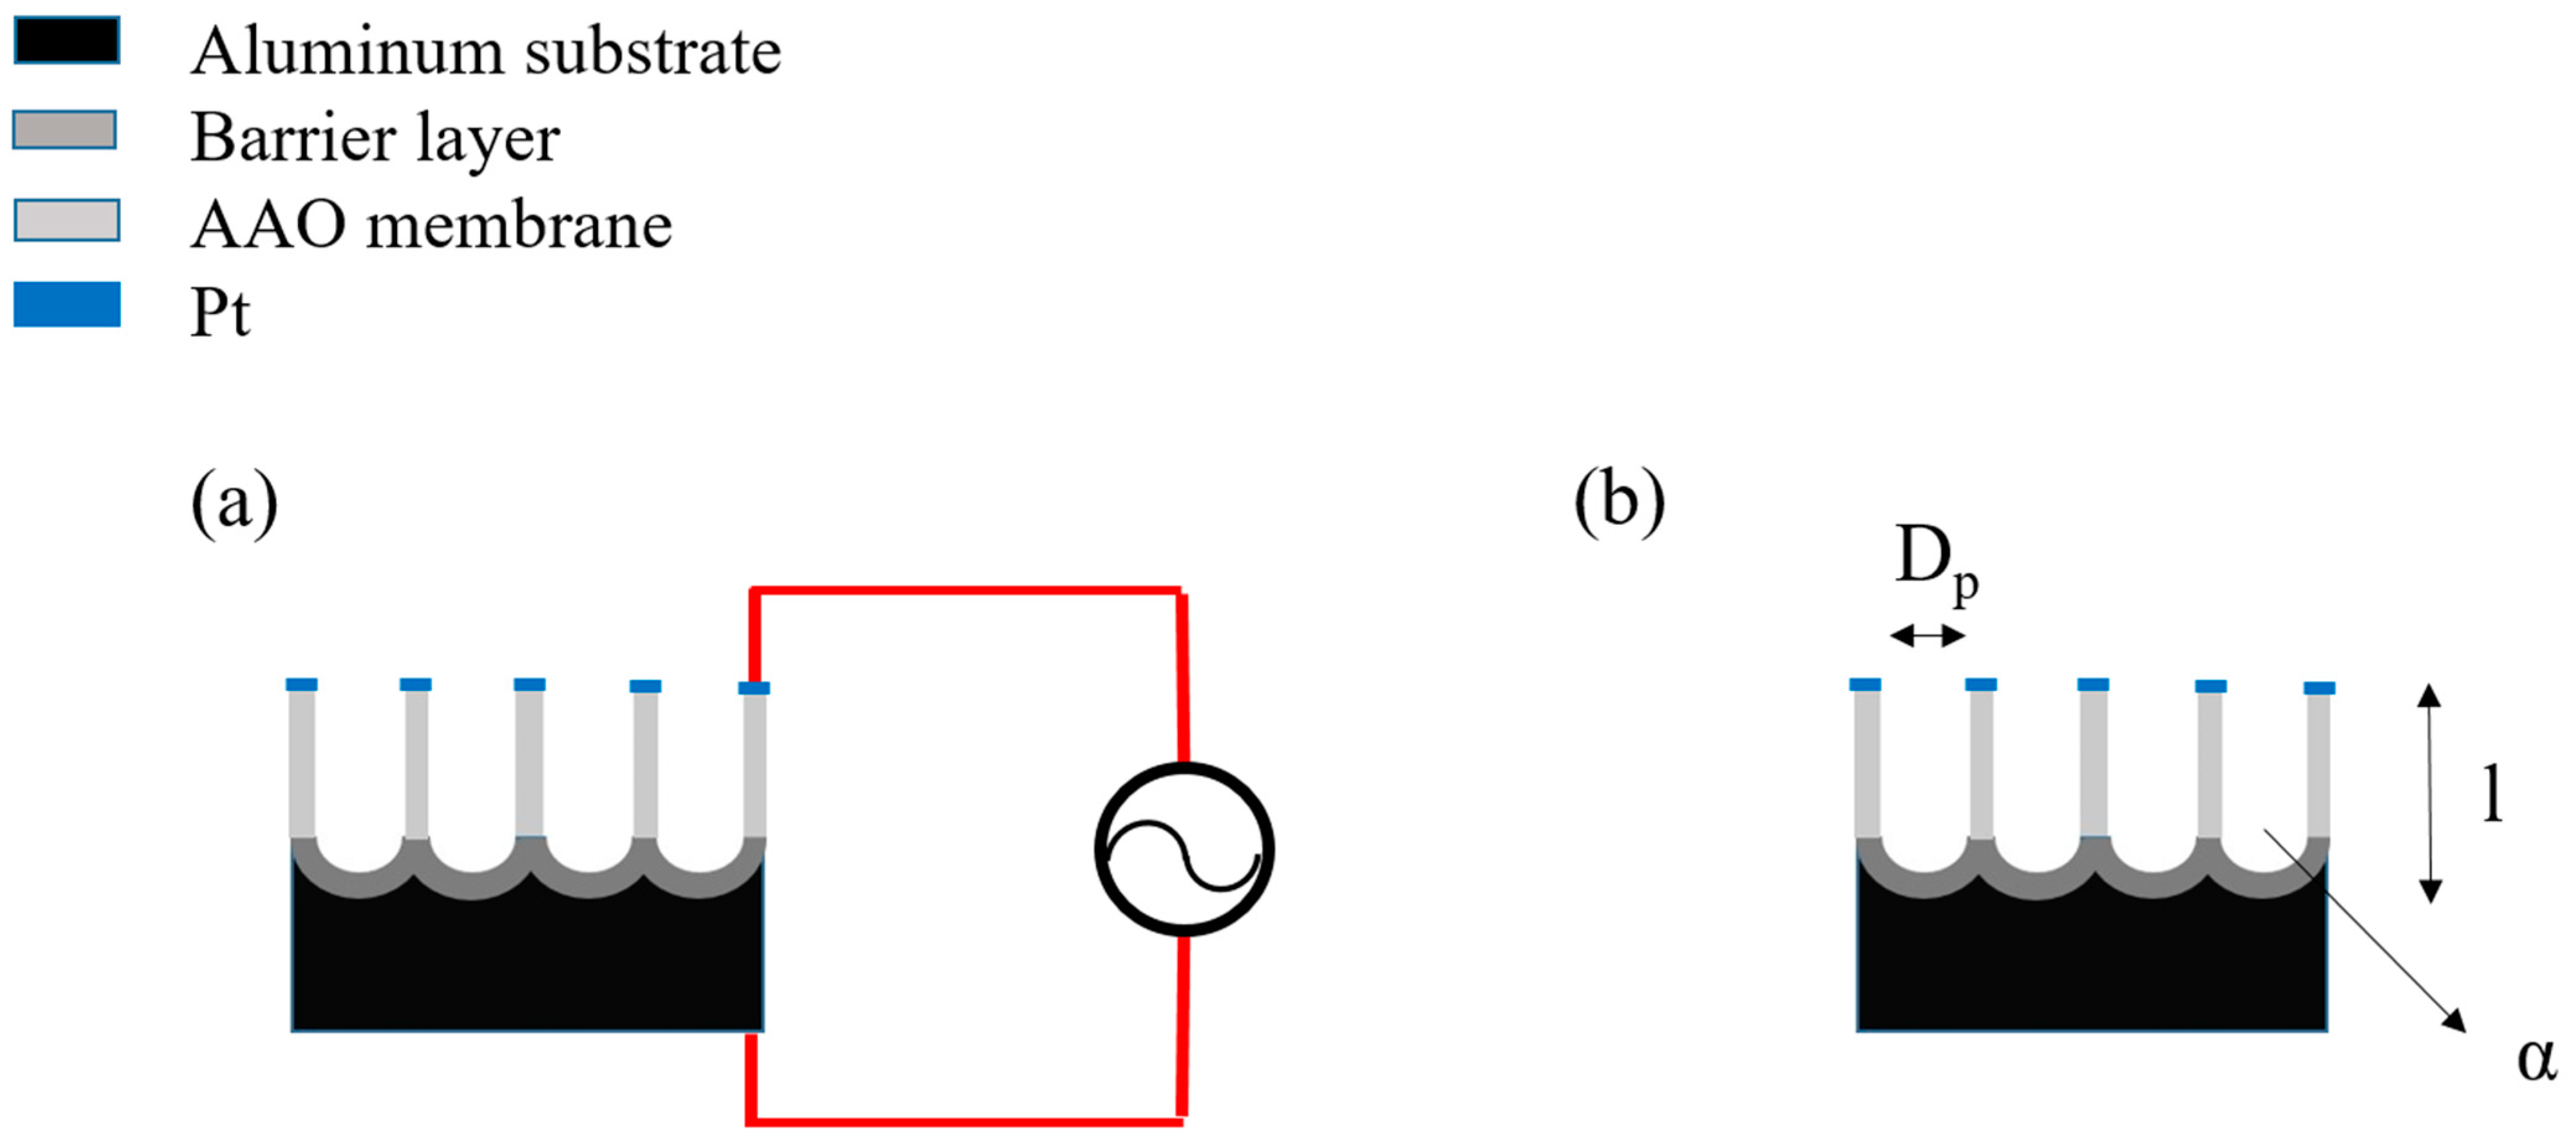
Regarding humidity measurement, we assembled an analysis system consisting of the AAO sensor, a custom-made chamber, dry and humidified air pipelines, an LCR meter and a computer. The upper electrode (Pt) and lower electrode (Al) were connected with wires to create the AAO humidity sensor, and resistance values were measured using an LCR meter. The completed structure of the AAO sensor is shown in Figure 1a. From top to bottom, it consists of the thin film of Pt, the AAO membrane and the aluminum substrate. For the relative humidity control, a commercial humidity sensor was used as a reference, and the airflow to the dry and humid air pipelines was adjusted to achieve a stable humidity environment within the chamber. Resistance measurements were taken at five points for each relative humidity level, and an average value was calculated. The sensors were tested at relative humidity levels of 20%, 40%, 60% and 80%, with the starting point set at 20% relative humidity. On the other hand, the surface and cross-sectional nanostructures of the AAO sensor were observed by scanning electron microscopy (SEM). SEM images were analyzed using the commercial software ImageJ (version 1.51j8) to calculate parameters such as pore size (Dp), thickness (l) and porosity (α), as illustrated in Figure 1b, and their relationship with the measurement results was discussed.
3. Results and Discussion
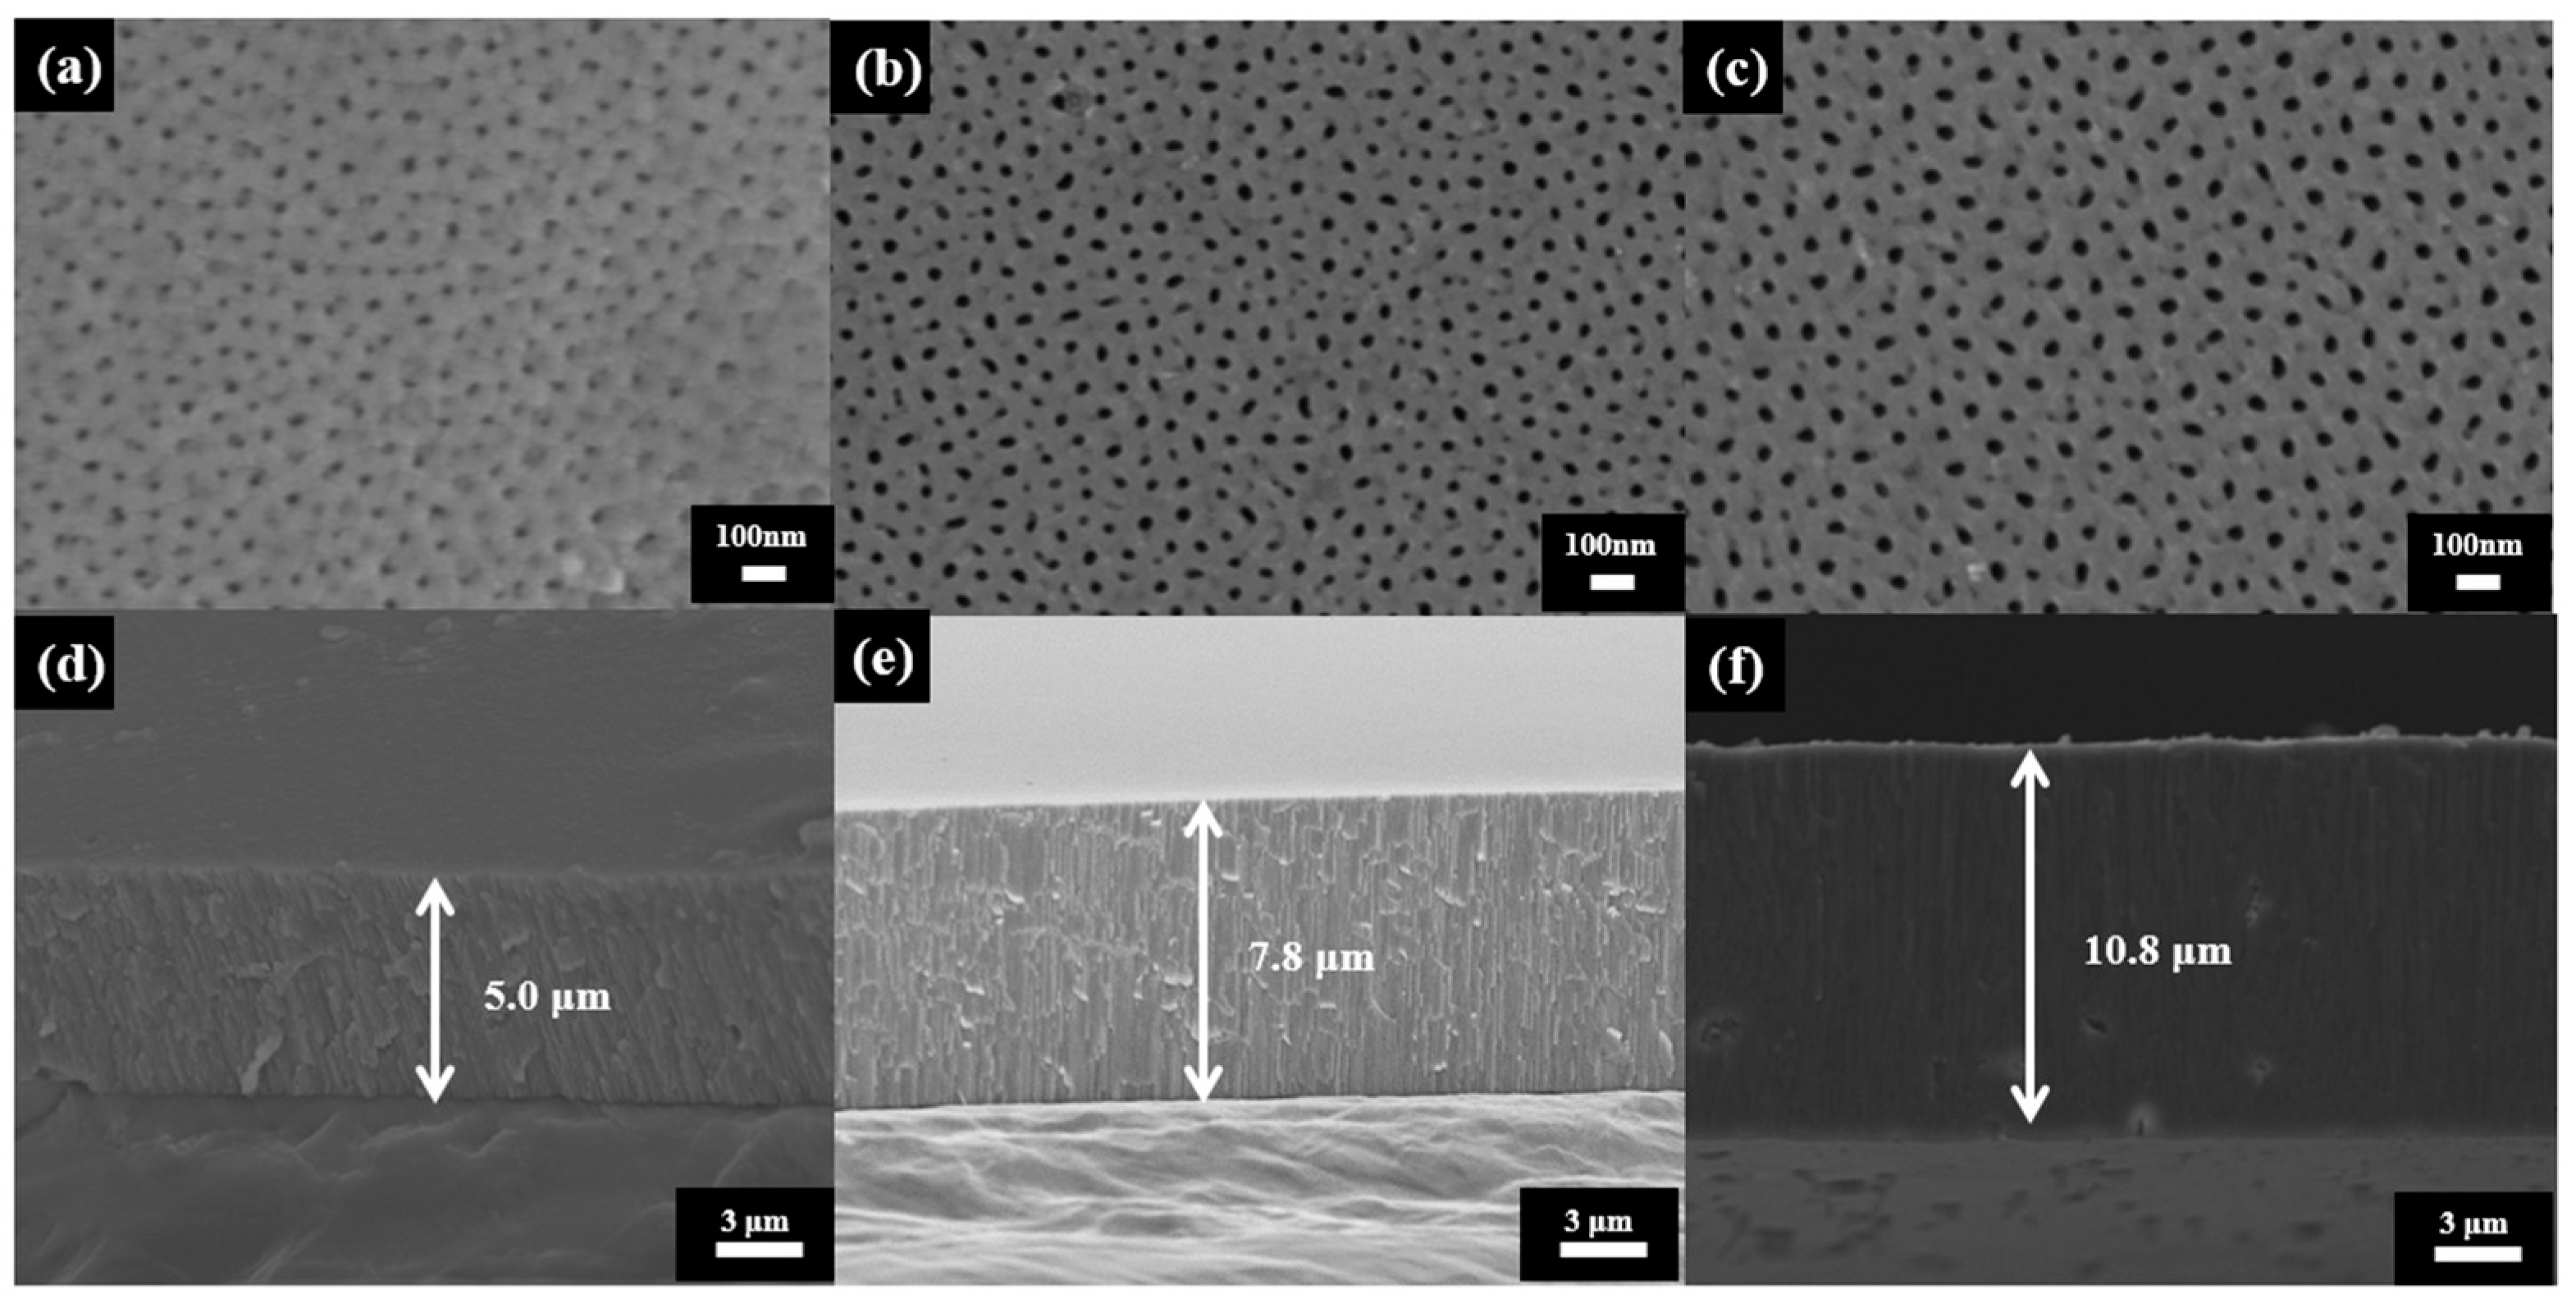
The SEM images of the AAO nanopore structures prepared at 20 V, 30 V and 40 V are shown in Figure 2. Figure 2a–c represent the top view of the AAO pore structure, while Figure 2d–f are the cross-section views of the AAO thickness. Specifically, Figure 2a,d correspond to AAO prepared at 20 V, Figure 2b,e at 30 V and Figure 2c,f at 40 V. The commercial software ImageJ is used for AAO morphology analysis, the average pore diameters after one-step anodization for 2 h at 25 °C in 0.3 M oxalic acid were determined to be 19.89 ± 5.2 nm, 25.33 ± 5.0 nm and 32.56 ± 4.4 nm for 20 V, 30 V and 40 V, respectively. The images clearly reveal that the AAO pore structures are complete without burning. It is attributed to the use of the self-made holder, which ensures the stability of the entire AAO formation process, and the HPA method effectively suppresses Joule heating. Generally, in traditional DCA anodization, the accumulated heat during the reaction would lead to burning of the nanostructures. Therefore, most processes are carried out at low temperatures (0–10 °C). However, the HPA preparation method ensures that there is no current generation during the negative period of anodization, thereby significantly reducing the generation of Joule heating and allowing the entire reaction to be carried out at room temperature. This greatly enhances the growth efficiency of AAO, approximately three to five times faster than traditional AAO growth rates. In our experiments, it can be observed that AAO prepared at 40 V exhibits the fastest growth rate, which is attributed to the quicker dissolution and deposition rates. When the voltage is increased, it enhances the carrier driving capability in the electrolyte, leading to faster ion diffusion into the AAO pore’s barrier layer. Additionally, as the current passes through the barrier layer, resistance generates a heating effect, further increasing the reaction rate. This higher anodization voltage contributes to improved reaction efficiency in AAO anodization. On the other hand, pore density is also a crucial indicator of AAO nanostructures because both density and diameter directly impact the sensor’s specific surface area. We have previously verified in our earlier papers that specific surface area is an important structural factor affecting sensor performance. According to the ImageJ software calculations from Figure 2a–c, the pore densities at 20 V, 30 V and 40 V are approximately 2.4 × 10¹⁰ pores/cm2, 1.56 × 10¹⁰ pores/cm2, and 9.5 × 10⁹ pores/cm2, respectively. Generally speaking, the interpore distance of AAO is directly proportional to anodization voltage. Therefore, in the same area, a higher anodization voltage will result in lower pore density, which aligns with our image analysis results.
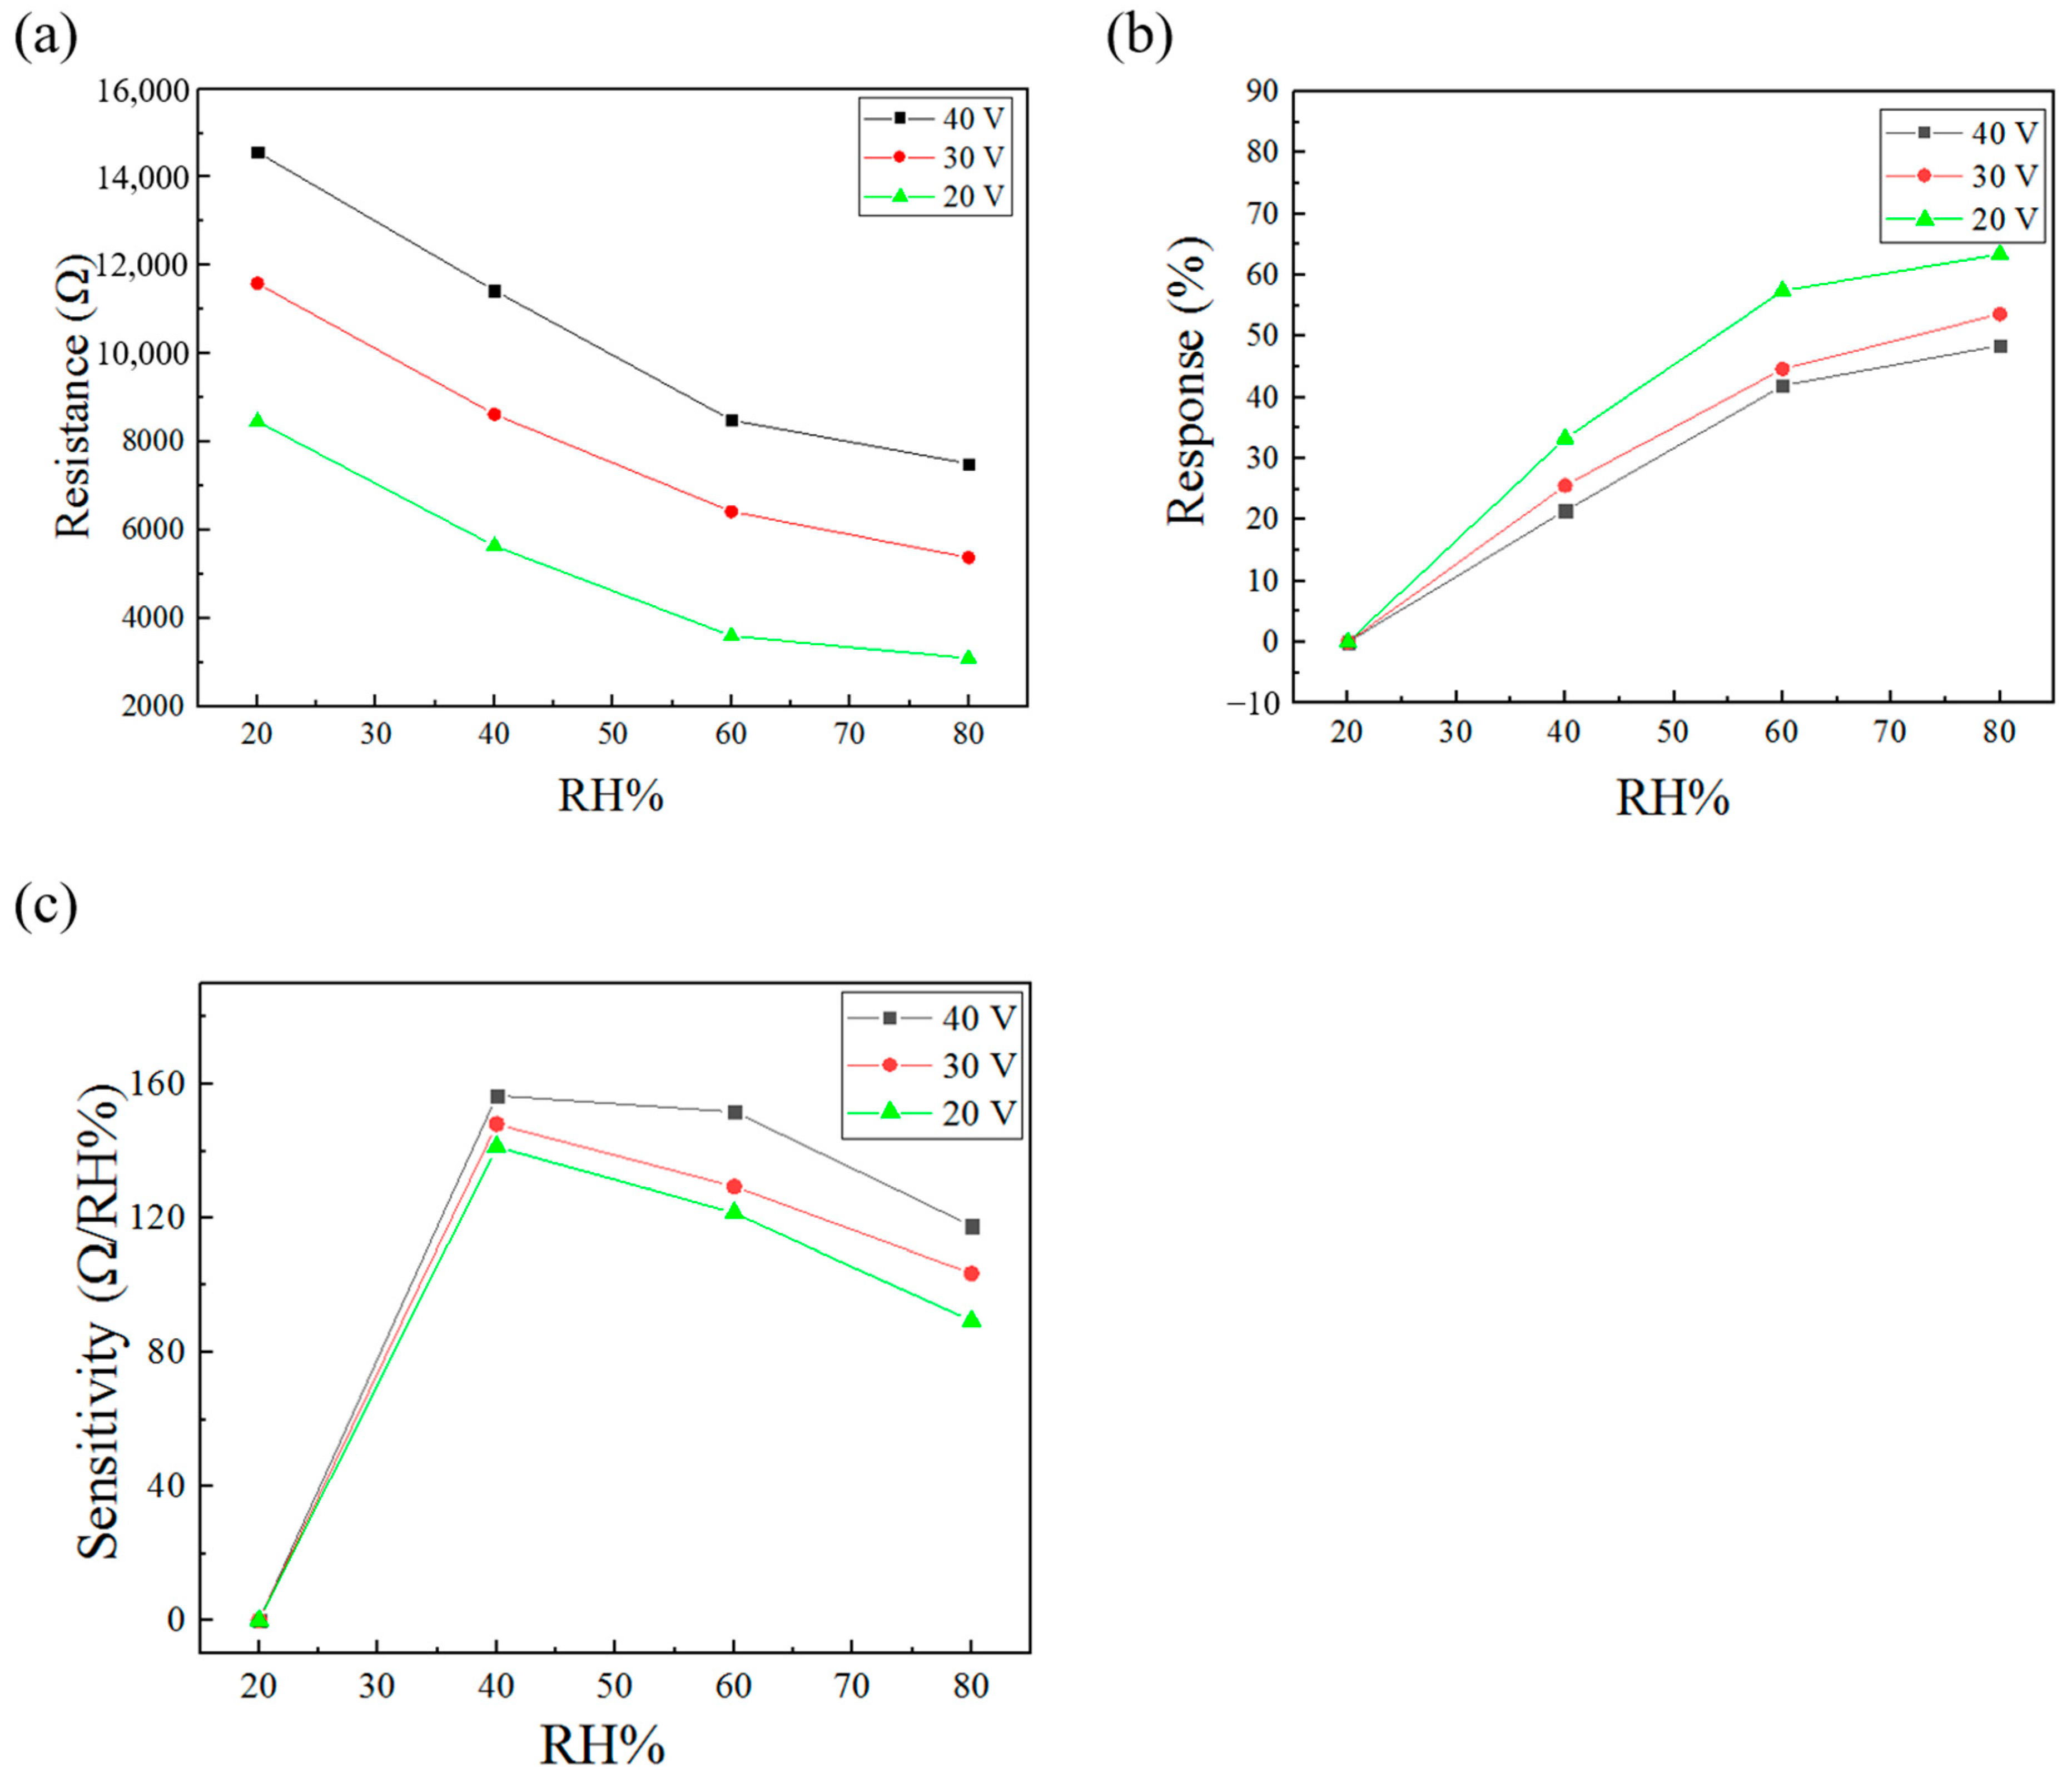
The humidity measurements for the AAO resistive sensors are shown in Figure 3a, and detailed resistance values are listed in Table 1. Each point represents the average of five measurements. At relative humidities of 20%, 40%, 60% and 80%, the resistance values for AAO sensors prepared at 20 V are 4834, 3021, 2057 and 1764 Ω, respectively. For the 30 V samples, the resistance values are 6621, 4829, 3666 and 3071 Ω, and for the 40 V AAO, the resistance values are 8321, 6532, 4852 and 4288 ohms. It is evident that as humidity increases, the resistance values decrease significantly.
Furthermore, the AAO sensor prepared at 40 V exhibits higher resistance values, which can be explained using the following resistance formula:
where ρ represents resistivity, l in this case is the thickness of the AAO, and A is the measurement area of the sensor. In the AAO sensor system, the thickness increases with the anodization voltage, as observed in the SEM image in Figure 2, where the 40 V AAO has the greatest thickness, resulting in the highest l and consequently the highest resistance values. Conversely, the 20 V AAO has the smallest thickness, leading to the lowest measured resistance values.
Figure 3b represents the response of AAO resistance sensors to relative humidity, where the response is defined as shown in Equation (2):
Here, R refers to the resistance value at a specific humidity level, and R0 is the resistance value at the initial measured humidity, which is 20% relative humidity in this case. The response signifies the change in signal proportion, where a higher proportion indicates that the sensor can better distinguish different humidity levels. It is important to note that the proportion is not only related to the absolute change in resistance values but also to the magnitude of the initial value. The signal change proportion, in the context of AAO nanostructures, represents either the specific surface area or the total circumference, as confirmed by our previous findings [36]. To predict the impact of different AAO nanostructures on sensing performance, we can define the resistance values R0 at low humidity and the resistance R at a specific humidity as follows:
At low humidity, the AAO nanopores are predominantly filled with air. Since the resistivity of air is extremely high, it can be virtually ignored. The resistance is nearly determined by AAO, as shown in Formula (3). As humidity increases, the sensor transforms into a parallel structure of AAO and water molecules in the pores, as indicated in Formula (4). Substituting Formulas (3) and (4) back into Formula (2), the response is primarily influenced by the resistance contributed by the water molecules, as expressed in Formula (5). Furthermore, according to Formula (1), as the area A occupied by the water molecules increases, the resistance decreases and results in a higher response. The area occupied by moisture in the AAO nanopores is mainly influenced by the rise in humidity or an increase in the total pore circumference (PCtotal).
Since AAO nanostructures grow vertically downward, the size of the PCtotal can also represent the specific surface area. The calculation of the PCtotal can be simplified as explained in Equation (6):
where PCtotal represents the total circumference length, n is the number of AAO nanopores per unit area, and Dp is the diameter of AAO nanopores. Calculating by the formula, the total circumferences within 1 square centimeter sensing area for AAO prepared at 20 V, 30 V and 40 V are 1.5 × 10¹² nm, 1.24 × 10¹² nm and 9.7 × 10¹¹ nm, respectively. It is evident that the AAO produced at 20 V has the highest water vapor adsorption ratio. Therefore, as humidity increases, the proportion of signal change is faster compared to other samples. This is also reflected in Figure 3b, where the AAO prepared at 20 V shows the highest response. At relative humidities of 20%, 40%, 60% and 80%, the responses for 20 V AAO are 0%, 33.3%, 57.4% and 63.4%, respectively. For 30 V AAO, the responses are 0%, 25.6%, 44.6% and 53.6%, and for 40 V AAO, the responses are 0%, 21.5%, 41.9% and 48.5%, respectively. Indeed, despite having the lowest signal in terms of resistance values, the 20 V AAO demonstrates the highest response, which aligns with the predictions based on the formula.
Figure 3c depicts the differential sensitivity of the AAO resistance sensor, as defined by Equation (7):
where RH represents the specific humidity during measurement, and RH0 is the initial humidity, which in this system is 20%. Differential sensitivity refers to the change in resistance for every 1% humidity variation, making it a reference based on the absolute change in resistance. Unlike the response, which emphasizes the percentage of change and is influenced to a considerable extent by the initial value, differential sensitivity focuses on the absolute value, and its relationship with the initial value is not as pronounced. Furthermore, differential sensitivity relates to the overall surface area of the AAO sensor, as the absolute signal value is associated with the total surface area, not the responsive specific surface area. The total surface area () of the AAO sensor can be straightforwardly calculated using Equation (8):
where PCtotal is the total circumference mentioned in Equation (6), and l represents the thickness of the AAO. Since AAO grows vertically downward, multiplying the total circumference by the thickness provides the surface area. By calculating the values using Formula (8), the total surface areas for AAO prepared at 20 V, 30 V and 40 V are 7.5 × 10¹⁵ square nanometers, 9.7 × 10¹⁵ square nanometers, and 1.05 × 10¹⁶ square nanometers, respectively. Therefore, it can be concluded that AAO prepared at 40 V exhibits the best differential sensitivity due to having the largest total surface area, which is consistent with the measurements shown in Figure 3c. At relative humidities of 20%, 40%, 60% and 80%, the differential sensitivities of the 20 V AAO sensor reach 0, 141.2, 121.4 and 89.4 Ω/RH%, while those of the 30 V AAO are 0, 148, 129.3 and 103.6 Ω/RH%, and finally, the 40 V AAO has sensitivities of 0, 156.6, 151.7 and 117.6 Ω/RH%. The data show that the AAO resistance humidity sensor prepared at 40 V exhibits the highest differential sensitivity, which aligns with the predictions from the formula. Furthermore, the resistance-based AAO humidity sensor demonstrates a higher differential sensitivity at low humidity levels and a faster increase in response. This is in contrast to capacitive sensors, which present higher differential sensitivity and larger signal changes at high humidity, indicating that resistance-based sensors perform better at low humidity levels. To predict the impact of the nanostructure on the differential sensitivity from Formula (7), we can identify that R-R0 is a critical parameter, as shown in Formula (9). In the calculation of response, it is observed that the area and thickness of the sensor do not have an impact. However, differential sensitivity is different. Substituting Formula (1), it is evident that both the area and thickness of the sensor are important parameters. A greater thickness increases sensitivity, while a larger PCtotal increases the water absorption area (A), leading to a decrease in differential sensitivity. Therefore, we can observe that the 40 V AAO, which has the smallest total circumference, exhibits the optimal differential sensitivity due to it having the largest .
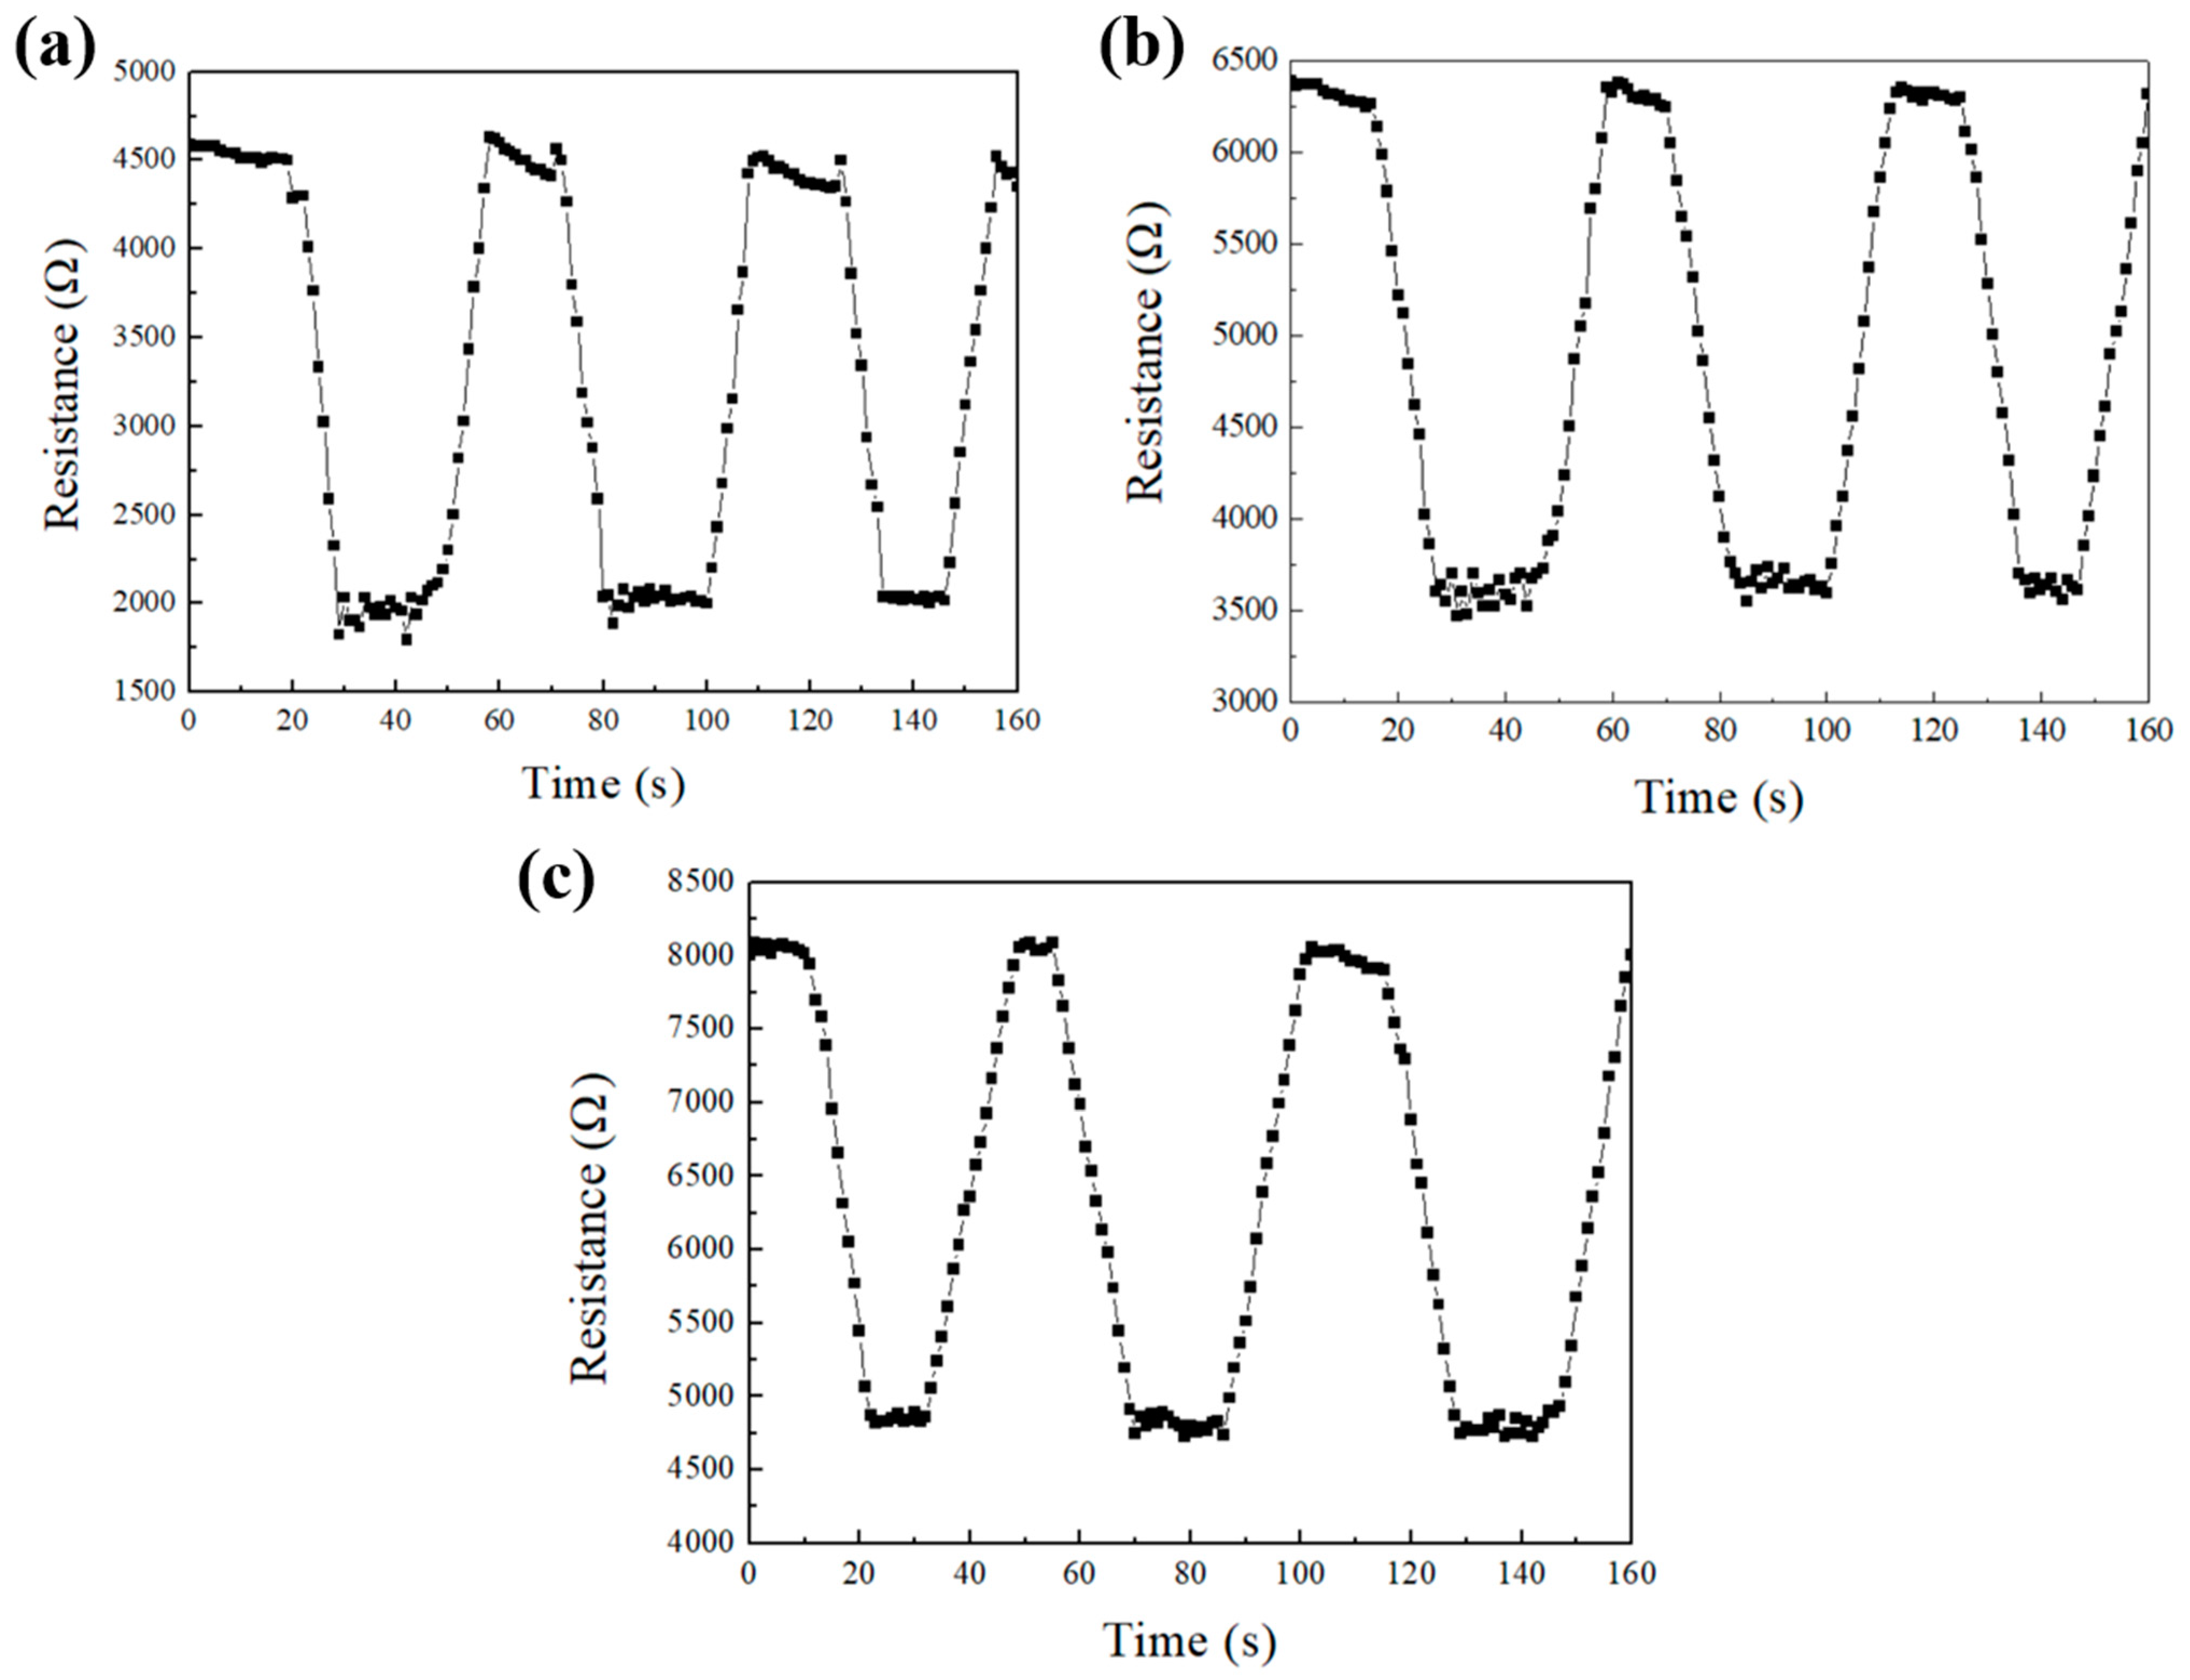
Figure 4 illustrates the response–recovery time of the AAO humidity sensors, where Figure 4a–c correspond to AAO prepared at 20 V, 30 V and 40 V, respectively. The humidity is switched by introducing dry air to a humidity of 25% and indoor humidity (60%), and the response–recovery time is defined as the time it takes for the resistance to reach 90% of the stable value. In Figure 4a, the response–recovery time is the fastest, taking approximately 9 s to reach near the stable value. This result is attributed to the thinner AAO thickness prepared at 20 V, resulting in a shorter diffusion path for moisture. In Figure 4b,c, the response–recovery times are approximately 11–12 s and 14–15 s, respectively. This is primarily due to the greater thickness of the AAO, leading to a longer diffusion path.
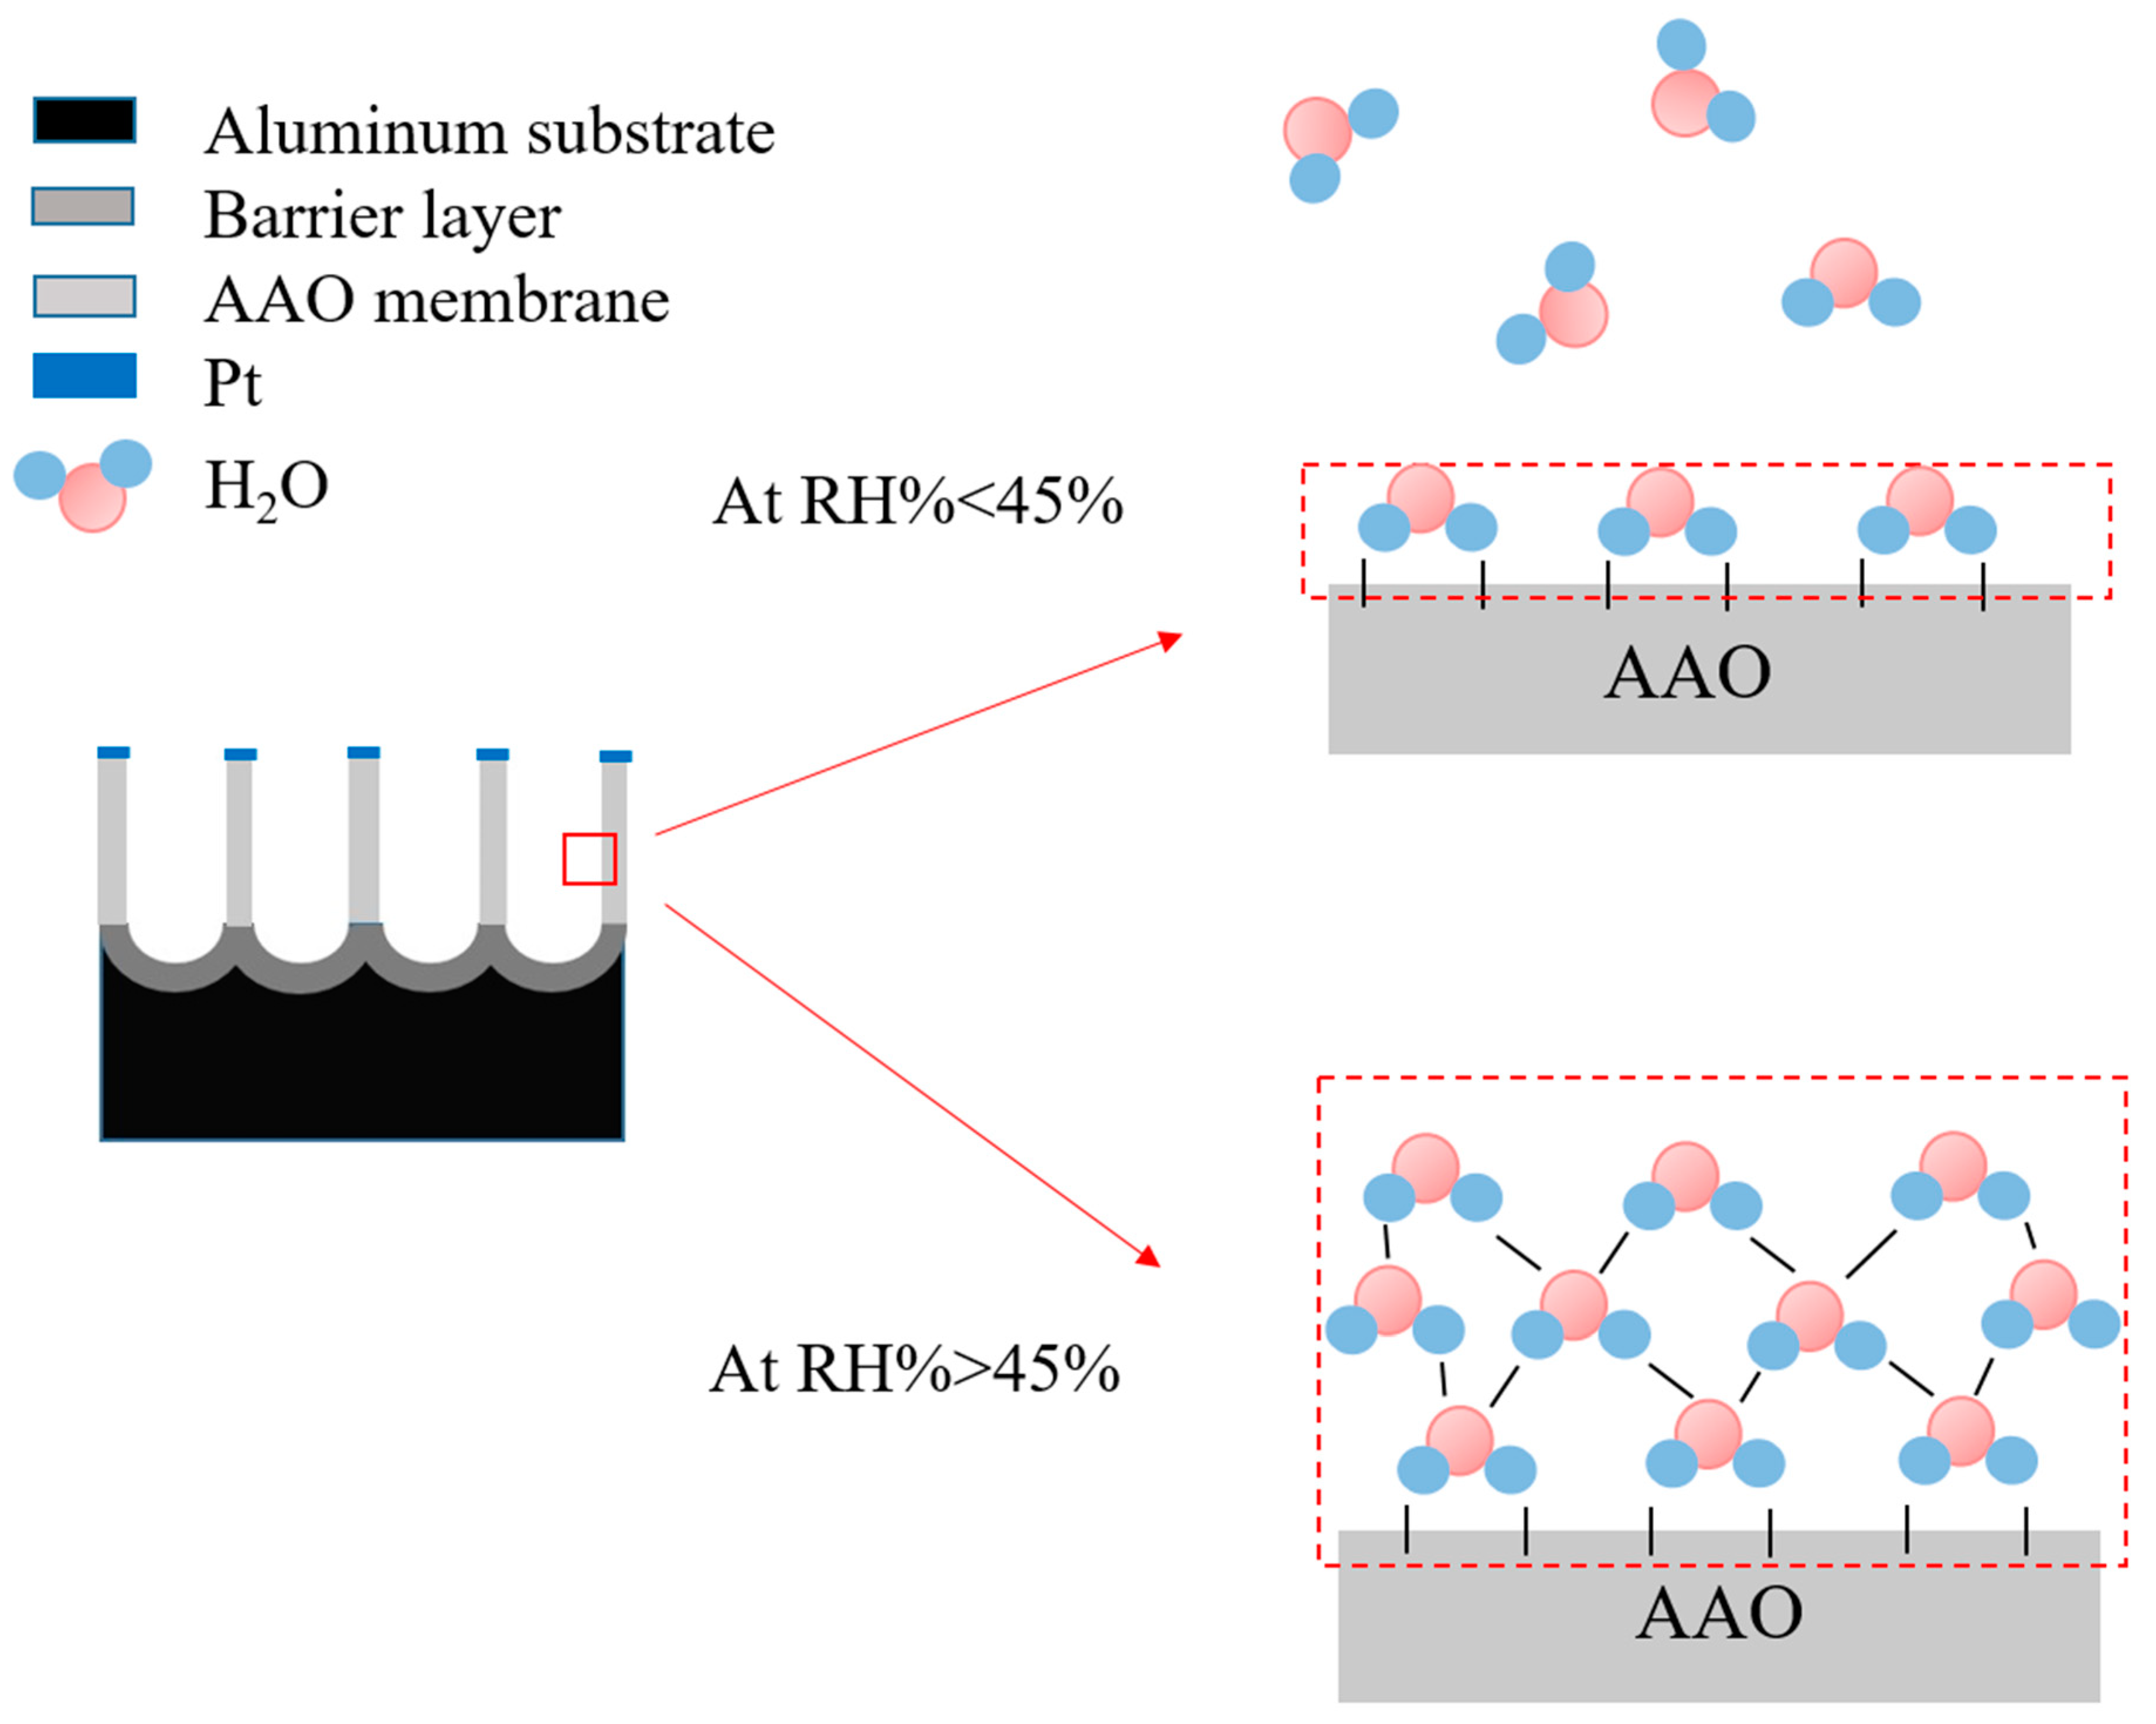
The measurement mechanism of the AAO humidity sensor at different humidity levels is illustrated in Figure 5. Since AAO is a ceramic material rather than a semiconductor or carbon-based material, the electrical properties of the pore walls do not change significantly from water vapor adsorption. Therefore, the principle can be broadly explained using the adsorption theory [30] and a parallel system [3,36]. According to the adsorption principle, at a relative humidity below 45%, only a single chemisorbed layer is formed. As humidity increases, multiple physisorbed layers of water vapor molecules will stack on the chemisorption layer. In the AAO humidity sensor, water vapor adsorption can be explained as a parallel system to the AAO pore walls. In the case of capacitance measurement, the signal contribution comes from the sum of the capacitance from both AAO and water vapor. Therefore, as humidity increases, the capacitance rapidly increases following a natural function curve. However, in the resistive AAO sensor measurement system, the total resistance comes from the reciprocal of both the AAO pore walls and the water vapor, as shown in Equation (4). As the humidity rises, the change in resistance due to water vapor has a relatively small impact, which makes the resistive AAO humidity sensor less responsive at high humidity levels. At the same time, it enhances the sensitivity of the resistive AAO sensor at low humidity levels, as shown in Figure 3c.
4. Conclusions
The relationship between the AAO nanostructures and resistive humidity sensors is discussed in detail from our research. In the anodization process, voltage is the most significant parameter and the focus of our research investigation. We successfully applied the HPA method to produce AAO at room temperature using voltages ranging from 20 V to 40 V in a one-step process with AA1050 substrate, addressing the high-cost and time-consuming disadvantages from the traditional two-step process by high-purity Al at low temperatures. The impact of the anodization potential on the morphology of nanopores and its interplay with humidity sensing performance are thoroughly explored in this experiment. The resistance measurement primarily depends on the thickness of AAO, so the higher anodization voltages contribute to greater signal intensity under the same processing time. Sensor response indicates the change in signal ratio from different relative humidity, and therefore sensors with a higher specific surface area exhibit a better response. In the AAO sensor system, the total pore circumference is directly proportional to the specific surface area. Therefore, AAO sensors prepared at low voltages with high pore densities result in higher response values. However, in terms of sensor performance based on differential sensitivity, the main structural factor is the surface area. With AAO prepared at 40 V, the highest surface area is calculated with the largest signal change, leading to the highest differential sensitivity. Furthermore, the AAO humidity sensor can be categorized as a parallel system of aluminum oxide and water molecules. Therefore, as humidity increases, the decrease in the total resistance of the sensor tends to slow down at high humidity levels, which results in higher sensitivity at low humidity levels from resistive AAO sensors. In the future, it is worth studying the lifetime of AAO humidity sensors and their integration into industrial applications.
Author Contributions
Conceptualization, C.-A.K. and C.-K.C.; methodology, C.-A.K., C.-W.H. and C.-K.C.; validation, C.-A.K., C.-W.H. and C.-K.C.; formal analysis, C.-A.K., C.-W.H. and C.-K.C.; investigation, C.-A.K. and C.-K.C.; resources, C.-K.C.; data curation, C.-A.K. and C.-W.H.; writing—original draft preparation, C.-A.K. and C.-W.H.; writing—review and editing, C.-K.C.; visualization, C.-A.K. and C.-W.H.; supervision, C.-K.C.; funding acquisition, C.-K.C. All authors have read and agreed to the published version of the manuscript.
Funding
This work is partially sponsored by the Ministry of Science and Technology (MOST), which is now named the National Science and Technology Council (NSTC), Taiwan, under contract No. MOST110-2221-E-006-177 and NSTC112-2221-E006-172-MY3. Additionally, it is supported in part by the Higher Education Sprout Project, Ministry of Education to the Headquarters of University Advancement at National Cheng Kung University (NCKU).
Data Availability Statement
Data are presented in the coauthors’ research results and schematic drawing available on request.
Acknowledgments
We also thank the Core Facility Center in NCKU for some equipment support.
Conflicts of Interest
The authors declare no conflicts of interest.
References
- Duan, Z.; Yuan, Z.; Jiang, Y.; Liu, Y.; Tai, H. Amorphous carbon material of daily carbon ink: Emerging applications in pressure, strain, and humidity sensors. J. Mater. Chem. C 2023, 11, 5585–5600. [Google Scholar] [CrossRef]
- Ma, Z.; Fei, T.; Zhang, T. An overview: Sensors for low humidity detection. Sens. Actuators B Chem. 2023, 376, 133039. [Google Scholar] [CrossRef]
- Ku, C.A.; Chung, C.K. Advances in Humidity Nanosensors and Their Application: Review. Sensors 2023, 23, 2328. [Google Scholar] [CrossRef] [PubMed]
- Rao, X.; Zhao, L.; Xu, L.; Wang, Y.; Liu, K.; Wang, Y.; Chen, G.Y.; Liu, T.; Wang, Y. Review of Optical Humidity Sensors. Sensors 2021, 21, 8049. [Google Scholar] [CrossRef] [PubMed]
- Wang, Y.; Li, J.; Guo, L.N.; Tian, M.; Meng, F. Development of fabrication technique and sensing performance of optical fiber humidity sensors in the most recent decade. Measurement 2023, 215, 112888. [Google Scholar] [CrossRef]
- Delipinar, T.; Shafique, A.; Gohar, M.S.; Yapici, M.K. Fabrication and materials integration of flexible humidity sensors for emerging applications. ACS Omega 2021, 6, 8744–8753. [Google Scholar] [CrossRef] [PubMed]
- Mishra, S.; Singh, A.K. Optical sensors for water and humidity and their further applications. Coord. Chem. Rev. 2021, 445, 214063. [Google Scholar] [CrossRef]
- Hou, A.; Chen, H.; Zheng, C.; Xie, K.; Gao, A. Assembly of a Fluorescent Chiral Photonic Crystal Membrane and Its Sensitive Responses to Multiple Signals Induced by Small Molecules. ACS Nano 2020, 14, 7380–7388. [Google Scholar] [CrossRef]
- Yu, L.; Xu, H.; Monro, T.M.; Lancaster, D.G.; Xie, Y.; Zeng, H.; Chen, G.Y.; Liu, X. Ultrafast colorimetric humidity-sensitive polyelectrolyte coating for touchless control. Mater. Horiz. 2016, 4, 72–82. [Google Scholar] [CrossRef]
- Nakajima, T.; Fujio, Y.; Sugahara, T.; Tsuchiya, T. Flexible Ceramic Film Sensors for Free-Form Devices. Sensors 2022, 22, 1996. [Google Scholar] [CrossRef]
- Foucaud, M.; Renka, S.; Klaser, T.; Popović, J.; Skoko, Ž.; Mošner, P.; Noudelkal, L.; Šantić, A. Sodium-Ion Conductivity and Humidity-Sensing Properties of Na2O-MoO3-P2O5 Glass-Ceramics. Nanomaterials 2022, 12, 240. [Google Scholar] [CrossRef] [PubMed]
- Kalyakin, A.S.; Danilov, N.A.; Volkov, A.N. Determining humidity of nitrogen and air atmospheres by means of a protonic ceramic sensor. J. Electroanal. Chem. 2021, 895, 115523. [Google Scholar] [CrossRef]
- Tripathy, A.; Sharma, P.; Pramanik, S.; Silva, F.S.; Bin Abu Osman, N.A. Armalcolite Nanocomposite: A New Paradigm for Flexible Capacitive Humidity Sensor. IEEE Sens. J. 2021, 21, 14685–14692. [Google Scholar] [CrossRef]
- Lazarova, K.; Bozhilova, S.; Christova, D.; Babeva, T. Poly(vinyl alcohol)-based thin films for optical humidity sensing. J. Phys. Conf. Ser. 2020, 1492, 012040. [Google Scholar] [CrossRef]
- Lazarova, K.; Bozhilova, S.; Novakov, C.; Christova, D.; Babeva, T. Amphiphilic Poly(vinyl Alcohol) Copolymers Designed for Optical Sensor Applications—Synthesis and Properties. Coatings 2020, 10, 460. [Google Scholar] [CrossRef]
- Zhou, L.; Wang, M.; Liu, Z.; Guan, J.; Li, T.; Zhang, D. High-performance humidity sensor based on graphitic carbon nitride/polyethylene oxide and construction of sensor array for non-contact humidity detection. Sens. Actuators B Chem. 2021, 344, 130219. [Google Scholar] [CrossRef]
- Kim, J.; Cho, J.H.; Lee, H.M.; Hong, S.M. Capacitive Humidity Sensor Based on Carbon Black/Polyimide Composites. Sensors 2021, 21, 1974. [Google Scholar] [CrossRef] [PubMed]
- Zhao, H.; Zhang, T.; Qi, R.; Dai, J.; Liu, S.; Fei, T. Drawn on paper: A reproducible humidity sensitive device by handwriting. ACS Appl. Mater. Interfaces 2017, 9, 28002–28009. [Google Scholar] [CrossRef]
- Bi, H.; Yin, K.; Xie, X.; Ji, J.; Wan, S.; Sun, L.; Terrones, M.; Dresselhaus, M.S. Ultrahigh humidity sensitivity of graphene oxide. Sci. Rep. 2013, 3, 2714. [Google Scholar] [CrossRef]
- Anju, V.P.; Jithesh, P.R.; Narayanankutty, S.K. A novel humidity and ammonia sensor based on nano-fibers/polyaniline/polyvinyl alcohol. Sens. Actuators A Phys. 2019, 285, 35–44. [Google Scholar] [CrossRef]
- Jeong, Y.; Hong, S.; Jung, G.; Shin, W.; Park, J.; Kim, D.; Choi, Y.S.; Bae, J.-H.; Hong, B.H.; Lee, J.-H. Highly stable Si MOSFET-type humidity sensor with ink-jet printed graphene quantum dots sensing layer. Sens. Actuators B Chem. 2021, 343, 130134. [Google Scholar] [CrossRef]
- Yan, M.; Wu, Y.; Hua, Z.; Lu, N.; Sun, W.; Zhang, J.; Fan, S. Humidity compensation based on power-law response for MOS sensors to VOCs. Sens. Actuators B Chem. 2021, 334, 129601. [Google Scholar] [CrossRef]
- Yang, M.-Y.; Huang, M.-L.; Li, Y.-Z.; Feng, Z.-S.; Huang, Y.; Chen, H.-J.; Xu, Z.-Q.; Liu, H.-G.; Wang, Y. Printing assembly of flexible devices with oxidation stable MXene for high performance humidity sensing applications. Sens. Actuators B Chem. 2022, 364, 131867. [Google Scholar] [CrossRef]
- Xing, H.; Li, X.; Lu, Y.; Wu, Y.; He, Y.; Chen, Q.; Liu, Q.; Han, R.P. MXene/MWCNT electronic fabric with enhanced mechanical robustness on humidity sensing for real-time respiration monitoring. Sens. Actuators B Chem. 2022, 361, 131704. [Google Scholar] [CrossRef]
- Shaukat, R.A.; Saqib, Q.M.; Khan, M.U.; Chougale, M.Y.; Bae, J. Bio-waste sunflower husks powder based recycled triboelectric nanogenerator for energy harvesting. Energy Rep. 2021, 7, 724–731. [Google Scholar] [CrossRef]
- Farahani, E.; Mohammadpour, R. Fabrication of flexible self-powered humidity sensor based on super-hydrophilic titanium oxide nanotube arrays. Sci. Rep. 2020, 10, 13032. [Google Scholar] [CrossRef] [PubMed]
- Podgolin, S.K.; Petukhov, D.I.; Dorofeev, S.G.; Eliseev, A.A. Anodic alumina membrane capacitive sensors for detection of vapors. Talanta 2020, 219, 121248. [Google Scholar] [CrossRef]
- Chung, C.K.; Ku, C.A. An Effective Resistive-Type Alcohol Vapor Sensor Using One-Step Facile Nanoporous Anodic Alumina. Micromachines 2023, 14, 1330. [Google Scholar] [CrossRef]
- Ku, C.A.; Yu, C.Y.; Hung, C.W.; Chung, C.K. Advances in the Fabrication of Nanoporous Anodic Aluminum Oxide and Its Applications to Sensors: A Review. Nanomaterials 2023, 13, 2853. [Google Scholar] [CrossRef]
- Nahar, R. Study of the performance degradation of thin film aluminum oxide sensor at high humidity. Sens. Actuators B Chem. 2000, 63, 49–54. [Google Scholar] [CrossRef]
- Kim, Y.; Jung, B.; Lee, H.; Kim, H.; Lee, K.; Park, H. Capacitive humidity sensor design based on anodic aluminum oxide. Sens. Actuators B Chem. 2009, 141, 441–446. [Google Scholar] [CrossRef]
- Kashi, M.A.; Ramazani, A.; Abbasian, H.; Khayyatian, A. Capacitive humidity sensors based on large diameter porous alumina prepared by high current anodization. Sens. Actuators A Phys. 2012, 174, 69–74. [Google Scholar] [CrossRef]
- Chen, S.W.; Khor, O.K.; Liao, M.W.; Chung, C.K. Sensitivity evolution and enhancement mechanism of porous anodic aluminum oxide humidity sensor using magnetic field. Sens. Actuators B Chem. 2014, 199, 384–388. [Google Scholar] [CrossRef]
- Chung, C.K.; Khor, O.K.; Syu, C.J.; Chen, S.W. Effect of oxalic acid concentration on the magnetically enhanced capacitance and resistance of AAO humidity sensor. Sens. Actuators B Chem. 2015, 210, 69–74. [Google Scholar] [CrossRef]
- Balde, M.; Vena, A.; Sorli, B. Fabrication of porous anodic aluminium oxide layers on paper for humidity sensors. Sens. Actuators B Chem. 2015, 220, 829–839. [Google Scholar] [CrossRef]
- Chung, C.K.; Ku, C.A.; Wu, Z.E. A high-and-rapid-response capacitive humidity sensor of nanoporous anodic alumina by one-step anodizing commercial 1050 aluminum alloy and its enhancement mechanism. Sens. Actuators B Chem. 2021, 343, 130156. [Google Scholar] [CrossRef]
- He, Z.; Yao, L.; Zheng, M.; Ma, L.; He, S.; Shen, W. Enhanced humidity sensitivity of nanoporous alumina films by controlling the concentration and type of impurity in pore wall. Phys. E Low-Dimens. Syst. Nanostructures 2010, 43, 366–371. [Google Scholar] [CrossRef]
- Sharma, K.; Islam, S.S. Optimization of porous anodic alumina nanostructure for ultra high sensitive humidity sensor. Sens. Actuators B Chem. 2016, 237, 443–451. [Google Scholar] [CrossRef]
Figure 1.
(a) The AAO humidity sensor structure and (b) the AAO nanopore morphology parameters.

Figure 2.
The SEM micrographs of AAO humidity sensors. (a–c) top views of AAO at 20 V, 30 V and 40 V with pore diameters of 19.89 ± 5.2 nm, 25.33 ± 5.0 nm, 32.56 ± 4.4 nm, respectively. (d–f) the cross-section views of AAO at 20 V, 30 V and 40 V with thicknesses of 5.0, 7.8 and 10.8 μm, respectively.

Figure 3.
(a) The resistance vs. relative humidity diagram from AAO sensors prepared at 20 V, 30 V and 40 V. (b) The sensor response of the AAO resistive humidity sensor calculated by (a). (c) The corresponding sensor sensitivity of the AAO resistive humidity sensor calculated by (a).
Figure 3.
(a) The resistance vs. relative humidity diagram from AAO sensors prepared at 20 V, 30 V and 40 V. (b) The sensor response of the AAO resistive humidity sensor calculated by (a). (c) The corresponding sensor sensitivity of the AAO resistive humidity sensor calculated by (a).

Figure 4.
The response–recovery time diagram of AAO humidity sensors. (a) AAO prepared at 20 V with response–recovery time of 9 s. (b) AAO prepared at 30 V with response–recovery time of 11–12 s. (c) AAO prepared at 40 V with response–recovery time of 14–15 s.
Figure 4.
The response–recovery time diagram of AAO humidity sensors. (a) AAO prepared at 20 V with response–recovery time of 9 s. (b) AAO prepared at 30 V with response–recovery time of 11–12 s. (c) AAO prepared at 40 V with response–recovery time of 14–15 s.

Figure 5.
The schematic diagram of the water molecule adsorption on AAO sensor surface at lower humidity (RH% < 45%) and higher humidity (RH% > 45%).
Figure 5.
The schematic diagram of the water molecule adsorption on AAO sensor surface at lower humidity (RH% < 45%) and higher humidity (RH% > 45%).


Table 1.
The measured resistance from AAO humidity sensors made at 20 V to 40 V under a relative humidity ranging from 20% to 80%.
Table 1.
The measured resistance from AAO humidity sensors made at 20 V to 40 V under a relative humidity ranging from 20% to 80%.
| Relative Humidity | The Resistance Value from AAO Sensors (Ω) | ||
|---|---|---|---|
| 20 V AAO | 30 V AAO | 40 V AAO | |
| 20% | 4834 | 6621 | 8321 |
| 40% | 3021 | 4829 | 6532 |
| 60% | 2057 | 3666 | 4852 |
| 80% | 1764 | 3071 | 4288 |
Disclaimer/Publisher’s Note: The statements, opinions and data contained in all publications are solely those of the individual author(s) and contributor(s) and not of MDPI and/or the editor(s). MDPI and/or the editor(s) disclaim responsibility for any injury to people or property resulting from any ideas, methods, instructions or products referred to in the content. |
© 2024 by the authors. Licensee MDPI, Basel, Switzerland. This article is an open access article distributed under the terms and conditions of the Creative Commons Attribution (CC BY) license (https://creativecommons.org/licenses/by/4.0/).
Share and Cite
MDPI and ACS Style
Ku, C.-A.; Hung, C.-W.; Chung, C.-K. Influence of Anodic Aluminum Oxide Nanostructures on Resistive Humidity Sensing. Nanomanufacturing 2024, 4, 58-68. https://doi.org/10.3390/nanomanufacturing4010004
AMA Style
Ku C-A, Hung C-W, Chung C-K. Influence of Anodic Aluminum Oxide Nanostructures on Resistive Humidity Sensing. Nanomanufacturing. 2024; 4(1):58-68. https://doi.org/10.3390/nanomanufacturing4010004
Chicago/Turabian StyleKu, Chin-An, Chia-Wei Hung, and Chen-Kuei Chung. 2024. "Influence of Anodic Aluminum Oxide Nanostructures on Resistive Humidity Sensing" Nanomanufacturing 4, no. 1: 58-68. https://doi.org/10.3390/nanomanufacturing4010004