Article

In Situ Monitoring of Non-Thermal Plasma Cleaning of Surfactant Encapsulated Nanoparticles

1
Center for Functional Nanomaterials, Brookhaven National Laboratory, Upton, NY 11973, USA
2
Department of Materials Science and Chemical Engineering, Stony Brook University, Stony Brook, NY 11790, USA
3
Catalysis Center for Energy Innovation, Department of Chemical and Biomolecular Engineering, University of Delaware, Newark, DE 19716, USA
*
Authors to whom correspondence should be addressed.
Nanomaterials 2024, 14(3), 290; https://doi.org/10.3390/nano14030290
Submission received: 28 December 2023 / Revised: 24 January 2024 / Accepted: 26 January 2024 / Published: 31 January 2024
(This article belongs to the Special Issue Advanced Understanding of Metal Nanoparticles in Catalysts)

Abstract

:
Surfactants are widely used in the synthesis of nanoparticles, as they have a remarkable ability to direct their growth to obtain well-defined shapes and sizes. However, their post-synthesis removal is a challenge, and the methods used often result in morphological changes that defeat the purpose of the initial controlled growth. Moreover, after the removal of surfactants, the highly active surfaces of nanomaterials may undergo structural reconstruction by exposure to a different environment. Thus, ex situ characterization after air exposure may not reflect the effect of the cleaning methods. Here, combining X-ray photoelectron spectroscopy, in situ infrared reflection absorption spectroscopy, and environmental transmission electron microscopy measurements with CO probe experiments, we investigated different surfactant-removal methods to produce clean metallic Pt nanoparticles from surfactant-encapsulated ones. It was demonstrated that both ultraviolet-ozone (UV-ozone) treatment and room temperature O2 plasma treatment led to the formation of Pt oxides on the surface after the removal of the surfactant. On the other hand, when H2 was used for plasma treatment, both the Pt0 oxidation state and nanoparticle size distribution were preserved. In addition, H2 plasma treatment can reduce Pt oxides after O2-based treatments, resulting in metallic nanoparticles with clean surfaces. These findings provide a better understanding of the various options for surfactant removal from metal nanoparticles and point toward non-thermal plasmas as the best route if the integrity of the nanoparticle needs to be preserved.

1. Introduction

Synthesis of metal nanoparticles is of great importance in both fundamental studies and practical applications [1,2,3,4,5], such as heterogeneous catalysis [6,7,8,9], drug delivery [10,11], quantum dots [12], electronic devices, and purification systems [13,14,15]. A common strategy used in wet synthesis to control nanoparticle size is adding surfactants [16,17,18,19]. As a result, the nanoparticle surface is decorated by surfactant molecules, which prevent particle aggregation and thus stabilize the particles at the nanoscale. Generally, the surfactants used in synthesis include alkyl-based molecules, peptides, lipids, deoxyribonucleic acid (DNA), and polymers covalently grafted to or non-covalently assembled on nanoparticle surfaces, thereby changing their properties [6]. For example, when organic ligands are used, the size of nanoparticles can be controlled, and the shape of nanoparticles can be regulated [20,21,22,23,24,25]. The different atomic arrangements on crystal surfaces can affect catalytic behavior in terms of activity, selectivity, and durability. However, for most applications, the surfactant layer needs to be removed post-synthesis; this is true for, for example, in catalysis, where the surface sites need to be accessible to reactants, and in biomedical applications, due to the high cytotoxicity of the surfactants [26,27,28,29].
Thermal treatment is one of the most efficient strategies for removing hydrocarbons [30]. However, the decomposition of hydrocarbons requires a relatively high temperature, which may induce changes in the structure and surface composition of metal nanoparticles. Therefore, efforts have been made to develop cleaning strategies to remove the surfactant layer under non-thermal conditions. Among various approaches, ultraviolet-ozone (UV-ozone) [31,32] and oxygen (O2) plasma treatment [26,33,34,35] have been widely studied. The UV-ozone process involves the simultaneous UV-photon-induced activation of the C–H bonds (photosensitized process) and the oxidation by atomic oxygen O species derived from O3, resulting eventually in the decomposition of organic surfactants into carbon dioxide (CO2) and water (H2O). O2 plasma is abundant in highly reactive O species that participate in rapid oxidative degradation of organic species towards CO2 and H2O. Recently, atmospheric pressure helium (He)/O2 plasma was successfully applied to remove organic ligands and enhance the catalytic performance of supported palladium (Pd) nanocubes [36].
For both strategies, a clean surface can be obtained upon desorption of CO2 and H2O. Nevertheless, the oxidation reactions between oxygen species and surface metal atoms are inevitable, which lead to forming an oxide layer/cluster on the nanoparticles’ surface, and thus sequential reduction steps are required. To avoid the oxidation of metal nanoparticles, inert gases, such as argon or helium, have been used for plasma treatment [37]. In addition, the non-oxidative plasma treatments are ex situ operations (i.e., the sample is characterized after treatment rather than during). After plasma treatment, the sample is exposed to air. Thus, the highly active atoms on metal nanoparticles can react with airborne species (i.e., H2O, O2, hydrocarbons), which may lead to the modification of the active surface. It becomes inevitable that multiple reaction steps during surfactant layer removal result in structural transformations directly affecting the surface chemistry of metal nanoparticles. Thermal reduction treatments are expected to make those transformations even more prominent. Therefore, it is necessary to study nanoparticle structural transformations during the treatment (in situ). However, ex situ characterization techniques are poorly suited for this purpose as they do not necessarily reflect the actual modifications after particles are transferred between treatment and characterization chambers through air.
Recent developments in the field of in situ characterization (i.e., at relevant conditions) provide a unique opportunity to monitor structural changes of materials during non-thermal plasma treatment. For example, de Mello and co-workers [38] reported the in situ plasma treatment of metal-organic-framework (MOF) films using different gases. Infrared reflection absorption spectroscopy (IRRAS) shows that the O2 plasma treatment leads to the etching of organic ligands with the formation of carbonyl groups. In contrast, N2 plasma treatment induces mild etching and formation of nitrile groups on the MOF. Combining organic ligand cleavage and functionalization in that work results in enhanced selectivity in gas permeation using MOF-based membranes. More importantly, plasma treatment coupled with simultaneous spectroscopic measurements (in situ) at different conditions enables the fundamental understanding of surface modification by plasma treatment, eliminating the uncertainty of exposure to uncontrolled environments between the treatment and characterization steps (ex situ characterization).
In this work, surfactant-encapsulated platinum (Pt) nanoparticles have been synthesized through a chemical reduction method using cetyltrimethylammonium bromide (CTAB) and oleylamine as protecting agents. We characterize the surface modification of metal nanoparticles using a combination of in situ spectroscopic measurements to illustrate the mechanistic aspects of surface cleaning by non-thermal plasma treatment in different gases, such as O2, H2, and sequential O2–H2. Ex situ UV-ozone treatment on surfactant-encapsulated Pt nanoparticles is also studied for comparison. Environmental TEM (ETEM) shows the efficient removal of surfactants by plasma treatment. X-ray photoelectron spectroscopy (XPS) coupled with in situ IRRAS has been applied to quantitively understand the effect of different gases in plasma treatment on the structure and properties of Pt nanoparticles. The effectiveness of surfactant removal treatments has been investigated by in situ carbon monoxide (CO) probe studies. This work demonstrates the profound effects of gases used in plasma treatment on the surface cleaning of metal nanoparticles. These observations may open opportunities for the utilization of nanoparticles in catalysis, surface science, and biomedical applications that require efficient removal of surfactants by reaching a better mechanistic understanding of this process and identifying the most adequate conditions.

2. Materials and Methods

2.1. Materials Synthesis

Gold (Au, Sigma-Aldrich, St. Louis, MI, USA, 99.99+%)-coated silicon (Si) substrates were prepared by physical vapor deposition on a Kurt J. Lesker PVD75 system (Lesker Company, Jefferson Hills, PA, USA). To enhance the interaction between Au and Si, a 10 nm adhesive layer of titanium (Ti, Sigma-Aldrich, 99.99%) was first deposited on Si, with a deposition rate of 0.5 Å/s. Then, a 100 nm Au layer was deposited onto the Ti-Si substrate with a deposition rate of 1.0 Å/s. The obtained Au substrate was analyzed by atomic force microscopy (AFM) on a Park NX20 atomic force microscopy.
Surfactant-encapsulated Pt nanoparticles were synthesized by a chemical reduction method [39]. In a typical synthesis, 2.5 mg chloroplatinic acid hexahydrate (H2PtCl6·6H2O, Sigma-Aldrich, ACS reagent) and 20.0 mg hexadecyltrimethylammonium bromide (CTAB, Sigma-Aldrich, BioXtra, >99%) were mixed in 4.5 mL deionized (DI) water. The solution was heated to 50 °C under constant stirring (400 rpm) for 2 h. Then, 3.0 mg sodium borohydride (NaBH4, Sigma-Aldrich, ReagentPlus, 99%) was dissolved in 0.5 mL ice-cooled DI water and added dropwise into the solution. The resulting mixture was stirred for another 12 h at 50 °C. The Pt nanoparticles were purified by discarding the precipitate following centrifugation at 3000 rpm for 30 min. The procedure was repeated four times.
To obtain oleylamine-encapsulated Pt nanoparticles, CTAB encapsulated Pt nanoparticles were collected by centrifugation at 13,000 rpm for 30 min. The resulting precipitate was washed with DI water twice and redispersed in oleylamine (Sigma-Aldrich, >98% primary amine)-water solution (0.8 mL oleylamine in 1 mL DI water). The suspension in a closed container was heated to 50 °C and stirred for 12 h. The obtained oleyamine encapsulated Pt nanoparticles were washed three times with methanol (anhydrous, Sigma-Aldrich, 99.8%) and then redispersed in 0.5 mL toluene (anhydrous, Sigma-Aldrich, 99.8%).
The solution was slowly dropped onto a water subphase on a Langmuir-Blodget trough to produce a monolayer of oleylamine-encapsulated Pt nanoparticles. After evaporation of the toluene for 1 h, the film was compressed until a surface tension of 15 mN·m−1 was achieved. The resulting film was then aged for 30 min before being transferred to an Au-coated Si substrate via a pull-out method.

2.2. Structural Characterization

Scanning electron microscopy (SEM) was performed on a Hitachi 4800 SEM instrument (Hitachi High-Technologies Corporation, Chiyoda-Ku, Tokyo, Japan), operating at 10 kV. Environmental transmission electron microscopy (ETEM) was performed on aberration-corrected FEI Titan 80–300 (S)TEM instrument (FEI Company, Hillsboro, OR, USA) operated at 300 kV.
Ambient-pressure X-ray photoelectron spectroscopy (XPS) analysis was performed using a customized system, with a Hemispherical Energy Analyzer PHOIBOS NAP 150 (SPECS Surface Nano Analysis GmbH, Berlin, Germany), with monochromatic Al Kα as the excitation source (hν = 1486.6 eV) at Center for Functional Nanomaterials at Brookhaven National Laboratory. The base pressure was 2 × 10⁻⁹ mbar. The spectra regions probed included C 1s, O 1s, N 1s, Au 4f, and Pt 4f. For each spectral region, a pass energy of 20 eV and energy step size of 0.1 eV were used. Peak fitting was performed using CasaXPS (Version 2.3.24PR1.0) peak fitting software. A Shirley background type was used. Lineshapes (1.2, 85, 70) and GL (30) were used for Pt0 and Ptδ+ peak fitting, respectively.
Infrared reflection absorption spectroscopy (IRRAS) spectra were collected on a Bruker Vertex 80 V spectrometer equipped with a mercury-cadmium-telluride (MCT) detector with a grazing incidence angle of 8°. The base pressure of IRRAS was 2 × 10⁻⁸ mbar. An average of 1000 scans were collected over a range of 800–4000 cm−1 with a resolution of 4 cm−1 after a certain time of plasma treatment. The gas pressure (O2 or H2) was maintained at 0.1 mbar. In all cases, both the p- and s-polarized light spectra were taken under all conditions. The p 0 s 0 of the starting material at 0.1 mbar gas pressure was used as a reference. The spectra taken at different plasma treatment time were calculated by comparing to the reference: p s p 0 s 0 .
Likewise, for in situ CO probe experiment, the p 0 s 0 of starting material at 2 × 10⁻⁸ mbar was used as reference. By changing the pressure of CO in the IRRAS chamber, the spectra of CO adsorption on Pt nanoparticles were collected and converted to transmission mode by comparing to the reference: p s p 0 s 0 .

2.3. Plasma and UV-Ozone Treatments

For plasma treatment setup on the IRRAS instrument, the setup description is shown in Scheme S1 in the supporting information [38]. All the plasma treatments were performed at room temperature (25 °C). First, the gas of interest was introduced into the IRRAS chamber to a pressure of 0.1 mbar for all plasma treatment conditions. Then, the plasma was generated using an AC high-voltage at 1 kV peak-to-peak with a frequency of 22 kHz (PVM500, Information Unlimited, Mont Vernon, NH, USA). The voltage and current waveforms were recorded using a high-voltage probe (Tektronix P6015 (Tektronix, Inc., Beaverton, OR, USA)) and a current monitor (Pearson 6585 (Pearson Electronics, Inc. Palo Alto, CA, USA)), respectively. Both signals were observed in real-time using a Tektronix MDO32 series oscilloscope, and the average power was calculated by integrating the instantaneous power over one period. The plasma was characterized using optical emission spectroscopy (OES). The plasma emission was collected through an optical fiber with a collimating lens adjusted to a quartz viewport of the reactor chamber. The wideband spectrum was recorded using an AvaSpec-ULS4096CL-EVO (Avantes BV, Apeldoorn, The Netherlands) spectrometer and analyzed with AvaSoft8.14.0.0 software.
For UV-ozone treatment, the Pt nanoparticles on Au film were placed in a UV-ozone cleaning system (UVOCS INC., Lansdale, PA, USA; model: T10 × 10/OES) and subject to UV irradiation (185 nm and 254 nm) for 30 min.

3. Results and Discussion

In the following subsections, we will present the spectroscopy results for surfactant removal using different methods. Namely, Section 3.1 will focus on UV-ozone treatment, Section 3.2 on oxygen plasma, Section 3.3 on hydrogen plasma, and Section 3.4 on a combination of UV-ozone or oxygen plasma, followed by hydrogen treatments (thermal or plasma) to reduce the produced oxides.

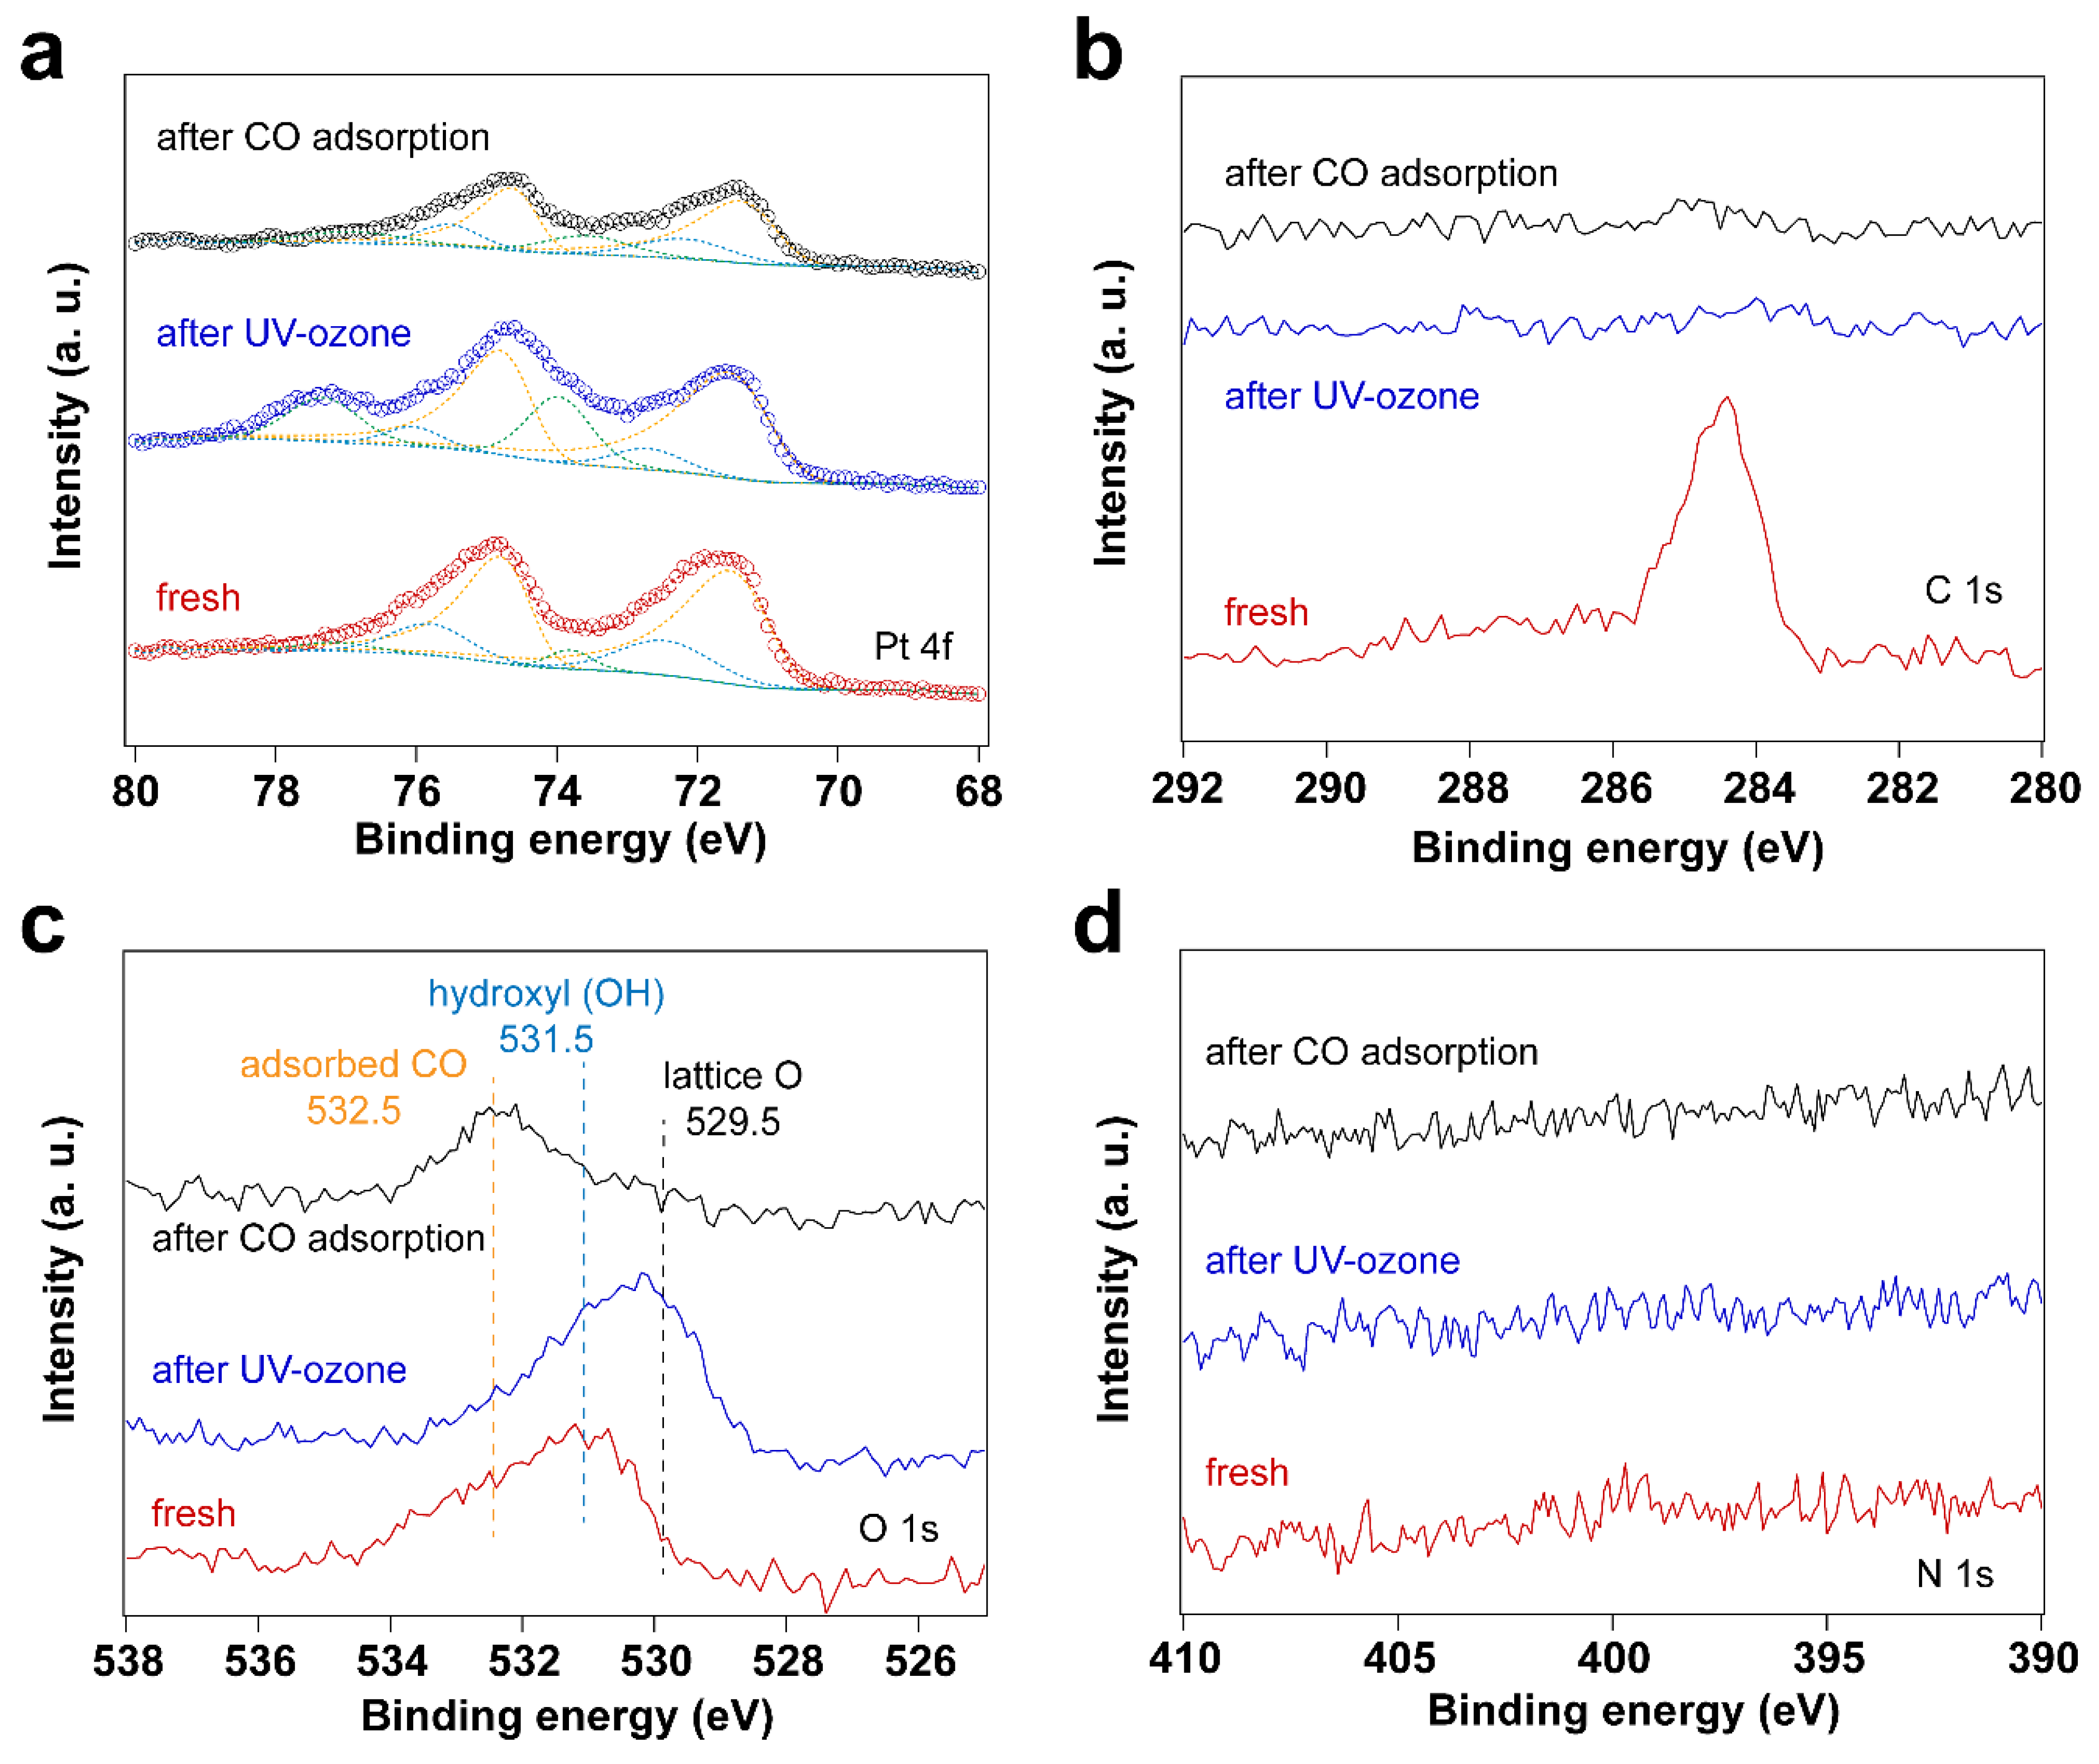
3.1. Removal of Surfactant by UV-Ozone Treatment

As described in the experimental section, surfactant-encapsulated Pt nanoparticles were prepared using methods from the literature with CTAB and chloroplatinic acid as precursors (H2PtCl6) [39,40]. A thin film of Pt nanoparticles was prepared by the Langmuir-Blodgett (LB) method and then transferred onto a Au-coated silicon wafer. The original capping agent CTAB was exchanged to oleylamine to fabricate the LB assembly and deposition. For comparison, the surfactant-encapsulated Pt nanoparticles were first cleaned by UV-ozone treatment. X-ray photoelectron spectroscopy (XPS) was performed to track surface composition changes. The survey spectrum of the fresh sample in Figure S1 (supporting information) shows that the surface mainly contains carbon (C), gold (Au), platinum (Pt), and oxygen (O). The oxidation state of Au remains unchanged throughout all the experiments.
Since the surfactant molecules, oleylamine and CTAB, contain hydrocarbon CHx and amine (NH2) groups, both C and N are detected by C 1s and N 1s for the fresh sample. After UV-ozone treatment, the peak of C 1s disappears, which is also reflected by the high-resolution C 1s and N 1s spectra. As shown in Figure 1, the disappearance of C 1s and N 1s peaks indicates that the surfactant molecules were removed after UV-ozone treatment. The Pt 4f spectra displayed in Figure 1 demonstrate Pt oxidation after UV-ozone treatment, as evidenced by the appearance of peaks corresponding to Pt–O species [41,42,43,44]. Table 1 summarizes the peak positions and the ratio of Pt–O/Pt0. Two different Pt–O species were observed and assigned to Pt(II)–O and Pt(I)–O. It shows a larger fraction of surface Pt–O(II) than Pt–O(I) after UV-ozone treatment, suggesting the significant oxidation of Pt. Therefore, when in situ IRRAS CO probe experiments were performed, CO molecules adsorb not only on metallic Pt (Pt0) sites, but also on Pt–O sites, as shown in Figure 2. Correspondingly, different O species, such as lattice O and adsorbed O, are observed in the O 1s spectra after UV-ozone treatment due to the reaction between active O species generated from UV-ozone and the organic surfactant [45,46].
As shown in Figure 2, the CO vibrational frequencies at 2200–2100 cm−1 in IRRAS are characteristic CO adsorption on oxidized Pt sites [47,48], while the bands in the 2100–1900 cm−1 range correspond to CO molecules linearly adsorbed on Pt nanoparticles (atop) [49,50,51]. The peak areas for the CO vibrational mode corresponding to metallic Pt sites increase with increasing pressure, while the peak area corresponding to CO on Pt-O sites decreases, suggesting the reduction of Pt–O during CO exposure. As confirmed by the Pt 4f spectra (Figure 1), metallic Pt is dominant and only a small fraction of Pt–O(I) was observed after CO exposure to elevated pressures. In the presence of CO, the Pt–O(II) was first reduced to Pt–O(I), followed by the reduction to Pt0. Therefore, different CO vibrational frequencies were observed due to the different oxidation states of Pt in the presence of CO.
At 1 × 10⁻⁵~1 × 10⁻¹ mbar CO pressure range, CO initially adsorbs on Pt–O sites with vibrational frequency of ~2170 and 2110 cm−1 (See Figure S2 in the supporting information) [48]. Further increasing the CO pressure, CO adsorption on metallic Pt sites emerge. When the pressure of CO reaches 5 mbar, atop adsorption of CO on metallic Pt sites is dominant, while the CO adsorption on Pt–O sites almost disappears. This likely indicates reduction of the Pt oxides by CO. It is well known that the differences in CO stretching frequency can arise from the different sites on Pt nanoparticles. That is, the undercoordinated sites lead to stronger CO adsorption than high-coordination sites, resulting in lower CO vibrational frequencies [47]. Consequently, the bands at ~2048 and ~1992 cm−1 that appeared at a CO pressure of 1 mbar can be assigned to the different metallic Pt sites. Further increasing CO pressure, CO adsorption on higher coordination sites of metallic Pt (~2096 cm−1) is obtained [47]. Moreover, the desorption of hydrocarbon species (as evident by the C-H stretching vibrations at 3000–2800 cm−1) was observed with the increase of CO pressure, indicating the presence of hydrocarbon residuals on the Pt surface after UV-ozone cleaning. Note that these appear as peaks pointing up in the transmittance spectra in Figure 2. This result is also consistent with the decreasing peak area ratio of C 1s/Au 4f after in situ CO probe experiment (Table S1 in supporting information).

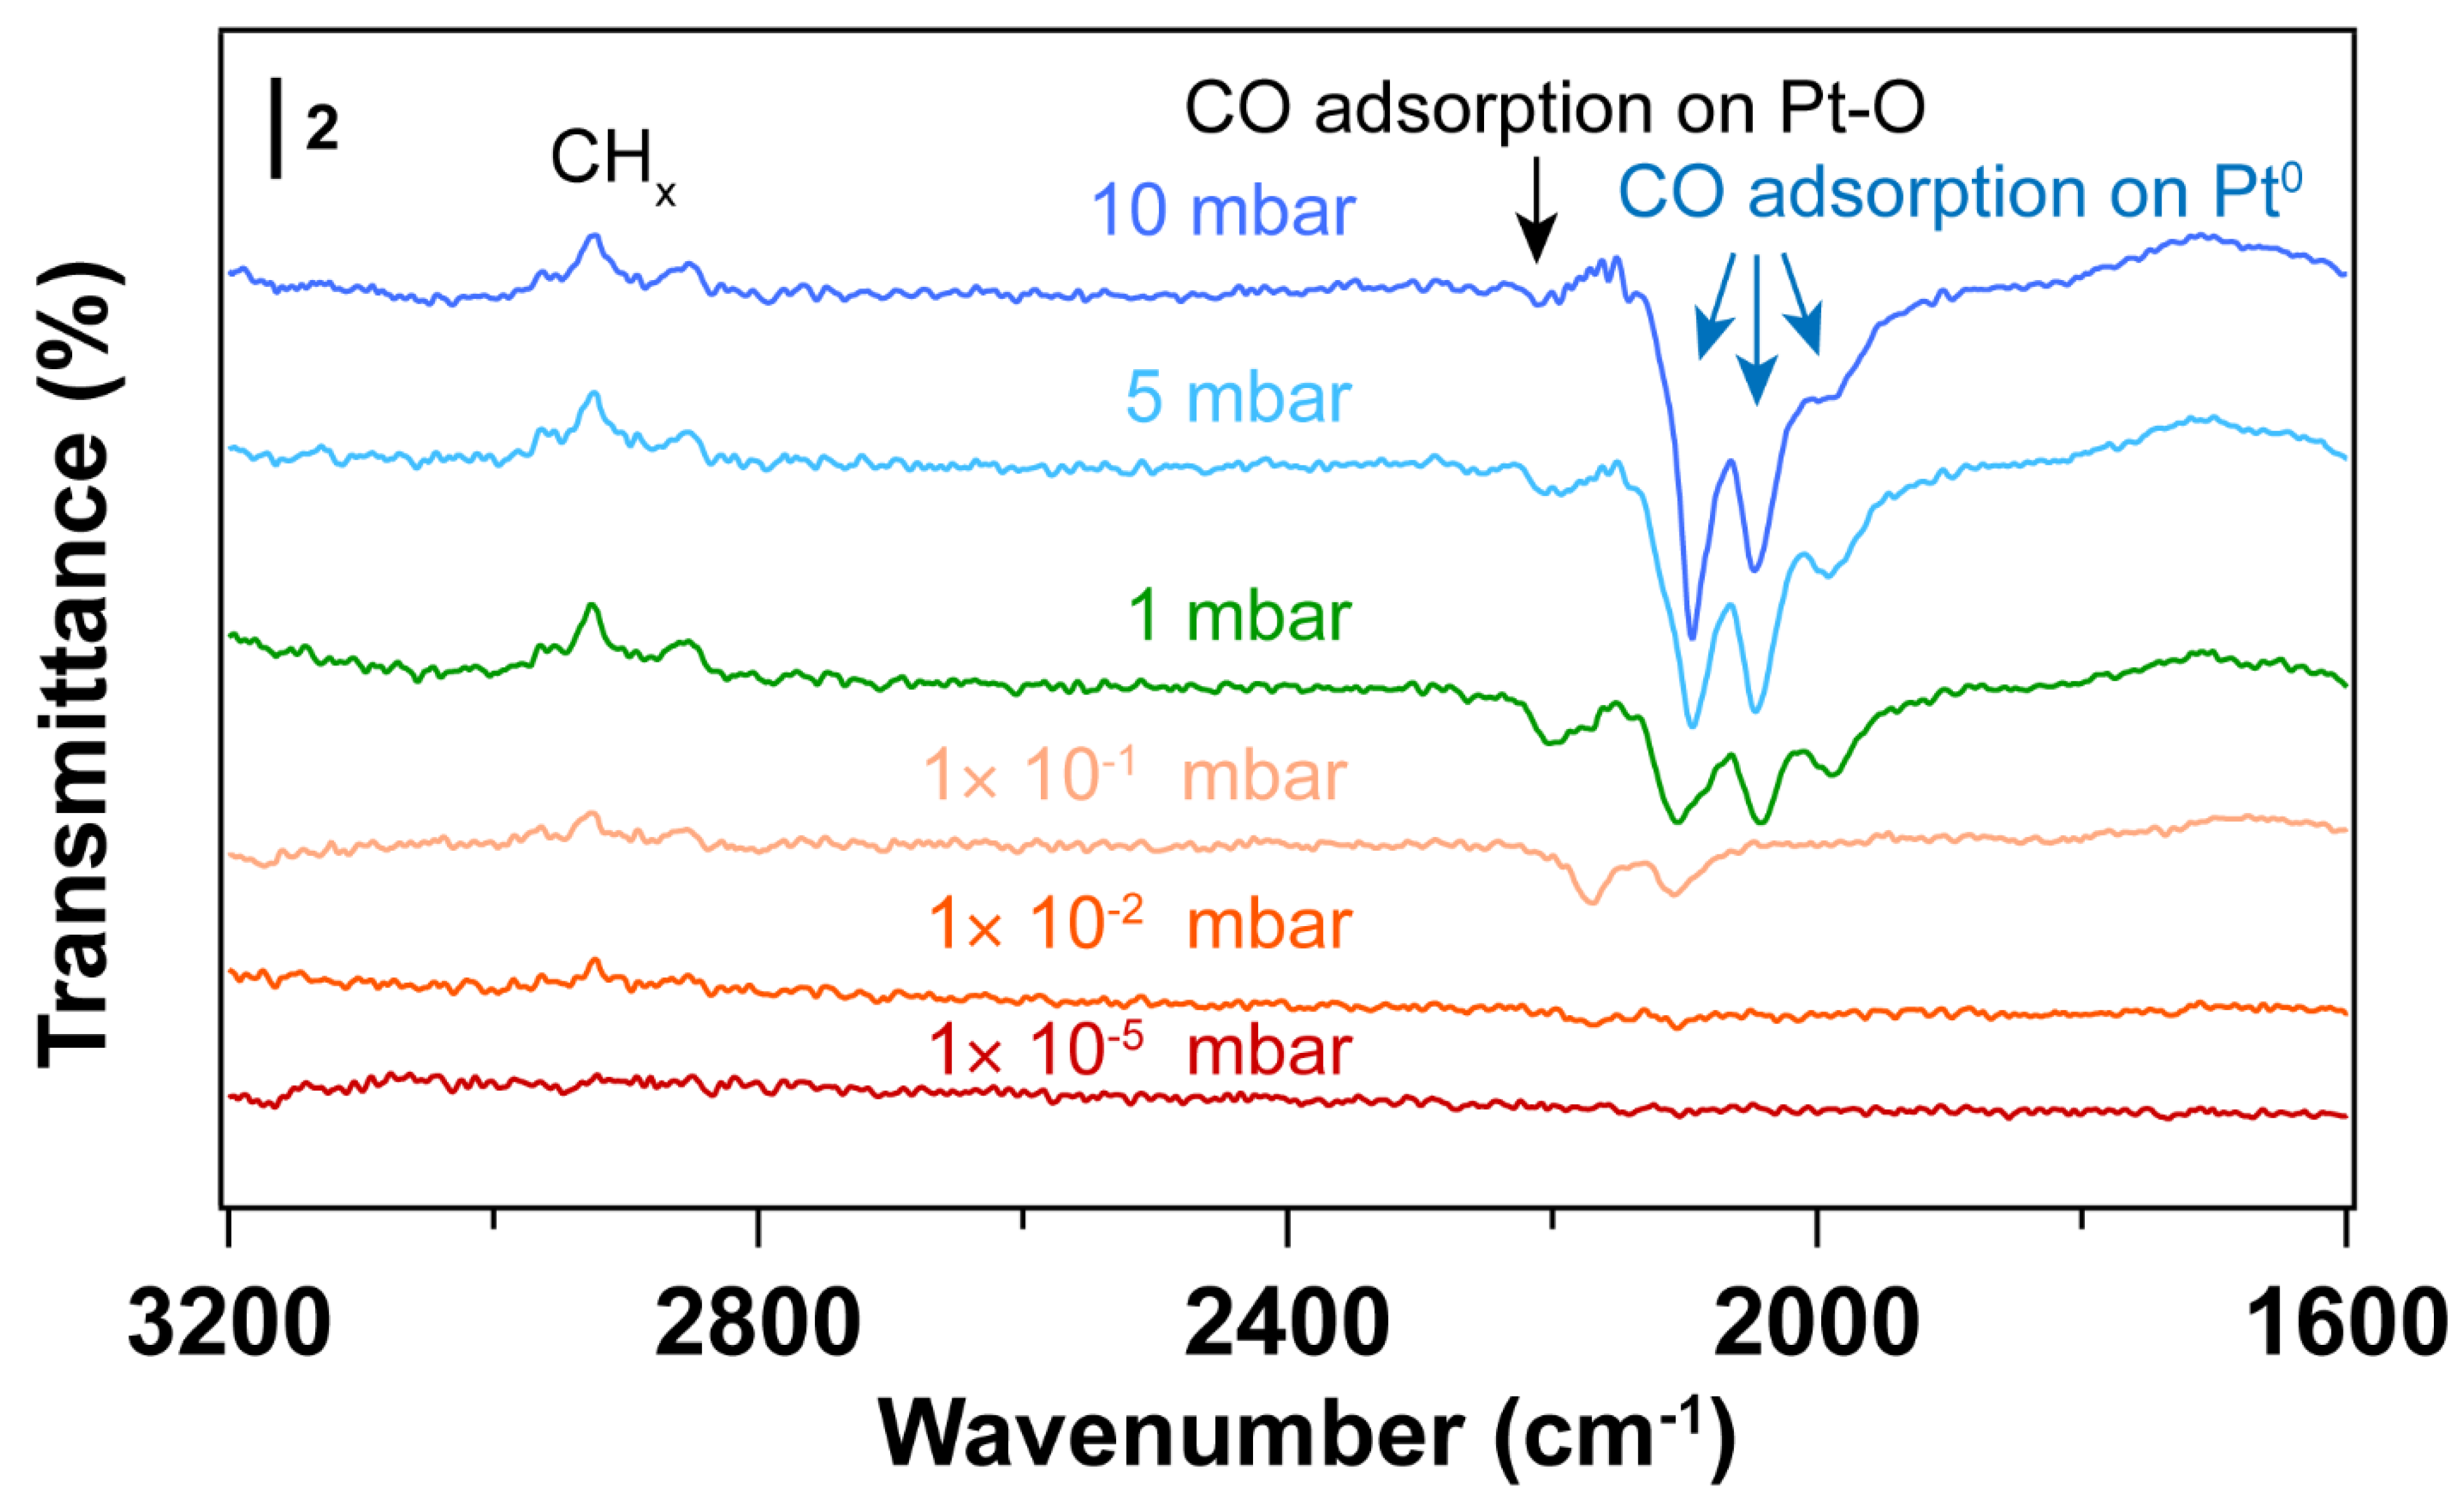
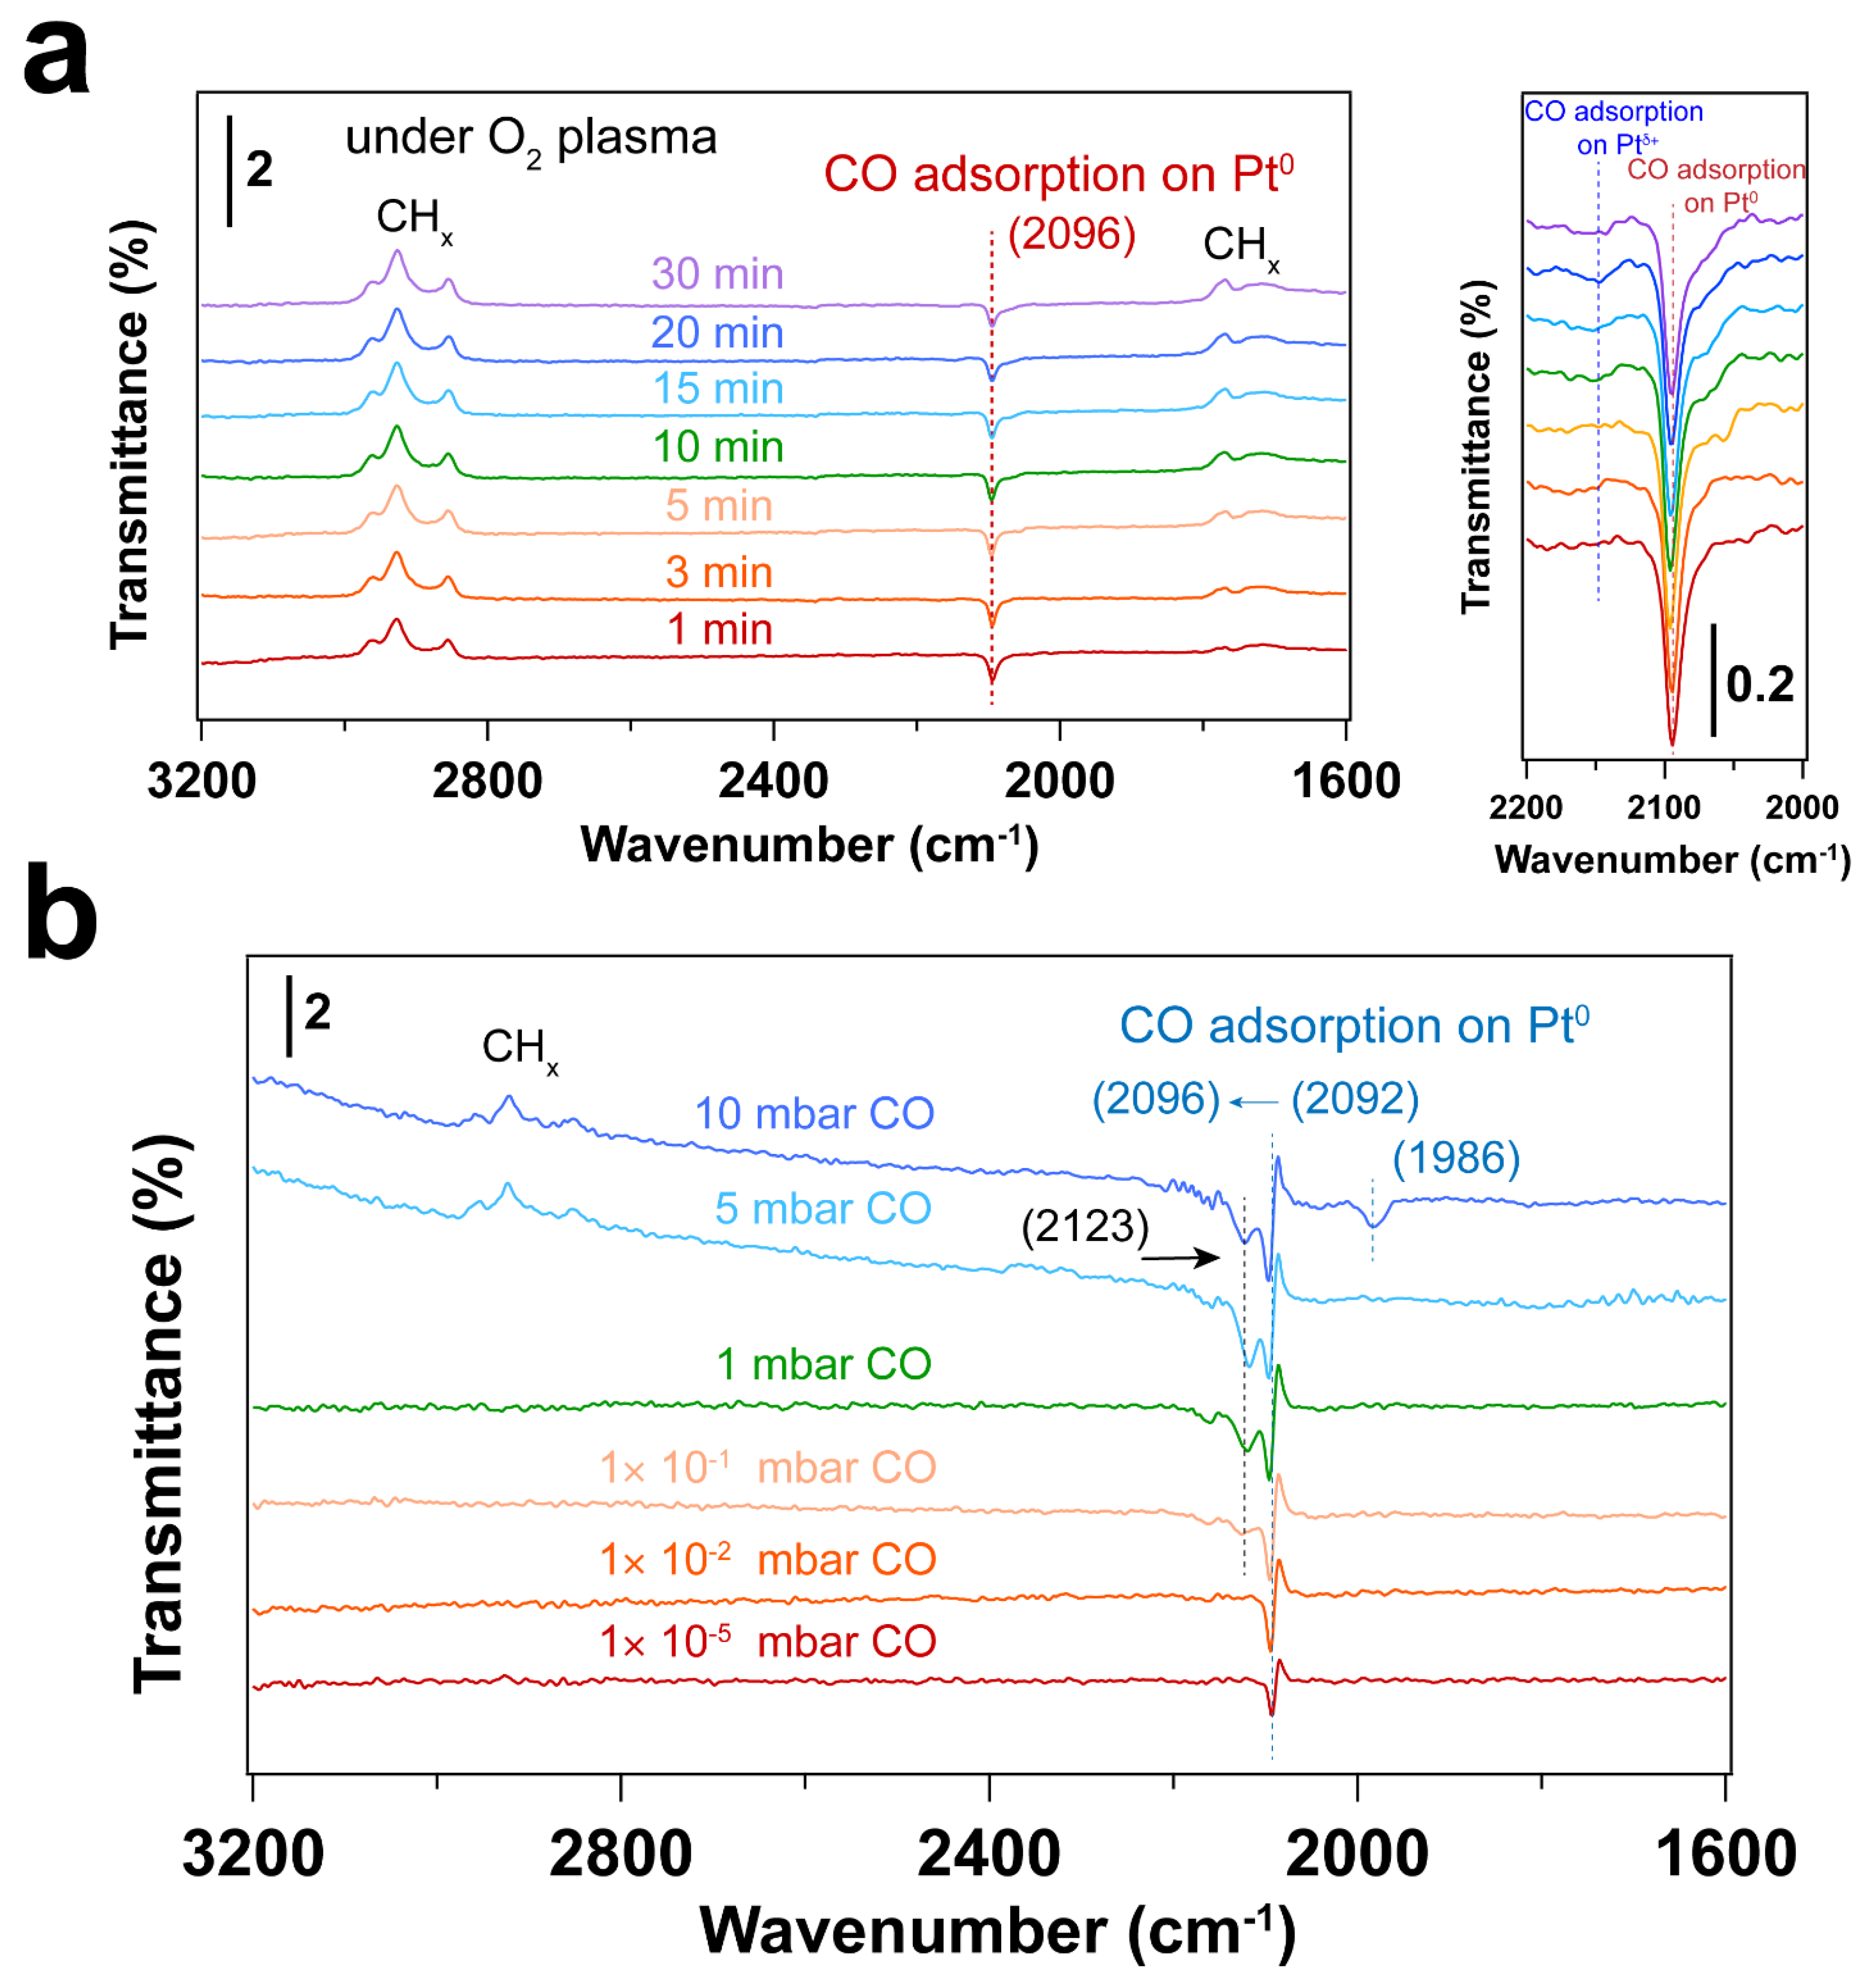
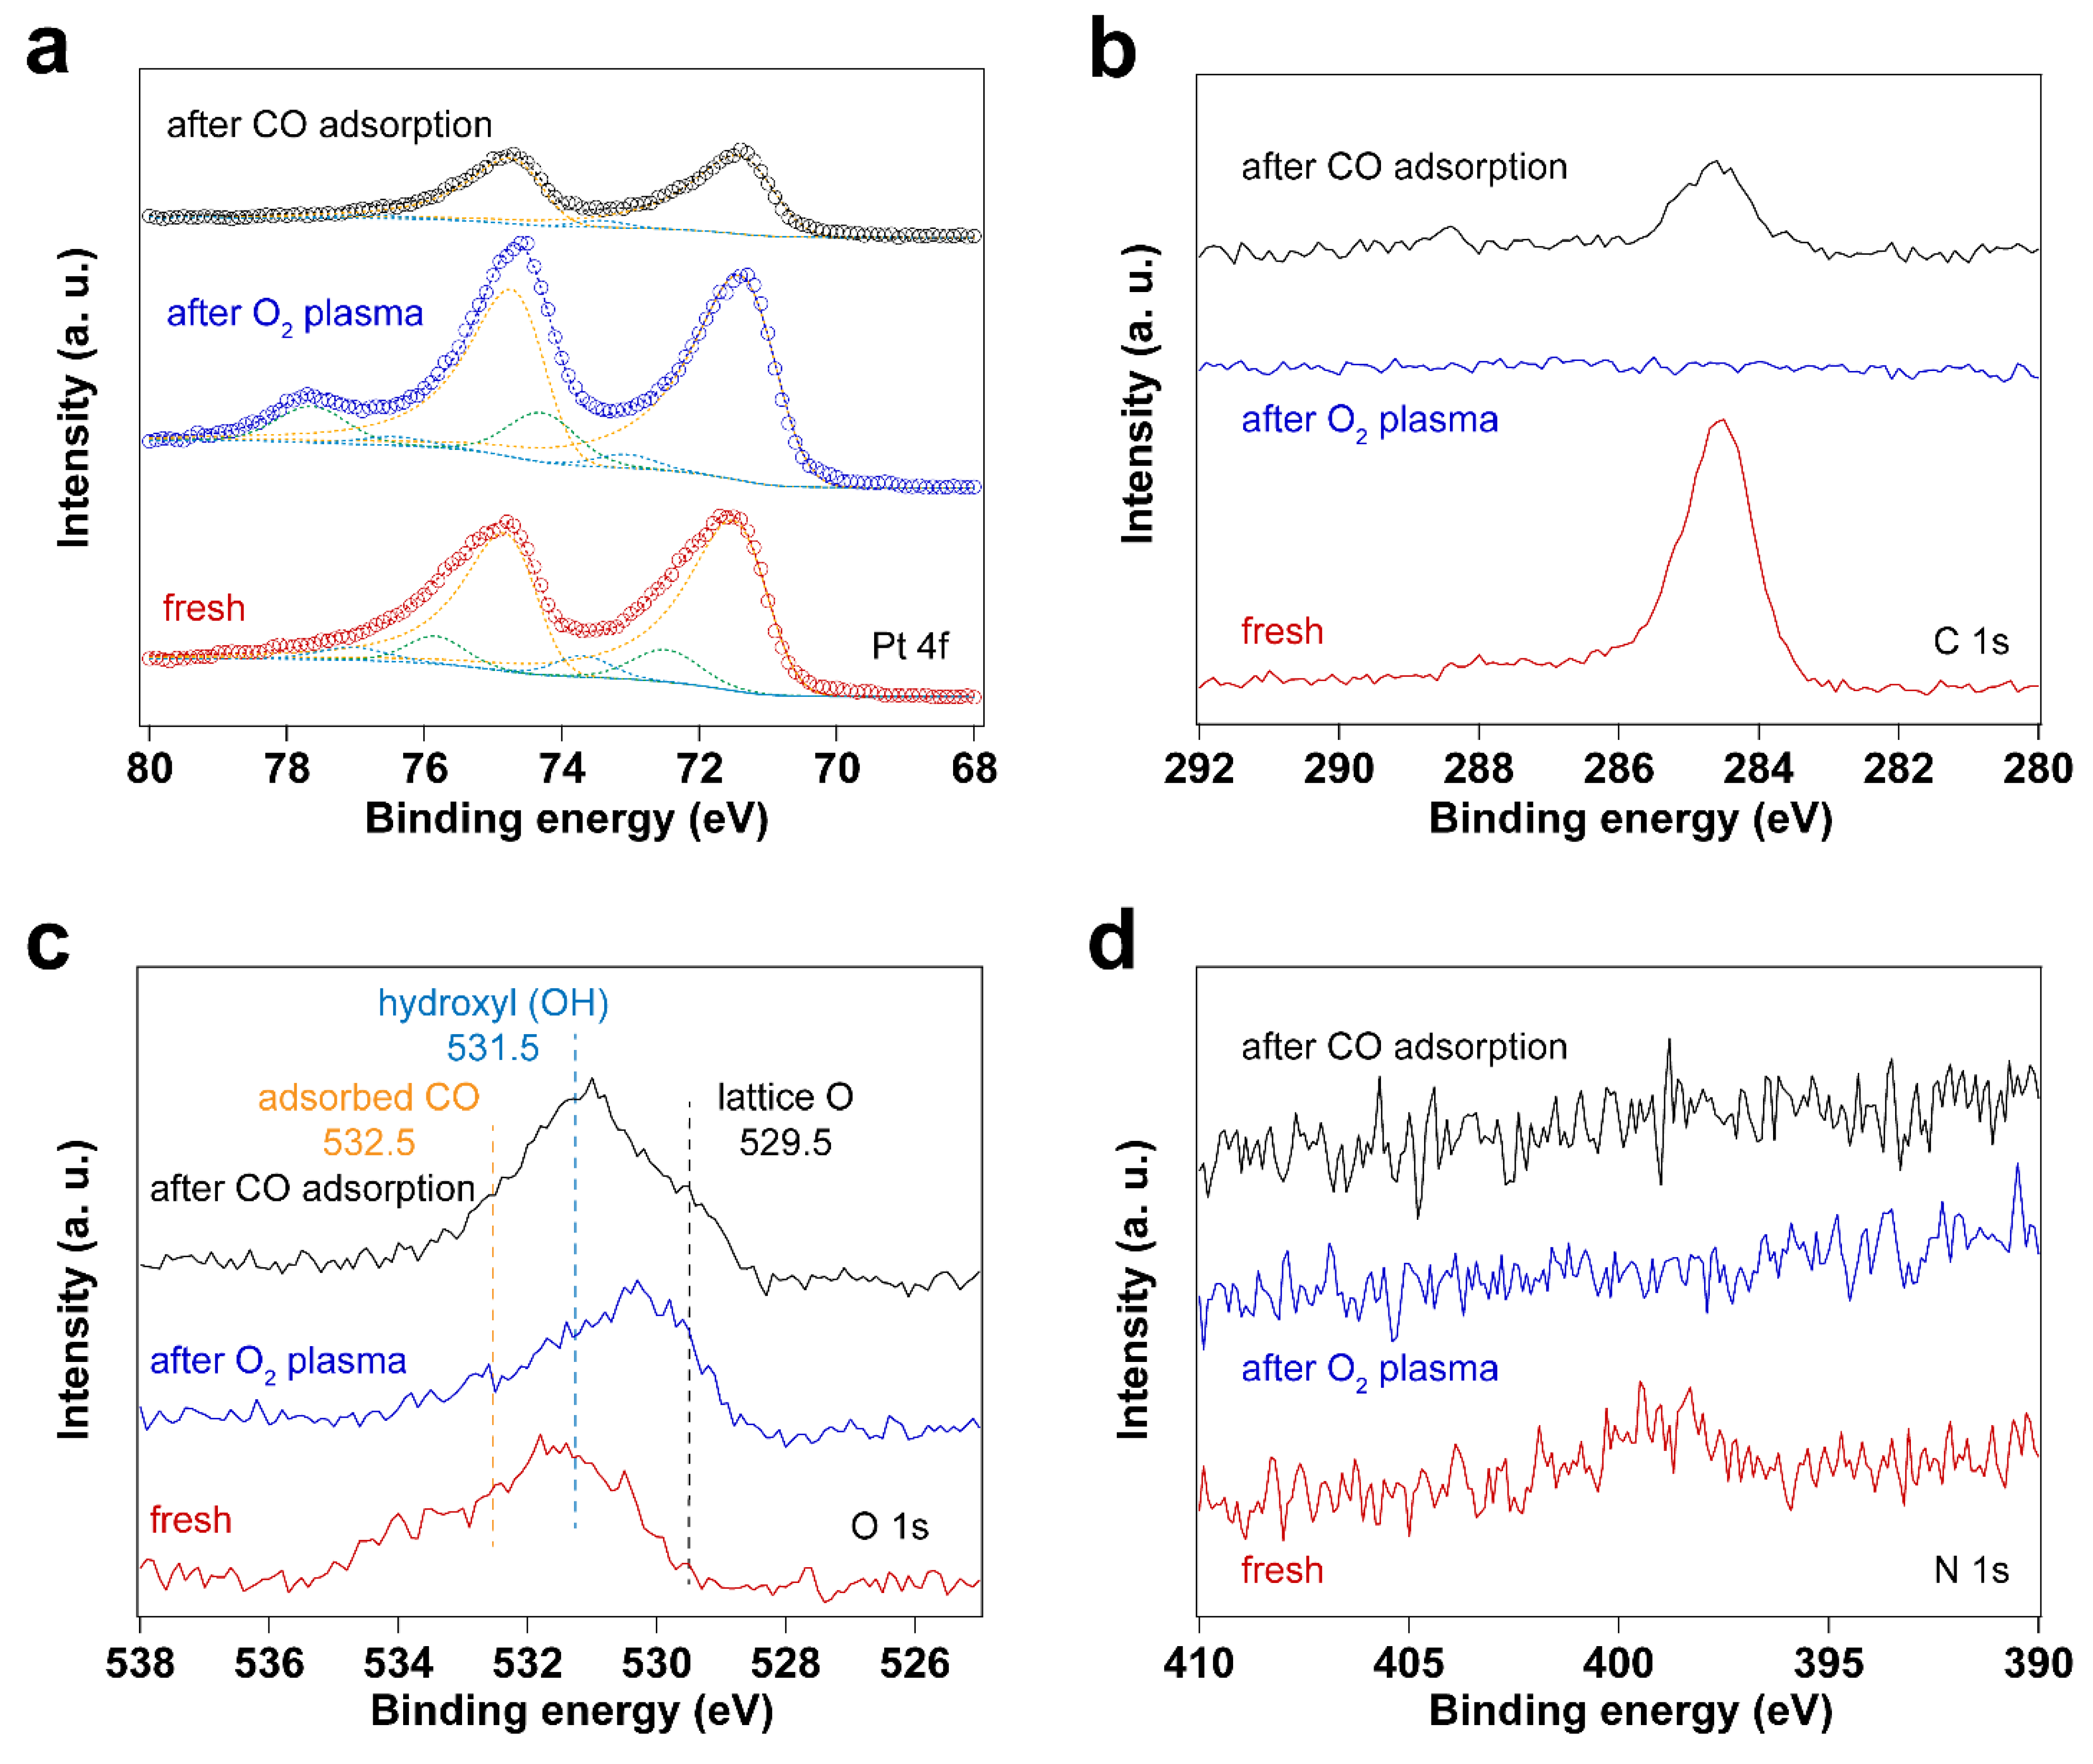
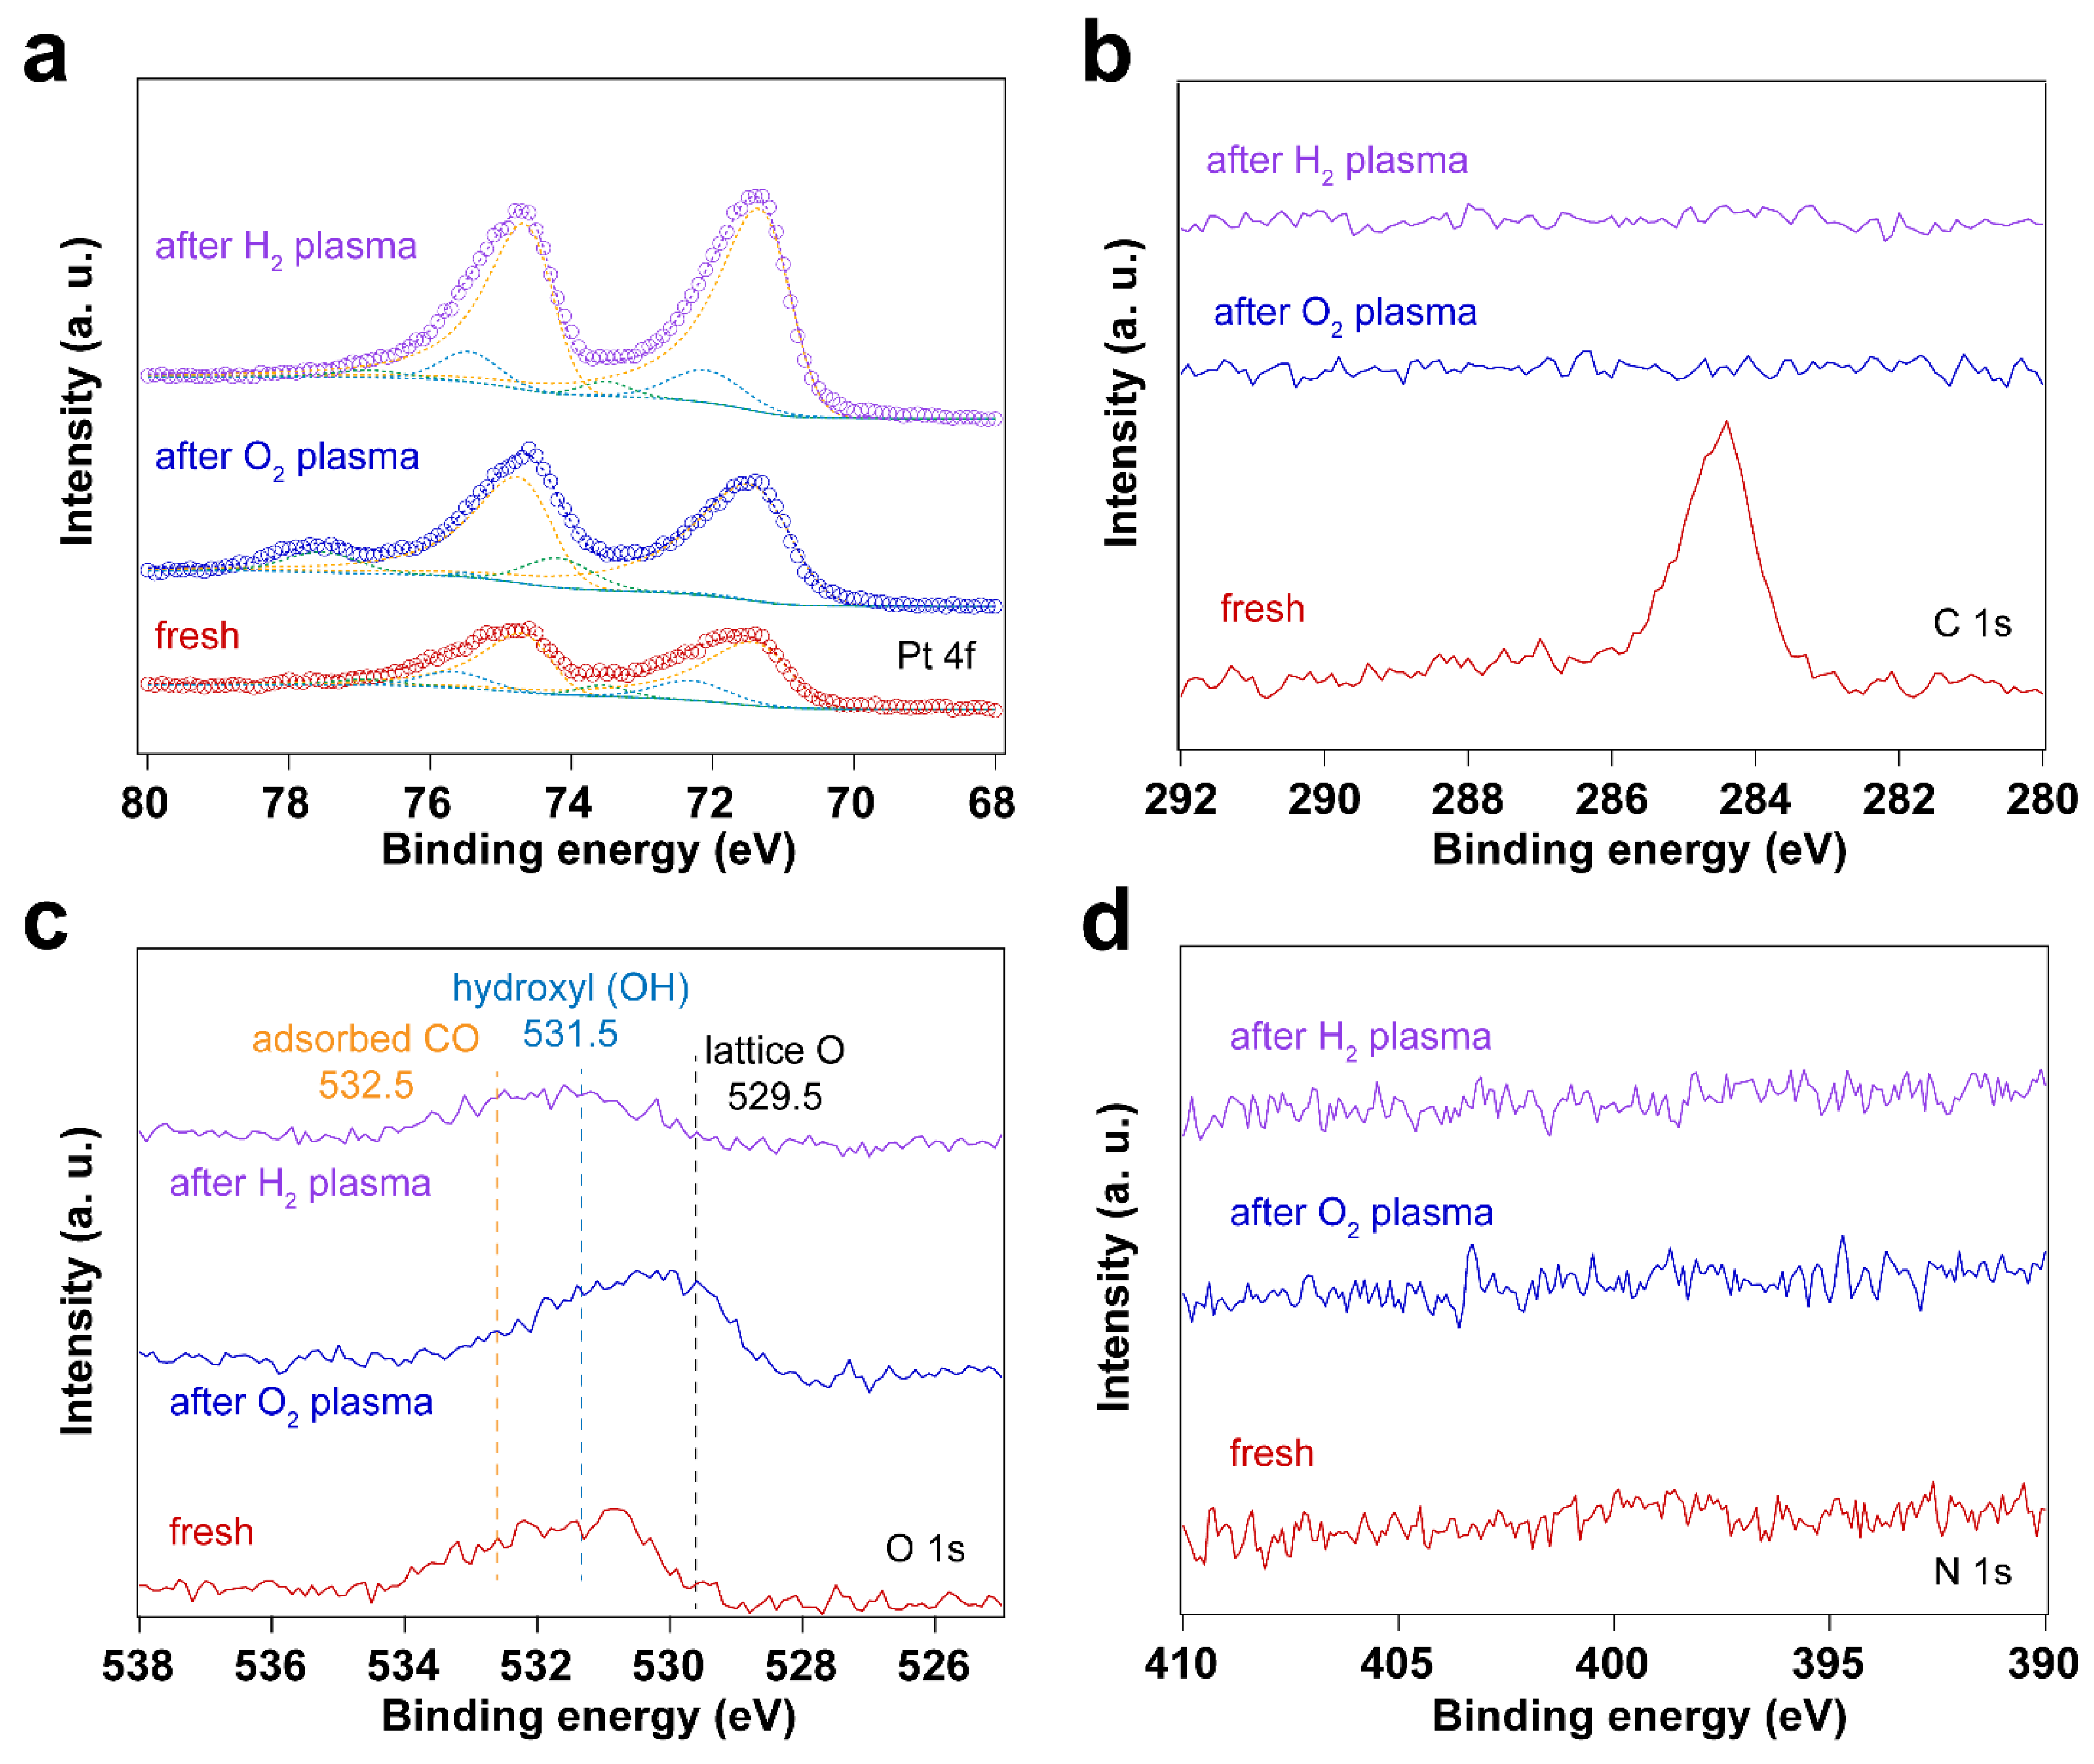
3.2. Removal of Surfactant by O2 Plasma Treatment

Figure 3 and Figure 4 display IRRAS and XPS measurements of surfactant-encapsulated Pt nanoparticles cleaned by in situ O2 plasma treatment. Similar to the UV-ozone cleaning process, carbon species on the surface can be efficiently removed by O2 plasma, while Pt was oxidized by the highly active O species generated in the plasma. As shown in Figure 3a, the bands in the 3100–2800 cm−1, 2200–1900 cm−1 and 1800–1650 cm−1 ranges are C–H stretching of the hydrocarbons in the surfactant [52,53], CO adsorption on Pt nanoparticles [47] and C–H bending of hydrocarbons [52], respectively. After 1 min O2 plasma treatment, the positive hydrocarbon peaks at 3100–2800 and 1800–1650 cm−1 indicate the removal of hydrocarbon species (C–H). During plasma treatment, the active O species react with hydrocarbons, forming CO, which adsorbs on Pt nanoparticles. Note that the presence of CO is not from direct introduction to the chamber but rather the result of the oxidation of hydrocarbons under O2 plasma. As shown in Figure 3a, the CO adsorption on Ptδ+ sites also suggests that the surface of Pt nanoparticles is oxidized during the O2 plasma treatment, and the fraction of Pt–O species increases, which is consistent with the Pt 4f and O 1s spectra as shown in Figure 4. Compared to the UV-ozone treatment, O2 plasma treatment results in a smaller fraction of Pt oxide sites on the Pt nanoparticle surface (see Table 2). Only adsorption of CO on metallic Pt sites is observed at CO pressures < 1 × 10⁻¹ mbar as evident by the peak originally at 2092 cm−1 (in the background) that shifts to 2096 cm−1 under CO pressure in Figure 3b, and only a small fraction of Pt–O species (peak at 2123 cm−1) is evident at higher pressures. In addition, below 10 mbar of CO, the absence of CO vibrational frequency at lower wavenumber range (2050–1990 cm−1) may suggest that less defective sites (low coordination) are formed after the O2 plasma treatment in comparison to the UV-ozone process [40]. Further increase of CO pressure to 10 mbar results in additional surge in CO adsorption at lower coordination sites (1986 cm−1), which may be due to the structural reconstruction of Pt nanoparticles caused by CO adsorption [54].

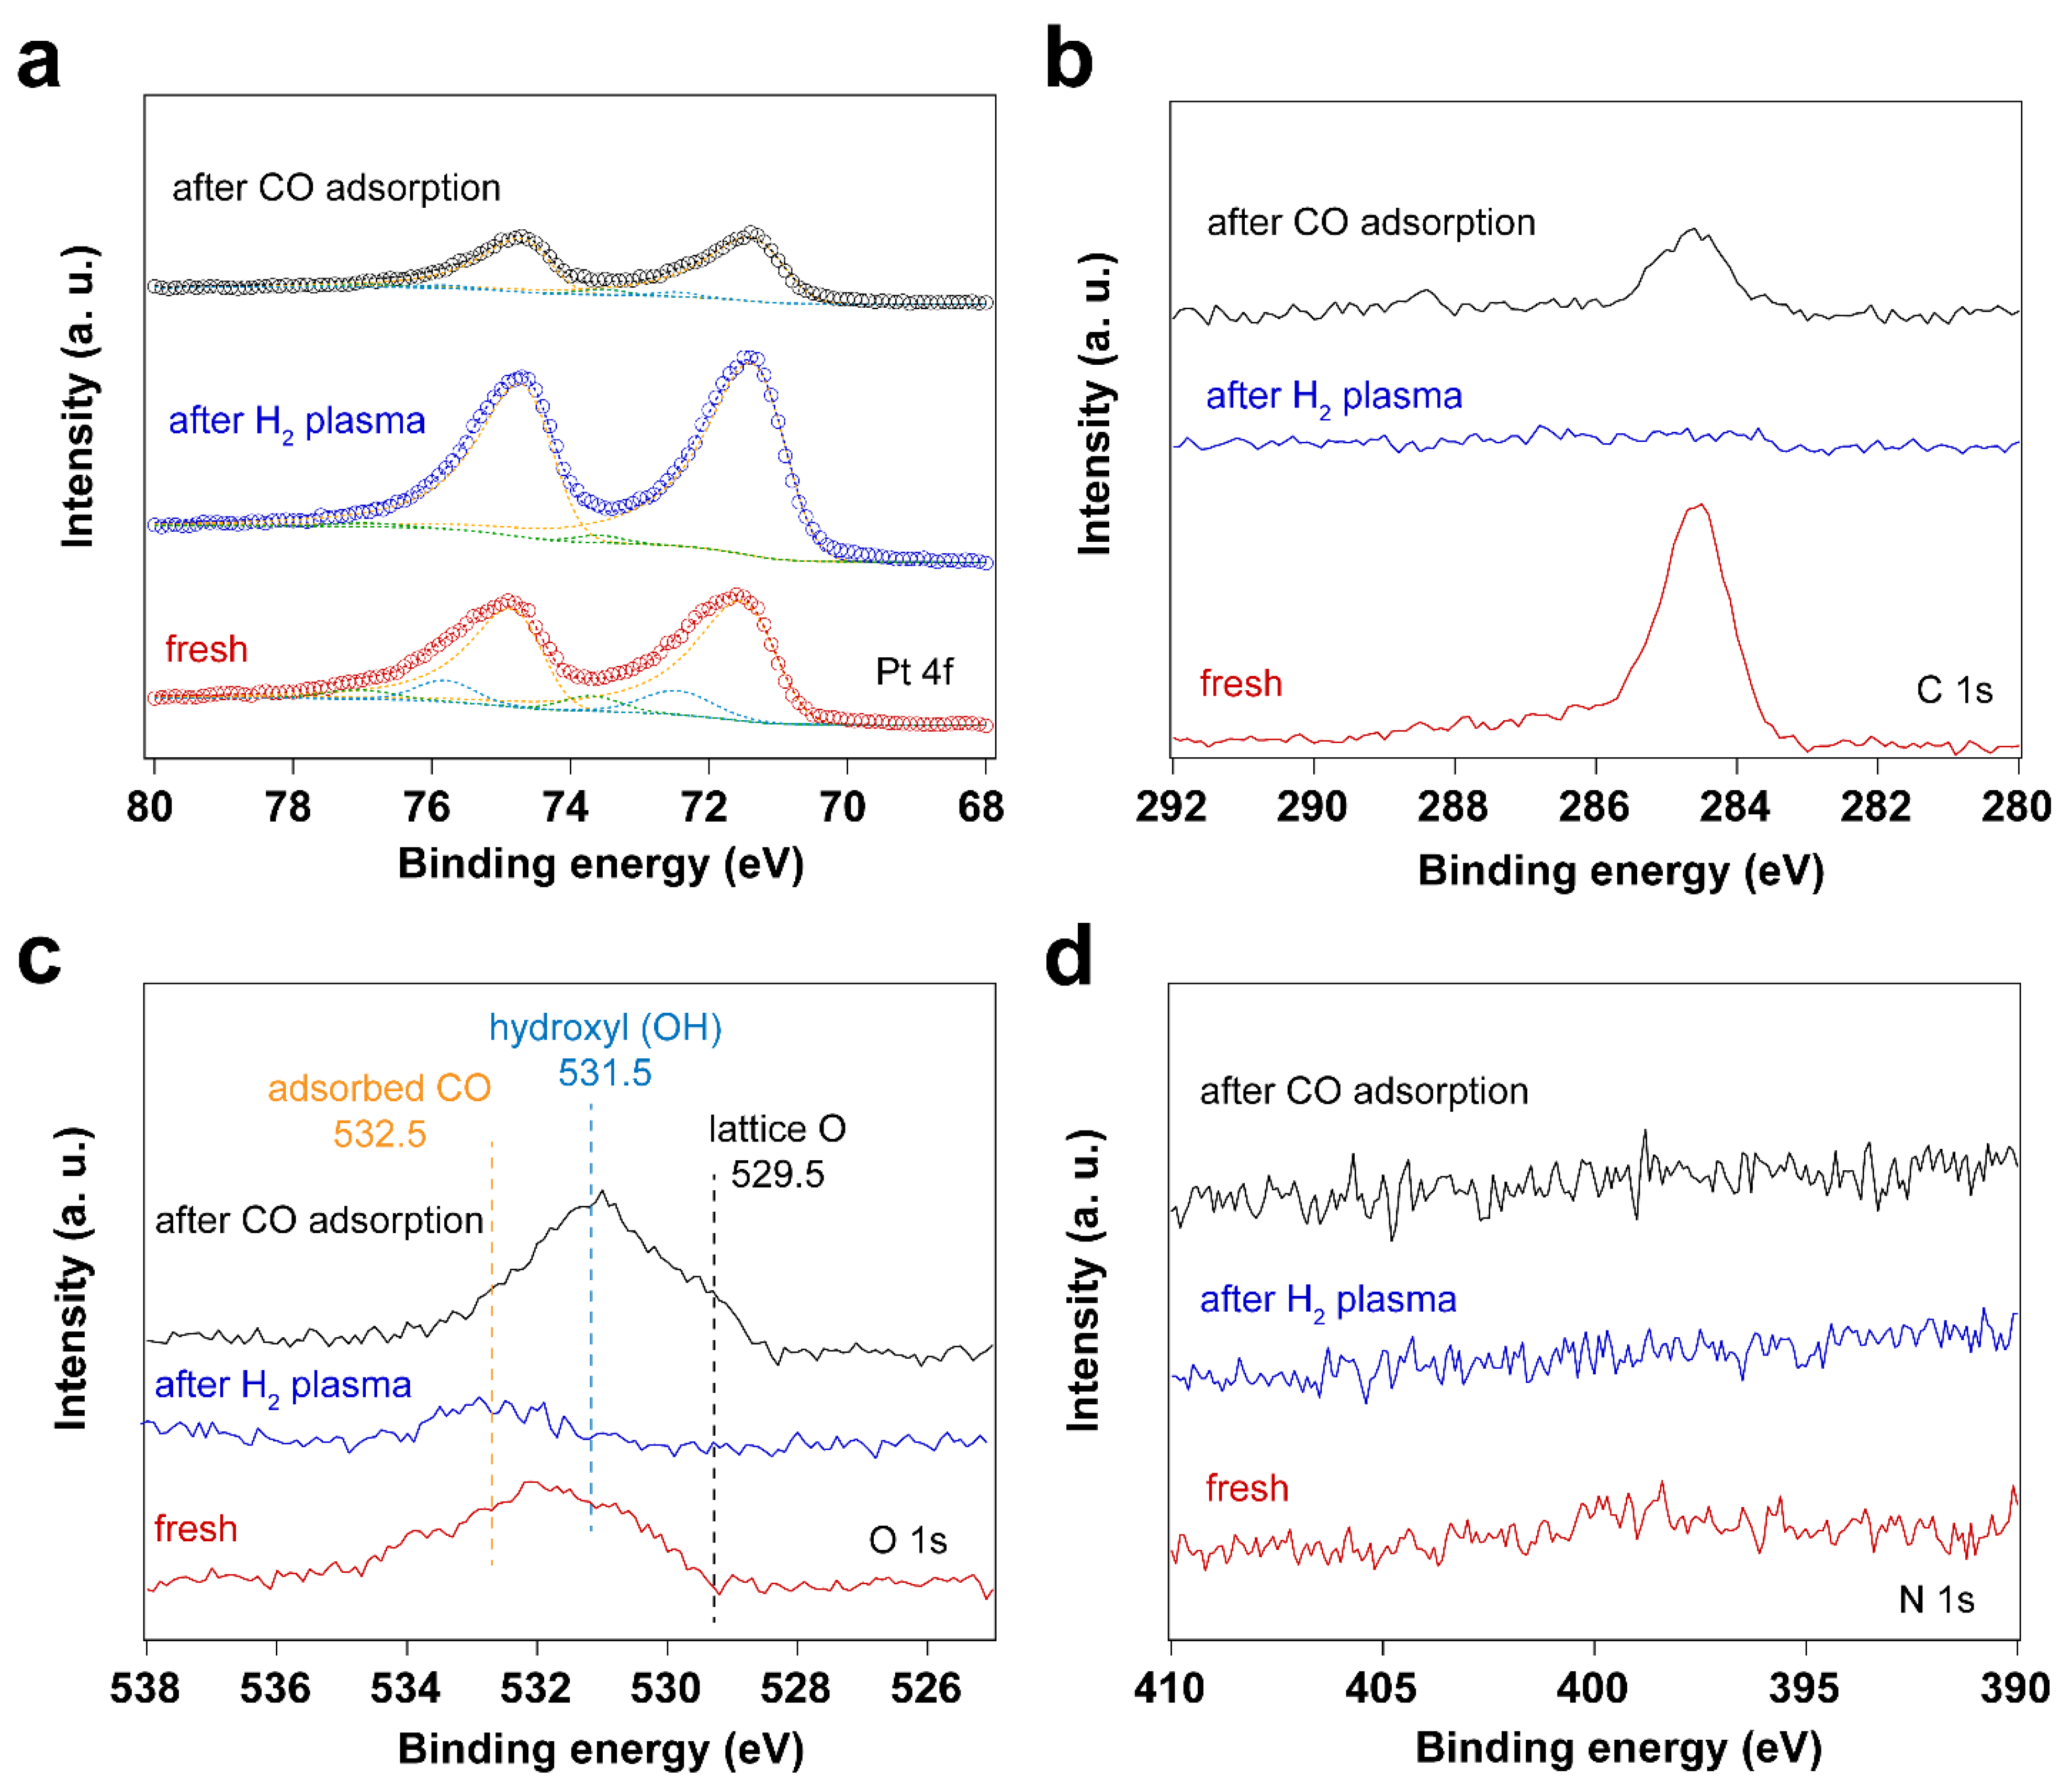
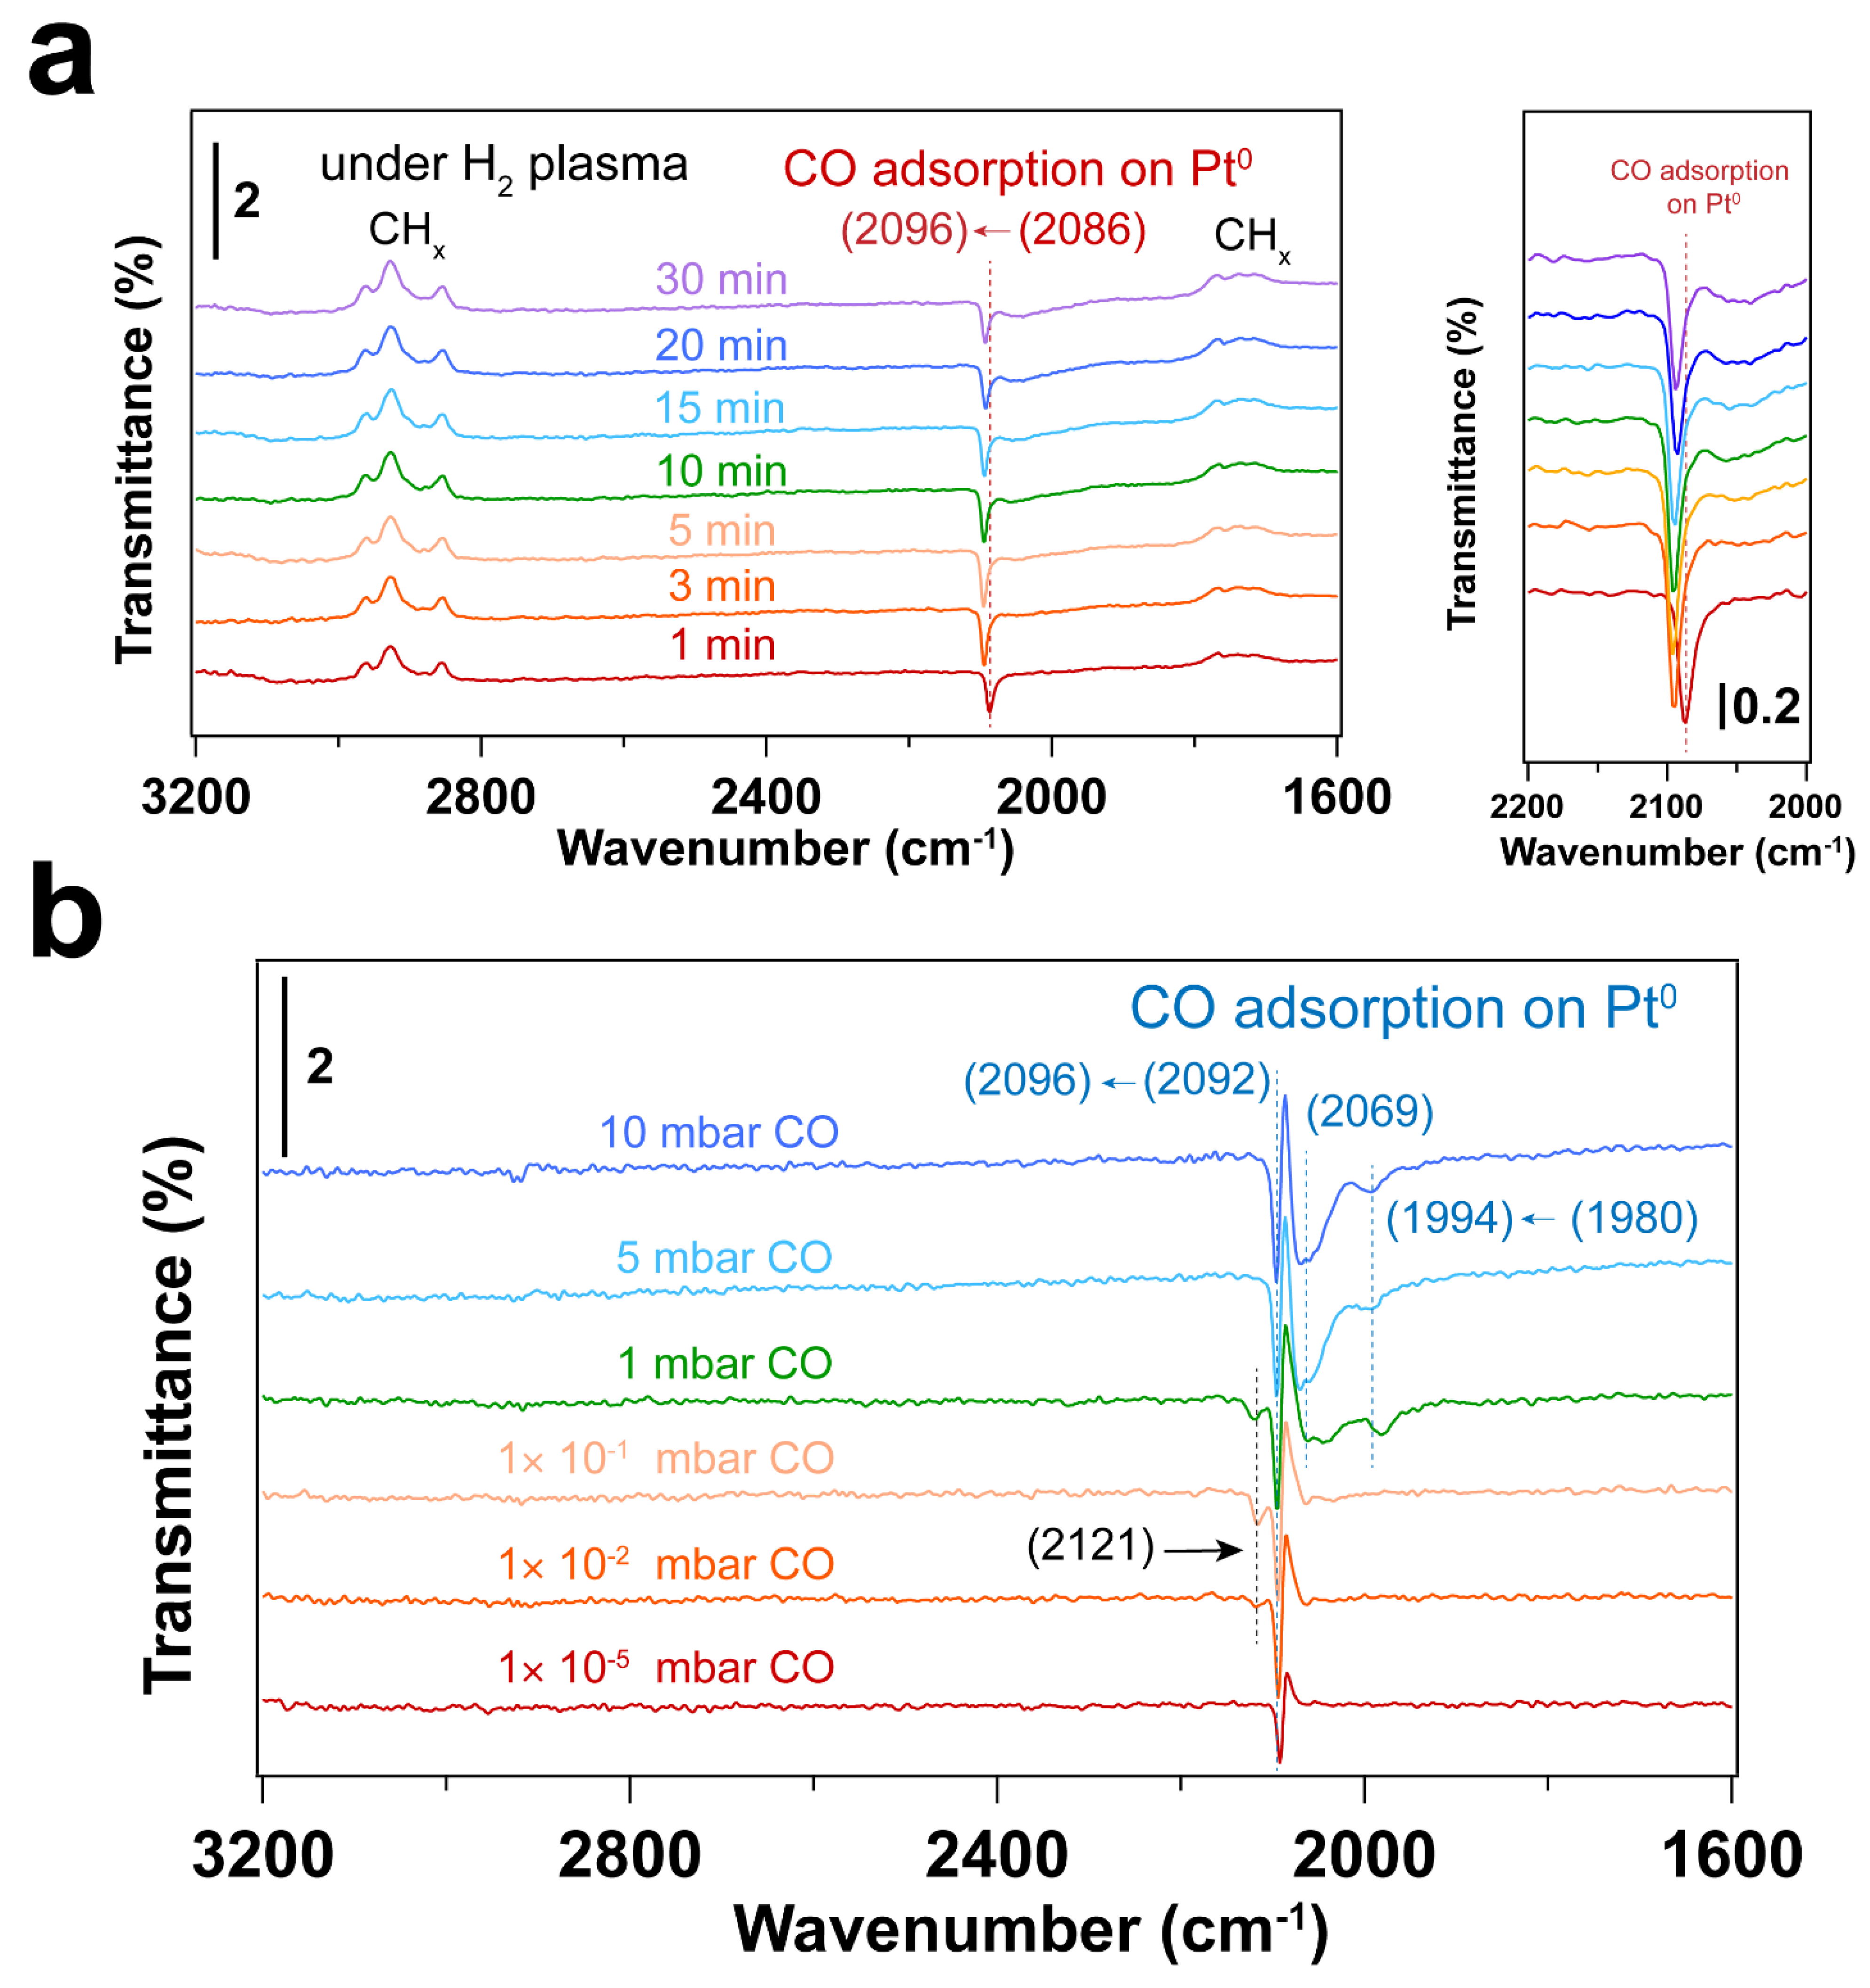
3.3. Removal of Surfactant by H2 Plasma Treatment

Altogether, both UV-ozone and O2 plasma treatments change the oxidation states of Pt. At the same time, the surfactant is removed efficiently by forming CO2 and CO species, with the latter (CO) adsorbing on the Pt nanoparticles. To avoid the oxidation of the Pt nanoparticles during cleaning, H2 plasma treatment was further investigated. Figure 5 shows XP spectra of the fresh sample after H2 plasma treatment and after CO adsorption. The data shows that the surfactant can also be removed by H2 plasma, as demonstrated by the disappearance C 1s and N 1s peaks in XP spectra. Similar to the sample after O2 plasma treatment, C species emerge in C 1s spectrum after CO adsorption experiment on the H2 plasma cleaned Pt nanoparticles.
The IRRA spectra in Figure 6a show CO adsorbed on metallic Pt during the H2 plasma treatment. This could be due to the reaction between hydrocarbon and surface oxygen species, forming CO. As a result, Pt remains in the metallic state after H2 plasma treatment (see Figure 5a and Table 3). Only linear adsorption of CO on Pt0 is observed from in situ CO probe experiments, as shown in Figure 6b. Different from the O2-based treatment, no CO adsorption on low coordination Pt sites is detected at low CO pressures (<1 mbar) in this case. By increasing CO pressure to 1 mbar, different CO stretching frequencies are obtained. This could be ascribed to the structural reconstruction of surface Pt atoms during CO adsorption [54]. CO initially adsorbs on those high-coordination Pt sites, resulting in CO stretching frequencies of 2069 and 2092 cm−1. With increasing CO pressure, the coordination number of Pt atoms varies with the plasma treatment time. Therefore, CO adsorption on low-coordination Pt sites appears (1980 cm−1). At high CO pressure, the increased CO coverage on Pt nanoparticles also results in the blue shifting of CO vibrational frequencies, which is caused by dipole-dipole interactions (from 1980 to 1994 cm−1 and from 2092 to 2096 cm−1). These results demonstrate that H2 plasma treatment is an efficient strategy for removing hydrocarbon-based surfactants while preventing oxidation of Pt.

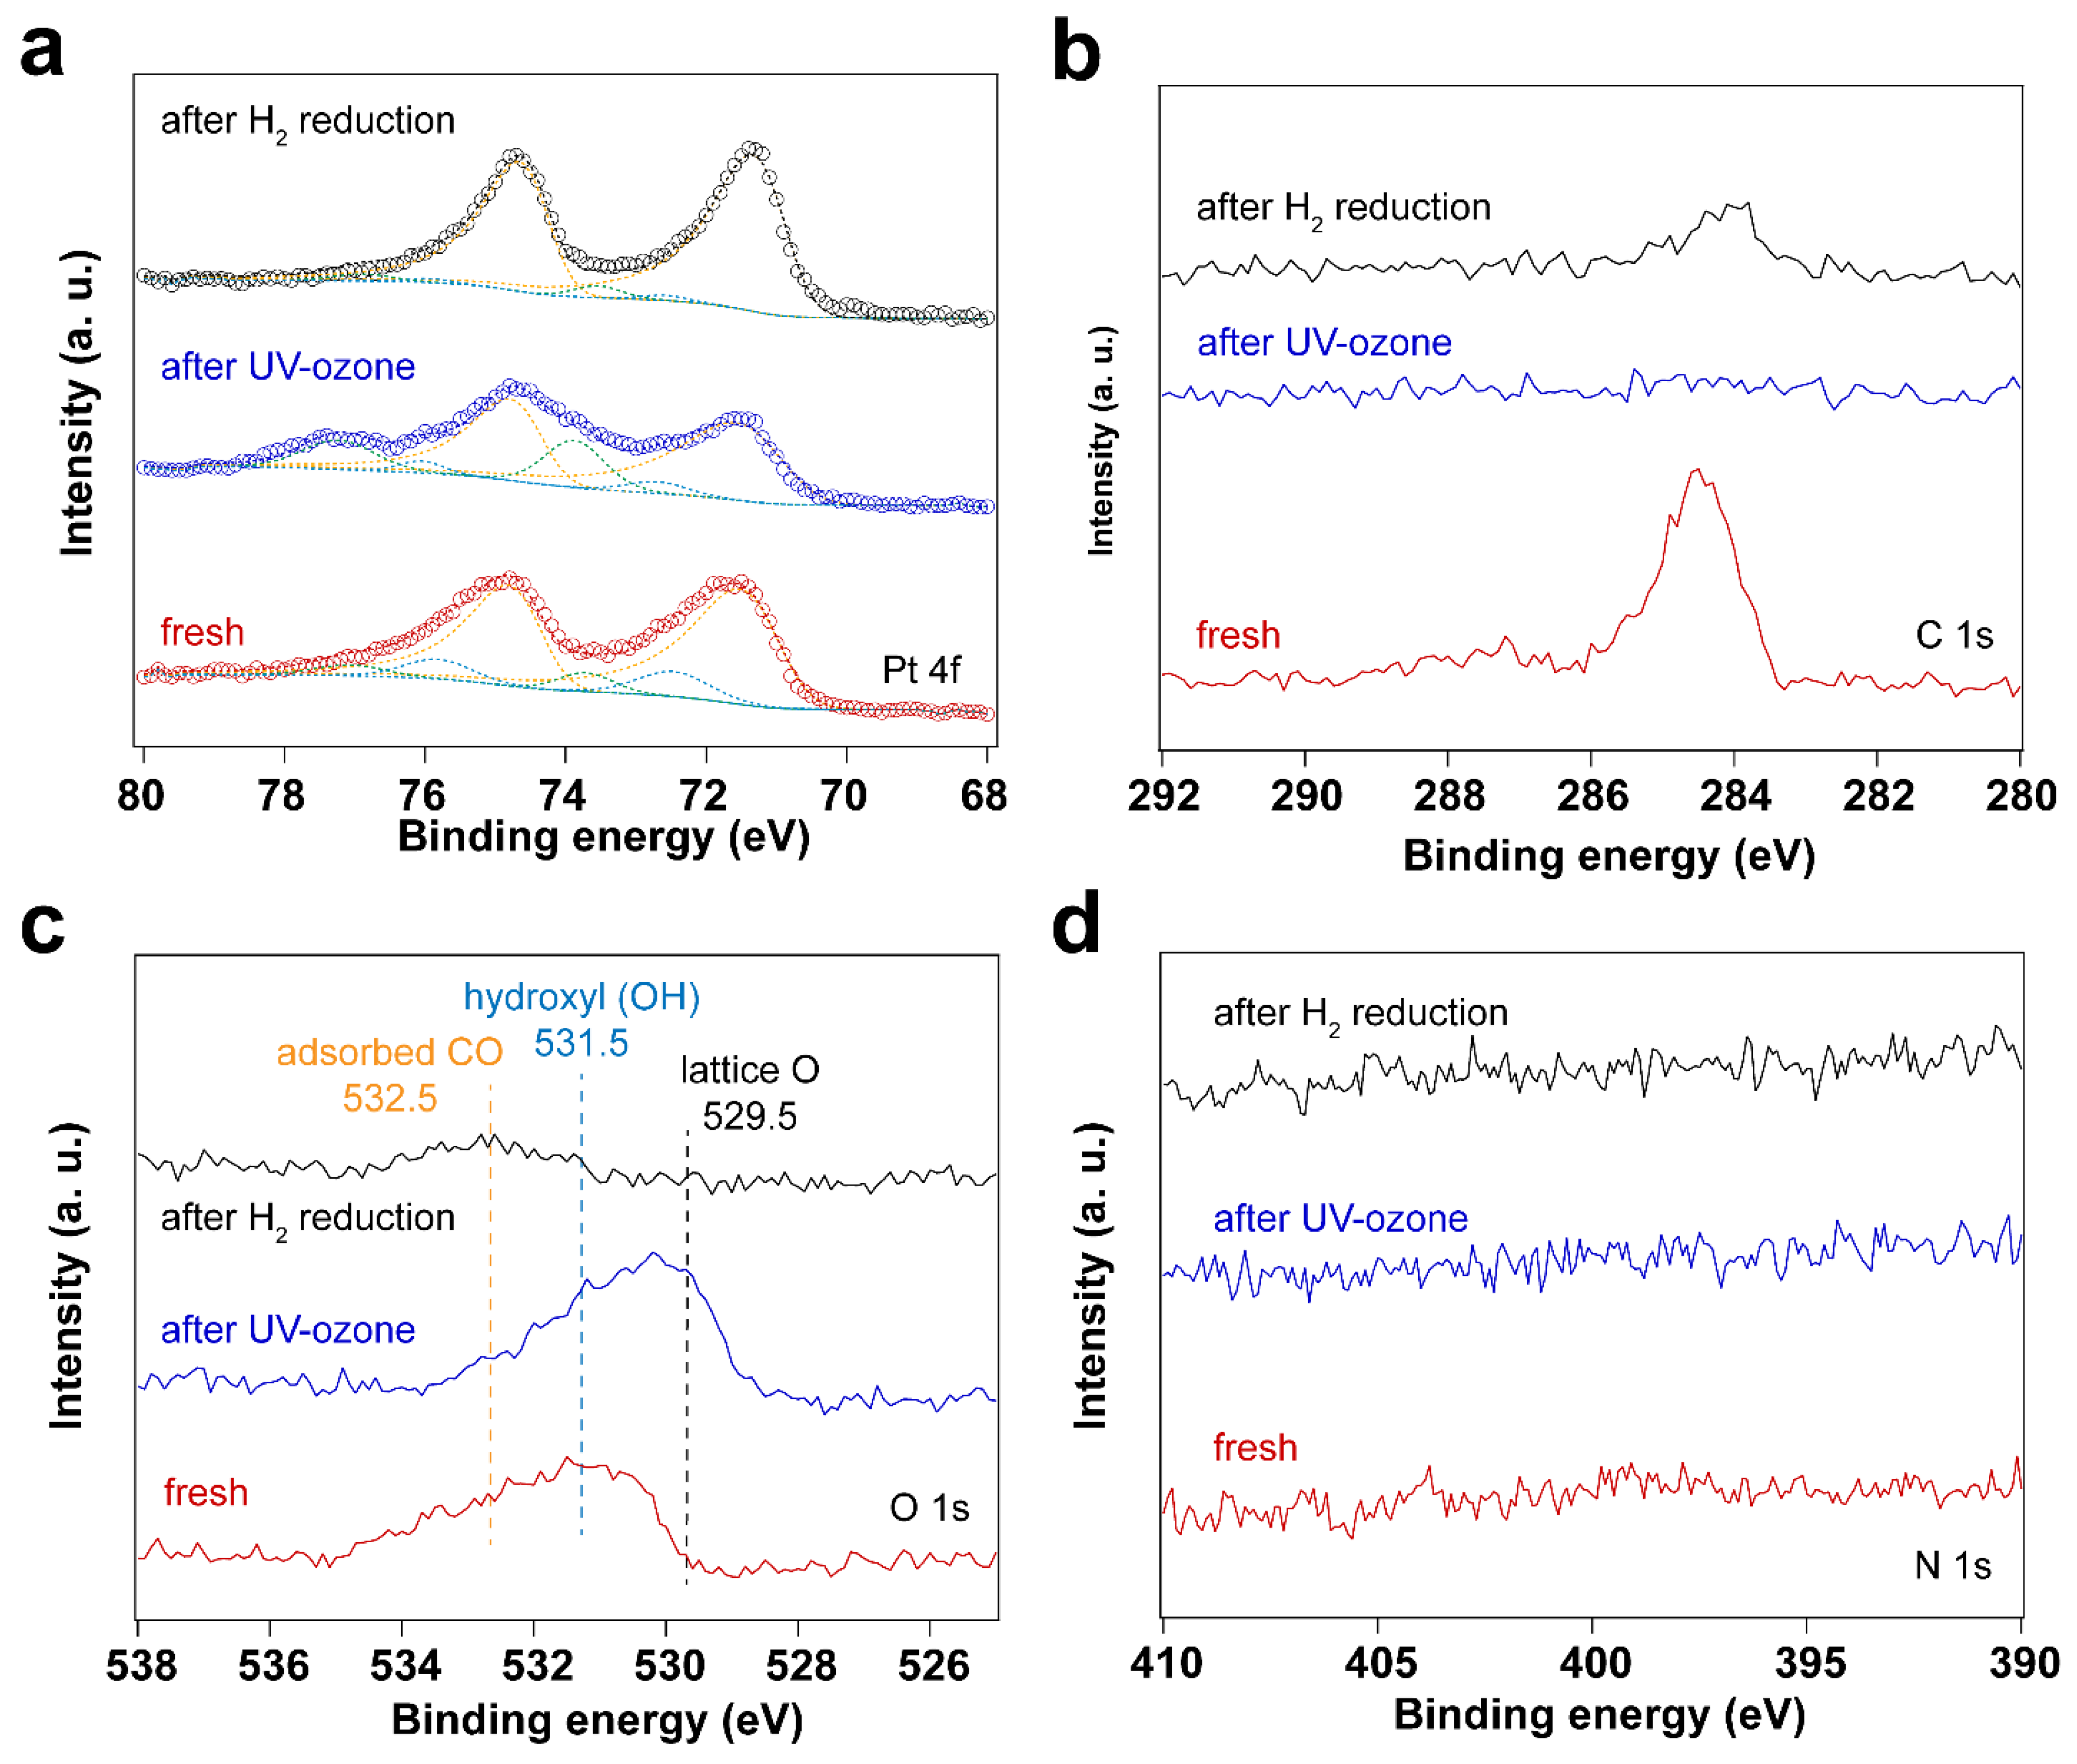
3.4. Using H2 Plasma to Reduce Pt Nanoparticles Treated by O2 Sources

In addition to surface cleaning, H2 plasma can also be used to reduce Pt oxides. The two O2-based cleaning methods described before result in the formation of oxides. We explore here the reduction of these oxides in different ways: (1) UV-ozone treatment coupled with in situ thermal H2 reduction, and (2) in situ O2 plasma followed by H2 plasma treatment. Figure 7 shows XPS measurements of surfactant encapsulated Pt nanoparticles after UV-ozone treatment followed by in situ H2 reduction at 100 °C under 0.5 mbar H2. Table 4 summarizes the Pt 4f peak positions and area ratios for the different Pt species before and after UV-ozone treatment, followed by in situ H2 reduction. Figure 8 shows the surfactant encapsulated Pt nanoparticles after O2 plasma treatment followed by H2 plasma reduction processes at room temperature. The Pt 4f peak positions and area ratios for different Pt species are summarized in Table 5. These results suggest that oxidized Pt can be reduced via thermal or plasma treatment in H2. Thermal treatment induces the C species emerging from bulk after O2 plasma cleaning, while no trace amount of C was detected after H2 plasma treatment. Figure S6 in the supporting information demonstrates that the H2 plasma treatment after O2 plasma further helps clean the surface. Residual hydrocarbon species desorb from the surface of Pt nanoparticles during H2 plasma treatment.
Figure 9 shows IRRA spectra of in situ CO adsorption on Pt nanoparticles after UV-ozone followed by thermal H2 reduction treatment. Figure 10 shows the IRRA spectra of in situ CO adsorption on Pt nanoparticles after O2 plasma treatment followed by H2 plasma treatment. For both samples, CO adsorption on highly coordinated sites dominates at low pressures (<1 × 10⁻¹ mbar). With increase of CO pressure, lower CO vibrational frequencies appear, which is similar to the H2 plasma treatment as discussed above (Figure 6). Since H2 plasma helps cleaning Pt nanoparticle surface after O2 plasma treatment, only a small fraction of hydrocarbon species at 3000–2800 cm−1 desorbs from the surface at high CO pressure (5 mbar). In contrast, the thermal reduction of Pt nanoparticles by H2 does not help the desorption of hydrocarbon species. During CO adsorption experiments, the desorption of hydrocarbon is observed at a relatively lower CO pressure (1 mbar).

3.5. Practical Applications of Plasma Cleaning in Advanced Characterization

To further investigate the changes of particle size after various treatments, scanning electron microscopy (SEM) analysis is performed. As shown in Figure 11 and Figures S9–S13 in supporting information, the average particle size of Pt nanoparticles is ~7.5 nm for the fresh sample. Non-thermal treatments (UV-ozone and plasma treatments) do not influence average particle size significantly, while thermal reduction leads to the growth of average Pt nanoparticle size. As shown in Figure 11j, a broad particle size distribution of Pt is observed after thermal reduction treatment. The presence of large particles (>12 nm) indicates the agglomeration of Pt nanoparticles during thermal treatment, which is consistent with the atomic force microscopy (AFM) result as shown in Figure S16. Compared to the thermal treatment, Pt nanoparticles show narrower size distributions after non-thermal treatments. In addition, O2-based surface cleaning treatment (UV-ozone and O2 plasma) results in the formation of Pt aggregates containing several small nanoparticles. On the contrary, the dispersion of Pt nanoparticles remains almost unchanged after H2 plasma treatment. As shown in Figure S17, there is no obvious agglomeration of Pt nanoparticles after H2 plasma treatment. These results indicate that compared to O2-based surface cleaning methods, H2 plasma treatment can efficiently remove hydrocarbon species without significantly changing the structure of nanoparticles.
Collectively, the widely used surfactant in chemical synthesis helps prepare metal nanoparticles with small particle sizes, which may exhibit promising performances due to the size effect, the formation of high density of defective sites and the different facets with atomic arrangements. However, after synthesis, the residual surfactant molecules on metal nanoparticle surface can either work cooperatively with metal nanoparticles to generate novel properties or block the surface of metal nanoparticles, sacrificing the surface metal sites. As shown in Figure S18, the presence of surfactant occupies surface Pt sites and thus the absence of CO adsorption on Pt was observed at low CO pressures. Both non-thermal UV-ozone and plasma treatment show the efficient removal of surfactant, indicated by the strong CO adsorption on Pt nanoparticles. As an example, Figure 12 compares the shape changes of Pt nanoparticles by conducting environmental transmission electron microscopy (ETEM) under different conditions to show the advantage of plasma-based cleaning method in practical applications. Figure 12a,b shows that surfactant encapsulated Pt nanoparticles are stable at 127 °C. The shapes of these particles remain almost unchanged after 2 min under vacuum conditions (~1 × 10⁻⁶ mbar). Further increasing the temperature to 227 °C, the small particles merge together, leading to the shape changes of these nanoparticles, as shown in Figure 12c. Movies S1 and S2 in the supporting information also show highly mobile Pt and shape changes of Pt nanoparticles at 227 °C. However, this dynamic structural reconstruction is absent at 127 °C. Figure 12d–f shows that after air plasma treatment for 1 h, the shape and size of Pt nanoparticles changes in 1 min. Longer exposing time results in the further changes in shape and particle size. Movie S3 in the supporting information also indicates that the structure undergoes reconstruction at 127 °C under vacuum conditions, after plasma treatment. The utilization of air plasma is more complicated than the single gas induced plasma treatment due to the complicated gas composition. Typically, reactive oxygen and nitrogen species, such as ozone, active radicals, nitrogen oxides, etc., play a major role in air plasma [55]. These results indicate the efficient sample cleaning by non-thermal plasma treatment.

4. Conclusions

In this work, we have investigated different strategies for the removal of surfactants from metal surfaces using well-defined Pt nanoparticles as model systems. The removal methods include UV-ozone irradiation, and non-thermal O2 and H2 plasma treatments. XPS, IRRAS analyses coupled with CO probe experiments demonstrate the efficient surfactant removal by all methods. For O2-based cleaning methods, surface Pt oxides are formed after treatment, and the particle size of Pt increases. On the contrary, H2 plasma treatment prevents oxidation and agglomeration of Pt nanoparticles. It also leads to a cleaner surface without residual adsorbed hydrocarbons after treatment. These observations reveal the importance of treatment conditions in producing a clean surface of nanoparticles without significant changes in structure and properties. Environmental TEM shows the highly dynamic surface of Pt nanoparticles after plasma treatment, indicating the protective role of surfactant and the efficient removal of surfactant by plasma treatment. SEM analysis demonstrates that the particle size distribution remains almost unchanged after non-thermal H2 plasma treatment. Notably, the dispersion of Pt nanoparticles is unchanged by H2 plasma treatment. While O2-based treatments do not lead to the growth of Pt nanoparticles, they induce changes in the dispersion of Pt nanoparticles, forming Pt aggregates. We hope these findings will open various opportunities for development of surface cleaning by extension of the concept to other materials and surfactants as well as gases used in plasma treatment. Note that for more electropositive metals than Pt, which are sensitive to oxidizing conditions, the utilization of non-thermal H2 plasma may be the only possible option to prevent drastic oxidation of the metal.

Supplementary Materials

The following supporting information can be downloaded at: https://www.mdpi.com/article/10.3390/nano14030290/s1. Reference [56] is cited in the supplementary materials.

Author Contributions

Conceptualization, J.A.B.; Methodology, G.L. and J.A.B.; Formal analysis, G.L. and P.D.; Investigation, G.L., D.N.Z., S.S., Y.X., X.T., P.D. and J.A.B.; Data curation, G.L. and P.D.; Writing – original draft, G.L.; Writing – review & editing, G.L., D.N.Z., P.D. and J.A.B.; Supervision, J.A.B.; Project administration, J.A.B.; Funding acquisition, J.A.B. All authors have read and agreed to the published version of the manuscript.

Funding

This work was supported by the U.S. Department of Energy, Office of Basic Energy Sciences, under Award DE-SC0022199. The experiments were carried out at the Center for Functional Nanomaterials at Brookhaven National Laboratory, supported by the U.S. Department of Energy, Office of Basic Energy Sciences, under Contract No. DE-SC0012704.

Data Availability Statement

Data are contained within the article and supplementary materials.

Conflicts of Interest

The authors declare no conflict of interest.

References

  1. Zhang, J.; Yang, H.; Fang, J.; Zou, S. Synthesis and oxygen reduction activity of shape-controlled Pt3Ni nanopolyhedra. Nano Lett. 2010, 10, 638–644. [Google Scholar] [CrossRef]
  2. Puntes, V.F.; Krishnan, K.M.; Alivisatos, A.P. Colloidal nanocrystal shape and size control: The case of cobalt. Science 2001, 291, 2115–2117. [Google Scholar] [CrossRef]
  3. Wang, C.; van der Vliet, D.; Chang, K.-C.; You, H.; Strmcnik, D.; Schlueter, J.A.; Markovic, N.M.; Stamenkovic, V.R. Monodisperse Pt3Co nanoparticles as a catalyst for the oxygen reduction reaction: Size-dependent activity. J. Phys. Chem. C 2009, 113, 19365–19368. [Google Scholar] [CrossRef]
  4. Sun, S.; Zeng, H.; Robinson, D.B.; Raoux, S.; Rice, P.M.; Wang, S.X.; Li, G. Monodisperse MFe2O4 (M = Fe, Co, Mn) nanoparticles. J. Am. Chem. Soc. 2004, 126, 273–279. [Google Scholar] [CrossRef]
  5. Tsung, C.-K.; Kuhn, J.N.; Huang, W.; Aliaga, C.; Hung, L.-I.; Somorjai, G.A.; Yang, P. Sub-10 nm platinum nanocrystals with size and shape control: Catalytic study for ethylene and pyrrole hydrogenation. J. Am. Chem. Soc. 2009, 131, 5816–5822. [Google Scholar] [CrossRef]
  6. Heinz, H.; Pramanik, C.; Heinz, O.; Ding, Y.; Mishra, R.K.; Marchon, D.; Flatt, R.J.; Estrela-Lopis, I.; Llop, J.; Moya, S. Nanoparticle decoration with surfactants: Molecular interactions, assembly, and applications. Surf. Sci. Rep. 2017, 72, 1–58. [Google Scholar] [CrossRef]
  7. Zeng, Z.; Chen, Y.; Zhu, X.; Yu, L. Polyaniline-supported nano metal-catalyzed coupling reactions: Opportunities and challenges. Chin. Chem. Lett. 2023, 34, 107728. [Google Scholar] [CrossRef]
  8. Darmadi, I.; Piella, J.; Stolas, A.; Andersson, C.; Tiburski, C.; Moth-Poulsen, K.; Langhammer, C. Plasma Cleaning of Cationic Surfactants from Pd Nanoparticle Surfaces: Implications for Hydrogen Sorption. ACS Appl. Nano Mater. 2023, 6, 8168–8177. [Google Scholar] [CrossRef]
  9. Saman, N.M.; Zakaria, I.H.; Ahmad, M.H.; Abdul-Malek, Z. Effects of plasma treated alumina nanoparticles on breakdown strength, partial discharge resistance, and thermophysical properties of mineral oil-based nanofluids. Materials 2021, 14, 3610. [Google Scholar] [CrossRef] [PubMed]
  10. Ayala-Orozco, C.; Urban, C.; Knight, M.W.; Urban, A.S.; Neumann, O.; Bishnoi, S.W.; Mukherjee, S.; Goodman, A.M.; Charron, H.; Mitchell, T. Au nanomatryoshkas as efficient near-infrared photothermal transducers for cancer treatment: Benchmarking against nanoshells. ACS Nano 2014, 8, 6372–6381. [Google Scholar] [CrossRef]
  11. Dreaden, E.C.; Alkilany, A.M.; Huang, X.; Murphy, C.J.; El-Sayed, M.A. The golden age: Gold nanoparticles for biomedicine. Chem. Soc. Rev. 2012, 41, 2740–2779. [Google Scholar] [CrossRef] [PubMed]
  12. Bang, J.H.; Kamat, P.V. Quantum dot sensitized solar cells. A tale of two semiconductor nanocrystals: CdSe and CdTe. ACS Nano 2009, 3, 1467–1476. [Google Scholar] [CrossRef] [PubMed]
  13. Jariwala, D.; Sangwan, V.K.; Lauhon, L.J.; Marks, T.J.; Hersam, M.C. Emerging device applications for semiconducting two-dimensional transition metal dichalcogenides. ACS Nano 2014, 8, 1102–1120. [Google Scholar] [CrossRef] [PubMed]
  14. Radisavljevic, B.; Radenovic, A.; Brivio, J.; Giacometti, V.; Kis, A. Single-layer MoS2 transistors. Nat. Nanotechnol. 2011, 6, 147–150. [Google Scholar] [CrossRef] [PubMed]
  15. Huang, G.; Chen, T.; Chen, W.; Wang, Z.; Chang, K.; Ma, L.; Huang, F.; Chen, D.; Lee, J.Y. Graphene-Like MoS2/Graphene Composites: Cationic Surfactant-Assisted Hydrothermal Synthesis and Electrochemical Reversible Storage of Lithium. Small 2013, 9, 3693–3703. [Google Scholar] [CrossRef]
  16. Wang, C.; Van Der Vliet, D.; More, K.L.; Zaluzec, N.J.; Peng, S.; Sun, S.; Daimon, H.; Wang, G.; Greeley, J.; Pearson, J. Multimetallic Au/FePt3 nanoparticles as highly durable electrocatalyst. Nano Lett. 2011, 11, 919–926. [Google Scholar] [CrossRef]
  17. Chen, W.; Kim, J.; Sun, S.; Chen, S. Electrocatalytic reduction of oxygen by FePt alloy nanoparticles. J. Phys. Chem. C 2008, 112, 3891–3898. [Google Scholar] [CrossRef]
  18. Swafford, L.A.; Weigand, L.A.; Bowers, M.J.; McBride, J.R.; Rapaport, J.L.; Watt, T.L.; Dixit, S.K.; Feldman, L.C.; Rosenthal, S.J. Homogeneously alloyed CdSxSe1-x nanocrystals: Synthesis, characterization, and composition/size-dependent band gap. J. Am. Chem. Soc. 2006, 128, 12299–12306. [Google Scholar] [CrossRef] [PubMed]
  19. Sun, Y.; Xia, Y. Shape-controlled synthesis of gold and silver nanoparticles. Science 2002, 298, 2176–2179. [Google Scholar] [CrossRef]
  20. Hrelescu, C.; Sau, T.K.; Rogach, A.L.; Ja, F.; Laurent, G.; Douillard, L.; Charra, F. Selective excitation of individual plasmonic hotspots at the tips of single gold nanostars. Nano Lett. 2011, 11, 402–407. [Google Scholar] [CrossRef] [PubMed]
  21. Niu, W.; Zheng, S.; Wang, D.; Liu, X.; Li, H.; Han, S.; Chen, J.; Tang, Z.; Xu, G. Selective synthesis of single-crystalline rhombic dodecahedral, octahedral, and cubic gold nanocrystals. J. Am. Chem. Soc. 2009, 131, 697–703. [Google Scholar] [CrossRef]
  22. Huang, X.; Neretina, S.; El-Sayed, M.A. Gold nanorods: From synthesis and properties to biological and biomedical applications. Adv. Mater. 2009, 21, 4880–4910. [Google Scholar] [CrossRef]
  23. Martinsson, E.; Shahjamali, M.M.; Enander, K.; Boey, F.; Xue, C.; Aili, D.; Liedberg, B. Local refractive index sensing based on edge gold-coated silver nanoprisms. J. Phys. Chem. C 2013, 117, 23148–23154. [Google Scholar] [CrossRef]
  24. Jing, H.; Zhang, Q.; Large, N.; Yu, C.; Blom, D.A.; Nordlander, P.; Wang, H. Tunable plasmonic nanoparticles with catalytically active high-index facets. Nano Lett. 2014, 14, 3674–3682. [Google Scholar] [CrossRef]
  25. Zhang, Q.; Large, N.; Wang, H. Gold nanoparticles with tipped surface structures as substrates for single-particle surface-enhanced Raman spectroscopy: Concave nanocubes, nanotrisoctahedra, and nanostars. ACS Appl. Mater. Interfaces 2014, 6, 17255–17267. [Google Scholar] [CrossRef] [PubMed]
  26. Martinsson, E.; Shahjamali, M.M.; Large, N.; Zaraee, N.; Zhou, Y.; Schatz, G.C.; Mirkin, C.A.; Aili, D. Influence of surfactant bilayers on the refractive index sensitivity and catalytic properties of anisotropic gold nanoparticles. Small 2016, 12, 330–342. [Google Scholar] [CrossRef] [PubMed]
  27. Macfarlane, R.J.; Jones, M.R.; Lee, B.; Auyeung, E.; Mirkin, C.A. Topotactic interconversion of nanoparticle superlattices. Science 2013, 341, 1222–1225. [Google Scholar] [CrossRef] [PubMed]
  28. Alkilany, A.M.; Thompson, L.B.; Boulos, S.P.; Sisco, P.N.; Murphy, C.J. Gold nanorods: Their potential for photothermal therapeutics and drug delivery, tempered by the complexity of their biological interactions. Adv. Drug Deliv. Rev. 2012, 64, 190–199. [Google Scholar] [CrossRef] [PubMed]
  29. Hauck, T.S.; Ghazani, A.A.; Chan, W.C. Assessing the effect of surface chemistry on gold nanorod uptake, toxicity, and gene expression in mammalian cells. Small 2008, 4, 153–159. [Google Scholar] [CrossRef] [PubMed]
  30. Li, D.; Wang, C.; Tripkovic, D.; Sun, S.; Markovic, N.M.; Stamenkovic, V.R. Surfactant removal for colloidal nanoparticles from solution synthesis: The effect on catalytic performance. ACS Catal. 2012, 2, 1358–1362. [Google Scholar] [CrossRef]
  31. Lu, L.; Zou, S.; Fang, B. The critical impacts of ligands on heterogeneous nanocatalysis: A review. ACS Catal. 2021, 11, 6020–6058. [Google Scholar] [CrossRef]
  32. Aliaga, C.; Park, J.Y.; Yamada, Y.; Lee, H.S.; Tsung, C.-K.; Yang, P.; Somorjai, G.A. Sum frequency generation and catalytic reaction studies of the removal of organic capping agents from Pt nanoparticles by UV—Ozone treatment. J. Phys. Chem. C 2009, 113, 6150–6155. [Google Scholar] [CrossRef]
  33. Kim, G.W.; Ha, J.W. Single-particle study: Effects of oxygen plasma treatment on structural and spectral changes of anisotropic gold nanorods. Phys. Chem. Chem. Phys. 2020, 22, 11767–11770. [Google Scholar] [CrossRef]
  34. Choi, K.; Ghosh, S.; Lim, J.; Lee, C. Removal efficiency of organic contaminants on Si wafer by dry cleaning using UV/O3 and ECR plasma. Appl. Surf. Sci. 2003, 206, 355–364. [Google Scholar] [CrossRef]
  35. Gehl, B.; Frömsdorf, A.; Aleksandrovic, V.; Schmidt, T.; Pretorius, A.; Flege, J.I.; Bernstorff, S.; Rosenauer, A.; Falta, J.; Weller, H. Structural and Chemical Effects of Plasma Treatment on Close-Packed Colloidal Nanoparticle Layers. Adv. Funct. Mater. 2008, 18, 2398–2410. [Google Scholar] [CrossRef]
  36. Nguyen, D.K.; Vargheese, V.; Liao, V.; Dimitrakellis, P.; Sourav, S.; Zheng, W.; Vlachos, D.G. Plasma-Enabled Ligand Removal for Improved Catalysis: Furfural Conversion on Pd/SiO2. ACS Nano 2023, 17, 21480–21492. [Google Scholar] [CrossRef]
  37. Han, G.; Wang, K.; Elkins, K.E.; Qiu, Z.; Timmons, R.B.; Savage, C.R.; Kang, S.; Liu, J.P. Cold plasma reduction of surface carbon on SmCo5 nano-flakes prepared by surfactant-assisted ball-milling. J. Magn. Magn. Mater. 2019, 471, 250–254. [Google Scholar] [CrossRef]
  38. de Mello, M.D.; Ahmad, M.; Lee, D.T.; Dimitrakellis, P.; Miao, Y.; Zheng, W.; Nykypanchuk, D.; Vlachos, D.G.; Tsapatsis, M.; Boscoboinik, J.A. In Situ Tracking of Nonthermal Plasma Etching of ZIF-8 Films. ACS Appl. Mater. Interfaces 2022, 14, 19023–19030. [Google Scholar] [CrossRef]
  39. Yamada, Y.; Tsung, C.-K.; Huang, W.; Huo, Z.; Habas, S.E.; Soejima, T.; Aliaga, C.E.; Somorjai, G.A.; Yang, P. Nanocrystal bilayer for tandem catalysis. Nat. Chem. 2011, 3, 372–376. [Google Scholar] [CrossRef]
  40. Li, G.; Marinkovic, N.; Wang, B.; Komarneni, M.R.; Resasco, D.E. Manipulating the Microenvironment of Surfactant-Encapsulated Pt Nanoparticles to Promote Activity and Selectivity. ACS Catal. 2022, 12, 13930–13940. [Google Scholar] [CrossRef]
  41. Vovk, E.I.; Kalinkin, A.V.; Smirnov, M.Y.; Klembovskii, I.O.; Bukhtiyarov, V.I. XPS study of stability and reactivity of oxidized Pt nanoparticles supported on TiO2. J. Phys. Chem. C 2017, 121, 17297–17304. [Google Scholar] [CrossRef]
  42. Li, G.; Li, L.; Wu, B.; Li, J.; Yuan, Y.; Shi, J. Controlled one-step synthesis of Pt decorated octahedral Fe3O4 and its excellent catalytic performance for CO oxidation. Nanoscale 2015, 7, 17855–17860. [Google Scholar] [CrossRef] [PubMed]
  43. Parkinson, C.; Walker, M.; McConville, C. Reaction of atomic oxygen with a Pt (111) surface: Chemical and structural determination using XPS, CAICISS and LEED. Surf. Sci. 2003, 545, 19–33. [Google Scholar] [CrossRef]
  44. Motin, A.M.; Haunold, T.; Bukhtiyarov, A.V.; Bera, A.; Rameshan, C.; Rupprechter, G. Surface science approach to Pt/carbon model catalysts: XPS, STM and microreactor studies. Appl. Surf. Sci. 2018, 440, 680–687. [Google Scholar] [CrossRef]
  45. Johansson, N.; Andersen, M.; Monya, Y.; Andersen, J.N.; Kondoh, H.; Schnadt, J.; Knudsen, J. Ambient pressure phase transitions over Ir (111): At the onset of CO oxidation. J. Phys. Condens. Matter 2017, 29, 444002. [Google Scholar] [CrossRef] [PubMed]
  46. Garcia-Martinez, F.; García-Fernández, C.; Simonovis, J.P.; Hunt, A.; Walter, A.; Waluyo, I.; Bertram, F.; Merte, L.R.; Shipilin, M.; Pfaff, S. Catalytic Oxidation of CO on a Curved Pt (111) Surface: Simultaneous Ignition at All Facets through a Transient CO-O Complex. Angew. Chem. 2020, 132, 20212–20218. [Google Scholar] [CrossRef]
  47. Ding, K.; Gulec, A.; Johnson, A.M.; Schweitzer, N.M.; Stucky, G.D.; Marks, L.D.; Stair, P.C. Identification of active sites in CO oxidation and water-gas shift over supported Pt catalysts. Science 2015, 350, 189–192. [Google Scholar] [CrossRef]
  48. Ivanova, E.; Mihaylov, M.; Thibault-Starzyk, F.; Daturi, M.; Hadjiivanov, K. FTIR spectroscopy study of CO and NO adsorption and co-adsorption on Pt/TiO2. J. Mol. Catal. A Chem. 2007, 274, 179–184. [Google Scholar] [CrossRef]
  49. Crossley, A.; King, D.A. Infrared spectra for co isotopes chemisorbed on Pt “111”: Evidence for strong absorbate coupling interactions. Surf. Sci. 1977, 68, 528–538. [Google Scholar] [CrossRef]
  50. Olsen, C.; Masel, R. An infrared study of CO adsorption on Pt (111). Surf. Sci. 1988, 201, 444–460. [Google Scholar] [CrossRef]
  51. Allian, A.D.; Takanabe, K.; Fujdala, K.L.; Hao, X.; Truex, T.J.; Cai, J.; Buda, C.; Neurock, M.; Iglesia, E. Chemisorption of CO and mechanism of CO oxidation on supported platinum nanoclusters. J. Am. Chem. Soc. 2011, 133, 4498–4517. [Google Scholar] [CrossRef] [PubMed]
  52. Bordenyuk, A.N.; Weeraman, C.; Yatawara, A.; Jayathilake, H.D.; Stiopkin, I.; Liu, Y.; Benderskii, A.V. Vibrational sum frequency generation spectroscopy of dodecanethiol on metal nanoparticles. J. Phys. Chem. C 2007, 111, 8925–8933. [Google Scholar] [CrossRef]
  53. Borodko, Y.; Habas, S.E.; Koebel, M.; Yang, P.; Frei, H.; Somorjai, G.A. Probing the Interaction of Poly (vinylpyrrolidone) with Platinum Nanocrystals by UV− Raman and FTIR. J. Phys. Chem. B 2006, 110, 23052–23059. [Google Scholar] [CrossRef] [PubMed]
  54. Michalka, J.R.; Latham, A.P.; Gezelter, J.D. CO-induced restructuring on stepped Pt surfaces: A molecular dynamics study. J. Phys. Chem. C 2016, 120, 18180–18190. [Google Scholar] [CrossRef]
  55. Zabidi, N.; Zaaba, S.; Sut, K.E.; Mohamad, C.; Masiman, R. A Brief Review on Atmospheric Air Plasma. J. Phys. Conf. Ser. 2021, 2071, 012004. [Google Scholar] [CrossRef]
  56. Škoro, N.; Puač, N.; Lazović, S.; Cvelbar, U.; Kokkoris, G.; Gogolides, E. Characterization and global modelling of low-pressure hydrogen-based RF plasmas suitable for surface cleaning processes. J. Phys. D Appl. Phys. 2013, 46, 475206. [Google Scholar] [CrossRef]
Figure 1. XP spectra of surfactant encapsulated Pt nanoparticles before and after 30 min UV-ozone treatment and after subsequent exposure to 10 mbar of CO at room temperature: (a) Pt 4f XP spectra; (b) C 1s XP spectra; (c) O 1s XP spectra, (d) N 1s XP spectra.
Nanomaterials 14 00290 g001
Figure 2. IRRA spectra of in situ CO adsorption on Pt nanoparticles after UV-ozone treatment. Before introducing CO, background ( p 0 s 0 ) was collected under UHV conditions (2 × 10⁻⁸ mbar); The transmittance signal was obtained by comparing the spectra under different CO pressures with the background spectrum ( p C O / s C O p 0 / s 0 ); where pCO and sCO refer to the p- and s- polarized spectra that were collected under different CO pressures. The wavenumbers of CO vibration are presented in brackets.
Nanomaterials 14 00290 g002
Figure 3. (a) IRRA spectra of surfactant encapsulated Pt nanoparticles during O2 plasma treatment at room temperature. The CO adsorption range (2200–2000 cm−1) is also presented. The pressure of O2 was 0.1 mbar, and the power applied for plasma treatment was 4 W. Before plasma treatment, background ( p 0 s 0 ) was collected in the presence of 0.1 mbar O2. The transmittance signal was obtained by comparing the spectrum after plasma treatment with the background spectrum ( p t / s t p 0 / s 0 ); where pt and st refer to the p- and s- polarized spectra; (b) IRRAS spectra of in situ CO adsorption on Pt nanoparticles after O2 plasma treatment. Before introducing CO, background ( p 0 s 0 ) was collected under UHV conditions (2 × 10⁻⁸ mbar). The transmittance signal was obtained by comparing the spectra under different CO pressures with the background spectrum ( p C O / s C O p 0 / s 0 ), where pCO and sCO refer to the p- and s-polarized spectra collected under different CO pressures. The wavenumbers of CO vibration are presented in brackets.
Nanomaterials 14 00290 g003
Figure 4. XP spectra of surfactant encapsulated Pt nanoparticles before and after O2 plasma treatment and after in situ CO adsorption experiment: (a) Pt 4f XP spectra; (b) C 1s XP spectra; (c) O 1s XP spectra; (d) N 1s XP spectra.
Nanomaterials 14 00290 g004
Figure 5. XP spectra of surfactant encapsulated Pt nanoparticles before and after H2 plasma treatment and after in situ CO adsorption experiment: (a) Pt 4f XP spectra; (b) C 1s XP spectra; (c) O 1s XP spectra; (d) N 1s XP spectra.
Nanomaterials 14 00290 g005
Figure 6. (a) IRRA spectra of surfactant encapsulated Pt nanoparticles during H2 plasma treatment at room temperature. The CO adsorption range (2200–2000 cm−1) is also presented. The pressure of H2 was 0.1 mbar, power applied for plasma treatment was 4 W; before plasma treatment, background ( p 0 s 0 ) was collected in the presence of 0.1 mbar H2; The transmittance signal was obtained by comparing the spectrum after plasma treatment with the background spectrum ( p t / s t p 0 / s 0 ); where pt and st refer to the p- and s- polarized spectra; (b) IRRAS spectra of in situ CO adsorption on Pt nanoparticles after H2 plasma treatment. Before introducing CO, background ( p 0 s 0 ) was collected under UHV conditions (2 × 10⁻⁸ mbar); The transmittance signal was obtained by comparing the spectra under different CO pressures with the background spectrum ( p C O / s C O p 0 / s 0 ); where pCO and sCO refer to the p- and s- polarized spectra that were collected under different CO pressures. The wavenumbers of CO vibration are presented in brackets.
Nanomaterials 14 00290 g006
Figure 7. XP spectra of surfactant encapsulated Pt nanoparticles after UV-ozone treatment followed by in situ H2 reduction at 100 °C under 0.5 mbar H2: (a) Pt 4f XP spectra; (b) C 1s XP spectra; (c) O 1s XP spectra; (d) N 1s XP spectra.
Nanomaterials 14 00290 g007
Figure 8. XP spectra of surfactant encapsulated Pt nanoparticles after O2 plasma treatment followed by H2 plasma reduction processes at room temperature: (a) Pt 4f XP spectra; (b) C 1s XP spectra; (c) O 1s XP spectra; (d) N 1s XP spectra. The pressure of O2 or H2 for plasma treatment was 0.1 mbar, and the power applied for plasma treatment was 4 W.
Nanomaterials 14 00290 g008
Figure 9. IRRA spectra of in situ CO adsorption on Pt nanoparticles, after UV-ozone followed by thermal H2 reduction treatment. The wavenumbers of CO vibration are presented in brackets. Before introducing CO, background ( p 0 s 0 ) was collected under UHV conditions (2 × 10⁻⁸ mbar). The transmittance signal was obtained by comparing the spectra under different CO pressures with the background spectrum ( p C O / s C O p 0 / s 0 ), where pCO and sCO refer to the p- and s-polarized spectra that were collected under different CO pressures.
Nanomaterials 14 00290 g009
Figure 10. IRRA spectra of in situ CO adsorption on Pt nanoparticles after O2 plasma followed by H2 plasma treatment. The wavenumbers of CO vibration are presented in brackets. The pressure of O2 or H2 for plasma treatment was 0.1 mbar, power applied for plasma treatment was 4 W. Before introducing CO, the background ( p 0 s 0 ) was collected under UHV conditions (2 × 10⁻⁸ mbar). The transmittance signal was obtained by comparing the spectra under different CO pressures with the background spectrum ( p C O / s C O p 0 / s 0 ); where pCO and sCO refer to the p- and s- polarized spectra that were collected under different CO pressures. In situ tracking of structure changes by IRRAS during sequential plasma treatments are presented in the supporting information.
Nanomaterials 14 00290 g010
Figure 11. SEM analysis of the changes of surfactant encapsulated Pt nanoparticles before and after treatments. (a,b) surfactant encapsulated Pt nanoparticles supported on Au film without treatment; (c,d) surfactant encapsulated Pt nanoparticles supported on Au film after UV-ozone treatment; (e,f) surfactant encapsulated Pt nanoparticles supported on Au film after O2 plasma treatment; (g,h) surfactant encapsulated Pt nanoparticles supported on Au film after H2 plasma treatment; (i,j) surfactant encapsulated Pt nanoparticles supported on Au film after UV-ozone treatment followed by H2 reduction at 100 °C for 30 min; (k,l) surfactant encapsulated Pt nanoparticles supported on Au film after O2 plasma followed by H2 plasma treatment. The estimated particle size distributions were obtained by counting ~100 nanoparticles from the SEM images.
Nanomaterials 14 00290 g011
Figure 12. (ac) In situ ETEM images showing morphological evolution of encapsulated Pt nanoparticles as a function of time and temperature; (df) in situ ETEM images of Pt nanoparticle after in situ air plasma treatment for 1 h at 127 °C. The shape changes of different nanoparticles are shown in Movies S1–S3 in the supporting information.
Nanomaterials 14 00290 g012
Table 1. Pt 4f peak positions and area ratios for the different Pt species before and after UV-ozone treatment, and CO adsorption experiment.
SampleFreshAfter UV-Ozone TreatmentAfter CO Adsorption
Peak position
(eV)
Pt0 4f7/271.1771.1671.04
Pt0 4f5/274.5274.5174.39
Pt–O(I) 4f7/272.4572.7072.18
Pt–O(I) 4f5/275.8076.0575.53
Pt–O(II) 4f7/273.7973.9873.57
Pt–O(II) 4f5/277.1477.3376.92
Peak area ratioPt–O(I)/Pt00.280.130.30
Pt–O(II)/Pt00.070.370.27
Table 2. Pt 4f peak positions and area ratios for the different Pt species before and after O2 plasma treatment and in situ CO adsorption.
SampleFreshAfter O2 Plasma TreatmentAfter CO Adsorption
Peak position
(eV)
Pt0 4f7/271.1671.0571.07
Pt0 4f5/274.5174.4074.42
Pt–O(I) 4f7/273.6973.0673.43
Pt–O(I) 4f5/277.0476.4176.77
Pt–O(II) 4f7/272.4874.2974.80
Pt–O(II) 4f5/275.8377.6478.15
Peak area ratioPt–O(I)/Pt00.130.040.04
Pt–O(II)/Pt00.070.17<0.001
Table 3. Pt 4f peak positions and area ratios for the different Pt species before and after H2 plasma treatment and in situ CO adsorption.
SampleFreshAfter H2 Plasma TreatmentAfter CO Adsorption
Peak position
(eV)
Pt0 4f7/271.2271.0571.07
Pt0 4f5/274.5774.4074.42
Pt–O(I) 4f7/272.5072.0572.46
Pt–O(I) 4f5/275.8575.4075.81
Pt–O(II) 4f7/274.6073.5873.54
Pt–O(II) 4f5/277.9576.9376.89
Peak area ratioPt–O(I)/Pt00.150.030.03
Pt–O(II)/Pt00.080.020.02
Table 4. Pt 4f peak positions and area ratios for the different Pt species before and after UV-ozone treatment followed by in situ H2 reduction.
SampleFreshAfter UV-Ozone TreatmentAfter H2 Reduction
Peak position
(eV)
Pt0 4f7/271.1471.1371.02
Pt0 4f5/274.4974.4874.37
Pt–O(I) 4f7/272.4772.7072.58
Pt–O(I) 4f5/275.8276.0575.93
Pt–O(II) 4f7/273.7273.8873.54
Pt–O(II) 4f5/277.0777.2376.89
Peak area ratioPt–O(I)/Pt00.150.070.02
Pt–O(II)/Pt00.090.300.04
Table 5. Pt 4f peak positions and area ratios for the different Pt species before and after O2 plasma treatment followed by H2 plasma treatment.
SampleFreshAfter O2 Plasma TreatmentAfter H2 Plasma Treatment
Peak position
(eV)
Pt0 4f7/271.0771.0871.03
Pt0 4f5/274.4274.4374.38
Pt–O(I) 4f7/272.3172.1572.10
Pt–O(I) 4f5/275.6675.5075.45
Pt–O(II) 4f7/273.5674.1973.52
Pt–O(II) 4f5/276.9177.5476.87
Peak area ratioPt–O(I)/Pt00.220.010.13
Pt–O(II)/Pt00.080.150.04
Disclaimer/Publisher’s Note: The statements, opinions and data contained in all publications are solely those of the individual author(s) and contributor(s) and not of MDPI and/or the editor(s). MDPI and/or the editor(s) disclaim responsibility for any injury to people or property resulting from any ideas, methods, instructions or products referred to in the content.

