
Characterisation and Mechanical Modelling of Polyacrylonitrile-Based Nanocomposite Membranes Reinforced with Silica Nanoparticles
 ,
,  ,
,  , ,
, ,  ,
,
Abstract
:1. Introduction
2. Materials and Methods
2.1. Materials
2.2. Preparation of PAN/FS Blend Membranes
2.3. Characterisation of Membranes
2.3.1. FTIR Analysis
2.3.2. Thermal Characterisation
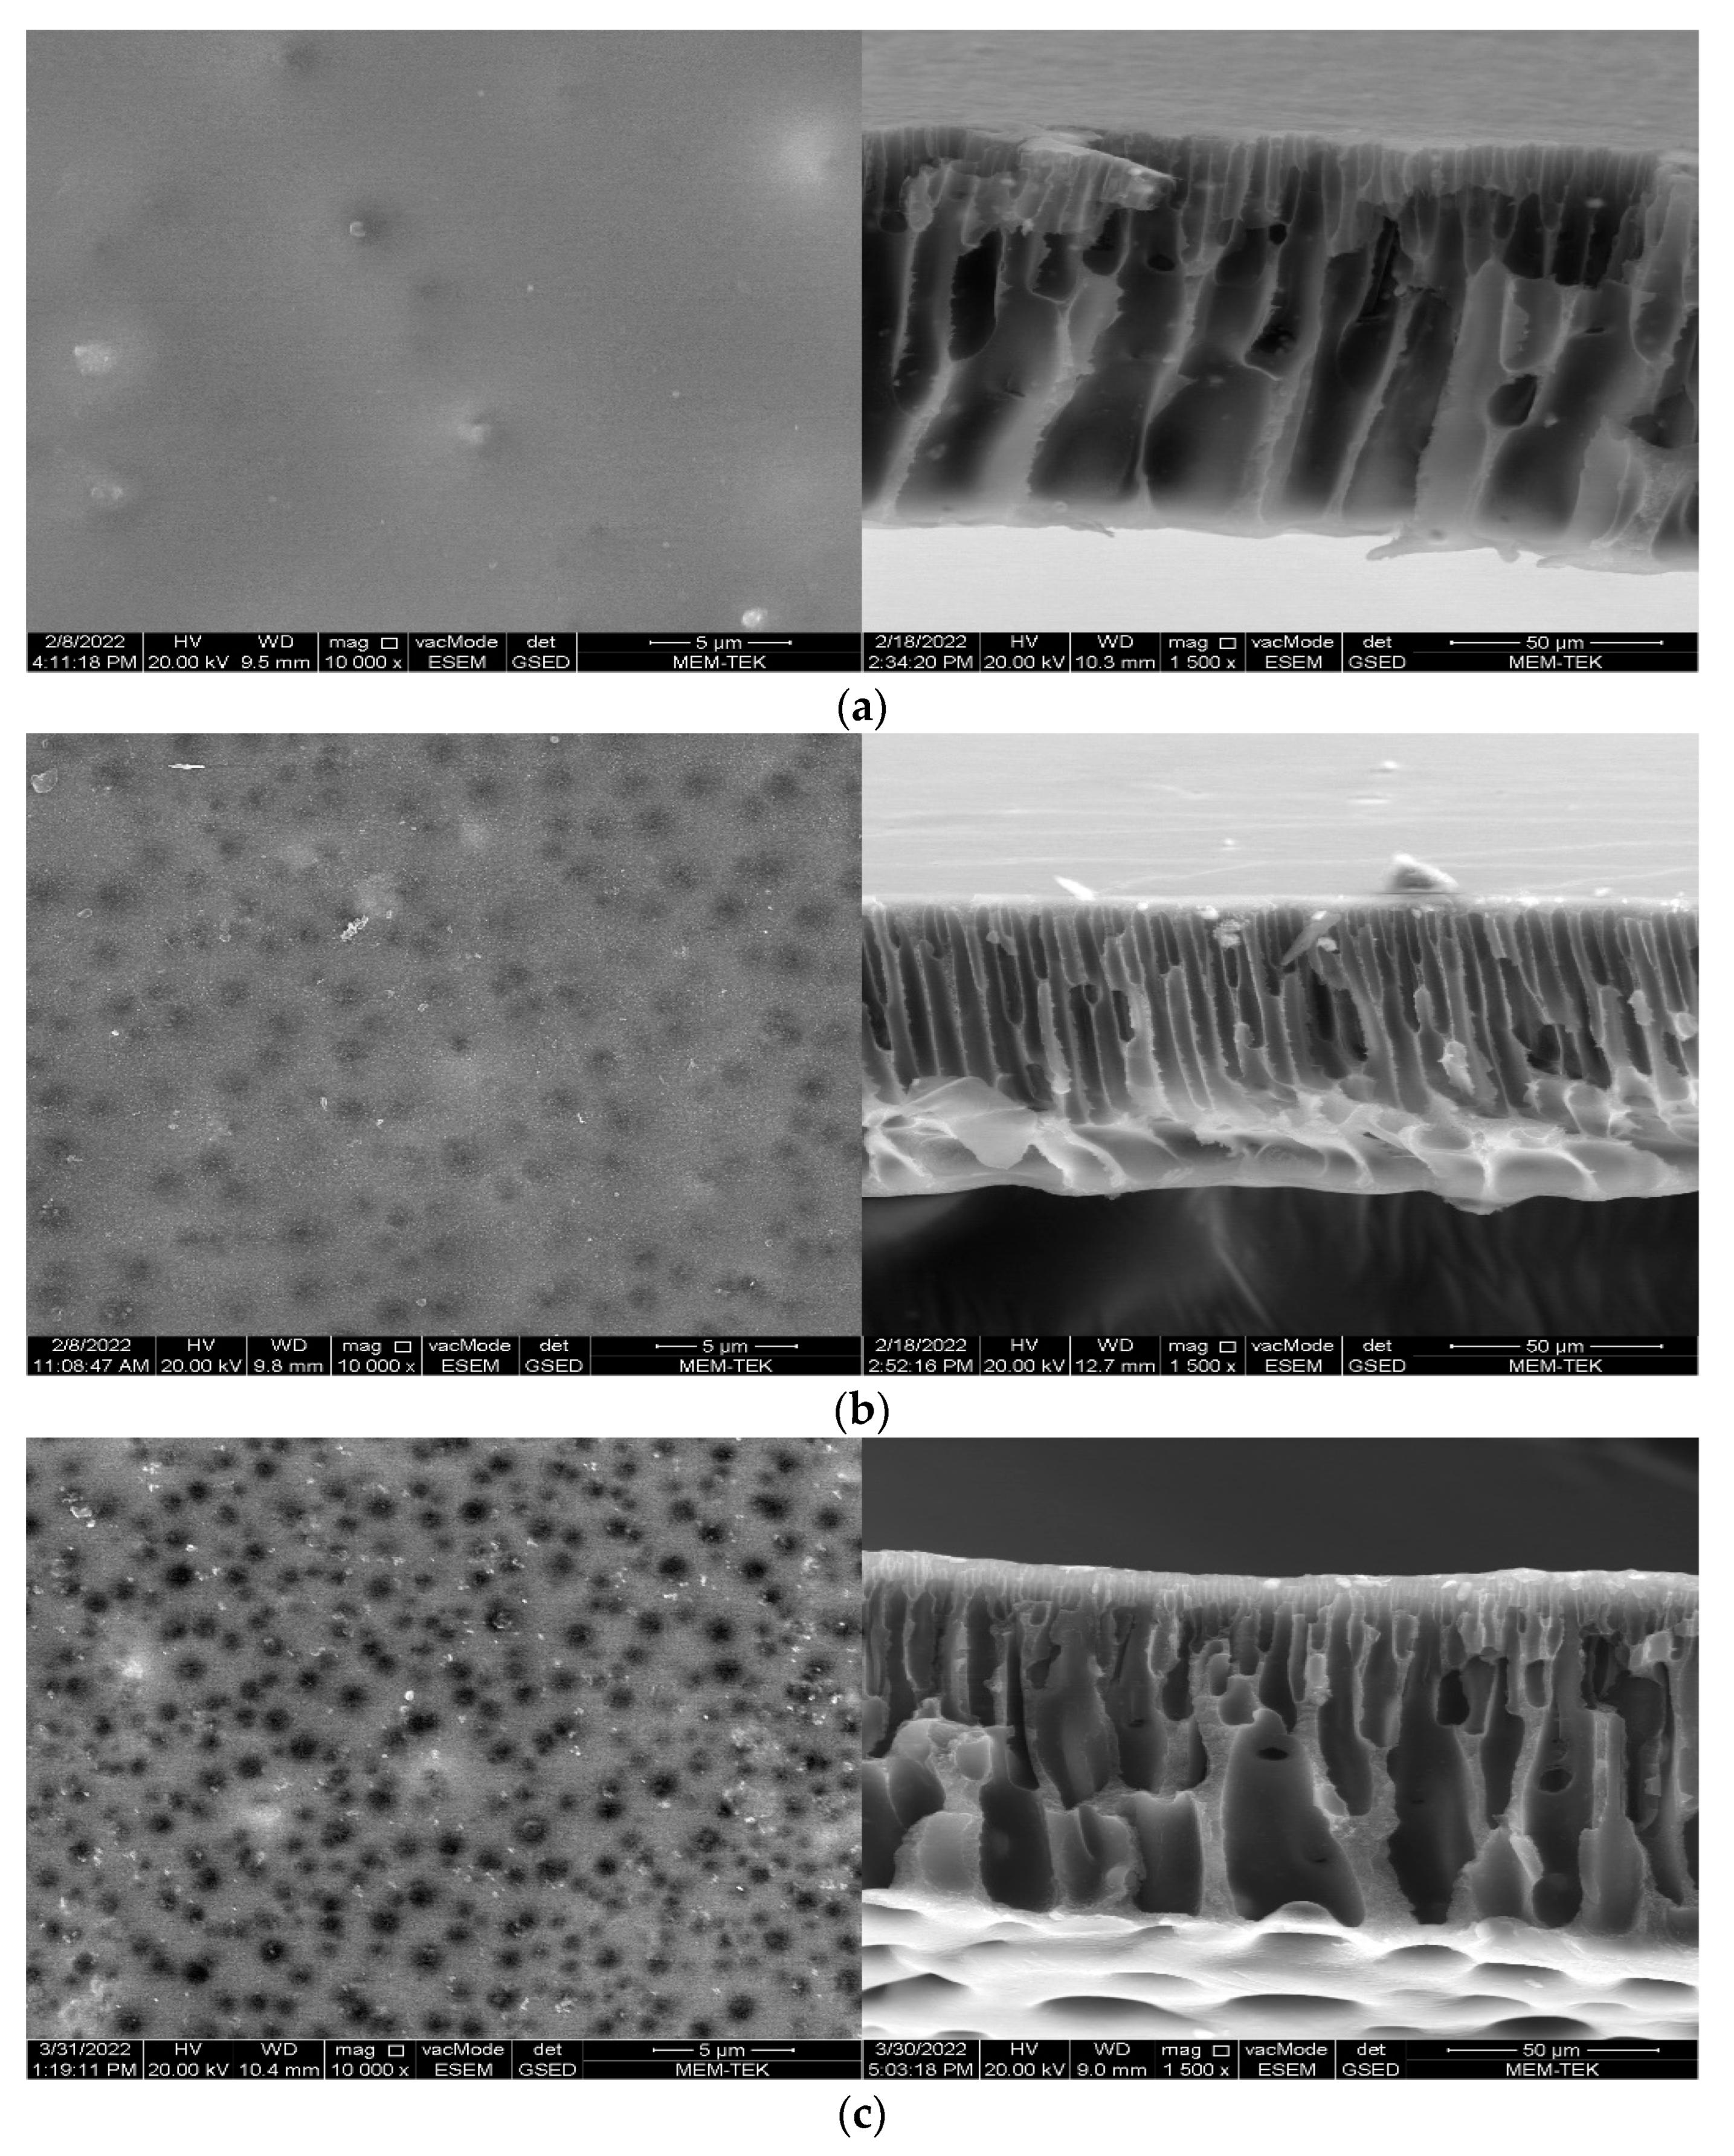
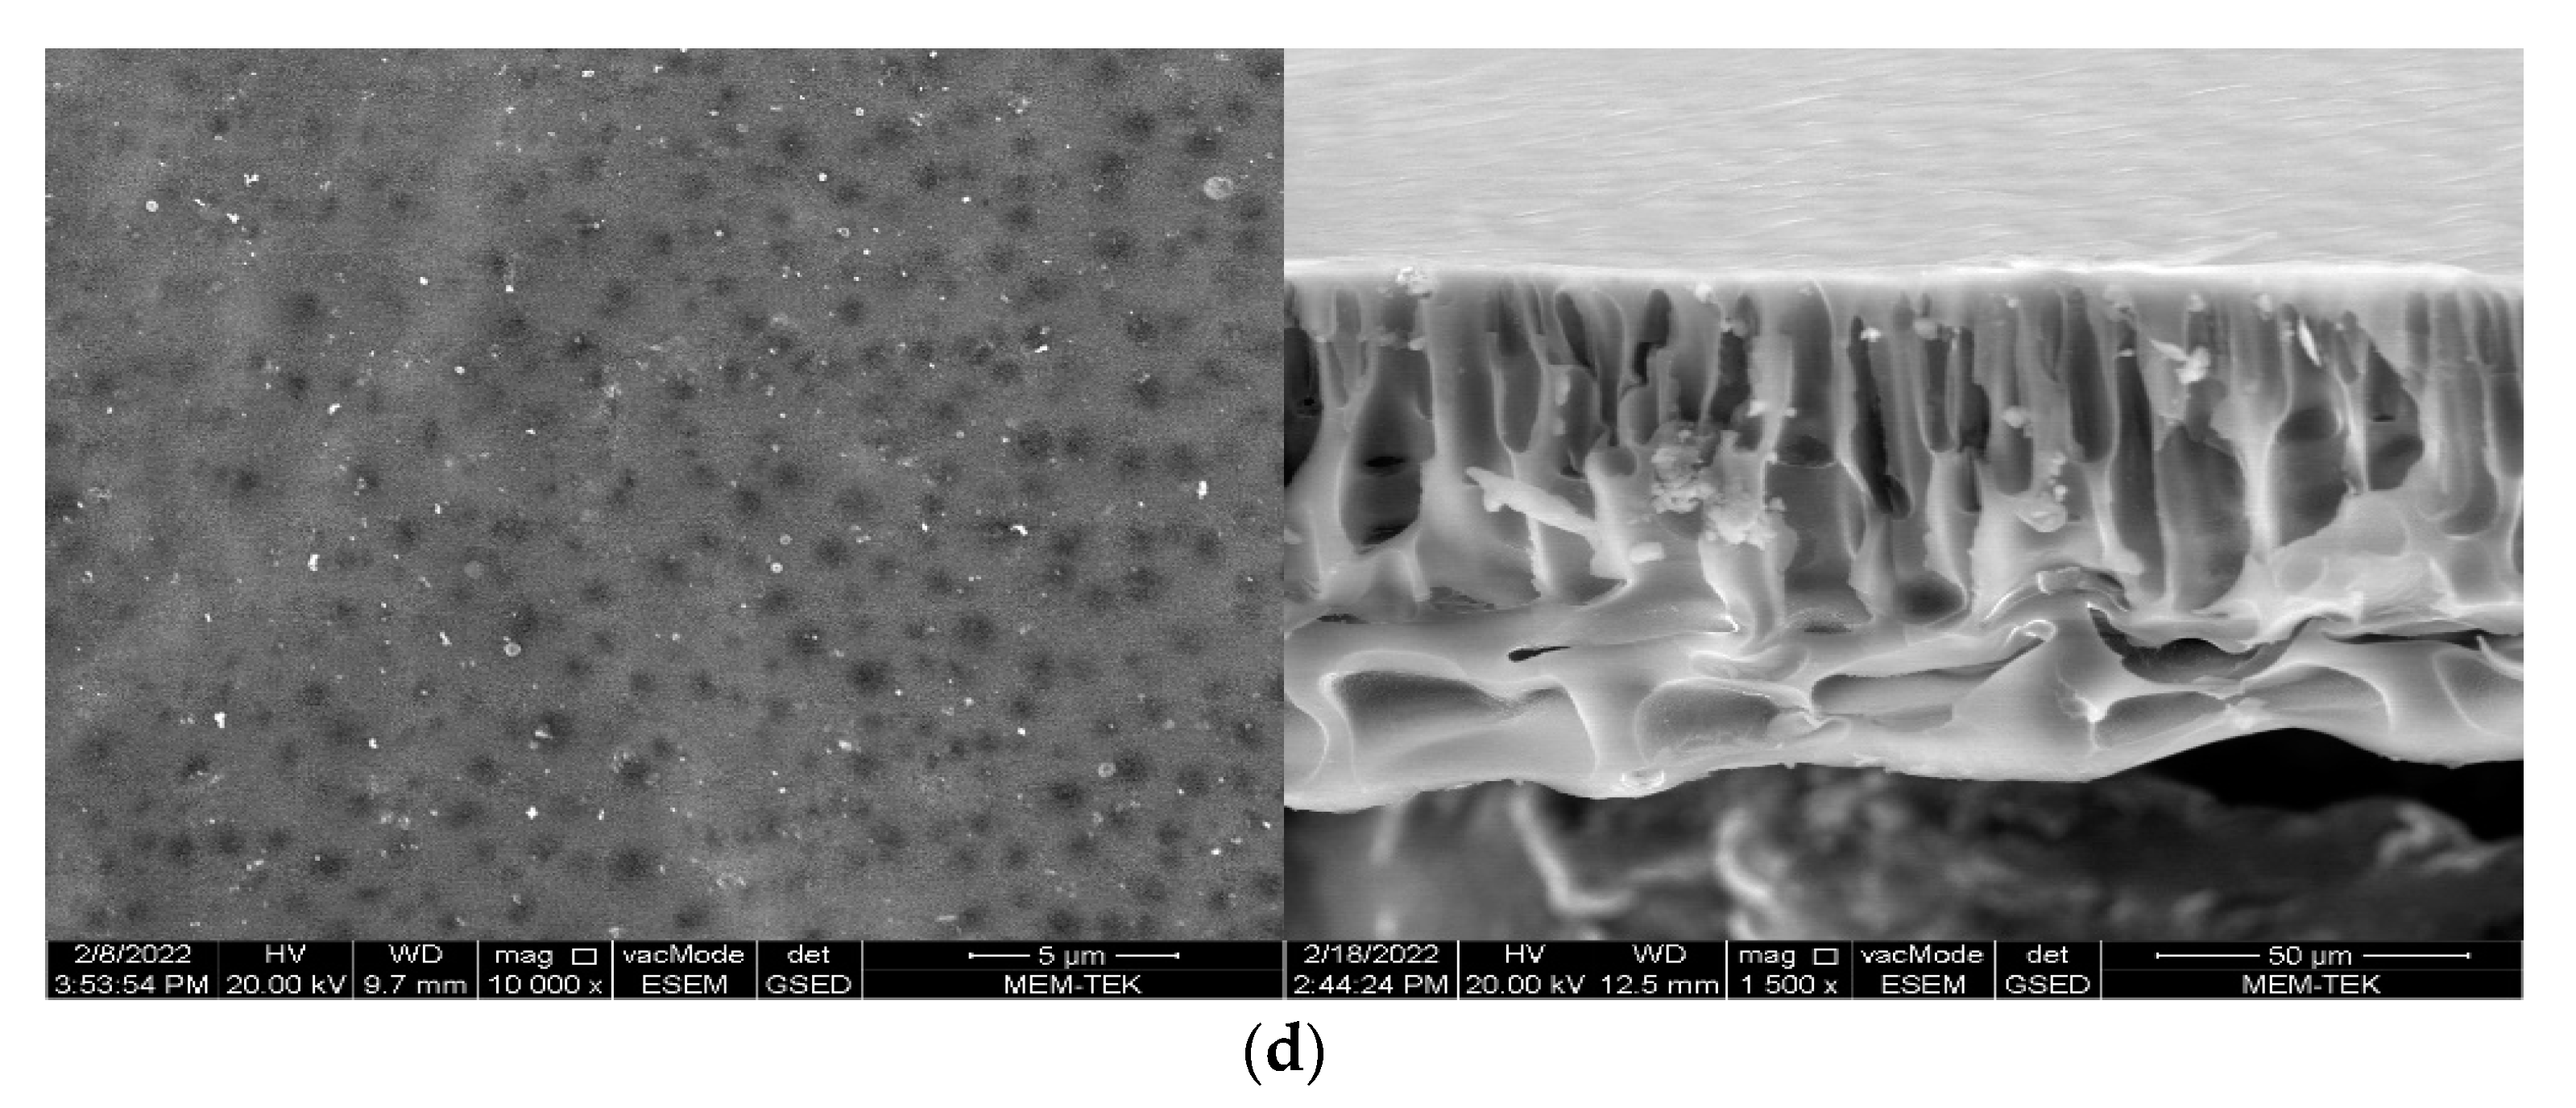
2.3.3. SEM
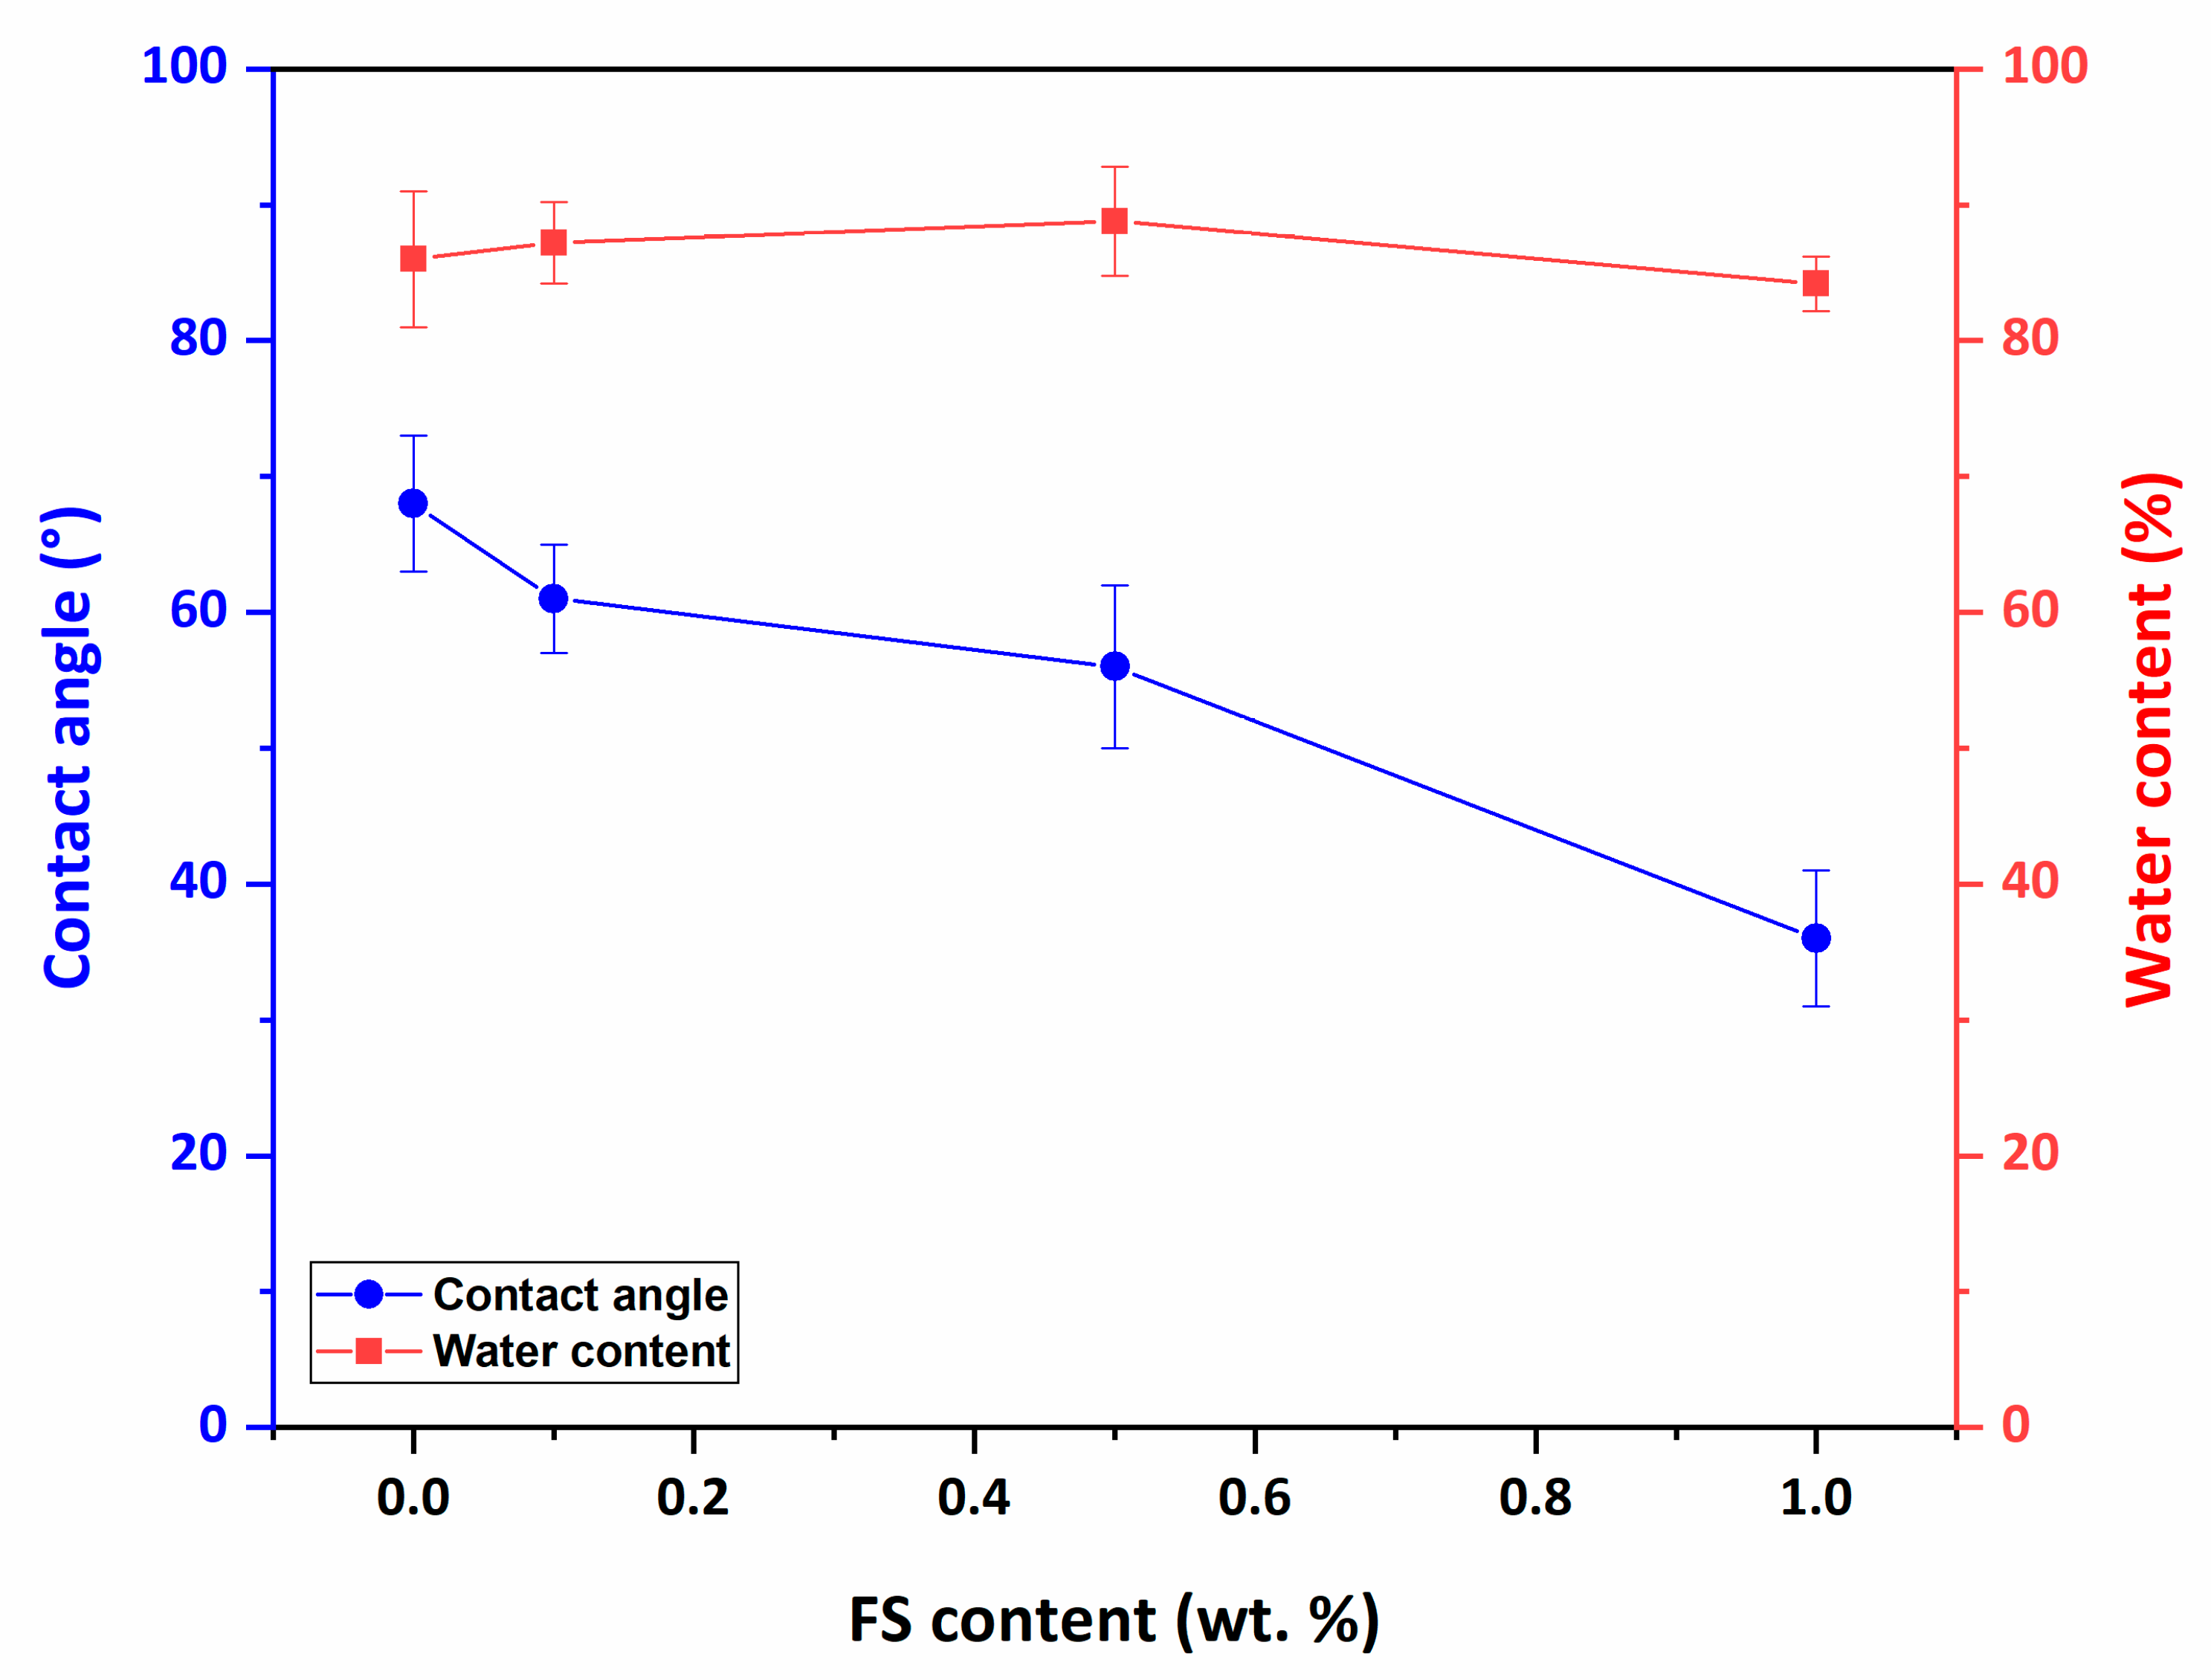
2.3.4. Contact Angle
2.3.5. Water Content
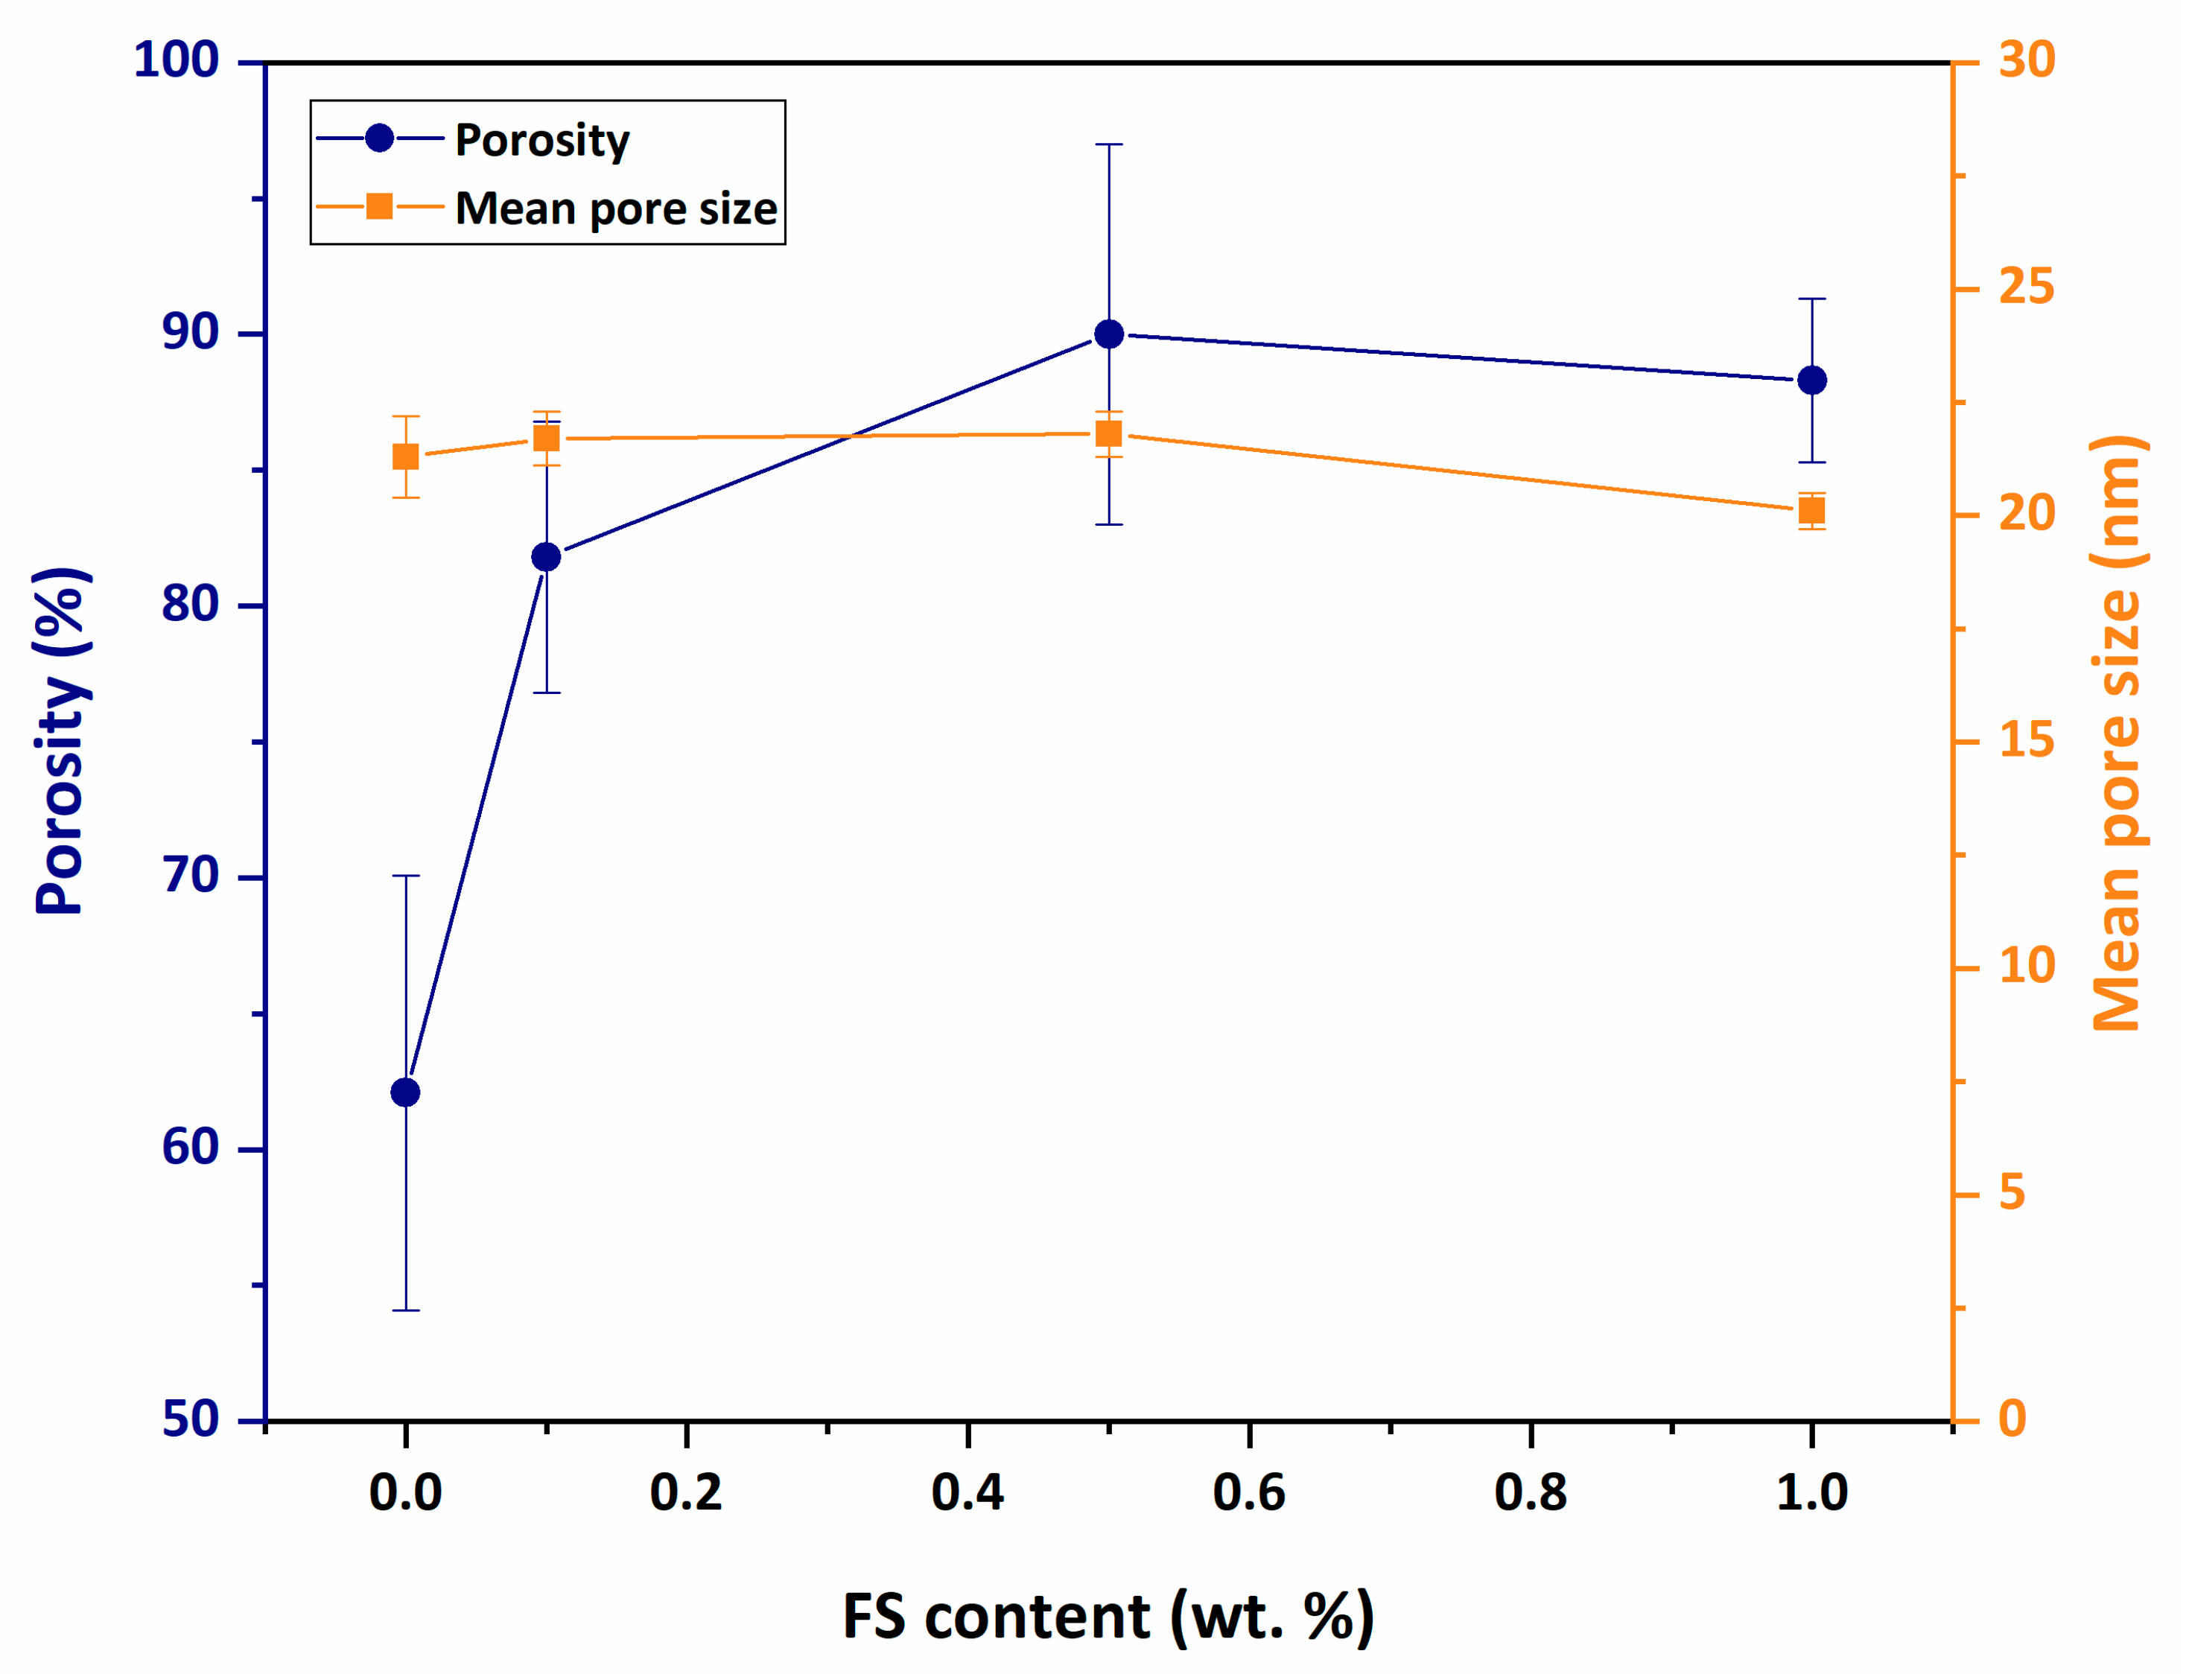
2.3.6. Porosity and Mean Pore Size
2.3.7. Pure Water Flux Performance
2.4. Membrane Mechanics
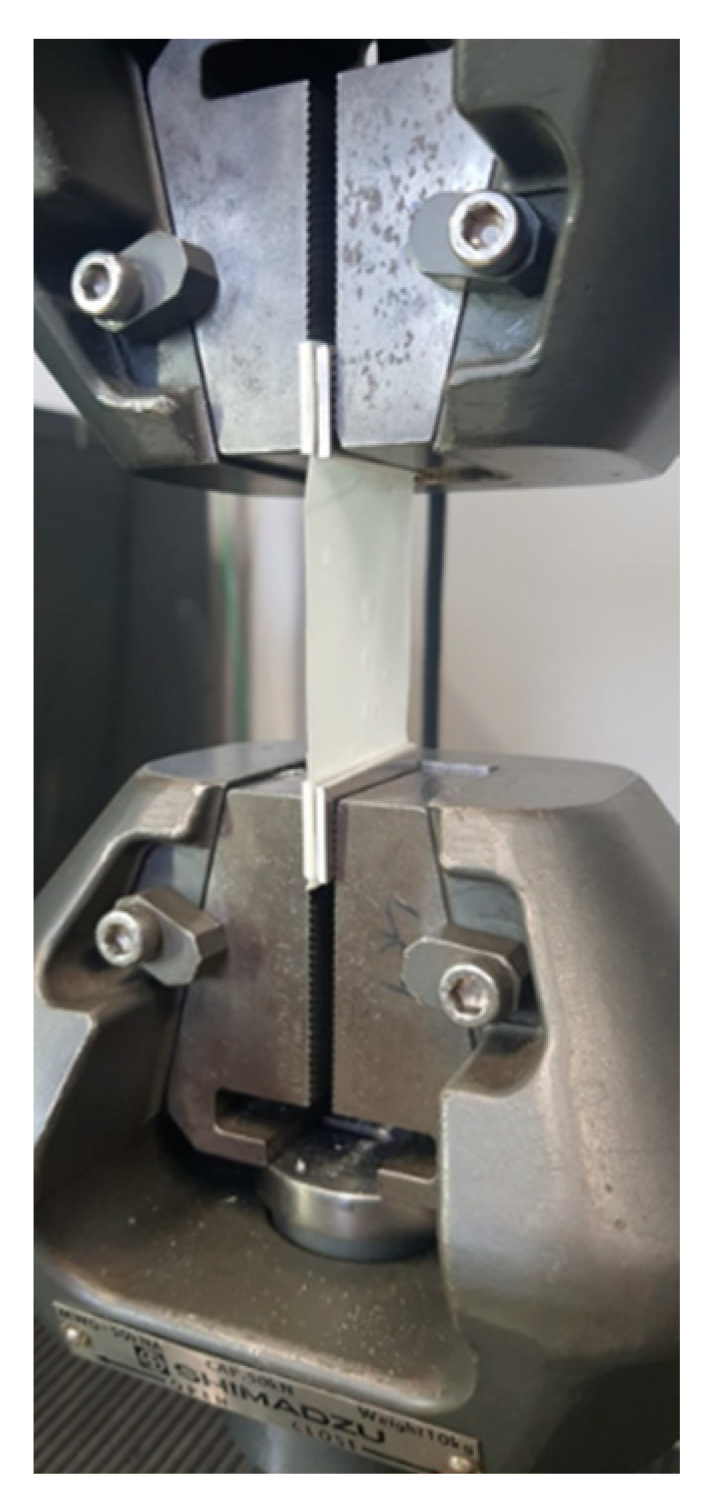
2.4.1. Experimental Characterisation of Membrane Mechanics
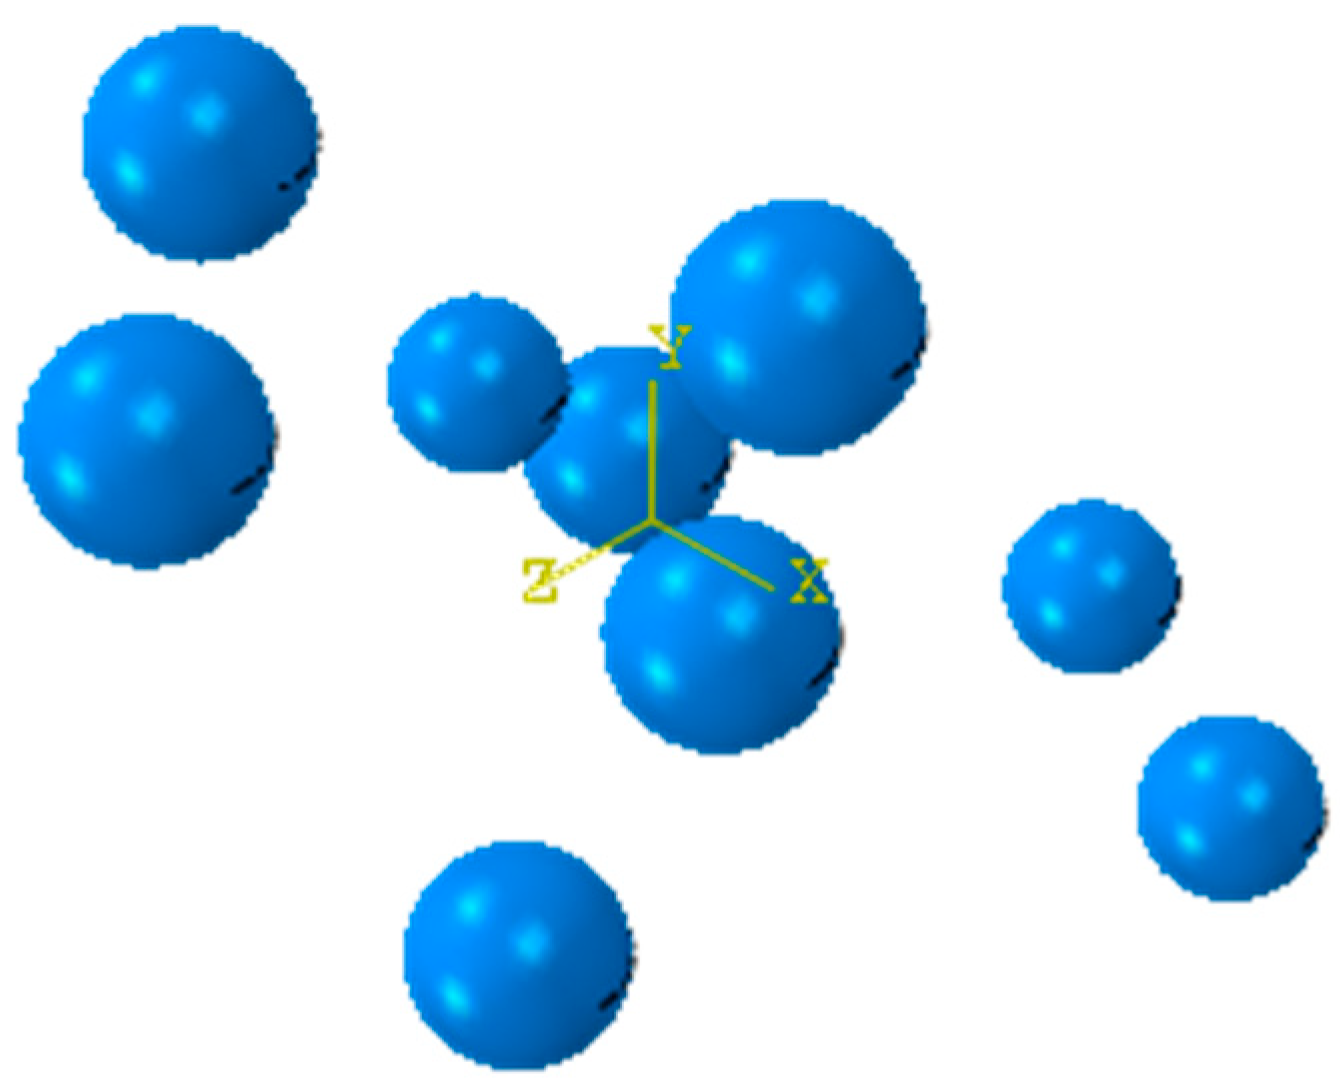
2.4.2. Numerical Modelling of Membrane Mechanics
3. Results
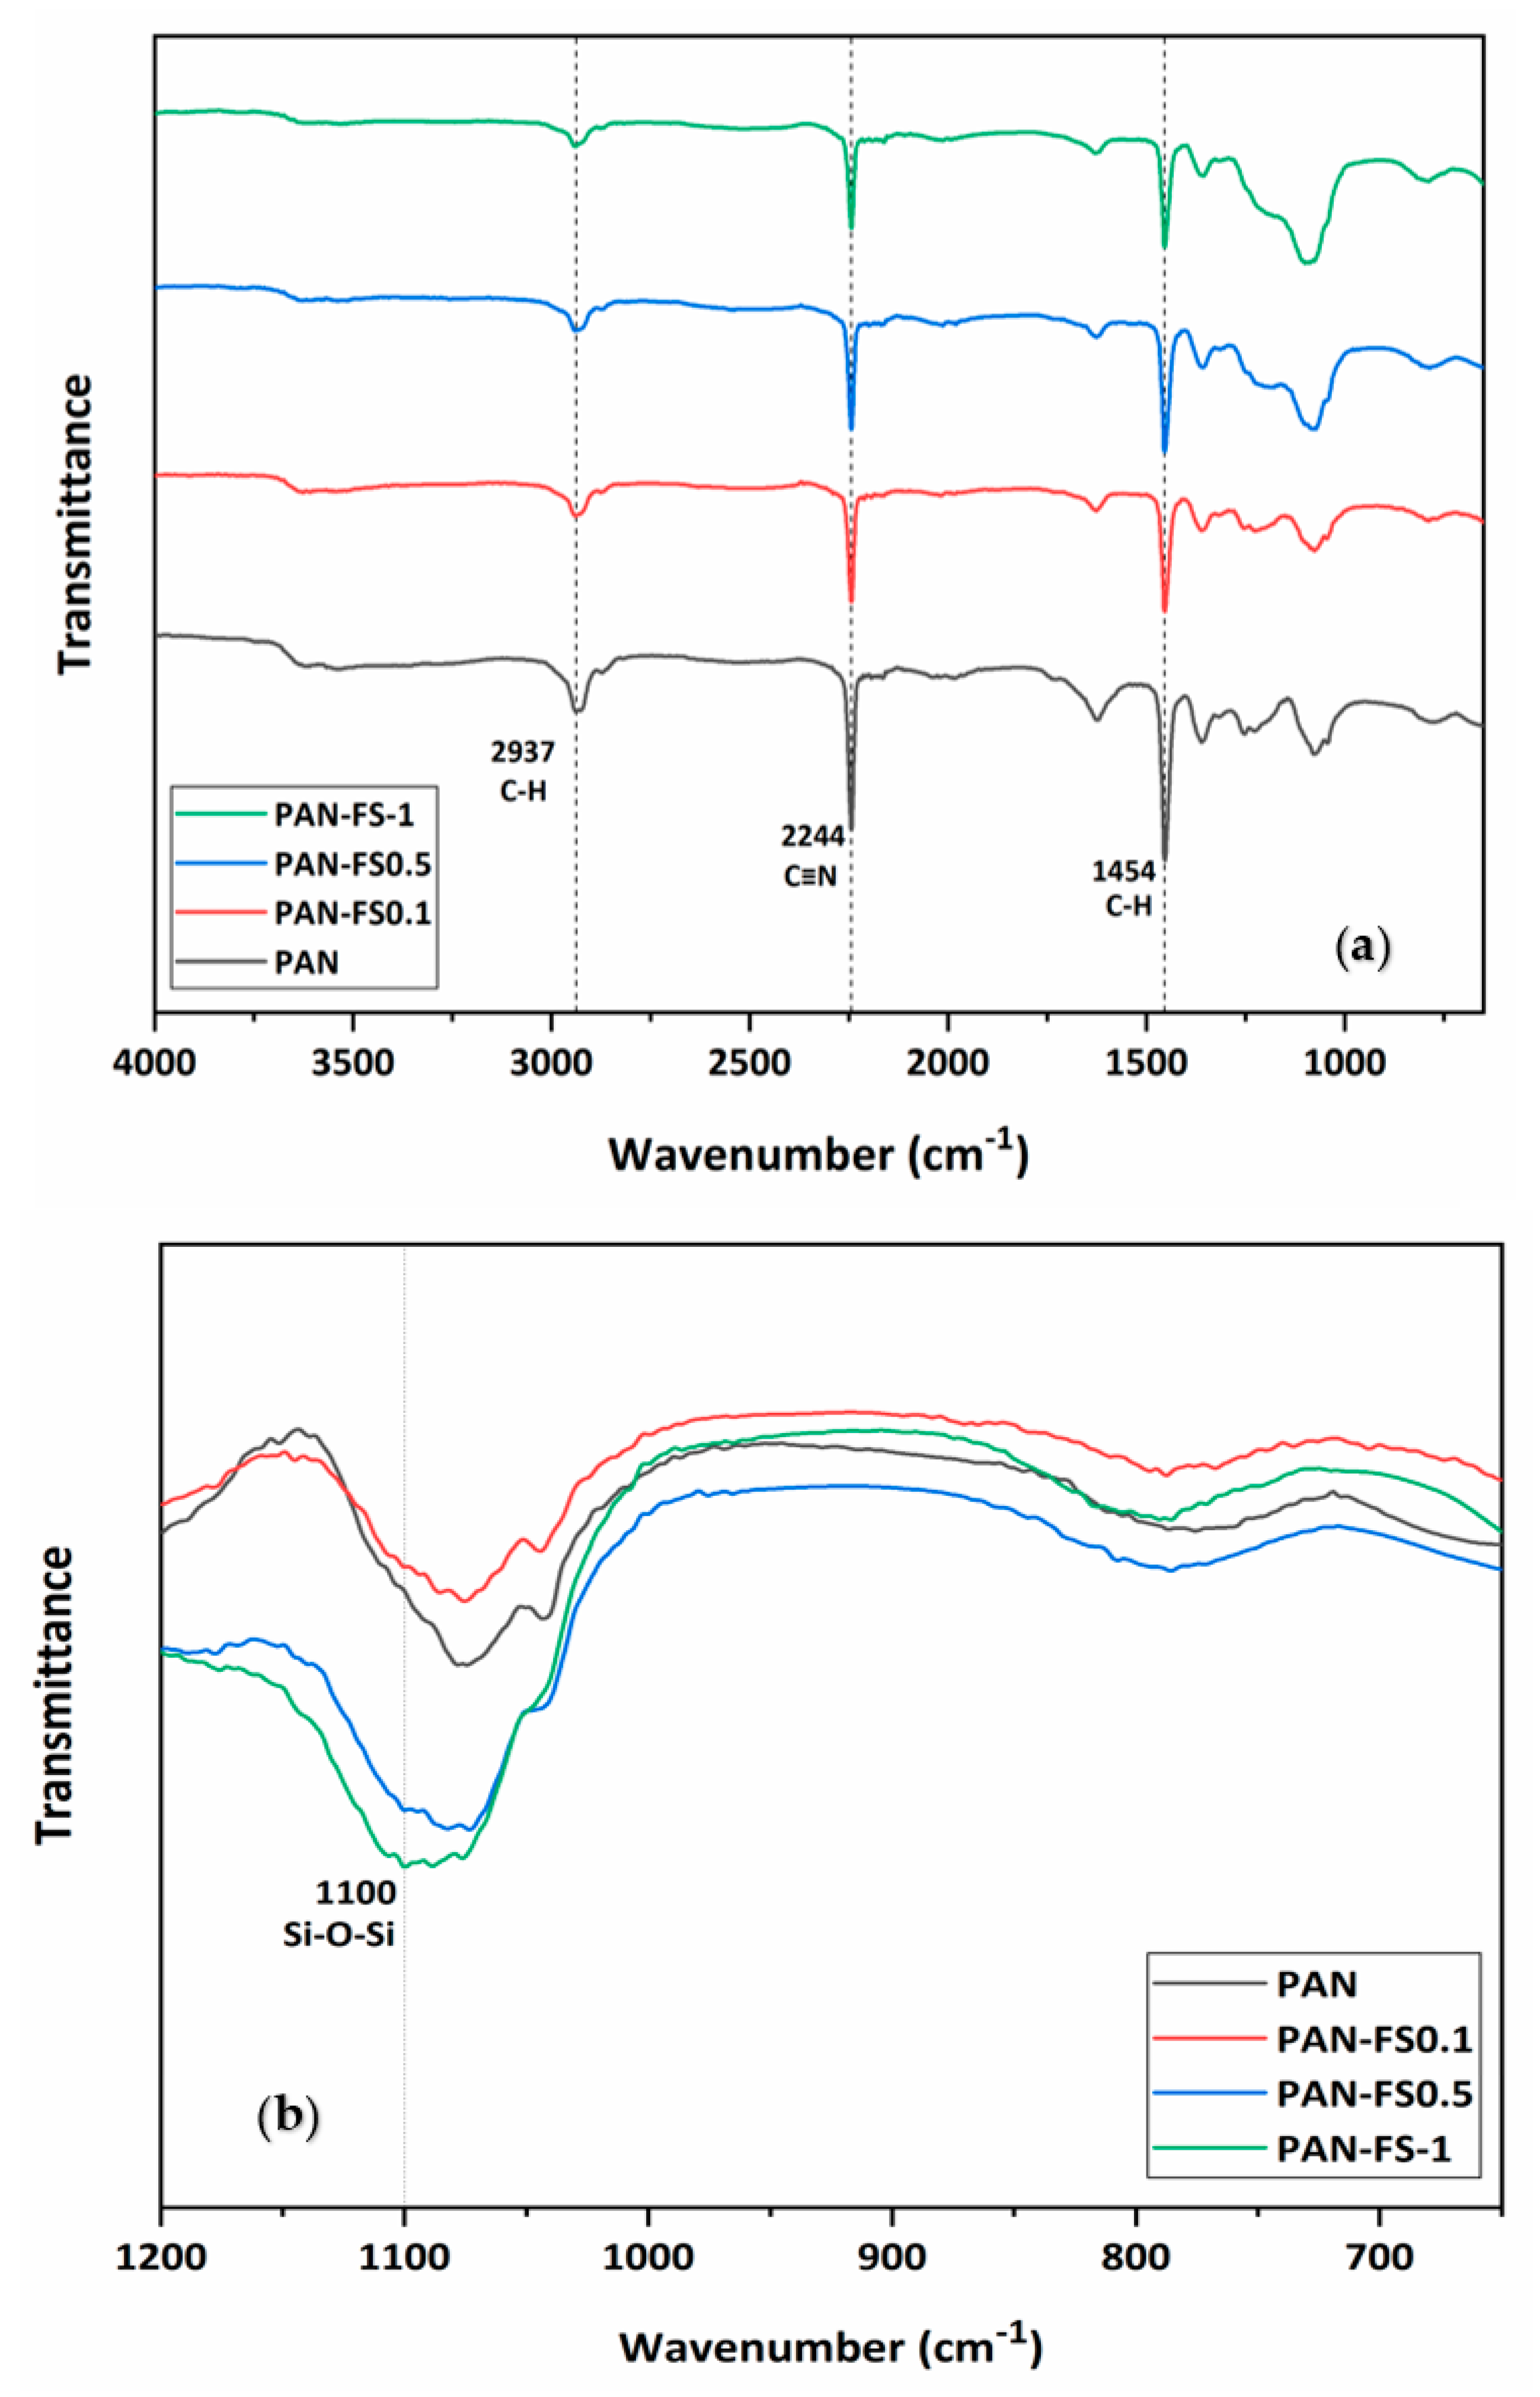
3.1. FTIR
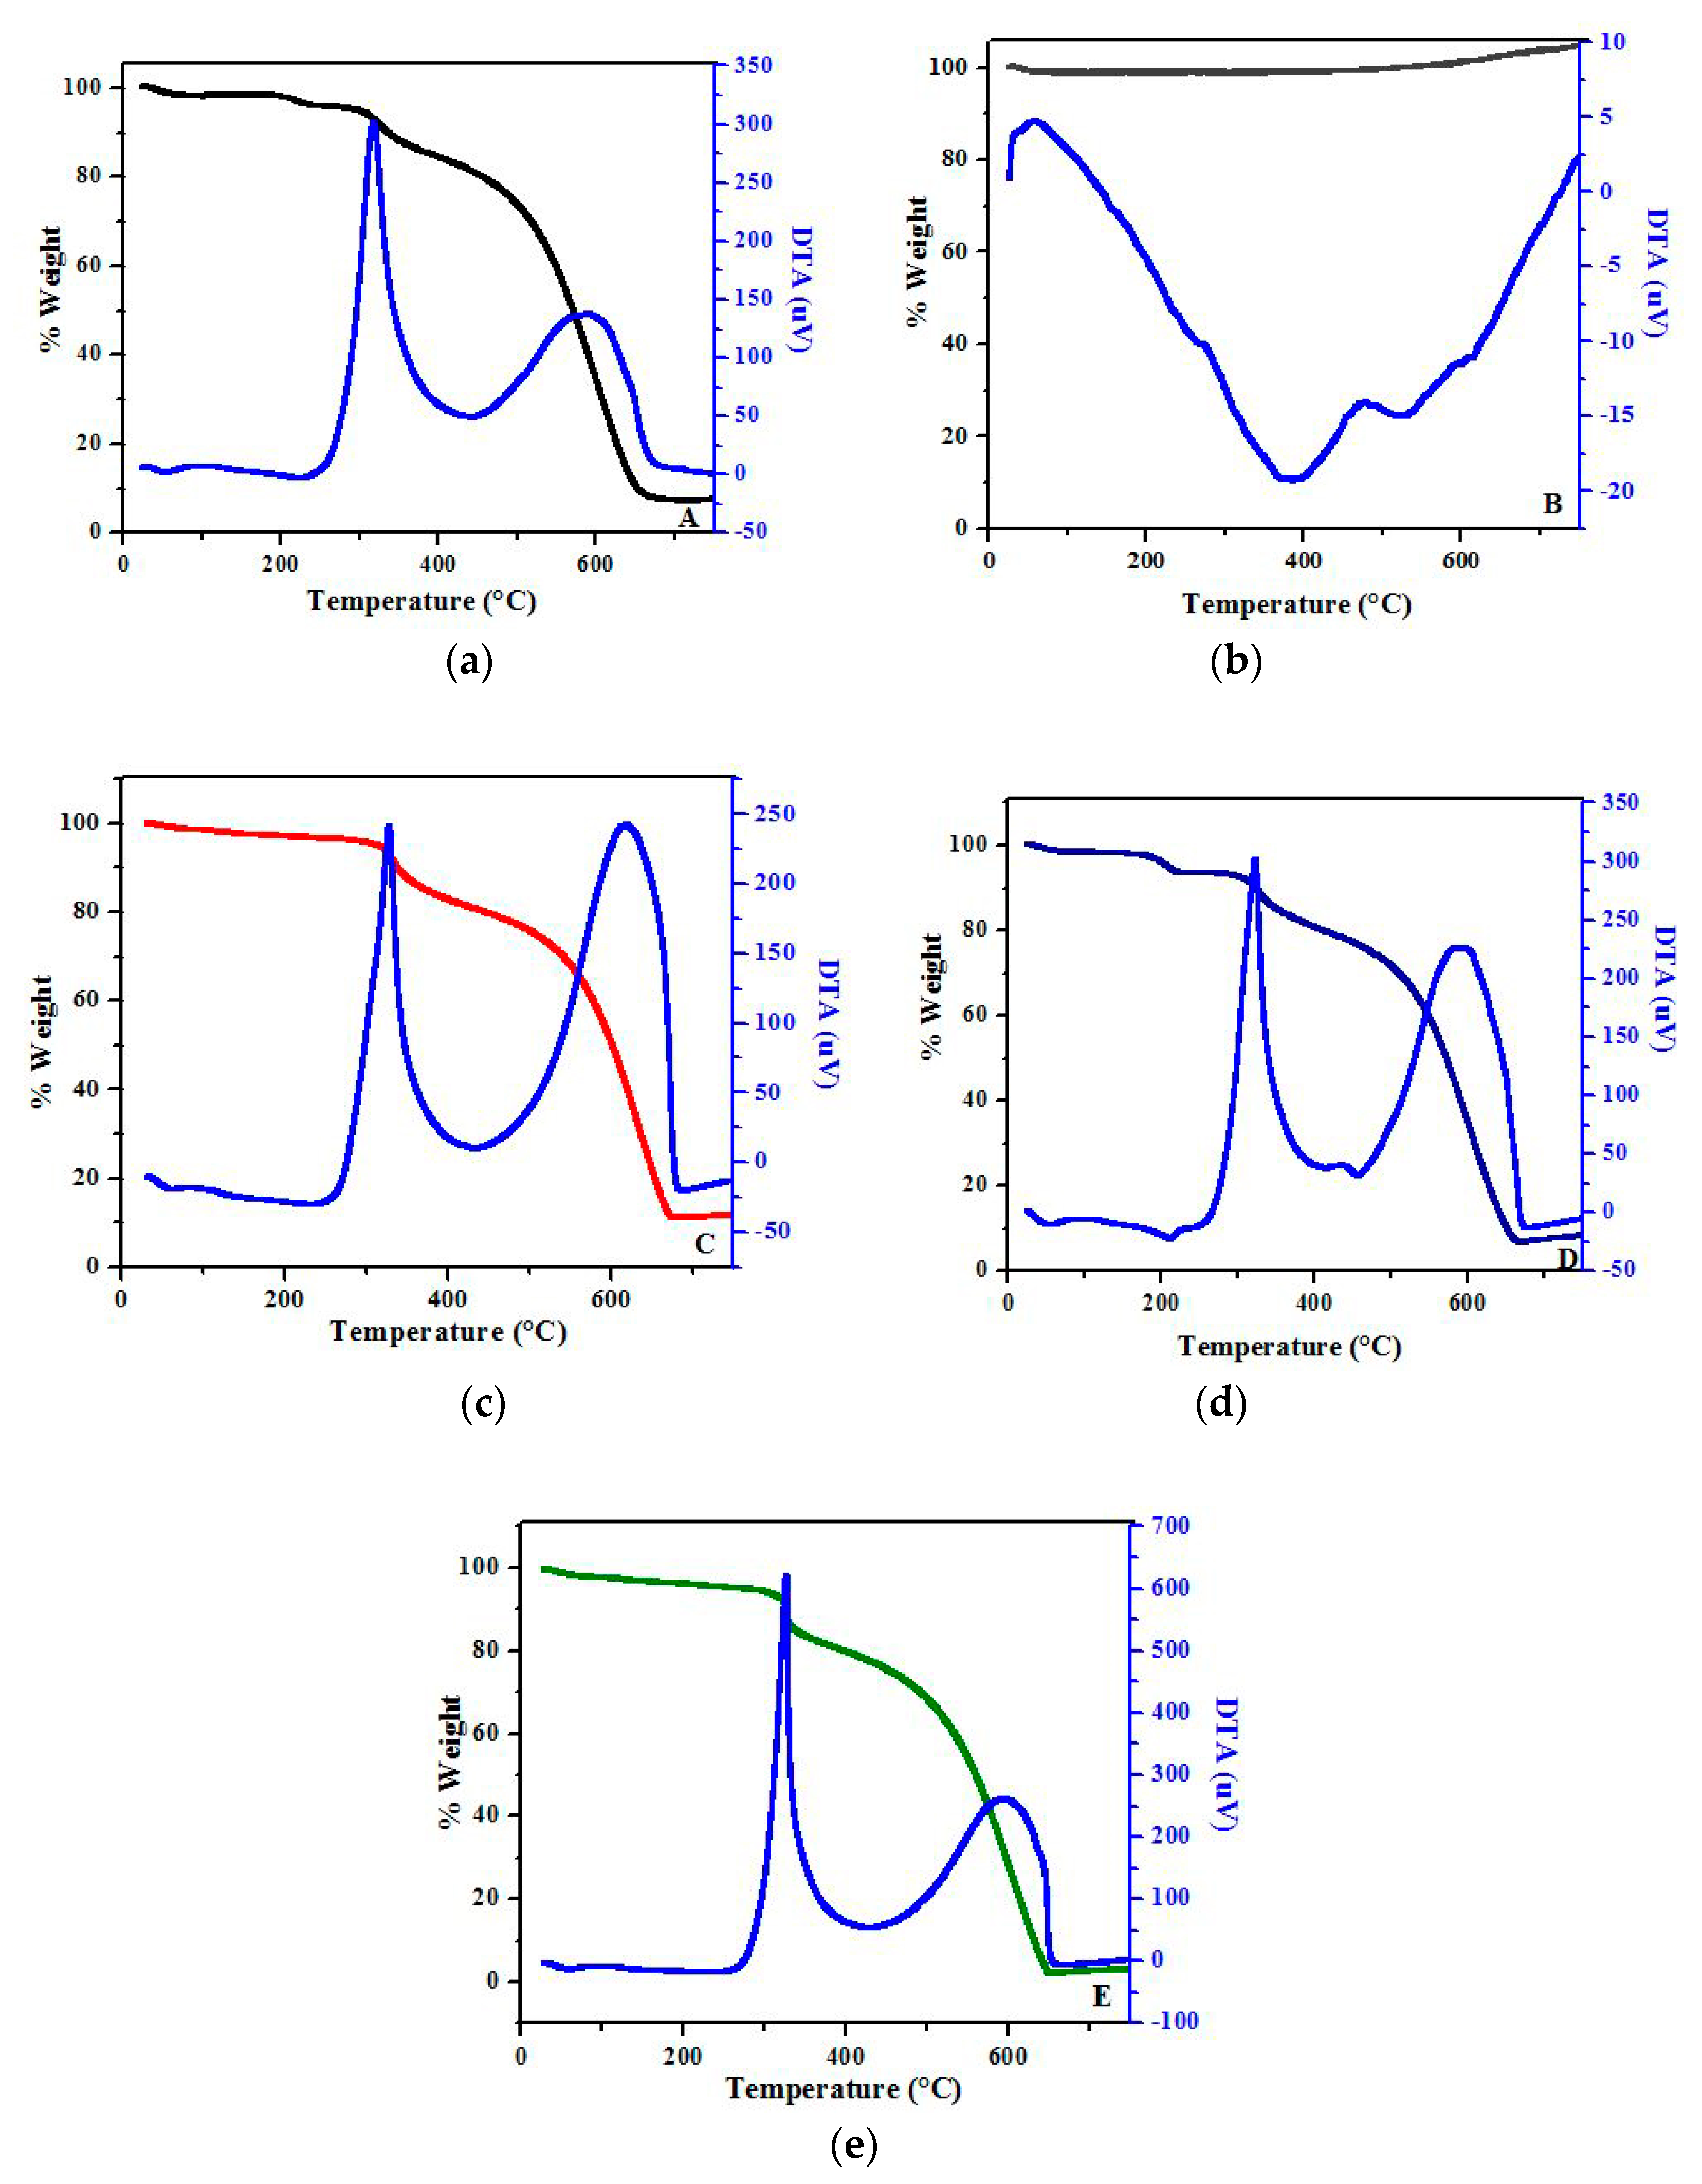
3.2. Thermal Characteristics
3.3. Membrane Morphology
3.4. Membrane Hydrophilicity
3.5. Porosity and Mean Pore Size
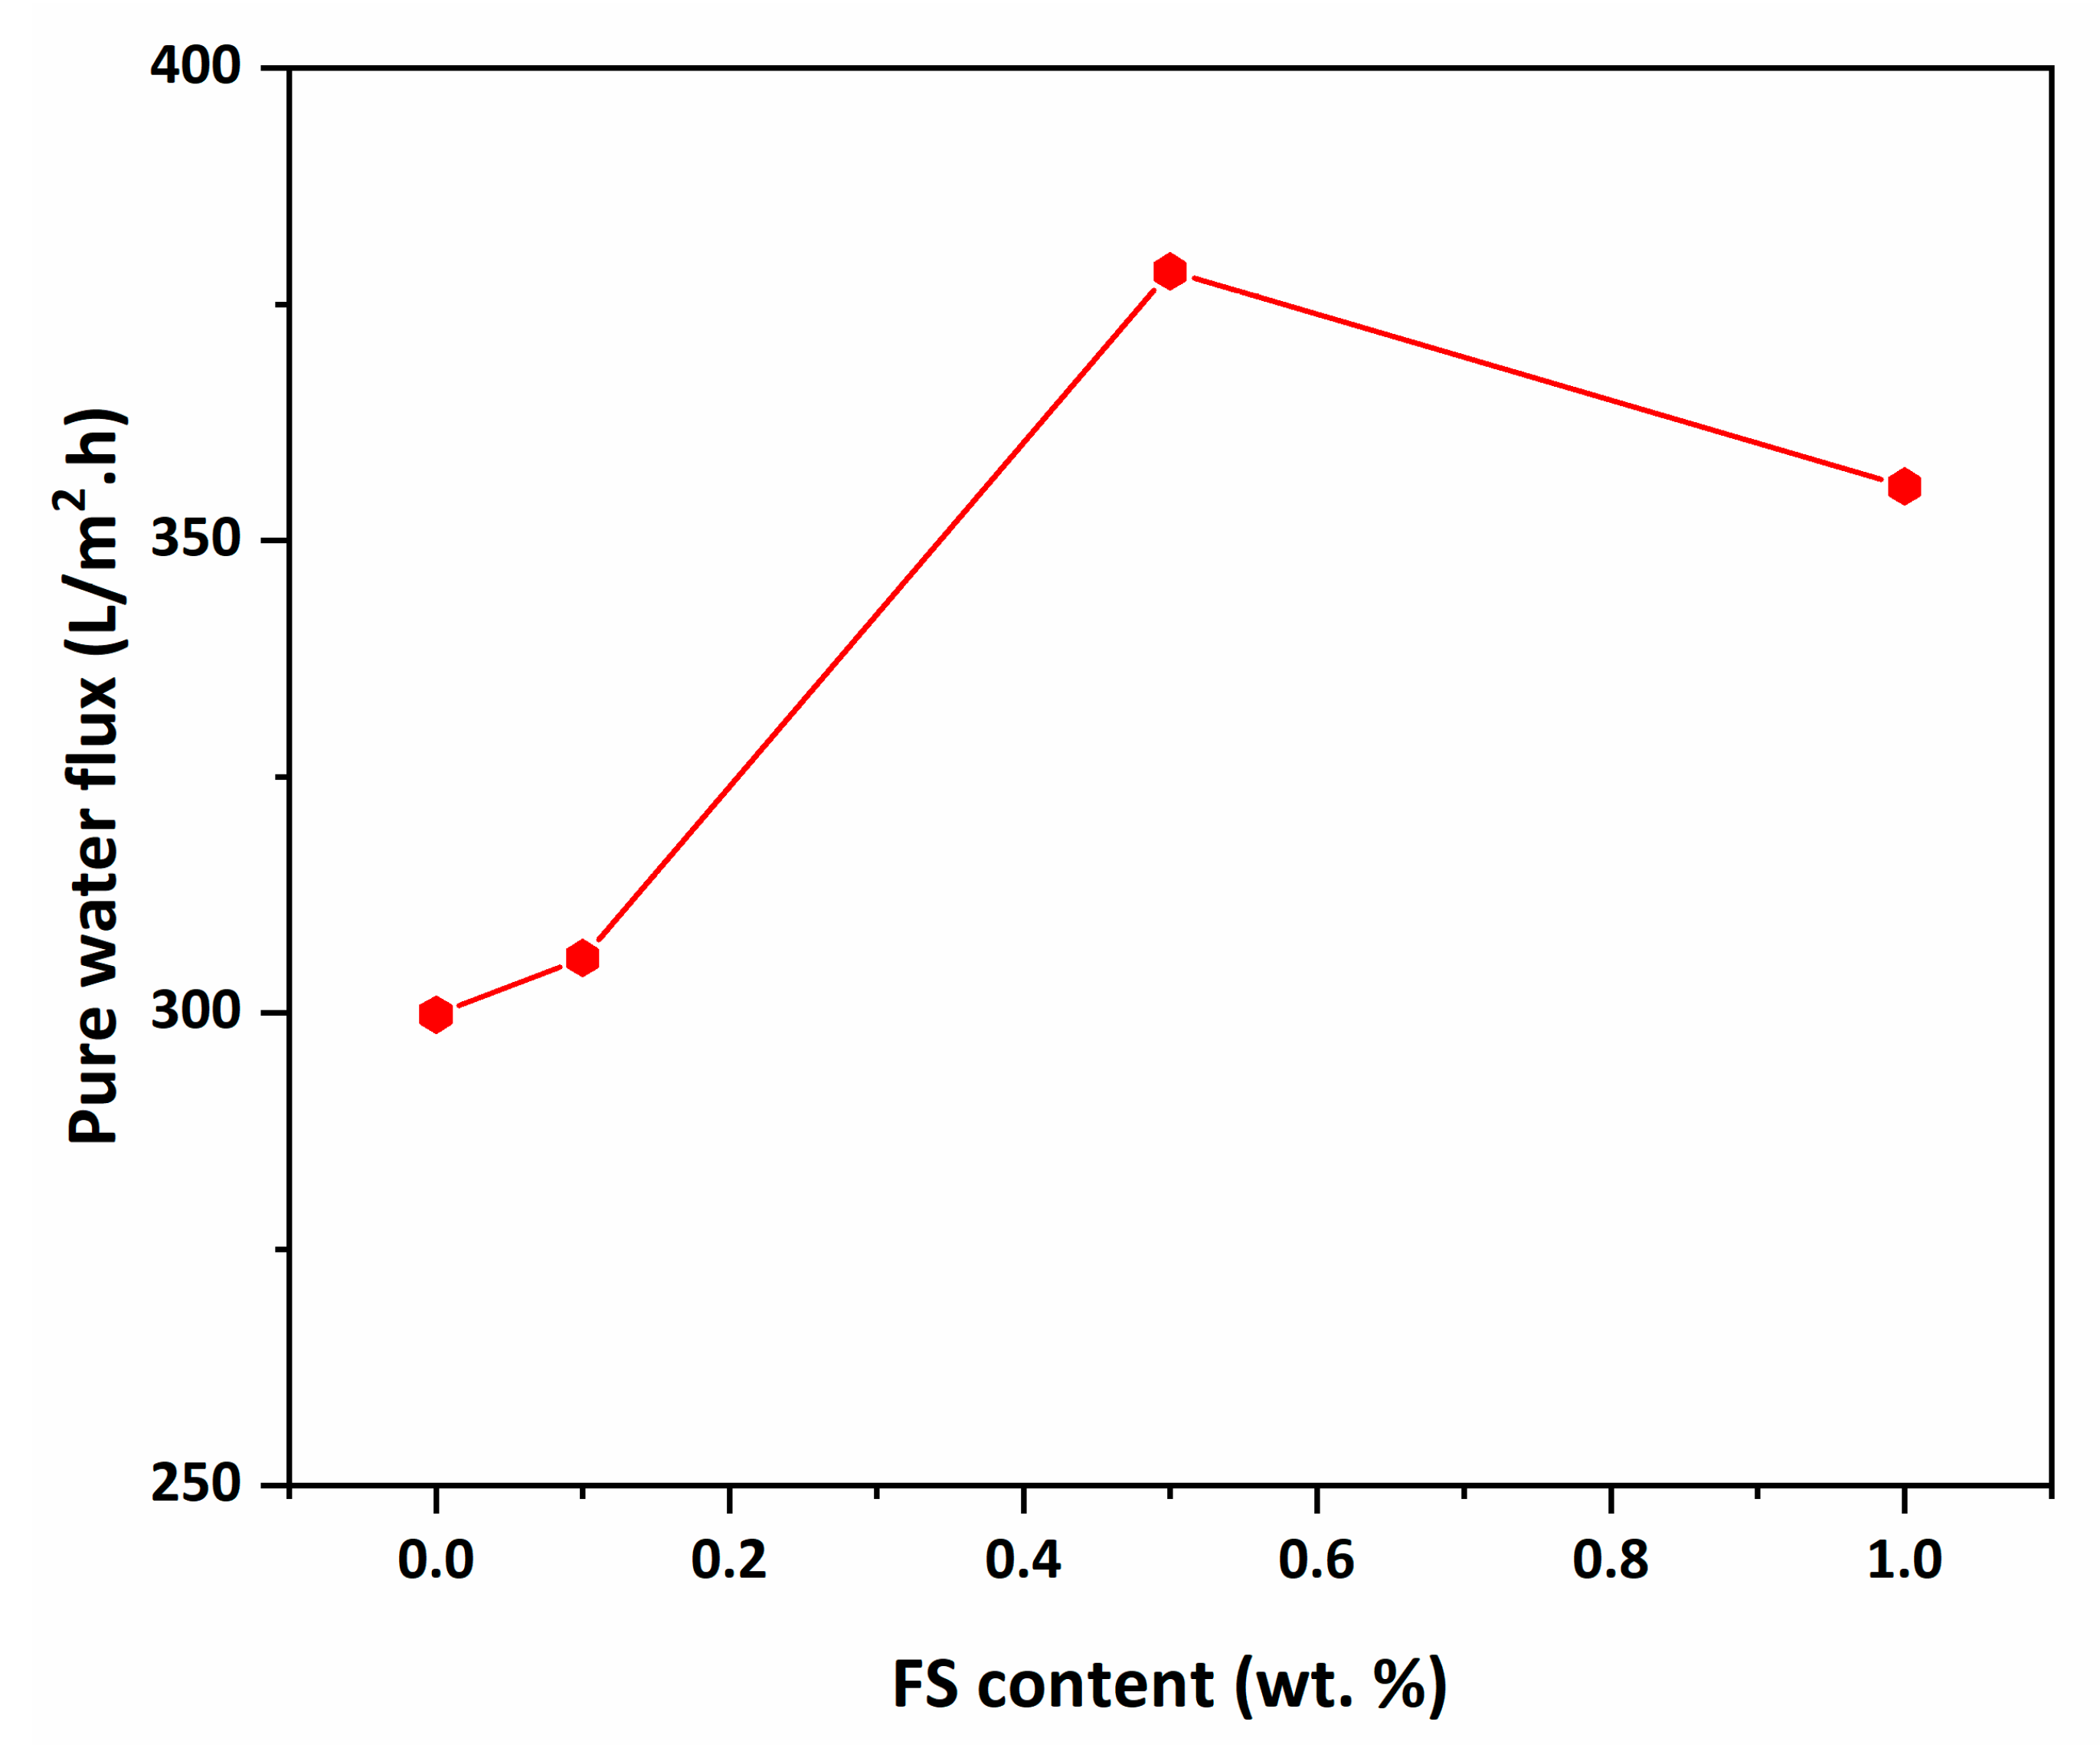
3.6. Pure Water Flux Performance
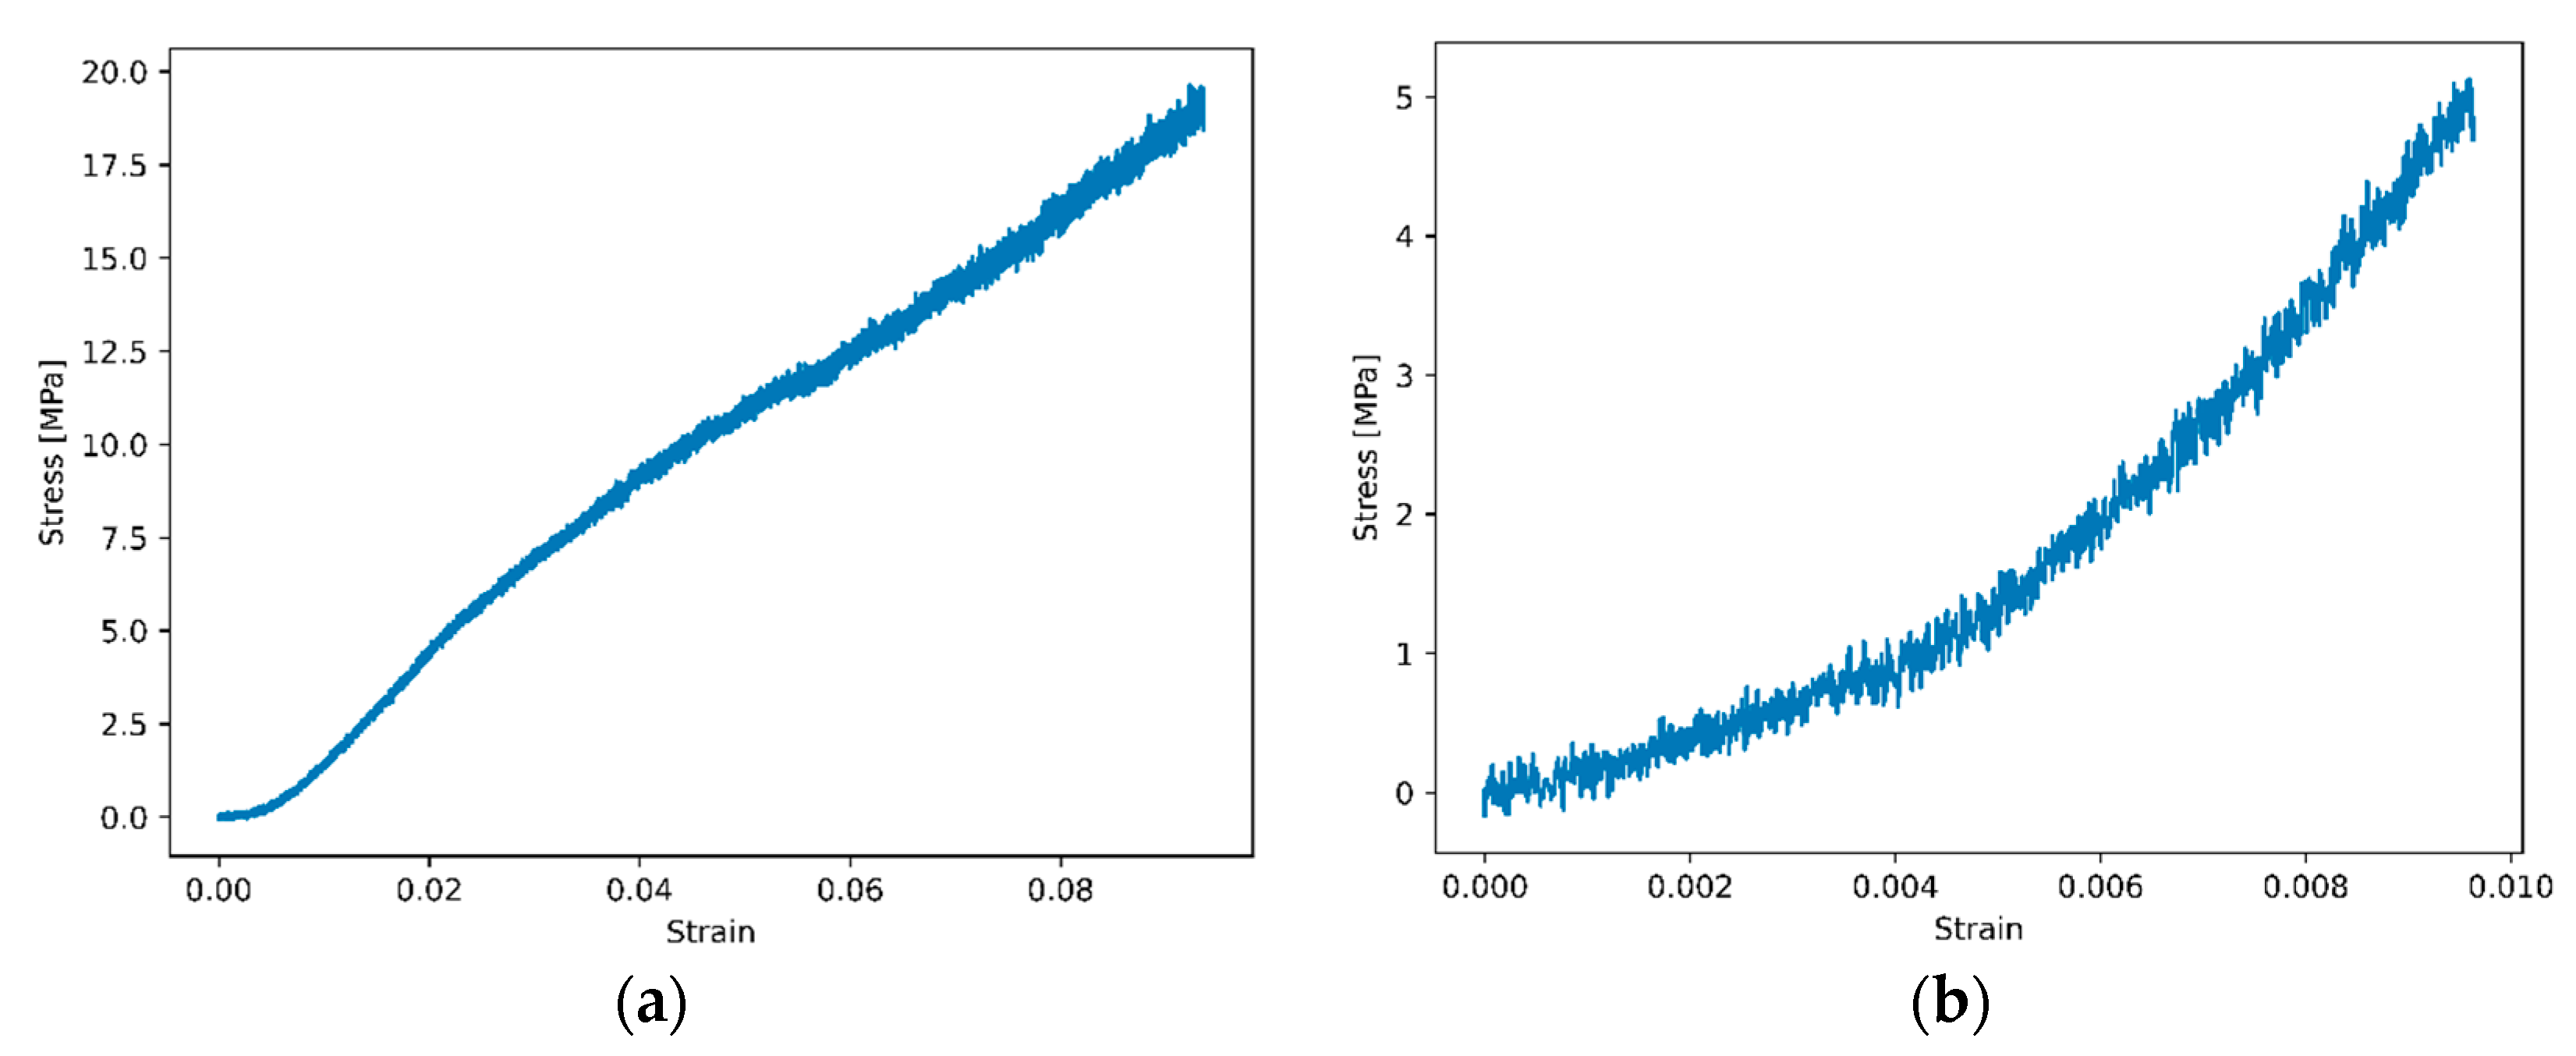
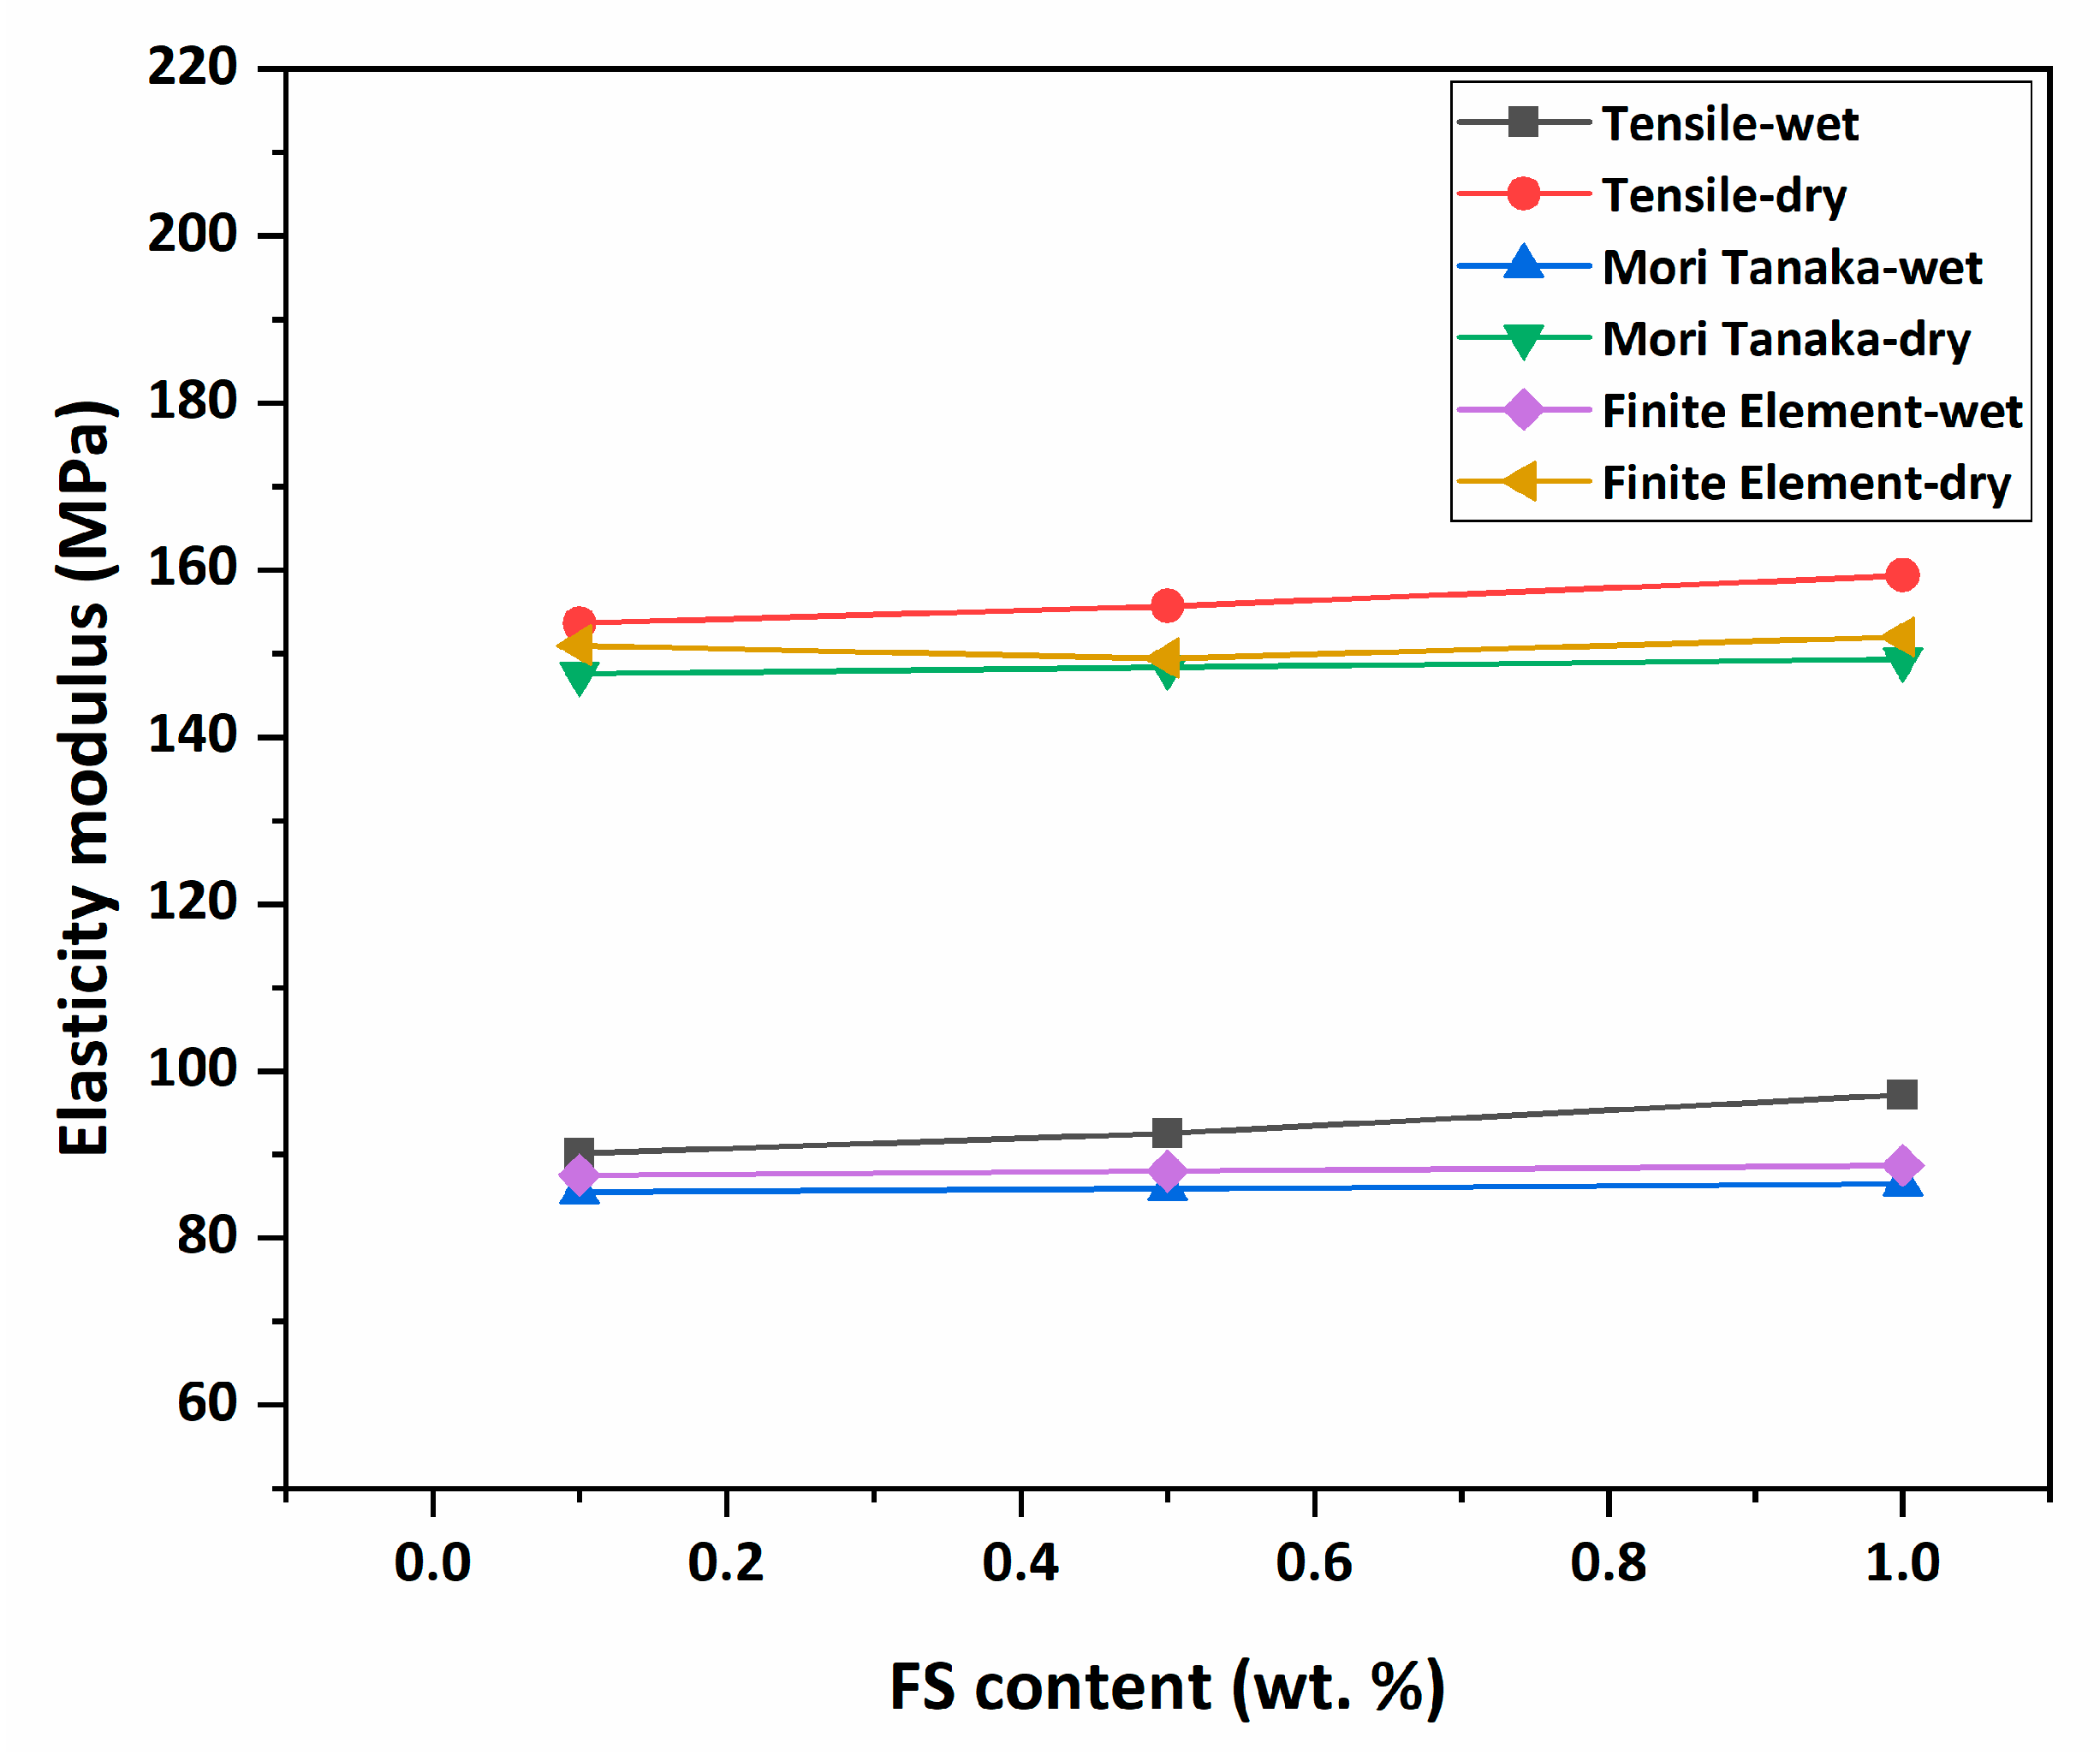
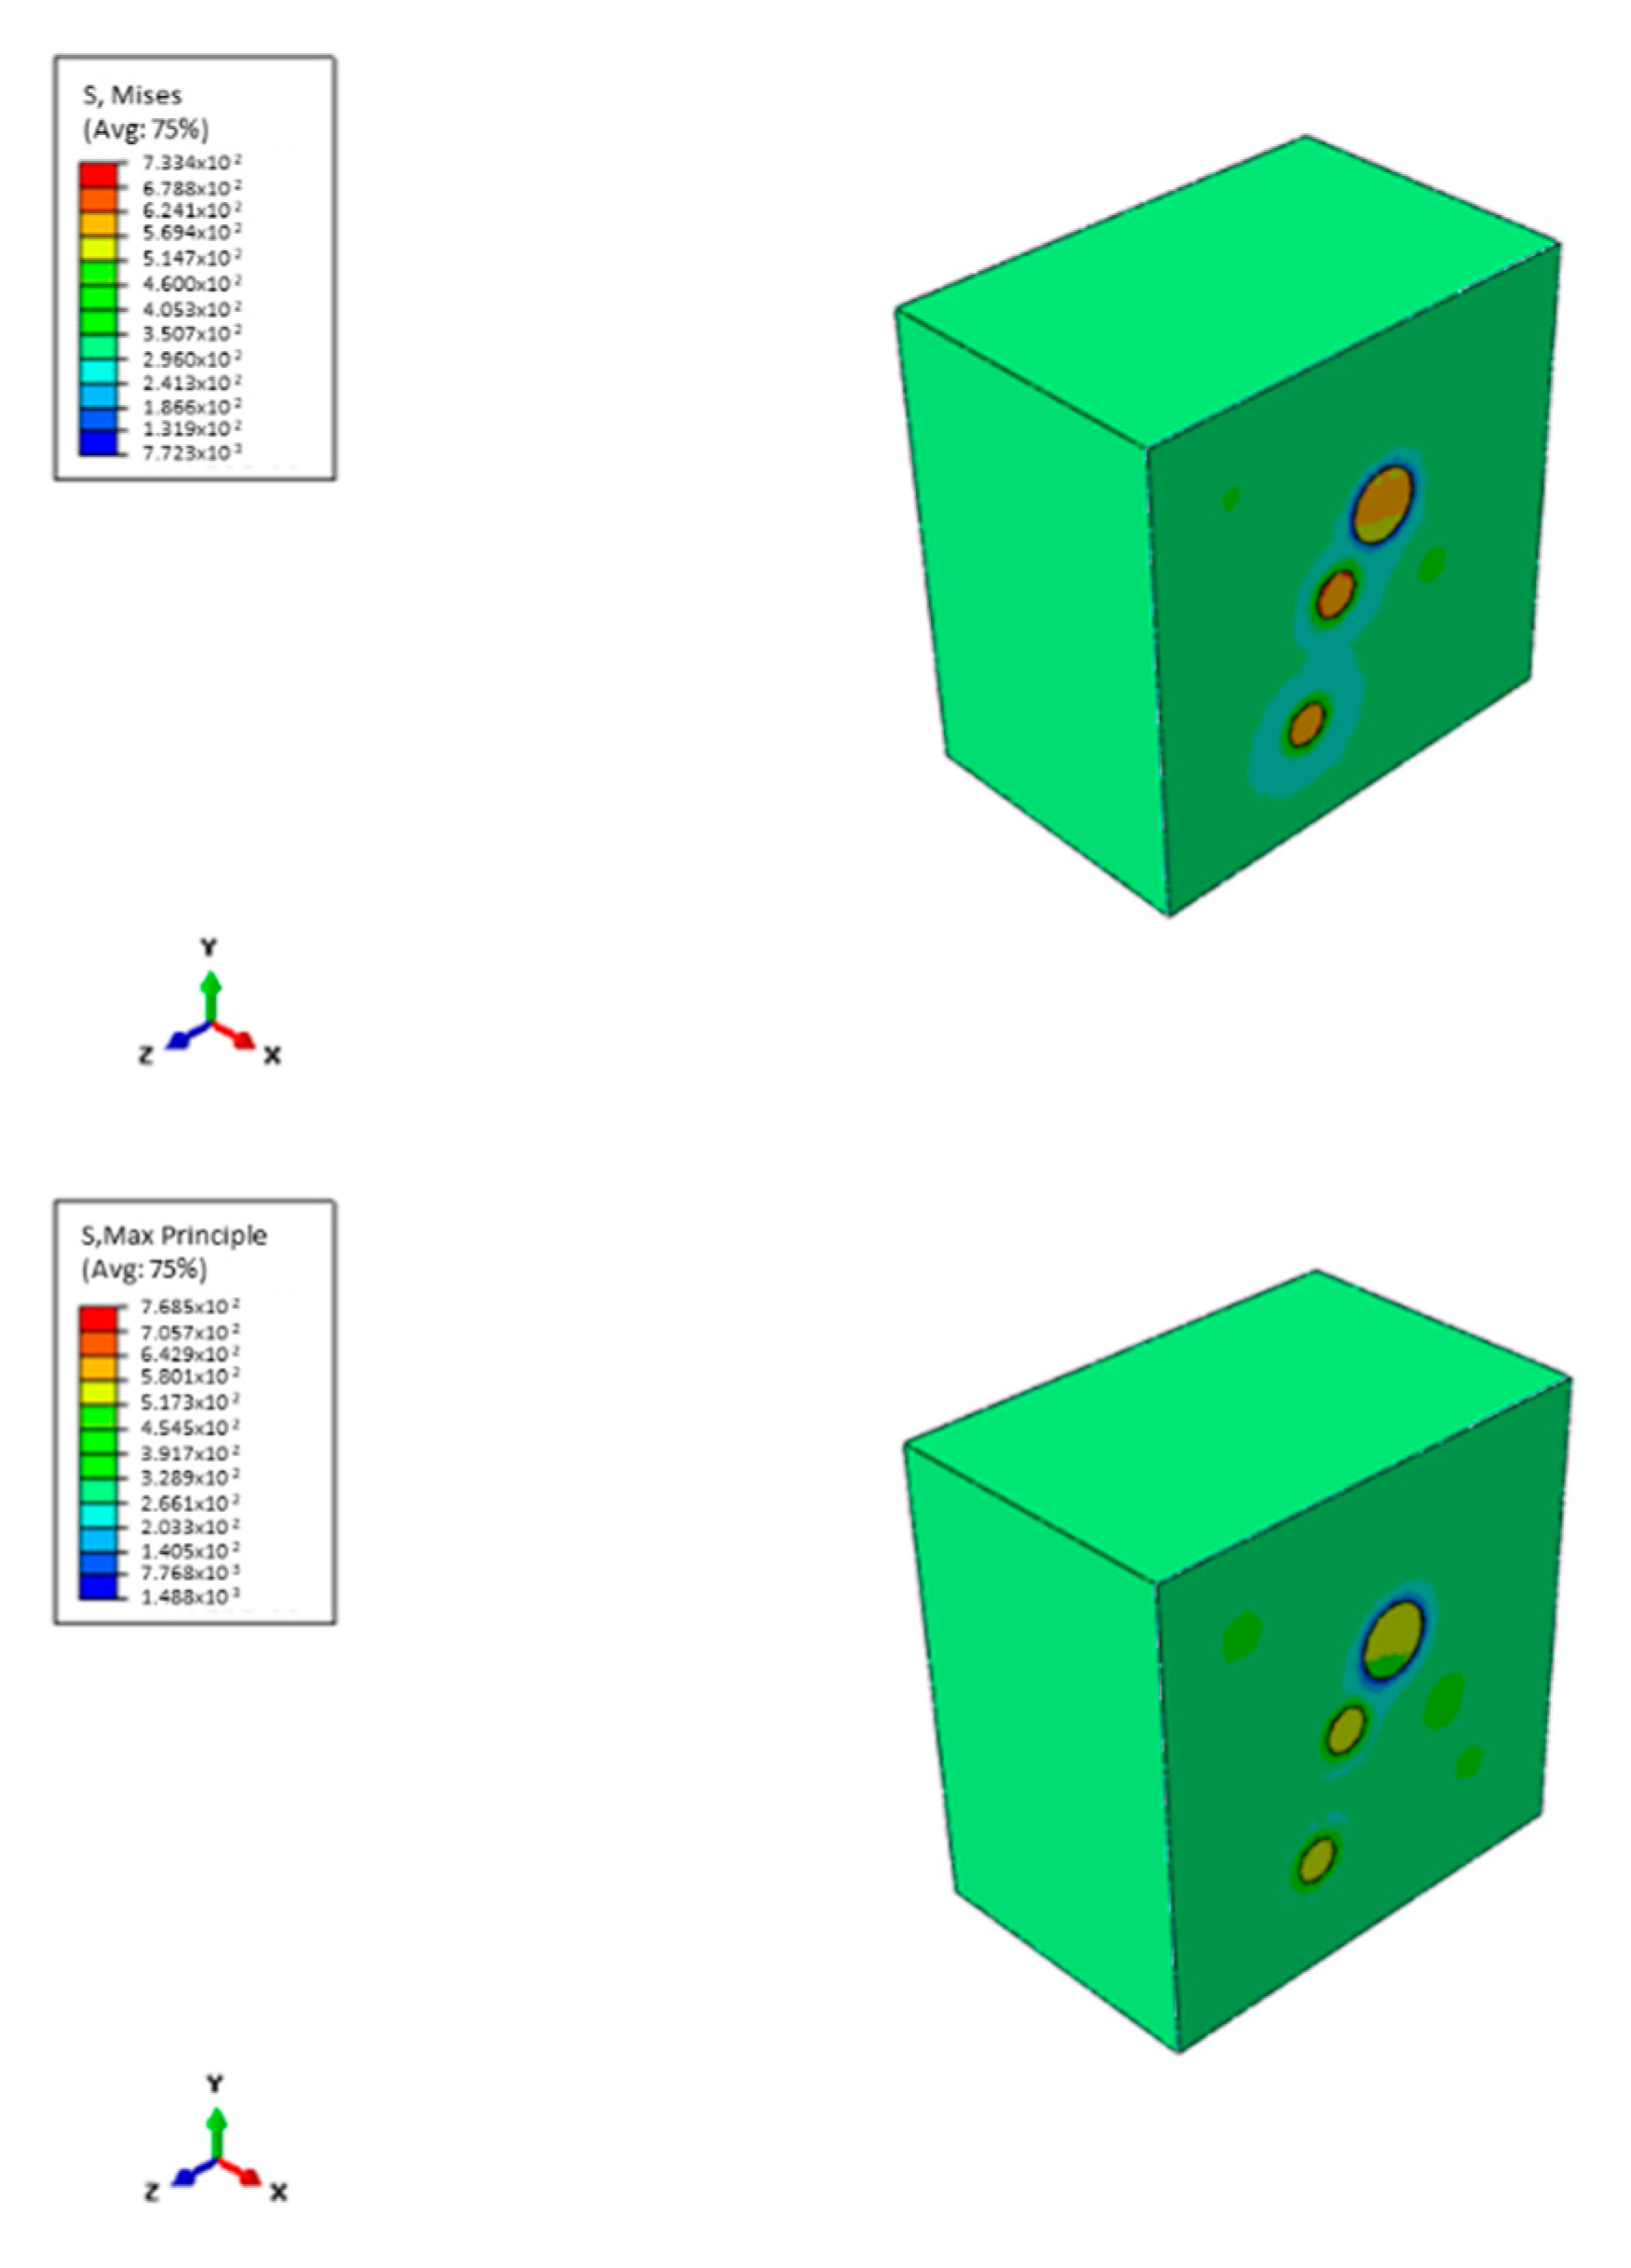
3.7. Membrane Mechanics
4. Conclusions
Author Contributions
Funding
Institutional Review Board Statement
Informed Consent Statement
Data Availability Statement
Conflicts of Interest
Abbreviations
References
- Lakhotia, S.R.; Mukhopadhyay, M.; Kumari, P. Iron oxide (FeO) nanoparticles embedded thin-film nanocomposite nanofiltration (NF) membrane for water treatment. Sep. Purif. Technol. 2019, 211, 98–107. [Google Scholar] [CrossRef]
- Nawi, N.S.M.; Lau, W.J.; Yusof, N.; Ismail, A.F. The Impacts of Iron Oxide Nanoparticles on Membrane Properties for Water and Wastewater Applications: A Review. Arab. J. Sci. Eng. 2021. [Google Scholar] [CrossRef]
- Sonawane, S.; Thakur, P.; Sonawane, S.H.; Bhanvase, B.A. Nanomaterials for Membrane Synthesis: Introduction, Mechanism, and Challenges for Wastewater Treatment; Elsevier Inc.: Amsterdam, The Netherlands, 2021; ISBN 9780128214961. [Google Scholar]
- Li, S.; Zhang, M.A.; Lewis, E.; Vogt, B.D. Dramatic Swelling of Copolymer Membrane Induced by Polyol-Based Antifoam Agent. ACS Appl. Polym. Mater. 2019, 1, 3048–3056. [Google Scholar] [CrossRef]
- Pakbaz, M.; Maghsoud, Z. Performance evaluation of polyvinylchloride / polyacrylonitrile ultrafiltration blend membrane. Iran. Polym. J. 2017, 26, 833–849. [Google Scholar] [CrossRef]
- Panda, S.R.; De, S. Preparation, characterization and antifouling properties of polyacrylonitrile/polyurethane blend membranes for water purification. RSC Adv. 2015, 5, 23599–23612. [Google Scholar] [CrossRef]
- Wu, Y.; Gao, R.; Gao, S.; Li, M. Poly(vinylidene fluoride)–polyacrylonitrile blend flat-sheet membranes reinforced with carbon nanotubes for wastewater treatment. J. Appl. Polym. Sci. 2018, 135, 1–10. [Google Scholar] [CrossRef]
- Nasrollahi, N.; Aber, S.; Vatanpour, V.; Mahmoodi, N.M. The effect of amine functionalization of CuO and ZnO nanoparticles used as additives on the morphology and the permeation properties of polyethersulfone ultrafiltration nanocomposite membranes. Compos. Part B Eng. 2018, 154, 388–409. [Google Scholar] [CrossRef]
- Qadir, D.; Mukhtar, H.; Keong, L.K. Mixed Matrix Membranes for Water Purification Applications. Sep. Purif. Rev. 2017, 46, 62–80. [Google Scholar] [CrossRef]
- Bedar, A.K.; Lenka, R.; Goswami, N.; Kumar, V.; K. Debnath, A.; Sen, D.; Kumar, S.; Ghodke, S.; K. Tewari, P.; C. Bindal, R.; et al. Polysulfone–Ceria Mixed-Matrix Membrane with Enhanced Radiation Resistance Behavior. ACS Appl. Polym. Mater. 2019, 1, 1854–1865. [Google Scholar] [CrossRef]
- Salahshoori, I.; Seyfaee, A.; Babapoor, A. Recent advances in synthesis and applications of mixed matrix membranes. Synth. Sinter. 2021, 1, 1–27. [Google Scholar] [CrossRef]
- Liu, Y.; Zhang, Z.; Li, W.; Liu, R.; Qiu, J.; Wang, S. Water purification performance and energy consumption of gradient nanocomposite membranes. Compos. Part B Eng. 2020, 202, 108426. [Google Scholar] [CrossRef]
- Chong, C.Y.; Lau, W.J.; Yusof, N.; Lai, G.S.; Ismail, A.F. Roles of nanomaterial structure and surface coating on thin film nanocomposite membranes for enhanced desalination. Compos. Part B Eng. 2019, 160, 471–479. [Google Scholar] [CrossRef]
- Wang, F.; Wu, Y.; Huang, Y. Novel application of graphene oxide to improve hydrophilicity and mechanical strength of aramid nanofiber hybrid membrane. Compos. Part A Appl. Sci. Manuf. 2018, 110, 126–132. [Google Scholar] [CrossRef]
- Eum, K.; Woo Kim, D.; Choi, Y.; Duan, X.A.; Hillmyer, M.; Tsapatsis, M. Assembly of Graphene Oxide Nanosheets on Diamine-Treated PVDF Hollow Fiber as Nanofiltration Membranes. ACS Appl. Polym. Mater. 2020, 2, 3859–3866. [Google Scholar] [CrossRef]
- Ngoma, M.M.; Mathaba, M.; Moothi, K. Effect of carbon nanotubes loading and pressure on the performance of a polyethersulfone (PES)/carbon nanotubes (CNT) membrane. Sci. Rep. 2021, 11, 1–13. [Google Scholar] [CrossRef]
- Rahimi, A.; Mahdavi, H. Zwitterionic-functionalized GO/PVDF nanocomposite membranes with improved anti-fouling properties. J. Water Process Eng. 2019, 32, 100960. [Google Scholar] [CrossRef]
- Mo, Y.; Yang, M.; Lu, Z.; Huang, F. Preparation and tribological performance of chemically-modified reduced graphene oxide/polyacrylonitrile composites. Compos. Part A Appl. Sci. Manuf. 2013, 54, 153–158. [Google Scholar] [CrossRef]
- Batool, M.; Shafeeq, A.; Haider, B.; Ahmad, N.M. Tio2 nanoparticle filler-based mixed-matrix pes/ca nanofiltration membranes for enhanced desalination. Membranes 2021, 11, 433. [Google Scholar] [CrossRef]
- Jin, H.; Jin, H.; Lin, L.; Lin, L.; Liu, M.; Liu, M.; Li, Q.; Li, Q.; Huang, Z.; Huang, Z.; et al. Preparation of Nano-silica Dioxide Modified Cellulose Acetate (CA) Membranes for Enhanced Performance in Forward Osmosis Process. Mater. Res. Express 2018, 9, 163–169. [Google Scholar] [CrossRef]
- Shakak, M.; Rezaee, R.; Maleki, A.; Jafari, A.; Safari, M.; Shahmoradi, B.; Daraei, H.; Lee, S.M. Synthesis and characterization of nanocomposite ultrafiltration membrane (PSF/PVP/SiO2) and performance evaluation for the removal of amoxicillin from aqueous solutions. Environ. Technol. Innov. 2020, 17. [Google Scholar] [CrossRef]
- Kusworo, T.D.; Qudratun; Utomo, D.P. Performance evaluation of double stage process using nano hybrid PES/SiO2-PES membrane and PES/ZnO-PES membranes for oily waste water treatment to clean water. J. Environ. Chem. Eng. 2017, 5, 6077–6086. [Google Scholar] [CrossRef]
- Mavukkandy, M.O.; Bilad, M.R.; Kujawa, J.; Al-Gharabli, S.; Arafat, H.A. On the effect of fumed silica particles on the structure, properties and application of PVDF membranes. Sep. Purif. Technol. 2017, 187, 365–373. [Google Scholar] [CrossRef]
- Polisetti, V.; Ray, P. Nano SiO2 and TiO2 embedded polyacrylonitrile/polyvinylidene fluoride ultrafiltration membranes: Improvement in flux and antifouling properties. J. Appl. Polym. Sci. 2021, 138. [Google Scholar] [CrossRef]
- Wang, K.; Abdalla, A.A.; Khaleel, M.A.; Hilal, N.; Khraisheh, M.K. Mechanical properties of water desalination and wastewater treatment membranes. Desalination 2017, 401, 190–205. [Google Scholar] [CrossRef] [Green Version]
- Tufekci, M.; Gunes-Durak, S.; Ormanci-Acar, T.; Tufekci, N. Effects of geometry and PVP addition on mechanical behavior of PEI membranes for use in wastewater treatment. J. Appl. Polym. Sci. 2019, 136, 47073. [Google Scholar] [CrossRef]
- Dong, Q.; Liu, J.; Yao, C.; Shao, G. Poly(vinyl alcohol)-based polymeric membrane: Preparation and tensile properties. J. Appl. Polym. Sci. 2011, 122, 1350–1357. [Google Scholar] [CrossRef]
- Homaeigohar, S.S.; Elbahri, M. Novel compaction resistant and ductile nanocomposite nanofibrous microfiltration membranes. J. Colloid Interface Sci. 2012, 372, 6–15. [Google Scholar] [CrossRef] [Green Version]
- Bui, N.-N.; McCutcheon, J.R. Hydrophilic Nanofibers as New Supports for Thin Film Composite Membranes for Engineered Osmosis. Environ. Sci. Technol. 2013, 47, 1761–1769. [Google Scholar] [CrossRef]
- Wang, F.; Wu, Y.; Huang, Y. High strength, thermostable and fast-drying hybrid transparent membranes with POSS nanoparticles aligned on aramid nanofibers. Compos. Part A Appl. Sci. Manuf. 2018, 110, 154–161. [Google Scholar] [CrossRef]
- Ionita, M.; Iovu, H. Mechanical properties, urea diffusion, and cell cultural response of poly(vinyl alcohol)–Chitosan bioartificial membranes via molecular modelling and experimental investigation. Compos. Part B Eng. 2012, 43, 2464–2470. [Google Scholar] [CrossRef]
- Fuller, J.; Mitchell, S.; Pozegic, T.; Wu, X.; Longana, M.; Wisnom, M. Experimental evaluation of hygrothermal effects on pseudo-ductile thin ply angle-ply carbon/epoxy laminates. Compos. Part B Eng. 2021, 227, 109388. [Google Scholar] [CrossRef]
- Lu, X.; Qiu, Z.; Wan, Y.; Hu, Z.; Zhao, Y. Preparation and characterization of conducting polycaprolactone/chitosan/polypyrrole composites. Compos. Part A Appl. Sci. Manuf. 2010, 41, 1516–1523. [Google Scholar] [CrossRef]
- Tüfekci, M.; Durak, S.G.; Pir, İ.; Acar, T.O.; Demirkol, G.T.; Tüfekci, N. Manufacturing, characterisation and mechanical analysis of polyacrylonitrile membranes. Polymers 2020, 12, 2378. [Google Scholar] [CrossRef]
- Vignoli, L.L.; Savi, M.A.; Pacheco, P.M.C.L.; Kalamkarov, A.L. Comparative analysis of micromechanical models for the elastic composite laminae. Compos. Part B Eng. 2019, 174, 106961. [Google Scholar] [CrossRef]
- Sun, C.; Saffari, P.; Ranade, R.; Sadeghipour, K.; Baran, G. Finite element analysis of elastic property bounds of a composite with randomly distributed particles. Compos. Part A Appl. Sci. Manuf. 2007, 38, 80–86. [Google Scholar] [CrossRef]
- Mori, T.; Tanaka, K. Average stress in matrix and average elastic energy of materials with misfitting inclusions. Acta Metall. 1973, 21, 571–574. [Google Scholar] [CrossRef]
- Acarer, S.; Pir, İ.; Tüfekci, M.; Türkoğlu Demirkol, G.; Tüfekci, N. Manufacturing and characterisation of polymeric membranes for water treatment and numerical investigation of mechanics of nanocomposite membranes. Polymers 2021, 13, 1661. [Google Scholar] [CrossRef] [PubMed]
- Das Lala, S.; Sadikbasha, S.; Deoghare, A.B. Prediction of elastic modulus of polymer composites using Hashin–Shtrikman bound, mean field homogenization and finite element technique. Proc. Inst. Mech. Eng. Part C J. Mech. Eng. Sci. 2020, 234, 1653–1659. [Google Scholar] [CrossRef]
- Arora, G.; Pathak, H. Modeling of transversely isotropic properties of CNT-polymer composites using meso-scale FEM approach. Compos. Part B Eng. 2019, 166, 588–597. [Google Scholar] [CrossRef]
- Sheng, N.; Boyce, M.C.; Parks, D.M.; Rutledge, G.C.; Abes, J.I.; Cohen, R.E. Multiscale micromechanical modeling of polymer/clay nanocomposites and the effective clay particle. Polymer 2004, 45, 487–506. [Google Scholar] [CrossRef]
- Pontefisso, A.; Zappalorto, M.; Quaresimin, M. An efficient RVE formulation for the analysis of the elastic properties of spherical nanoparticle reinforced polymers. Comput. Mater. Sci. 2015, 96, 319–326. [Google Scholar] [CrossRef]
- Singh, I.V.; Shedbale, A.S.; Mishra, B.K. Material property evaluation of particle reinforced composites using finite element approach. J. Compos. Mater. 2015, 50, 2757–2771. [Google Scholar] [CrossRef]
- Pucha, R.V.; Worthy, J. Representative volume element-based design and analysis tools for composite materials with nanofillers. J. Compos. Mater. 2013, 48, 2117–2129. [Google Scholar] [CrossRef]
- Wu, H.; Bremner, D.H.; Li, H.; Shi, Q.; Wu, J.; Xiao, R.; Zhu, L. A novel multifunctional biomedical material based on polyacrylonitrile: Preparation and characterization. Mater. Sci. Eng. C 2016, 62, 702–709. [Google Scholar] [CrossRef] [Green Version]
- Guo, J.; Xiang, H.X.; Gong, X.Y.; Zhang, Y.P. Preparation and Performance of the Hydrolyzate of Waste Polyacrylonitrile Fiber/Poly(Ethylene Glycol) Graft Copolymerization. Energy Sources, Part A Recover. Util. Environ. Eff. 2011, 33, 1067–1075. [Google Scholar] [CrossRef]
- Karbownik, I.; Rac-Rumijowska, O.; Fiedot-Toboła, M.; Rybicki, T.; Teterycz, H. The Preparation and Characterization of Polyacrylonitrile-Polyaniline (PAN/PANI) Fibers. Materials 2019, 12, 664. [Google Scholar] [CrossRef] [Green Version]
- Ren, Y.; Huo, T.; Qin, Y.; Liu, X. Preparation of Flame Retardant Polyacrylonitrile Fabric Based on Sol-Gel and Layer-by-Layer Assembly. Materials 2018, 11, 483. [Google Scholar] [CrossRef] [Green Version]
- Luo, Y.Y.; Wang, Y.Q.; Zhong, J.P.; He, C.Z.; Li, Y.Z.; Peng, Z. Interaction Between Fumed-Silica and Epoxidized Natural Rubber. J. Inorg. Organomet. Polym. Mater. 2011, 21, 777–783. [Google Scholar] [CrossRef]
- Li, K.-M.; Jiang, J.-G.; Tian, S.-C.; Chen, X.-J.; Yan, F. Influence of Silica Types on Synthesis and Performance of Amine–Silica Hybrid Materials Used for CO2 Capture. J. Phys. Chem. C 2014, 118, 2454–2462. [Google Scholar] [CrossRef]
- Lee, S.; Kim, J.; Ku, B.-C.; Kim, J.; Joh, H.-I. Structural Evolution of Polyacrylonitrile Fibers in Stabilization and Carbonization. Adv. Chem. Eng. Sci. 2012, 02, 275–282. [Google Scholar] [CrossRef]
- Ji, L.; Saquing, C.; Khan, S.A.; Zhang, X. Preparation and characterization of silica nanoparticulate–polyacrylonitrile composite and porous nanofibers. Nanotechnology 2008, 19, 085605. [Google Scholar] [CrossRef] [PubMed]
- Khan, W.S.; Ceylan, M.; Jabarrania, A.; Saeednia, L.; Asmatulu, R. Chemical and thermal investigations of electrospun polyacrylonitrile nanofibers incorporated with various nanoscale inclusions. J. Therm. Eng. 2017, 3, 1375–1390. [Google Scholar] [CrossRef]
- Cipriani, E.; Zanetti, M.; Bracco, P.; Brunella, V.; Luda, M.P.; Costa, L. Crosslinking and carbonization processes in PAN films and nanofibers. Polym. Degrad. Stab. 2016, 123, 178–188. [Google Scholar] [CrossRef]
- Hasan-nezhad, H.; Yazdani, M.; Salami-Kalajahi, M.; Jeddi, M. Mechanical behavior of 3D GFRP composite with pure and treated shear thickening fluid matrix subject to quasi-static puncture and shear impact loading. J. Compos. Mater. 2020, 54, 3933–3948. [Google Scholar] [CrossRef]
- Faraji, S.; Yardim, M.F.; Can, D.S.; Sarac, A.S. Characterization of polyacrylonitrile, poly(acrylonitrile-co-vinyl acetate), and poly(acrylonitrile-co-itaconic acid) based activated carbon nanofibers. J. Appl. Polym. Sci. 2017, 134. [Google Scholar] [CrossRef]
- Ye, L.; Wu, Q.; Qu, B. Synergistic effects of fumed silica on intumescent flame-retardant polypropylene. J. Appl. Polym. Sci. 2010, 115, 3508–3515. [Google Scholar] [CrossRef]
- Zhang, J.; Lou, J.; Ilias, S.; Krishnamachari, P.; Yan, J. Thermal properties of poly(lactic acid) fumed silica nanocomposites: Experiments and molecular dynamics simulations. Polymer 2008, 49, 2381–2386. [Google Scholar] [CrossRef]
- Bajaj, P.; Sreekumar, T.V.; Sen, K. Thermal behaviour of acrylonitrile copolymers having methacrylic and itaconic acid comonomers. Polymer 2001, 42, 1707–1718. [Google Scholar] [CrossRef]
- Yu, Z.; Liu, X.; Zhao, F.; Liang, X.; Tian, Y. Fabrication of a low-cost nano-SiO2/PVC composite ultrafiltration membrane and its antifouling performance. J. Appl. Polym. Sci. 2015, 132, 1–11. [Google Scholar] [CrossRef]
- Yang, Z.; Zhou, Y.; Feng, Z.; Rui, X.; Zhang, T.; Zhang, Z. A review on reverse osmosis and nanofiltration membranes for water purification. Polymers 2019, 11, 1252. [Google Scholar] [CrossRef]
- Huang, Y.; Kinloch, A.J. Modelling of the toughening mechanisms in rubber-modified epoxy polymers - Part I Finite element analysis studies. J. Mater. Sci. 1992, 27, 2753–2762. [Google Scholar] [CrossRef]
- Raz, P.; Brosh, T.; Ronen, G.; Tal, H. Tensile Properties of Three Selected Collagen Membranes. Biomed Res. Int. 2019, 2019, 5163603. [Google Scholar] [CrossRef]
- Qu, P.; Tang, H.; Gao, Y.; Zhang, L.P.; Wang, S. Polyethersulfone composite membrane blended With cellulose fibrils. BioResources 2010, 5, 2323–2336. [Google Scholar]
- Soni, R.; Asoh, T.-A.; Uyama, H. Cellulose nanofiber reinforced starch membrane with high mechanical strength and durability in water. Carbohydr. Polym. 2020, 238, 116203. [Google Scholar] [CrossRef] [PubMed]


| Membrane | PAN (wt%) | DMSO (wt%) | FS (wt%) |
|---|---|---|---|
| PAN | 16 | 84 | - |
| PAN-FS0.1 | 16 | 83.9 | 0.1 |
| PAN-FS0.5 | 16 | 83.5 | 0.5 |
| PAN-FS1 | 16 | 83 | 1 |
| Weight Loss Percentages | |||||||
|---|---|---|---|---|---|---|---|
| Membrane Type | 100 °C | 200 °C | 300 °C | 400 °C | 500 °C | 600 °C | 700 °C |
| PAN | 2.1 | 2.2 | 5.4 | 15.8 | 26.4 | 65.6 | 92.9 |
| PAN-FS0.1 | 1.4 | 2.8 | 4.2 | 17.1 | 24.2 | 49.2 | 88.7 |
| PAN-FS0.5 | 1.9 | 4.2 | 7.6 | 19.6 | 28.6 | 65.0 | 92.9 |
| PAN-FS1 | 2.0 | 3.3 | 5.3 | 19.7 | 31.1 | 70.8 | 96.8 |
| Elasticity Modulus (MPa) | Tensile Strength (MPa) | Elongation at Break | ||
|---|---|---|---|---|
| DMSO | Wet | 85.393 | 19.626 | 0.0936 |
| DMSO | Dry | 147.43 | 5.1256 | 0.0096 |
| 0.1 g FS | Wet | 90.13 | 20.1652 | 0.1192 |
| 0.1 g FS | Dry | 153.6 | 6.1119 | 0.0101 |
| 0.5 g FS | Wet | 92.52 | 22.0376 | 0.1257 |
| 0.5 g FS | Dry | 155.7 | 7.2553 | 0.0124 |
| 1 g FS | Wet | 97.18 | 23.54 | 0.1309 |
| 1 g FS | Dry | 159.34 | 7.8926 | 0.0147 |
| Experimental [MPa] | Mori–Tanaka [MPa] | Error (%) | FE [MPa] | Error (%) | ||
|---|---|---|---|---|---|---|
| DMSO | Wet | 85.393 | ||||
| DMSO | Dry | 147.43 | ||||
| 0.1 g FS | Wet | 90.13 | 85.501 | 5.140 | 87.563 | 2.852 |
| 0.1 g FS | Dry | 153.6 | 147.62 | 3.893 | 150.951 | 1.725 |
| 0.5 g FS | Wet | 92.52 | 85.938 | 7.114 | 88.004 | 4.881 |
| 0.5 g FS | Dry | 155.7 | 148.37 | 4.708 | 149.446 | 4.017 |
| 1 g FS | Wet | 97.18 | 86.488 | 11.002 | 88.713 | 8.713 |
| 1 g FS | Dry | 159.34 | 149.32 | 6.288 | 151.976 | 4.622 |
Publisher’s Note: MDPI stays neutral with regard to jurisdictional claims in published maps and institutional affiliations. |
© 2022 by the authors. Licensee MDPI, Basel, Switzerland. This article is an open access article distributed under the terms and conditions of the Creative Commons Attribution (CC BY) license (https://creativecommons.org/licenses/by/4.0/).
Share and Cite
Acarer, S.; Pir, İ.; Tüfekci, M.; Erkoç, T.; Öztekin, V.; Dikicioğlu, C.; Demirkol, G.T.; Durak, S.G.; Özçoban, M.Ş.; Çoban, T.Y.T.; et al. Characterisation and Mechanical Modelling of Polyacrylonitrile-Based Nanocomposite Membranes Reinforced with Silica Nanoparticles. Nanomaterials 2022, 12, 3721. https://doi.org/10.3390/nano12213721
Acarer S, Pir İ, Tüfekci M, Erkoç T, Öztekin V, Dikicioğlu C, Demirkol GT, Durak SG, Özçoban MŞ, Çoban TYT, et al. Characterisation and Mechanical Modelling of Polyacrylonitrile-Based Nanocomposite Membranes Reinforced with Silica Nanoparticles. Nanomaterials. 2022; 12(21):3721. https://doi.org/10.3390/nano12213721
Chicago/Turabian StyleAcarer, Seren, İnci Pir, Mertol Tüfekci, Tuğba Erkoç, Vehbi Öztekin, Can Dikicioğlu, Güler Türkoğlu Demirkol, Sevgi Güneş Durak, Mehmet Şükrü Özçoban, Tuba Yelda Temelli Çoban, and et al. 2022. "Characterisation and Mechanical Modelling of Polyacrylonitrile-Based Nanocomposite Membranes Reinforced with Silica Nanoparticles" Nanomaterials 12, no. 21: 3721. https://doi.org/10.3390/nano12213721