
A-Site Cation Size Effect on Structure and Magnetic Properties of Sm(Eu,Gd)Cr0.2Mn0.2Fe0.2Co0.2Ni0.2O3 High-Entropy Solid Solutions


 , ,
, ,  ,
,  and
and 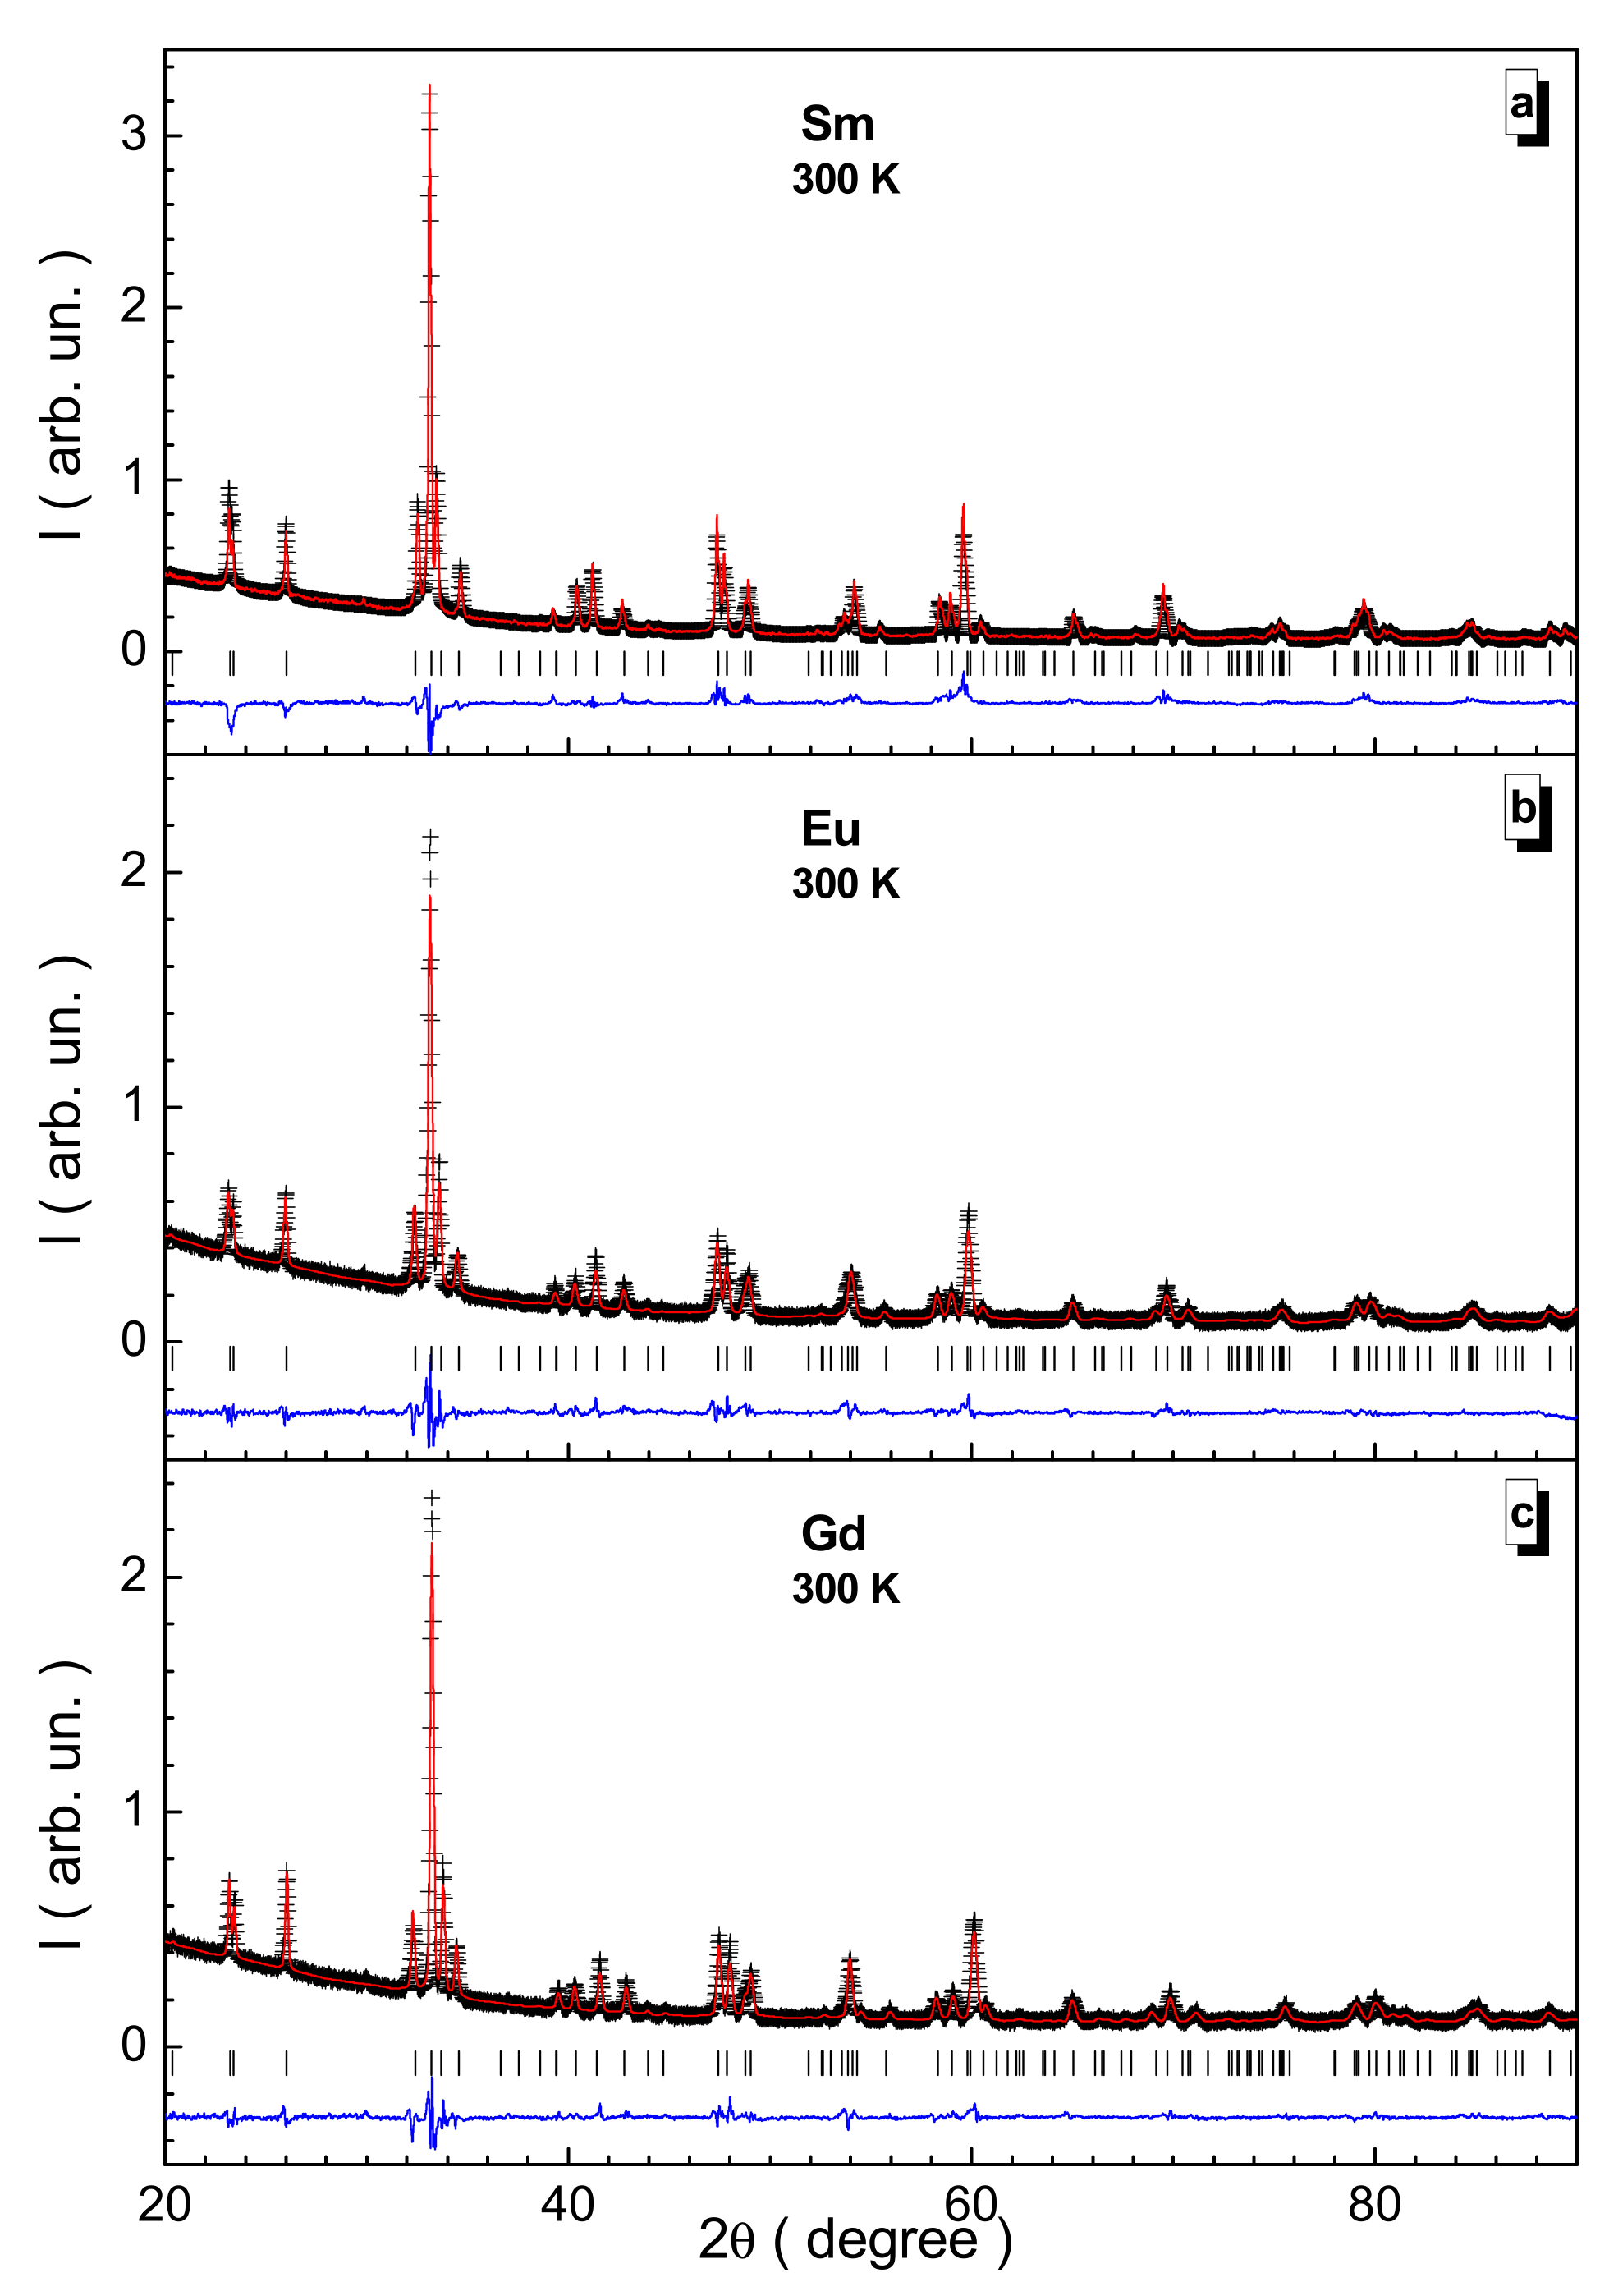
Abstract
:1. Introduction
2. Materials and Methods
Synthesis and Characterization
3. Results and Discussion
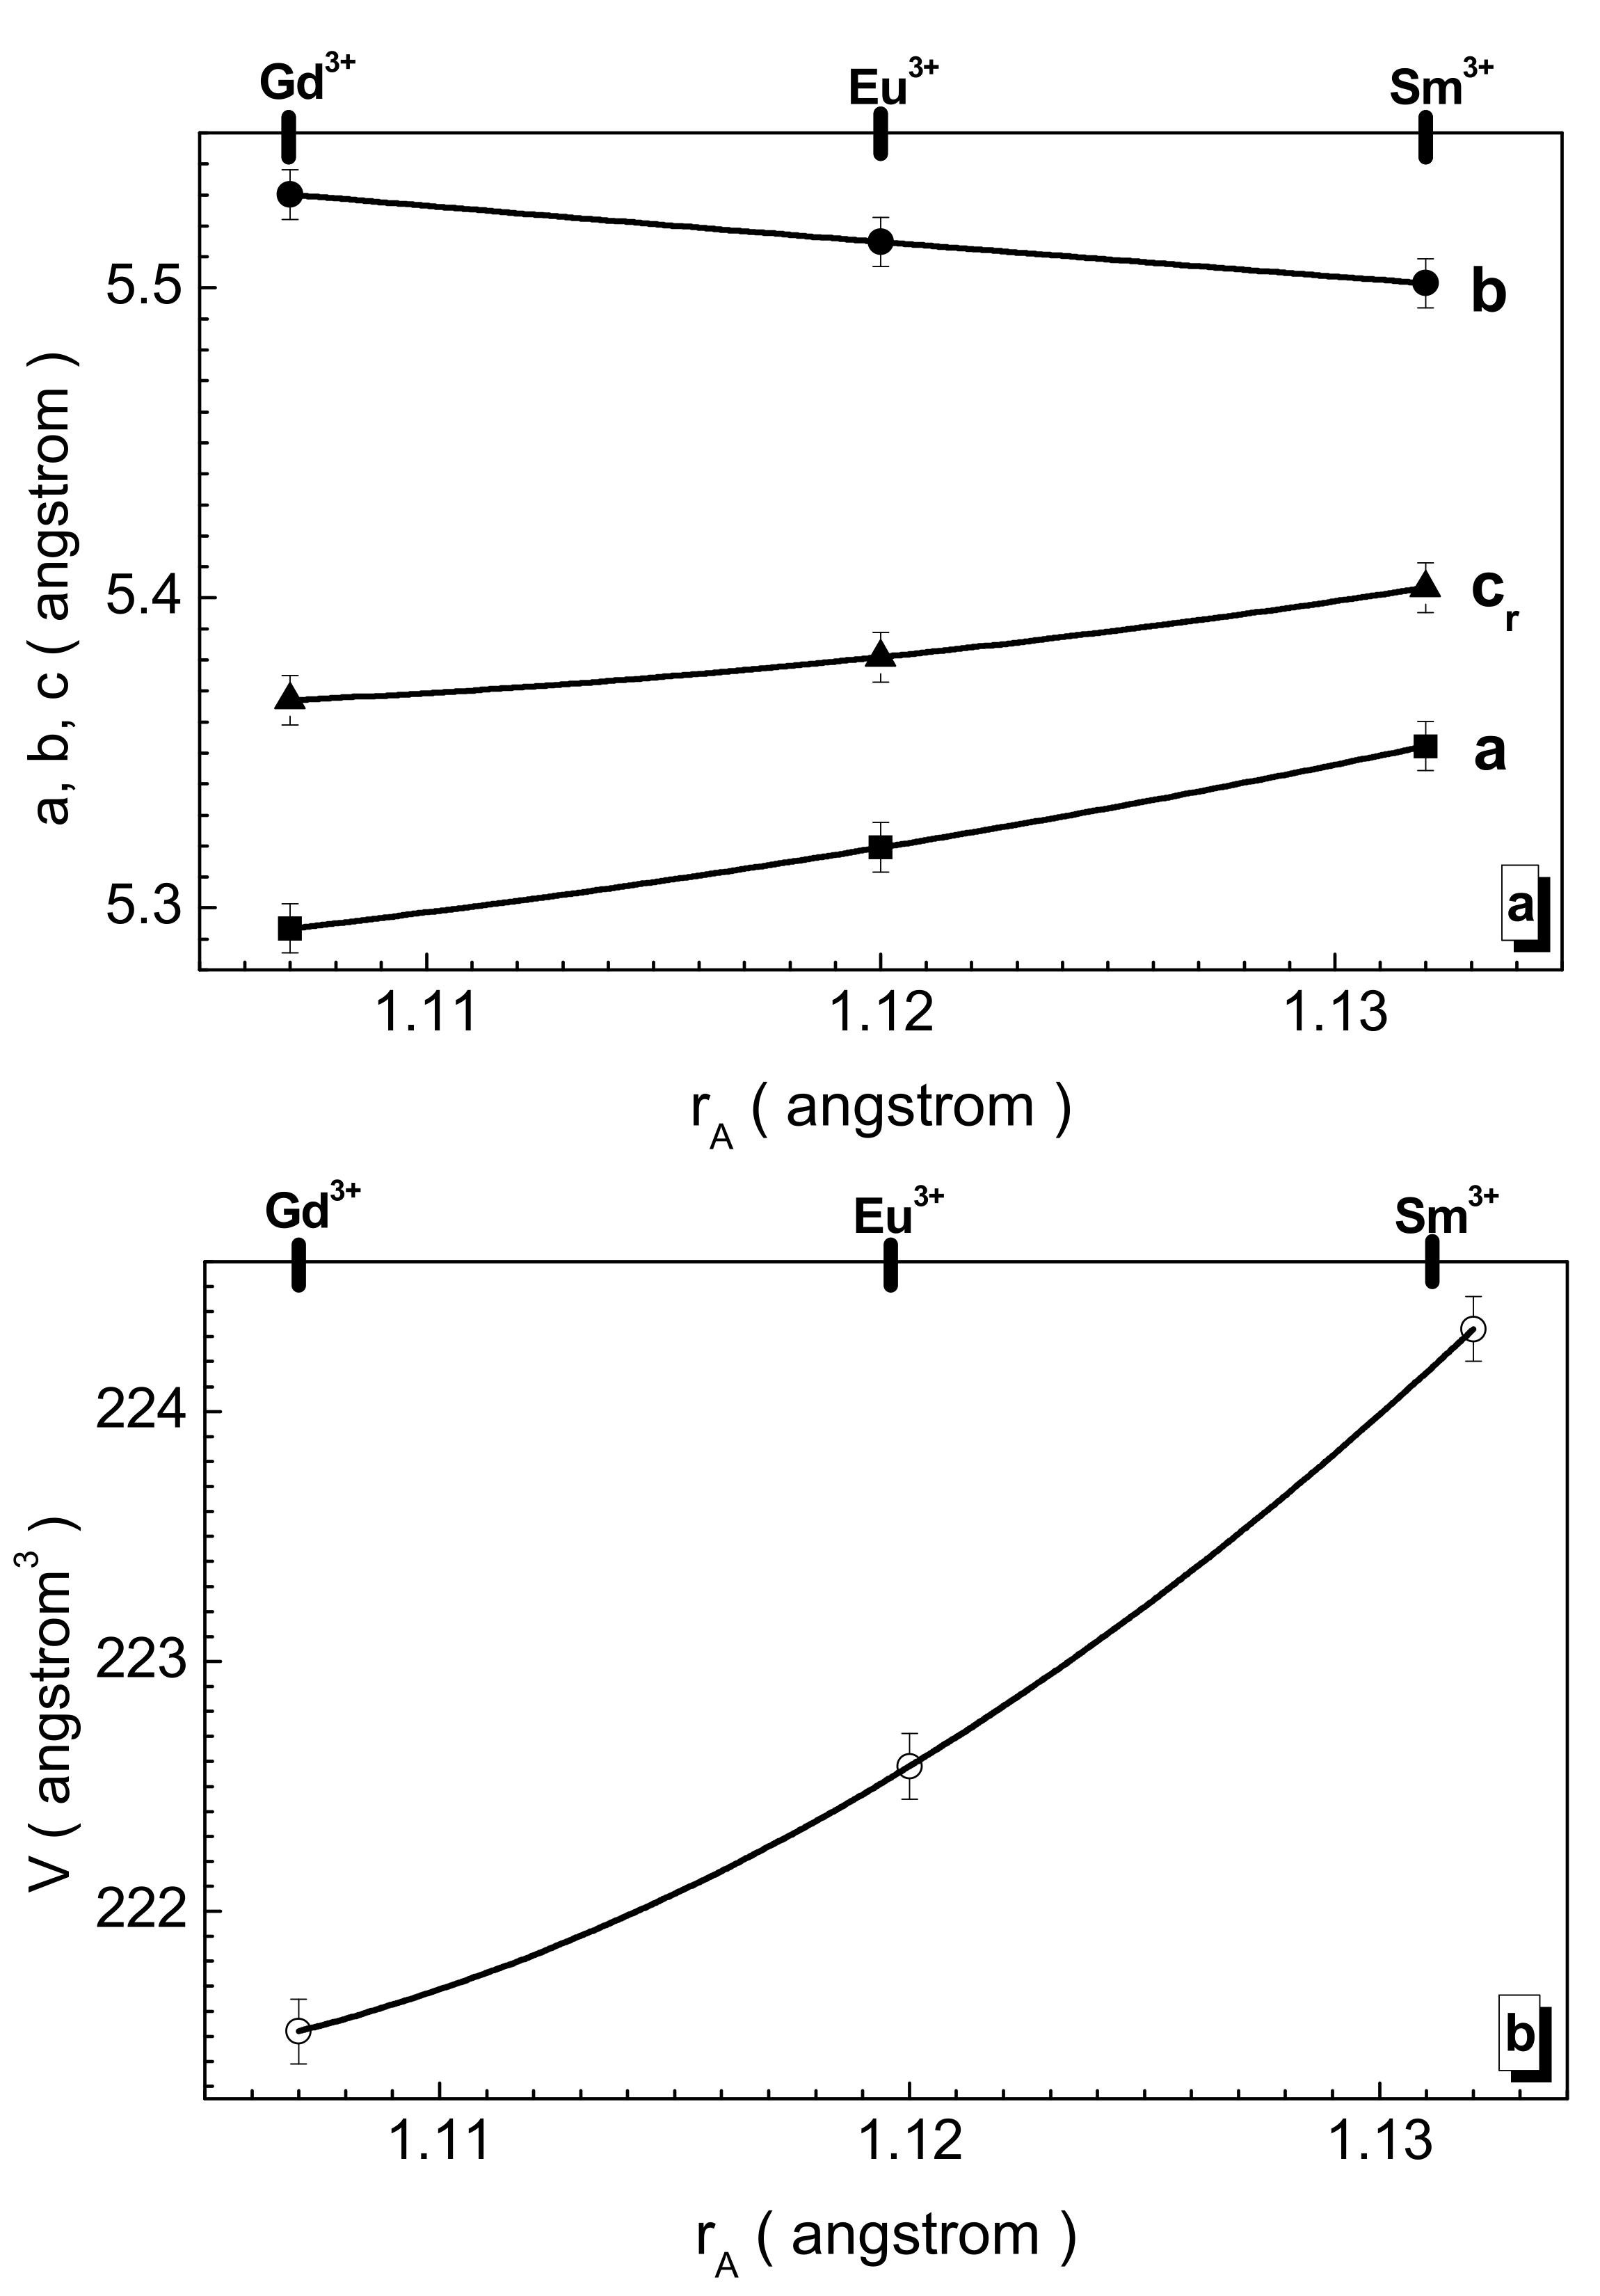
3.1. Crystal Structure
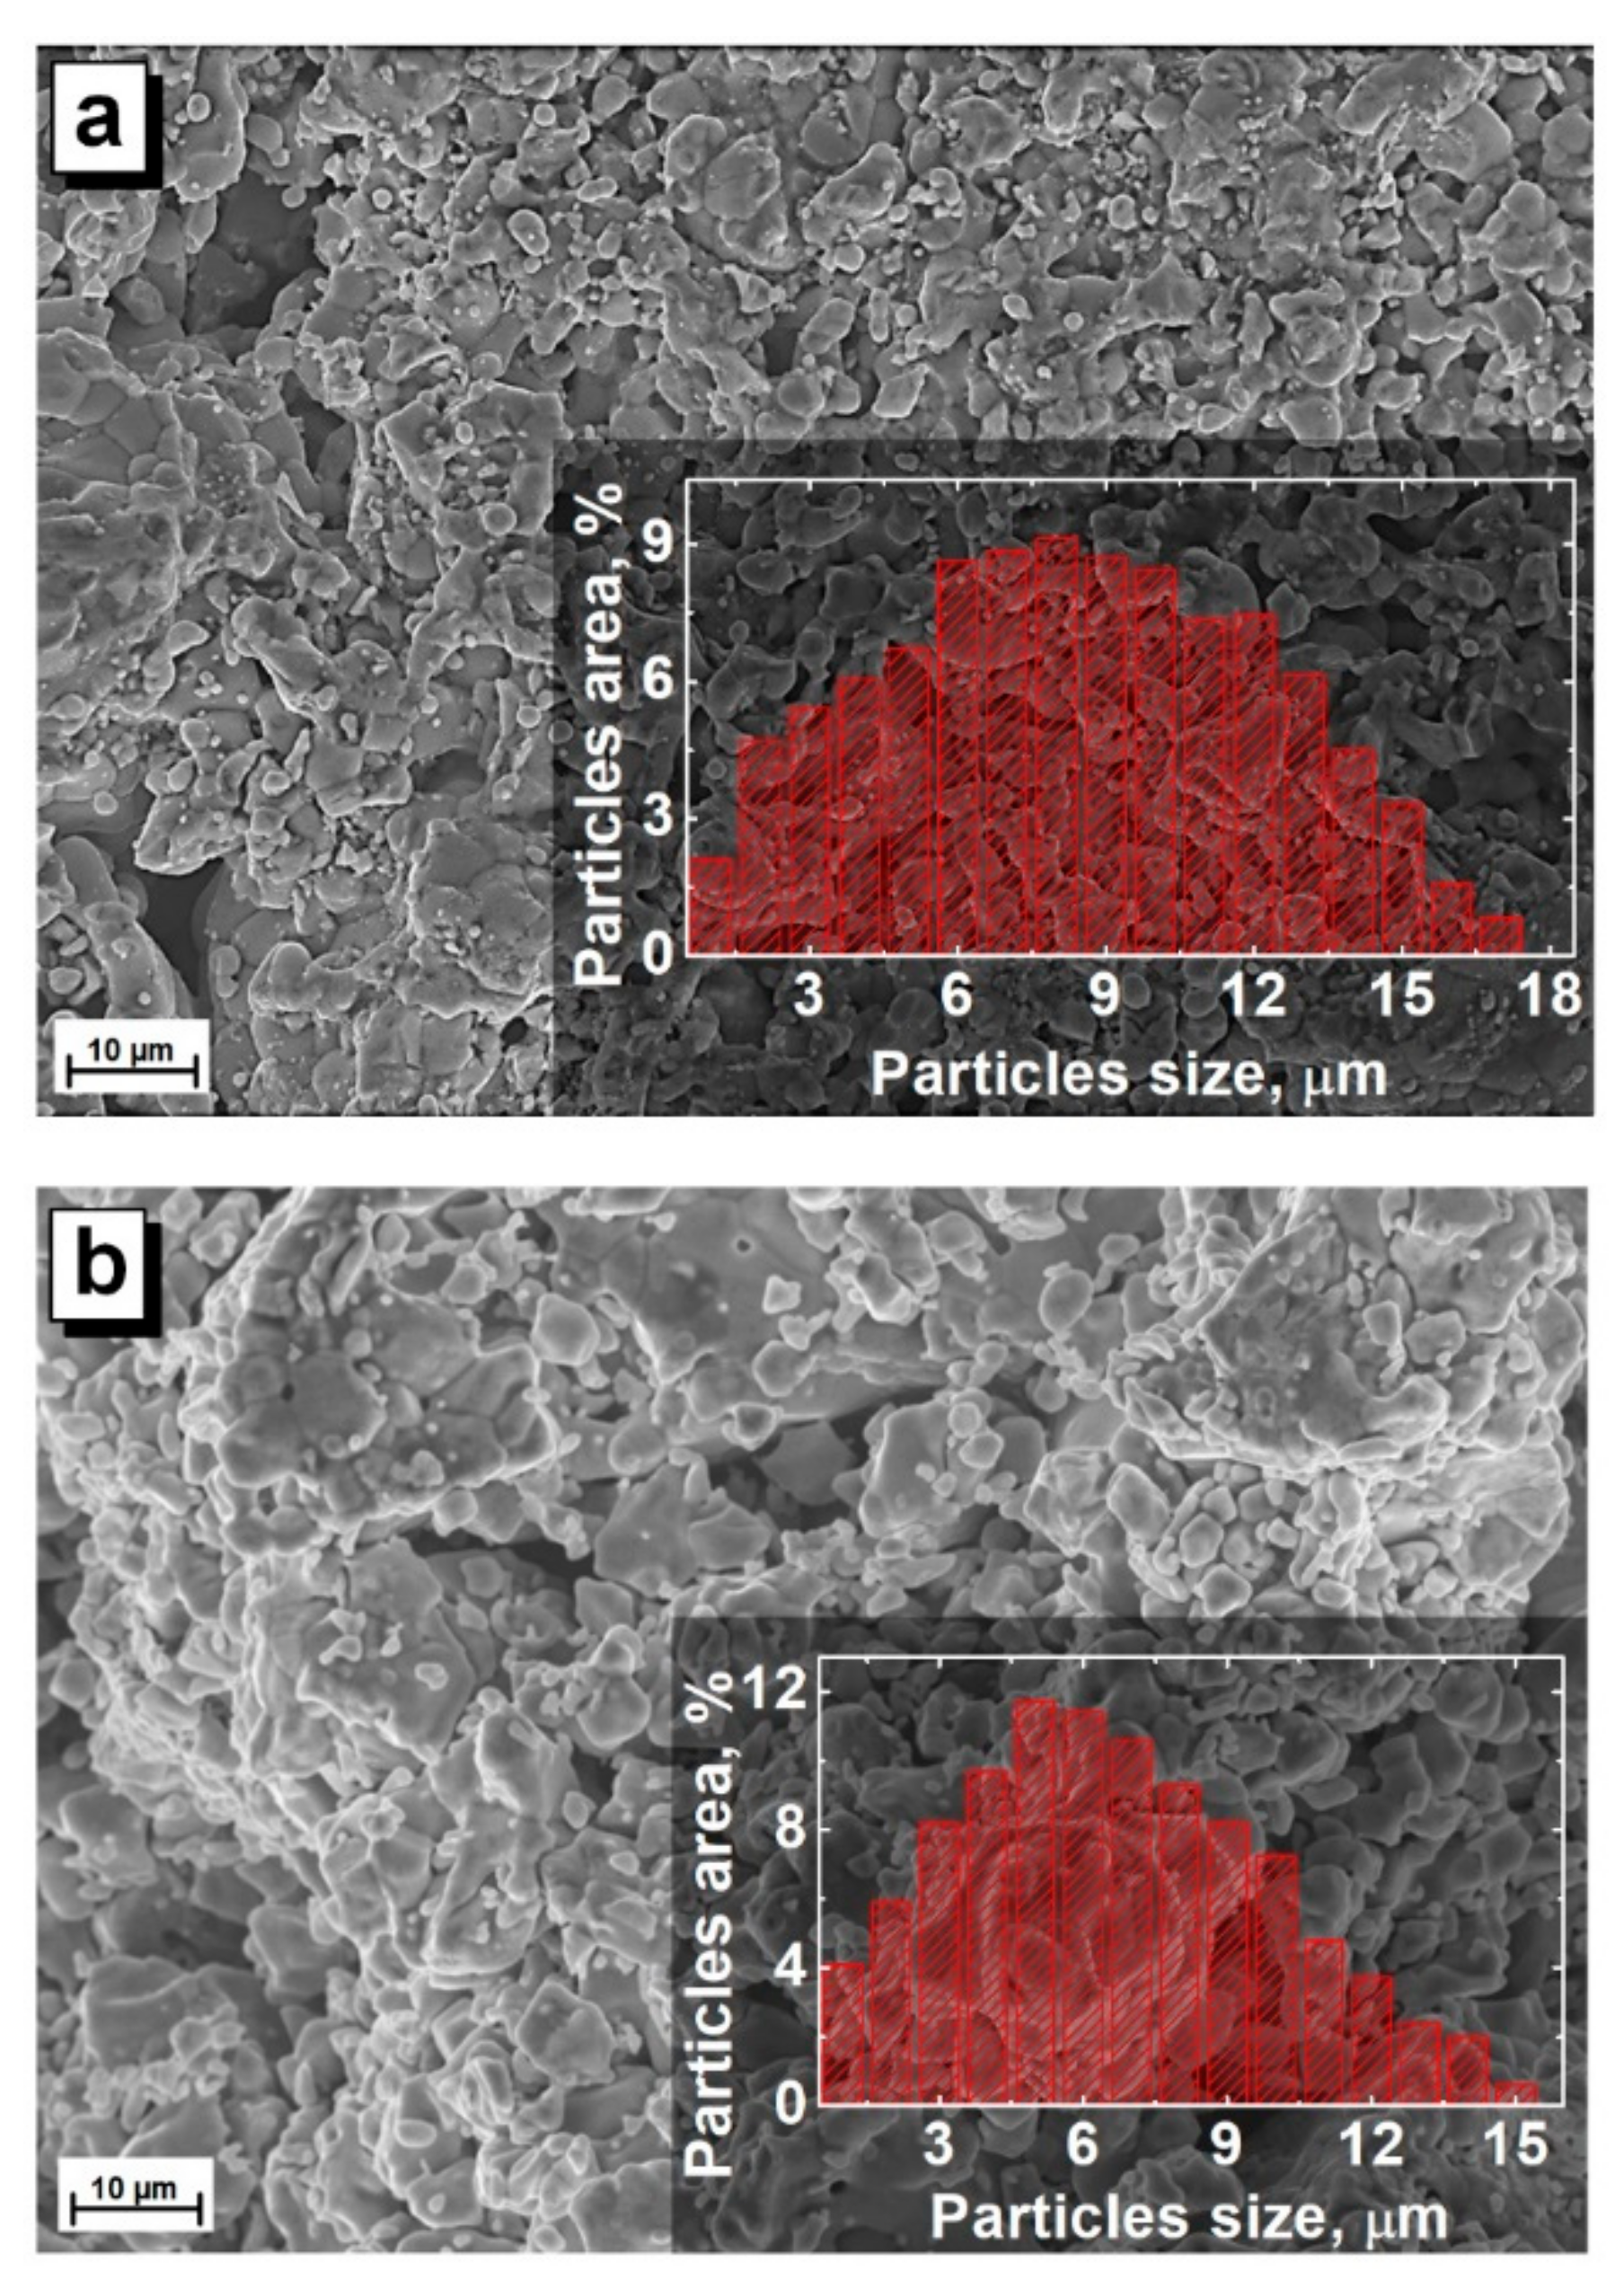
3.2. Microstructure
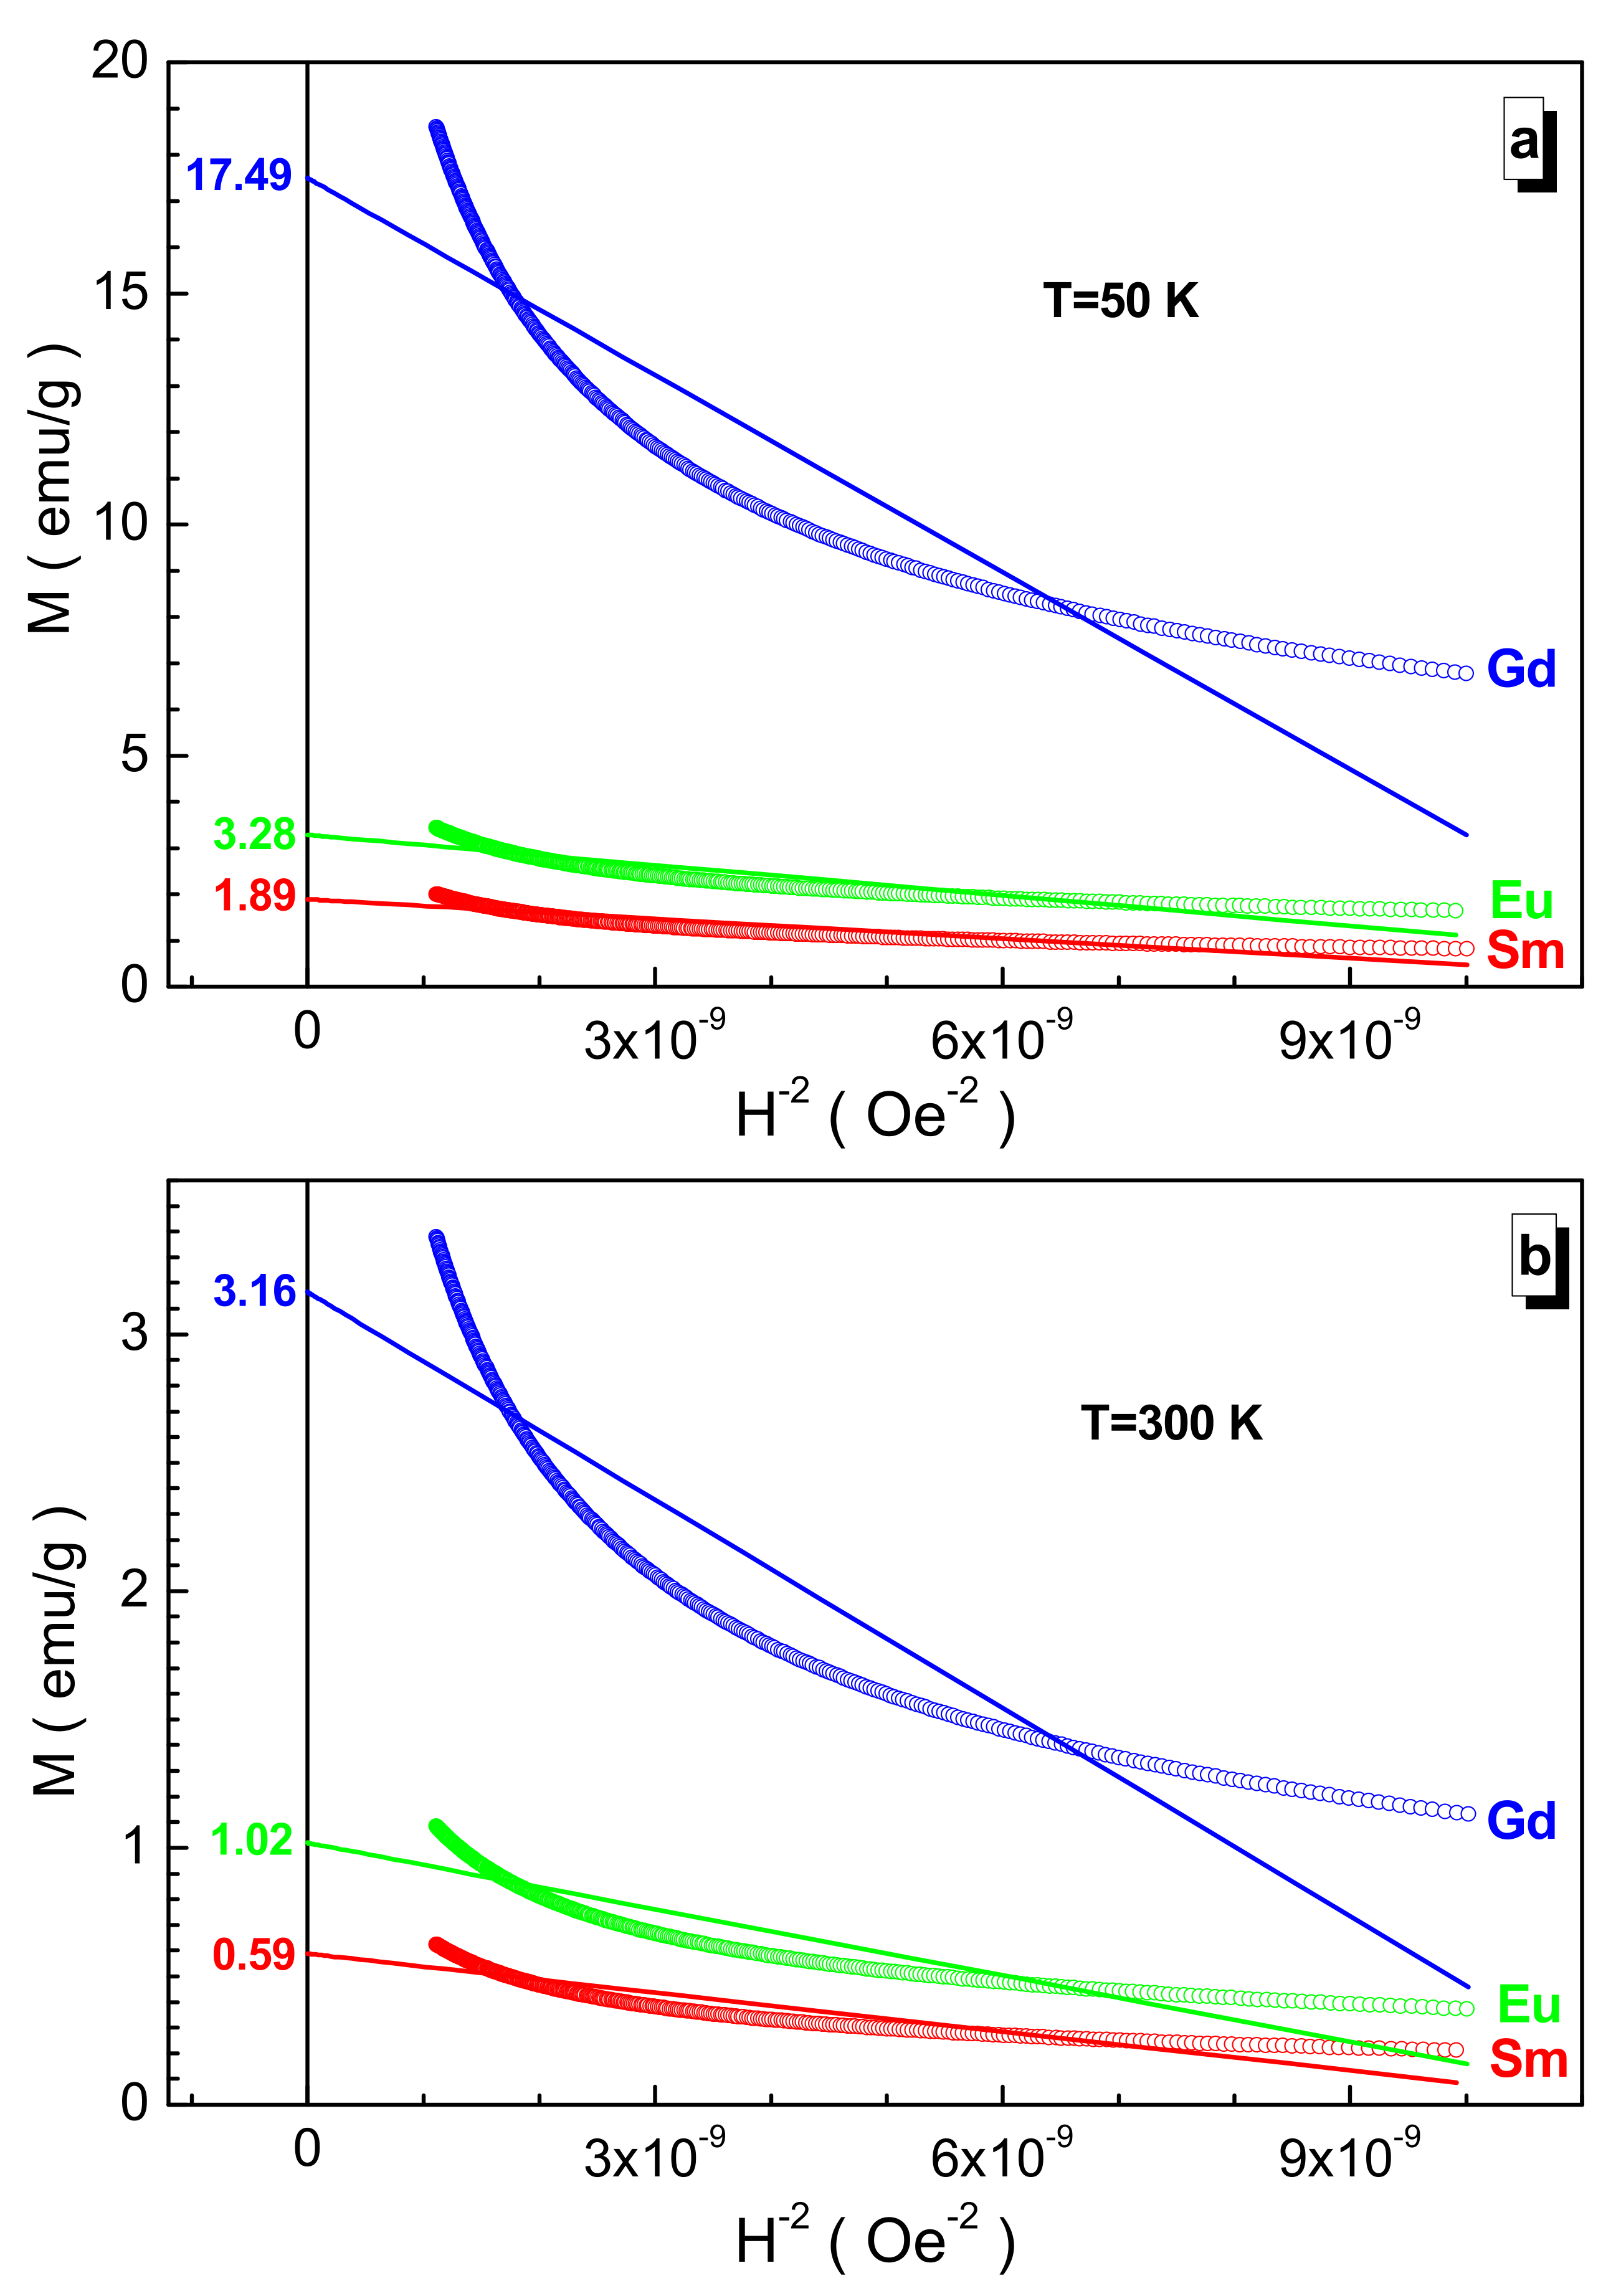
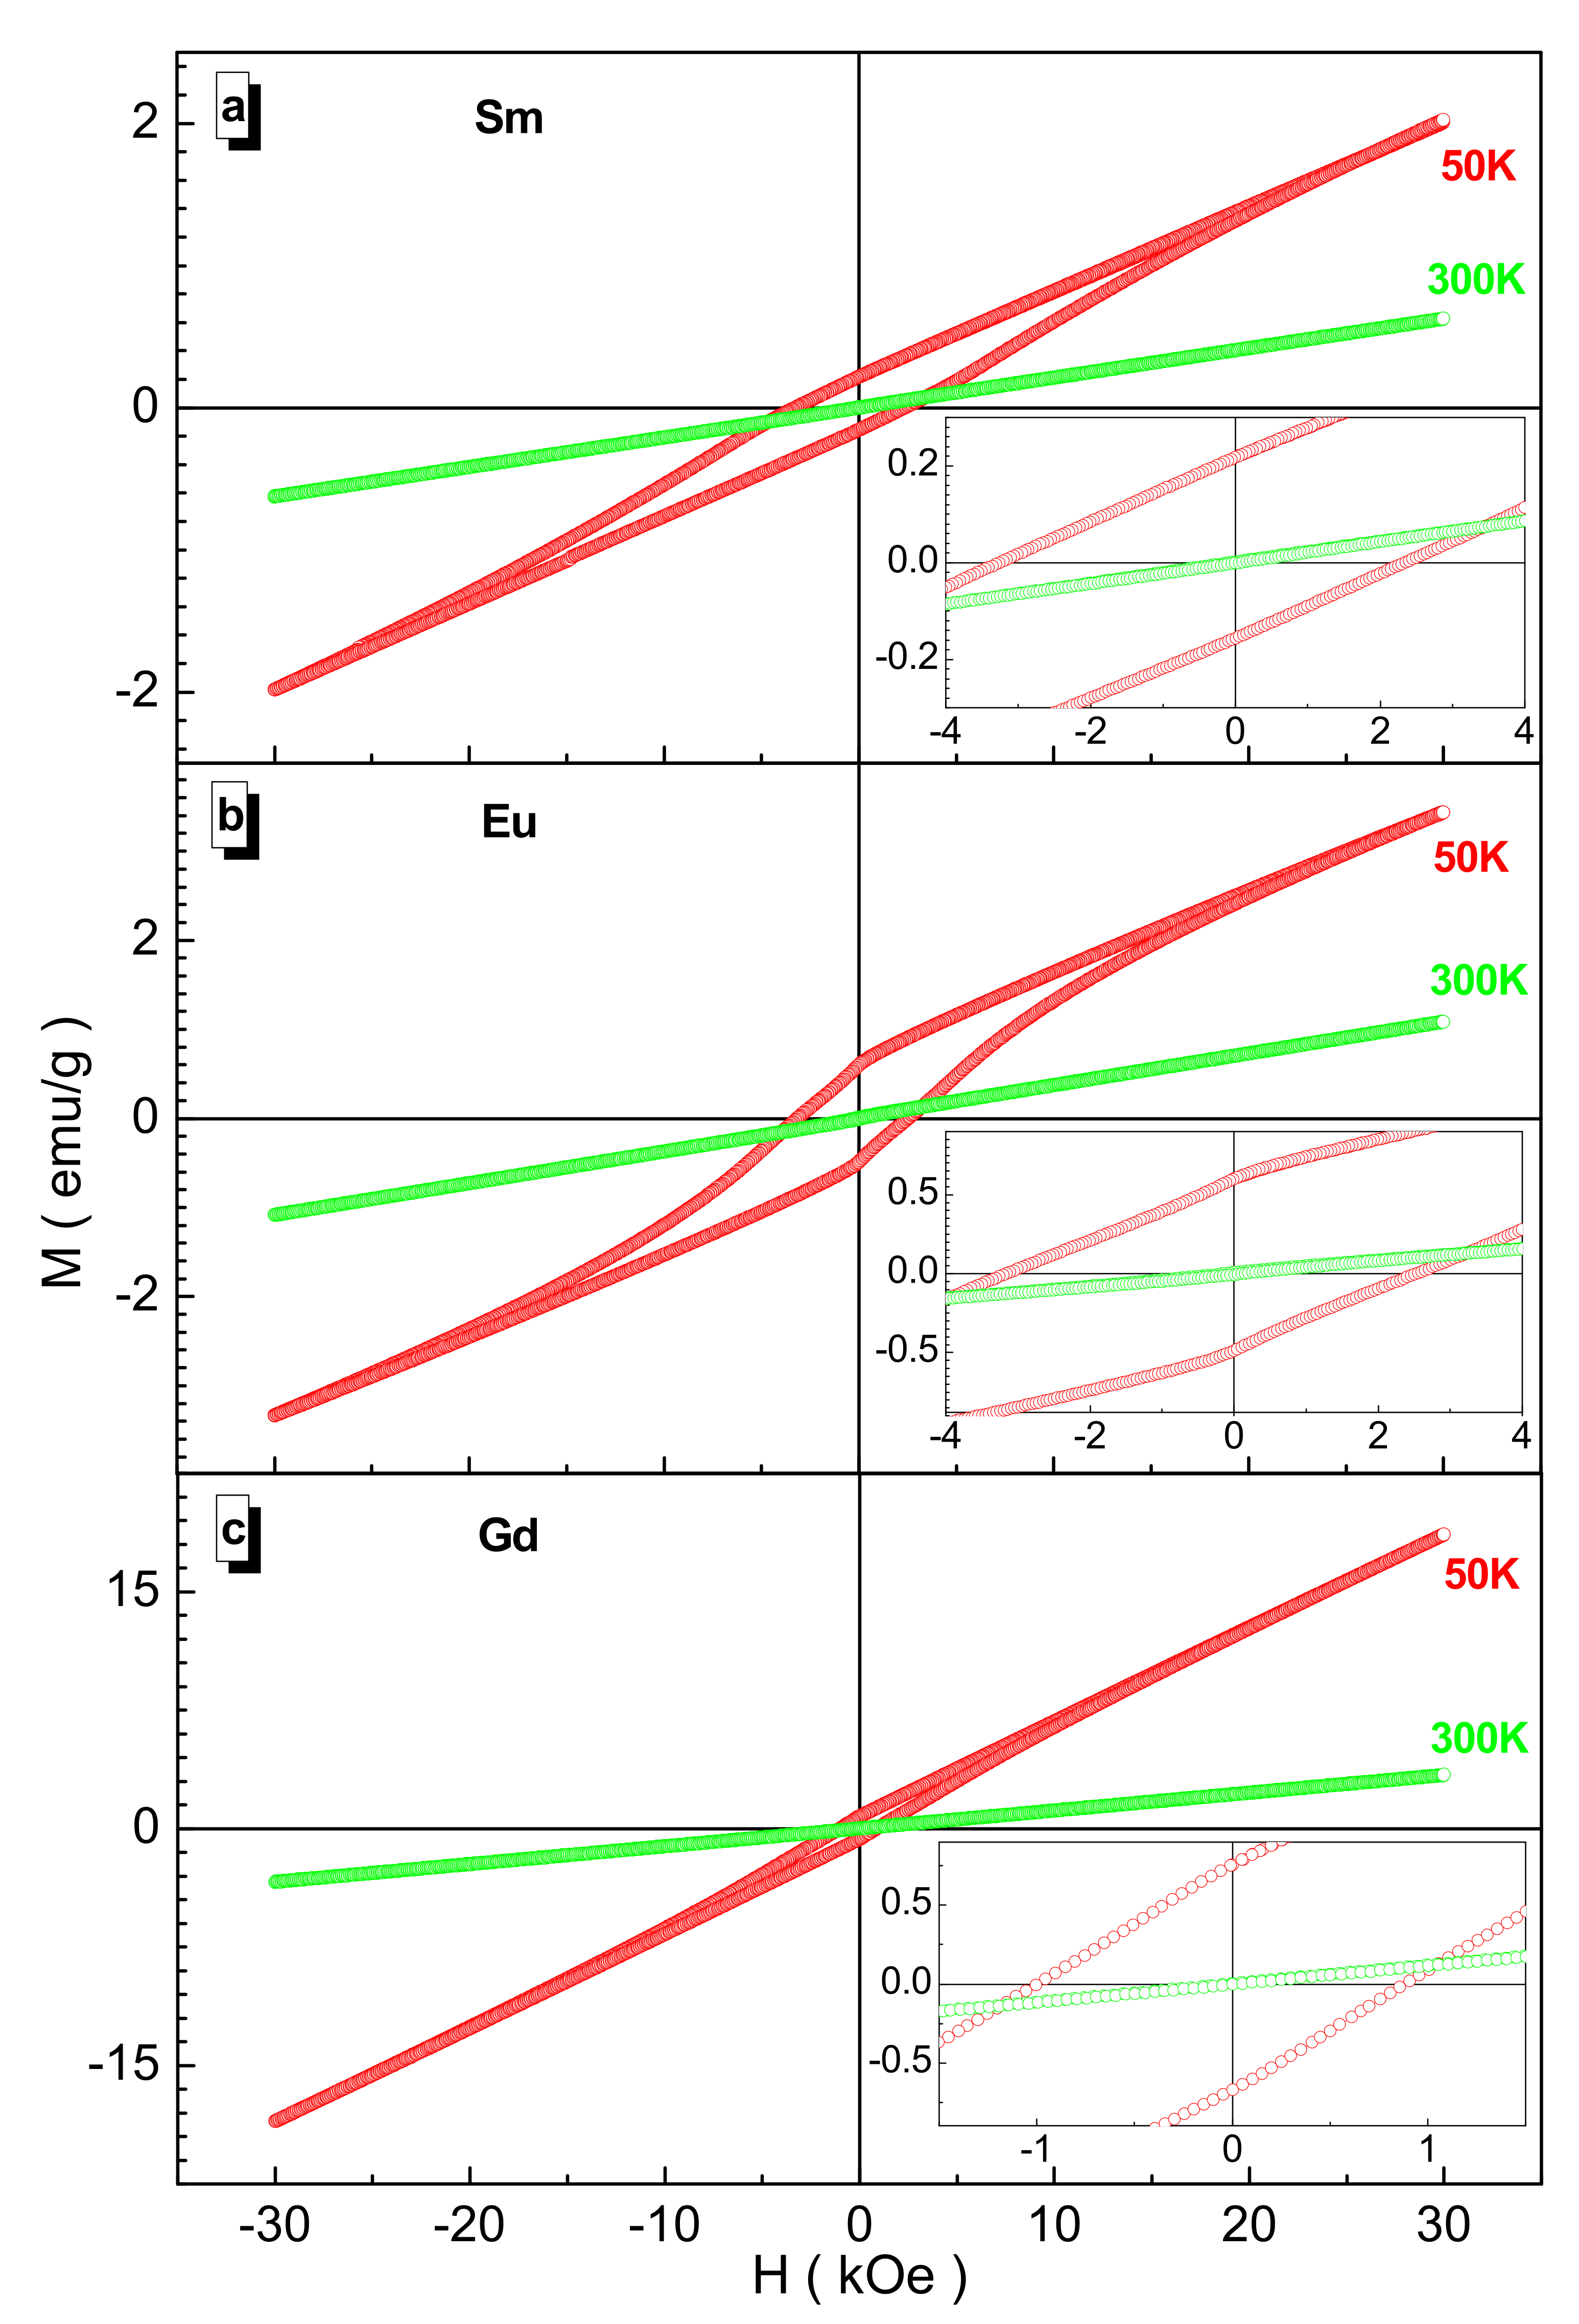
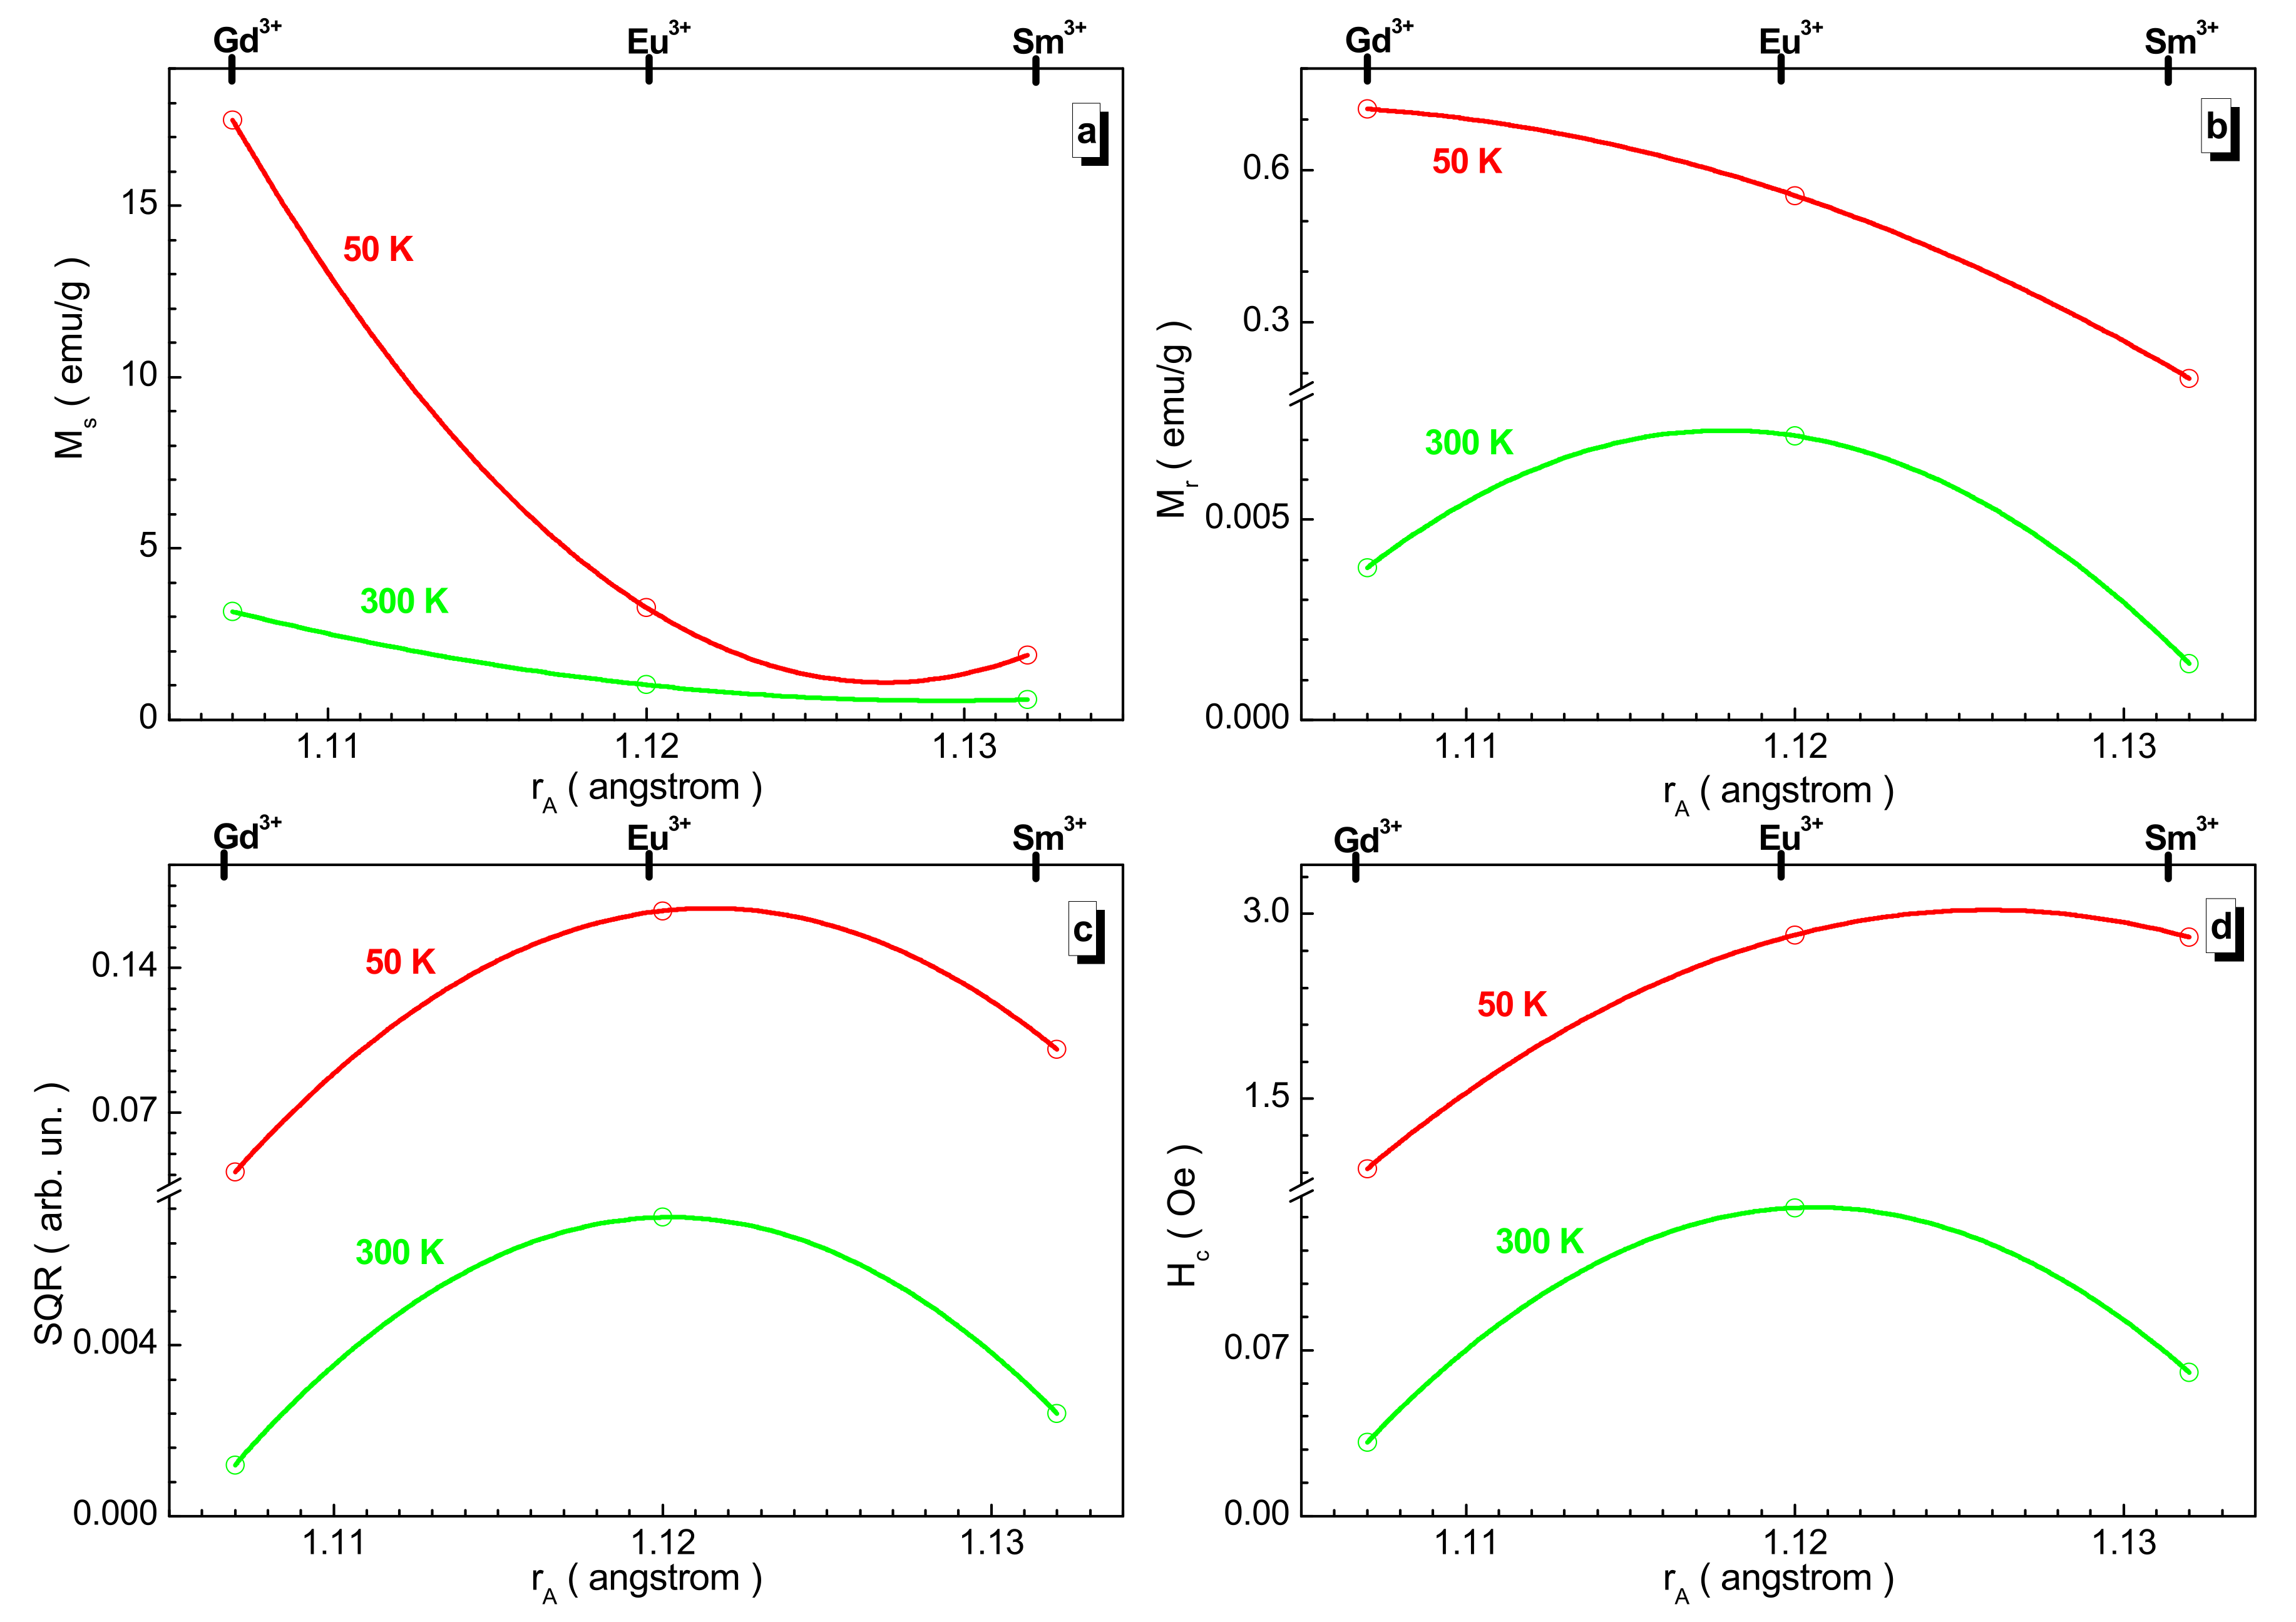
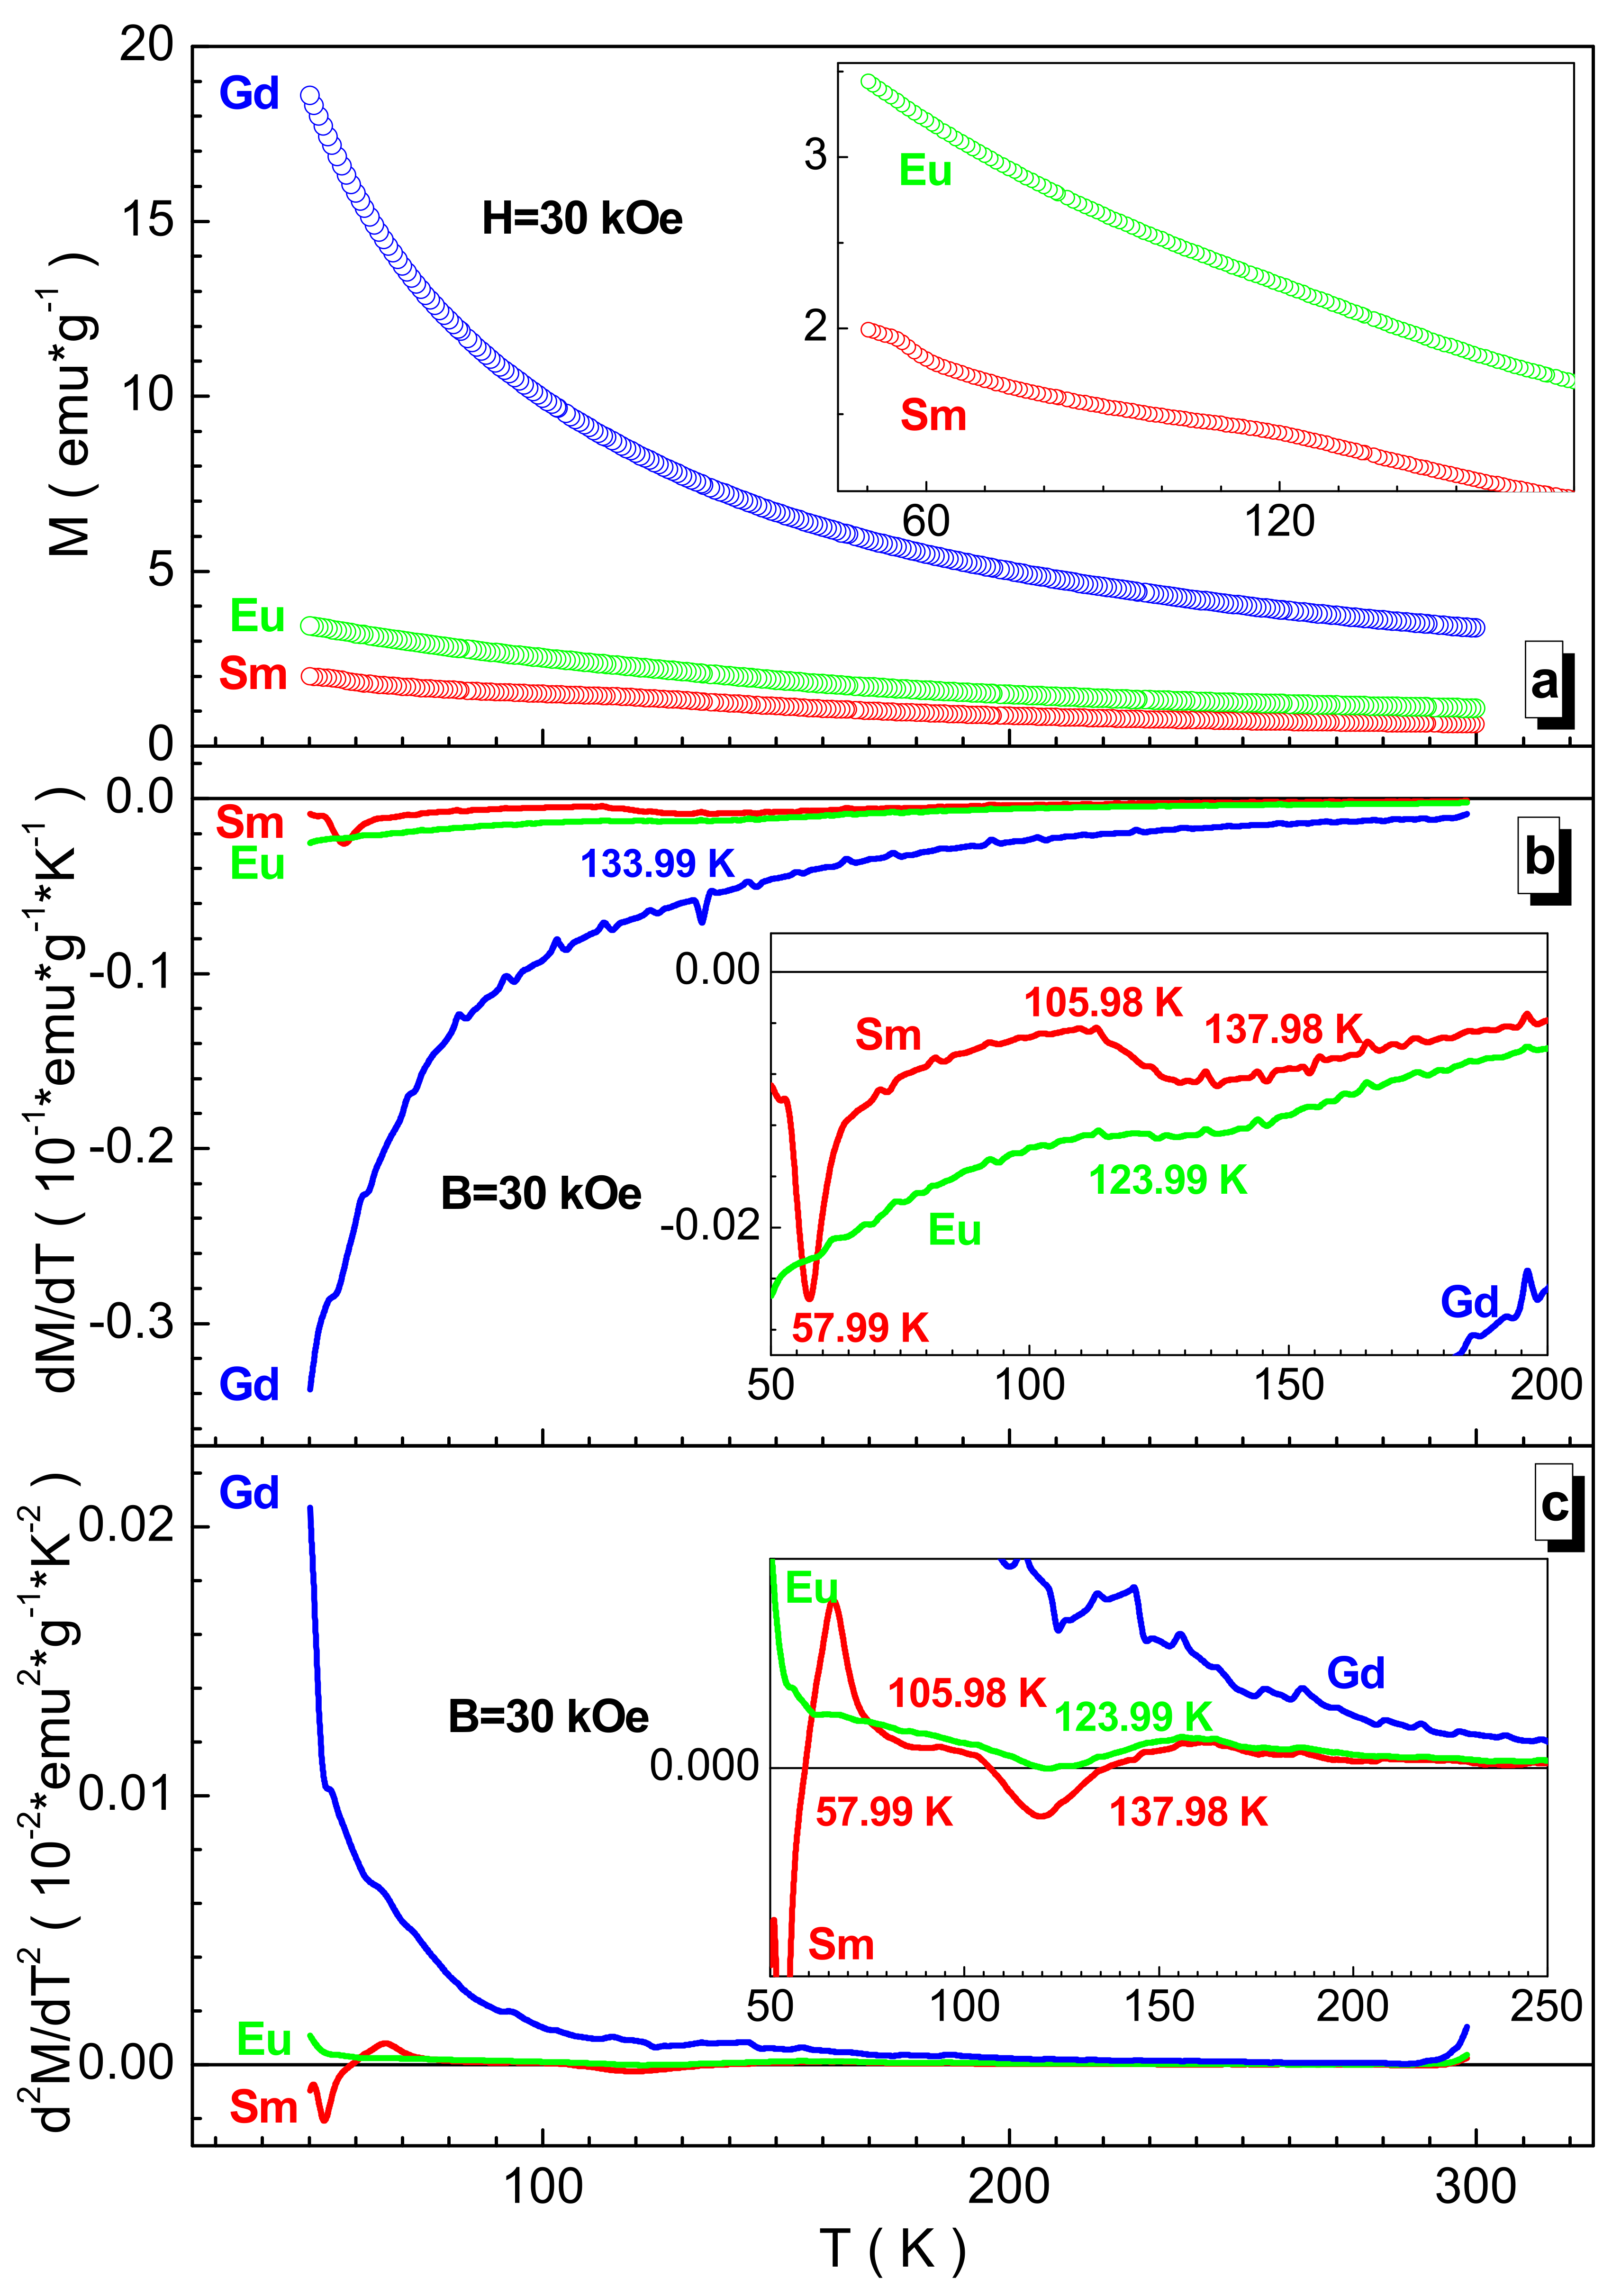
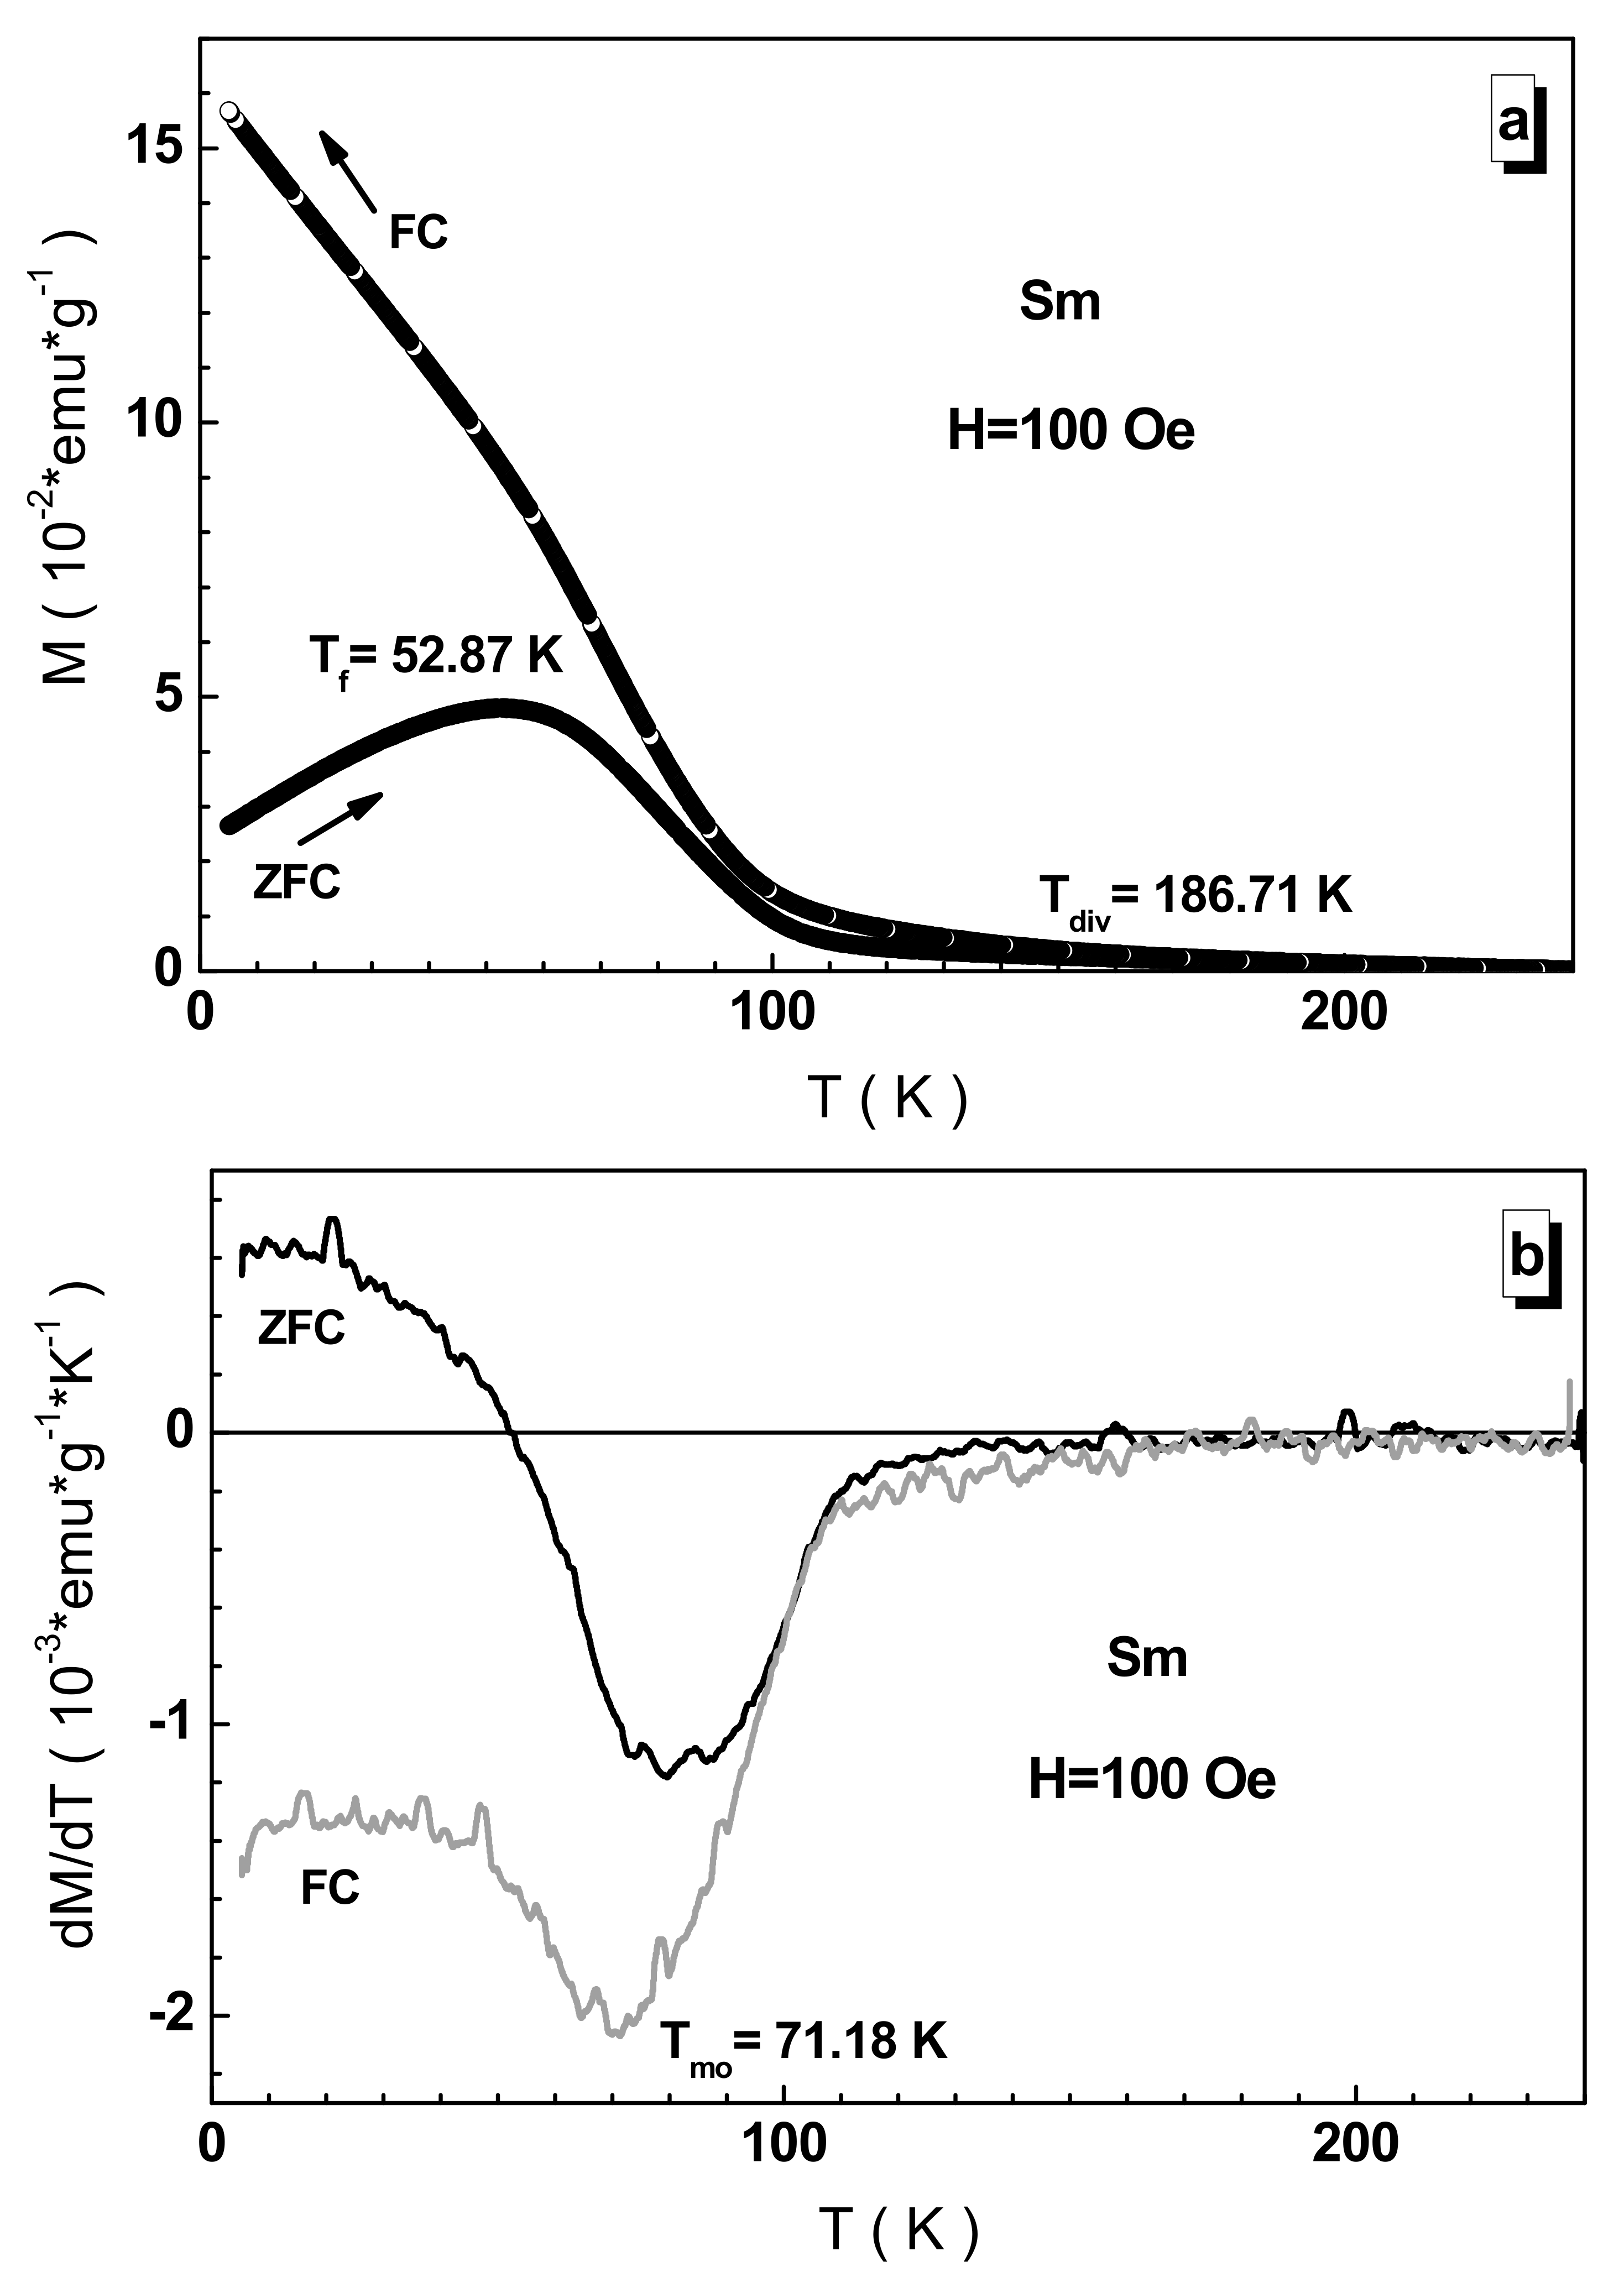
3.3. Magnetic Properties
4. Conclusions
Author Contributions
Funding
Data Availability Statement
Conflicts of Interest
References
- Zener, C. Interaction between thed-shells in the transition metals. II. ferromagnetic compounds of manganese with perovskite structure. Phys. Rev. 1951, 82, 403–405. [Google Scholar] [CrossRef]
- Coey, J.M.D.; Viret, M.; Von Molnár, S. Mixed-valence manganites. Adv. Phys. 1999, 48, 167–293. [Google Scholar] [CrossRef]
- Kubicek, M.; Bork, A.H.; Rupp, J.L.M. Perovskite oxides—A review on a versatile material class for solar-to-fuel conversion processes. J. Mater. Chem. A 2017, 5, 11983–12000. [Google Scholar] [CrossRef]
- Fernández-Posada, C.; Castro, A.; Kiat, J.-M.; Porcher, F.; Peña, O.; Algueró, M.; Amorín, H. A novel perovskite oxide chemically designed to show multiferroic phase boundary with room-temperature magnetoelectricity. Nat. Commun. 2016, 7, 12772. [Google Scholar] [CrossRef]
- Trukhanov, S.V.; Kostishin, V.G.; Panina, L.V.; Kazakevich, I.S.; Turchenko, V.; Kochervinskii, V.V. Coexistence of spontaneous polarization and magnetization in substituted M-type hexaferrites BaFe12–xAlxO19 (x ≤ 1.2) at room temperature. JETP Lett. 2016, 103, 100–105. [Google Scholar] [CrossRef]
- Kostopoulou, A.; Kymakis, E.; Stratakis, E. Perovskite nanostructures for photovoltaic and energy storage devices. J. Mater. Chem. A 2018, 6, 9765–9798. [Google Scholar] [CrossRef]
- Wang, P.-J.; Zhou, D.; Li, J.; Pang, L.-X.; Liu, W.-F.; Su, J.-Z.; Singh, C.; Trukhanov, S.; Trukhanov, A. Significantly enhanced electrostatic energy storage performance of P(VDF-HFP)/BaTiO3-Bi(Li0.5Nb0.5)O3 nanocomposites. Nano Energy 2020, 78, 105247. [Google Scholar] [CrossRef]
- Tokura, Y.; Tomioka, Y.; Kuwahara, H.; Asamitsu, A.; Moritomo, Y.; Kasai, M. Origins of colossal magnetoresistance in perovskite-type manganese oxides (invited). J. Appl. Phys. 1996, 79, 5288–5291. [Google Scholar] [CrossRef]
- Trukhanov, S.V. Magnetic and magnetotransport properties of La1–xBaxMnO3–x/2 perovskite manganites. J. Mater. Chem. 2003, 13, 347–352. [Google Scholar] [CrossRef]
- Trukhanov, S.V.; Troyanchuk, I.O.; Pushkarev, N.V.; Szymczak, H. Magnetic properties of anion-deficient La1−xBaxMnO3−x/2 (0 ≤ x ≤ 0.30) manganites. J. Exp. Theor. Phys. 2003, 96, 110–117. [Google Scholar] [CrossRef]
- Goodenough, J.B. Theory of the role of covalence in the perovskite-type manganites [La, M(II)]MnO3. Phys. Rev. 1955, 100, 564–573. [Google Scholar] [CrossRef] [Green Version]
- Goodenough, J.B. Electronic structure of CMR manganites (invited). J. Appl. Phys. 1997, 81, 5330–5335. [Google Scholar] [CrossRef]
- Cui, C.; Tyson, T.A.; Zhong, Z.; Carlo, J.P.; Qin, Y. Effects of pressure on electron transport and atomic structure of manganites: Low to high pressure regimes. Phys. Rev. B 2003, 67, 104107. [Google Scholar] [CrossRef] [Green Version]
- Yeh, J.-W.; Chen, S.K.; Lin, S.-J.; Gan, J.-Y.; Chin, T.-S.; Shun, T.-T.; Tsau, C.-H.; Chang, S.-Y. Nanostructured high-entropy alloys with multiple principal elements: Novel alloy design concepts and outcomes. Adv. Eng. Mater. 2004, 6, 299–303. [Google Scholar] [CrossRef]
- Cantor, B.; Chang, I.T.H.; Knight, P.; Vincent, A.J.B. Microstructural development in equiatomic multicomponent alloys. Mater. Sci. Eng. A 2004, 375–377, 213–218. [Google Scholar] [CrossRef]
- Sarkar, A.; Wang, Q.; Schiele, A.; Chellali, M.R.; Bhattacharya, S.S.; Wang, D.; Brezesinski, T.; Hahn, H.; Velasco, L.; Breitung, B. High-entropy oxides: Fundamental aspects and electrochemical properties. Adv. Mater. 2019, 31, e1806236. [Google Scholar] [CrossRef] [PubMed]
- McCormack, S.J.; Navrotsky, A. Thermodynamics of high entropy oxides. Acta Mater. 2020, 202, 1–21. [Google Scholar] [CrossRef]
- Vinnik, D.; Trukhanov, A.; Podgornov, F.; Trofimov, E.; Zhivulin, V.; Starikov, A.; Zaitseva, O.; Gudkova, S.; Kirsanova, A.; Taskaev, S.; et al. Correlation between entropy state, crystal structure, magnetic and electrical properties in M-type Ba-hexaferrites. J. Eur. Ceram. Soc. 2020, 40, 4022–4028. [Google Scholar] [CrossRef]
- Akrami, S.; Edalati, P.; Fuji, M.; Edalati, K. High-entropy ceramics: Review of principles, production and applications. Mater. Sci. Eng. R Rep. 2021, 146, 100644. [Google Scholar] [CrossRef]
- Musicó, B.L.; Gilbert, D.; Ward, T.Z.; Page, K.; George, E.; Yan, J.; Mandrus, D.; Keppens, V. The emergent field of high entropy oxides: Design, prospects, challenges, and opportunities for tailoring material properties. APL Mater. 2020, 8, 040912. [Google Scholar] [CrossRef] [Green Version]
- Sarkar, A.; Breitung, B.; Hahn, H. High entropy oxides: The role of entropy, enthalpy and synergy. Scr. Mater. 2020, 187, 43–48. [Google Scholar] [CrossRef]
- Zhivulin, V.; Trofimov, E.; Gudkova, S.; Pashkeev, I.; Punda, A.; Gavrilyak, M.; Zaitseva, O.; Taskaev, S.; Podgornov, F.; Darwish, M.; et al. Polysubstituted high-entropy [LaNd](Cr0.2Mn0.2Fe0.2Co0.2Ni0.2)O3 perovskites: Correlation of the electrical and magnetic properties. Nanomaterials 2021, 11, 1014. [Google Scholar] [CrossRef]
- Vinnik, D.A.; Trofimov, E.A.; Zhivulin, V.E.; Gudkova, S.A.; Zaitseva, O.V.; Zherebtsov, D.A.; Starikov, A.Y.; Sherstyuk, D.P.; Amirov, A.A.; Kalgin, A.V.; et al. High entropy oxide phases with perovskite structure. Nanomaterials 2020, 10, 268. [Google Scholar] [CrossRef] [Green Version]
- Trukhanov, S.V.; Bushinsky, M.V.; Troyanchuk, I.O.; Szymczak, H. Magnetic ordering in La1−xSrxMnO3−x/2 anion-deficient manganites. J. Exp. Theor. Phys. 2004, 99, 756–765. [Google Scholar] [CrossRef]
- Dang, N.; Zakhvalinskii, V.; Kozlenko, D.; Phan, T.-L.; Kichanov, S.; Trukhanov, S.; Nekrasova, Y.; Taran, S.; Ovsyannikov, S.; Jabarov, S.; et al. Effect of Fe doping on structure, magnetic and electrical properties La0.7Ca0.3Mn0.5Fe0.5O3 manganite. Ceram. Int. 2018, 44, 14974–14979. [Google Scholar] [CrossRef]
- Trukhanov, S.V.; Dang, N.T.; Zakhvalinskii, V.S.; Kozlenko, D.P.; Phan, T.-L.; Kichanov, S.; Ovsyannikov, S.V.; Jabarov, S.H.; Trukhanova, E.L.; Vinnik, D.; et al. Magnetotransport properties and phase separation in iron substituted lanthanum-calcium manganite. Mater. Res. Express 2018, 5, 086108. [Google Scholar] [CrossRef]
- Rietveld, H.M. A profile refinement method for nuclear and magnetic structures. J. Appl. Crystallogr. 1969, 2, 65–71. [Google Scholar] [CrossRef]
- Rodríguez-Carvajal, J. Recent advances in magnetic structure determination by neutron powder diffraction. Phys. B Condens. Matter. 1993, 192, 55–69. [Google Scholar] [CrossRef]
- Turchenko, V.A.; Trukhanov, S.V.; Kostishin, V.G.; Damay, F.; Porcher, F.; Klygach, D.S.; Vakhitov, M.G.; Lyakhov, D.; Michels, D.; Bozzo, B.; et al. Features of structure, magnetic state and electrodynamic performance of SrFe12−xInxO19. Sci. Rep. 2021, 11, 1–14. [Google Scholar] [CrossRef]
- Trukhanov, S.V. Peculiarities of the magnetic state in the system La0.70Sr0.30MnO3−γ (0 ≤ γ ≤ 0.25). J. Exp. Theor. Phys. 2005, 100, 95–105. [Google Scholar] [CrossRef]
- Grössinger, R. Correlation between the inhomogeneity and the magnetic anisotropy in polycrystalline ferromagnetic materials. J. Magn. Magn. Mater. 1982, 28, 137–142. [Google Scholar] [CrossRef]
- Trukhanov, S.; Trukhanov, A.V.; Szymczak, H. Effect of magnetic fields on magnetic phase separation in anion-deficient manganite La0.70Sr0.30MnO2.85. Low Temp. Phys. 2011, 37, 465. [Google Scholar] [CrossRef]
- Trukhanov, S.V.; Vasiliev, A.; Balagurov, A.M.; Szymczak, H. Magnetic state of the structural separated anion-deficient La0.70Sr0.30MnO2.85 manganite. J. Exp. Theor. Phys. 2011, 113, 819–825. [Google Scholar] [CrossRef]
- Goodenough, J.B.; Wold, A.; Arnott, R.J.; Menyuk, N. Relationship between crystal symmetry and magnetic properties of ionic compounds containing Mn3+. Phys. Rev. 1961, 124, 373–384. [Google Scholar] [CrossRef]
- Topkaya, R. Effect of composition and temperature on the magnetic properties of BaBixLaxFe(12-2x)O19 (0.0 ≤ x ≤ 0.2) hexaferrites. Appl. Phys. A 2017, 123, 488. [Google Scholar] [CrossRef]
- Da Silva, C.A.; Silva, R.S.; Plaza, E.J.R.; Moreno, N.O. Magnetic state and magnetocaloric effect of SmMnO3. J. Supercond. Nov. Magn. 2013, 26, 2497–2499. [Google Scholar] [CrossRef]
- Cao, S.; Zhao, H.; Kang, B.; Zhang, J.; Ren, W. Temperature induced spin switching in SmFeO3 single crystal. Sci. Rep. 2015, 4, srep05960. [Google Scholar] [CrossRef] [Green Version]
- Marshall, L.G.; Cheng, J.; Zhou, J.-S.; Goodenough, J.B.; Yan, J.; Mandrus, D.G. Magnetic coupling between Sm3+ and the canted spin in an antiferromagnetic SmFeO3 single crystal. Phys. Rev. B 2012, 86, 064417. [Google Scholar] [CrossRef] [Green Version]
- Pinho, S.L.C.; Amaral, J.S.; Wattiaux, A.; Duttine, M.; Delville, M.; Geraldes, C.F.G.C. Synthesis and characterization of rare-earth Orthoferrite LnFeO3 nanoparticles for bioimaging. Eur. J. Inorg. Chem. 2018, 2018, 3570–3578. [Google Scholar] [CrossRef]
- Lone, I.; Aslam, J.; Radwan, N.R.E.; Bashal, A.H.; Ajlouni, A.F.A.; Akhter, A. Multiferroic ABO3 transition metal Oxides: A rare interaction of ferroelectricity and magnetism. Nanoscale Res. Lett. 2019, 14, 1–12. [Google Scholar] [CrossRef]
- Kimura, T.; Ishihara, S.; Shintani, H.; Arima, T.-H.; Takahashi, K.T.; Ishizaka, K.; Tokura, Y. Distorted perovskite with configuration as a frustrated spin system. Phys. Rev. B 2003, 68, 060403. [Google Scholar] [CrossRef] [Green Version]
- Choi, E.-M.; Maity, T.; Kursumovic, A.; Lu, P.; Bi, Z.; Yu, S.; Park, Y.; Zhu, B.; Wu, R.; Gopalan, V.; et al. Nanoengineering room temperature ferroelectricity into orthorhombic SmMnO3 films. Nat. Commun. 2020, 11, 2207–2209. [Google Scholar] [CrossRef] [PubMed]
- Shimamoto, K.; Mukherjee, S.; Bingham, N.S.; Suszka, A.K.; Lippert, T.; Niedermayer, C.; Schneider, C.W. Single-axis-dependent structural and multiferroic properties of orthorhombic RMnO3 (R = Gd–Lu). Phys. Rev. B 2017, 95, 184105. [Google Scholar] [CrossRef] [Green Version]
- Kokila, I.P.; Kanagaraj, M.; Kumar, P.S.; Peter, S.C.; Sekar, C.; Therese, H.A. Structural, magnetic and magnetocaloric properties of EuMnO3 perovskite manganite: A comprehensive MCE study. Mater. Res. Express 2018, 5, 026107. [Google Scholar] [CrossRef]
- Modi, A.; Thakur, R.K.; Thakur, R.; Gaur, N.K. Magnetic transport behavior of multiferroic GdMnO3. AIP Conf. Proc. 2015, 1661, 060003. [Google Scholar] [CrossRef]
- Capon, F.; Boileau, A.; Carteret, C.; Martin, N.; Boulet, P.; Pierson, J.F. Cation size effect on the thermochromic properties of rare earth cobaltites RECoO3 (RE: La, Nd, Sm). J. Appl. Phys. 2013, 114, 113510. [Google Scholar] [CrossRef]
- Vasil’Chikova, T.N.; Kuz’Mova, T.G.; Kamenev, A.A.; Kaul’, A.R.; Vasil’Ev, A.N. Spin states of cobalt and the thermodynamics of Sm1−xCaxCoO3−δ solid solutions. JETP Lett. 2013, 97, 34–37. [Google Scholar] [CrossRef]
- Olsson, E.; Aparicio-Anglès, X.; De Leeuw, N.H. A DFT+U study of the structural, electronic, magnetic, and mechanical properties of cubic and orthorhombic SmCoO3. J. Chem. Phys. 2016, 145, 224704. [Google Scholar] [CrossRef] [Green Version]
- Ivanova, N.B.; Kazak, N.V.; Michel, C.; Balaev, A.D.; Ovchinnikov, S.G. Low-temperature magnetic behavior of the rare-earth cobaltites GdCoO3 and SmCoO3. Phys. Solid State 2007, 49, 2126–2131. [Google Scholar] [CrossRef]
- Tripathi, M.; Choudhary, R.J.; Phase, D.M.; Chatterji, T.; Fischer, H.E. Evolution of magnetic phases in SmCrO3: A neutron diffraction and magnetometric study. Phys. Rev. B 2017, 96, 174421. [Google Scholar] [CrossRef]
- Oliveira, G.N.P.; Teixeira, R.C.; Moreira, R.P.; Correia, J.G.; Araújo, J.P.; Lopes, A.M.L. Local inhomogeneous state in multiferroic SmCrO3. Sci. Rep. 2020, 10, 4686–4712. [Google Scholar] [CrossRef]
- Demazeau, G.; Marbeuf, A.; Pouchard, M.; Hagenmuller, P. Sur une série de composés oxygènes du nickel trivalent derivés de la perovskite. J. Solid State Chem. 1971, 3, 582–589. [Google Scholar] [CrossRef]
- Girardot, C.; Pignard, S.; Weiss, F.; Kreisel, J. SmNiO3/NdNiO3 thin film multilayers. Appl. Phys. Lett. 2011, 98, 241903. [Google Scholar] [CrossRef] [Green Version]
- Medarde, M.L. Structural, magnetic and electronic properties of RNiO3 perovskites (R = rare earth). J. Phys. Condens. Matter 1997, 9, 1679–1707. [Google Scholar] [CrossRef]
- Bean, C.P.; Livingston, J.D. Superparamagnetism. J. Appl. Phys. 1959, 30, S120–S129. [Google Scholar] [CrossRef]
- Troyanchuk, I.; Khalyavin, D.D.; Trukhanov, S.V.; Szymczak, H. Magnetic phase diagrams of the manganites Ln1-xBaxMnO3 (Ln = Nd, Sm). J. Phys. Condens. Matter 1999, 11, 8707–8717. [Google Scholar] [CrossRef]
- Troyanchuk, I.; Khalyavin, D.D.; Trukhanov, S.V.; Szymczak, H.; Nabialek, A. Magnetotransport properties of the Sm0.56(Sr0.44-xMex)MnO3 (Me = Ba, Ca, Cd) perovskites. J. Phys. Condens. Matter 1999, 11, 8913–8920. [Google Scholar] [CrossRef]
- Almessiere, M.A.; Slimani, Y.; Güngüneş, H.; Korkmaz, A.D.; Zubar, T.; Trukhanov, S.; Trukhanov, A.; Manikandan, A.; Alahmari, F.; Baykal, A. Influence of Dy3+ Ions on the microstructures and magnetic, electrical, and microwave properties of [Ni0.4Cu0.2Zn0.4](Fe2–xDyx)O4 (0.00 ≤ x ≤ 0.04) spinel ferrites. ACS Omega 2021, 6, 10266–10280. [Google Scholar] [CrossRef]
- Herbst, J.F.; Pinkerton, F.E. Law of approach to saturation for polycrystalline ferromagnets: Remanent initial state. Phys. Rev. B 1998, 57, 10733–10739. [Google Scholar] [CrossRef]
- Shlimas, D.I.; Kozlovskiy, A.L.; Zdorovets, M.V. Study of the formation effect of the cubic phase of LiTiO2 on the structural, optical, and mechanical properties of Li2±xTi1±xO3 ceramics with different contents of the X component. J. Mater. Sci. Mater. Electron. 2021, 32, 7410–7422. [Google Scholar] [CrossRef]
- Kozlovskiy, A.L.; Shlimas, D.I.; Zdorovets, M.V. Synthesis, structural properties and shielding efficiency of glasses based on TeO2-(1-x)ZnO-xSm2O3. J. Mater. Sci. Mater. Electron. 2021, 32, 12111–12120. [Google Scholar] [CrossRef]
- Kozlovskiy, A.; Egizbek, K.; Zdorovets, M.V.; Ibragimova, M.; Shumskaya, A.; Rogachev, A.A.; Ignatovich, Z.V.; Kadyrzhanov, K. Evaluation of the efficiency of detection and capture of manganese in aqueous solutions of FeCeOx nanocomposites doped with Nb2O5. Sensors 2020, 20, 4851. [Google Scholar] [CrossRef] [PubMed]
- Zdorovets, M.V.; Kozlovskiy, A.L.; Shlimas, D.I.; Borgekov, D.B. Phase transformations in FeCo–Fe2CoO4/Co3O4-spinel nanostructures as a result of thermal annealing and their practical application. J. Mater. Sci. Mater. Electron. 2021, 32, 16694–16705. [Google Scholar] [CrossRef]
- Kozlovskiy, A.L.; Zdorovets, M.V. Synthesis, structural, strength and corrosion properties of thin films of the type CuX (X = Bi, Mg, Ni). J. Mater. Sci. Mater. Electron. 2019, 30, 11819–11832. [Google Scholar] [CrossRef]
- Zhumatayeva, I.Z.; Kenzhina, I.E.; Kozlovskiy, A.L.; Zdorovets, M.V. The study of the prospects for the use of Li0.15Sr0.85TiO3 ceramics. J. Mater. Sci. Mater. Electron. 2020, 31, 6764–6772. [Google Scholar] [CrossRef]
- Kozlovskiy, A.L.; Zdorovets, M.V. Effect of doping of Ce4+/3+ on optical, strength and shielding properties of (0.5-x)TeO2-0.25MoO-0.25Bi2O3-xCeO2 glasses. Mater. Chem. Phys. 2021, 263, 124444. [Google Scholar] [CrossRef]


Publisher’s Note: MDPI stays neutral with regard to jurisdictional claims in published maps and institutional affiliations. |
© 2021 by the authors. Licensee MDPI, Basel, Switzerland. This article is an open access article distributed under the terms and conditions of the Creative Commons Attribution (CC BY) license (https://creativecommons.org/licenses/by/4.0/).
Share and Cite
Vinnik, D.A.; Zhivulin, V.E.; Trofimov, E.A.; Gudkova, S.A.; Punda, A.Y.; Valiulina, A.N.; Gavrilyak, M.; Zaitseva, O.V.; Taskaev, S.V.; Khandaker, M.U.; et al. A-Site Cation Size Effect on Structure and Magnetic Properties of Sm(Eu,Gd)Cr0.2Mn0.2Fe0.2Co0.2Ni0.2O3 High-Entropy Solid Solutions. Nanomaterials 2022, 12, 36. https://doi.org/10.3390/nano12010036
Vinnik DA, Zhivulin VE, Trofimov EA, Gudkova SA, Punda AY, Valiulina AN, Gavrilyak M, Zaitseva OV, Taskaev SV, Khandaker MU, et al. A-Site Cation Size Effect on Structure and Magnetic Properties of Sm(Eu,Gd)Cr0.2Mn0.2Fe0.2Co0.2Ni0.2O3 High-Entropy Solid Solutions. Nanomaterials. 2022; 12(1):36. https://doi.org/10.3390/nano12010036
Chicago/Turabian StyleVinnik, Denis A., Vladimir E. Zhivulin, Evgeny A. Trofimov, Svetlana A. Gudkova, Alexander Yu. Punda, Azalia N. Valiulina, Maksim Gavrilyak, Olga V. Zaitseva, Sergey V. Taskaev, Mayeen Uddin Khandaker, and et al. 2022. "A-Site Cation Size Effect on Structure and Magnetic Properties of Sm(Eu,Gd)Cr0.2Mn0.2Fe0.2Co0.2Ni0.2O3 High-Entropy Solid Solutions" Nanomaterials 12, no. 1: 36. https://doi.org/10.3390/nano12010036