Sustainable One-Step Solid-State Synthesis of Antibacterially Active Silver Nanoparticles Using Mechanochemistry

 , , ,
, , ,
Abstract
:
1. Introduction
2. Materials and Methods
2.1. Materials
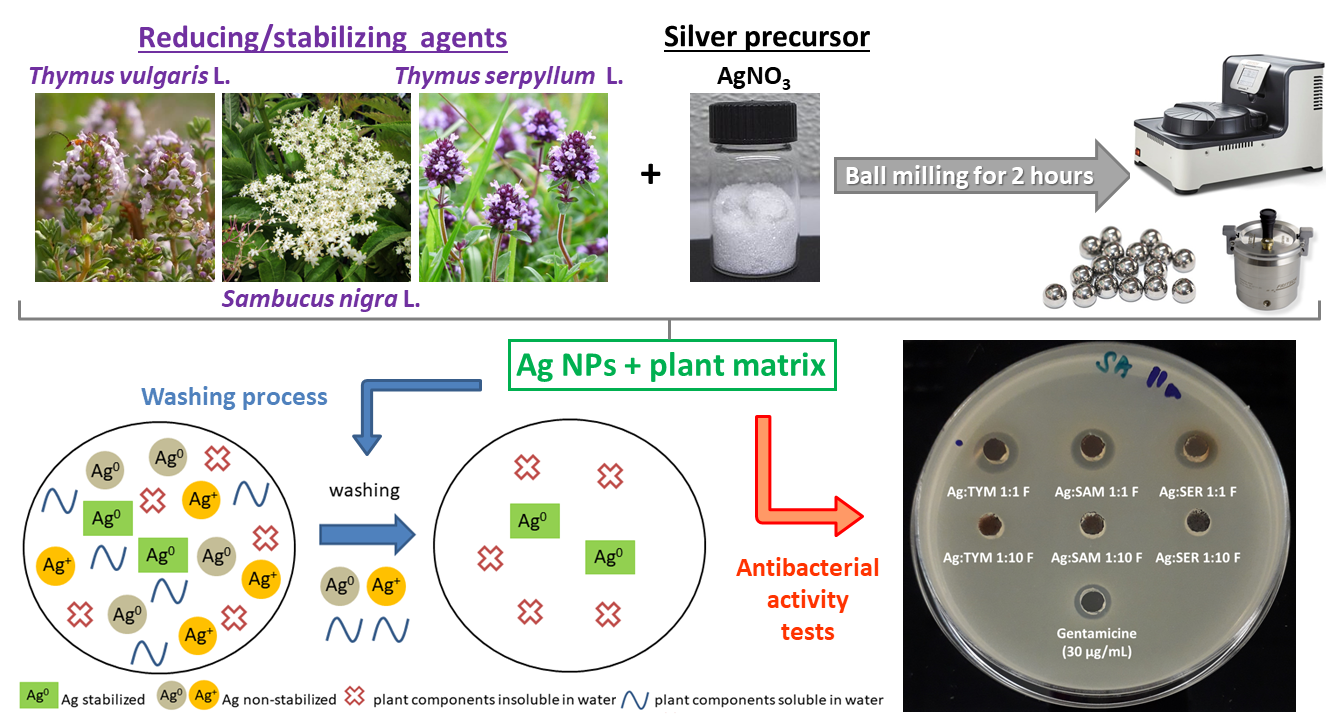
2.2. Mechanochemical Synthesis
2.3. Characterization
2.4. Antibacterial Activity
3. Results and Discussion
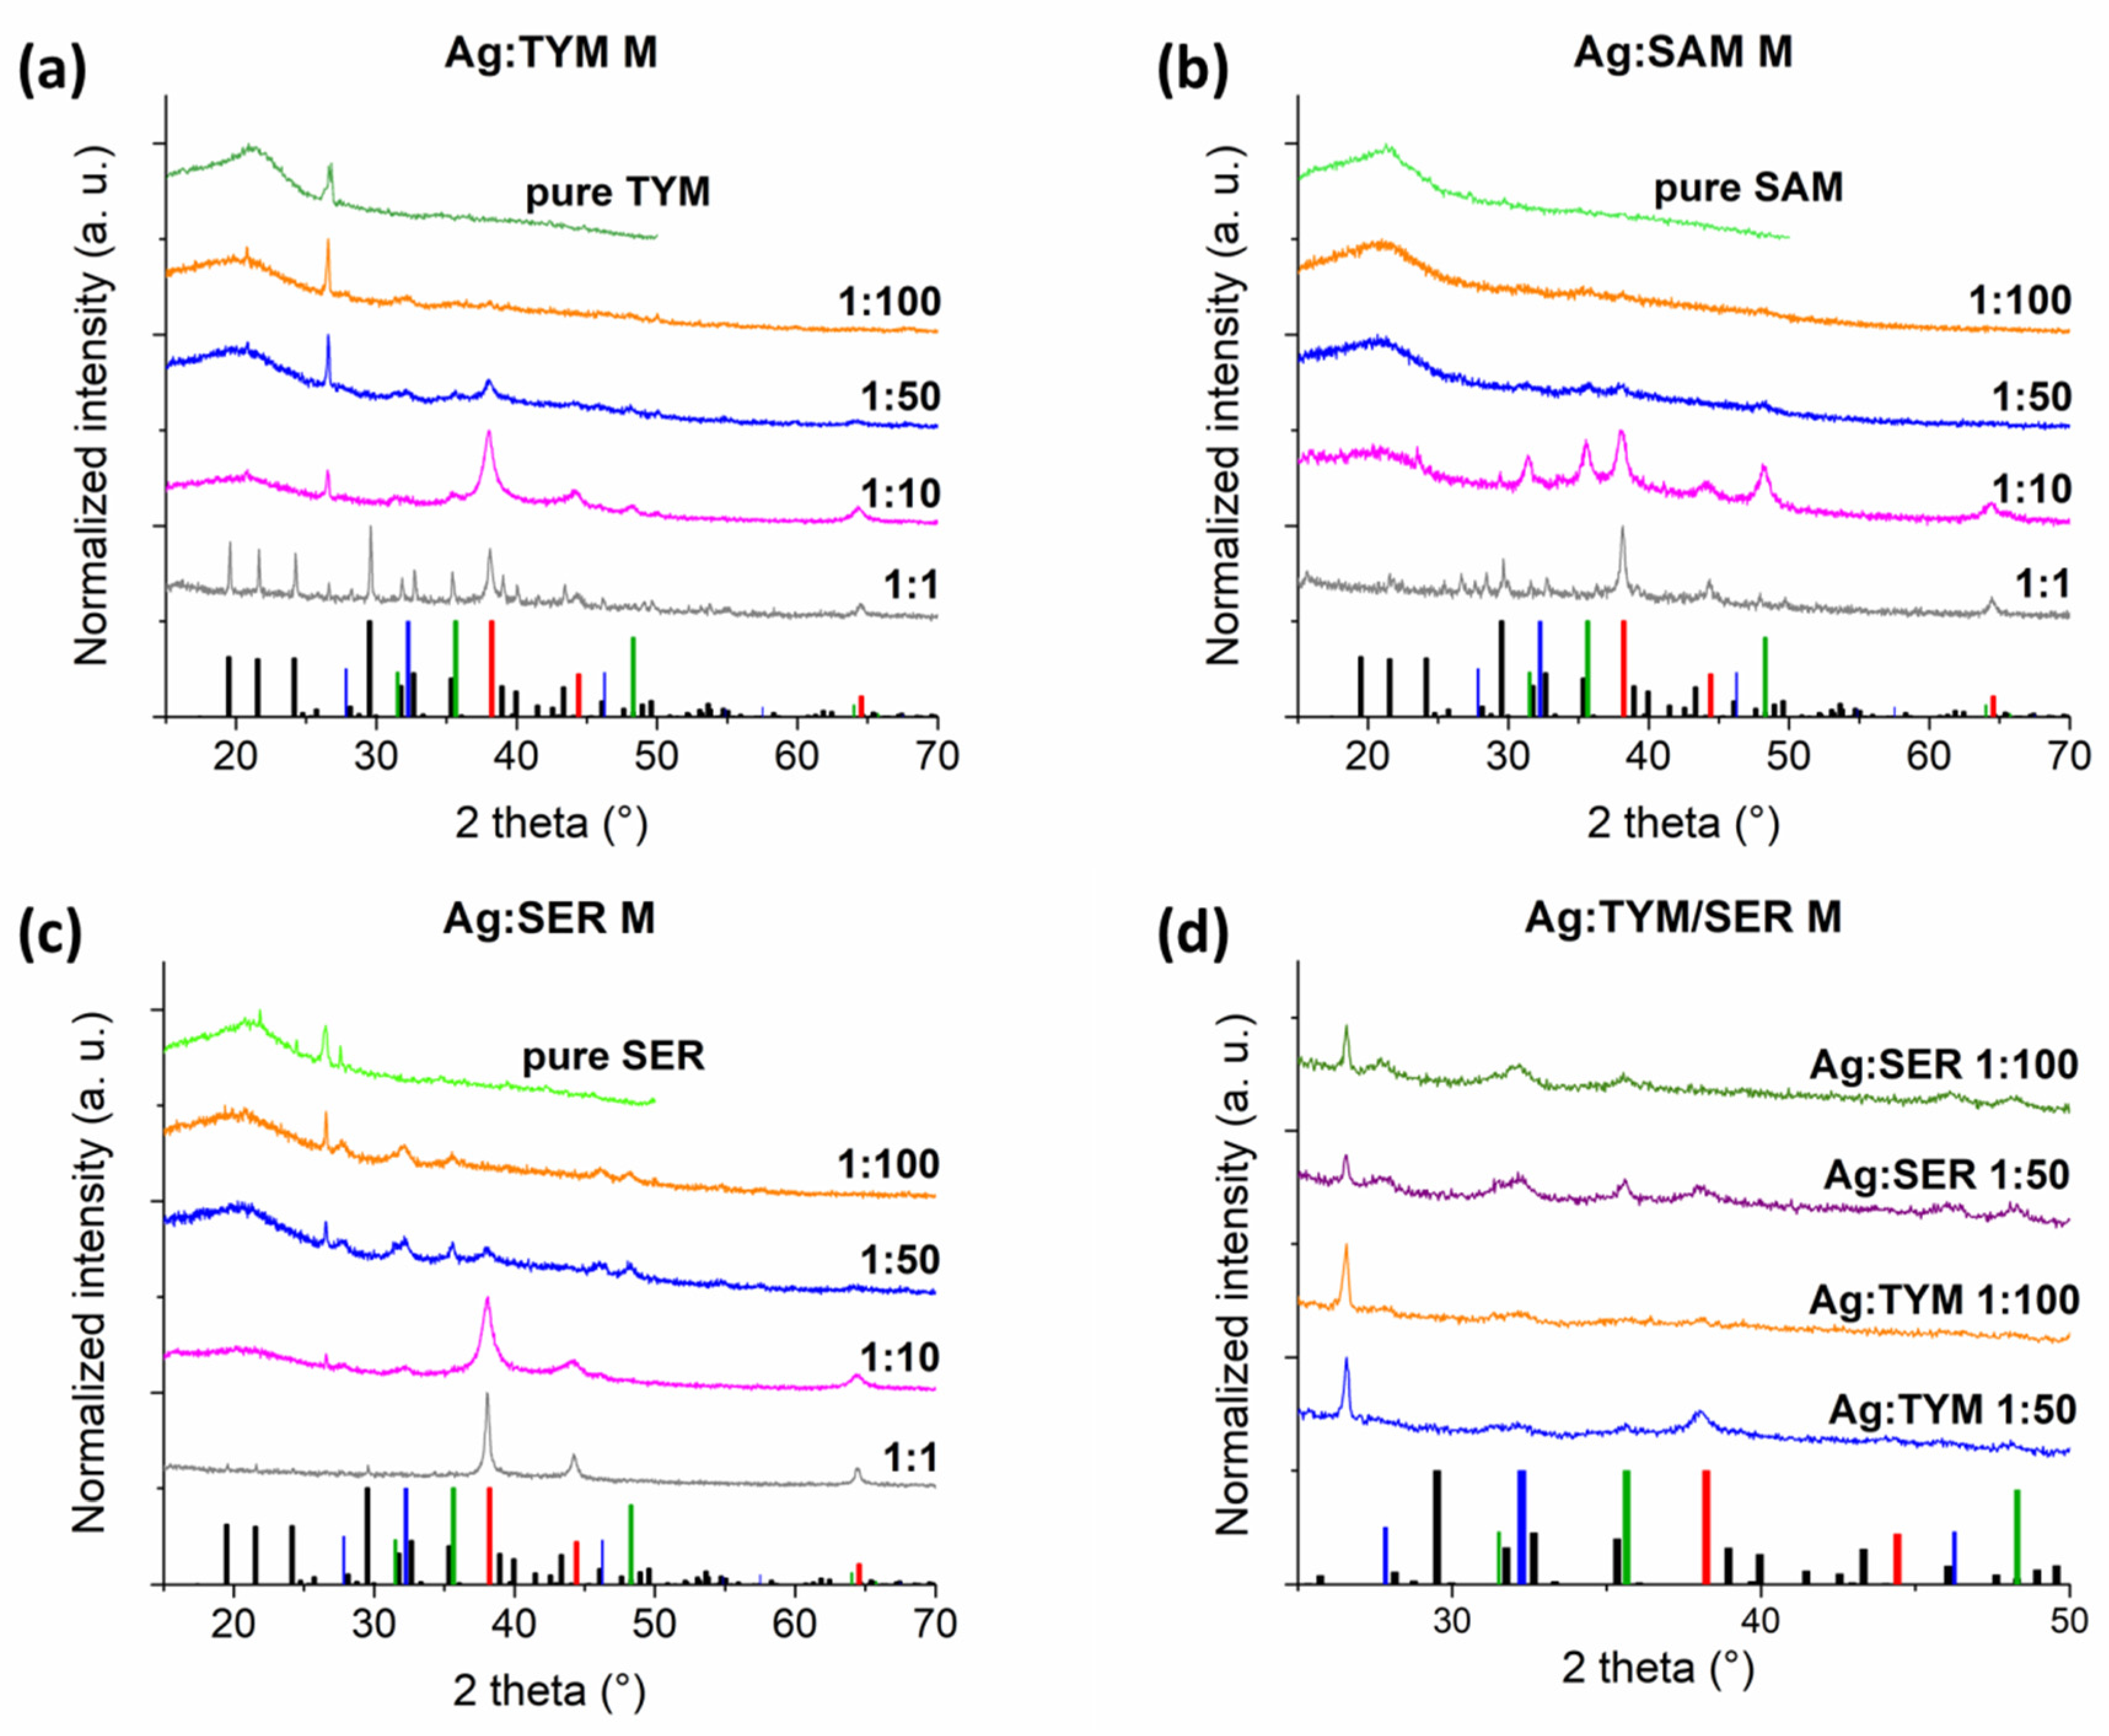
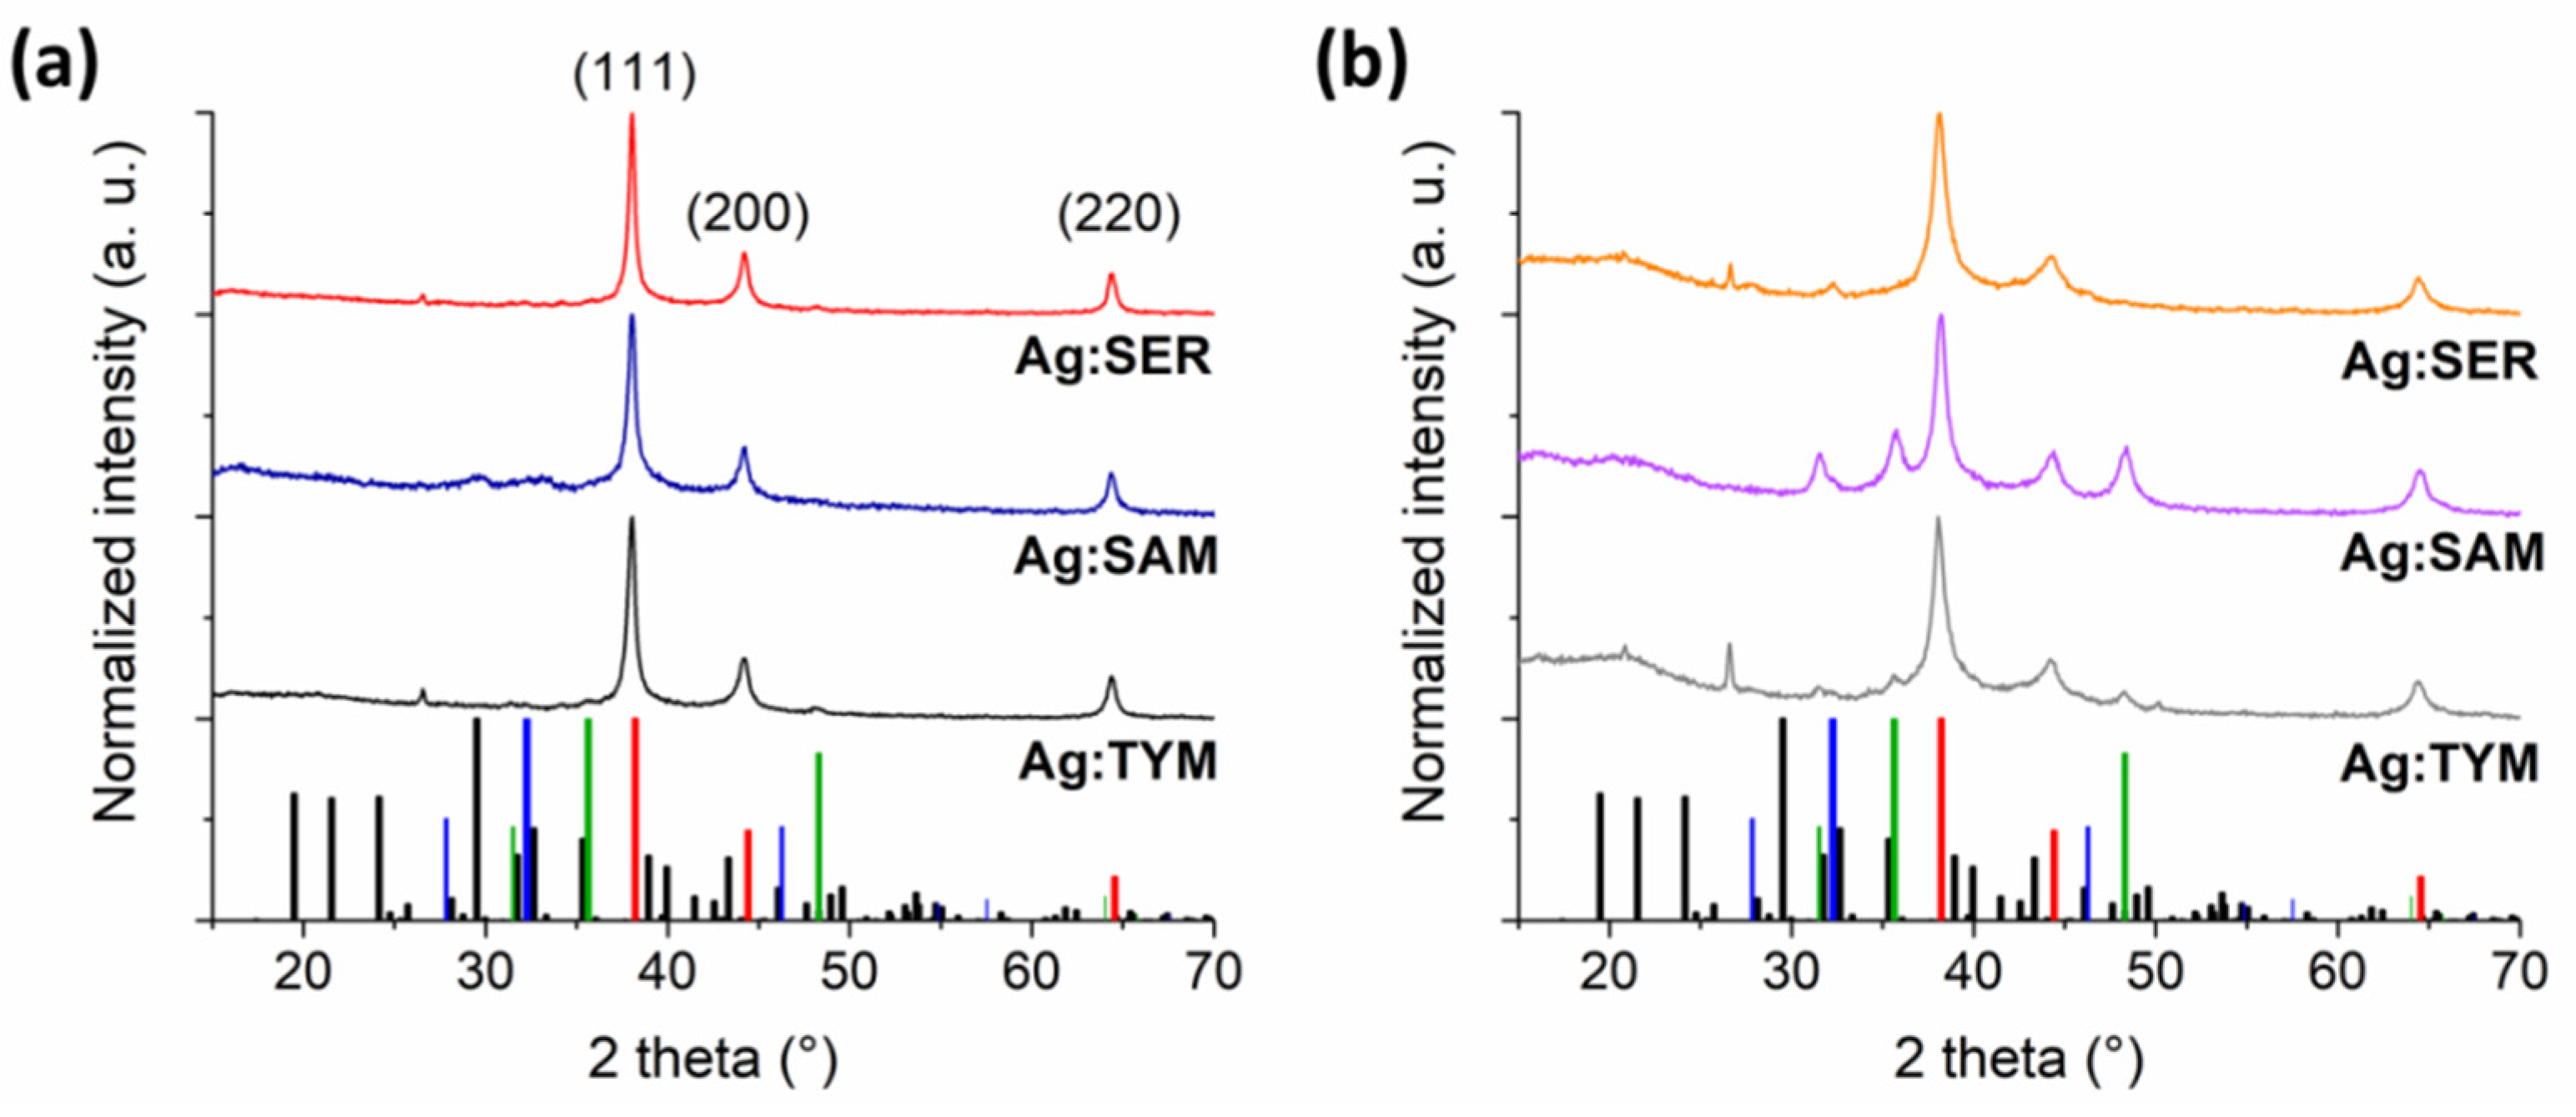
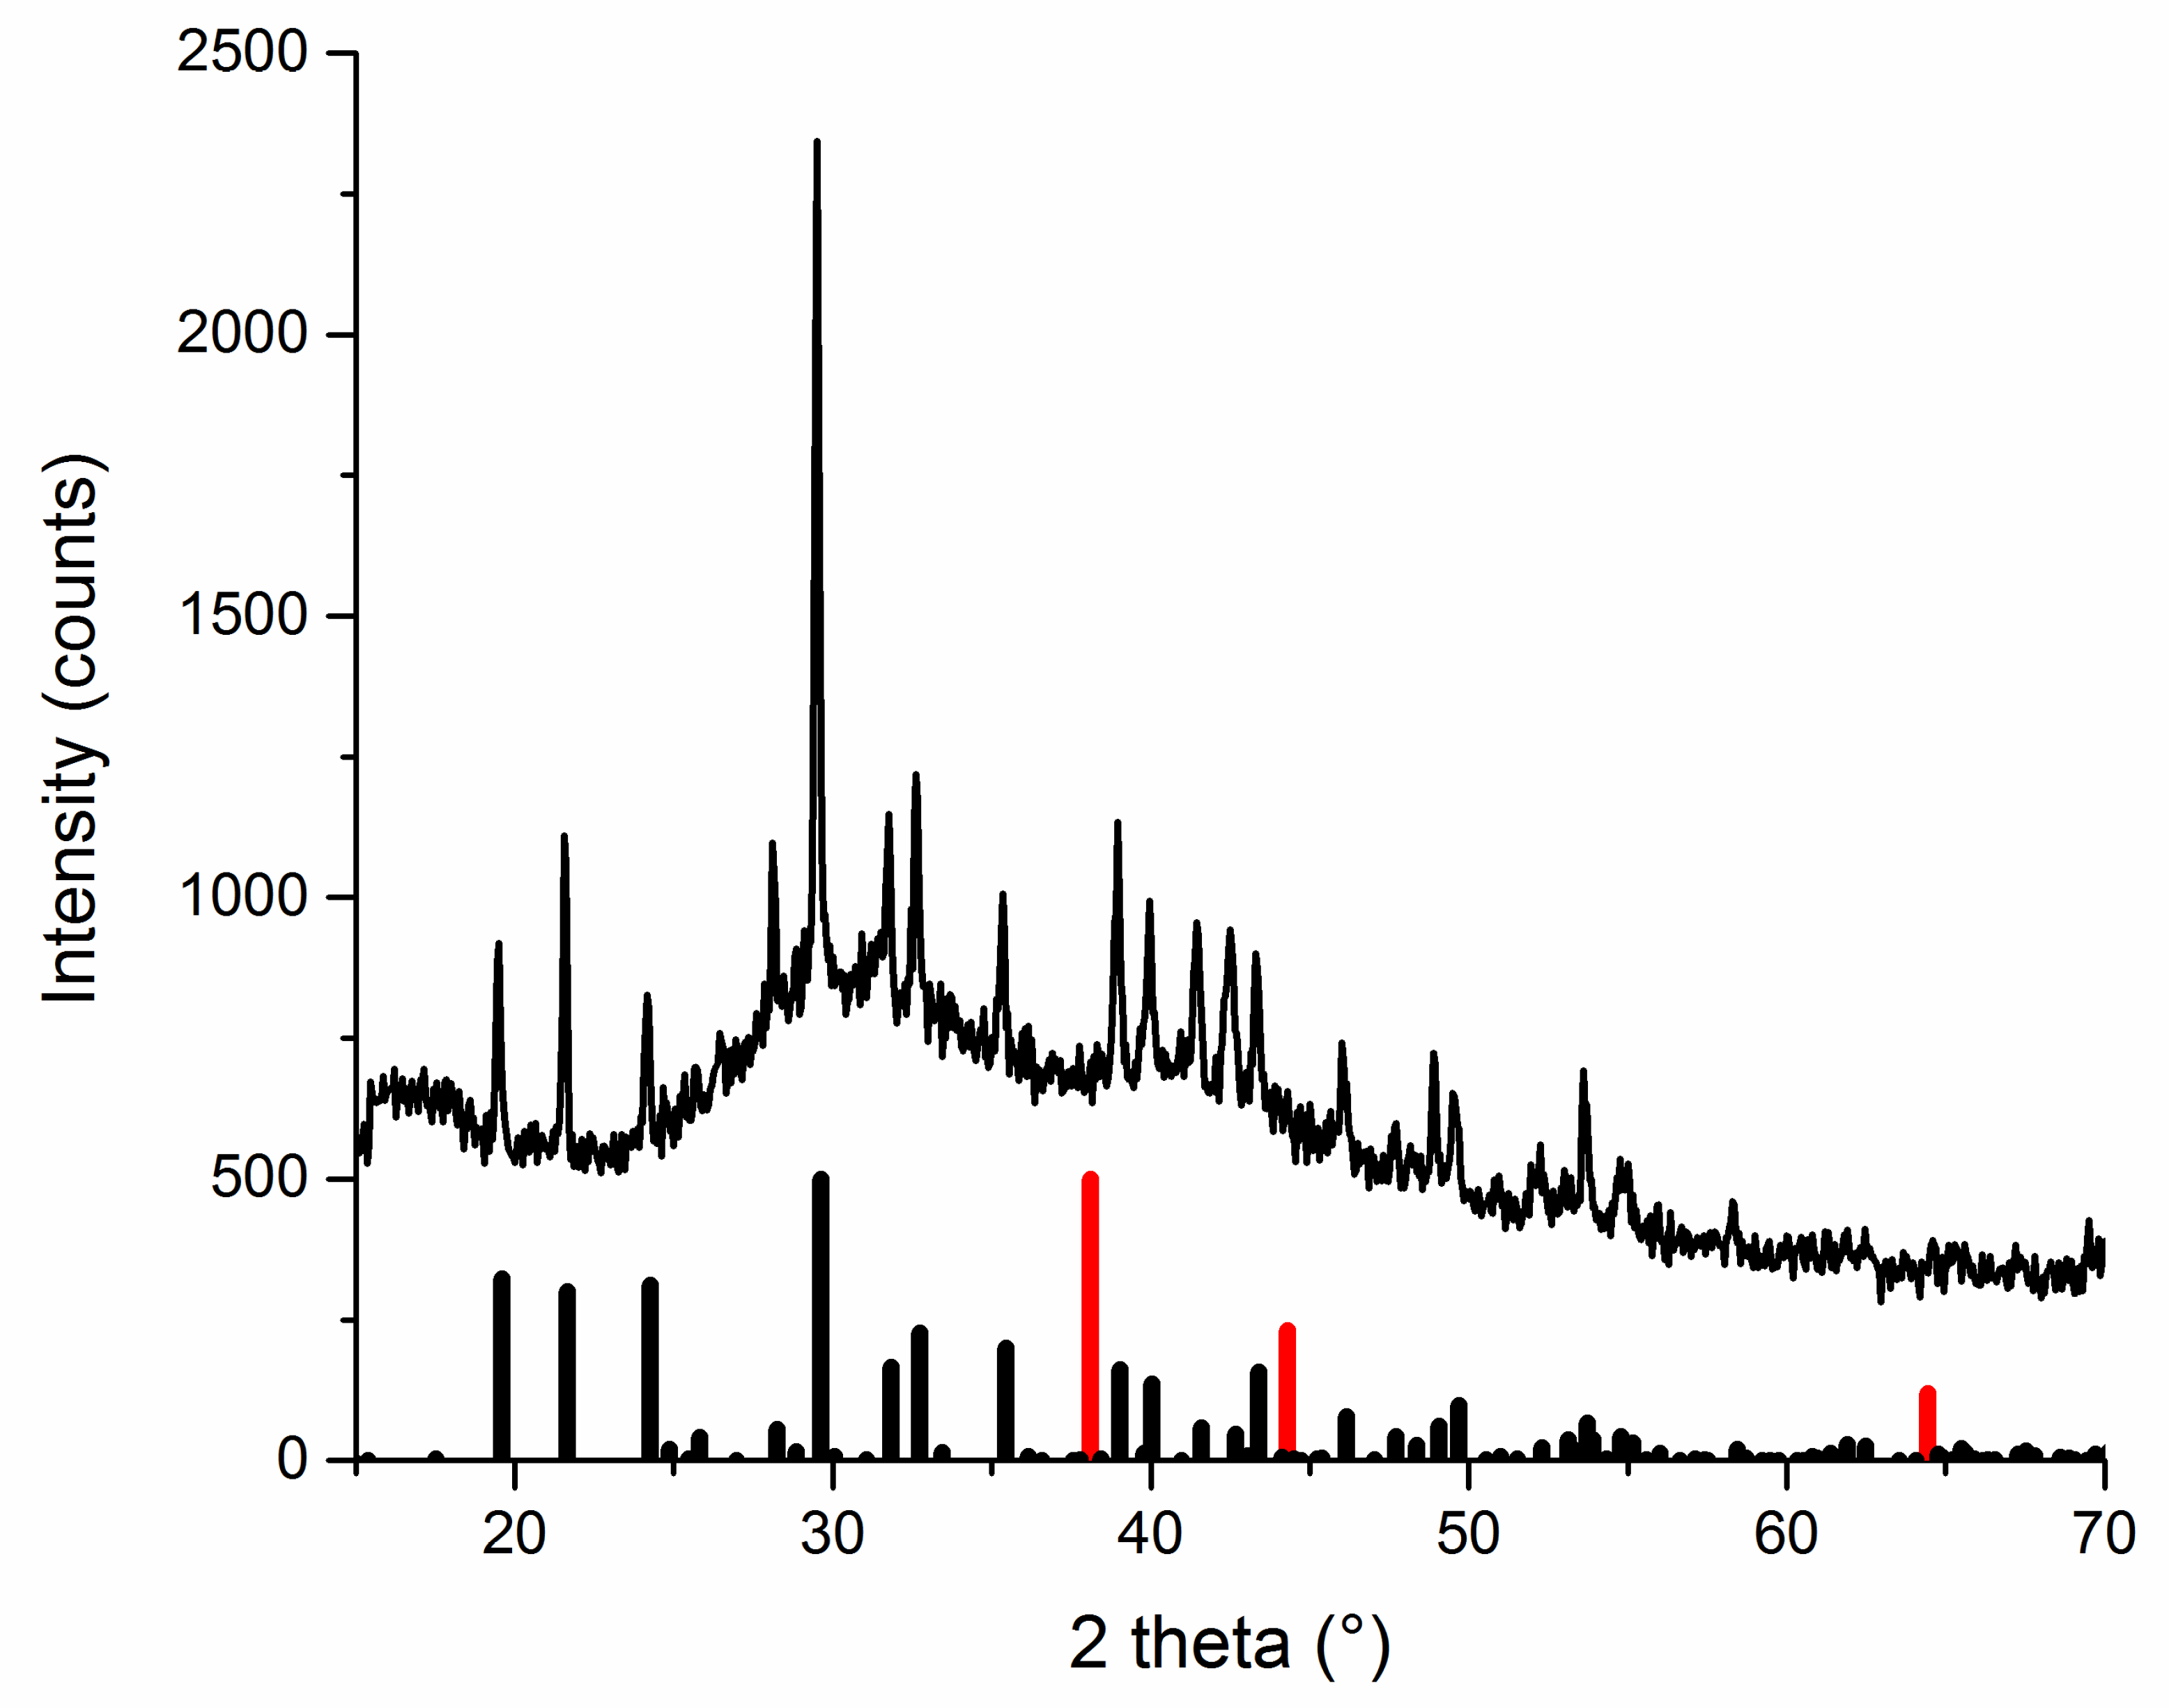
3.1. X-ray Diffraction Analysis
3.1.1. As-Received Powders
3.1.2. Washed Powders Subjected to Rietveld Refinement
3.2. Atomic Absorption Spectrometry Analysis
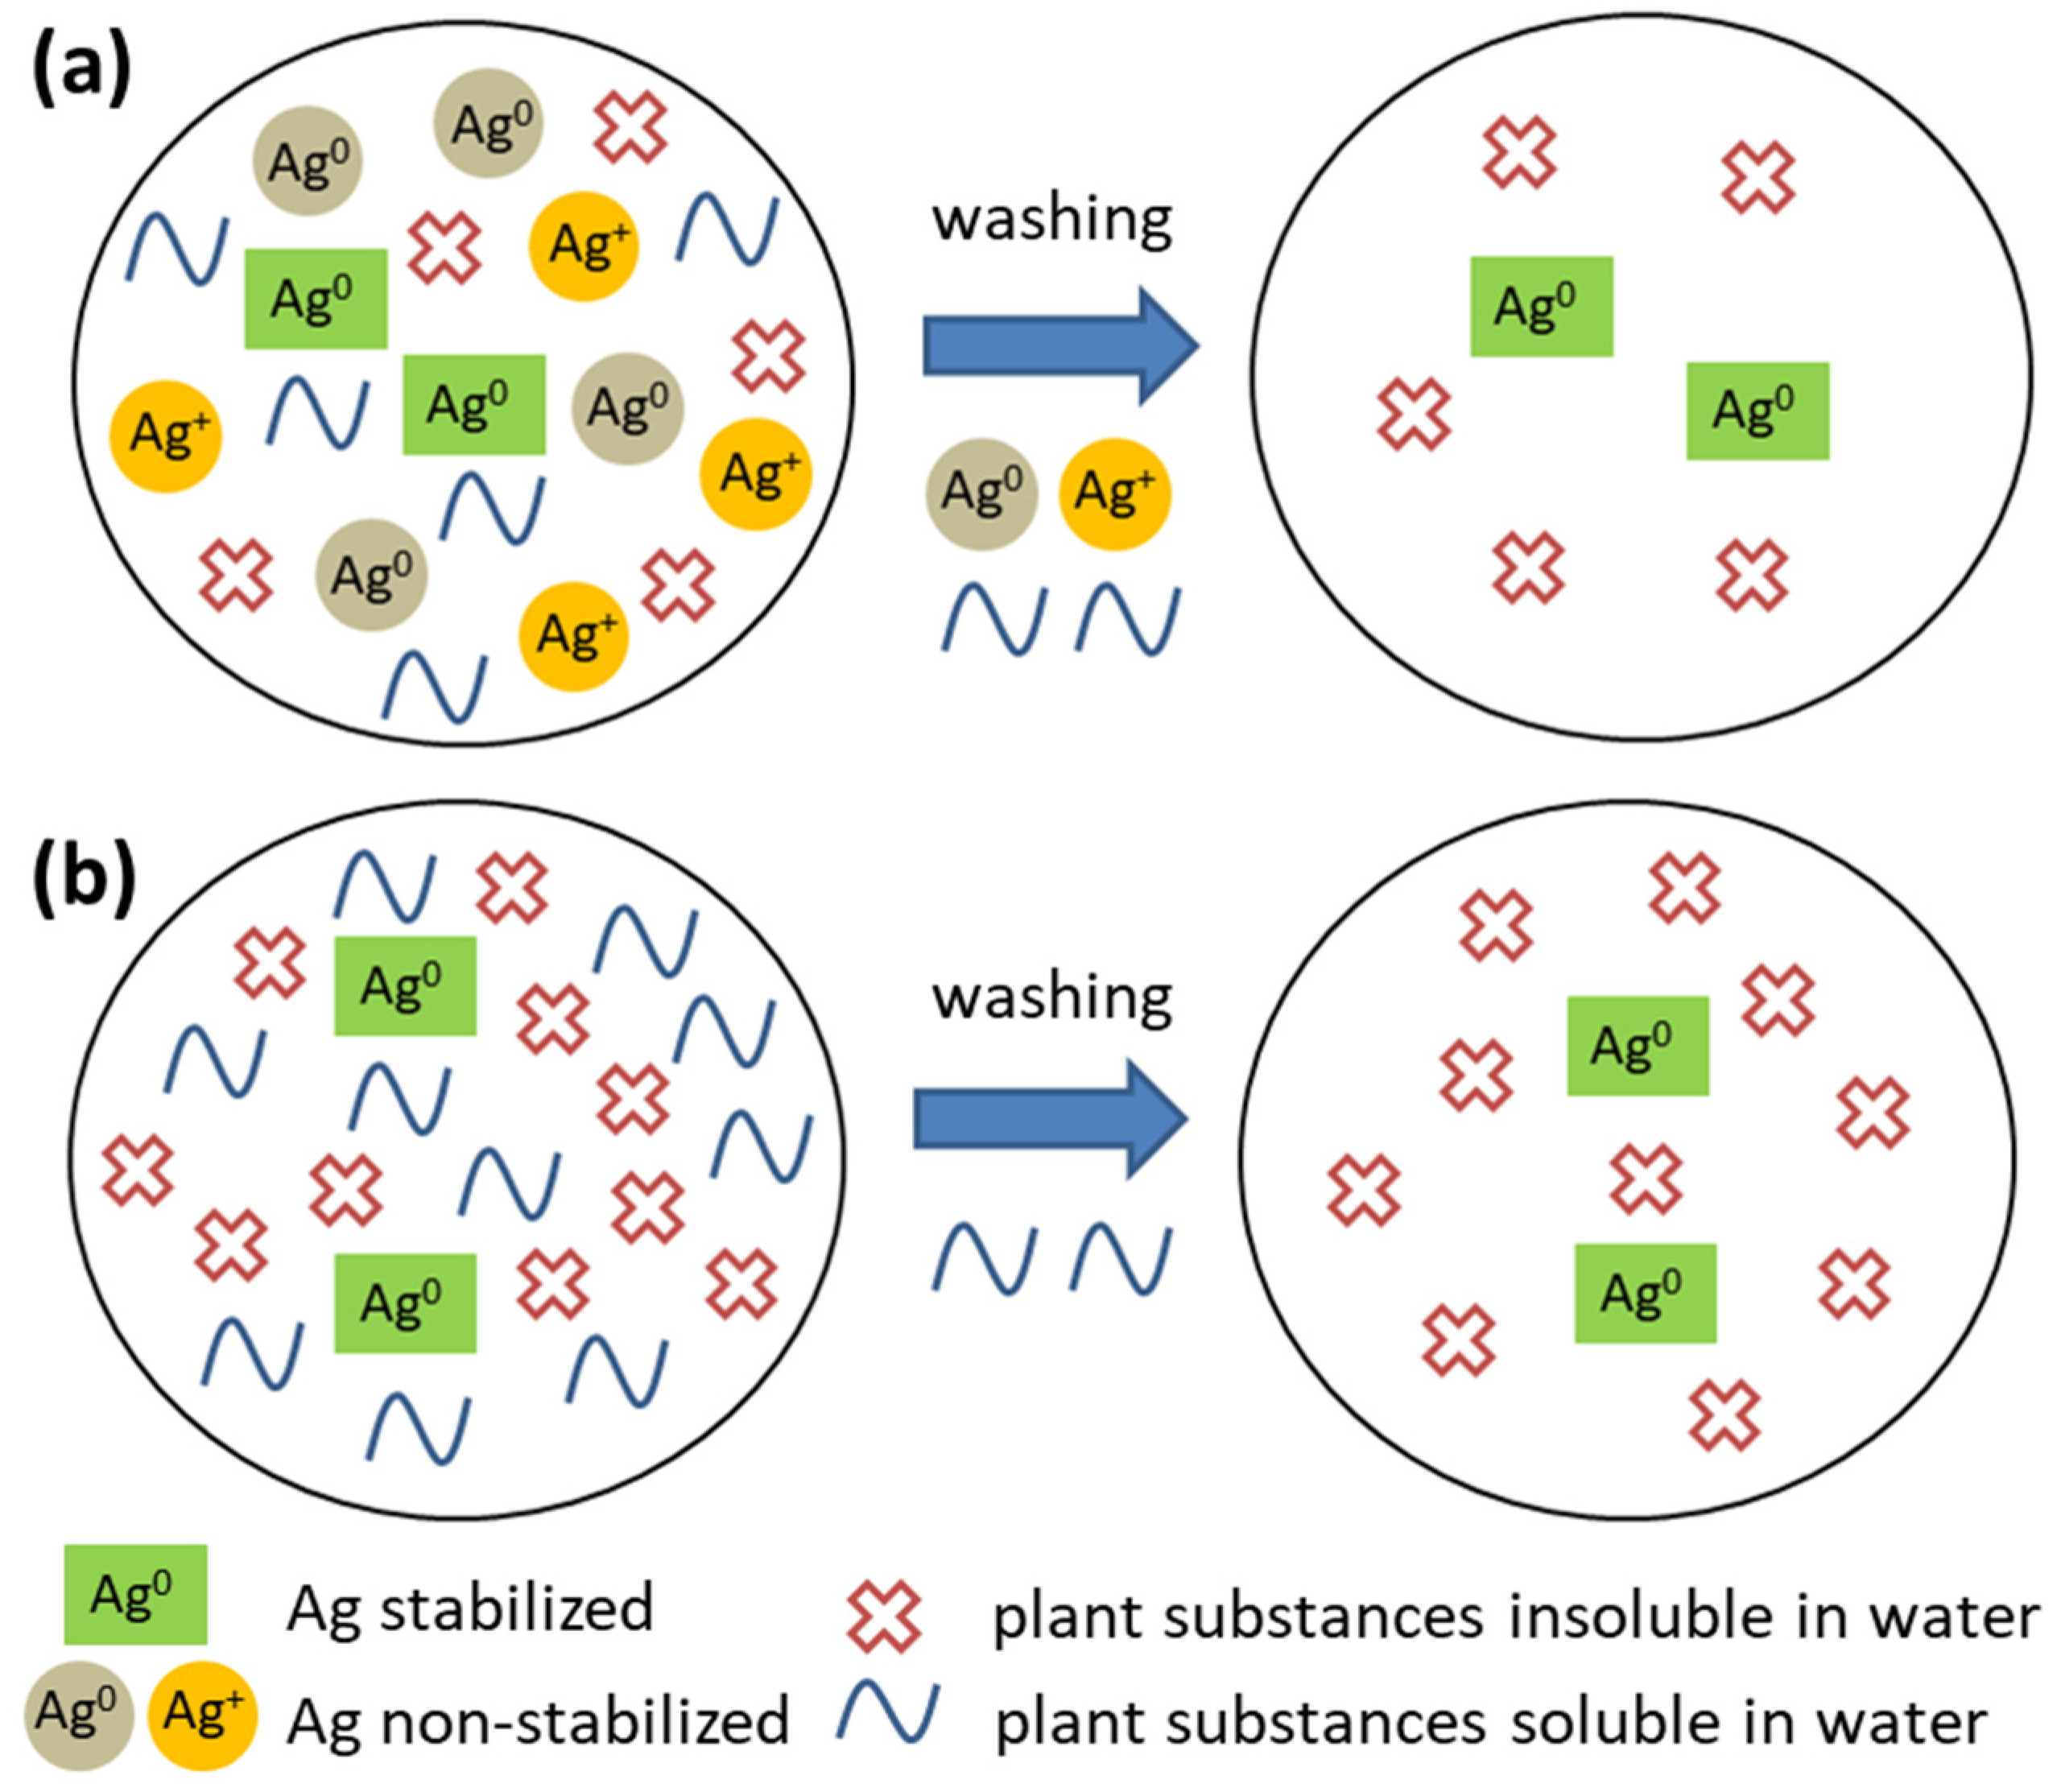
- In the Ag:plant 1:1 samples, the concentration and subsequent dissolution (into distilled water) of non-stabilized Ag0 and Ag+ is relatively high (Figure 3a). The water-soluble plant substances are washed away with the unstabilized Ag species (meaning not retained in the powder, but they are stabilized by the water-soluble components of the plant) as well, but their dissolution from the Ag:plant 1:1 samples is not as high as in the other cases.
- In plant-rich samples, only stabilized Ag0 is present; thus, only water-soluble plant species are washed away, resulting in a larger amount of Ag being identified in the samples (Figure 3b).
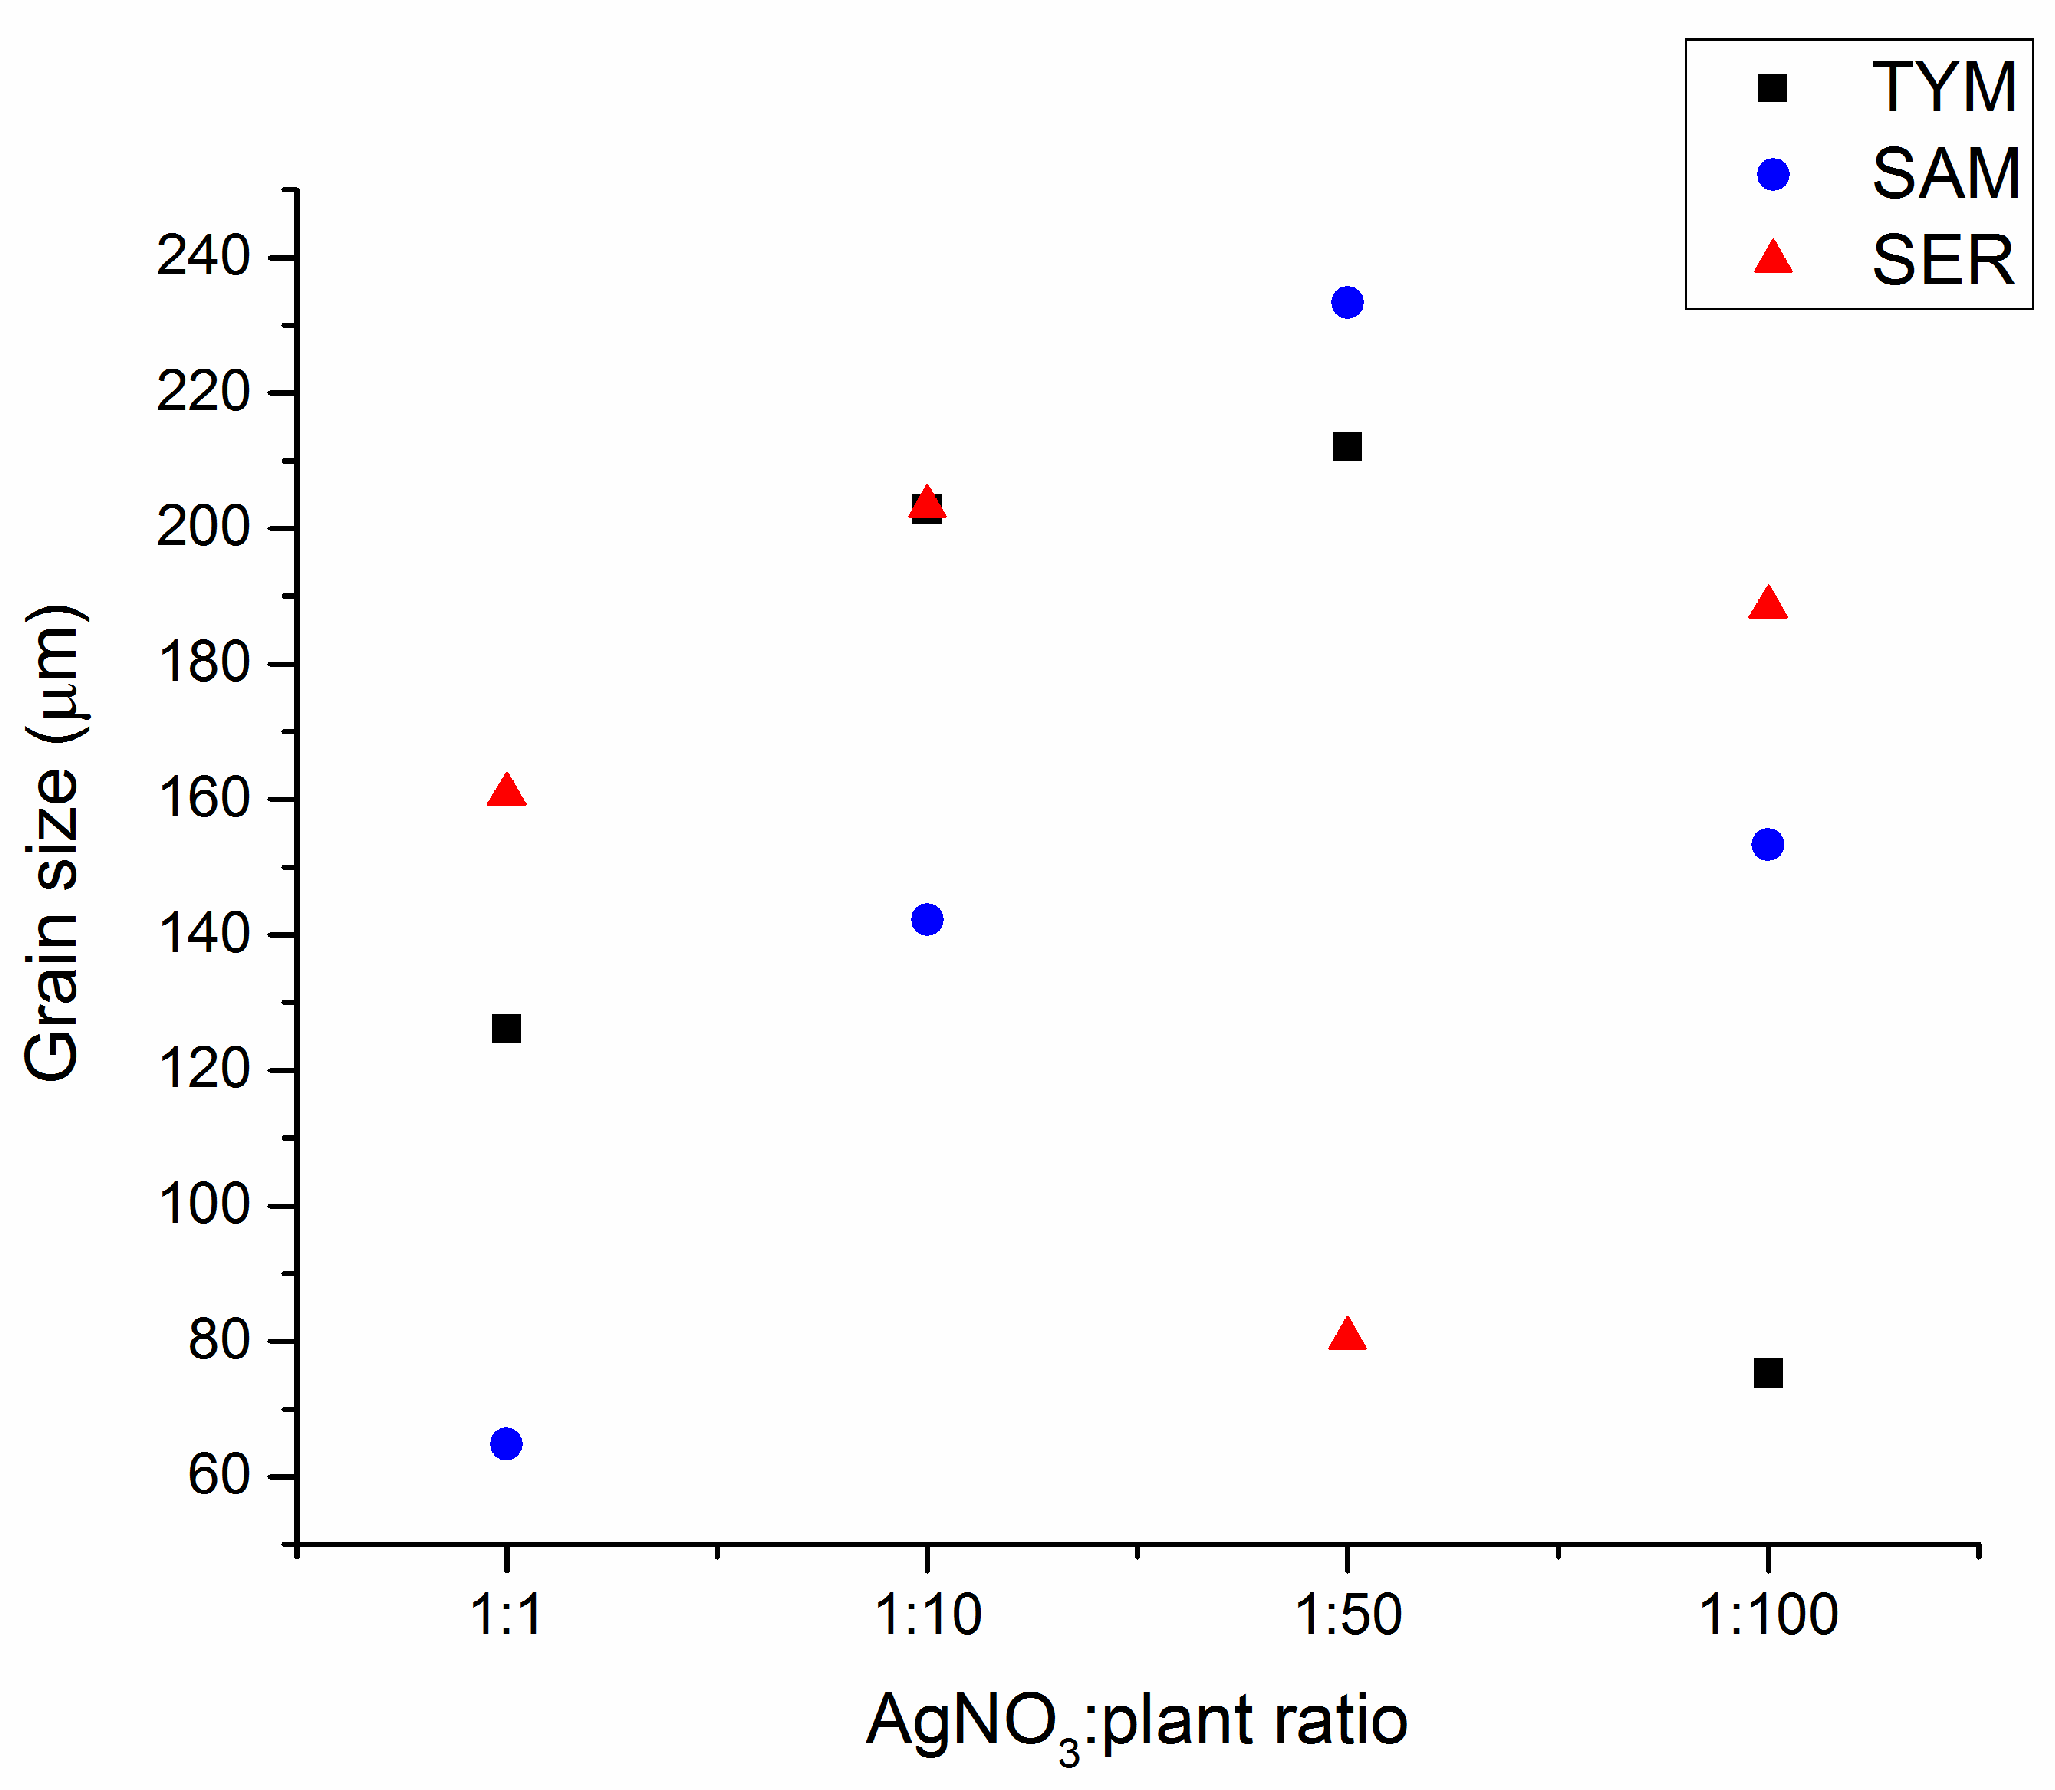
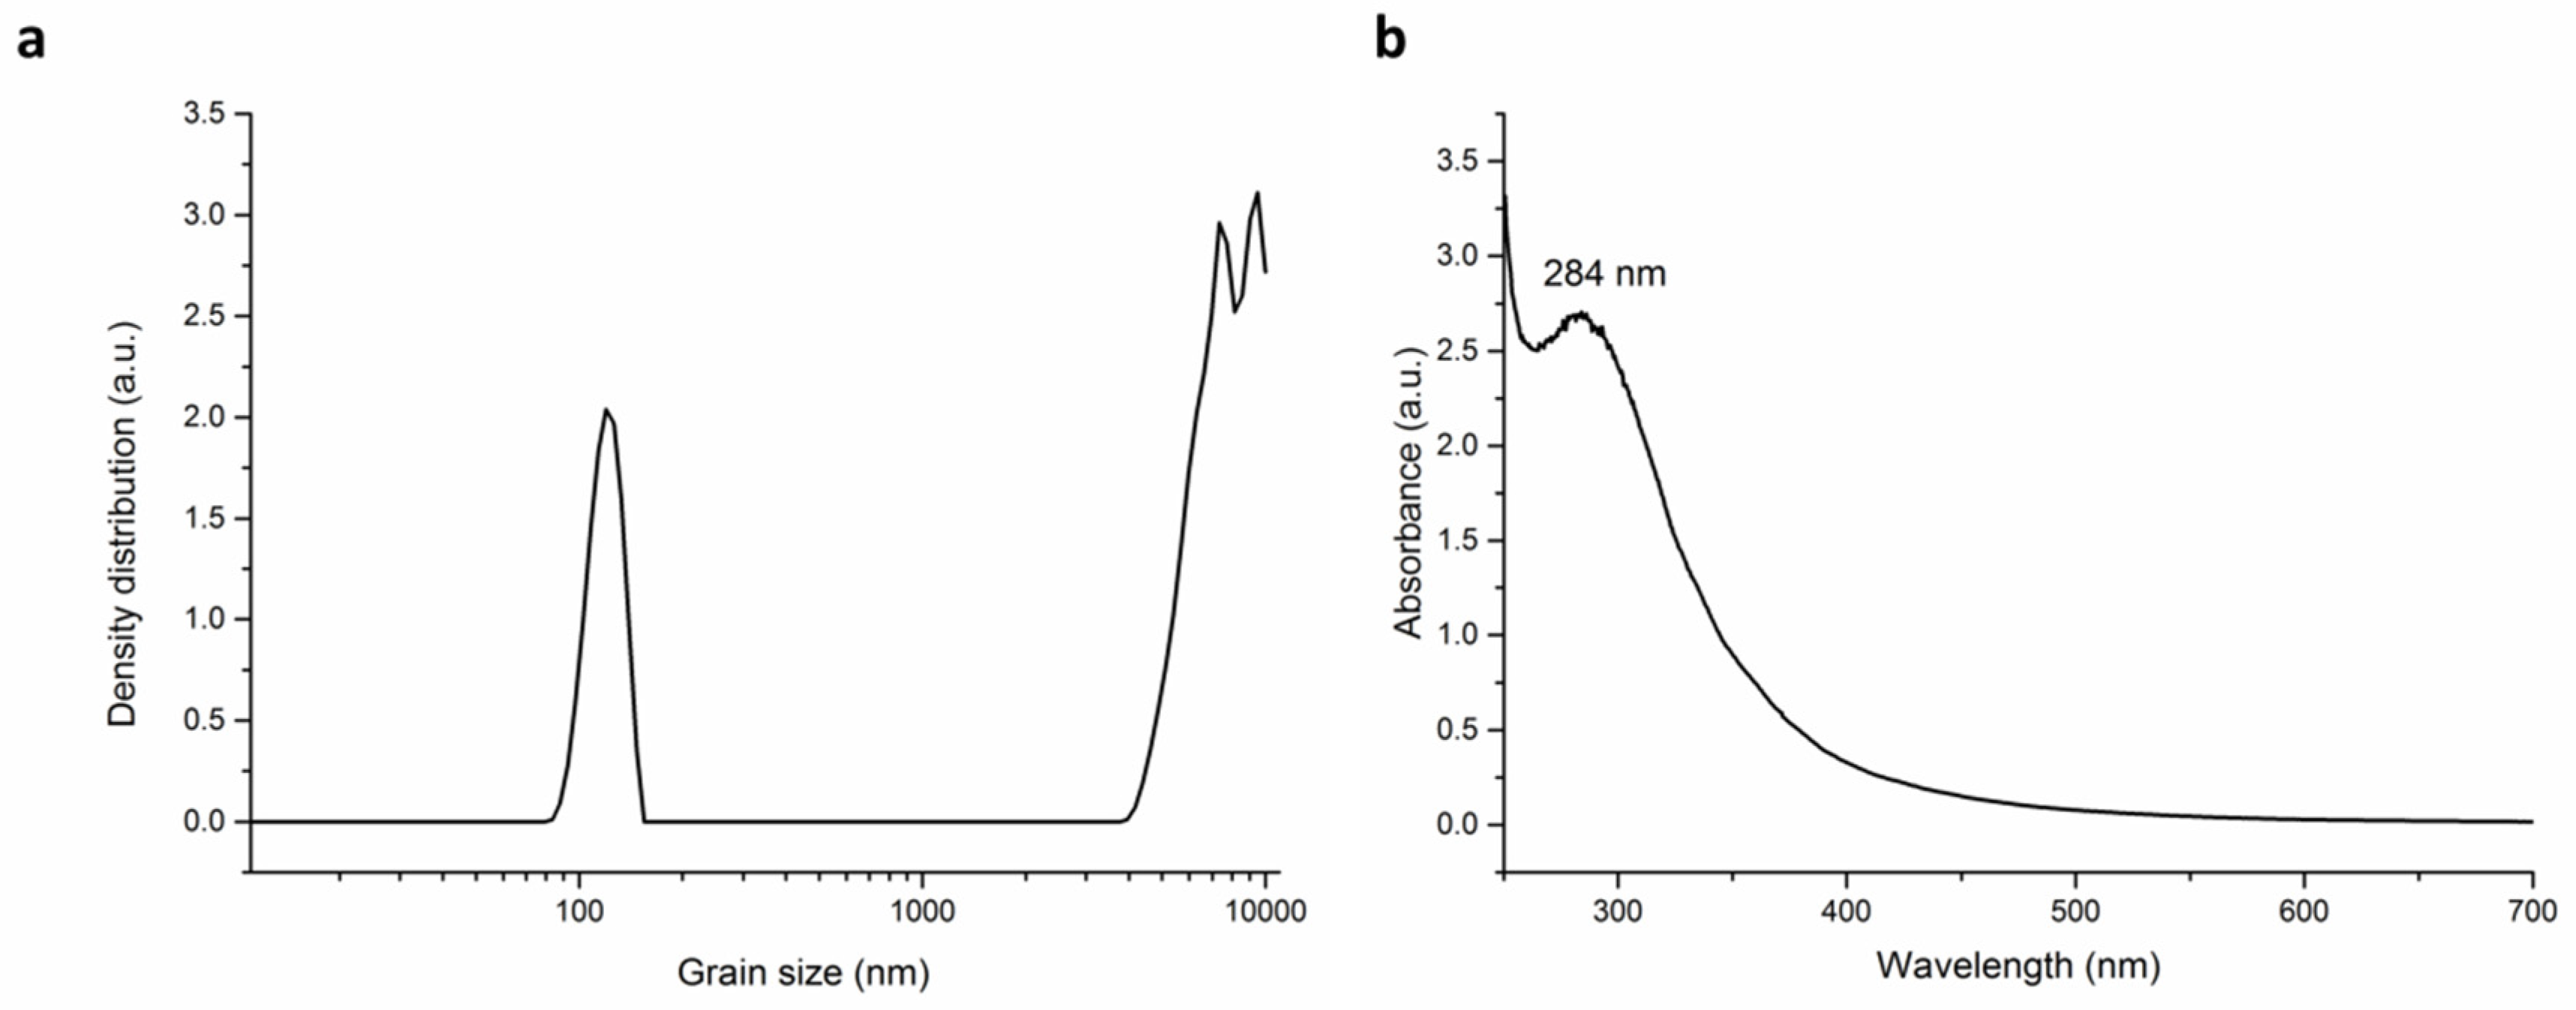
3.3. Grain Size Analysis
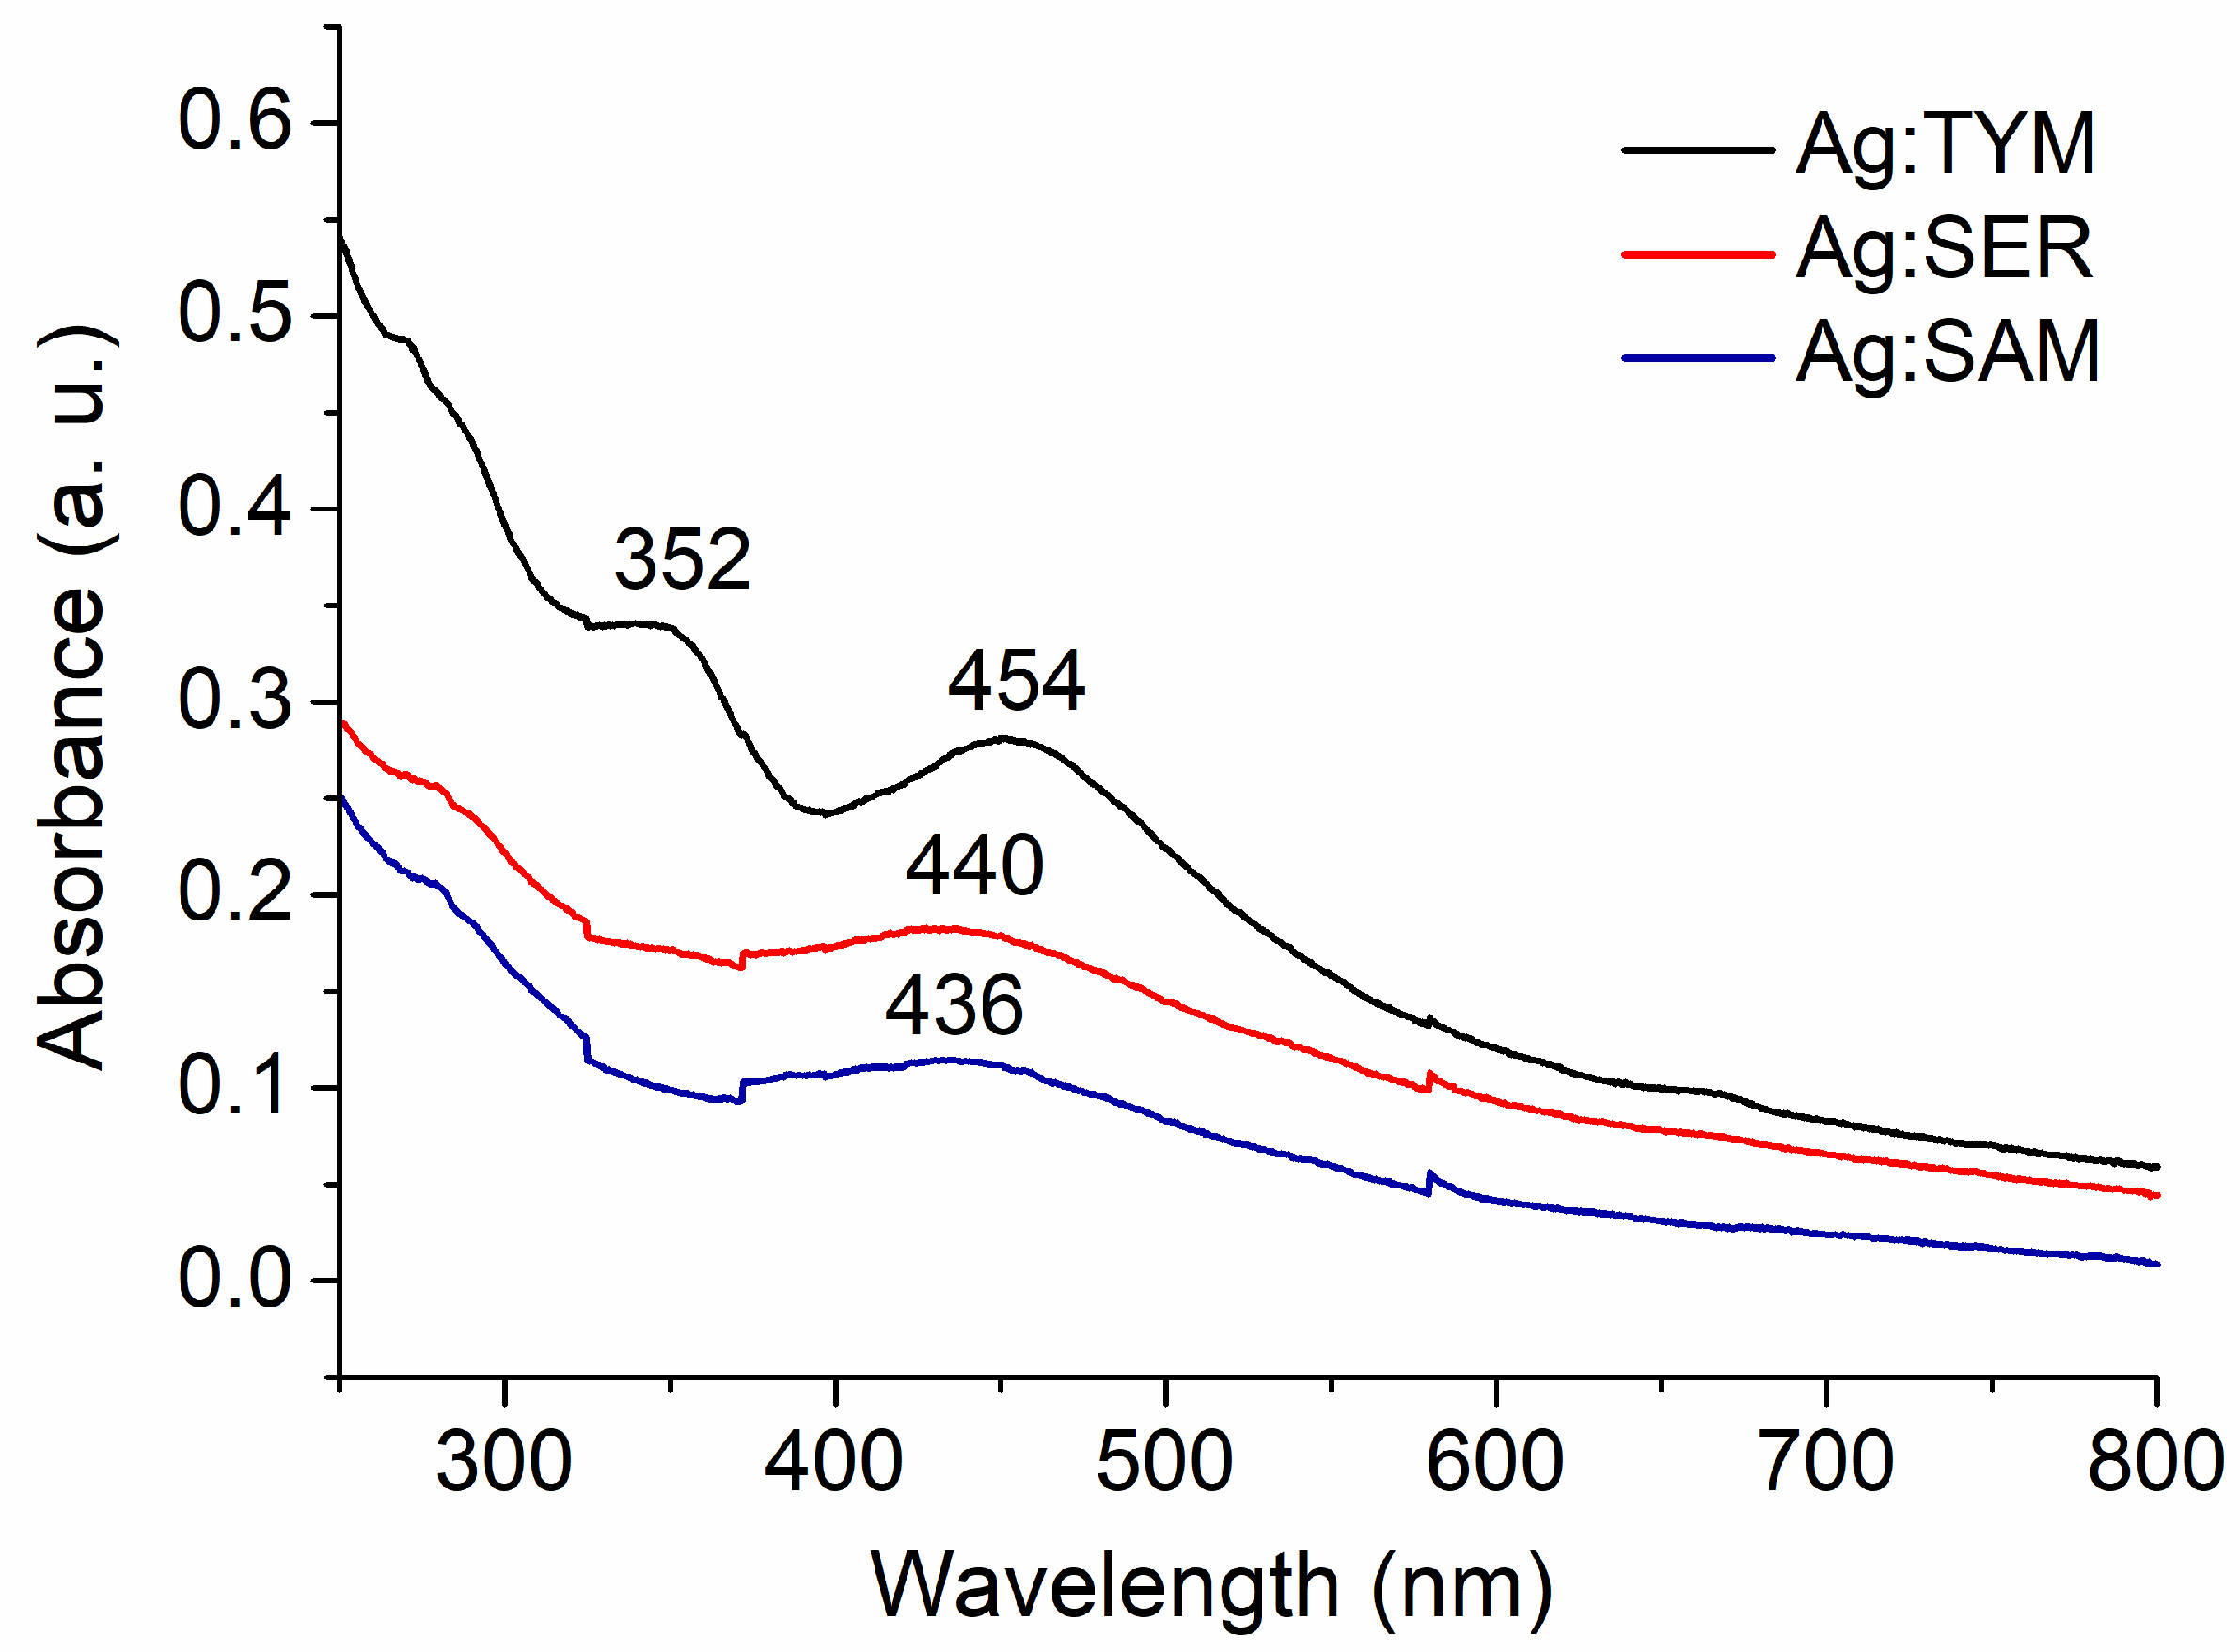
3.4. UV-Vis Results
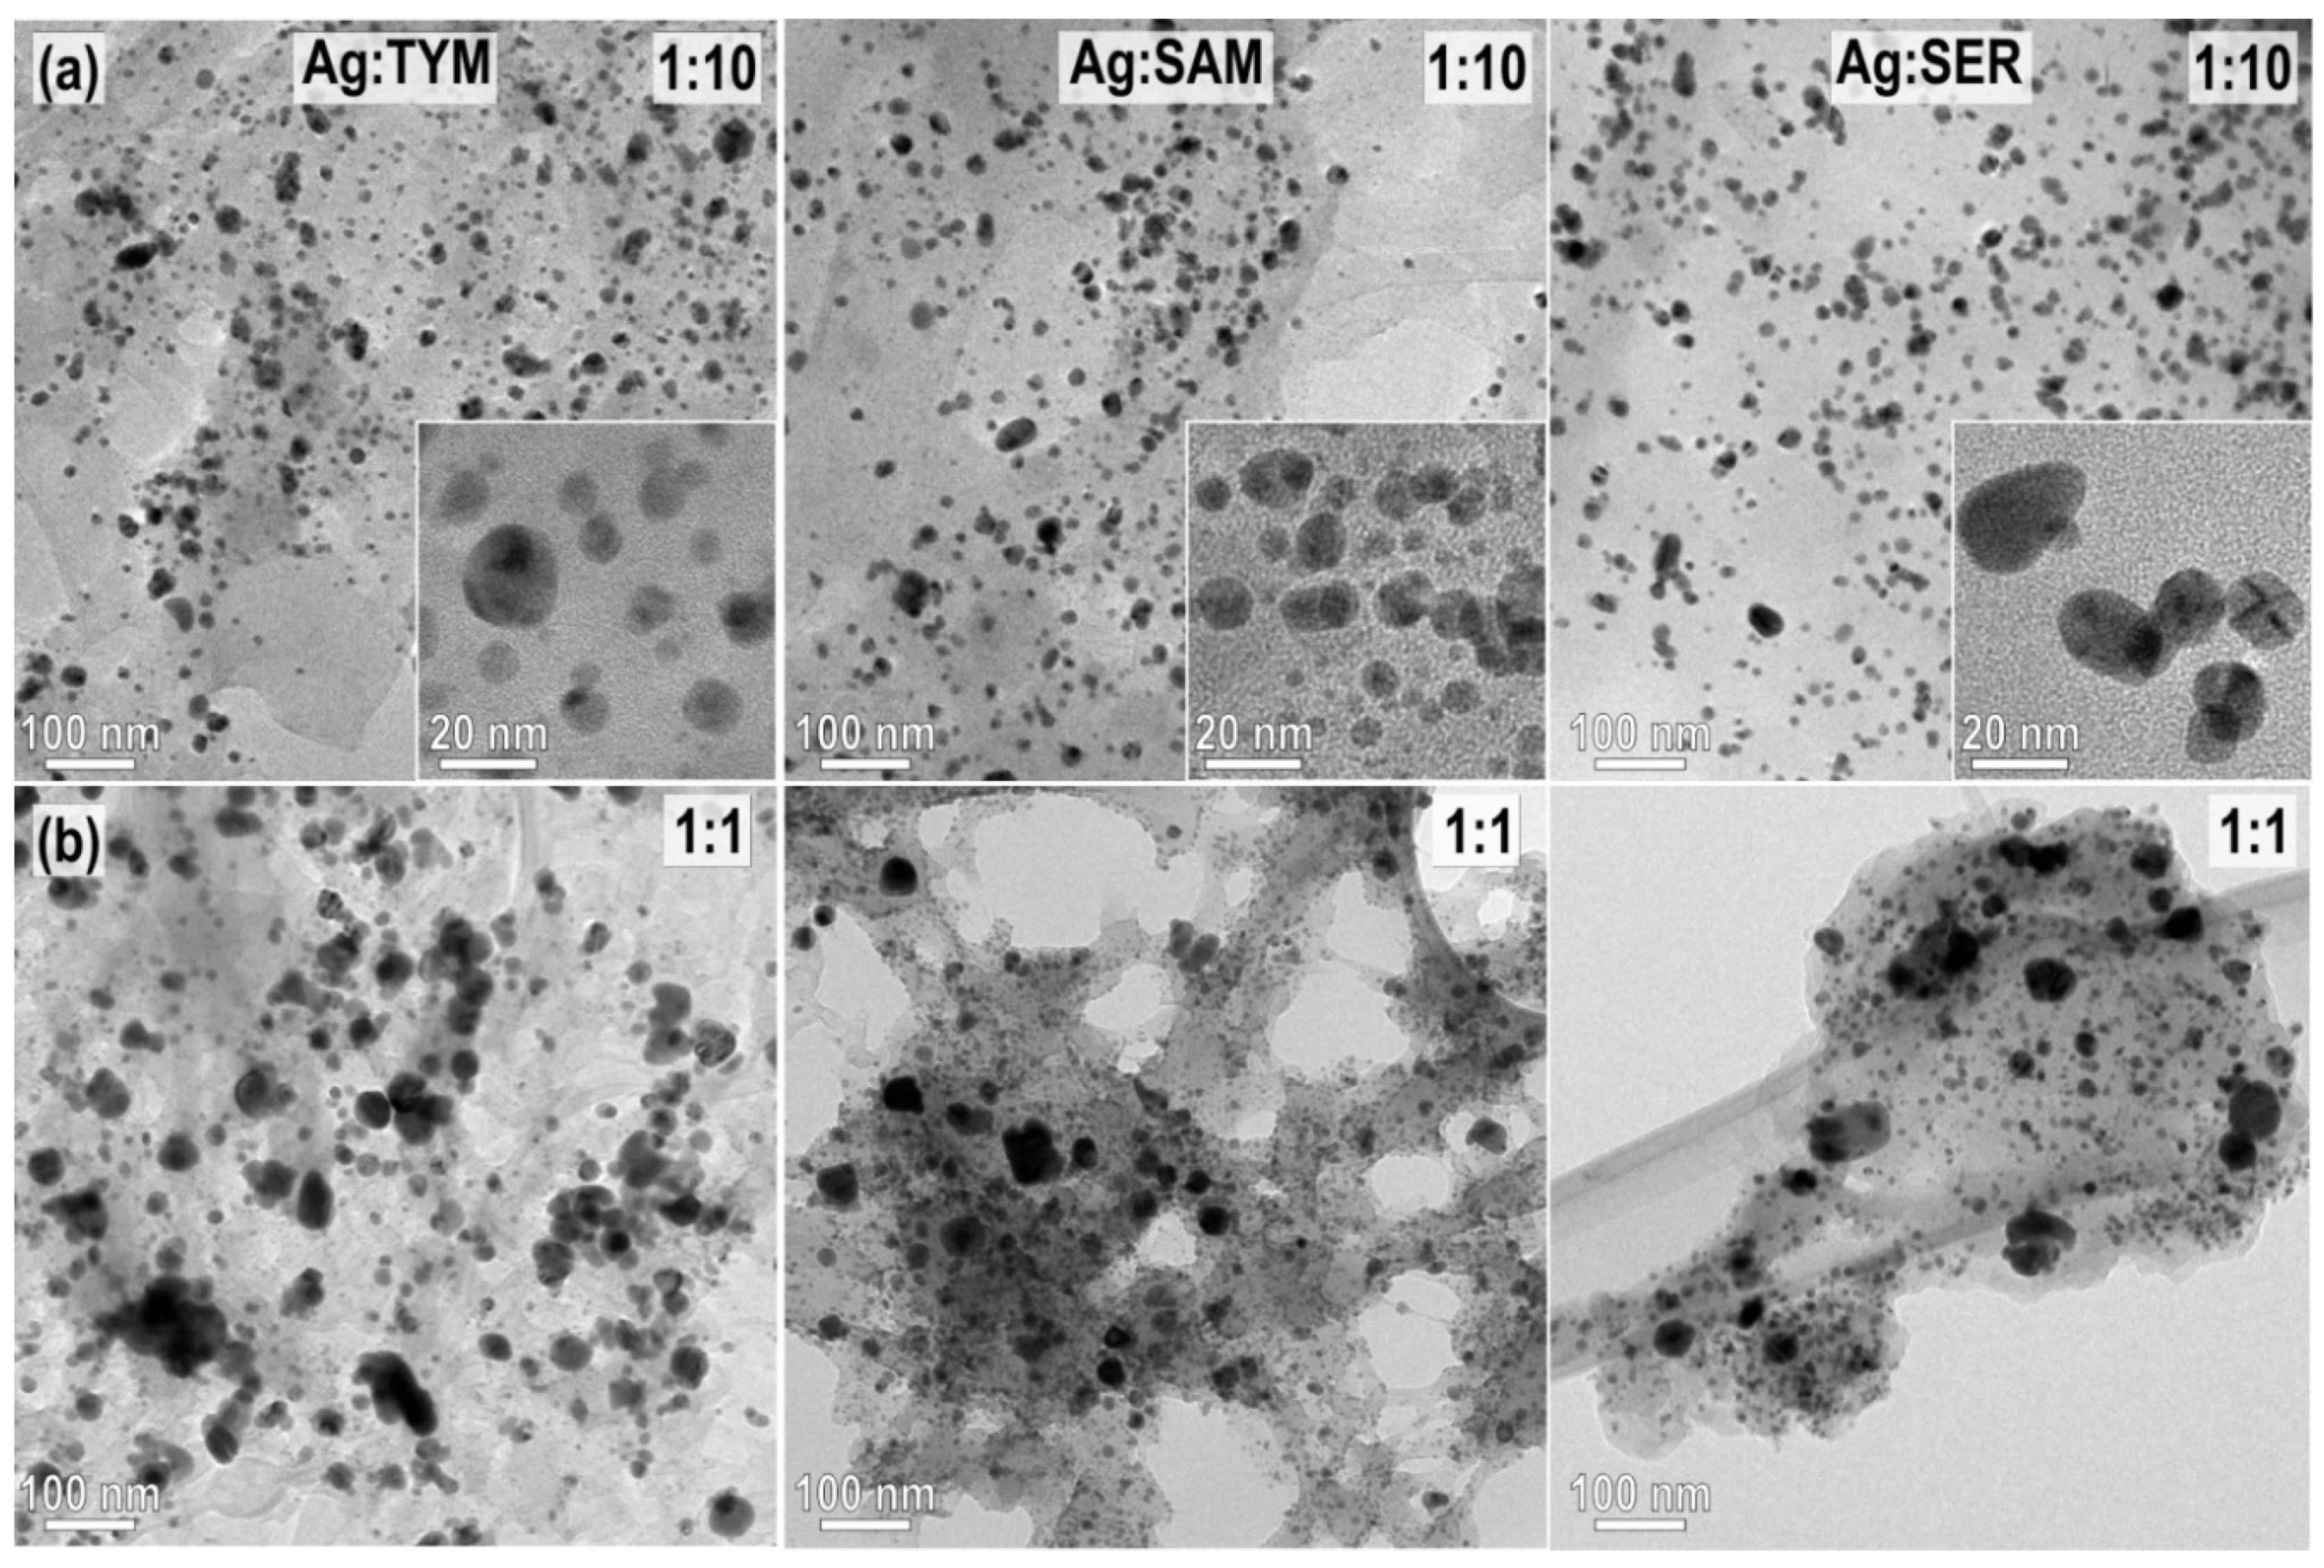
3.5. TEM Analysis
3.6. Characterization of the Filtrate of Ag:SER 1:1 Sample after Washing
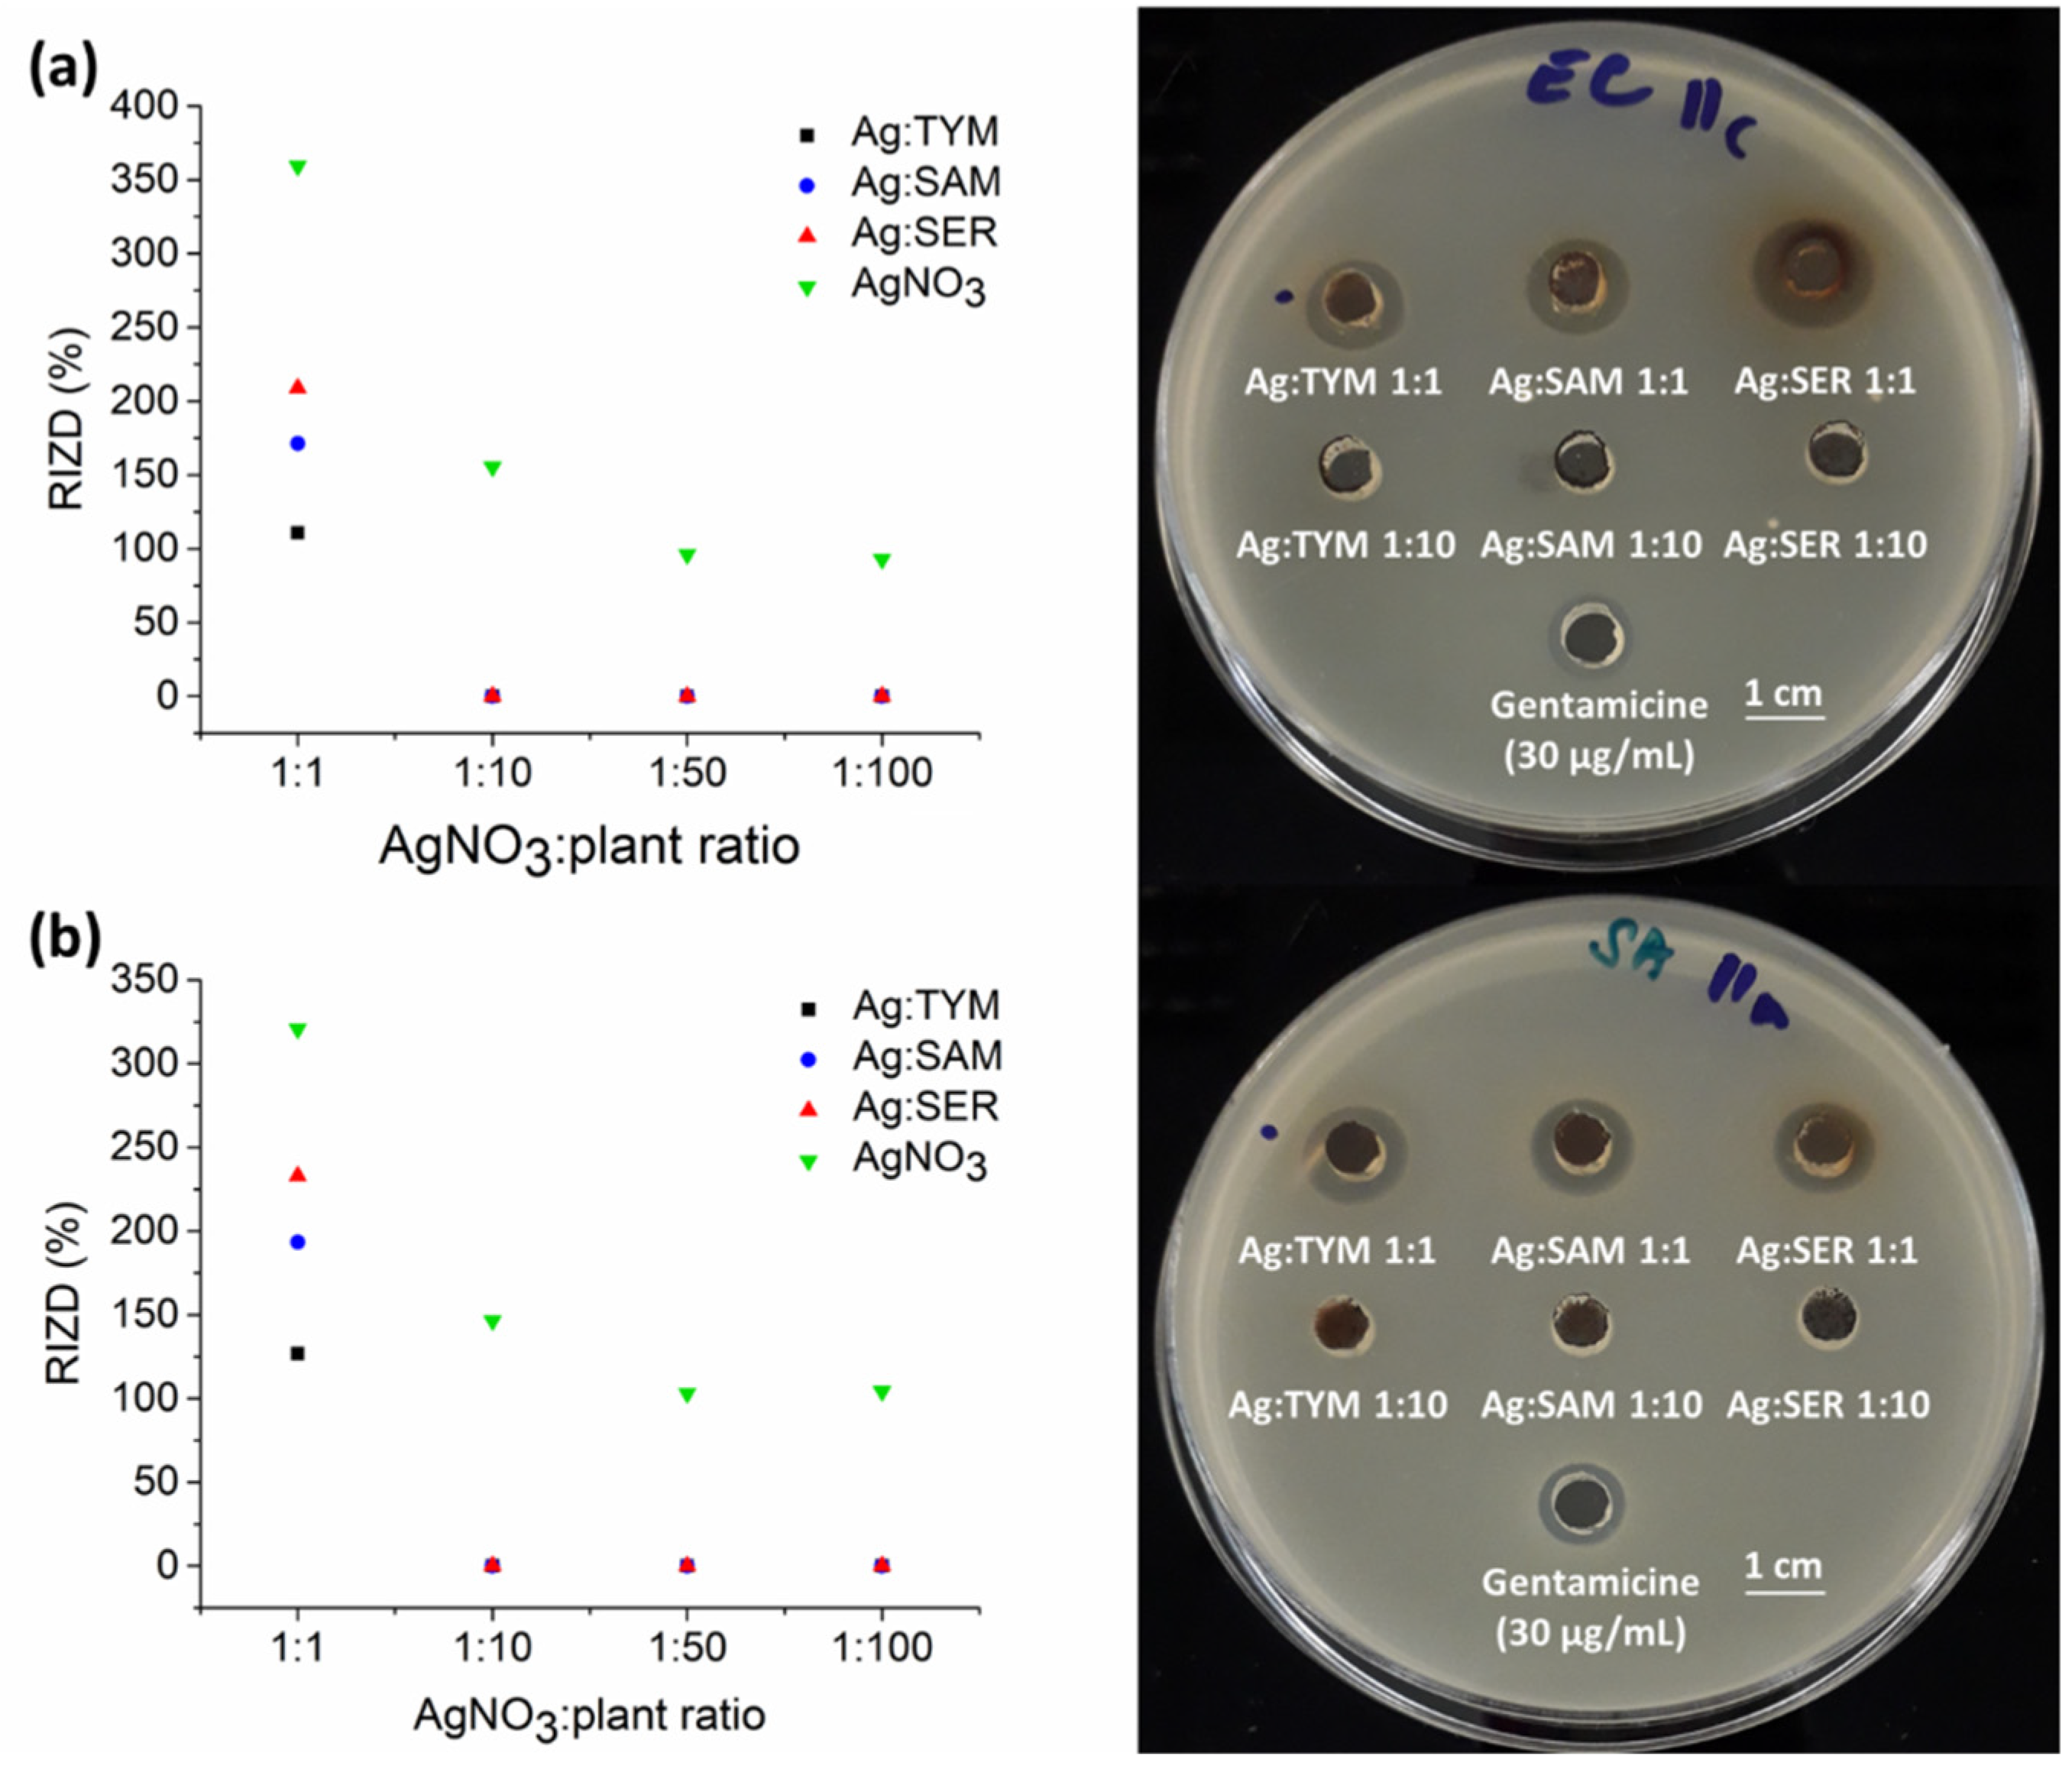
3.7. Antibacterial Activity
4. Conclusions
Supplementary Materials
Author Contributions
Funding
Conflicts of Interest
References
- Sarina, S.; Waclawik, E.R.; Zhu, H.Y. Photocatalysis on supported gold and silver nanoparticles under ultraviolet and visible light irradiation. Green Chem. 2013, 15, 1814–1833. [Google Scholar] [CrossRef]
- Ahmed, S.; Ahmad, M.; Swami, B.L.; Ikram, S. A review on plants extract mediated synthesis of silver nanoparticles for antimicrobial applications: A green expertise. J. Adv. Res. 2016, 7, 17–28. [Google Scholar] [CrossRef] [PubMed] [Green Version]
- Syafiuddin, A.; Salmiati; Salim, M.R.; Hong Kueh, A.B.; Hadibarata, T.; Nur, H. A Review of Silver Nanoparticles: Research Trends, Global Consumption, Synthesis, Properties, and Future Challenges. J. Chin. Chem. Soc. 2017, 64, 732–756. [Google Scholar] [CrossRef]
- Lee, S.H.; Jun, B.H. Silver nanoparticles: Synthesis and application for nanomedicine. Int. J. Mol. Sci. 2019, 20, 865. [Google Scholar] [CrossRef] [PubMed] [Green Version]
- Verma, P.; Maheshwari, S.K. Applications of Silver nanoparticles in diverse sectors. Int. J. Nano Dimens. 2019, 10, 18–36. [Google Scholar]
- Marambio-Jones, C.; Hoek, E.M.V. A review of the antibacterial effects of silver nanomaterials and potential implications for human health and the environment. J. Nanopart. Res. 2010, 12, 1531–1551. [Google Scholar] [CrossRef]
- Lara, H.H.; Garza-Trevino, E.N.; Ixtepan-Turrent, L.; Singh, D.K. Silver nanoparticles are broad-spectrum bactericidal and virucidal compounds. J. Nanobiotechnol. 2011, 9, 30. [Google Scholar] [CrossRef] [Green Version]
- Rai, M.; Kon, K.; Ingle, A.; Duran, N.; Galdiero, S.; Galdiero, M. Broad-spectrum bioactivities of silver nanoparticles: The emerging trends and future prospects. Appl. Microbiol. Biotechnol. 2014, 98, 1951–1961. [Google Scholar] [CrossRef]
- Zhang, X.F.; Liu, Z.G.; Shen, W.; Gurunathan, S. Silver nanoparticles: Synthesis, characterization, properties, applications, and therapeutic approaches. Int. J. Mol. Sci. 2016, 17, 1534. [Google Scholar] [CrossRef]
- Wei, L.Y.; Lu, J.R.; Xu, H.Z.; Patel, A.; Chen, Z.S.; Chen, G.F. Silver nanoparticles: Synthesis, properties, and therapeutic applications. Drug Discov. Today 2015, 20, 595–601. [Google Scholar] [CrossRef] [Green Version]
- Singh, M.K.; Singh, M.; Verma, J.L.; Kumar, N.; Mandal, R.K. Stabilization of nanocrystalline silver by Sella and Mansoori rice starch. Trans. Indian Inst. Metals 2015, 68, 239–245. [Google Scholar] [CrossRef]
- Tarannum, N.; Divya; Gautam, Y.K. Facile green synthesis and applications of silver nanoparticles: A state-of-the-art review. RSC Adv. 2019, 9, 34926–34948. [Google Scholar] [CrossRef] [Green Version]
- Ahmad, S.; Munir, S.; Zeb, N.; Ullah, A.; Khan, B.; Ali, J.; Bilal, M.; Omer, M.; Alamzeb, M.; Salman, S.M.; et al. Green nanotechnology: A review on green synthesis of silver nanoparticles—An ecofriendly approach. Int. J. Nanomed. 2019, 14, 5087–5107. [Google Scholar] [CrossRef] [PubMed] [Green Version]
- Jafari, A.; Pourakbar, L.; Farhadi, K.; Mohamadgolizad, L.; Goosta, Y. Biological synthesis of silver nanoparticles and evaluation of antibacterial and antifungal properties of silver and copper nanoparticles. Turk. J. Biol. 2015, 39, 556–561. [Google Scholar] [CrossRef]
- Heidari, Z.; Salehzadeh, A.; Shandiz, S.A.S.; Tajdoost, S. Anti-cancer and anti-oxidant properties of ethanolic leaf extract of Thymus vulgaris and its bio-functionalized silver nanoparticles. 3 Biotech 2018, 8, 177. [Google Scholar] [CrossRef]
- Erci, F.; Torlak, E. Antimicrobial and antibiofilm activity of green synthesized silver nanoparticles by using aqueous leaf extract of Thymus serpyllum. Sak. Univ. J. Sci. 2019, 23, 333–339. [Google Scholar] [CrossRef]
- David, L.; Moldovan, B.; Vulcu, A.; Olenic, L.; Perde-Schrepler, M.; Fischer-Fodor, E.; Florea, A.; Crisan, M.; Chiorean, I.; Clichici, S.; et al. Green synthesis, characterization and anti-inflammatory activity of silver nanoparticles using European black elderberry fruits extract. Colloids Surf. B Biointerfaces 2014, 122, 767–777. [Google Scholar] [CrossRef] [PubMed]
- Moldovan, B.; David, L.; Achim, M.; Clichici, S.; Filip, G.A. A green approach to phytomediated synthesis of silver nanoparticles using Sambucus nigra L. fruits extract and their antioxidant activity. J. Mol. Liq. 2016, 221, 271–278. [Google Scholar] [CrossRef]
- Rao, B.; Tang, R.C. Green synthesis of silver nanoparticles with antibacterial activities using aqueous Eriobotrya japonica leaf extract. Adv. Nat. Sci. Nanosci. Nanotechnol. 2017, 8, 015014. [Google Scholar] [CrossRef] [Green Version]
- Ronavari, A.; Kovacs, D.; Igaz, N.; Vagvolgyi, C.; Boros, I.M.; Konya, Z.; Pfeiffer, I.; Kiricsi, M. Biological activity of green-synthesized silver nanoparticles depends on the applied natural extracts: A comprehensive study. Int. J. Nanomed. 2017, 12, 871–883. [Google Scholar] [CrossRef] [Green Version]
- Ciplak, Z.; Gokalp, C.; Getiren, B.; Yildiz, A.; Yildiz, N. Catalytic performance of Ag, Au and Ag-Au nanoparticles synthesized by lichen extract. Green Process. Synth. 2018, 7, 433–440. [Google Scholar] [CrossRef]
- Baláž, M.; Balážová, Ľ.; Kováčová, M.; Daneu, N.; Salayová, A.; Bedlovičová, Z.; Tkáčiková, Ľ. The relationship between precursor concentration and antibacterial activity of biosynthesized Ag nanoparticles. Adv. Nano Res. 2019, 7, 125–134. [Google Scholar] [CrossRef]
- Rak, M.J.; Friscic, T.; Moores, A. One-step, solvent-free mechanosynthesis of silver nanoparticle-infused lignin composites for use as highly active multidrug resistant antibacterial filters. RSC Adv. 2016, 6, 58365–58370. [Google Scholar] [CrossRef] [Green Version]
- Arancon, R.A.D.; Balu, A.M.; Romero, A.A.; Ojeda, M.; Gomez, M.; Blanco, J.; Domingo, J.L.; Luque, R. Mechanochemically synthesized Ag-based nanohybrids with unprecedented low toxicity in biomedical applications. Environ. Res. 2017, 154, 204–211. [Google Scholar] [CrossRef] [PubMed]
- Baláž, M.; Balážová, Ľ.; Daneu, N.; Dutková, E.; Balážová, M.; Bujňáková, Z.; Shpotyuk, Y. Plant-mediated synthesis of silver nanoparticles and their stabilization by wet stirred media milling. Nanoscale Res. Lett. 2017, 12, 83. [Google Scholar] [CrossRef] [Green Version]
- Baláž, M.; Daneu, N.; Balážová, Ľ.; Dutková, E.; Tkáčiková, Ľ.; Briančin, J.; Vargová, M.; Balážová, M.; Zorkovská, A.; Baláž, P. Bio-mechanochemical synthesis of silver nanoparticles with antibacterial activity. Adv. Powder Technol. 2017, 28, 3307–3312. [Google Scholar] [CrossRef]
- Nasiri, J.; Rahimi, M.; Hamezadeh, Z.; Motamedi, E.; Naghavi, M.R. Fulfillment of green chemistry for synthesis of silver nanoparticles using root and leaf extracts of Ferula persica: Solid-state route vs. solution-phase method. J. Clean. Prod. 2018, 192, 514–530. [Google Scholar] [CrossRef]
- Kwiczak-Yigitbasi, J.; Lacin, O.; Demir, M.; Ahan, R.E.; Seker, U.O.S.; Baytekin, B. A sustainable preparation of catalytically active and antibacterial cellulose metal nanocomposites via ball milling of cellulose. Green Chem. 2020, 22, 455–464. [Google Scholar] [CrossRef]
- Baláž, M.; Goga, M.; Hegedüs, M.; Daneu, N.; Kováčová, M.; Tkáčiková, Ľ.; Balážová, Ľ.; Bačkor, M. Biomechanochemical solid-state synthesis of silver nanoparticles with antibacterial activity using lichens. ACS Sustain. Chem. Eng. 2020, 8, 13945–13955. [Google Scholar] [CrossRef]
- De Oliveira, P.F.M.; Torresi, R.M.; Emmerling, F.; Camargo, P.H.C. Challenges and opportunities in the bottom-up mechanochemical synthesis of noble metal nanoparticles. J. Mater. Chem. A 2020, 8, 16114–16141. [Google Scholar] [CrossRef]
- Baláž, M.; Bedlovičová, Z.; Kováčová, M.; Salayová, A.; Balážová, Ľ. Green and Bio-Mechanochemical Approach to Silver Nanoparticles Synthesis, Characterization and Antibacterial Potential. In Nanostructures for Antimicrobial and Antibiofilm Applications; Prasad, R., Siddhardha, B., Dyavaiah, M., Eds.; Springer Nature: Cham, Switzerland, 2020; pp. 145–183. [Google Scholar]
- Goga, M.; Baláž, M.; Daneu, N.; Elečko, J.; Tkáčiková, Ľ.; Marcinčinová, M.; Bačkor, M. Biological activity of selected lichens and lichen-based Ag nanoparticles prepared by a green solid-state mechanochemical approach. Mater. Sci. Eng. C 2020, in press. [Google Scholar] [CrossRef]
- Prathna, T.C.; Chandrasekaran, N.; Raichur, A.M.; Mukherjee, A. Biomimetic synthesis of silver nanoparticles by Citrus limon (lemon) aqueous extract and theoretical prediction of particle size. Colloids Surf. B Biointerfaces 2011, 82, 152–159. [Google Scholar] [CrossRef] [PubMed]
- Khalil, M.M.H.; Ismail, E.H.; El-Baghdady, K.Z.; Mohamed, D. Green synthesis of silver nanoparticles using olive leaf extract and its antibacterial activity. Arab. J. Chem. 2014, 7, 1131–1139. [Google Scholar] [CrossRef] [Green Version]
- El Khoury, E.; Abiad, M.; Kassaify, Z.G.; Patra, D. Green synthesis of curcumin conjugated nanosilver for the applications in nucleic acid sensing and anti-bacterial activity. Colloids Surf. B Biointerfaces 2015, 127, 274–280. [Google Scholar] [CrossRef] [PubMed]
- Suarez-Cerda, J.; Alonso-Nunez, G.; Espinoza-Gomez, H.; Flores-Lopez, L.Z. Synthesis, kinetics and photocatalytic study of “ultra-small” Ag-NPs obtained by a green chemistry method using an extract of Rosa ‘Andeli’ double delight petals. J. Colloid Interface Sci. 2015, 458, 169–177. [Google Scholar] [CrossRef] [PubMed]
- Nasiriborournand, M.; Montazer, M.; Barani, H. Preparation and characterization of biocompatible silver nanoparticles using pomegranate peel extract. J. Photochem. Photobiol. B 2018, 179, 98–104. [Google Scholar] [CrossRef]
- Shaik, M.R.; Khan, M.; Kuniyil, M.; Al-Warthan, A.; Alkhathlan, H.Z.; Siddiqui, M.R.H.; Shaik, J.P.; Ahamed, A.; Mahmood, A.; Khan, M.; et al. Plant-Extract-Assisted Green Synthesis of Silver Nanoparticles Using Origanum vulgare L. Extract and Their Microbicidal Activities. Sustainability 2018, 10, 913. [Google Scholar] [CrossRef] [Green Version]
- Cathcart, N.; Frank, A.J.; Kitaev, V. Silver nanoparticles with planar twinned defects: Effect of halides for precise tuning of plasmon resonance maxima from 400 to >900 nm. Chem. Commun. 2009, 46, 7170–7172. [Google Scholar] [CrossRef]
- Dong, Y.H.; Zhu, H.L.; Shen, Y.Y.; Zhang, W.T.; Zhang, L. Antibacterial activity of silver nanoparticles of different particle size against Vibrio Natriegens. PLoS ONE 2019, 14, e0222322. [Google Scholar] [CrossRef] [Green Version]
- Raza, M.A.; Kanwal, Z.; Rauf, A.; Sabri, A.N.; Riaz, S.; Naseem, S. Size- and Shape-Dependent Antibacterial Studies of Silver Nanoparticles Synthesized by Wet Chemical Routes. Nanomaterials 2016, 6, 74. [Google Scholar] [CrossRef] [Green Version]
- Sotiriou, G.A.; Pratsinis, S.E. Antibacterial Activity of Nanosilver Ions and Particles. Environ. Sci. Technol. 2010, 44, 5649–5654. [Google Scholar] [CrossRef]
- Amato, E.; Diaz-Fernandez, Y.A.; Taglietti, A.; Pallavicini, P.; Pasotti, L.; Cucca, L.; Milanese, C.; Grisoli, P.; Dacarro, C.; Fernandez-Hechavarria, J.M.; et al. Synthesis, Characterization and Antibacterial Activity against Gram Positive and Gram Negative Bacteria of Biomimetically Coated Silver Nanoparticles. Langmuir 2011, 27, 9165–9173. [Google Scholar] [CrossRef] [PubMed]
- Pallavicini, P.; Dacarro, G.; Taglietti, A. Self-Assembled Monolayers of Silver Nanoparticles: From Intrinsic to Switchable Inorganic Antibacterial Surfaces. Eur. J. Inorg. Chem. 2018, 2018, 4846–4855. [Google Scholar] [CrossRef]
- Kim, J.S.; Kuk, E.; Yu, K.N.; Kim, J.H.; Park, S.J.; Lee, H.J. Antimicrobial effects of silver nanoparticles. Nanomed. Nanotechnol. Biol. Med. 2007, 3, 95–101. [Google Scholar] [CrossRef]
- Slavin, Y.N.; Asnis, J.; Hafeli, U.O.; Bach, H. Metal nanoparticles: Understanding the mechanisms behind antibacterial activity. J. Nanobiotechnol. 2017, 15, 1–20. [Google Scholar] [CrossRef]


| Sample | 1:1 | 1:10 | |||
|---|---|---|---|---|---|
| Ag | WC | Ag | WC | AgCl | |
| Ag:TYM | 99.60 ± 0.27 | 0.40 ± 0.27 | 78.0 ± 2.3 | 18.6 ± 2.3 | 3.4 ± 0.7 |
| Ag:SAM | 100 | - | 37.7 ± 6.7 | 62.3 ± 6.7 | - |
| Ag:SER | 100 | - | 93.6 ± 1.6 | - | 6.4 ± 1.6 |
| Sample | 1:1 | 1:10 |
|---|---|---|
| Ag:TYM | 22 ± 4 | 19 ± 2 |
| Ag:SAM | 18 ± 0.3 | 13 ± 0.2 |
| Ag:SER | 27 ± 3 | 19 ± 4 |
| Sample | 1:1 | 1:10 |
|---|---|---|
| Ag:TYM | 68.101 ± 0.043 | 68.304 ± 0.074 |
| Ag:SAM | 68.075 ± 0.059 | 68.329 ± 0.071 |
| Ag:SER | 67.982 ± 0.040 | 68.265 ± 0.078 |
| Sample | Ag Content in the Milled Sample (M) (%) | Ag Content in the Milled Sample after Washing (W) (%) | W/M Ratio |
|---|---|---|---|
| Ag:TYM 1:1 | 31.20 | 18.34 | 0.59 |
| Ag:SAM 1:1 | 32.50 | 23.31 | 0.72 |
| Ag:SER 1:1 | 32.10 | 26.06 | 0.81 |
| Ag:TYM 1:10 | 5.64 | 10.95 | 1.94 |
| Ag:SAM 1:10 | 5.40 | 11.33 | 2.10 |
| Ag:SER 1:10 | 4.95 | 12.28 | 2.48 |
| Ag:TYM 1:50 | 0.60 | 2.19 | 3.65 |
| Ag:SAM 1:50 | 0.75 | 2.28 | 3.04 |
| Ag:SER 1:50 | 0.22 | 1.83 | 8.32 |
| Ag:TYM 1:100 | 0.13 | 0.80 | 6.15 |
| Ag:SAM 1:100 | 0.16 | 0.97 | 6.06 |
| Ag:SER 1:100 | 0.15 | 0.63 | 4.20 |
Publisher’s Note: MDPI stays neutral with regard to jurisdictional claims in published maps and institutional affiliations. |
© 2020 by the authors. Licensee MDPI, Basel, Switzerland. This article is an open access article distributed under the terms and conditions of the Creative Commons Attribution (CC BY) license (http://creativecommons.org/licenses/by/4.0/).
Share and Cite
Kováčová, M.; Daneu, N.; Tkáčiková, Ľ.; Búreš, R.; Dutková, E.; Stahorský, M.; Bujňáková, Z.L.; Baláž, M. Sustainable One-Step Solid-State Synthesis of Antibacterially Active Silver Nanoparticles Using Mechanochemistry. Nanomaterials 2020, 10, 2119. https://doi.org/10.3390/nano10112119
Kováčová M, Daneu N, Tkáčiková Ľ, Búreš R, Dutková E, Stahorský M, Bujňáková ZL, Baláž M. Sustainable One-Step Solid-State Synthesis of Antibacterially Active Silver Nanoparticles Using Mechanochemistry. Nanomaterials. 2020; 10(11):2119. https://doi.org/10.3390/nano10112119
Chicago/Turabian StyleKováčová, Mária, Nina Daneu, Ľudmila Tkáčiková, Radovan Búreš, Erika Dutková, Martin Stahorský, Zdenka Lukáčová Bujňáková, and Matej Baláž. 2020. "Sustainable One-Step Solid-State Synthesis of Antibacterially Active Silver Nanoparticles Using Mechanochemistry" Nanomaterials 10, no. 11: 2119. https://doi.org/10.3390/nano10112119