
The Role UX Design Attributes Play in the Perceived Persuasiveness of Contact Tracing Apps

1
Department of Electrical Engineering & Computer Science, York University, Toronto, ON M3J 1P3, Canada
2
School of Public Health Sciences, University of Waterloo, Waterloo, ON N2L 3G1, Canada
3
Department of Systems Design Engineering, University of Waterloo, Waterloo, ON N2L 3G1, Canada
4
eHealth Innovation, Techna Institute, University Health Network, Toronto, ON M5G 2C4, Canada
5
Institute of Health Policy, Management, and Evaluation, University of Toronto, Toronto, ON M5T 3M6, Canada
*
Authors to whom correspondence should be addressed.
Multimodal Technol. Interact. 2022, 6(10), 88; https://doi.org/10.3390/mti6100088
Submission received: 12 July 2022
/
Revised: 12 September 2022
/
Accepted: 20 September 2022
/
Published: 12 October 2022
Abstract
:Contact tracing apps (CTAs) were deployed worldwide in 2020 to combat COVID-19. Due to their low uptake, a growing amount of empirical research is being conducted to understand the factors that drive their adoption. For CTAs to be adopted, users must, first and foremost, find them persuasive. However, there is little research to understand the role user experience (UX) plays in their perceived persuasiveness. Consequently, we conducted an online study on Amazon Mechanical Turk among Canadian and American residents (n = 446) to investigate the most important UX design attributes associated with the perceived persuasiveness of CTAs. The study was based on two app designs (control and persuasive), each of which comprises three use cases: no exposure, exposure, and diagnosis report interfaces. One interface (screenshot) was randomly presented to a participant to view and provide their responses on the perceived UX design attributes and perceived persuasiveness of the interface. In the overall model, we found that perceived usefulness is the most important and consistent UX design attribute that influences perceived persuasiveness (β = 0.29, p < 0.001), followed by perceived trustworthiness (β = 0.24, p < 0.001) and perceived privacy protection (β = 0.16, p < 0.05). Respectively, the three predictors were consistently significant in two-thirds, half, and one-third of the 12 submodels based on app design, adoption status, and country of residence. The relationships regarding the persuasive designs are more likely to be significant, with the variance of the target construct explained by the predictors ranging from 71% to 89% compared with 54% to 69% for the control designs. The three significant attributes will help designers know which UX design attributes to focus on when designing CTAs for future epidemics. More importantly, in predictive modeling, if their ratings are known, they hold potential in predicting new users’ responsiveness to multiple persuasive strategies/messages featured in behavior-change support systems.
1. Introduction
Starting from the second quarter of 2020, digital contact tracing apps (CTAs) were deployed worldwide to fight the spread of COVID-19. The COVID-19 pandemic is the first global epidemic in which digital CTAs have been widely implemented [1]. A CTA is a mobile health app that notifies people of a possible exposure to COVID-19 whenever someone with whom they had a close contact reports their diagnosis through the app. CTAs were deployed to augment the manual tracing of COVID-19 contacts, which has several limitations. For example, manual contact tracing requires a lot of human labor, resources, and is time-consuming. Moreover, it is subject to memory bias on the part of the people being interviewed by public health professionals. Although digital CTAs have many advantages over manual contact tracing, their reception and adoption have been low, partly due to privacy concerns and low/lack of trust in stakeholders. This has led researchers to conduct several studies in various countries to uncover the various factors affecting CTA adoption [2]. These studies set out to understand the human and design factors that may facilitate or serve as barriers to CTA adoption, often operationalized as intention to download, install, or use the apps. However, there is little research on the factors (UX design attributes) that influence the perceived persuasiveness of these apps, which is an antecedent to CTA adoption and use. Perceived persuasiveness refers to the ability of a human–computer interaction system to persuade people to change their behavior through its UX design elements and functionality. Due to the scarcity of research, we conducted an empirical study among Canadian and American residents to understand the key UX design attributes that influence the perceived persuasiveness of CTAs. We investigated the relationship between seven UX design attributes and perceived persuasiveness using the Canadian COVID Alert app as a proof of concept. The investigated UX design attributes include perceived usefulness, perceived ease of use, perceived compatibility, perceived enjoyment, perceived trustworthiness, perceived data privacy, and perceived data security. Perceived persuasiveness is the capacity of a system to positively influence behavior change. Uncovering the most important attributes that influence perceived persuasiveness will help designers know which of the many UX design attributes to focus on when designing contact tracing apps for future pandemics and epidemics. More importantly, the significant attributes in the path models hold potential in predicting users’ responsiveness to persuasive strategies that will be implemented in future iterations of contact tracing apps. This is evident in the relative number and strength of significant relationships and the coefficient of determination of perceived persuasiveness, which are higher in the models based on persuasive interfaces that implemented persuasive strategies (self-monitoring and social learning) than in the models based on control interfaces.
2. Related Work
Since the inception of the COVID-19 pandemic, a substantial number of empirical studies have been carried out with regard to CTAs aiming at slowing down the spread of the coronavirus. Many of these studies are aimed at understanding the factors that drive technology acceptance [2,3]. We cover a cross section of the relevant studies. Horvath et al. [4] conducted a study on the adoption and continued use of CTAs to assess within-subject changes over time in England. The authors found that trust in government influenced the adoption of the government-backed National Health Services (NHS) app in the third wave, with continued app use linked to perceptions of transparent evidence on app effectiveness. The authors also found that providing clear information about privacy policy could increase uptake. Similarly, Huang et al. [5] explored the determinants of the Singaporean CTA called TraceTogether. They found that those who perceived the app as useful had a higher likelihood of accepting it. However, they found that those with data-privacy concerns had a lower likelihood of accepting it. Tomczyk et al. [6] conducted a CTA study based on the unified theory of acceptance and use of technology (UTAUT) among social media users. The authors found that perceive usefulness, hedonic motivation, and price value positively influence adoption intentions. Similarly, Walrave et al. [7] studied the technology-acceptance model among Belgians. They found that perceived usefulness, subjective norms, and innovativeness are drivers of users’ intention to use a CTA, while privacy concern is a barrier. Similarly, Abuhammad et al. [8] studied the Jordanian population. They found that perceived benefit and voluntariness are drivers of intention to use a CTA, while privacy and ethical concerns are barriers. Moreover, Sharma et al. [9] studied Facebook users and found that personal and social benefits are drivers of intention to install a CTA, while privacy concerns and perceived risk are barriers. Other authors that have investigated the acceptance of CTAs and found similar results include Velicia-Martin et al. [10], Trang et al. [11], Li et al. [12], and Cruz et al. [13]. Cruz et al. [13] explored the potential effectiveness of persuasive features in promoting CTA uptake among the Brazilian population. Although they found that reward and self-monitoring may be effective in increasing users’ intention to use CTAs, the authors did not implement them. As evident in the review, none of the extant studies, include our prior CTA studies [14,15], focused on the relationship between UX design attributes and perceived persuasiveness, which is an antecedent of adoption intentions [16]. Hence, this paper aims to bridge this gap by examining the said relationships and the moderating effect of country of residence, adoption status, and persuasive design.
3. Method
After the launch of COVID Alert in July 2020 by the federal government to curb the spread of COVID-19, we reviewed the app, identified three key interfaces, and requested a UX designer working in our lab to replicate the control versions as well as incorporate persuasive features into each interface. Various persuasive designs were sampled until we arrived and agreed on three, each representing one of the three interfaces. An overview of the app is presented in the following subsection.
4. Study Objective
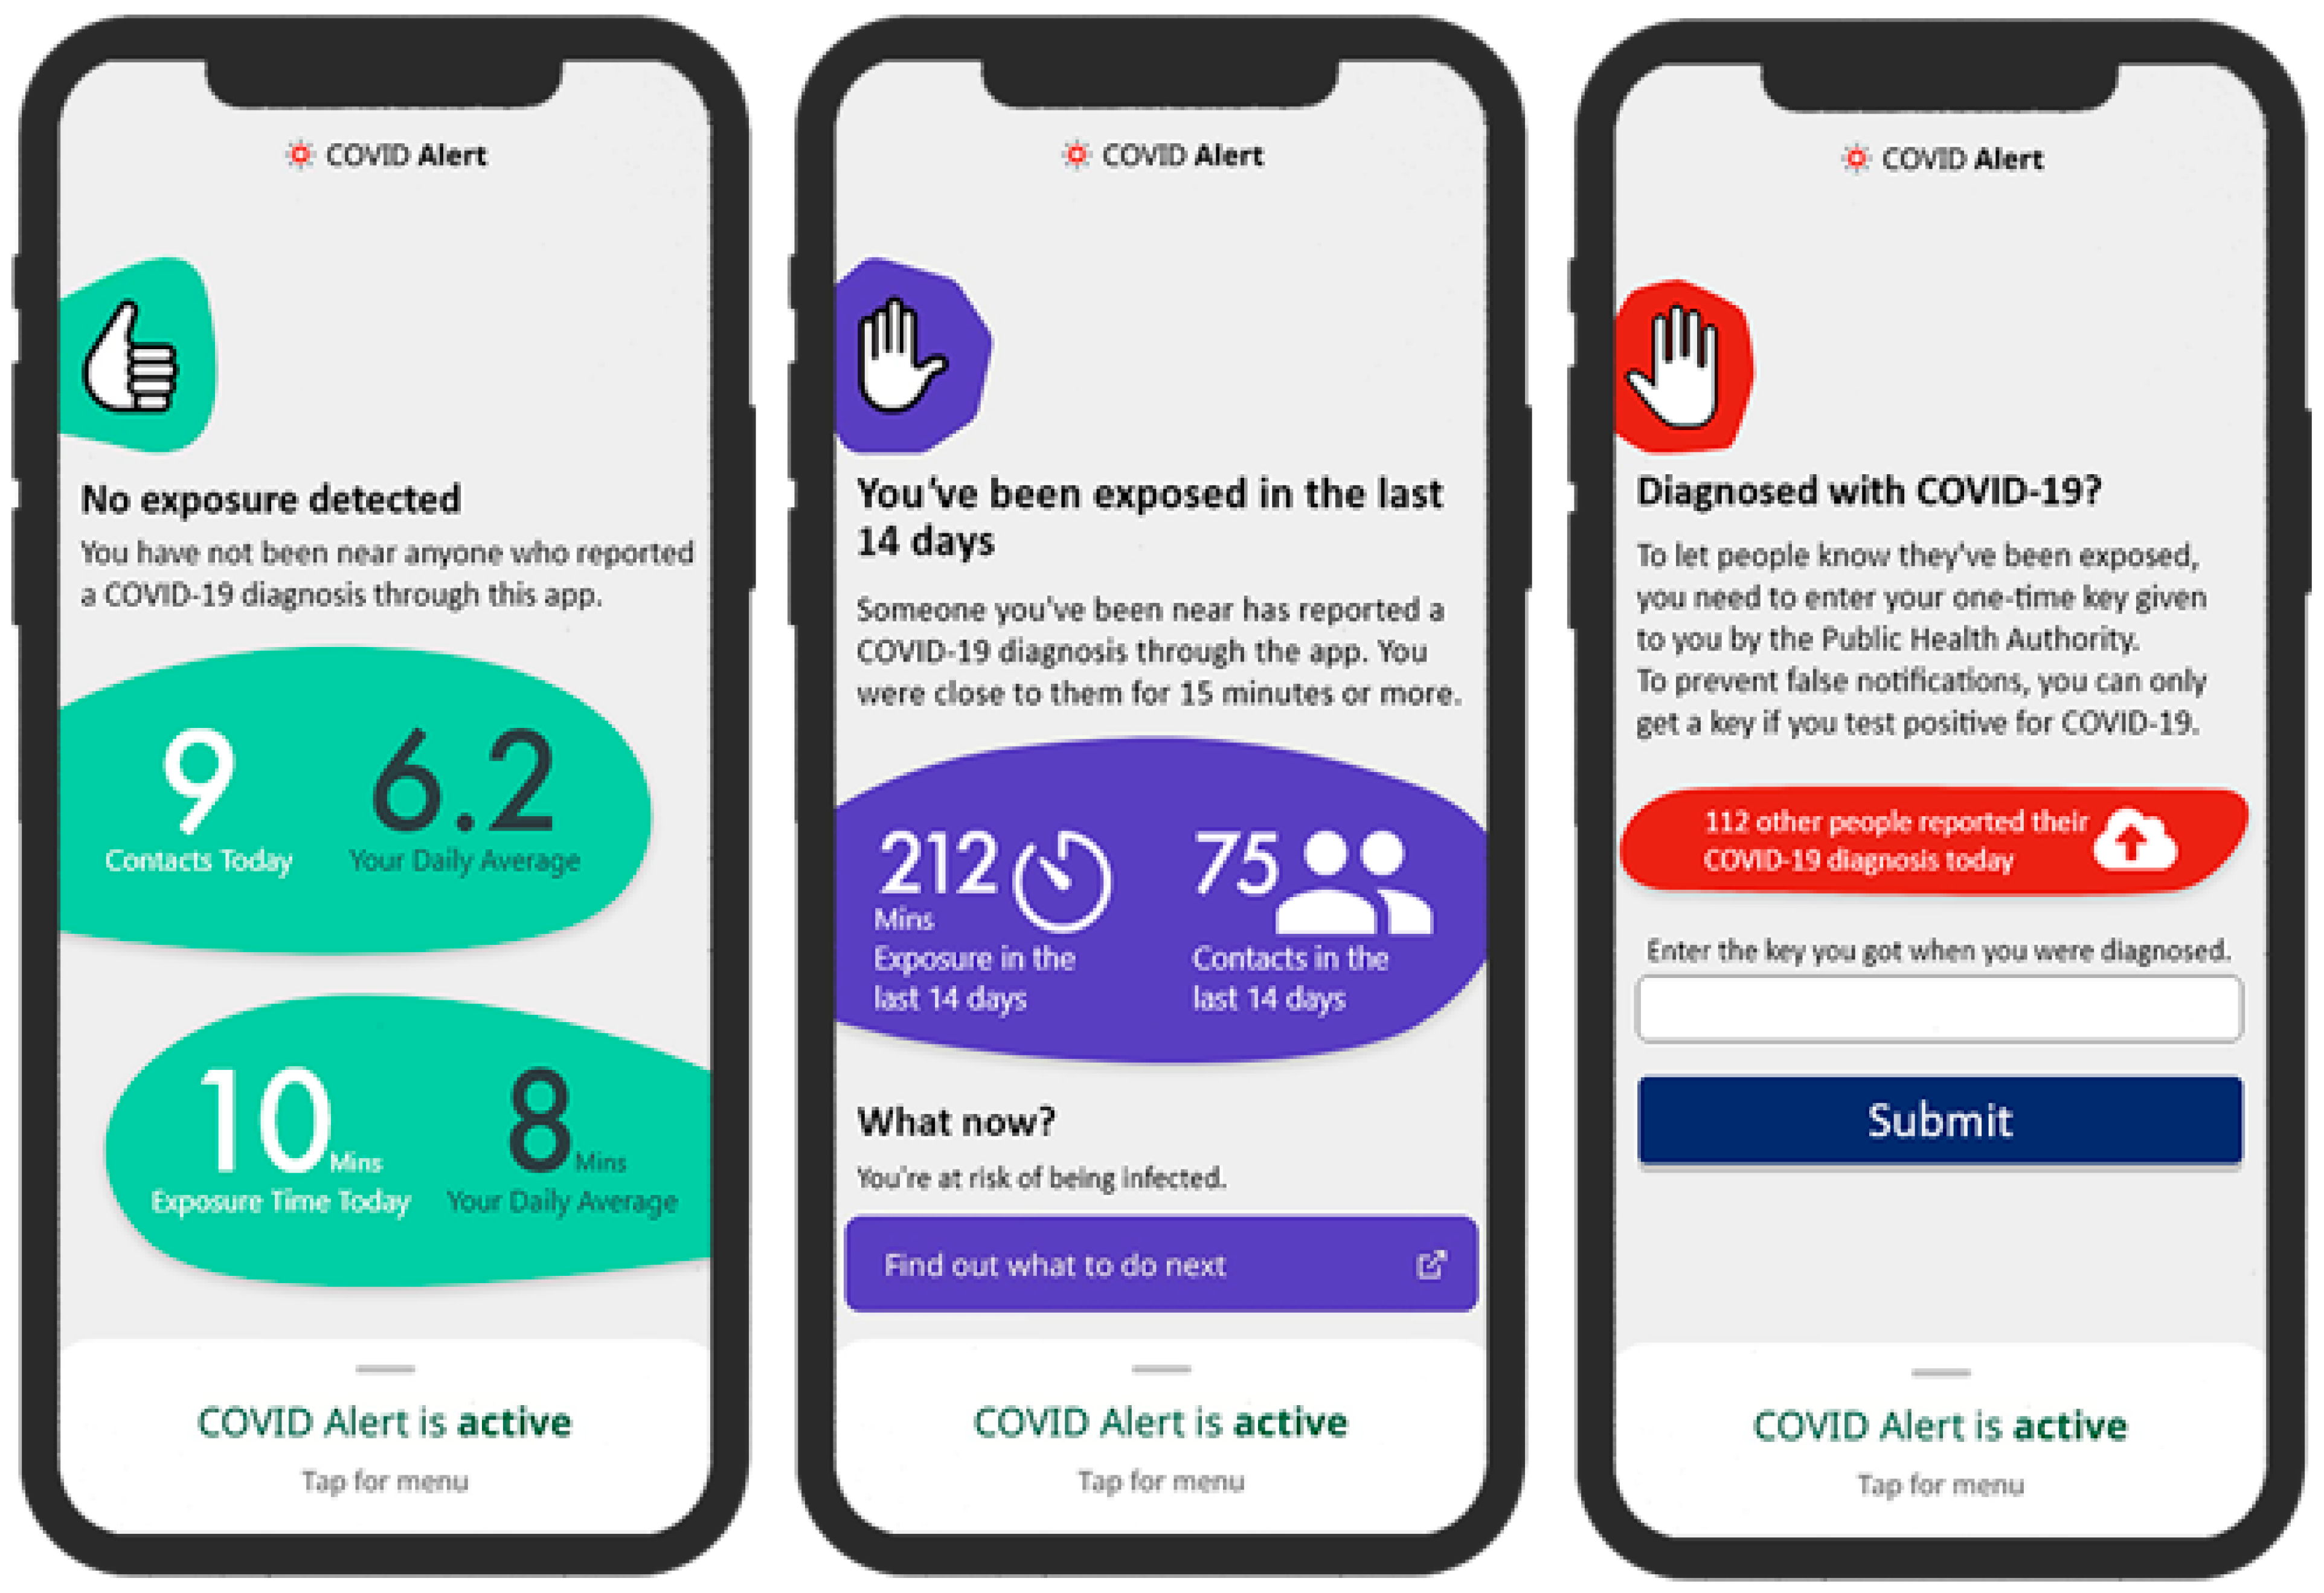
As defined by Fogg [17], persuasive technologies are interactive systems intentionally designed to change attitudes and behaviors. For example, the persuasive version of the diagnosis report interface (Figure 1) is aimed at increasing the reporting of COVID-19 diagnosis when users test positive. In the current study, we aimed to uncover the relationship between the perceived UX attributes of persuasive and control interfaces (e.g., perceived usefulness) and their perceived persuasiveness (i.e., the ability to motivate users to adopt them).
5. Overview of COVID Alert
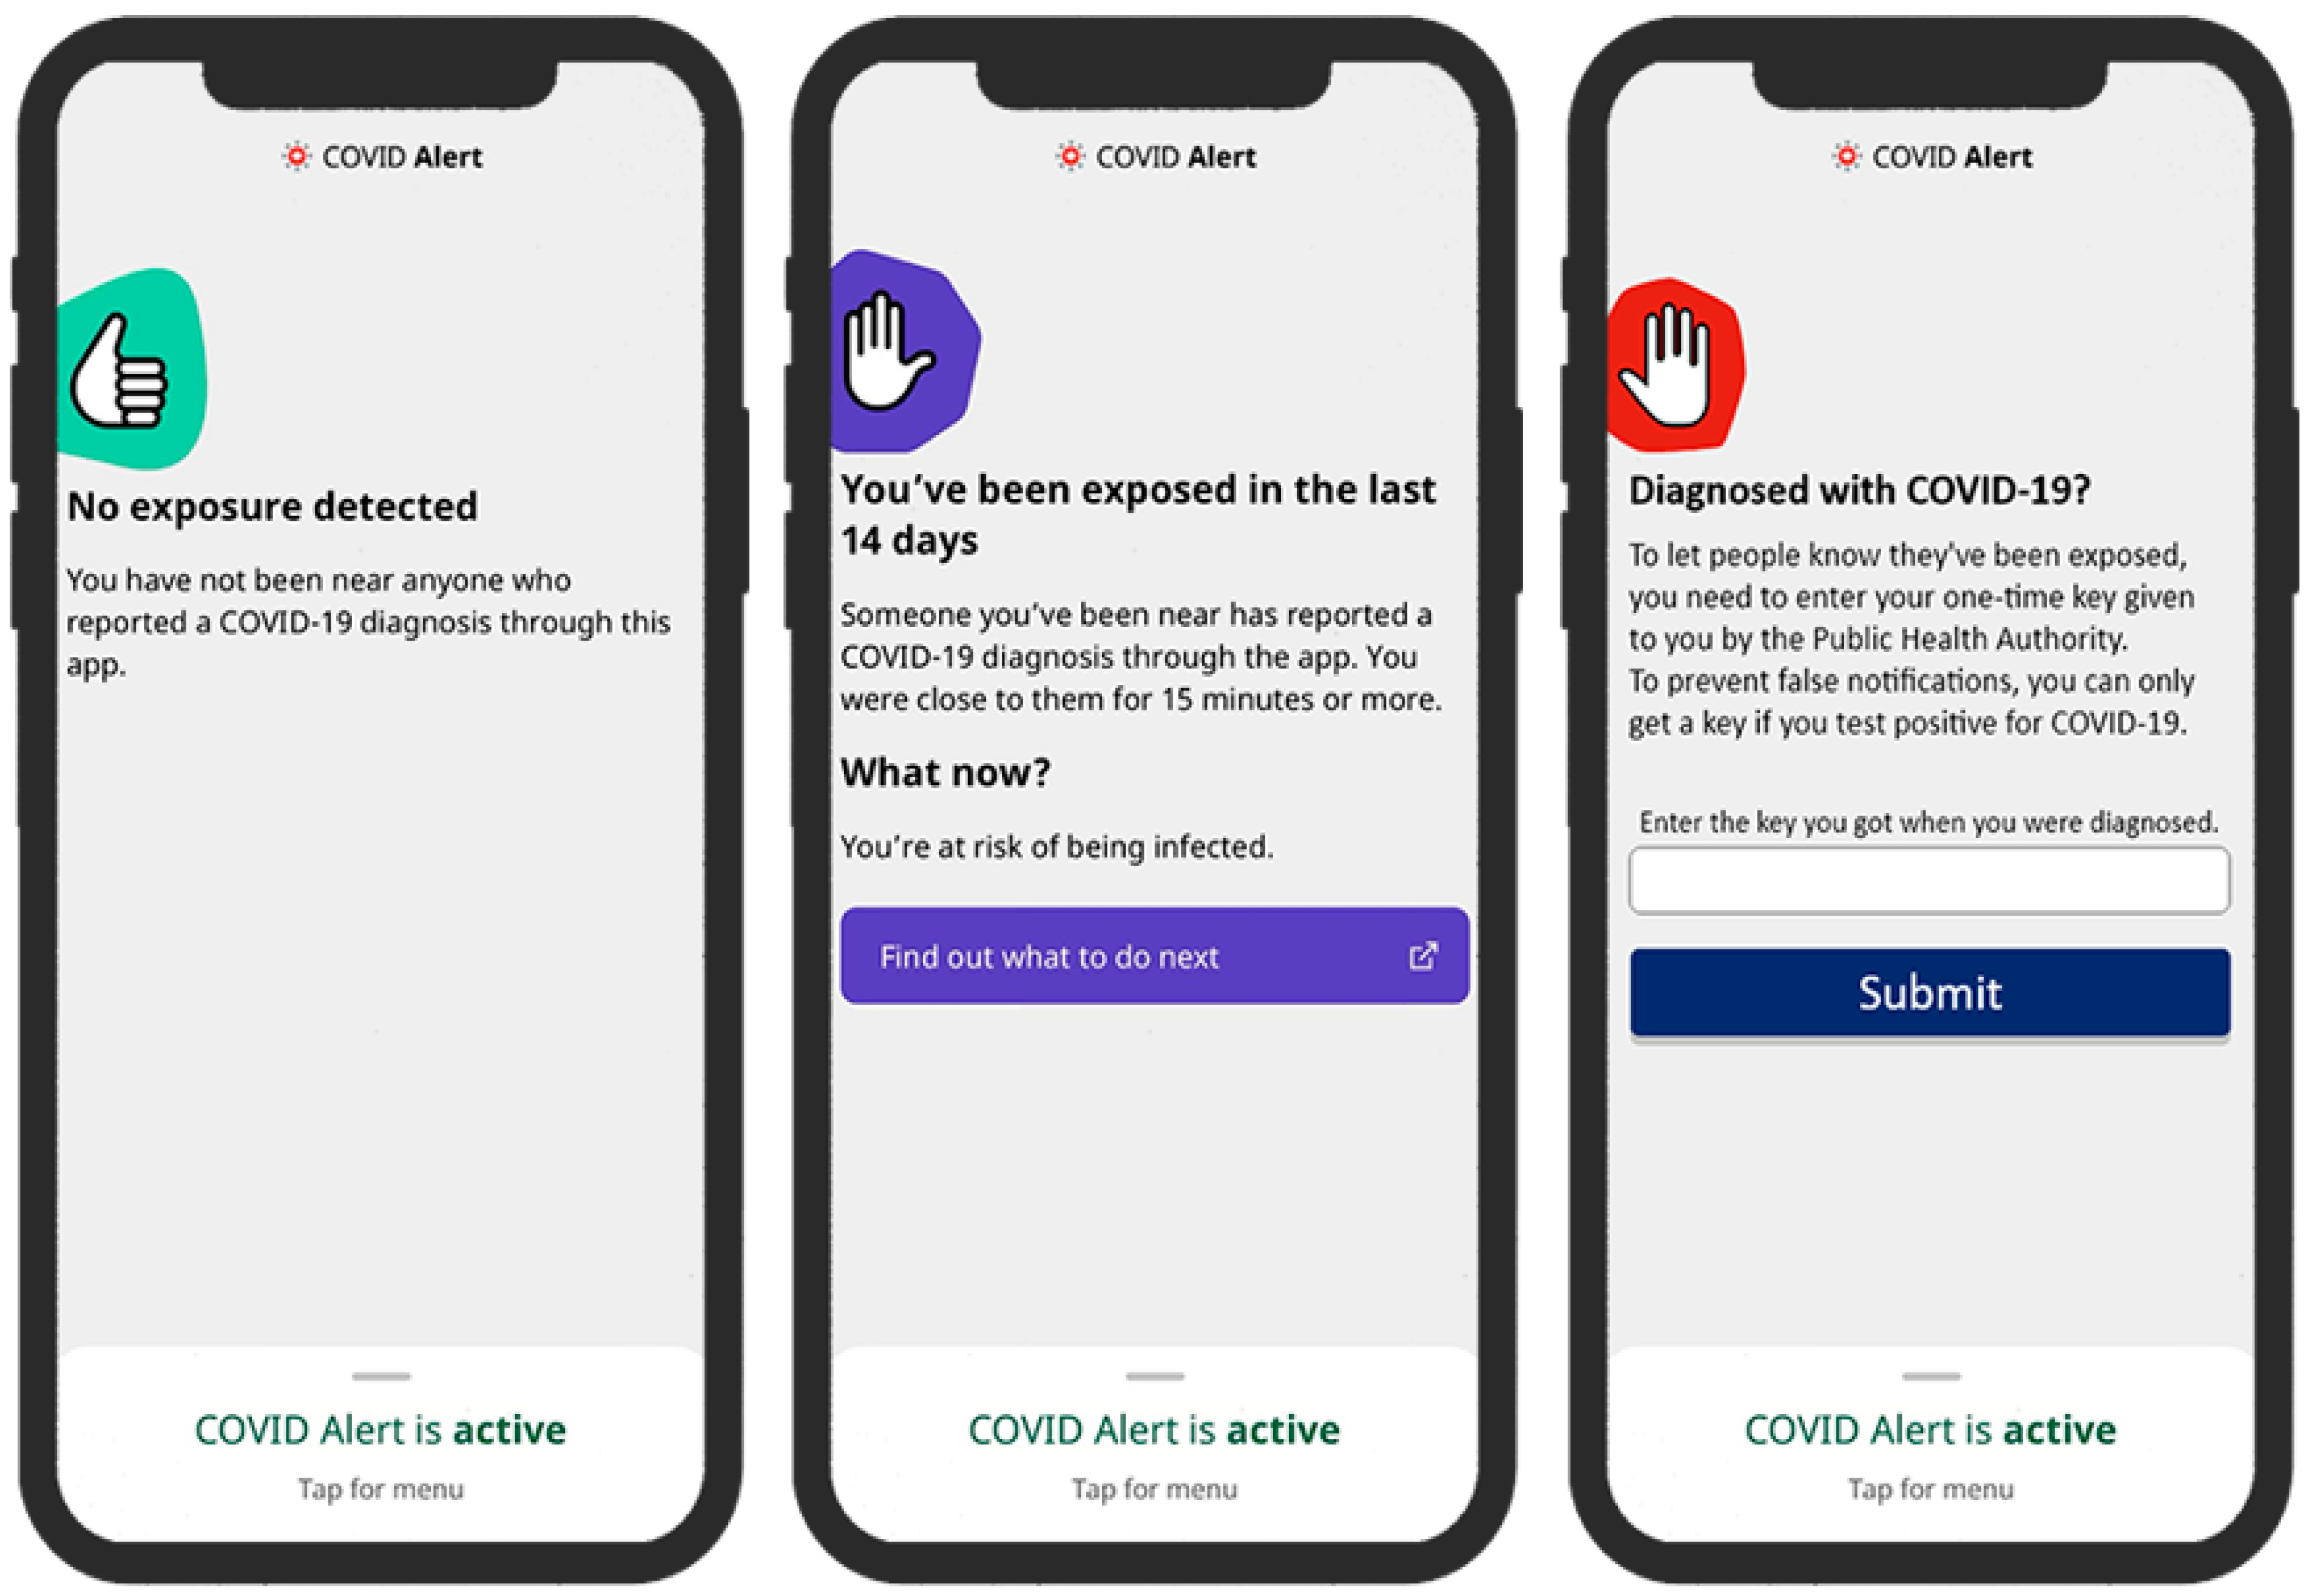
As stated by the Canadian government, the COVID Alert app adopted a decentralized privacy design [4,15]. This means that it does not track the location of users or collect personally identifiable information. Rather, the app stores contact IDs locally on the user’s phone for 14 days, which are later uploaded to a central server whenever the user reports a diagnosis. The uploaded IDs enable the app to notify the user’s contacts of a possible COVID-19 exposure. The functionality of the COVID Alert app is described in detail in our prior work [18]. In this study, we implemented two app designs (persuasive and control) to understand the relationship between the UX design attributes and perceived persuasiveness of CTAs. Each of the app design comprises the three key use cases or interfaces of a CTA: “no exposure status,” “exposure status,” and “diagnosis report.” Figure 2 shows the control versions of the three interfaces from the original app (without persuasive features). Figure 1 shows the persuasive versions (equipped with persuasive features).
No-Exposure Status Interface. The control version (C1) lets the user know that they have not been exposed by being in close contact with someone infected by COVID-19. In addition to this functionality, the persuasive version (P1) supports a self-monitoring feature that enables the user to track their daily exposure level: number and duration of contacts.
Exposure Status Interface. The control version (C2) notifies the user that they may have been exposed to COVID-19 and provides information on what to do next. In addition to this functionality, the persuasive version (P2) supports a self-monitoring feature that enables the user to track their exposure level: number and duration of contacts within the last 14 days.
Diagnosis Report Interface. The control version (C3) allows the user to report their one-time key given to them by the public health authority after testing positive. In addition to this functionality, the persuasive version (P3) supports a social learning feature that enables the user to see the number of other users who have reported their COVID-19 diagnosis using the app.
6. Justification of Implemented Persuasive Features
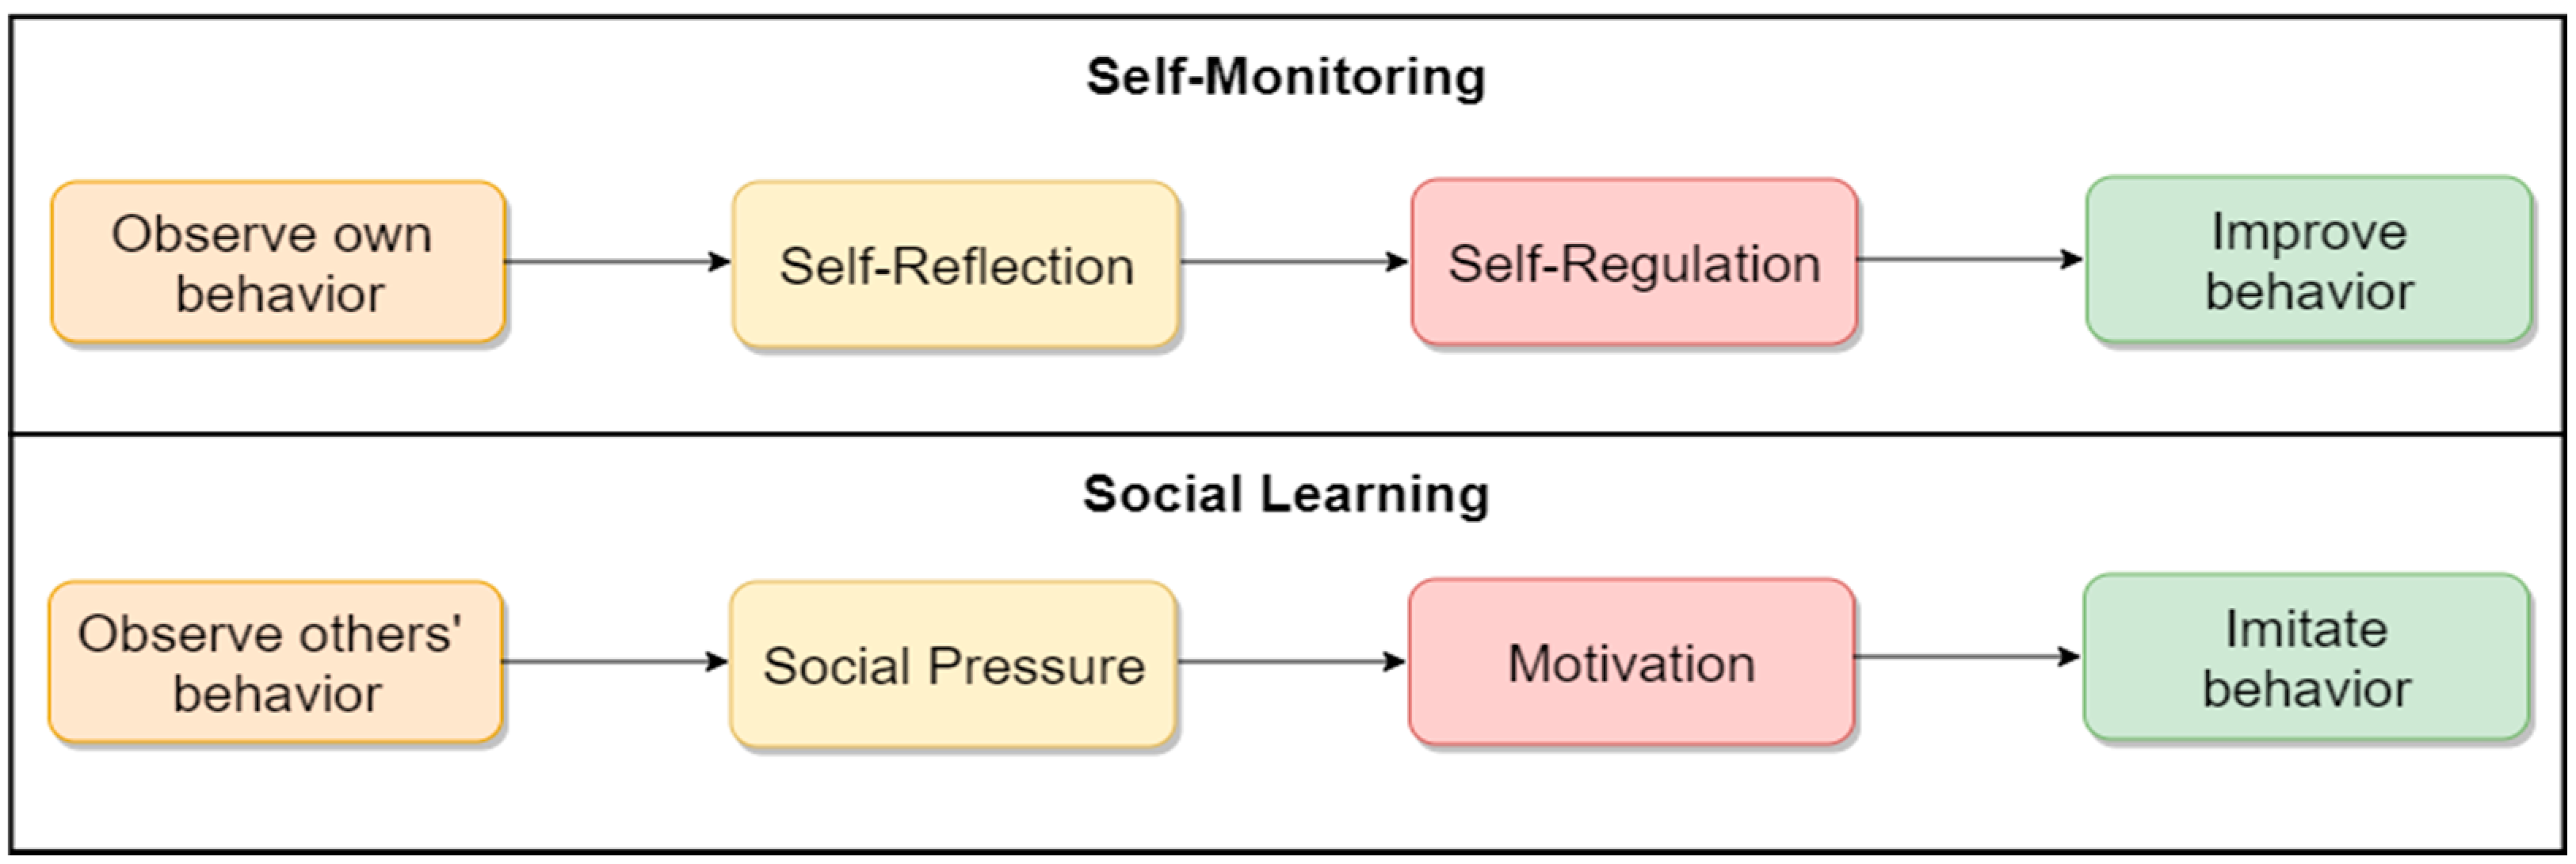
Two types of persuasive strategies are implemented in the three interfaces: personal and social. Prior research shows that both personal and social influence strategies have the potential to motivate behavior change among Canadians [19], although personal strategies such as self-monitoring are more likely than social strategies to be effective in certain domains (e.g., fitness app [20]). The persuasive versions of the no-exposure and exposure status interfaces (Figure 1) are equipped with a self-monitoring feature (a personal persuasive strategy). Self-monitoring is known as one of the cornerstones of persuasive technology aimed at changing attitudes and behaviors [21]. Illustrated in Figure 3, self-monitoring enables users to track their own behavior (e.g., COVID-19 status, progress made towards an exercise goal) and make improvements if need be (e.g., if one is falling behind set goals). Through self-monitoring, users can reflect on their performance or status and make appropriate adjustments (e.g., increase one’s exercise if one falls short of the set goals, go test for COVID-19 if one receives an exposure alert). Given that CTAs aim to reduce the spread of COVID-19, we deem it important for the app users to monitor their number of contacts as well as their exposure time daily. Our prior paper shows that letting users know this information, in addition to their COVID-19 status, can increase the adoption of the COVID Alert app among non-adopters [18]. Moreover, the persuasive version of the diagnosis report interface (Figure 1) is equipped with a social learning feature (a social persuasive strategy). The social learning feature enables the user to observe others’ behavior and puts pressure on them to imitate it. As shown in Figure 3, when the user observes a certain behavior of others (e.g., COVID-19 diagnosis reporting), they are motivated through social pressure to imitate it if they deem the observed behavior beneficial to them, others, or society in general. Our prior paper shows that letting users know how many others have reported their COVID-19 diagnosis can increase reporting among app users who have tested positive [18]. More detail on the justification of the two implemented persuasive strategies (self-monitoring and social learning) and the results of their comparison with the control versions can be found in our prior papers [14,18].
7. Study Participants
We submitted the study (ORE #42638), comprising six questionnaires and their corresponding interfaces, to the ethics office of the University of Waterloo for review. Upon approval, we posted the questionnaires on Amazon Mechanical Turk, a low-cost crowdsourcing commercial platform for recruiting non-convenience samples worldwide. The six interfaces, coupled with their respective questionnaires, were randomly administered to the participants on the platform, with each participant seeing one interface only. The study design and questionnaire administration are described in detail here [18]. A total of 204 participants completed the questionnaires after consenting. Each participant was remunerated with USD2 in appreciation of their time. The data were collected between December 2021 and February 2022. Table 1 shows the demographics of the Canadian and American residents. A total of 446 participants took part in the study: 204 Canadian residents and 242 American residents. The distribution of the interfaces among the participants was as follows: C1 (n = 74), P1 (n = 75), C2 (n = 77), P2 (n = 80), C3 (n = 72), and P3 (n = 68).
8. Measurement Instruments
Table 2 shows the measured constructs in each of the six questionnaires administered to the six groups of participants. The UX design constructs are drawn from the UTAUT proposed by Venkatesh et al. [22,23]. They include perceived usefulness, perceived trust, perceived security, perceived ease of use, perceived privacy protection, perceived compatibility, and perceived enjoyment. These seven constructs are the hypothesized predictors in the research model. Persuasiveness, which is the target construct, was adapted from Lehto et al. [24]. Each of the eight constructs was measured using three items ranging from “strongly disagree—1” to “strongly agree—7.”
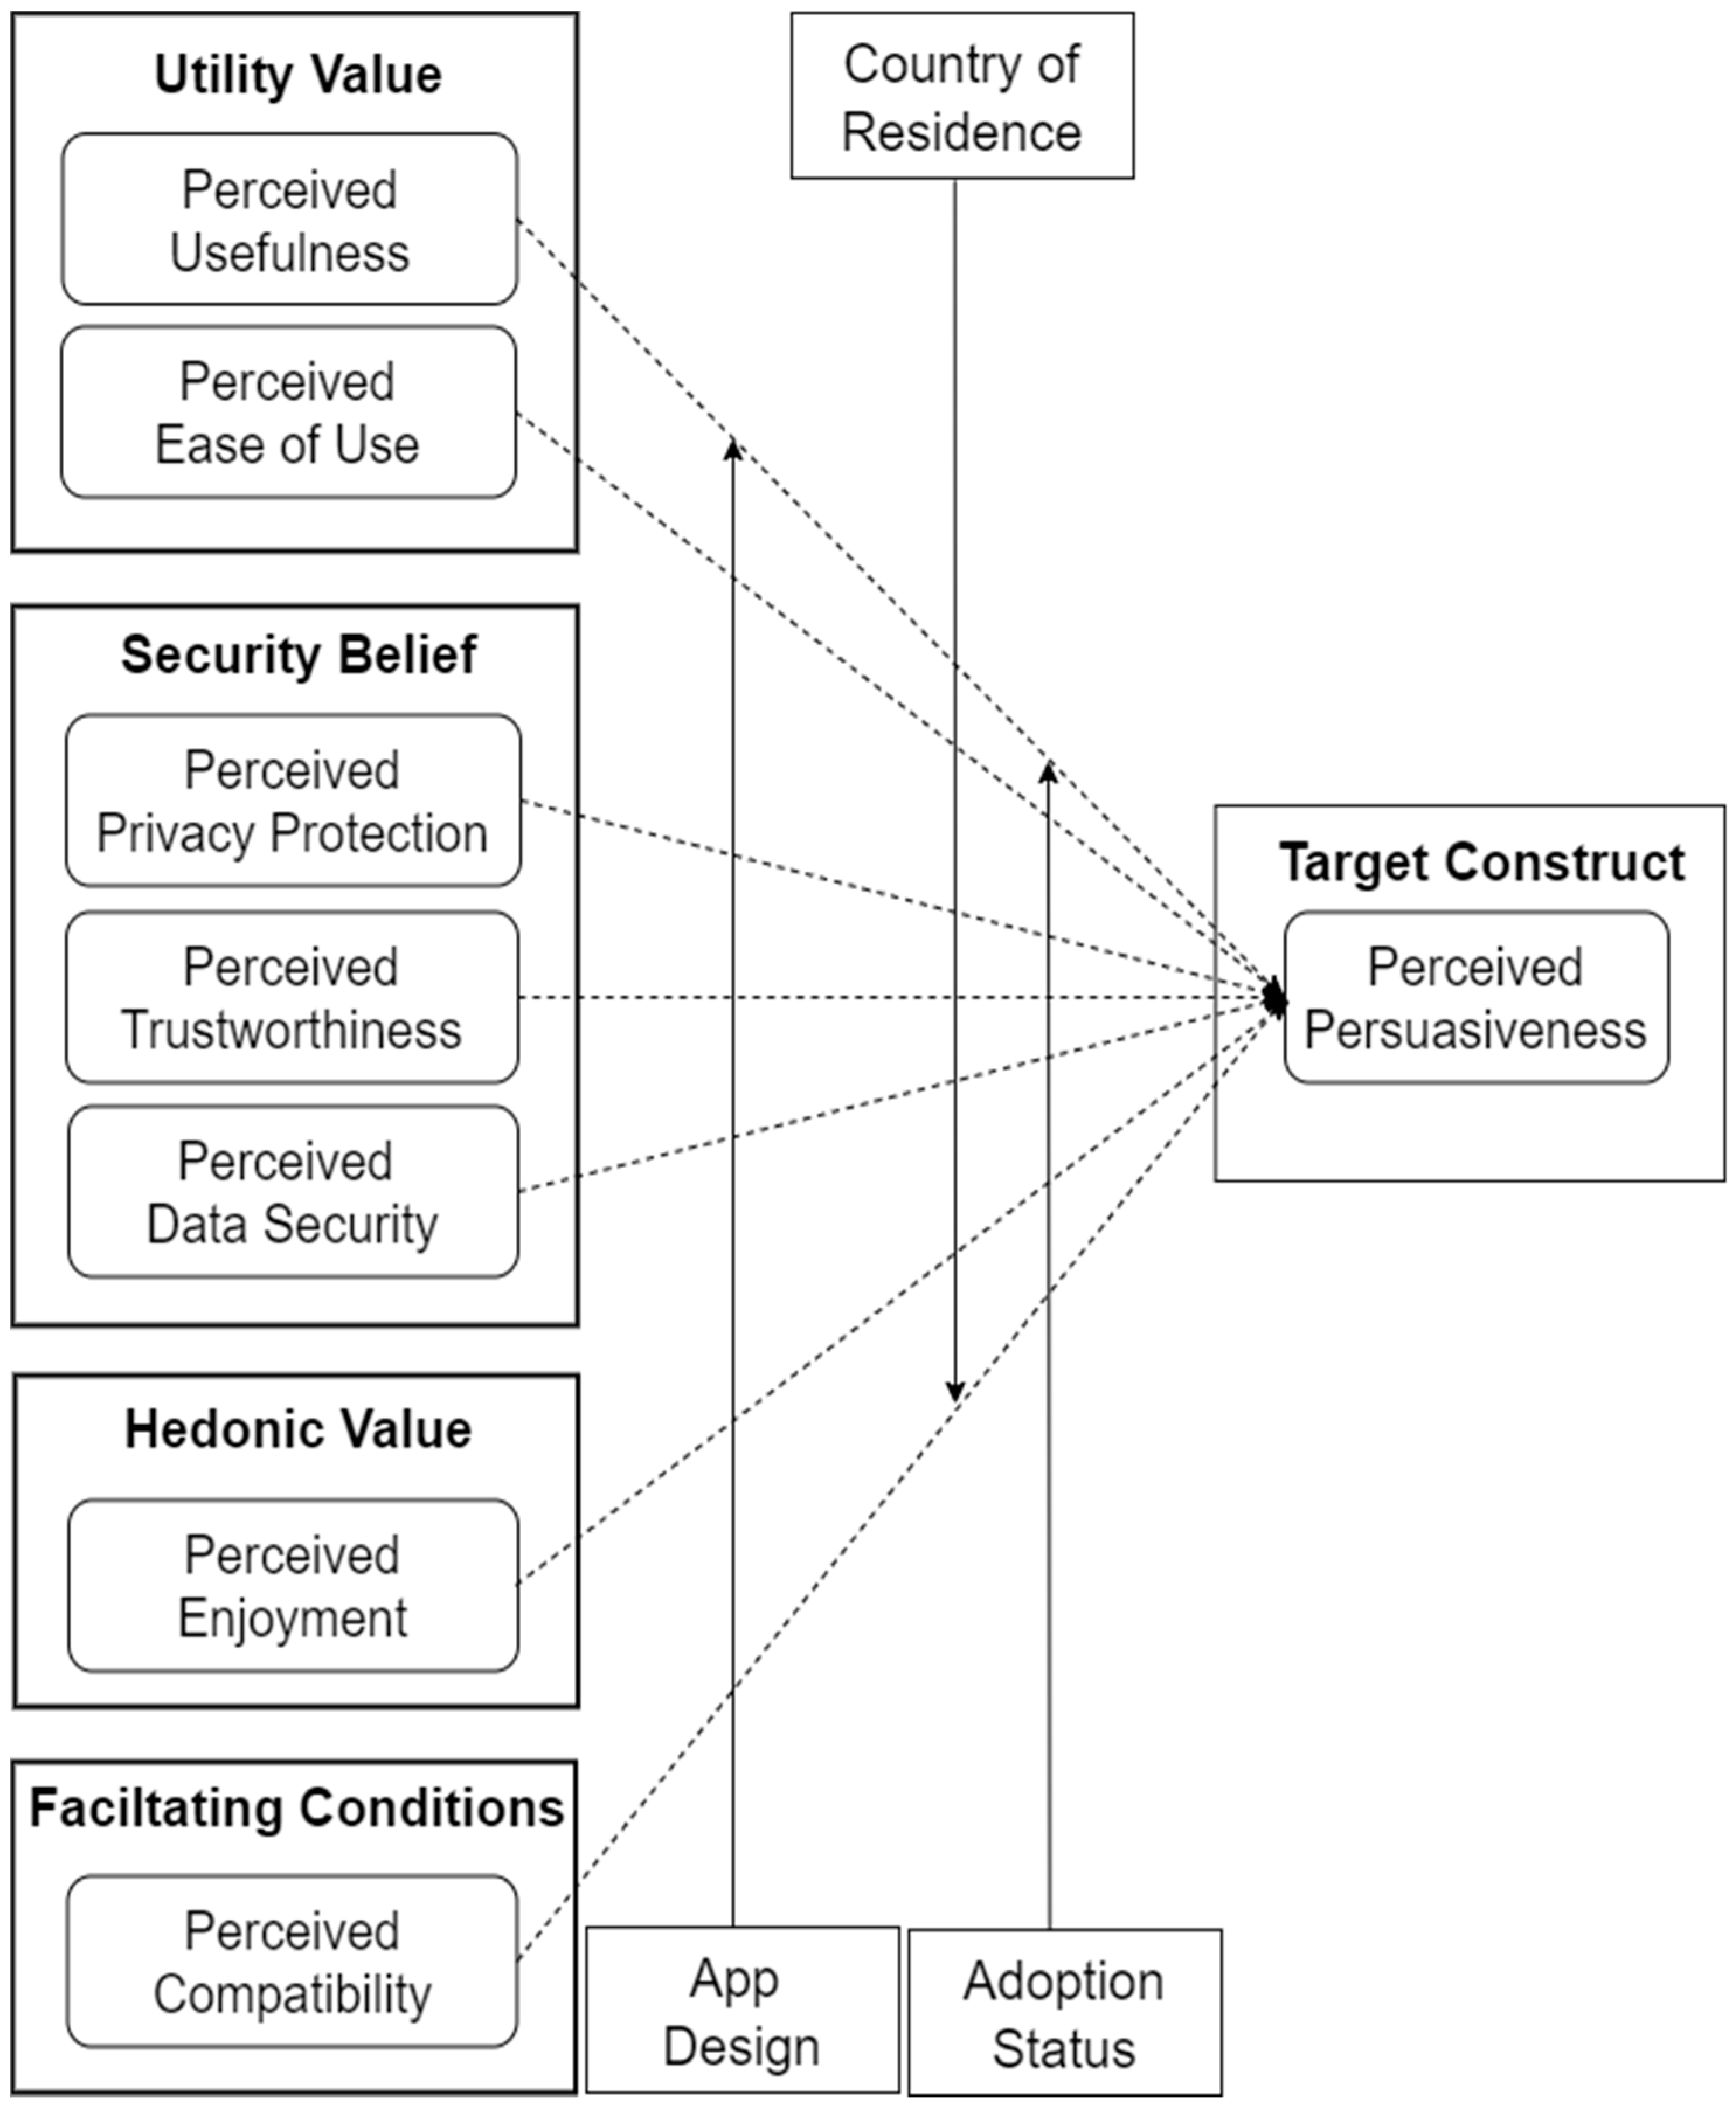
9. Research Model
Figure 4 shows the research model for our study. The model is based on a preliminary model proposed and partially validated by Oyibo and Vassileva in the fitness-app domain. In their model, the authors found that perceived usefulness and perceived aesthetics have a positive relationship with the perceived persuasiveness of a fitness app represented by a screenshot of the home screen. However, they found that perceived credibility (which is related to perceived trustworthiness in our research model) has no significant relationship with perceived persuasiveness, while perceived ease of use has a negative relationship. Due to these mixed findings, which include positive, negative, and nonsignificant relationships between UX design attributes and perceived persuasiveness, we set out to explore the said relationships in addition to new ones in the CTA domain as shown in the research model. The current findings will help us to uncover how the findings in the fitness-app domain generalize to the CTA domain.
10. Results
We used the partial least square path modeling (“plspm”) package in RStudio to analyze the data [28,29]. PLSPM is a statistical technique for analyzing significant relationships among latent variables, which comprise predictors and a target construct. In our path modeling, we conducted two types of analyses: measurement model and structural model [28]. The results of the measurement model analysis, which ought to meet certain criteria, serve as the preconditions for analyzing the structural models.
11. Evaluation of the Measurement Models
Four preconditions—outer loading, internal consistency reliability, convergent validity, and discriminant validity—were evaluated prior to analyzing the structural models. Regarding the outer loadings of the items on their respective constructs, over 95% of them were greater than 0.7 [28], and the other 5% ranged between 0.4 and 0.7. Items less than 0.4 were removed from the respective models. For example, the first item of perceived data security was removed from the American model for being less than 0.4. Similarly, the second item of perceived data security was removed from the adopter and control design models for the same reason [30]. Regarding the internal consistency of the items of each construct, the Dillon–Goldstein metric (ρ) was greater than 0.5, except for less than 5% of the constructs, for which values were between 0.6 and 0.7. Regarding convergent validity, the average variance extracted for each construct was greater than 0.5, except for less than 5% of the constructs, for which values were between 0.4 and 0.5. Finally, regarding discriminant validity, which was based on the cross-loading criterion, no item loaded higher on any other construct than the one it measured.
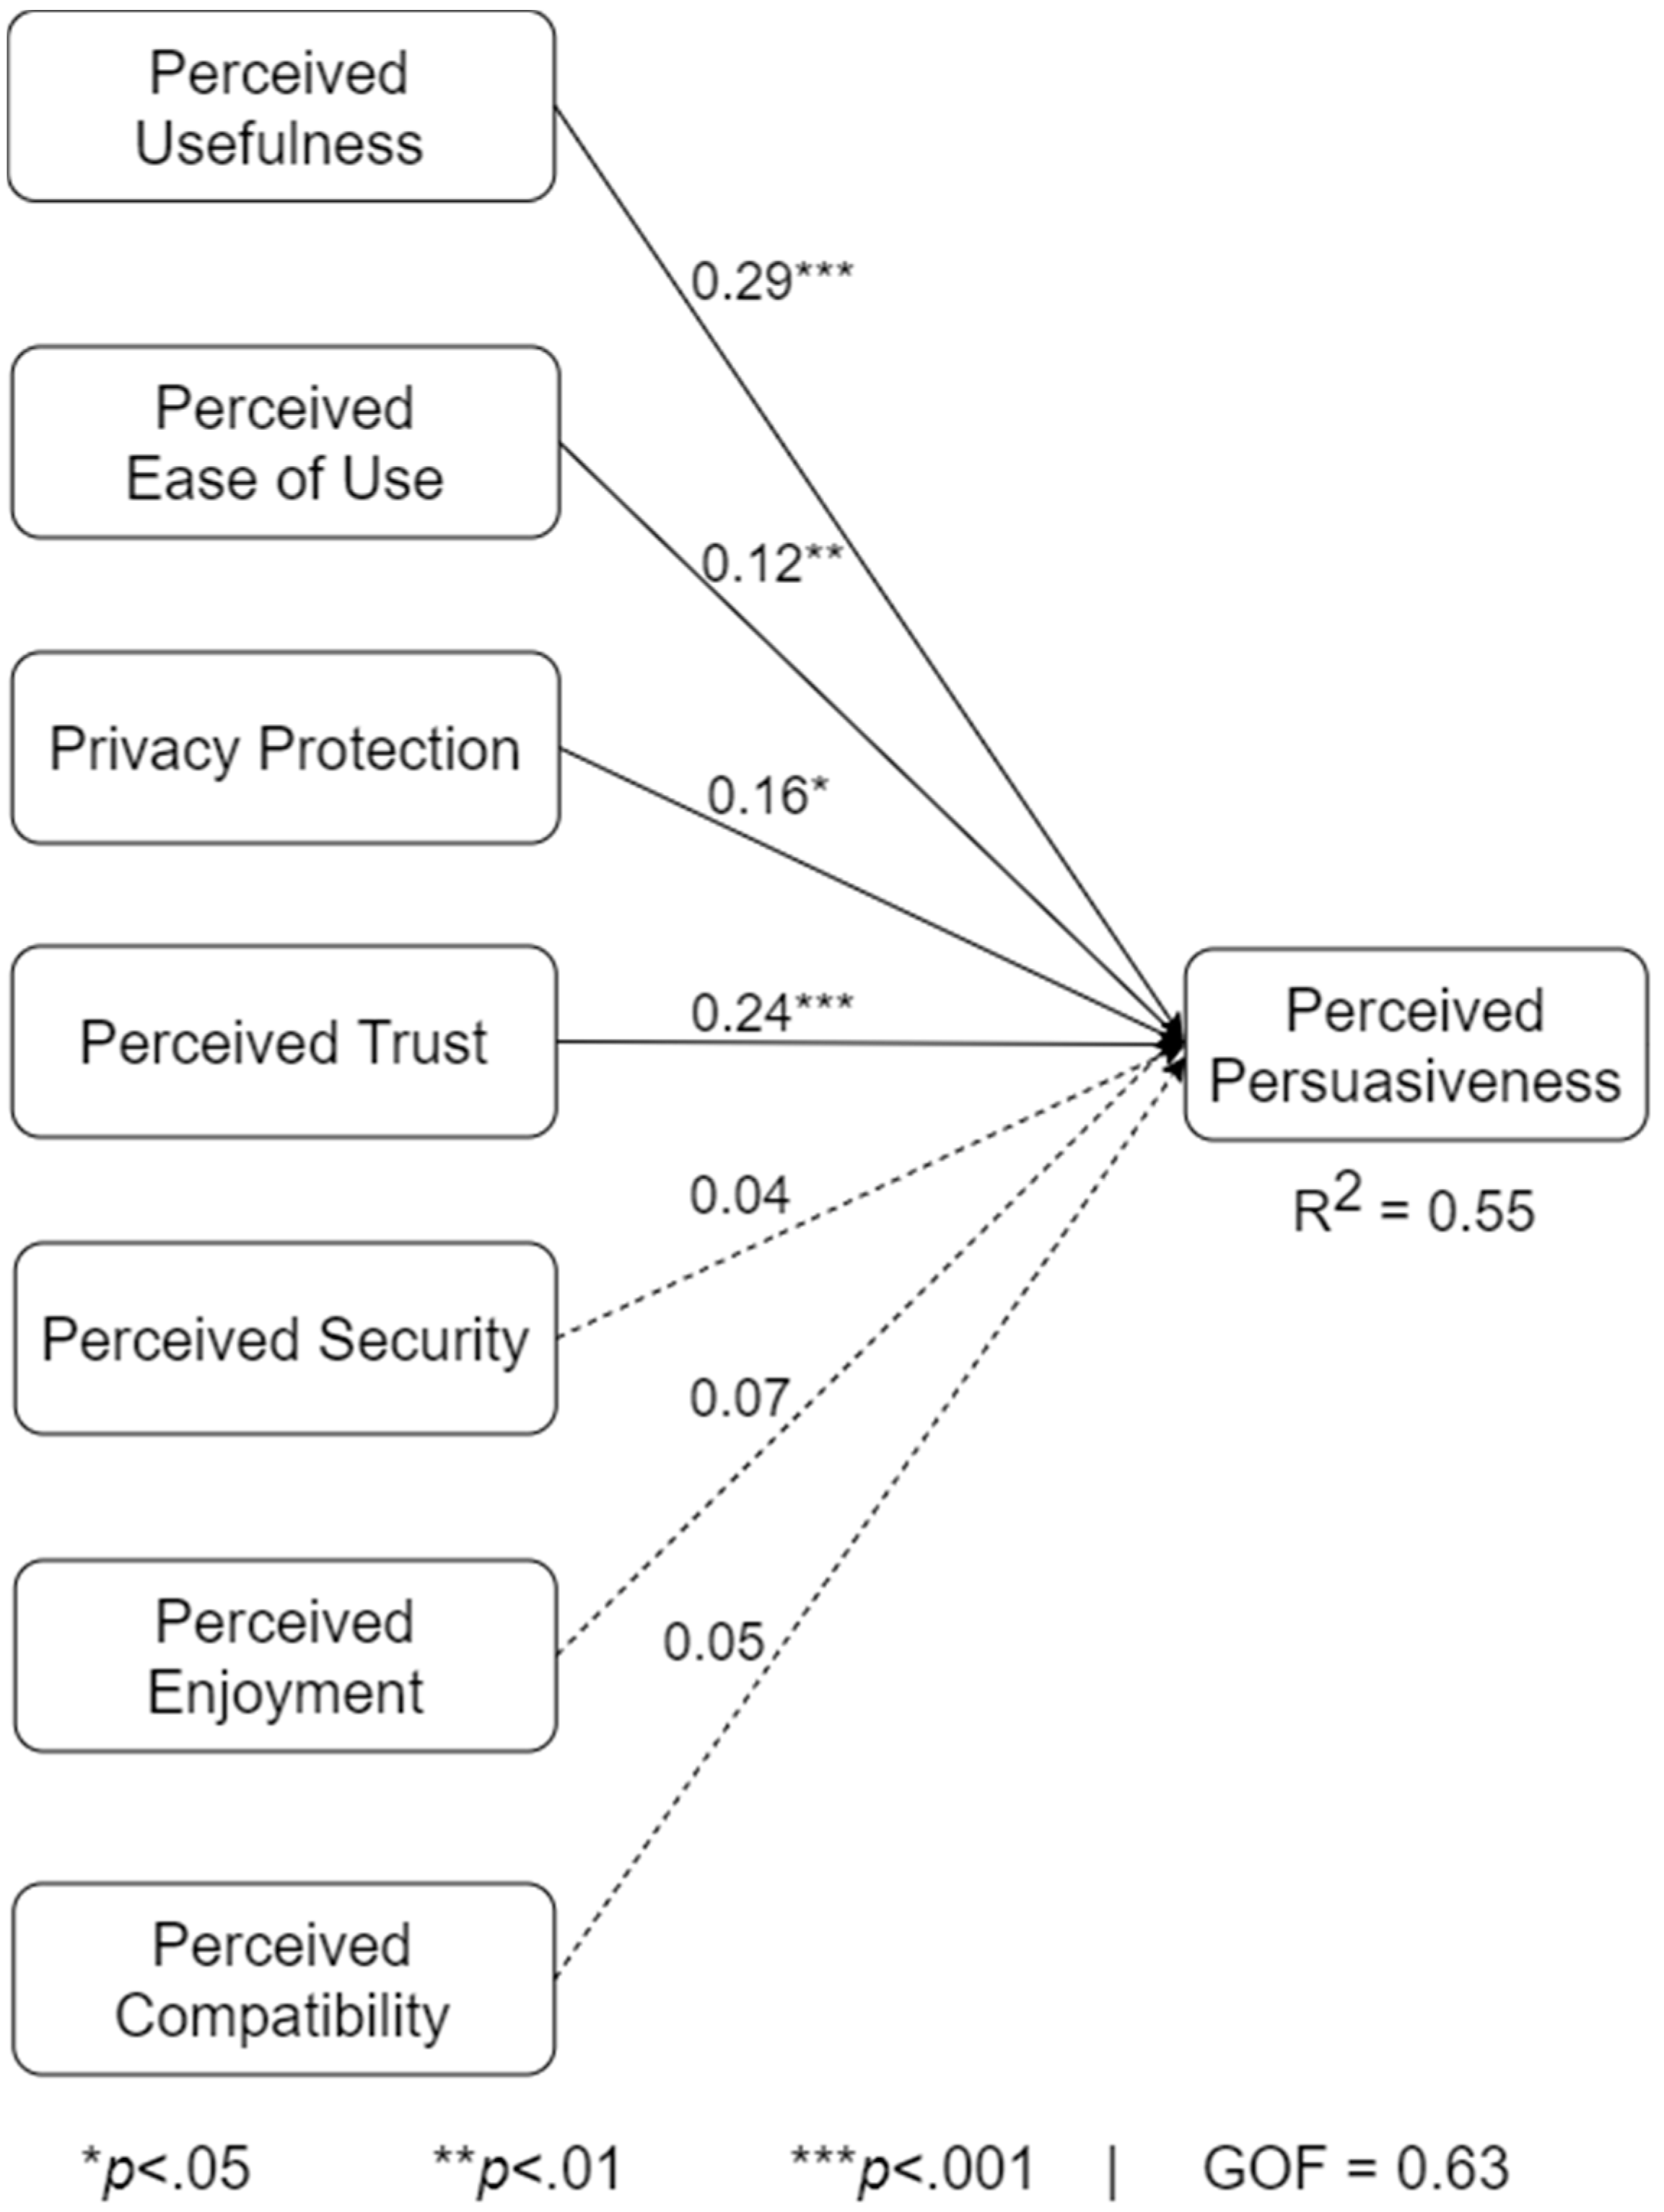
12. Analysis of the Overall Structural Model
Figure 5 shows the overall model of the relationships between the predicting and target constructs. The numerical values on the links, also known as path coefficients (βs), indicate the strength of the relationship between each pair of constructs. The coefficient of determination value (R2) for the target construct indicates the amount of variance of the target construct explained by the predictors. The goodness of fit (GOF) captures how well the model fits its data. In the overall model, the GOF is 63%, which is an acceptable value within the PLSPM community [29]. That said, 55% of perceived persuasiveness is explained by the predictors, with perceived usefulness (β = 0.29, p < 0.001), perceived ease of use (β = 0.12, p < 0.01), privacy protection (β = 0.16, p < 0.05), and perceived trustworthiness (β = 0.24, p < 0.001) being significant. The R2 value of 55% is classified as moderate, given that it is between 0.30 and 0.60 [29]. The results presented in this paper were initially presented in the 2022 Human Factors and Ergonomics Symposium [31]. However, a full paper corresponding to the results was not submitted for publication.
13. Analysis of the Structural Submodels
We built stratified submodels and conducted multigroup analyses to uncover the moderating effect of country of residence, adoption status, and persuasive design. Table 3 shows the various submodels based on each factor and the p-value of the multigroup analysis for each pair of the relationships. The R2 values of perceived persuasiveness range from 48% (for the control design model) to 89% (for the diagnosis report model). The GOF for the submodels ranges from 57% (for the adopter model) to 81% (for the diagnosis report model). Just like in the overall model, perceived usefulness is the most consistent and strongest relationship in the submodels, with 8 and 7 of the 12 relationships in the third column being significant and strong, respectively. Perceived trustworthiness turns to be the second most consistent and strongest relationship, with 6 of the 12 relationships in the fourth column being significant or strong. Privacy protection turns out to be the third most consistent and strongest relationship, with 4 and 3 of the 12 relationships in the fifth column being significant and strong, respectively. Perceived enjoyment is the fourth most consistent and strongest relationship, with 2 of the 12 relationships in the sixth column being significant or strong. It turns out that the relationships regarding perceived ease of use, perceived data security, and perceived compatibility are nonsignificant in all 12 submodels. Finally, the p-value row shows whether the difference in each pair of relationships is significant. For example, regarding perceived usefulness, the difference between the adopter and non-adopter models is significant (p < 0.001), with the relationship (β = 0.43, p < 0.001) being significant in the non-adopter model only.
14. Discussion
We have presented a model of the relationship between UX design attributes and the perceived persuasiveness of CTAs. Overall, regardless of app design, use case, adoption status, and country of residence, four attributes (perceived usefulness, perceived trustworthiness, perceived data privacy, and perceived ease of use) are important (Figure 2). Specifically, among the 12 submodels based on app design, use case, adoption status, and country of residence, two-thirds, half, and one-third of the relationships regarding perceived usefulness, perceived trustworthiness, and perceived data privacy, are statistically significant (Table 3). Interestingly, seven out of the eight significant relationships regarding perceived usefulness are strong (β < 0.20, p < 0.05); all of the six significant relationships regarding perceived trustworthiness are strong; and three-quarters of those regrading perceived data privacy are strong. On the other hand, only one-sixth of the relationships are significant regarding perceived enjoyment and perceived ease of use, with both of the 12 significant relationships in the former and latter being strong and weak, respectively (Table 3). Moreover, none of the 12 relationships regarding perceived data security and perceived compatibility is significant (p > 0.05).
Perceived usefulness and perceived trustworthiness are significantly and strongly associated with perceived persuasiveness. These associations are (near) strong, despite controlling for country of residence and app design. However, when app design and use case are controlled for, some of the significant associations become nonsignificant, especially regarding C1 and P1. Nevertheless, regarding C2 and P2, the association between perceived usefulness and perceived persuasiveness remains significant. The association between perceived trust/perceived enjoyment and perceived persuasiveness remains strong regarding P2 and nonsignificant regarding C2. Secondly, regarding the diagnosis report interface, the association between perceived usefulness and perceived persuasiveness remains significantly strong for C3, while that between perceived privacy and perceived persuasiveness becomes strong for P3. Finally, the control for adoption status shows that perceived usefulness and perceived trustworthiness remain strong in the non-adopter models, while perceived privacy protection becomes significantly strong in the adopter model.
Overall, perceived usefulness has a more consistently strong relationship with perceived persuasiveness, followed by perceived trust, perceived privacy protection, and perceived enjoyment. The other constructs (perceived ease of use, perceived compatibility, and perceived security) have no strong or significant relationship with perceived persuasiveness. The significantly strong relationships hold potential for building machine-learning predictive models by using the significant UX design attributes to predict first-time users’ responsiveness to persuasive strategies implemented in CTAs and other persuasive apps aimed at motivating behavior change. In other words, the significant relationships have the potential to address the cold-start problem experienced by persuasive health technologies. The cold-start problem is the inability of a persuasive app to know what persuasive strategies or messages will be effective in changing a first user’s behavior. This suggests that by asking first-time users a few UX-related questions (e.g., on perceived usefulness and/or perceived trustworthiness) prior to using the app proper, their responsiveness to certain persuasive strategies and messages may be predicted.
15. Differences between Pairs of Submodels
This path modeling shows that the different pairs of submodels are different in terms of the significant relationships and multigroup analysis test.
Based on country of residence, Table 3 shows that all of the three most consistent relationships (perceived usefulness, perceived trustworthiness, and perceived data privacy) are significant and (near) strong in the Canadian models. In the American model, perceived data privacy is not significant. However, there is no statistically significant difference between each pair of relationships.
Based on adoption status, two of the three most consistent relationships (perceived usefulness and perceived trustworthiness) are significant in the non-adopter model, while one of the three (privacy data privacy) is significant in the adopter model. The multigroup analysis shows that regarding perceived usefulness, the difference between non-adopters (β = 0.43, p < 0.01) and adopters (β = 0.03, p > 0.05) is statistically significant (p < 0.001). On the other hand, regarding perceived data privacy, the difference between adopters (β = 0.42, p < 0.01) and non-adopters (β = 0.03, p > 0.05) is statistically significant (p < 0.05). Moreover, perceived ease of use is weakly important for both groups of participants (β ≈ 0.10, p > 0.05).
Based on app design, the number of significant relationships differ between the two groups. Regarding the persuasive designs, the path modeling shows that the three most consistent relationships (perceived usefulness, perceived trustworthiness, and perceived data privacy) as well as perceived enjoyment are important in the prediction of perceived persuasiveness. In control design models, only perceived usefulness and perceived trustworthiness are important. However, the numerical difference between each pair of relationships for both app designs (control and persuasive) is not statistically significant.
Based on the app design for the no-exposure-interface use case, none of the seven relationships in each model (C1 and P1) is significant. However, the perceived trustworthiness relationship (β = 0.79, p = 0.055) in the P1 model is near significant. This is an indication of the importance of perceived trustworthiness regarding P1.
For the exposure-interface use case, the path modeling shows that two of the three most consistent relationships (perceived usefulness and perceived trustworthiness) as well as perceived enjoyment are important in the prediction of perceived persuasiveness of the persuasive design (P2). In the control design model (C2), only perceived usefulness is important. However, the numerical difference between each pair of relationships for both app designs (C2 and P2) is not statistically significant.
Finally, for the diagnosis-report-interface use case, the path modeling shows that only one of the three most consistent relationships is important in each app design: perceived usefulness for C3 (β = 0.31, p < 0.01) and perceived data privacy for P3 (β = 0.75, p < 0.001. The numerical difference between C3 and P3 regarding the latter relationships is statistically significant.
16. Summary of Key Findings
The results of the study are not far from expected. For the most part, they confirm what UX/persuasive technology experts could have foreseen based on general UI/persuasive design guidelines. For example, perceived usefulness (the most significant attribute) is regarded as one of the key attributes of a human–computer interaction system, and perceived trustworthiness (the second most significant attribute) as one of the key features of a persuasive system (e.g., a fitness app [16]). The main takeaways of the paper based on the path models and multigroup analyses can be summarized as follows:
- Perceived usefulness, perceived trustworthiness, and perceived privacy protection are the strongest and most consistent predictors of the perceived persuasiveness of CTAs.
- In addition to the three main predictors, perceived enjoyment is an important predictor of perceived persuasiveness in the persuasive design that implemented self-monitoring (P2), but this is not the case for the control design (C2).
- Overall, the relative number of significant relationships and the coefficient of determination of perceived persuasiveness are higher for the persuasive design models than for the control design models.
- The #3 finding indicates there is more likely to be a significant relationship between UX design attributes and perceived persuasiveness for interfaces that implemented persuasive strategies than otherwise.
- There is no significant difference between the models for Canadian and American residents, although perceived privacy protection is significant in the former but nonsignificant in the latter.
- Perceived usefulness is important for non-adopters, but not for adopters. On the other hand, perceived privacy protection is important for adopters, but not for non-adopters.
- For the diagnosis report interface, privacy protection is important for the persuasive design group (P3), but not for the control design group (C3).
17. Comparison with Prior Work
It is worthy of note that while perceived data security (cf. perceived risk), perceived usefulness, perceived trustworthiness, and perceived compatibility were important predictors of intention to use the app in our prior work [14], only perceived usefulness and perceived trustworthiness are consistently significant in the current work. These findings indicate that: (1) perceived usefulness and perceived trustworthiness are important to users’ viewing the app as persuasive and forming intentions to use it; and (2) perceived data security and perceived compatibility are not important to users’ viewing the app as persuasive, but they are important to their formation of intentions to use it. Moreover, in prior work [14], we found that perceived enjoyment is only significant for the persuasive designs, as in the current work. This suggests that perceived enjoyment is important to users’ viewing the persuasive interfaces (particularly P2) as persuasive and forming their intentions to use the app. The fact that perceived enjoyment is only significant in the persuasive designs in both studies is an indication that perceived enjoyment is an important attribute of the persuasive designs, meaning the persuasive interfaces, unlike the control versions, induce enjoyment that can motivate app adoption through perceived persuasiveness. However, it remains unseen whether the perceived enjoyment of the persuasive versions is higher than that of the control versions. Hence, in future work, we will investigate whether participants’ perceived enjoyment of the persuasive versions is higher than that of the control versions. Given the relationship between perceived enjoyment and perceived persuasiveness and our prior finding that, overall, the perceived persuasiveness of the persuasive designs is higher than that of the control designs [18], we expect to find that the persuasive designs will be viewed as more enjoyable by participants. We will investigate this hypothesis in our future comparison of UX design attributes between the persuasive designs and the control designs.
18. Contribution and Implications of Findings
This paper is the first to demonstrate the relationship between UX design attributes and the perceived persuasiveness of CTAs and uncover the moderating effect of app design, adoption status, and country of residence. For example, we found that perceived usefulness was an important predictor of perceived persuasiveness for non-adopters, but not for adopters. On the other hand, perceived privacy protection was important for adopters, but not for non-adopters. The difference between both groups in both cases is significant (p < 0.05). For non-adopters, the finding indicates that the app must support useful features for them to adopt it. For adopters, interestingly, the control version of COVID Alert supported a decentralized/local storage of users’ contact IDs (a good privacy design compared with centralized/server-based storage). This may partly explain why adopters accepted the app. Moreover, regarding the diagnosis report interface, privacy protection becomes important for the P3 group, but not for the C3 group, with the difference between both groups being significant (p < 0.05). This finding indicates that making participants to be aware of how many other people have reported their diagnosis using the app triggers or brings to the fore privacy concerns. This is evident in perceived privacy protection being the only significant attribute in the P3 model, with a very strong path coefficient (β = 0.75, p < 0.001). One plausible explanation is that the socially oriented persuasive message “112 other people reported their COVID-19 diagnosis today” tends to make P3 participants to think about the possibility of others knowing about their exposure status (testing positive) in the event that they report their COVID-19 diagnosis using the app. This calls for “user privacy and confidentiality reassurance” on the diagnosis report interface, which the current version of COVID Alert does not contain. For example, a message such as “Your COVID-19 status will not be shared with a third party” or “Your COVID-19 status will only be shared with Health Canada for decision-making” or “Your one-time key is highly secured and protected” or “Your one-time key cannot be associated with your personal identity” may help alleviate their fear.
The current finding that perceived usefulness is the strongest and most consistent predictor of perceived persuasiveness replicates Oyibo and Vassileva’s (2021) finding with regard to fitness apps. In their study, Oyibo and Vassileva found that perceived usefulness is the strongest and most consistent predictor of users’ responsiveness to persuasive strategies such as goal-setting/self-monitoring, social learning, reward, cooperation, competition, and social comparison, the first two of which were implemented in P1/P2 and P3, respectively.
The current finding, as well as Oyibo and Vassileva’s (2021), lays the groundwork for future research aimed at uncovering the predictive powers of UX design attributes (such as perceived usefulness, perceived trustworthiness, and perceived privacy protection) regarding users’ responsiveness to persuasive strategies (and messages) in digital heath technologies and their generalizability to other domains. This holds potential, through predictive modeling and rule-based filtering, to address the cold-start problem experienced in persuasive health-communication systems. In other words, users’ responses to a few survey questions about their perception of one or more UX design attributes of a new app (e.g., perceived usefulness) prior to using it proper may reveal the set of persuasive strategies/messages that they are more likely to be responsive to. In future work, using machine-learning algorithms, such as support vector machine and random forest, we will train a predictive model using a portion of the dataset and test it using the other portion to uncover the predictive accuracy of the model.
19. Limitations and Future Work
The study has limitations. The first limitation is that the findings are based on user perception and not actual interaction with the evaluated user interfaces. We recommend that future work focus on user interactions with the interfaces to investigate how the current findings generalize to the interaction context. The second limitation is that our findings are based on three interfaces from a single app (Canada’s COVID Alert), which may not generalize to other CTAs used by other national populations. There is a need for further studies of other apps among other populations to examine the generalizability of the current findings. We plan to examine the relationships among Nigerians to uncover how the current findings generalize across national cultures.
20. Conclusions
We have presented a path model to uncover the relationship between UX design attributes and the perceived persuasiveness of CTAs. Our analysis shows that perceived usefulness, perceived trustworthiness, and perceived privacy (including perceived enjoyment for persuasive designs) have the potential to predict the perceived persuasiveness of CTAs among Canadian and American residents. More importantly, it suggests that the significantly strong relationships can be used as independent variables to predict dependent variables of interest, such as users’ responsiveness to persuasive strategies implemented in persuasive technologies. In future work, we plan to investigate the generalization of the significant relationships to other countries, such as Nigeria in Africa. Moreover, we aim to build machine-learning predictive models using the significant UX design attributes to predict first-time users’ responsiveness to persuasive strategies implemented in CTAs and other persuasive apps aimed at motivating behavior change.
Author Contributions
Conceptualization, K.O. and P.P.M.; methodology, K.O.; interface design, K.O. and P.P.M.; formal analysis, K.O.; investigation, K.O.; resources, P.P.M.; data curation, K.O.; writing—original draft preparation, K.O.; writing—review and editing, K.O. and P.P.M.; visualization, K.O.; supervision, P.P.M.; project administration, K.O. and P.P.M.; funding acquisition, P.P.M. All authors have read and agreed to the published version of the manuscript.
Funding
This project was funded by the Natural Sciences and Engineering Research Council of Canada Discovery Grant (RGPIN-2017-05310) and Cybersecurity and Privacy Institute, University of Waterloo.
Institutional Review Board Statement
The study was conducted according to the guidelines of the Declaration of Helsinki, and approved by the Institutional Review Board (or Ethics Committee) of University of Waterloo (ORE #42638).
Informed Consent Statement
Informed consent was obtained from all subjects involved in the study.
Data Availability Statement
The data is available upon request from the authors.
Conflicts of Interest
The authors declare no conflict of interest.
References
- Vogt, F.; Haire, B.; Selvey, L.; Katelaris, A.L.; Kaldor, J. Effectiveness evaluation of digital contact tracing for COVID-19 in New South Wales, Australia. Lancet Public Health 2022, 7, e250–e258. [Google Scholar] [CrossRef]
- Oyibo, K.; Sahu, K.S.; Oetomo, A.; Morita, P.P. Factors Influencing the Adoption of Contact Tracing Applications: Systematic Review and Recommendations. Front. Digit. Health 2022, 4. [Google Scholar] [CrossRef] [PubMed]
- Akinbi, A.; Forshaw, M.; Blinkhorn, V. Contact tracing apps for the COVID-19 pandemic: A systematic literature review of challenges and future directions for neo-liberal societies. Health Inf. Sci. Syst. 2021, 9, 1–15. [Google Scholar] [CrossRef] [PubMed]
- Horvath, L.; Banducci, S.; Blamire, J.; Degnen, C.; James, O.; Jones, A.; Stevens, D.; Tyler, K. Adoption and continued use of mobile contact tracing technology: Multilevel explanations from a three-wave panel survey and linked data. BMJ Open 2022, 12, e053327. [Google Scholar] [CrossRef] [PubMed]
- Huang, Z.; Guo, H.; Lim, H.Y.F.; Chow, A. Determinants of the acceptance and adoption of a digital contact tracing tool during the COVID-19 pandemic in Singapore. Epidemiol. Infect. 2022, 150, 1–13. [Google Scholar] [CrossRef] [PubMed]
- Tomczyk, S.; Barth, S.; Schmidt, S.; Muehlan, H. Utilizing health behavior change and technology acceptance models to predict the adoption of COVID-19 contact tracing apps: Cross-sectional survey study. J. Med. Internet Res. 2021, 23, e25447. [Google Scholar] [CrossRef]
- Walrave, M.; Waeterloos, C.; Ponnet, K. Ready or Not for Contact Tracing? Investigating the Adoption Intention of COVID-19 Contact-Tracing Technology Using an Extended Unified Theory of Acceptance and Use of Technology Model. Cyberpsychology Behav. Soc. Netw. 2021, 24, 377–383. [Google Scholar] [CrossRef]
- Abuhammad, S.; Khabour, O.F.; Alzoubi, K.H. Covid-19 contact-tracing technology: Acceptability and ethical issues of use. Patient Prefer. Adherence 2020, 14, 1639–1647. [Google Scholar] [CrossRef]
- Sharma, S.; Singh, G.; Sharma, R.; Jones, P.; Kraus, S.; Dwivedi, Y.K. Digital Health Innovation: Exploring Adoption of COVID-19 Digital Contact Tracing Apps. IEEE Trans. Eng. Manag. 2020. [Google Scholar] [CrossRef]
- Velicia-Martin, F.; Cabrera-Sanchez, J.P.; Gil-Cordero, E.; Palos-Sanchez, P.R. Researching COVID-19 tracing app acceptance: Incorporating theory from the technological acceptance model. PeerJ Comput. Sci. 2021, 7, e316. [Google Scholar] [CrossRef]
- Trang, S.; Trenz, M.; Weiger, W.H.; Tarafdar, M.; Cheung, C.M.K. One app to trace them all? Examining app specifications for mass acceptance of contact-tracing apps. Eur. J. Inf. Syst. 2020, 29, 415–428. [Google Scholar] [CrossRef]
- Li, T.; Cobb, C.; Yang, J.; Baviskar, S.; Agarwal, Y.; Li, B.; Bauer, L.; Hong, J.I. What makes people install a COVID-19 contact-tracing spp? Understanding the influence of app design and individual difference on contact-tracing app adoption intention. arXiv 2020, arXiv:228652809. [Google Scholar]
- Cruz, M.M.; Oliveira, R.S.; Beltrao, A.P.V.; Lopes, P.H.B.; Viterbo, J.; Trevisan, D.G.; Bernardini, F. Assessing the level of acceptance of a crowdsourcing solution to monitor infectious diseases propagation. In Proceedings of the 2020 IEEE International Smart Cities Conference, ISC2 2020, Piscataway, NJ, USA, 28 September–1 October 2020. [Google Scholar] [CrossRef]
- Oyibo, K.; Morita, P. COVID Alert: Factors Influencing the Adoption of Exposure Notification Apps among Canadian Residents. Front. Digit. Health 2022, 4, 842661. [Google Scholar] [CrossRef] [PubMed]
- Oyibo, K.; Serdah, S.; Karkhanis, K.; Pelegrini, P.M. Contact Tracing Apps: A Comparative Analysis of Canada’s COVID Alert and India’s Aarogya Setu based on Persuasive System Design Model. In Proceedings of the 17th Adjunct Proccedings of Persuasive Technology. CEUR, Virtual Event, Doha, Qatar, 29–31 March 2022. [Google Scholar]
- Oyibo, K.; Vassileva, J. HOMEX: Persuasive Technology Acceptance Model and the Moderating Effect of Culture. Front. Comput. Sci. 2020, 2. [Google Scholar] [CrossRef]
- Fogg, B.J. Persuasive Technology: Using Computers to Change What We Think and Do, 1st ed.; Morgan Kaufmann: Lancashire, UK, 2003; pp. 1–282. [Google Scholar]
- Oyibo, K.; Morita, P.P. The Effect of Persuasive Design on the Adoption of Exposure Notification Apps: A Proof of Concept Based on COVID Alert. JMIR Form. Res. 2022, 6. [Google Scholar] [CrossRef] [PubMed]
- Oyibo, K.; Orji, R.; Vassileva, J. The influence of culture in the effect of age and gender on social influence in persuasive technology. In Adjunct Publication of the 25th Conference on User Modeling, Adaptation and Person-Alization; 2017; pp. 47–52. Available online: https://dl.acm.org/doi/10.1145/3099023.3099071 (accessed on 1 July 2022).
- Oyibo, K.; Vassileva, J. Investigation of the moderating effect of culture on users’ susceptibility to persua-sive features in fitness applications. Information 2019, 10, 344. [Google Scholar] [CrossRef] [Green Version]
- Orji, R.; Lomotey, R.; Oyibo, K.; Orji, F.; Blustein, J.; Shahid, S. Tracking feels oppressive and ‘punishy’: Ex-ploring the costs and benefits of self-monitoring for health and wellness. Digit. Health 2018, 4, 2055207618797554. [Google Scholar] [CrossRef] [Green Version]
- Venkatesh, V.; Morris, M.; Davis, G.F.D. User acceptance of information technology: Toward a unified view. Manag. Inf. Syst. Quarter. 2003, 27, 425–478. [Google Scholar] [CrossRef] [Green Version]
- Venkatesh, V.; Thong, J.Y.L.; Xu, X. Unified theory of acceptance and use of technology: A synthesis and the road ahead. J. Assoc. Inf. Syst. 2016, 17, 328–376. [Google Scholar] [CrossRef]
- Lehto, T.; Oinas-Kukkonen, H.; Drozd, F. Factors affecting perceived persuasiveness of a behavior change support system. In Proceedings of the Thirty Third International Conference on Information Systems, Brno, Czech Republic, 9–11 December 2020; pp. 1–15. [Google Scholar]
- Venkatesh, V.; Aloysius, J.A.; Hoehle, H.; Burton, S. Design and evaluation of auto-ID enabled shopping assistance artifacts in customers’ mobile phones: Two retail store laboratory experiments. MIS Q. Manag. Inf. Systems. 2017, 41, 83–113. [Google Scholar] [CrossRef]
- Venkatesh, V.; Thong, J.Y.L.; Xu, X. Consumer acceptance and use of information technology: Extending the unified theory of acceptance and use of technology. MIS Q. Manag. Inf. Syst. 2012, 36, 157–178. [Google Scholar] [CrossRef] [Green Version]
- Kukuk, L. Analyzing Adoption of COVID-19 Contact Tracing Apps Using UTAUT; University of Twente: Enschede, The Netherlands, 2018; pp. 1–8. [Google Scholar]
- Hair, J.F.; Hult, G.T.M.; Ringle, C.M.; Sarstedt, M. A Primer on Partial Least Squares Structural Equation Modeling (PLS-SEM); Sage Publications, Inc.: Washington, DC, USA, 2014. [Google Scholar]
- Sanchez, G. PLS Path Modeling with R; 2013; Available online: https://www.academia.edu/5167290/PLS_Path_Modeling_with_R (accessed on 1 July 2022).
- Wong, K.K. Partial Least Squares Structural Equation Modeling (PLS-SEM) Techniques Using SmartPLS. Mark. Bulletin 2013, 24, 1–32. [Google Scholar] [CrossRef]
- Oyibo, K.; Morita, P.P. The Role UX Design Attributes Play in the Perceived Persuasiveness of Contact Tracing Apps. In Human Factors and Ergonomics Symposiums; 2022; Available online: https://hfeshcs2022.conference-program.com/ (accessed on 1 July 2022).
Figure 1.
Persuasive versions showing the incorporation of self-monitoring (first, second) and social learning (third) [18].
Figure 1.
Persuasive versions showing the incorporation of self-monitoring (first, second) and social learning (third) [18].

Figure 2.
Control versions of key UIs of COVID Alert [18].
Figure 2.
Control versions of key UIs of COVID Alert [18].

Figure 3.
The operational mechanism of self-monitoring and social learning [14].
Figure 3.
The operational mechanism of self-monitoring and social learning [14].

Figure 4.
Research model.

Figure 5.
Overall model for the entire dataset.


Table 1.
Participants’ demographics (n = 446).
| Number | Percentage | ||||||
|---|---|---|---|---|---|---|---|
| Criterion | Subgroup | Overall | Canada | America | Overall | Canada | America |
| Gender | Male | 272 | 118 | 154 | 61.0 | 57.8 | 63.6 |
| Female | 161 | 78 | 83 | 36.1 | 38.2 | 34.3 | |
| Others | 13 | 8 | 5 | 2.9 | 3.9 | 2.1 | |
| Age | <18 | 2 | 1 | 1 | 0.4 | 0.5 | 0.4 |
| 18–24 | 54 | 41 | 13 | 12.1 | 20.1 | 5.4 | |
| 25–34 | 162 | 69 | 93 | 36.3 | 33.8 | 38.4 | |
| 35–44 | 124 | 53 | 71 | 27.8 | 26.0 | 29.3 | |
| 45–54 | 59 | 20 | 39 | 13.2 | 9.8 | 16.1 | |
| 55+ | 33 | 11 | 22 | 7.4 | 5.4 | 9.1 | |
| Unspecified | 12 | 9 | 3 | 2.7 | 4.4 | 1.2 | |
| Education | Technical/Trade | 11 | 5 | 6 | 2.5 | 2.5 | 2.5 |
| High School | 103 | 39 | 64 | 23.1 | 19.1 | 26.4 | |
| Bachelor | 229 | 107 | 122 | 51.3 | 52.5 | 50.4 | |
| Master | 74 | 34 | 40 | 16.6 | 16.7 | 16.5 | |
| Doctorate | 10 | 4 | 6 | 2.2 | 2.0 | 2.5 | |
| PhD | 9 | 6 | 3 | 2.0 | 2.9 | 1.2 | |
| Other | 10 | 9 | 1 | 2.2 | 4.4 | 0.4 | |
| Years Using Smartphone | 1–5 | 57 | 30 | 27 | 12.8 | 14.7 | 11.2 |
| 6–10 | 190 | 95 | 95 | 42.6 | 46.6 | 39.3 | |
| 11–20 | 172 | 64 | 108 | 38.6 | 31.4 | 44.6 | |
| >20 | 15 | 8 | 7 | 3.4 | 3.9 | 2.9 | |
| Others | 12 | 7 | 5 | 2.7 | 3.4 | 2.1 | |
| Country of Origin | Canada | 158 | 158 | 0 | 35.4 | 77.5 | 0.0 |
| US | 228 | 0 | 228 | 51.1 | 0.0 | 94.2 | |
| Other | 60 | 46 | 14 | 13.5 | 22.5 | 5.8 | |
| Adoption Status | ENA/CTA | 164 | 82 | 82 | 36.8 | 40.2 | 33.9 |
| Non-Adopter | 276 | 116 | 160 | 61.9 | 56.9 | 66.1 | |
| Unspecified | 6 | 6 | 0 | 1.3 | 2.9 | 0.0 | |
| Control Design | No Exposure | 74 | 33 | 41 | 16.6 | 16.2 | 16.9 |
| Exposure | 77 | 36 | 41 | 17.3 | 17.6 | 16.9 | |
| Diagnosis Report | 72 | 32 | 40 | 16.1 | 15.7 | 16.5 | |
| Persuasive Design | No Exposure | 75 | 35 | 40 | 16.8 | 17.2 | 16.5 |
| Exposure | 80 | 39 | 41 | 17.9 | 19.1 | 16.9 | |
| Diagnosis Report | 68 | 29 | 39 | 15.2 | 14.2 | 16.1 | |
Table 2.
Measurement instruments. * Item reversed during data analysis. The asterisked (*) items were reversed during data analysis.
Table 2.
Measurement instruments. * Item reversed during data analysis. The asterisked (*) items were reversed during data analysis.
| Construct | Items Measuring Construct |
|---|---|
| Perceived Usefulness [25] | (1) I find the app to be useful. (2) Using the app will increase my awareness about the spread of the coronavirus. (3) Using the app will help me in knowing my COVID-19 exposure status. |
| Perceived Ease of Use [26] | (1) It will be easy for me to become skillful using the app. (2) I will find it easy to use the app. (3) Learning to operate the app will be easy for me. |
| Privacy Protection [25] | (1) I feel comfortable giving personal information on this app. (2) I feel comfortable using the app. (3) The app clearly explains how user information will be used. |
| Perceived Trustworthiness [25] | (1) This app is trustworthy. (2) I trust the app keeps my best interests in mind. (3) This design of the app meets my expectations. |
| Perceived Data Security [25] | (1) Using the app will involve data-privacy risk. * (2) Using the app will involve data-confidentiality risk. * (3) My overall perception of risk related to using the app is high. * |
| Perceived Enjoyment [26] | (1) Using the app will be fun. (2) Using the app will be enjoyable. (3) Using the app will be entertaining. |
| Perceived Compatibility [27] | (1) I have the resources necessary to use the app. (2) I have the knowledge necessary to use the app. (3) The app is compatible with other technologies I use. |
| Perceived Persuasiveness [16,24] | (1) The app design is convincing for me to start or continue using the Covid Alert app. (2) The app design is relevant to my using or continued use of the Covid Alert app. (3) The app design influences me to start or continue using the Covid Alert app. |
Table 3.
Submodels based on country of residence, adoption status, and persuasive design.
| Model | NUM | USF | TRT | PRV | ENJ | EOU | SEC | CMP | R2 | GOF |
|---|---|---|---|---|---|---|---|---|---|---|
| Canada | 204 | 0.19 ** | 0.24 ** | 0.25 ** | 0.08 | 0.09 | 0.09 | 0.06 | 0.57 | 0.65 |
| America | 242 | 0.43 *** | 0.28 * | −0.01 | 0.13 | 0.13 | −0.07 | 0.00 | 0.63 | 0.66 |
| p-Value | 0.07 | - | - | - | - | - | - | |||
| Adopter | 164 | 0.03 | 0.14 | 0.42 ** | 0.00 | 0.10 * | −0.10 | 0.12 | 0.49 | 0.57 |
| Non-adopter | 276 | 0.43 ** | 0.22 ** | 0.05 | 0.08 | 0.13 * | 0.06 | 0.02 | 0.60 | 0.67 |
| p-Value | 0.001 | - | 0.05 | - | - | - | - | |||
| Control design | 223 | 0.30 ** | 0.20 ** | 0.09 | 0.07 | 0.11 | 0.12 | 0.14 | 0.48 | 0.60 |
| Persuasive design | 223 | 0.32 ** | 0.23 * | 0.12 * | 0.21 * | 0.11 | 0.09 | −0.02 | 0.68 | 0.71 |
| p-Value | - | - | - | - | - | - | - | |||
| C1 | 74 | 0.34 | 0.34 | 0.02 | 0.05 | 0.10 | 0.15 | 0.06 | 0.61 | 0.66 |
| P1 | 75 | 0.12 | 0.79 b | −0.09 | 0.13 | 0.07 | 0.03 | −0.11 | 0.83 | 0.80 |
| p-Value | - | - | - | - | - | - | - | |||
| C2 | 77 | 0.41 * | 0.11 | 0.1 | 0.11 | 0.14 | −0.16 | 0.24 | 0.69 | 0.69 |
| P2 | 80 | 0.29 * | 0.22 ** | 0.08 | 0.27 * | 0.19 | 0.12 | 0.00 | 0.71 | 0.72 |
| p-Value | - | - | - | 0.07 | - | - | - | |||
| C3 | 72 | 0.31 ** | 0.27 | −0.06 | 0.20 | 0.15 | −0.17 | 0.05 | 0.54 | 0.61 |
| P3 | 68 | 0.46 | −0.38 | 0.75 *** | 0.09 | −0.04 | 0.19 | 0.09 | 0.89 | 0.81 |
| p-Value | - | - | 0.05 | - | - | - | - | |||
| #Significant | 8 | 6 | 4 | 2 | 2 | 0 | 0 | |||
| %Significant | 66.67 | 50.00 | 33.33 | 16.67 | 16.67 | 0.00 | 0.00 | |||
| #Strong | 7 | 6 | 3 | 2 | 0 | 0 | 0 | |||
| %Strong | 58.33 | 50.00 | 25.00 | 16.67 | 0.00 | 0.00 | 0.00 |
P1: persuasive no-exposure interface, P2: persuasive exposure interface, P3: persuasive diagnosis report interface, C1: control no-exposure interface, C2: control exposure interface, C3: control diagnosis report interface, NUM: number of participants, USF: perceived usefulness, TRT: perceived trustworthiness, PRV: perceived privacy protection, ENJ: perceived enjoyment, EOU: perceived ease of use, SEC: perceived data security, CMP: perceived compatibility, R2: coefficient of determination, GOF: goodness of fit, * p <.0.05, ** p < 0.01, *** p < 0.001, b borderline significance (p = 0.55), “-”: no significant difference between the two pairs of relationships, #Significant: total number of significant relationships, %Significant: percentage of significant relationships, #Strong: total number of strong significant relationships, %Strong: percentage of strong significant relationships. The bold path coefficient (β ≥ 0.20, p < 0.05) is classified as strongly significant [28].
Publisher’s Note: MDPI stays neutral with regard to jurisdictional claims in published maps and institutional affiliations. |
© 2022 by the authors. Licensee MDPI, Basel, Switzerland. This article is an open access article distributed under the terms and conditions of the Creative Commons Attribution (CC BY) license (https://creativecommons.org/licenses/by/4.0/).
Share and Cite
MDPI and ACS Style
Oyibo, K.; Morita, P.P. The Role UX Design Attributes Play in the Perceived Persuasiveness of Contact Tracing Apps. Multimodal Technol. Interact. 2022, 6, 88. https://doi.org/10.3390/mti6100088
AMA Style
Oyibo K, Morita PP. The Role UX Design Attributes Play in the Perceived Persuasiveness of Contact Tracing Apps. Multimodal Technologies and Interaction. 2022; 6(10):88. https://doi.org/10.3390/mti6100088
Chicago/Turabian StyleOyibo, Kiemute, and Plinio Pelegrini Morita. 2022. "The Role UX Design Attributes Play in the Perceived Persuasiveness of Contact Tracing Apps" Multimodal Technologies and Interaction 6, no. 10: 88. https://doi.org/10.3390/mti6100088