
Investigating the Correlation between Electrolyte Concentration and Electrochemical Properties of Ionogels
 , , , ,
Abstract
:1. Introduction
2. Results and Discussion
3. Experimental Sections
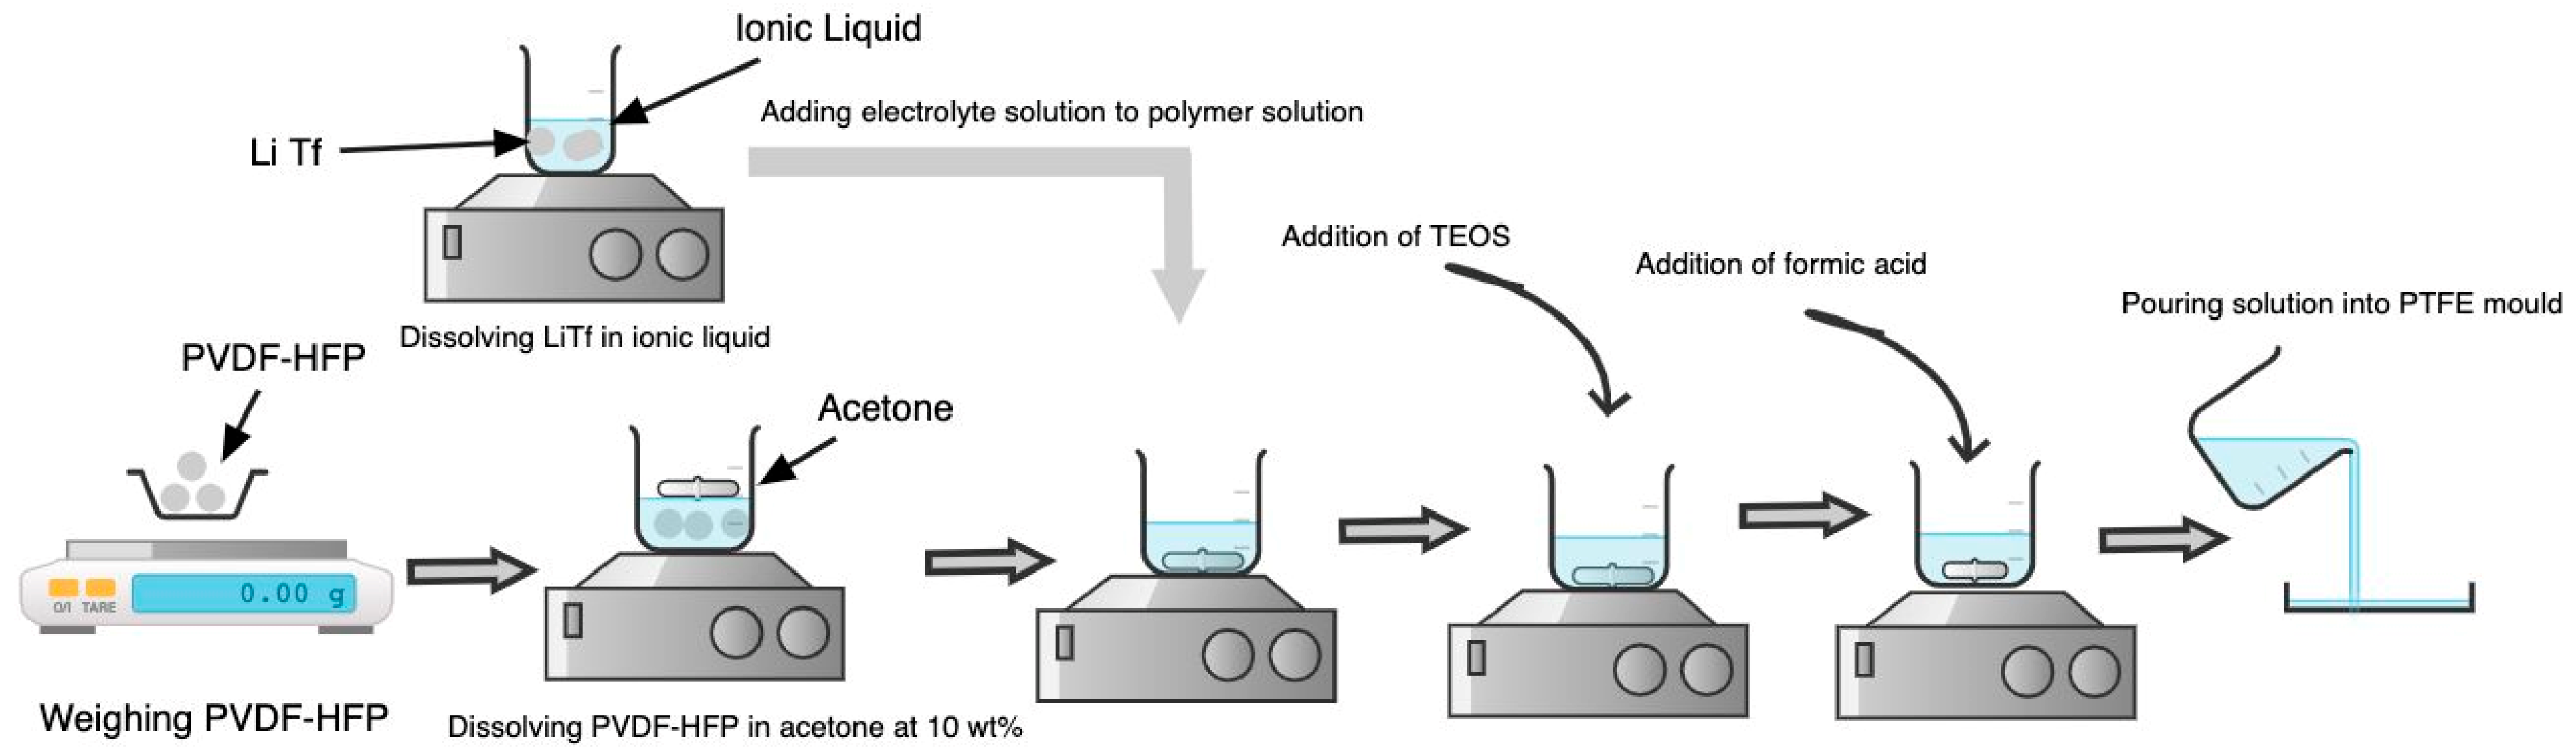
3.1. Synthesis of Ionogel
3.2. Material Characterization
4. Conclusions
Author Contributions
Funding
Institutional Review Board Statement
Informed Consent Statement
Data Availability Statement
Acknowledgments
Conflicts of Interest
Abbreviations
| CV | Cyclic Voltammetry |
| EIS | Electrochemical Impedance Spectroscopy |
| EMIM TFSI | 1-ethyl-3-methylimidazolium bis (trifluoromethyl sulfonate) |
| FTIR | Fourier transform infrared spectroscopy. |
| IG | Ionogel |
| IL | Ionic Liquid |
| LiTf | Lithium trifluoro methane sulfonate |
| LSV | Linear Sweep Voltammetry |
| PVDF-HFP | Poly(vinylidene fluoride)-co-hexafluoropropylene |
| SEM | Scanning Electron Microscopy |
| TEOS | Tetraethyl orthosilicate |
| XRD | X-ray diffraction |
References
- Ling, Y.; An, T.; Yap, L.W.; Zhu, B.; Gong, S.; Cheng, W. Disruptive, Soft, Wearable Sensors. Adv. Mater. 2020, 32, 1904664. [Google Scholar] [CrossRef] [PubMed]
- Wang, F.; Chen, J.; Cui, X.; Liu, X.; Chang, X.; Zhu, Y. Wearable Ionogel-Based Fibers for Strain Sensors with Ultrawide Linear Response and Temperature Sensors Insensitive to Strain. ACS Appl. Mater. Interfaces 2022, 14, 30268–30278. [Google Scholar] [CrossRef]
- Xiang, S.; Chen, S.; Yao, M.; Zheng, F.; Lu, Q. Strain sensor based on a flexible polyimide ionogel for application in high- and low-temperature environments. J. Mater. Chem. C 2019, 7, 9625–9632. [Google Scholar] [CrossRef]
- Kim, S.Y.; Choo, Y.; Bilodeau, R.A.; Yuen, M.C.; Kaufman, G.; Shah, D.S.; Osuji, C.O.; Kramer-Bottiglio, R. Sustainable manufacturing of sensors onto soft systems using self-coagulating conductive Pickering emulsions. Sci. Robot. 2020, 5, eaay3604. [Google Scholar] [CrossRef] [PubMed]
- Kang, Y.; Li, R.; Wang, A.; Kang, J.; Wang, Z.; Bi, W.; Yang, Y.; Song, Y.; Dong, Q. Ionogel-perovskite matrix enabling highly efficient and stable flexible solar cells towards fully-R2R fabrication. Energy Environ. Sci. 2022, 15, 3439–3448. [Google Scholar] [CrossRef]
- Luo, Z.; Li, W.; Yan, J.; Sun, J. Roles of Ionic Liquids in Adjusting Nature of Ionogels: A Mini Review. Adv. Funct. Mater. 2022, 32, 2203988. [Google Scholar] [CrossRef]
- Clarke, C.J.; Matthews, R.P.; Brogan, A.P.S.; Hallett, J.P. Controlling surface chemistry and mechanical properties of metal ionogels through Lewis acidity and basicity. J. Mater. Chem. A 2021, 9, 4679–4686. [Google Scholar] [CrossRef]
- Lan, J.; Li, Y.; Yan, B.; Yin, C.; Ran, R.; Shi, L.-Y. Transparent Stretchable Dual-Network Ionogel with Temperature Tolerance for High-Performance Flexible Strain Sensors. ACS Appl. Mater. Interfaces 2020, 12, 37597–37606. [Google Scholar] [CrossRef]
- Bhandary, R.; Schönhoff, M. Polymer effect on lithium ion dynamics in gel polymer electrolytes: Cationic versus acrylate polymer. Electrochim. Acta 2015, 174, 753–761. [Google Scholar] [CrossRef]
- Tripathi, A.K.; Singh, R.K. Lithium salt assisted enhanced performance of supercapacitor based on quasi solid-state electrolyte. J. Saudi Chem. Soc. 2018, 22, 838–845. [Google Scholar] [CrossRef]
- Guillemin, T.; Douard, C.; Robert, K.; Asbani, B.; Lethien, C.; Brousse, T.; Le Bideau, J. Solid-state 3D micro-supercapacitors based on ionogel electrolyte: Influence of adding lithium and sodium salts to the ionic liquid. Energy Storage Mater. 2022, 50, 606–617. [Google Scholar] [CrossRef]
- Cheng, Y.; Lu, S.; Zheng, R.; Zhang, D.; Zhang, H. Silica-based ionogel electrolyte with porous flower-like structure enables safer lithium ion battery. Appl. Surf. Sci. 2019, 485, 119–127. [Google Scholar] [CrossRef]
- Ogawa, H.; Mori, H. In-situ formation of poly(ionic liquid)s with ionic liquid-based plasticizer and lithium salt in electrodes for solid-state lithium batteries. Polymer 2019, 178, 121614. [Google Scholar] [CrossRef]
- Dutta, A.; Mishra, D.K.; Kundu, D.; Mahanta, U.; Jiang, S.P.; Silvester, D.S.; Banerjee, T. Examining the Electrochemical Nature of an Ionogel Based on the Ionic Liquid [P66614][TFSI] and TiO2: Synthesis, Characterization, and Quantum Chemical Calculations. Ind. Eng. Chem. Res. 2022, 61, 8763–8774. [Google Scholar] [CrossRef]
- Das, S.; Ghosh, A. Charge Carrier Relaxation in Different Plasticized PEO/PVDF-HFP Blend Solid Polymer Electrolytes. J. Phys. Chem. B 2017, 121, 5422–5432. [Google Scholar] [CrossRef]
- Wang, M.; Zhang, P.; Shamsi, M.; Thelen, J.L.; Qian, W.; Truong, V.K.; Ma, J.; Hu, J.; Dickey, M.D. Tough and stretchable ionogels by in situ phase separation. Nat. Mater. 2022, 21, 359–365. [Google Scholar] [CrossRef] [PubMed]
- Wan, C.; Bowen, C.R. Multiscale-structuring of polyvinylidene fluoride for energy harvesting: The impact of molecular-, micro- and macro-structure. J. Mater. Chem. A 2017, 5, 3091–3128. [Google Scholar] [CrossRef] [Green Version]
- Ruan, L.; Yao, X.; Chang, Y.; Zhou, L.; Qin, G.; Zhang, X. Properties and Applications of the β Phase Poly(vinylidene fluoride). Polymers 2018, 10, 228. [Google Scholar] [CrossRef] [Green Version]
- Badatya, S.; Kumar, A.; Sharma, C.; Srivastava, A.K.; Chaurasia, J.P.; Gupta, M.K. Transparent flexible graphene quantum dot-(PVDF-HFP) piezoelectric nanogenerator. Mater. Lett. 2021, 290, 129493. [Google Scholar] [CrossRef]
- Khurana, S.; Chandra, A. Ion conducting polymer-silica hybrid ionogels obtained via non-aqueous sol-gel route. Solid State Ion. 2019, 340, 115027. [Google Scholar] [CrossRef]
- Tafur, J.P.; Fernández Romero, A.J. Electrical and spectroscopic characterization of PVdF-HFP and TFSI—Ionic liquids-based gel polymer electrolyte membranes. Influence of ZnTf2 salt. J. Membr. Sci. 2014, 469, 499–506. [Google Scholar] [CrossRef]
- Tripathi, A.K.; Verma, Y.L.; Singh, R.K. Thermal, electrical and structural studies on ionic liquid confined in ordered mesoporous MCM-41. J. Mater. Chem. A 2015, 3, 23809–23820. [Google Scholar] [CrossRef]
- Chen, X.; Zhao, J.; Zhang, J.; Qiu, L.; Xu, D.; Zhang, H.; Han, X.; Sun, B.; Fu, G.; Zhang, Y.; et al. Bis-imidazolium based poly(ionic liquid) electrolytes for quasi-solid-state dye-sensitized solar cells. J. Mater. Chem. 2012, 22, 18018–18024. [Google Scholar] [CrossRef]
- Li, R.; Fang, Z.; Wang, C.; Zhu, X.; Fu, X.; Fu, J.; Yan, W.; Yang, Y. Six-armed and dicationic polymeric ionic liquid for highly stretchable, nonflammable and notch-insensitive intrinsic self-healing solid-state polymer electrolyte for flexible and safe lithium batteries. Chem. Eng. J. 2022, 430, 132706. [Google Scholar] [CrossRef]
- Barbosa, J.C.; Correia, D.M.; Gonçalves, R.; de Zea Bermudez, V.; Silva, M.M.; Lanceros-Mendez, S.; Costa, C.M. Enhanced ionic conductivity in poly(vinylidene fluoride) electrospun separator membranes blended with different ionic liquids for lithium ion batteries. J. Colloid Interface Sci. 2021, 582, 376–386. [Google Scholar] [CrossRef] [PubMed]
- Pandey, G.P.; Hashmi, S.A. Experimental investigations of an ionic-liquid-based, magnesium ion conducting, polymer gel electrolyte. J. Power Sources 2009, 187, 627–634. [Google Scholar] [CrossRef]
- Sim, L.N.; Majid, S.R.; Arof, A.K. FTIR studies of PEMA/PVdF-HFP blend polymer electrolyte system incorporated with LiCF3SO3 salt. Vib. Spectrosc. 2012, 58, 57–66. [Google Scholar] [CrossRef]
- Asmara, S.N.; Kufian, M.Z.; Majid, S.R.; Arof, A.K. Preparation and characterization of magnesium ion gel polymer electrolytes for application in electrical double layer capacitors. Electrochim. Acta 2011, 57, 91–97. [Google Scholar] [CrossRef]
- Yang, Y.; Wu, Q.; Wang, D.; Ma, C.; Chen, Z.; Zhu, C.; Gao, Y.; Li, C. Decoupling the mechanical strength and ionic conductivity of an ionogel polymer electrolyte for realizing thermally stable lithium-ion batteries. J. Membr. Sci. 2020, 595, 117549. [Google Scholar] [CrossRef]
- Xing, C.; Li, B.; Zhang, J.; Su, P.; Pan, S.; Cao, Y.; Gao, E.; Zhang, H. Rational design of a pre-lithiated ionogel membrane with enhanced safety and electrochemical performances. Mater. Chem. Phys. 2021, 272, 124975. [Google Scholar] [CrossRef]
- Han, D.-D.; Liu, S.; Liu, Y.-T.; Zhang, Z.; Li, G.-R.; Gao, X.-P. Lithiophilic gel polymer electrolyte to stabilize the lithium anode for a quasi-solid-state lithium–sulfur battery. J. Mater. Chem. A 2018, 6, 18627–18634. [Google Scholar] [CrossRef]
- Pei, Y.; Zhang, Y.; Ma, J.; Fan, M.; Zhang, S.; Wang, J. Ionic liquids for advanced materials. Mater. Today Nano 2022, 17, 100159. [Google Scholar] [CrossRef]
- Chen, N.; Xing, Y.; Wang, L.; Liu, F.; Li, L.; Chen, R.; Wu, F.; Guo, S. “Tai Chi” philosophy driven rigid-flexible hybrid ionogel electrolyte for high-performance lithium battery. Nano Energy 2018, 47, 35–42. [Google Scholar] [CrossRef]
- Yuan, C.; Zhu, X.; Su, L.; Yang, D.; Wang, Y.; Yang, K.; Cheng, X. Preparation and characterization of a novel ionic conducting foam-type polymeric gel based on polymer PVdF-HFP and ionic liquid [EMIM][TFSI]. Colloid Polym. Sci. 2015, 293, 1945–1952. [Google Scholar] [CrossRef]
- Noor, N.A.M.; Isa, M.I.N. Investigation on transport and thermal studies of solid polymer electrolyte based on carboxymethyl cellulose doped ammonium thiocyanate for potential application in electrochemical devices. Int. J. Hydrogen Energy 2019, 44, 8298–8306. [Google Scholar] [CrossRef]
- Li, Z.; Lu, Y.; Su, Q.; Wu, M.; Que, X.; Liu, H. High-Power Bipolar Solid-State Batteries Enabled by In-Situ-Formed Ionogels for Vehicle Applications. ACS Appl. Mater. Interfaces 2022, 14, 5402–5413. [Google Scholar] [CrossRef]
- Taylor, M.E.; Clarkson, D.; Greenbaum, S.G.; Panzer, M.J. Examining the Impact of Polyzwitterion Chemistry on Lithium Ion Transport in Ionogel Electrolytes. ACS Appl. Polym. Mater. 2021, 3, 2635–2645. [Google Scholar] [CrossRef]
- Pal, P.; Ghosh, A. Robust Succinonitrile Plastic Crystal-Based Ionogel for All-Solid-State Li-Ion and Dual-Ion Batteries. ACS Appl. Energy Mater. 2020, 3, 4295–4304. [Google Scholar] [CrossRef]
- Dhatarwal, P.; Choudhary, S.; Sengwa, R.J. Electrochemical performance of Li+-ion conducting solid polymer electrolytes based on PEO–PMMA blend matrix incorporated with various inorganic nanoparticles for the lithium ion batteries. Compos. Commun. 2018, 10, 11–17. [Google Scholar] [CrossRef]
- Aziz, S.B.; Hamsan, M.H.; Abdullah, R.M.; Kadir, M.F.Z. A Promising Polymer Blend Electrolytes Based on Chitosan: Methyl Cellulose for EDLC Application with High Specific Capacitance and Energy Density. Molecules 2019, 24, 2503. [Google Scholar] [CrossRef] [Green Version]
- Hadi, J.M.; Aziz, S.B.; Nofal, M.M.; Hussen, S.A.; Hamsan, M.H.; Brza, M.A.; Abdulwahid, R.T.; Kadir, M.F.Z.; Woo, H.J. Electrical, Dielectric Property and Electrochemical Performances of Plasticized Silver Ion-Conducting Chitosan-Based Polymer Nanocomposites. Membranes 2020, 10, 151. [Google Scholar] [CrossRef] [PubMed]
- Kwon, H.-N.; Jang, S.-J.; Kang, Y.C.; Roh, K.C. The effect of ILs as co-salts in electrolytes for high voltage supercapacitors. Sci. Rep. 2019, 9, 1180. [Google Scholar] [CrossRef] [Green Version]
- Pandey, G.P.; Kumar, Y.; Hashmi, S. Ionic liquid incorporated polymer electrolytes for supercapacitor application. Indian J. Chem. Sect. A 2010, 49A, 743–751. [Google Scholar]
- Folaranmi, G.; Bechelany, M.; Sistat, P.; Cretin, M.; Zaviska, F. Comparative Investigation of Activated Carbon Electrode and a Novel Activated Carbon/Graphene Oxide Composite Electrode for an Enhanced Capacitive Deionization. Materials 2020, 13, 5185. [Google Scholar] [CrossRef] [PubMed]
- Negre, L.; Daffos, B.; Turq, V.; Taberna, P.L.; Simon, P. Ionogel-based solid-state supercapacitor operating over a wide range of temperature. Electrochim. Acta 2016, 206, 490–495. [Google Scholar] [CrossRef] [Green Version]
- El-Kady, M.F.; Kaner, R.B. Scalable fabrication of high-power graphene micro-supercapacitors for flexible and on-chip energy storage. Nat. Commun. 2013, 4, 1475. [Google Scholar] [CrossRef] [Green Version]
- González-Gil, R.M.; Borràs, M.; Chbani, A.; Abitbol, T.; Fall, A.; Aulin, C.; Aucher, C.; Martínez-Crespiera, S. Sustainable and Printable Nanocellulose-Based Ionogels as Gel Polymer Electrolytes for Supercapacitors. Nanomaterials 2022, 12, 273. [Google Scholar] [CrossRef]
- Fontaine, O.; Touidjine, A.; Maréchal, M.; Bonhomme, C.; Ribot, F.; Geffroy, B.; Jousselme, B.; Sanchez, C.; Laberty-Robert, C. A one-pot route to prepare class II hybrid ionogel electrolytes. New J. Chem. 2014, 38, 2008–2015. [Google Scholar] [CrossRef]
- Janani, R.; Farmilo, N.; Roberts, A.; Sammon, C. Sol-gel synthesis pathway and electrochemical performance of ionogels: A deeper look into the importance of alkoxysilane precursor. J. Non-Cryst. Solids 2021, 569, 120971. [Google Scholar] [CrossRef]
- Wang, S.; Hsia, B.; Carraro, C.; Maboudian, R. High-performance all solid-state micro-supercapacitor based on patterned photoresist-derived porous carbon electrodes and an ionogel electrolyte. J. Mater. Chem. A 2014, 2, 7997–8002. [Google Scholar] [CrossRef]
- Liew, C.-W.; Ramesh, S. Electrical, structural, thermal and electrochemical properties of corn starch-based biopolymer electrolytes. Carbohydr. Polym. 2015, 124, 222–228. [Google Scholar] [CrossRef] [PubMed]
- Kadir, M.F.Z.; Arof, A.K. Application of PVA–chitosan blend polymer electrolyte membrane in electrical double layer capacitor. Mater. Res. Innov. 2011, 15, s217–s220. [Google Scholar] [CrossRef]
- Aziz, S.B.; Brza, M.A.; Brevik, I.; Hamsan, M.H.; Abdulwahid, R.T.; Majid, S.R.; Kadir, M.F.Z.; Hussen, S.A.; Abdullah, R.M. Characteristics of Glycerolized Chitosan: NH4NO3-Based Polymer Electrolyte for Energy Storage Devices with Extremely High Specific Capacitance and Energy Density Over 1000 Cycles. Polymers 2020, 12, 2718. [Google Scholar] [CrossRef]
- Lim, C.-S.; Teoh, K.H.; Liew, C.-W.; Ramesh, S. Capacitive behavior studies on electrical double layer capacitor using poly (vinyl alcohol)–lithium perchlorate based polymer electrolyte incorporated with TiO2. Mater. Chem. Phys. 2014, 143, 661–667. [Google Scholar] [CrossRef]
- Song, W.; Yang, L.; Sun, Z.; Li, F.; Du, S. Study on actuation enhancement for ionic-induced IL-cellulose based biocompatible composite actuators by glycerol plasticization treatment method. Cellulose 2018, 25, 2885–2899. [Google Scholar] [CrossRef]
- Villar-Chavero, M.M.; Domínguez, J.C.; Alonso, M.V.; Rigual, V.; Oliet, M.; Rodriguez, F. Viscoelastic properties of physical cellulosic bionogels of cholinium lysinate. Int. J. Biol. Macromol. 2019, 133, 262–269. [Google Scholar] [CrossRef] [PubMed]
- Ismail, H.K.; Qader, I.B.; Alesary, H.F.; Kareem, J.H.; Ballantyne, A.D. Effect of Graphene Oxide and Temperature on Electrochemical Polymerization of Pyrrole and Its Stability Performance in a Novel Eutectic Solvent (Choline Chloride–Phenol) for Supercapacitor Applications. ACS Omega 2022, 7, 34326–34340. [Google Scholar] [CrossRef]
- Park, J.; Sun, J.-Y. Phase-Transitional Ionogel-Based Supercapacitors for a Selective Operation. ACS Appl. Mater. Interfaces 2022, 14, 23375–23382. [Google Scholar] [CrossRef]
- Arya, A.; Sharma, A.L. Tailoring of the structural, morphological, electrochemical, and dielectric properties of solid polymer electrolyte. Ionics 2019, 25, 1617–1632. [Google Scholar] [CrossRef]
- Liew, C.-W.; Ramesh, S.; Arof, A.K. Enhanced capacitance of EDLCs (electrical double layer capacitors) based on ionic liquid-added polymer electrolytes. Energy 2016, 109, 546–556. [Google Scholar] [CrossRef]
- Raistrick, I.D.; Macdonald, J.R.; Franceschetti, D.R. Theory. In Impedance Spectroscopy; Wiley Online Library: Hoboken, NJ, USA, 2018; pp. 21–105. [Google Scholar] [CrossRef]
- Abidin, S.Z.Z.; Ali, A.M.; Jaafar, N.K.; Yahya, M.Z.A. Electrical properties of cellulose acetate-based polymer gel electrolytes. AIP Conf. Proc. 2017, 1885, 020088. [Google Scholar] [CrossRef]
- Xiong, R.; Tian, J.; Mu, H.; Wang, C. A systematic model-based degradation behavior recognition and health monitoring method for lithium-ion batteries. Appl. Energy 2017, 207, 372–383. [Google Scholar] [CrossRef]
- Huang, Q.-A.; Shen, Y.; Huang, Y.; Zhang, L.; Zhang, J. Impedance Characteristics and Diagnoses of Automotive Lithium-Ion Batteries at 7.5% to 93.0% State of Charge. Electrochim. Acta 2016, 219, 751–765. [Google Scholar] [CrossRef]
- Meddings, N.; Heinrich, M.; Overney, F.; Lee, J.-S.; Ruiz, V.; Napolitano, E.; Seitz, S.; Hinds, G.; Raccichini, R.; Gaberšček, M.; et al. Application of electrochemical impedance spectroscopy to commercial Li-ion cells: A review. J. Power Sources 2020, 480, 228742. [Google Scholar] [CrossRef]
- Huang, J.; Li, Z.; Liaw, B.Y.; Zhang, J. Graphical analysis of electrochemical impedance spectroscopy data in Bode and Nyquist representations. J. Power Sources 2016, 309, 82–98. [Google Scholar] [CrossRef]
- Faris, B.K.; Hassan, A.A.; Aziz, S.B.; Brza, M.A.; Abdullah, A.M.; Abdalrahman, A.A.; Abu Ali, O.A.; Saleh, D.I. Impedance, Electrical Equivalent Circuit (EEC) Modeling, Structural (FTIR and XRD), Dielectric, and Electric Modulus Study of MC-Based Ion-Conducting Solid Polymer Electrolytes. Materials 2022, 15, 170. [Google Scholar] [CrossRef]
- Vadhva, P.; Hu, J.; Johnson, M.J.; Stocker, R.; Braglia, M.; Brett, D.J.L.; Rettie, A.J.E. Electrochemical Impedance Spectroscopy for All-Solid-State Batteries: Theory, Methods and Future Outlook. ChemElectroChem 2021, 8, 1930–1947. [Google Scholar] [CrossRef]
- Zhao, L.; Dai, H.; Pei, F.; Ming, P.; Wei, X.; Zhou, J. A Comparative Study of Equivalent Circuit Models for Electro-Chemical Impedance Spectroscopy Analysis of Proton Exchange Membrane Fuel Cells. Energies 2022, 15, 386. [Google Scholar] [CrossRef]
- Barbosa, J.C.; Pinto, R.S.; Correia, D.M.; Fidalgo-Marijuan, A.; Gonçalves, R.; Ferdov, S.; Lanceros-Mendez, S.; Costa, C.M. Poly(vinylidene fluoride-co-hexafluoropropylene) based tri-composites with zeolite and ionic liquid for electromechanical actuator and lithium-ion battery applications. Electrochim. Acta 2022, 431, 141186. [Google Scholar] [CrossRef]
- Monteiro, M.J.; Bazito, F.F.C.; Siqueira, L.J.A.; Ribeiro, M.C.C.; Torresi, R.M. Transport Coefficients, Raman Spectroscopy, and Computer Simulation of Lithium Salt Solutions in an Ionic Liquid. J. Phys. Chem. B 2008, 112, 2102–2109. [Google Scholar] [CrossRef]
- Asenbauer, J.; Ben Hassen, N.; McCloskey, B.D.; Prausnitz, J.M. Solubilities and ionic conductivities of ionic liquids containing lithium salts. Electrochim. Acta 2017, 247, 1038–1043. [Google Scholar] [CrossRef]
- Tong, J.; Wu, S.; von Solms, N.; Liang, X.; Huo, F.; Zhou, Q.; He, H.; Zhang, S. The Effect of Concentration of Lithium Salt on the Structural and Transport Properties of Ionic Liquid-Based Electrolytes. Front. Chem. 2020, 7, 945. [Google Scholar] [CrossRef] [PubMed] [Green Version]
- Lourenço, T.C.; Zhang, Y.; Costa, L.T.; Maginn, E.J. A molecular dynamics study of lithium-containing aprotic heterocyclic ionic liquid electrolytes. J. Chem. Phys. 2018, 148, 193834. [Google Scholar] [CrossRef] [PubMed]


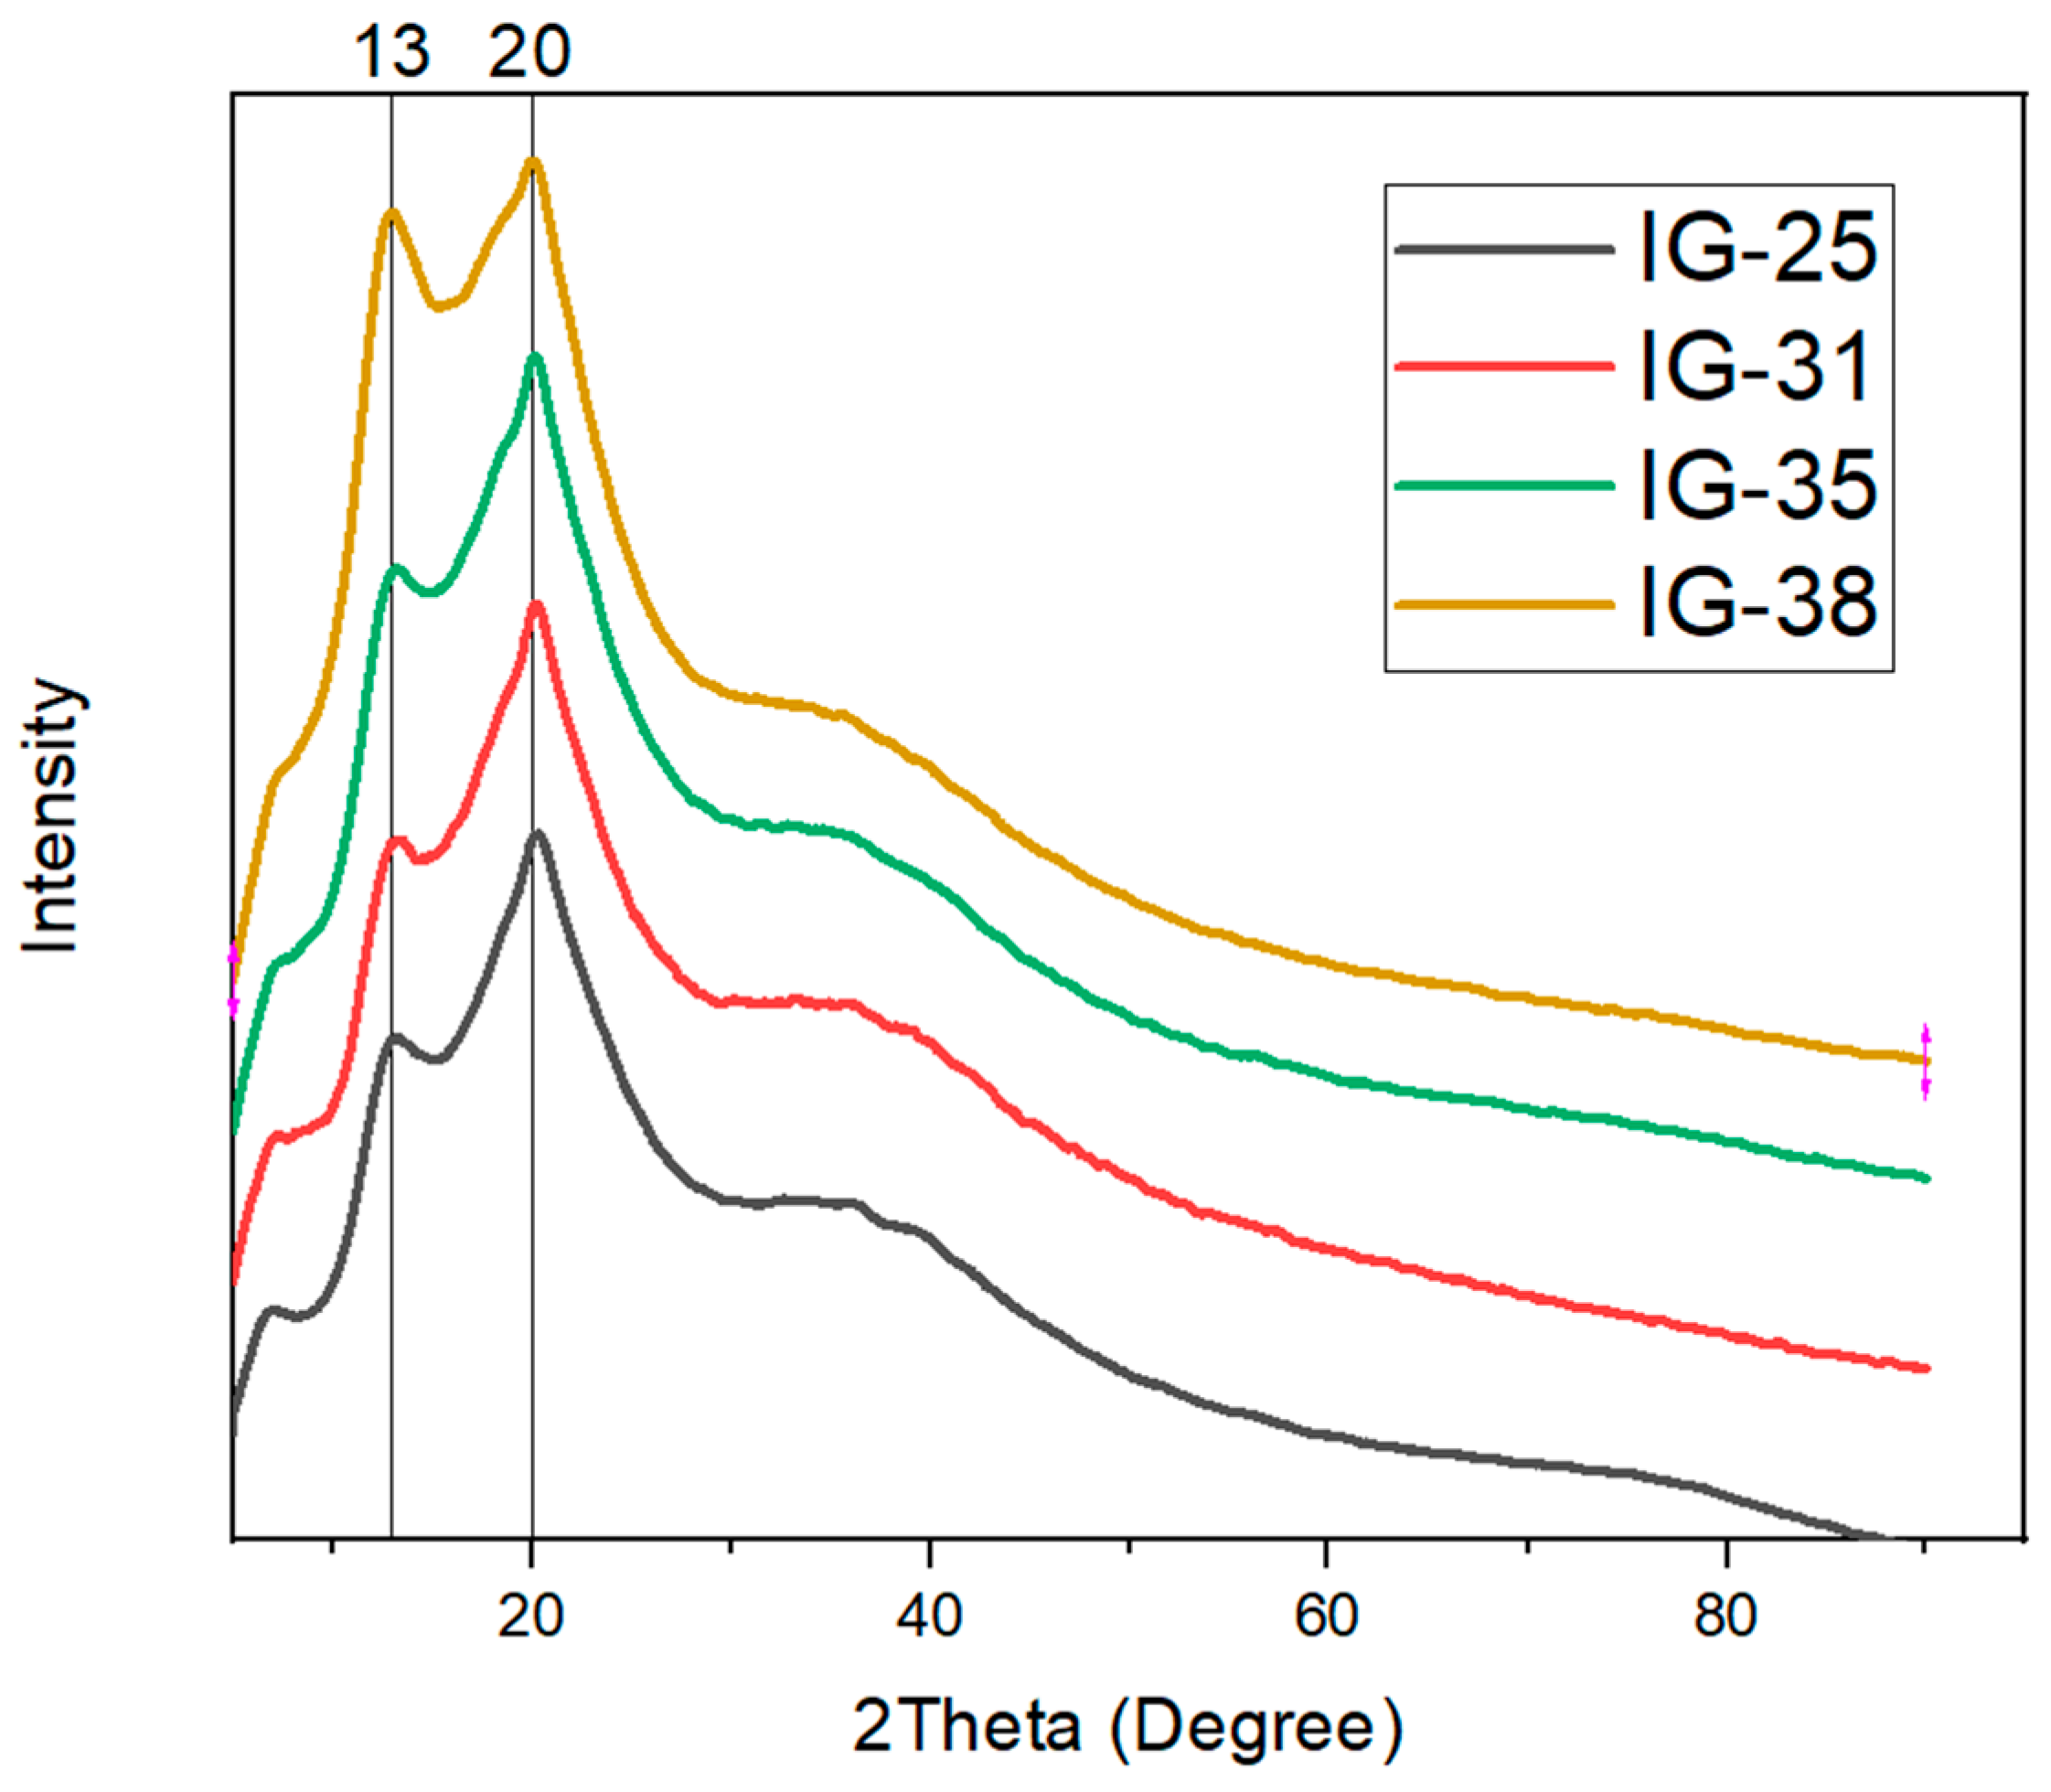
| Ionogel | Degree of Crystallinity (%) |
|---|---|
| IG-25 | 72.46 |
| IG-28 | 52.16 |
| IG-31 | 49.02 |
| IG-35 | 55.66 |
| IG-38 | 63.51 |
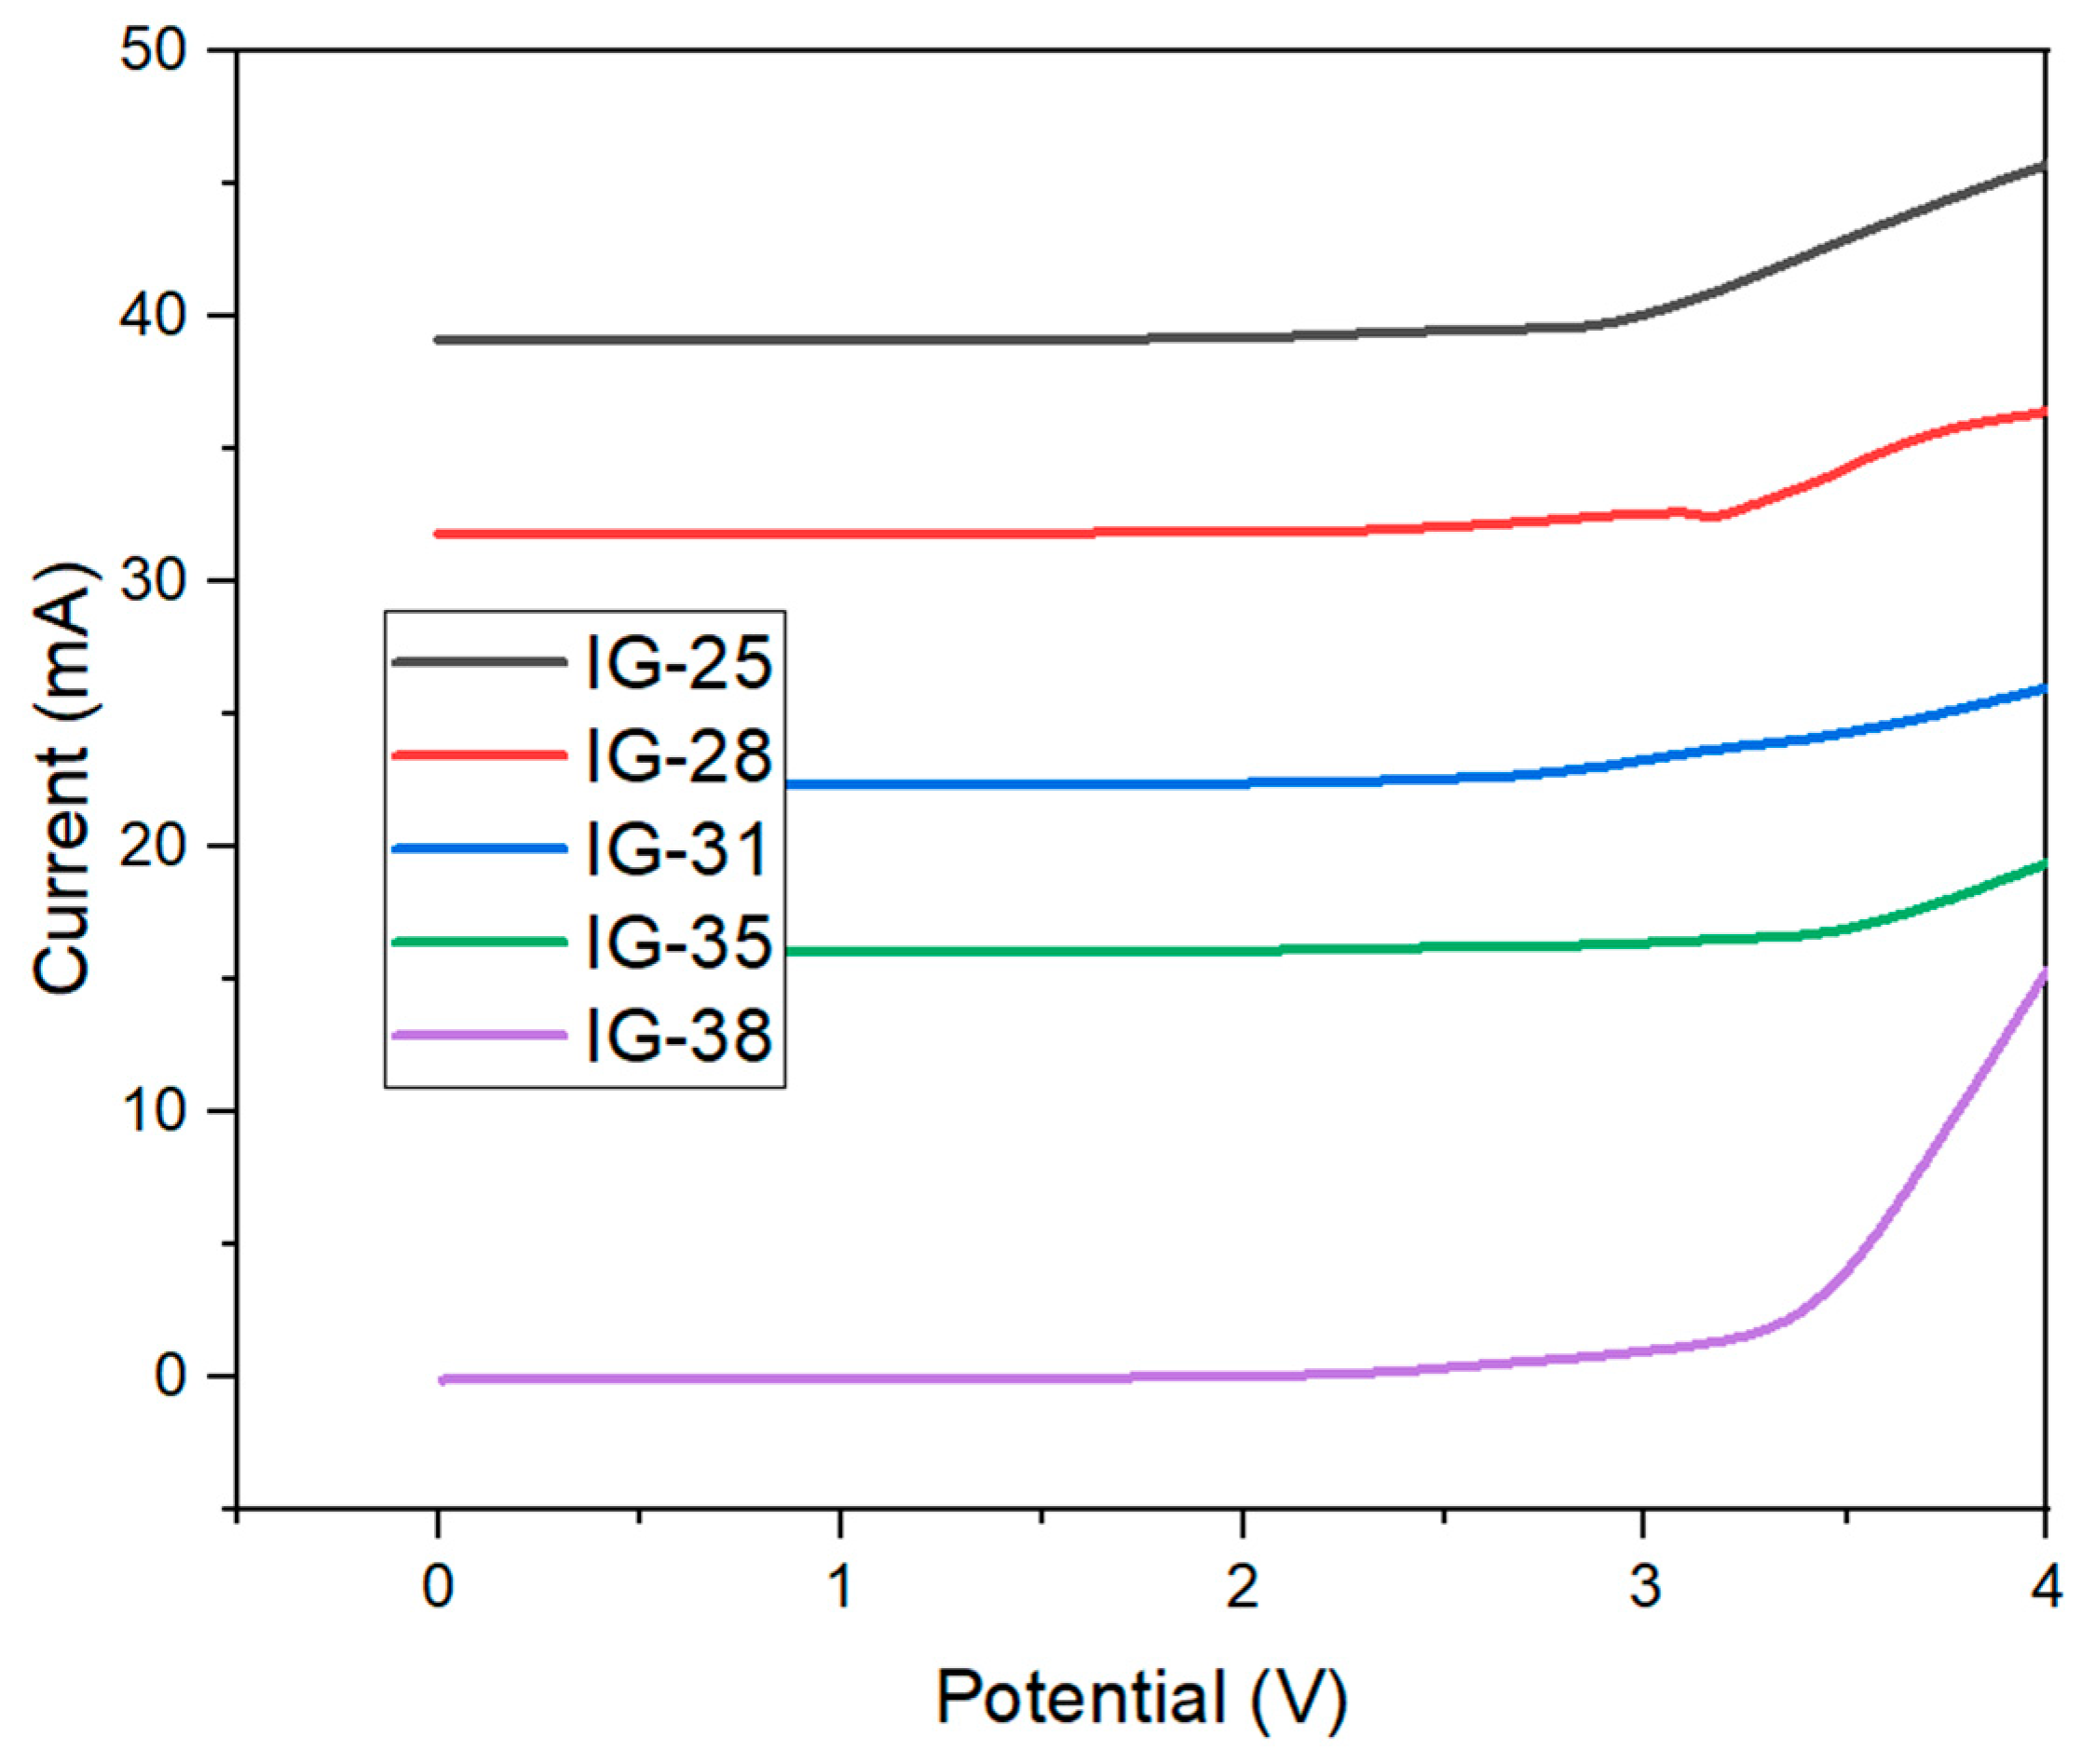
| Ionogel-x vol% of Electrolyte Solution | Electrochemical Stability (V) |
|---|---|
| IG-25 | 3.00 0.45 |
| IG-28 | 3.20 0.06 |
| IG-31 | 3.50 0.05 |
| IG-35 | 3.20 0.35 |
| IG-38 | 3.10 0.07 |
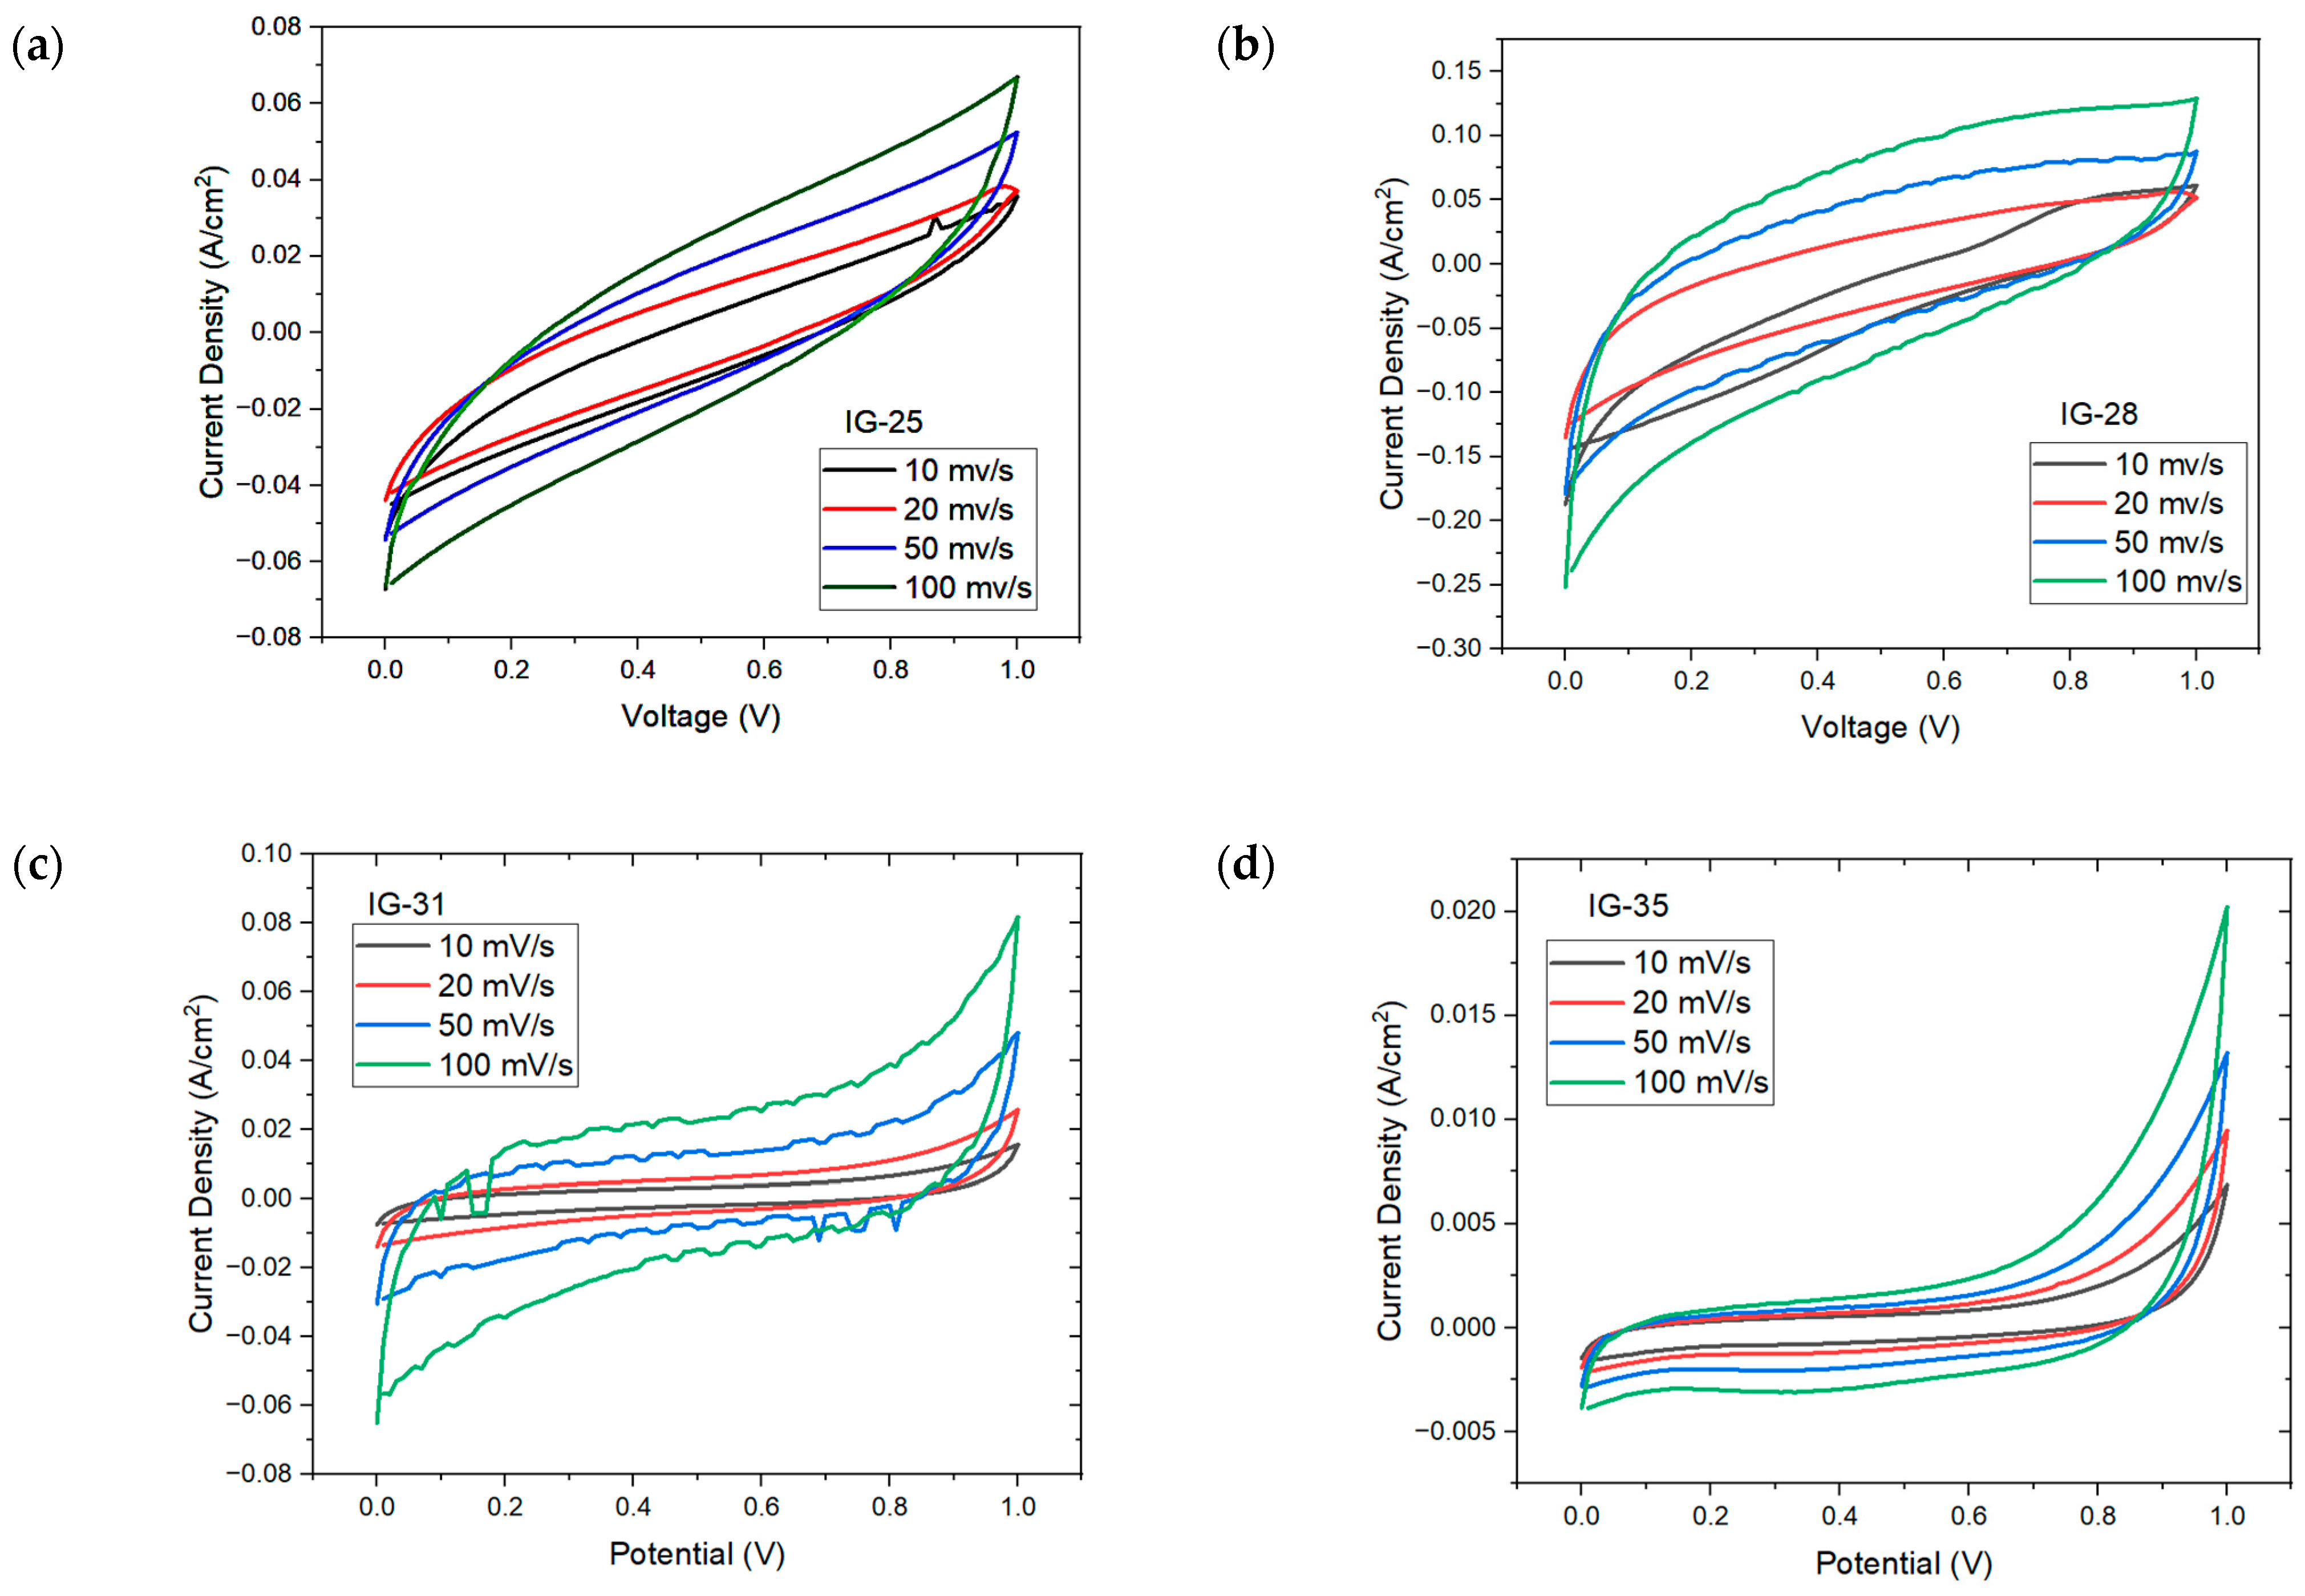
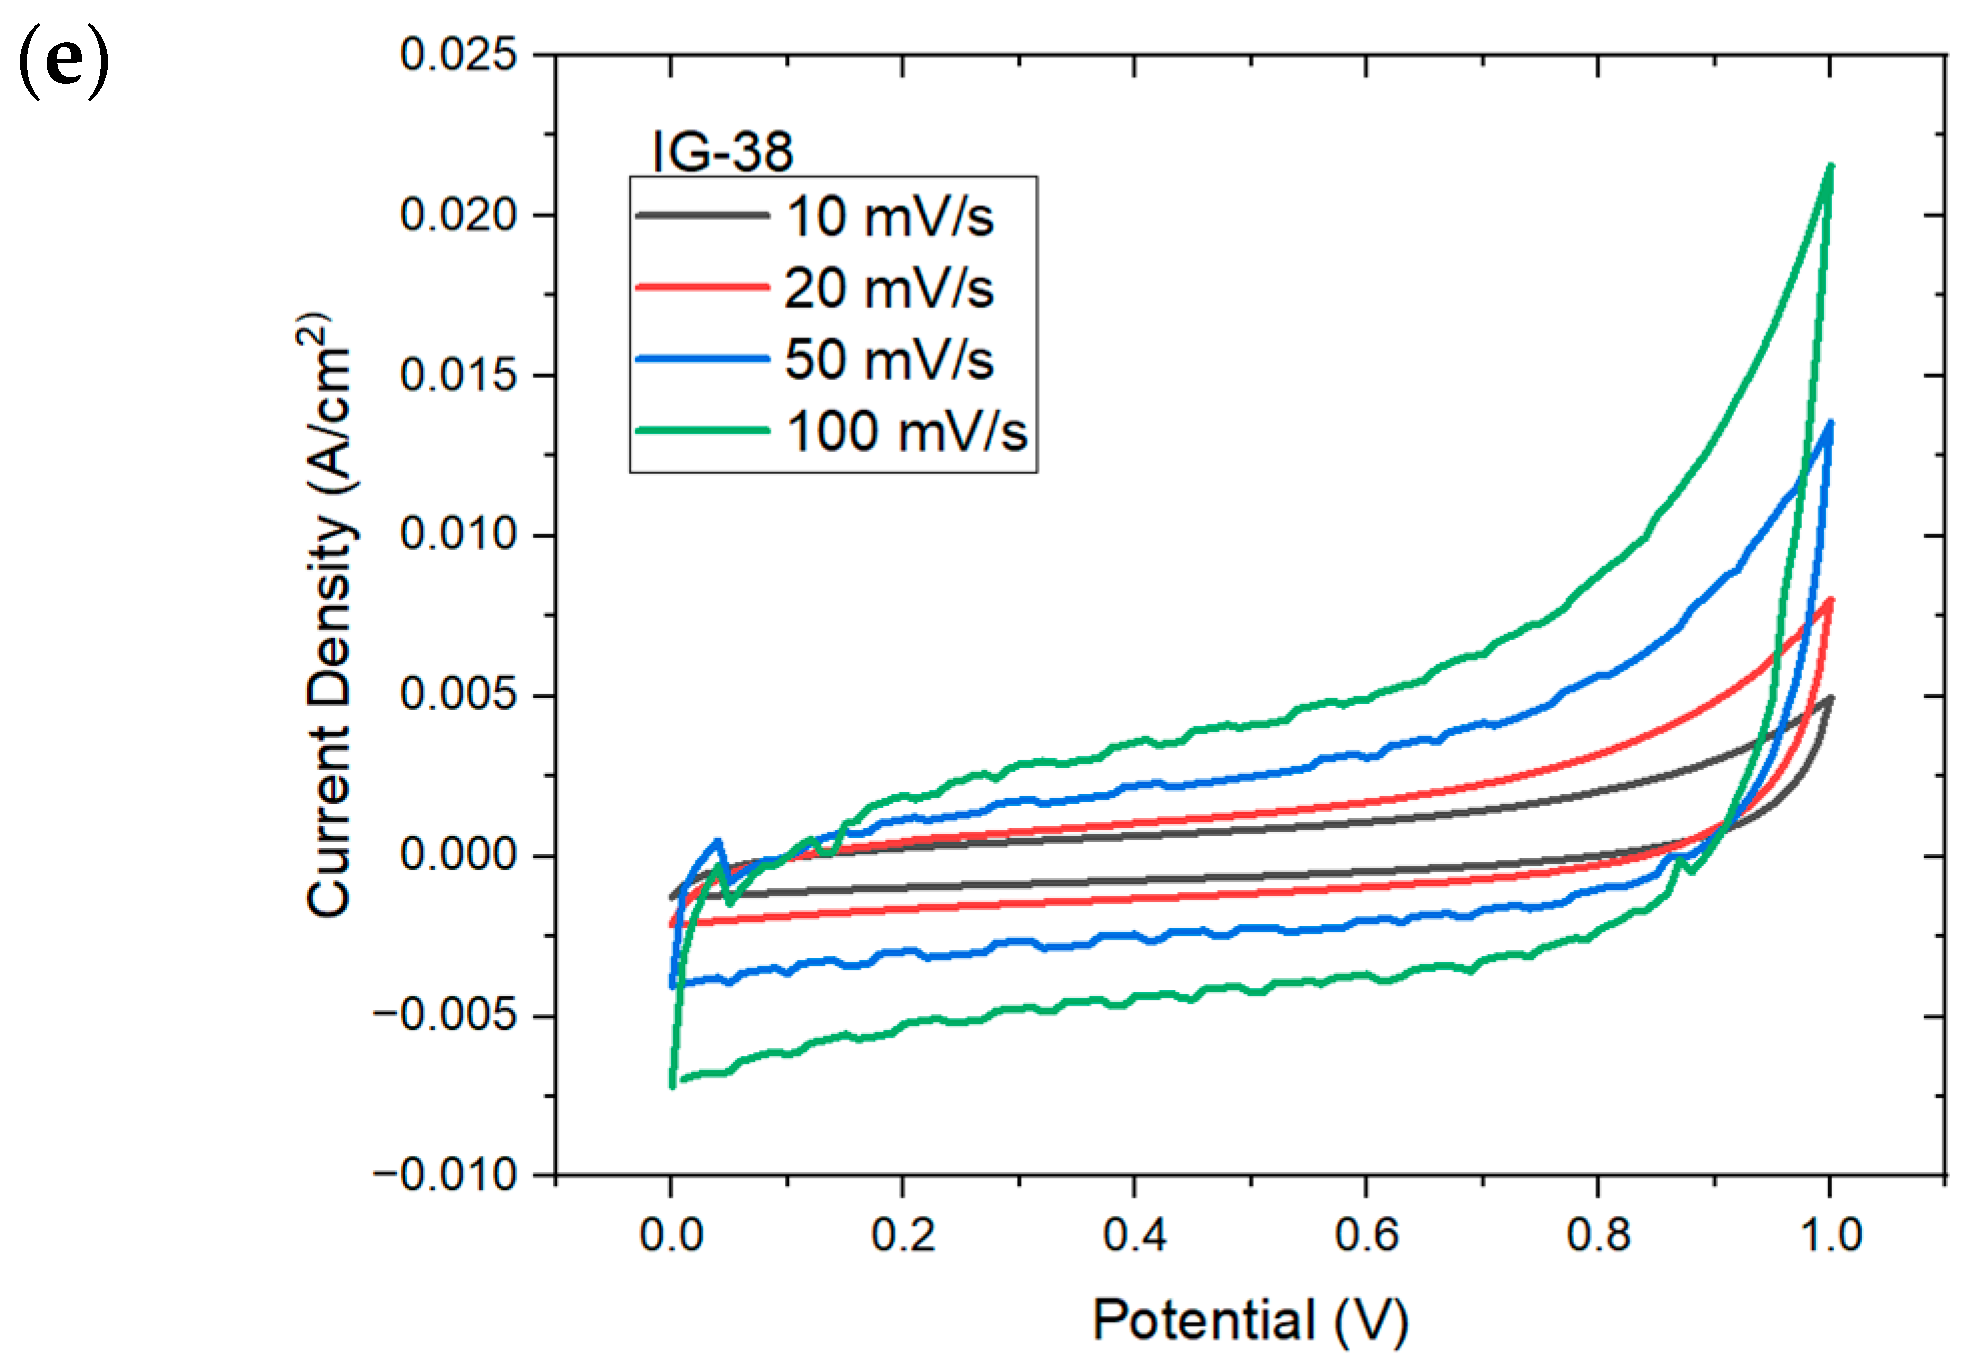
| 10 mV/s | 20 mV/s | 50 mV/s | 100 mV/s | |
|---|---|---|---|---|
| IG-25 | 3.16 F/g | 1.84 F/g | 1.40 F/g | 1.29 F/g |
| IG-28 | 28.73 F/g | 11.55 F/g | 7.63 F/g | 6.23 F/g |
| IG-31 | 45.74 F/g | 28.34 F/g | 23.99 F/g | 19.39 F/g |
| IG-35 | 10.75 F/g | 7.93 F/g | 4.53 F/g | 3.89 F/g |
| IG-38 | 838.55 mF/g | 719.832 mF/g | 569.832 mF/g | 470.949 mF/g |
| Ionogel | S/cm) |
|---|---|
| IG-25 | |
| IG-28 | |
| IG-31 | |
| IG-33 | |
| IG-35 | |
| IG-37 | |
| IG-38 |
Disclaimer/Publisher’s Note: The statements, opinions and data contained in all publications are solely those of the individual author(s) and contributor(s) and not of MDPI and/or the editor(s). MDPI and/or the editor(s) disclaim responsibility for any injury to people or property resulting from any ideas, methods, instructions or products referred to in the content. |
© 2023 by the authors. Licensee MDPI, Basel, Switzerland. This article is an open access article distributed under the terms and conditions of the Creative Commons Attribution (CC BY) license (https://creativecommons.org/licenses/by/4.0/).
Share and Cite
Suen, J.W.; Elumalai, N.K.; Debnath, S.; Mubarak, N.M.; Lim, C.I.; Reddy Moola, M.; Tan, Y.S.; Khalid, M. Investigating the Correlation between Electrolyte Concentration and Electrochemical Properties of Ionogels. Molecules 2023, 28, 5192. https://doi.org/10.3390/molecules28135192
Suen JW, Elumalai NK, Debnath S, Mubarak NM, Lim CI, Reddy Moola M, Tan YS, Khalid M. Investigating the Correlation between Electrolyte Concentration and Electrochemical Properties of Ionogels. Molecules. 2023; 28(13):5192. https://doi.org/10.3390/molecules28135192
Chicago/Turabian StyleSuen, Ji Wei, Naveen Kumar Elumalai, Sujan Debnath, Nabisab Mujawar Mubarak, Chye Ing Lim, Mohan Reddy Moola, Yee Seng Tan, and Mohammad Khalid. 2023. "Investigating the Correlation between Electrolyte Concentration and Electrochemical Properties of Ionogels" Molecules 28, no. 13: 5192. https://doi.org/10.3390/molecules28135192