
Generic Methods for Simultaneous Analysis of Four Direct Oral Anticoagulants in Human Plasma and Urine by Ultra-High Performance Liquid Chromatography-Tandem Mass Spectrometry

Abstract
:1. Introduction
2. Results
2.1. Method Development
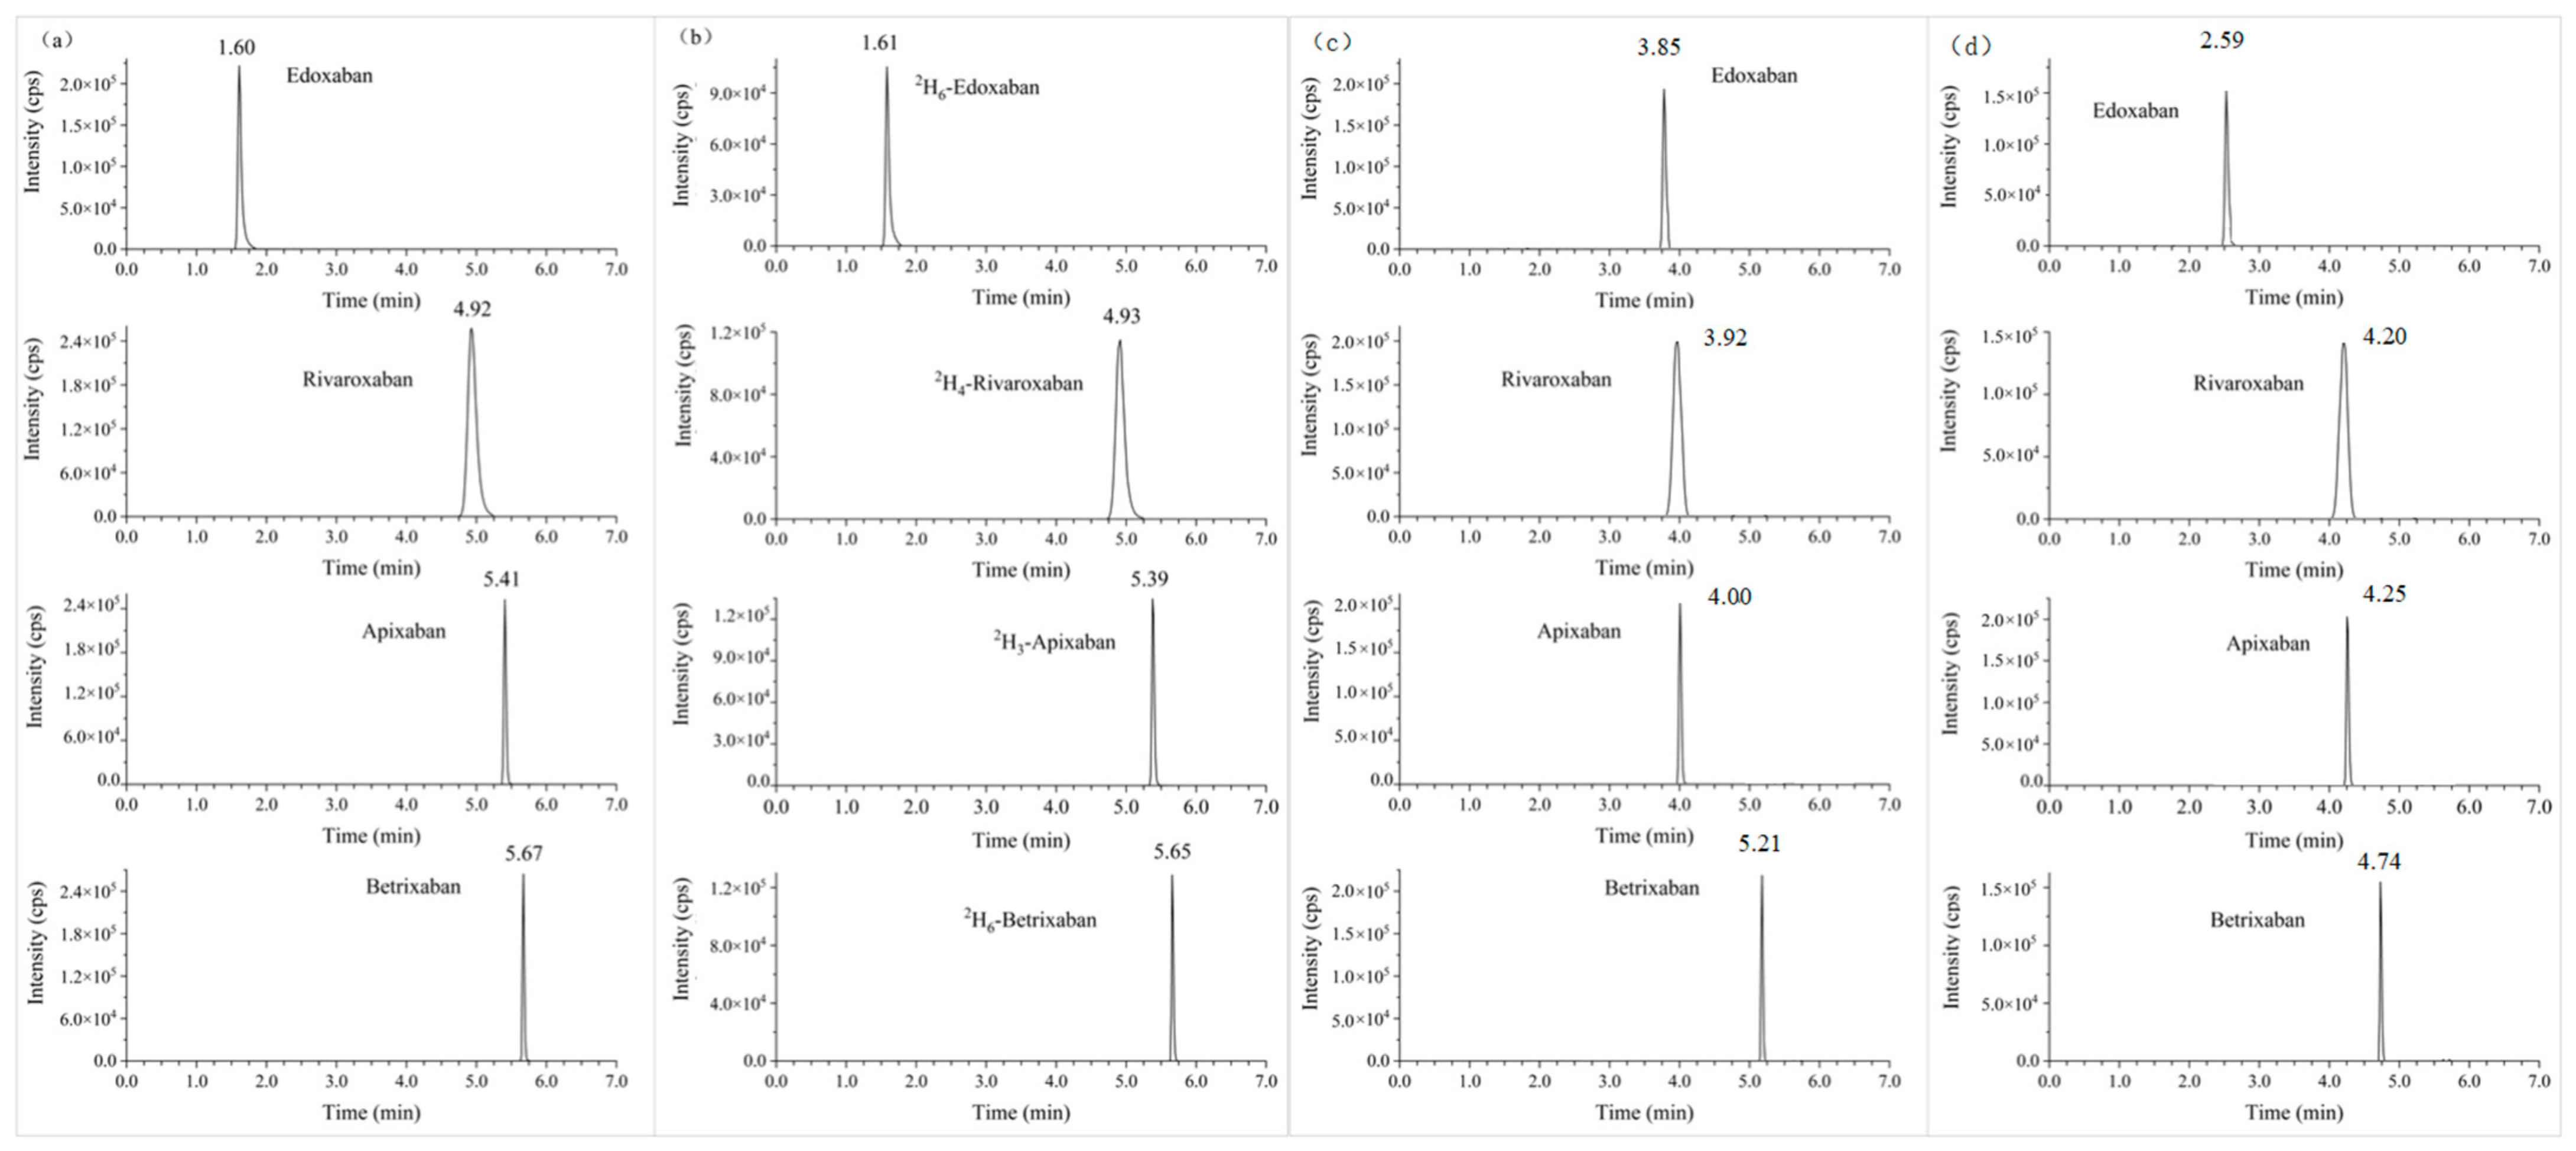
2.1.1. Chromatography and Mass Spectrometry
2.1.2. Sample Preparation
2.2. Method Validation
2.2.1. Linearity
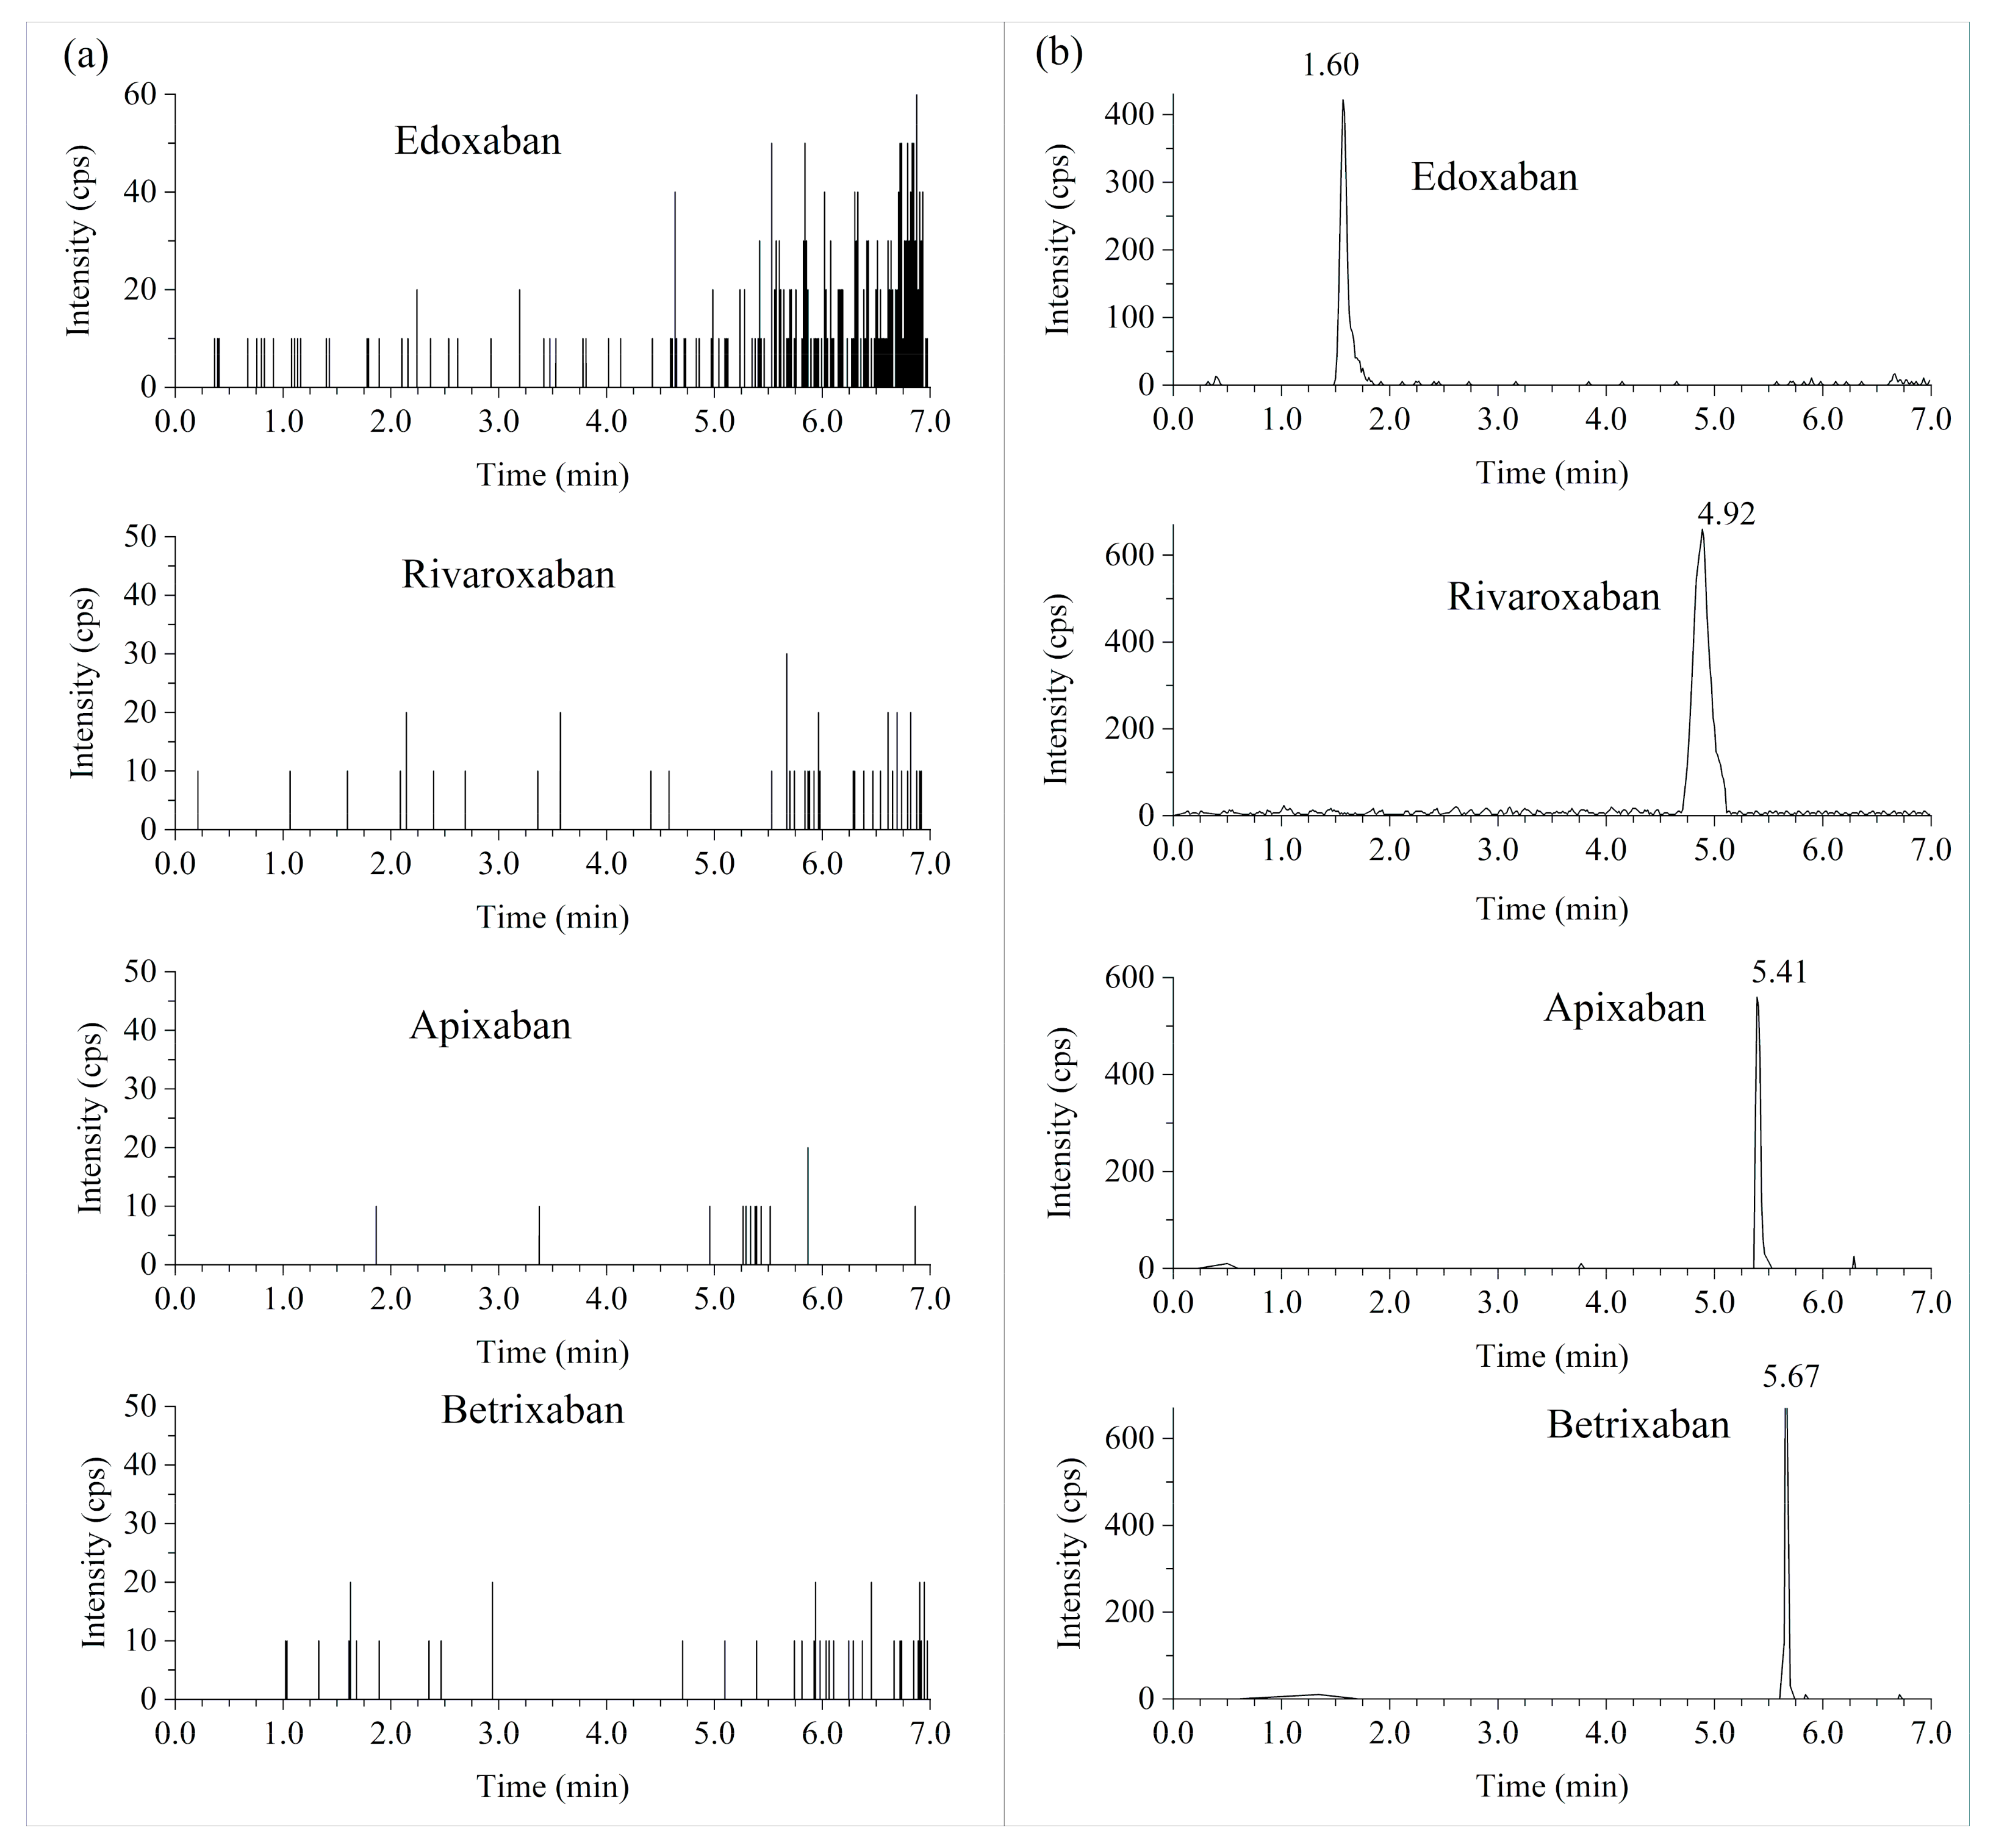
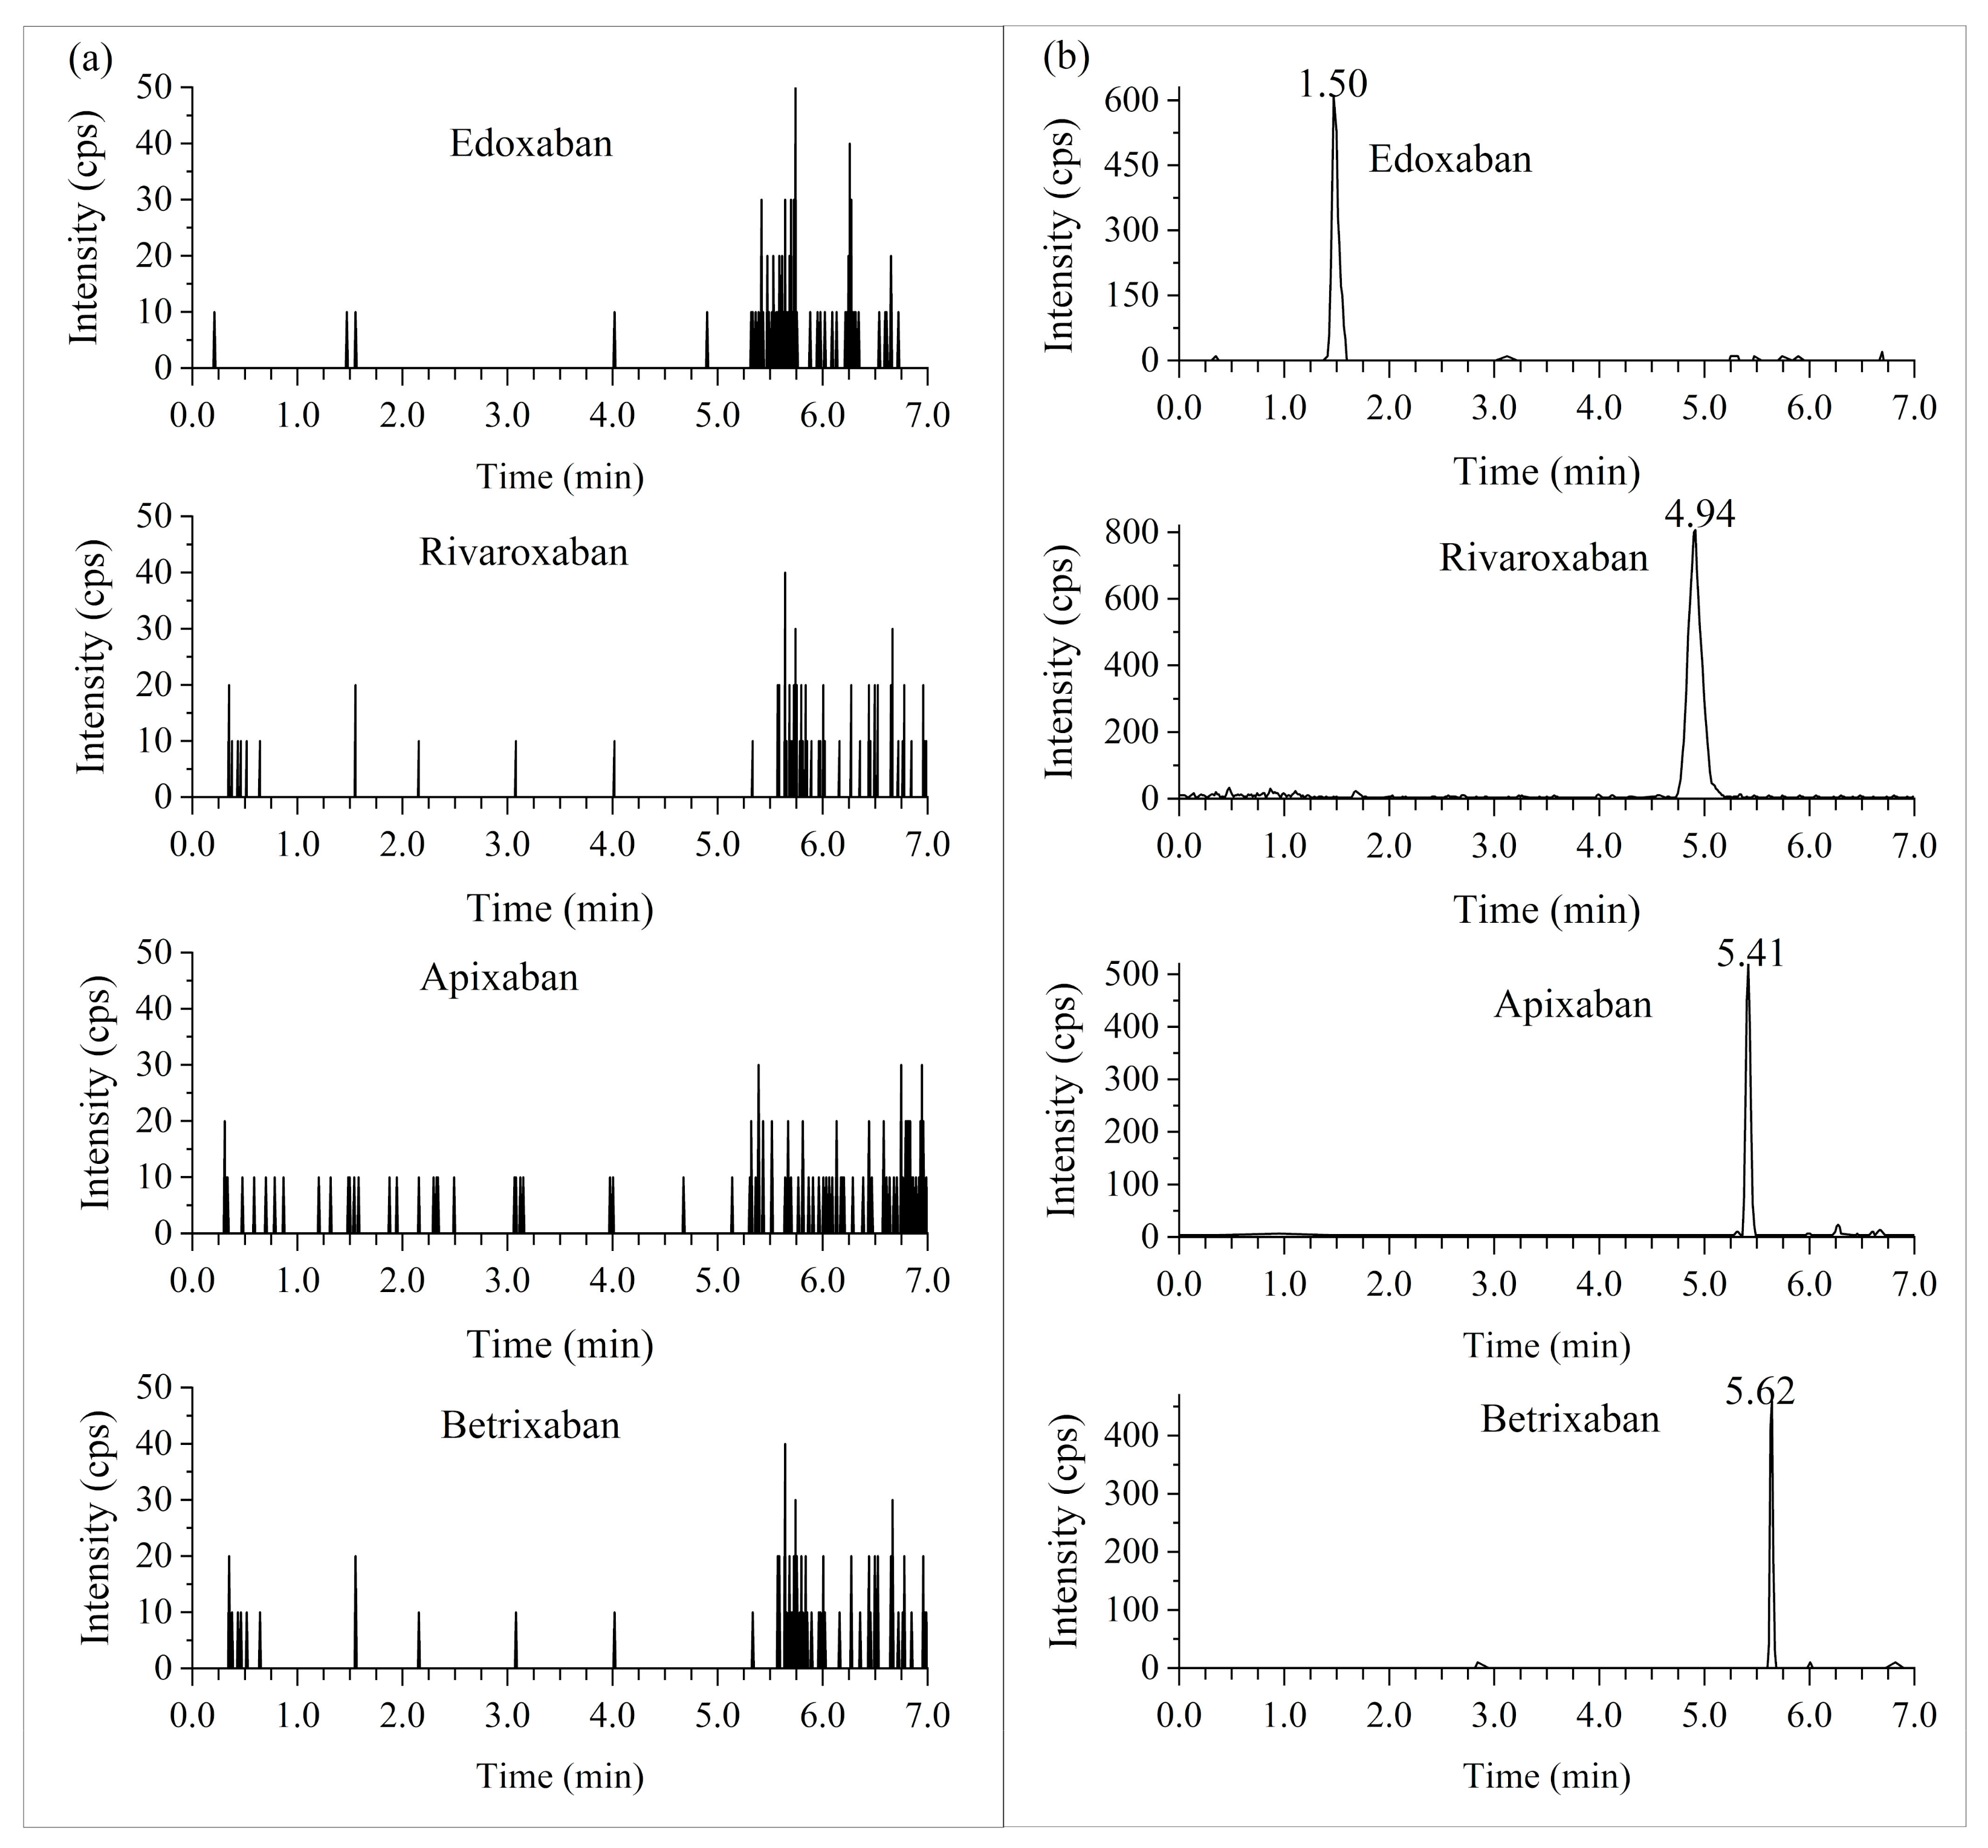
2.2.2. Selectivity
2.2.3. Precision and Accuracy
2.2.4. Matrix Effect and Extraction Recovery
2.2.5. Effect of Hemolysis and Hyperlipidemia in Plasma
2.2.6. Dilution Integrity
2.2.7. Stability
2.2.8. Carry-Over
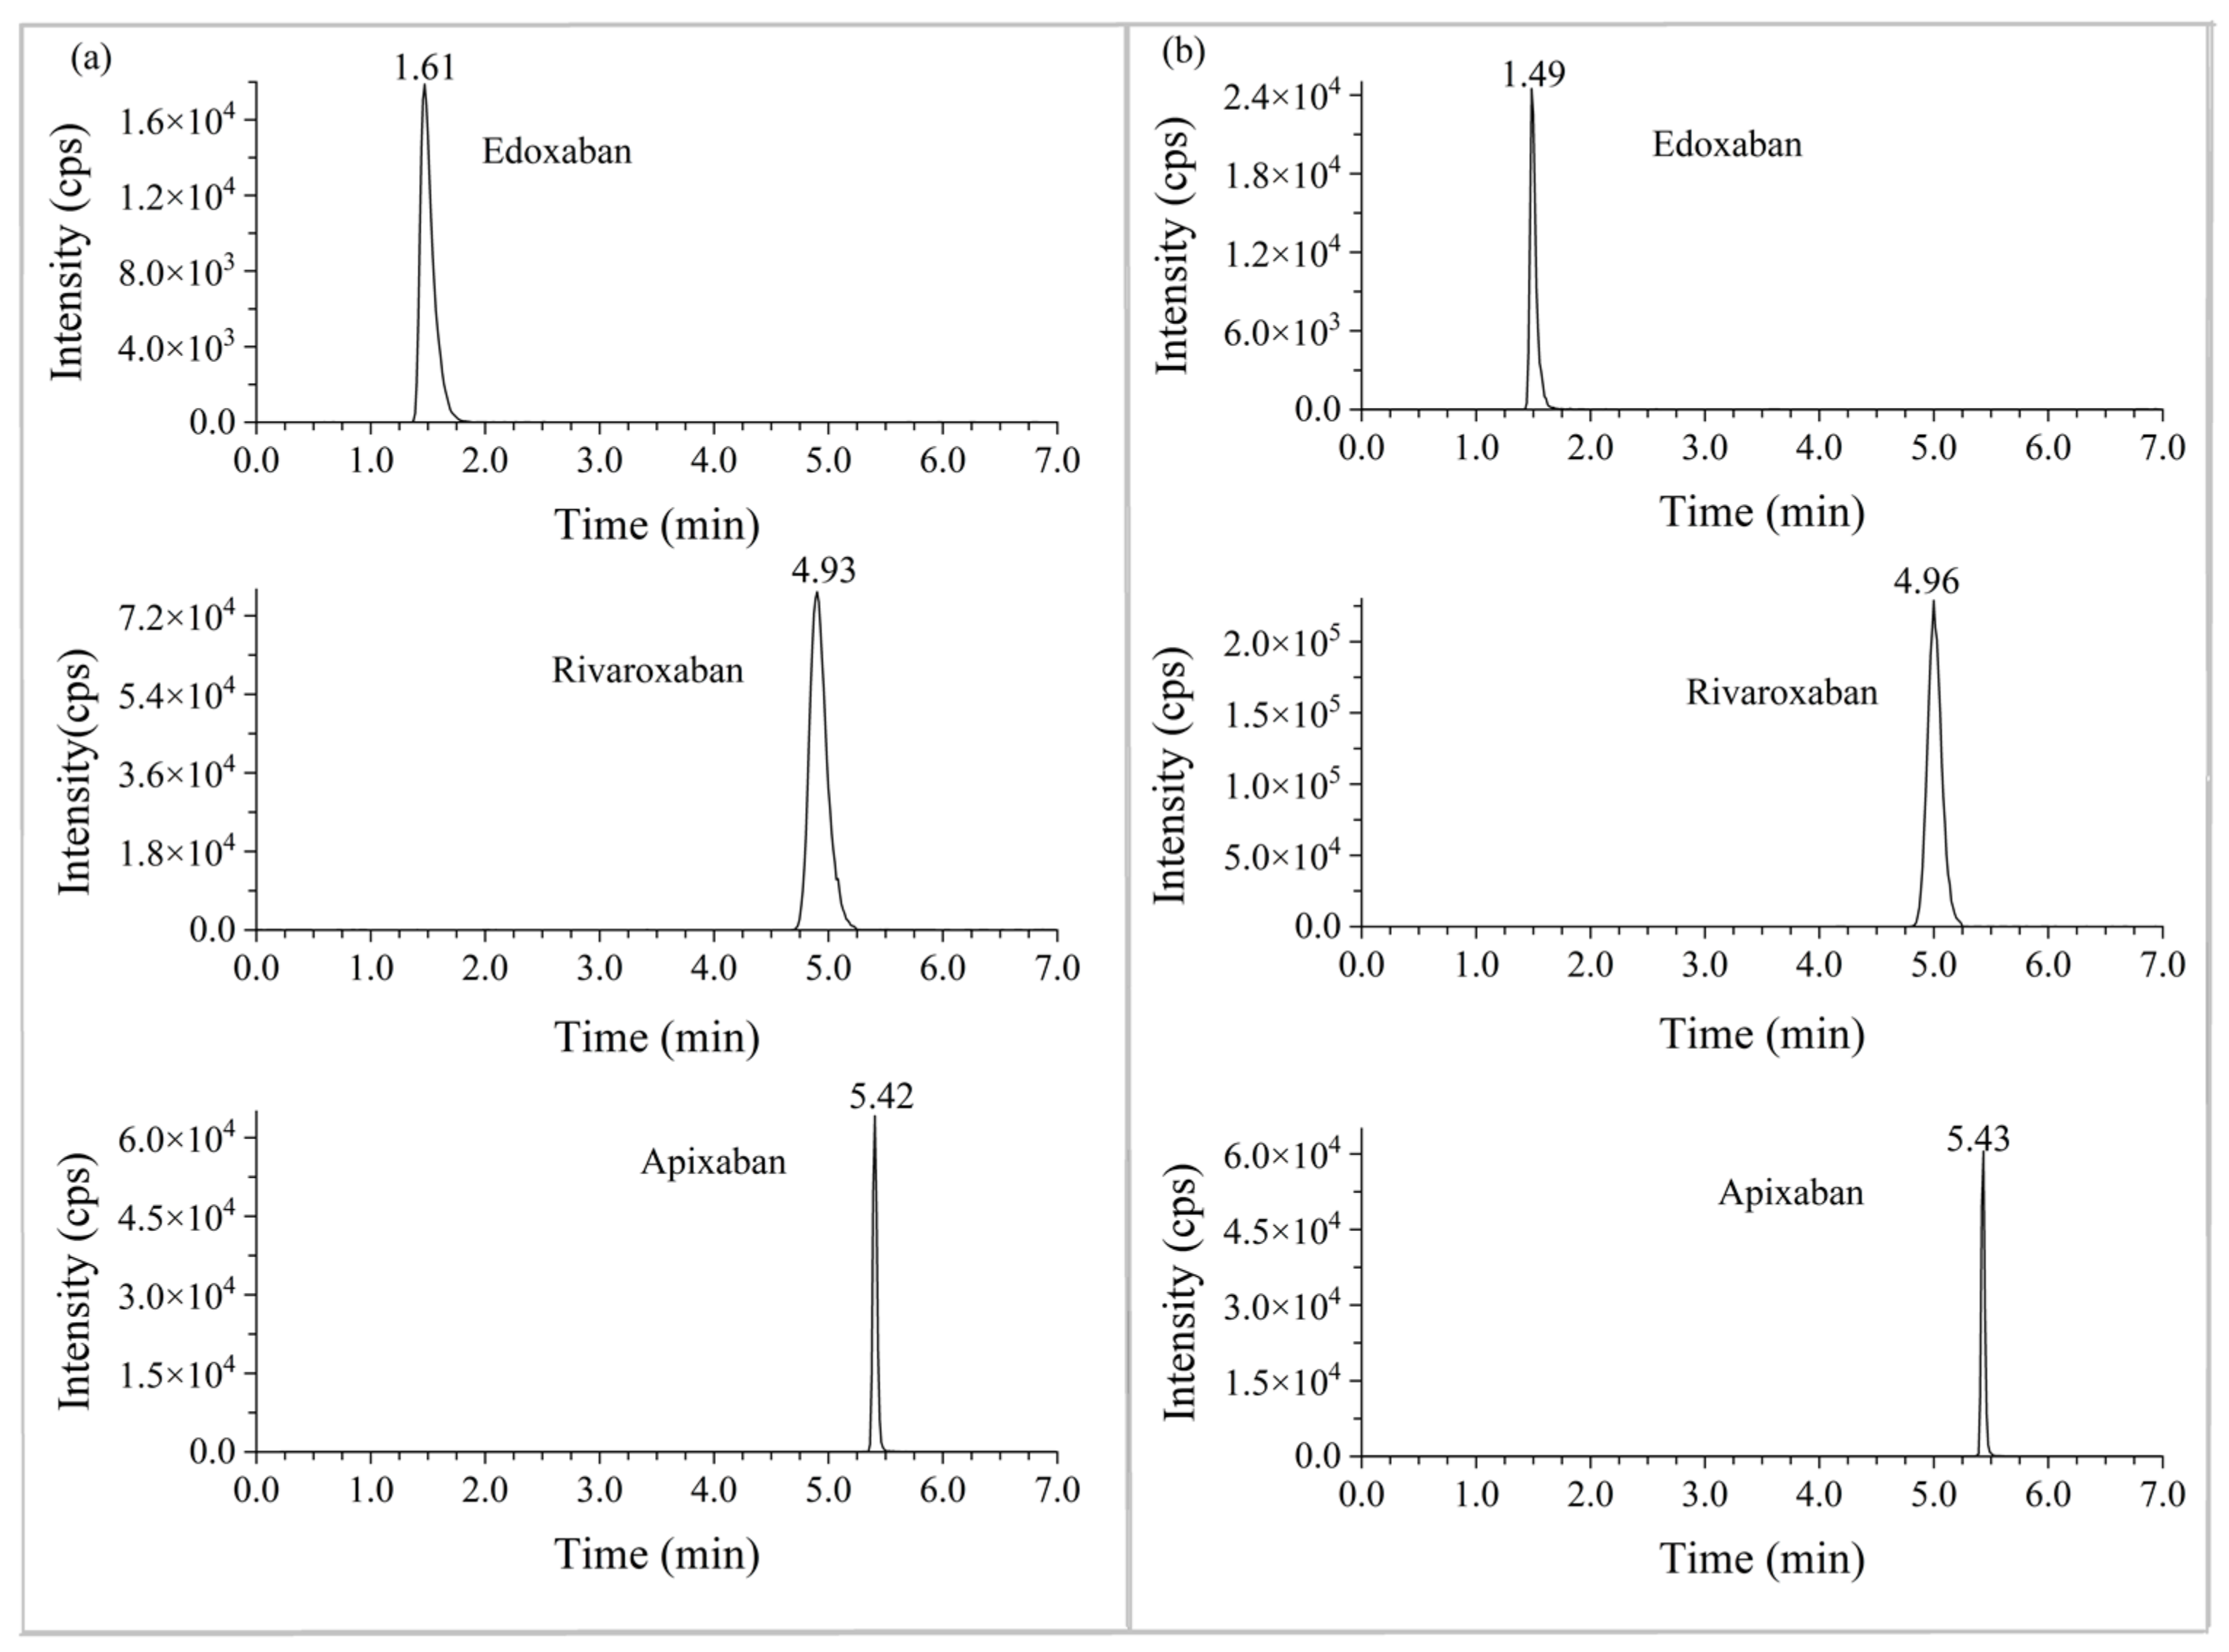
2.3. Patient Samples Analysis
3. Discussion
4. Materials and Methods
4.1. Chemicals and Reagents
4.2. Instruments
4.3. UPLC–MS/MS Conditions
4.4. Stock Solutions, Calibration Standards and Quality Controls (QC)
4.5. Sample Preparation
4.6. Method Validation
4.6.1. Linearity
4.6.2. Accuracy and Precision
4.6.3. Selectivity
4.6.4. Matrix Effects and Recovery
4.6.5. Effect of Hemolysis and Hyperlipidemia on Plasma
4.6.6. Stability
4.6.7. Dilution Integrity
4.6.8. Carryover
4.7. Clinical Application
5. Conclusions
Author Contributions
Funding
Institutional Review Board Statement
Informed Consent Statement
Data Availability Statement
Acknowledgments
Conflicts of Interest
Sample Availability
References
- Wendelboe, A.M.; Raskob, G.E. Global Burden of Thrombosis: Epidemiologic Aspects. Circ. Res. 2016, 118, 1340–1347. [Google Scholar] [CrossRef]
- Ruff, C.T.; Giugliano, R.P.; Braunwald, E.; Morrow, D.A.; Murphy, S.A.; Kuder, J.F.; Deenadayalu, N.; Jarolim, P.; Betcher, J.; Shi, M. Association between edoxaban dose, concentration, anti-Factor Xa activity, and outcomes: An analysis of data from the randomised, double-blind ENGAGE AF-TIMI 48 trial. Lancet 2015, 385, 2288–2295. [Google Scholar] [CrossRef] [PubMed]
- Reilly, P.A.; Lehr, T.; Haertter, S.; Connolly, S.J.; Yusuf, S.; Eikelboom, J.W.; Ezekowitz, M.D.; Nehmiz, G.; Wang, S.; Wallentin, L.; et al. The Effect of Dabigatran Plasma Concentrations and Patient Characteristics on the Frequency of Ischemic Stroke and Major Bleeding in Atrial Fibrillation Patients. J. Am. Coll. Cardiol. 2014, 63, 321–328. [Google Scholar] [CrossRef] [Green Version]
- Pare, G.; Eriksson, N.; Lehr, T.; Connolly, S.; Eikelboom, J.; Ezekowitz, M.D.; Axelsson, T.; Haertter, S.; Oldgren, J.; Reilly, P. Genetic determinants of dabigatran plasma levels and their relation to bleeding. Circulation 2013, 127, 1404–1412. [Google Scholar] [CrossRef] [PubMed] [Green Version]
- Gouveia, F.; Bicker, J.; Gonçalves, J.; Alves, G.; Falcão, A.; Fortuna, A. Liquid chromatographic methods for the determination of direct oral anticoagulant drugs in biological samples: A critical review. Anal. Chim. Acta 2019, 1076, 18–31. [Google Scholar] [CrossRef] [PubMed] [Green Version]
- Foerster, K.I.; Huppertz, A.; Müller, O.J.; Rizos, T.; Tilemann, L.; Haefeli, W.E.; Burhenne, J. Simultaneous quantification of direct oral anticoagulants currently used in anticoagulation therapy. J. Pharm. Biomed. Anal. 2018, 148, 238–244. [Google Scholar] [CrossRef]
- Çelebier, M.; Reçber, T.; Koçak, E.; Altınöz, S.; Kır, S. Determination of Rivaroxaban in Human Plasma by Solid-Phase Extraction–High Performance Liquid Chromatography. J. Chromatogr. Sci. 2015, 54, 216–220. [Google Scholar] [CrossRef] [Green Version]
- Wiesen, M.H.J.; Blaich, C.; Streichert, T.; Michels, G.; Müller, C. Paramagnetic micro-particles as a tool for rapid quantification of apixaban, dabigatran, edoxaban and rivaroxaban in human plasma by UHPLC-MS/MS. Clin. Chem. Lab. Med. 2017, 55, 1349–1359. [Google Scholar] [CrossRef]
- Merrelaar, A.E.; Bögl, M.S.; Buchtele, N.; Merrelaar, M.; Herkner, H.; Schoergenhofer, C.; Harenberg, J.; Douxfils, J.; Siriez, R.; Jilma, B.; et al. Performance of a Qualitative Point-of-Care Strip Test to Detect DOAC Exposure at the Emergency Department: A Cohort-Type Cross-Sectional Diagnostic Accuracy Study. Thromb. Haemost. 2022, 122, 1723–1731. [Google Scholar] [CrossRef]
- Gonzalez-Quesada, C.J.; Giugliano, R.P. Comparison of the phase III clinical trial designs of novel oral anticoagulants versus warfarin for the treatment of nonvalvular atrial fibrillation: Implications for clinical practice. Am. J. Cardiovasc. Drugs 2014, 14, 111–127. [Google Scholar] [CrossRef]
- Zhao, X.; Sun, P.; Zhou, Y.; Liu, Y.; Zhang, H.; Mueck, W.; Kubitza, D.; Bauer, R.J.; Zhang, H.; Cui, Y. Safety, pharmacokinetics and pharmacodynamics of single/multiple doses of the oral, direct Factor Xa inhibitor rivaroxaban in healthy Chinese subjects. Br. J. Clin. Pharmacol. 2009, 68, 77–88. [Google Scholar] [CrossRef] [Green Version]
- Mueck, W.; Borris, L.C.; Dahl, O.E.; Haas, S.; Huisman, M.V.; Kakkar, A.K.; Kälebo, P.; Muelhofer, E.; Misselwitz, F.; Eriksson, B.I. Population pharmacokinetics and pharmacodynamics of once and twice-daily rivaroxaban for the prevention of venous thromboembolism in patients undergoing total hip replacement. Thromb. Haemost. 2008, 100, 453–461. [Google Scholar] [CrossRef]
- Margelidon-Cozzolino, V.; Hodin, S.; Jacqueroux, E.; Delézay, O.; Bertoletti, L.; Delavenne, X. In Vitro Assessment of Pharmacokinetic Drug-Drug Interactions of Direct Oral Anticoagulants: Type 5-Phosphodiesterase Inhibitors Are Inhibitors of Rivaroxaban and Apixaban Efflux by P-Glycoprotein. J. Pharmacol. Exp. Ther. 2018, 365, 519. [Google Scholar] [CrossRef]
- Di Minno, A.; Frigerio, B.; Spadarella, G.; Ravani, A.; Sansaro, D.; Amato, M.; Kitzmiller, J.P.; Pepi, M.; Tremoli, E.; Baldassarre, D. Old and new oral anticoagulants: Food, herbal medicines and drug interactions. Blood Rev. 2017, 31, 193–203. [Google Scholar] [CrossRef]
- Wiggins, B.S.; Dixon, D.L.; Neyens, R.R.; Page, R.L.; Gluckman, T.J. Select Drug-Drug Interactions with Direct Oral Anticoagulants. J. Am. Coll. Cardiol. 2020, 75, 1341–1350. [Google Scholar] [CrossRef]
- Galgani, A.; Palleria, C.; Iannone, L.F.; De Sarro, G.; Giorgi, F.S.; Maschio, M.; Russo, E. Pharmacokinetic interactions of clinical interest between direct oral anticoagulants and antiepileptic drugs. Front. Neurol. 2018, 9, 1067. [Google Scholar] [CrossRef] [Green Version]
- Zhang, D.; Chen, W.; Qin, W.; Du, W.; Wang, X.; Zuo, X.; Li, P. Population Pharmacokinetics and Hemorrhagic Risk Analysis of Rivaroxaban in Elderly Chinese Patients with Nonvalvular Atrial Fibrillation. J. Clin. Pharmacol. 2023, 63, 66–76. [Google Scholar] [CrossRef]
- Baglin, T.; Keeling, D.; Kitchen, S. Effects on routine coagulation screens and assessment of anticoagulant intensity in patients taking oral dabigatran or rivaroxaban: Guidance from the British Committee for Standards in Haematology. Br. J. Haematol. 2012, 159, 427–429. [Google Scholar] [CrossRef]
- Kitchen, S.; Gray, E.; Mackie, I.; Baglin, T.; Makris, M.; the BCSH Committee. Measurement of non-coumarin anticoagulants and their effects on tests of Haemostasis: Guidance from the British Committee for Standards in Haematology. Br. J. Haematol. 2014, 166, 830–841. [Google Scholar] [CrossRef]
- Patel, J.P.; Byrne, R.A.; Patel, R.K.; Arya, R. Progress in the monitoring of direct oral anticoagulant therapy. Br. J. Haematol. 2019, 184, 912–924. [Google Scholar] [CrossRef]
- Gosselin, R.C.; Adcock, D.M.; Bates, S.M.; Douxfils, J.; Favaloro, E.J.; Gouin-Thibault, I.; Guillermo, C.; Kawai, Y.; Lindhoff-Last, E.; Kitchen, S. International Council for Standardization in Haematology (ICSH) recommendations for laboratory measurement of direct oral anticoagulants. Thromb. Haemost. 2018, 118, 437–450. [Google Scholar] [CrossRef] [PubMed] [Green Version]
- Kearon, C.; Akl, E.A.; Ornelas, J.; Blaivas, A.; Jimenez, D.; Bounameaux, H.; Huisman, M.; King, C.S.; Morris, T.A.; Sood, N. Antithrombotic therapy for VTE disease: CHEST guideline and expert panel report. Chest 2016, 149, 315–352. [Google Scholar] [CrossRef]
- Arachchillage, D.; Reynolds, R.; Devey, T.; Maclean, R.; Kitchen, S.; Van Veen, J. Effect of extremes of body weight on drug level in patient treated with standard dose of rivaroxaban for venous thromboembolism; real life experience. Thromb. Res. 2016, 147, 32–35. [Google Scholar] [CrossRef] [PubMed]
- Eikelboom, J.; Merli, G. Bleeding with direct oral anticoagulants vs warfarin: Clinical experience. Am. J. Med. 2016, 129, S33–S40. [Google Scholar] [CrossRef] [PubMed] [Green Version]
- Maier, V.; Slavík, L.; Ondra, P. A synergy of liquid chromatography with high-resolution mass spectrometry and coagulation test for determination of direct oral anticoagulants for clinical and toxicological purposes. Biomed. Chromatogr. 2021, 35, e5195. [Google Scholar] [CrossRef]
- Pan, T.-Y.; Tsai, W.-C.; Tan, C.-H.; Cheng, C.-M.; Chen, W.; Soundappan, T.; Valan Arasu, M.; Al-Dhabi, N.A.; Wu, C.-F.; Ponnusamy, V.K.; et al. Rapid simultaneous clinical monitoring of five oral anti-coagulant drugs in human urine using green microextraction technique coupled with LC–MS/MS. J. King Saud Univ.-Sci. 2021, 33, 101602. [Google Scholar] [CrossRef]
- Harenberg, J.; Beyer-Westendorf, J.; Crowther, M.; Douxfils, J.; Elalamy, I.; Verhamme, P.; Bauersachs, R.; Hetjens, S.; Weiss, C.; Working Group, M.; et al. Accuracy of a Rapid Diagnostic Test for the Presence of Direct Oral Factor Xa or Thrombin Inhibitors in Urine—A Multicenter Trial. Thromb. Haemost. 2020, 120, 132–140. [Google Scholar] [CrossRef] [Green Version]
- Harenberg, J.; Schreiner, R.; Hetjens, S.; Weiss, C. Detecting Anti-IIa and Anti-Xa Direct Oral Anticoagulant (DOAC) Agents in Urine using a DOAC Dipstick. Semin. Thromb. Hemost. 2019, 45, 275–284. [Google Scholar] [CrossRef] [Green Version]
- Martini, A.; Harenberg, J.; Bauersachs, R.; Beyer-Westendorf, J.; Crowther, M.; Douxfils, J.; Elalamy, I.; Weiss, C.; Hetjens, S. Detection of Direct Oral Anticoagulants in Patient Urine Samples by Prototype and Commercial Test Strips for DOACs—A Systematic Review and Meta-analysis. TH Open 2021, 5, e438–e448. [Google Scholar] [CrossRef]
- Dunois, C. Laboratory monitoring of direct oral anticoagulants (DOACs). Biomedicines 2021, 9, 445. [Google Scholar] [CrossRef]
- U.S. Department of Health and Human Services; Food and Drug Administration; Center for Drug Evaluation and Research (CDER); Center for Veterinary Medicine (CMV). Guidance for Industry: Bioanalytical Method Validation; Food and Drug Administration: Silver Spring, MD, USA, 2018.
- European Agency for the Evaluation of Medicinal Products (EMEA). Guideline on Bioanalytical Method Validation. 2011. Available online: http://www.ema.europa.eu/docs/enGB/documentlibrary/Scientificguideline/2011/08/WC500109686.pdf (accessed on 11 May 2022).
- International Council for Harmonisation. Bioanalytical Method Validation and Study Sample Analysis M10; International Council for Harmonisation: Geneva, Switzerland, 2022. [Google Scholar]
- Chinese Pharmacopoeia Commission. Pharmacopoeia of the People’s Republic of China; China Medical Science and Technology Press: Beijing, China, 2020. [Google Scholar]


| Compound | Retention Time (Minute) | Transitions (m/z) | DP (V) | EP (V) | CE (V) | CXP (V) |
|---|---|---|---|---|---|---|
| Rivaroxaban | 4.92 | 436.0 > 145.0 | 168 | 7 | 40 | 15 |
| 2H4-Rivaroxaban | 4.93 | 440.0 > 144.9 | 180 | 8 | 37 | 14 |
| Betrixaban | 5.67 | 452.1 > 324.2 | 90 | 8 | 55 | 18 |
| 2H6-Betrixaban | 5.65 | 458.1 > 330.2 | 86 | 10 | 55 | 25 |
| Apixaban | 5.41 | 460.1 > 443.2 | 200 | 6 | 55 | 19 |
| 2H3-Apixaban | 5.39 | 463.1 > 446.3 | 175 | 7 | 55 | 17 |
| Edoxaban | 1.60 | 548.1 > 366.3 | 57 | 6 | 26 | 25 |
| 2H6-Edoxaban | 1.61 | 554.1 > 372.3 | 60 | 7 | 27 | 10 |
| Matrix | Compound | Range | Calibration Curves | R2 |
|---|---|---|---|---|
| Plasma | Rivaroxaban | 1–500 ng/mL | Y = 0.00604X + 0.00198 | 0.9992 |
| Betrixaban | 1–500 ng/mL | Y = 0.00529X + 0.00228 | 0.9990 | |
| Apixaban | 1–500 ng/mL | Y = 0.00403X + 0.00119 | 0.9986 | |
| Edoxaban | 1–500 ng/mL | Y = 0.0052X + 0.000502 | 0.9991 | |
| Urine | Rivaroxaban | 10–10,000 ng/mL | Y = 0.00270X + 0.00440 | 0.9992 |
| Betrixaban | 10–10,000 ng/mL | Y = 0.00208X + 0.00333 | 0.9956 | |
| Apixaban | 10–10,000 ng/mL | Y = 0.00313X + 0.00308 | 0.9993 | |
| Edoxaban | 10–10,000 ng/mL | Y = 0.00234X + 0.00648 | 0.9992 |
| Matrix | Run Batch | Analyte | LLOQ | LQC | MQC | HQC | ||||
|---|---|---|---|---|---|---|---|---|---|---|
| RSD (%) | RE (%) | RSD (%) | RE (%) | RSD (%) | RE (%) | RSD (%) | RE (%) | |||
| Plasma | Intra-day 1 (n = 6) | Rivaroxaban | 5.0 | −11.3 | 3.0 | 1.7 | 1.2 | 6.8 | 2.2 | 6.0 |
| Apixaban | 11.2 | −4.0 | 7.6 | 4.3 | 2.3 | 8.6 | 2.1 | 6.0 | ||
| Edoxaban | 14.7 | −6.6 | 8.1 | −0.8 | 2.8 | 7.7 | 2.9 | 7.0 | ||
| Betrixaban | 9.6 | −4.4 | 5.0 | 2.4 | 2.5 | 8.3 | 1.6 | 4.0 | ||
| Intra-day 2 (n = 6) | Rivaroxaban | 6.8 | −3.9 | 3.4 | 2.6 | 2.2 | 3.8 | 1.2 | −0.4 | |
| Apixaban | 12.8 | 6.1 | 6.8 | 9.3 | 2.1 | 8.8 | 1.2 | 0.5 | ||
| Edoxaban | 10.6 | 7.5 | 5.7 | 4.3 | 1.4 | 5.7 | 2 | 2.8 | ||
| Betrixaban | 7.9 | −2.9 | 7.1 | 1.3 | 2.8 | 5.3 | 1.9 | −2.1 | ||
| Intra-day 3 (n = 6) | Rivaroxaban | 4.4 | 4.3 | 4.8 | 6.8 | 1.8 | 4.6 | 1 | −2.4 | |
| Apixaban | 5.5 | 0.3 | 2.8 | 7.4 | 1.3 | 3.8 | 1.4 | −5.3 | ||
| Edoxaban | 10.6 | −8.8 | 3.7 | 4.3 | 1 | 4.5 | 1.8 | −0.9 | ||
| Betrixaban | 6.3 | −13.8 | 6 | 1.9 | 2.2 | 3.7 | 0.7 | −3.2 | ||
| Inter-day (n = 18) | Rivaroxaban | 8.5 | −3.6 | 4.2 | 3.7 | 2.1 | 5.1 | 3.9 | 1.1 | |
| Apixaban | 11 | 0.8 | 6.0 | 7.0 | 3.0 | 7.1 | 5.0 | 0.4 | ||
| Edoxaban | 14 | −2.6 | 6.0 | 2.6 | 2.0 | 6.0 | 4.0 | 3.0 | ||
| Betrixaban | 9 | −7 | 6.0 | 1.9 | 3.0 | 5.8 | 4.0 | −0.4 | ||
| Urine | Intra-day 1 (n = 6) | Rivaroxaban | 7.0 | 1.4 | 2.0 | 2.0 | 2.9 | −0.3 | 2.3 | −4.2 |
| Apixaban | 11.1 | 2.7 | 3.6 | 8.3 | 1.2 | 3.7 | 1.5 | −10.0 | ||
| Edoxaban | 10.9 | 0.2 | 5.5 | −5.9 | 2.0 | −0.4 | 2.6 | 0.8 | ||
| Betrixaban | 8.8 | −9.8 | 6.1 | 5.6 | 3.7 | −0.8 | 1.9 | −2.0 | ||
| Intra-day 2 (n = 6) | Rivaroxaban | 9.2 | -8.0 | 5.7 | 0.8 | 1.8 | 1.8 | 1.2 | −2.0 | |
| Apixaban | 9.2 | 2.1 | 4.4 | 5.3 | 3.9 | 3.8 | 1.2 | −10.2 | ||
| Edoxaban | 10.9 | 0.2 | 6.8 | −0.7 | 2.0 | −1.5 | 2.1 | 0.2 | ||
| Betrixaban | 8.1 | −10.0 | 4.8 | 5.4 | 3.6 | 4.8 | 3.4 | 0.0 | ||
| Intra-day 3 (n = 6) | Rivaroxaban | 5.1 | −4.9 | 2.8 | 3.1 | 1.9 | 3.6 | 1.3 | −2.6 | |
| Apixaban | 6.9 | 0.1 | 5.1 | 7.3 | 2.8 | 10.4 | 5.1 | −11.8 | ||
| Edoxaban | 14.2 | −5.1 | 4.6 | 5.3 | 3.9 | 5.0 | 4.1 | 1.4 | ||
| Betrixaban | 10.3 | −4.9 | 4.1 | 0.1 | 2.5 | 1.8 | 1.4 | −1.0 | ||
| Inter-day (n = 18) | Rivaroxaban | 8.0 | −3.8 | 3.7 | 1.9 | 2.7 | 1.7 | 1.8 | −2.9 | |
| Apixaban | 8.8 | 1.7 | 4.3 | 7.0 | 4.1 | 6.0 | 3.0 | −10.7 | ||
| Edoxaban | 11.6 | −1.5 | 7.1 | 0.4 | 3.9 | 1.1 | 2.9 | 0.8 | ||
| Betrixaban | 9.0 | −8.1 | 5.4 | 3.7 | 3.9 | 1.9 | 2.0 | −1.0 | ||
| Matrix | Item | Analytes | LQC | MQC | HQC | RSD (%) |
|---|---|---|---|---|---|---|
| Plasma | Matrix effects (%) | Rivaroxaban | 94.1 | 89.1 | 93.9 | 3.1 |
| Apixaban | 87.5 | 90.9 | 95.6 | 4.4 | ||
| Edoxaban | 86.5 | 92.5 | 96.6 | 5.5 | ||
| Betrixaban | 97.5 | 92.2 | 96.8 | 3.0 | ||
| Recovery (%) | Rivaroxaban | 101.3 | 99.1 | 97.5 | 1.9 | |
| Apixaban | 104.7 | 99.0 | 93.5 | 5.6 | ||
| Edoxaban | 99.8 | 92.4 | 93.7 | 4.2 | ||
| Betrixaban | 94.8 | 98.4 | 95.1 | 2.1 | ||
| Urine | Matrix effects (%) | Rivaroxaban | 101.9 | 101.1 | 101.1 | 0.4 |
| Apixaban | 100.3 | 97.9 | 98.0 | 1.4 | ||
| Edoxaban | 98.6 | 97.5 | 102.6 | 2.7 | ||
| Betrixaban | 97.0 | 97.6 | 100.3 | 1.8 | ||
| Recovery (%) | Rivaroxaban | 93.5 | 93.3 | 99.5 | 3.7 | |
| Apixaban | 92.5 | 97.2 | 98.6 | 3.3 | ||
| Edoxaban | 94.4 | 95.0 | 97.8 | 1.9 | ||
| Betrixaban | 85.1 | 87.2 | 95.9 | 6.4 |
| Item | Analyte | LQC | MQC | HQC | |||
|---|---|---|---|---|---|---|---|
| RE (%) | RSD (%) | RE (%) | RSD (%) | RE (%) | RSD (%) | ||
| Hyperlipidemia stability (300 mg/dL) | Rivaroxaban | 9.2 | 1.8 | 2.5 | 1.7 | −1.9 | 1.2 |
| Apixaban | 1.7 | 4.3 | 5.5 | 1.3 | −2.1 | 2.4 | |
| Edoxaban | 9.8 | 4.7 | 8.7 | 1.8 | 4.2 | 1.6 | |
| Betrixaban | −3.0 | 5.5 | 5.7 | 2.2 | −1.4 | 1.8 | |
| Hemolysis stability (2%) | Rivaroxaban | 2.1 | 2.2 | −1.9 | 1.9 | −3.8 | 1.3 |
| Apixaban | 2.0 | 7.2 | 2.1 | 2.9 | −3.3 | 1.1 | |
| Edoxaban | 8.9 | 5.4 | 2.4 | 2.5 | 2.7 | 1.2 | |
| Betrixaban | 0.1 | 8.5 | −1.1 | 2.4 | −3.0 | 2.0 | |
| Item | Analyte | LQC | MQC | HQC | |||
|---|---|---|---|---|---|---|---|
| RE (%) | RSD (%) | RE (%) | RSD (%) | RE (%) | RSD (%) | ||
| Reinject stability (10 °C for 69 h) | Rivaroxaban | 5.8 | 3.9 | 7.8 | 2.8 | 7.3 | 2.2 |
| Apixaban | 4.8 | 2.2 | 8.3 | 1.5 | 2.0 | 2.7 | |
| Edoxaban | 9.3 | 5.9 | 7.0 | 1.9 | 7.5 | 2.2 | |
| Betrixaban | 5.2 | 6.9 | 9.5 | 1.6 | 5.5 | 1.9 | |
| Autosampler stability (10 °C for 72 h) | Rivaroxaban | 2.3 | 1.6 | 1.9 | 2.7 | −2.6 | 1.5 |
| Apixaban | −3.3 | 3.9 | 3.7 | 1.9 | −6.0 | 0.9 | |
| Edoxaban | −0.3 | 4.5 | 1.3 | 1.8 | −0.8 | 0.9 | |
| Betrixaban | 1.2 | 2.8 | 1.6 | 2.7 | −4.5 | 1.4 | |
| Short time stability (room temperature for 24 h) | Rivaroxaban | −3.5 | 4.1 | 2.2 | 1.7 | −2 | 1.3 |
| Apixaban | −3.1 | 6.3 | 3.7 | 1.8 | −4.9 | 1.1 | |
| Edoxaban | 1.1 | 6.4 | 2.3 | 2.0 | −1.6 | 2.0 | |
| Betrixaban | 0.1 | 3.1 | 1.4 | 2.3 | −4.9 | 1.5 | |
| Freeze and thaw stability (−80 °C to room temperature, 3 times) | Rivaroxaban | −8.2 | 7.3 | 5.8 | 2.1 | 3.7 | 2.9 |
| Apixaban | 0.8 | 5.0 | 5.2 | 2.6 | −0.7 | 3.5 | |
| Edoxaban | −5.2 | 4.2 | 1.2 | 1.8 | −1.1 | 1.9 | |
| Betrixaban | 2.4 | 6.0 | 6.7 | 2.5 | 0.4 | 1.9 | |
| Long time stability (−80 °C for 112 days) | Rivaroxaban | 10.8 | 2.5 | 7.0 | 2.6 | 0.8 | 0.7 |
| Apixaban | 9.4 | 2.0 | 8.7 | 2.0 | −0.8 | 0.6 | |
| Edoxaban | 8.2 | 4.3 | 7.3 | 1.9 | 1.7 | 1.0 | |
| Betrixaban | 4.0 | 5.7 | 7.3 | 2.6 | −1.1 | 1.3 | |
| Item | Analyte | LQC | MQC | HQC | |||
|---|---|---|---|---|---|---|---|
| RE (%) | RSD (%) | RE (%) | RSD (%) | RE (%) | RSD (%) | ||
| Reinject stability (10 °C 48 h) | Rivaroxaban | 1.4 | 3.3 | 1.9 | 2.7 | −1.9 | 1.9 |
| Apixaban | 5.3 | 8.6 | 7.8 | 3.7 | −5.5 | 2.0 | |
| Edoxaban | −1.5 | 10.2 | −1.5 | 2.7 | −0.9 | 1.4 | |
| Betrixaban | 0.0 | 4.6 | 1.0 | 3.0 | −2.1 | 3.2 | |
| Autosampler stability (10 °C for 72 h) | Rivaroxaban | 6.2 | 3.2 | 3.7 | 3.0 | −3.2 | 0.7 |
| Apixaban | 3.0 | 8.9 | 7.5 | 2.7 | −10.9 | 3.5 | |
| Edoxaban | 4.6 | 4.2 | 2.8 | 1.7 | −0.5 | 2.2 | |
| Betrixaban | −1.9 | 8.5 | 4.5 | 1.6 | −1.1 | 2.1 | |
| Short time stability (room temperature for 24 h) | Rivaroxaban | 1.0 | 3.5 | 0.8 | 2.0 | −3.0 | 1.6 |
| Apixaban | 10.0 | 5.7 | 1.5 | 3.0 | −13.0 | 1.2 | |
| Edoxaban | −1.7 | 4.8 | −1.3 | 1.8 | −0.8 | 1.5 | |
| Betrixaban | 2.7 | 12.3 | 1.9 | 2.9 | −2.6 | 2.0 | |
| Freeze and thaw stability (−80 °C to room temperature, 3 cycles) | Rivaroxaban | −0.8 | 3.0 | −3.1 | 2.2 | −9.2 | 2.0 |
| Apixaban | 5.6 | 6.6 | 5.0 | 3.6 | −9.8 | 2.0 | |
| Edoxaban | −4.6 | 3.6 | −5.6 | 3.0 | −6.8 | 2.2 | |
| Betrixaban | −6.5 | 9.8 | 2.5 | 2.8 | −0.9 | 3.9 | |
| Long time stability (−80 °C for 93 days) | Rivaroxaban | 0.6 | 2.8 | 0.7 | 2.7 | −7.7 | 3.7 |
| Apixaban | −2.5 | 5.8 | −0.3 | 6.2 | −8.2 | 6.3 | |
| Edoxaban | −6.0 | 3.9 | −0.5 | 5.2 | −2.6 | 4.4 | |
| Betrixaban | −1.4 | 9.6 | −0.3 | 4.9 | −2.1 | 4.7 | |
Disclaimer/Publisher’s Note: The statements, opinions and data contained in all publications are solely those of the individual author(s) and contributor(s) and not of MDPI and/or the editor(s). MDPI and/or the editor(s) disclaim responsibility for any injury to people or property resulting from any ideas, methods, instructions or products referred to in the content. |
© 2023 by the authors. Licensee MDPI, Basel, Switzerland. This article is an open access article distributed under the terms and conditions of the Creative Commons Attribution (CC BY) license (https://creativecommons.org/licenses/by/4.0/).
Share and Cite
Ren, J.-W.; Zheng, X.; Han, X.-H. Generic Methods for Simultaneous Analysis of Four Direct Oral Anticoagulants in Human Plasma and Urine by Ultra-High Performance Liquid Chromatography-Tandem Mass Spectrometry. Molecules 2023, 28, 2254. https://doi.org/10.3390/molecules28052254
Ren J-W, Zheng X, Han X-H. Generic Methods for Simultaneous Analysis of Four Direct Oral Anticoagulants in Human Plasma and Urine by Ultra-High Performance Liquid Chromatography-Tandem Mass Spectrometry. Molecules. 2023; 28(5):2254. https://doi.org/10.3390/molecules28052254
Chicago/Turabian StyleRen, Jian-Wei, Xin Zheng, and Xiao-Hong Han. 2023. "Generic Methods for Simultaneous Analysis of Four Direct Oral Anticoagulants in Human Plasma and Urine by Ultra-High Performance Liquid Chromatography-Tandem Mass Spectrometry" Molecules 28, no. 5: 2254. https://doi.org/10.3390/molecules28052254