
The Tumorigenic Effect of the High Expression of Ladinin-1 in Lung Adenocarcinoma and Its Potential as a Therapeutic Target

 , , and
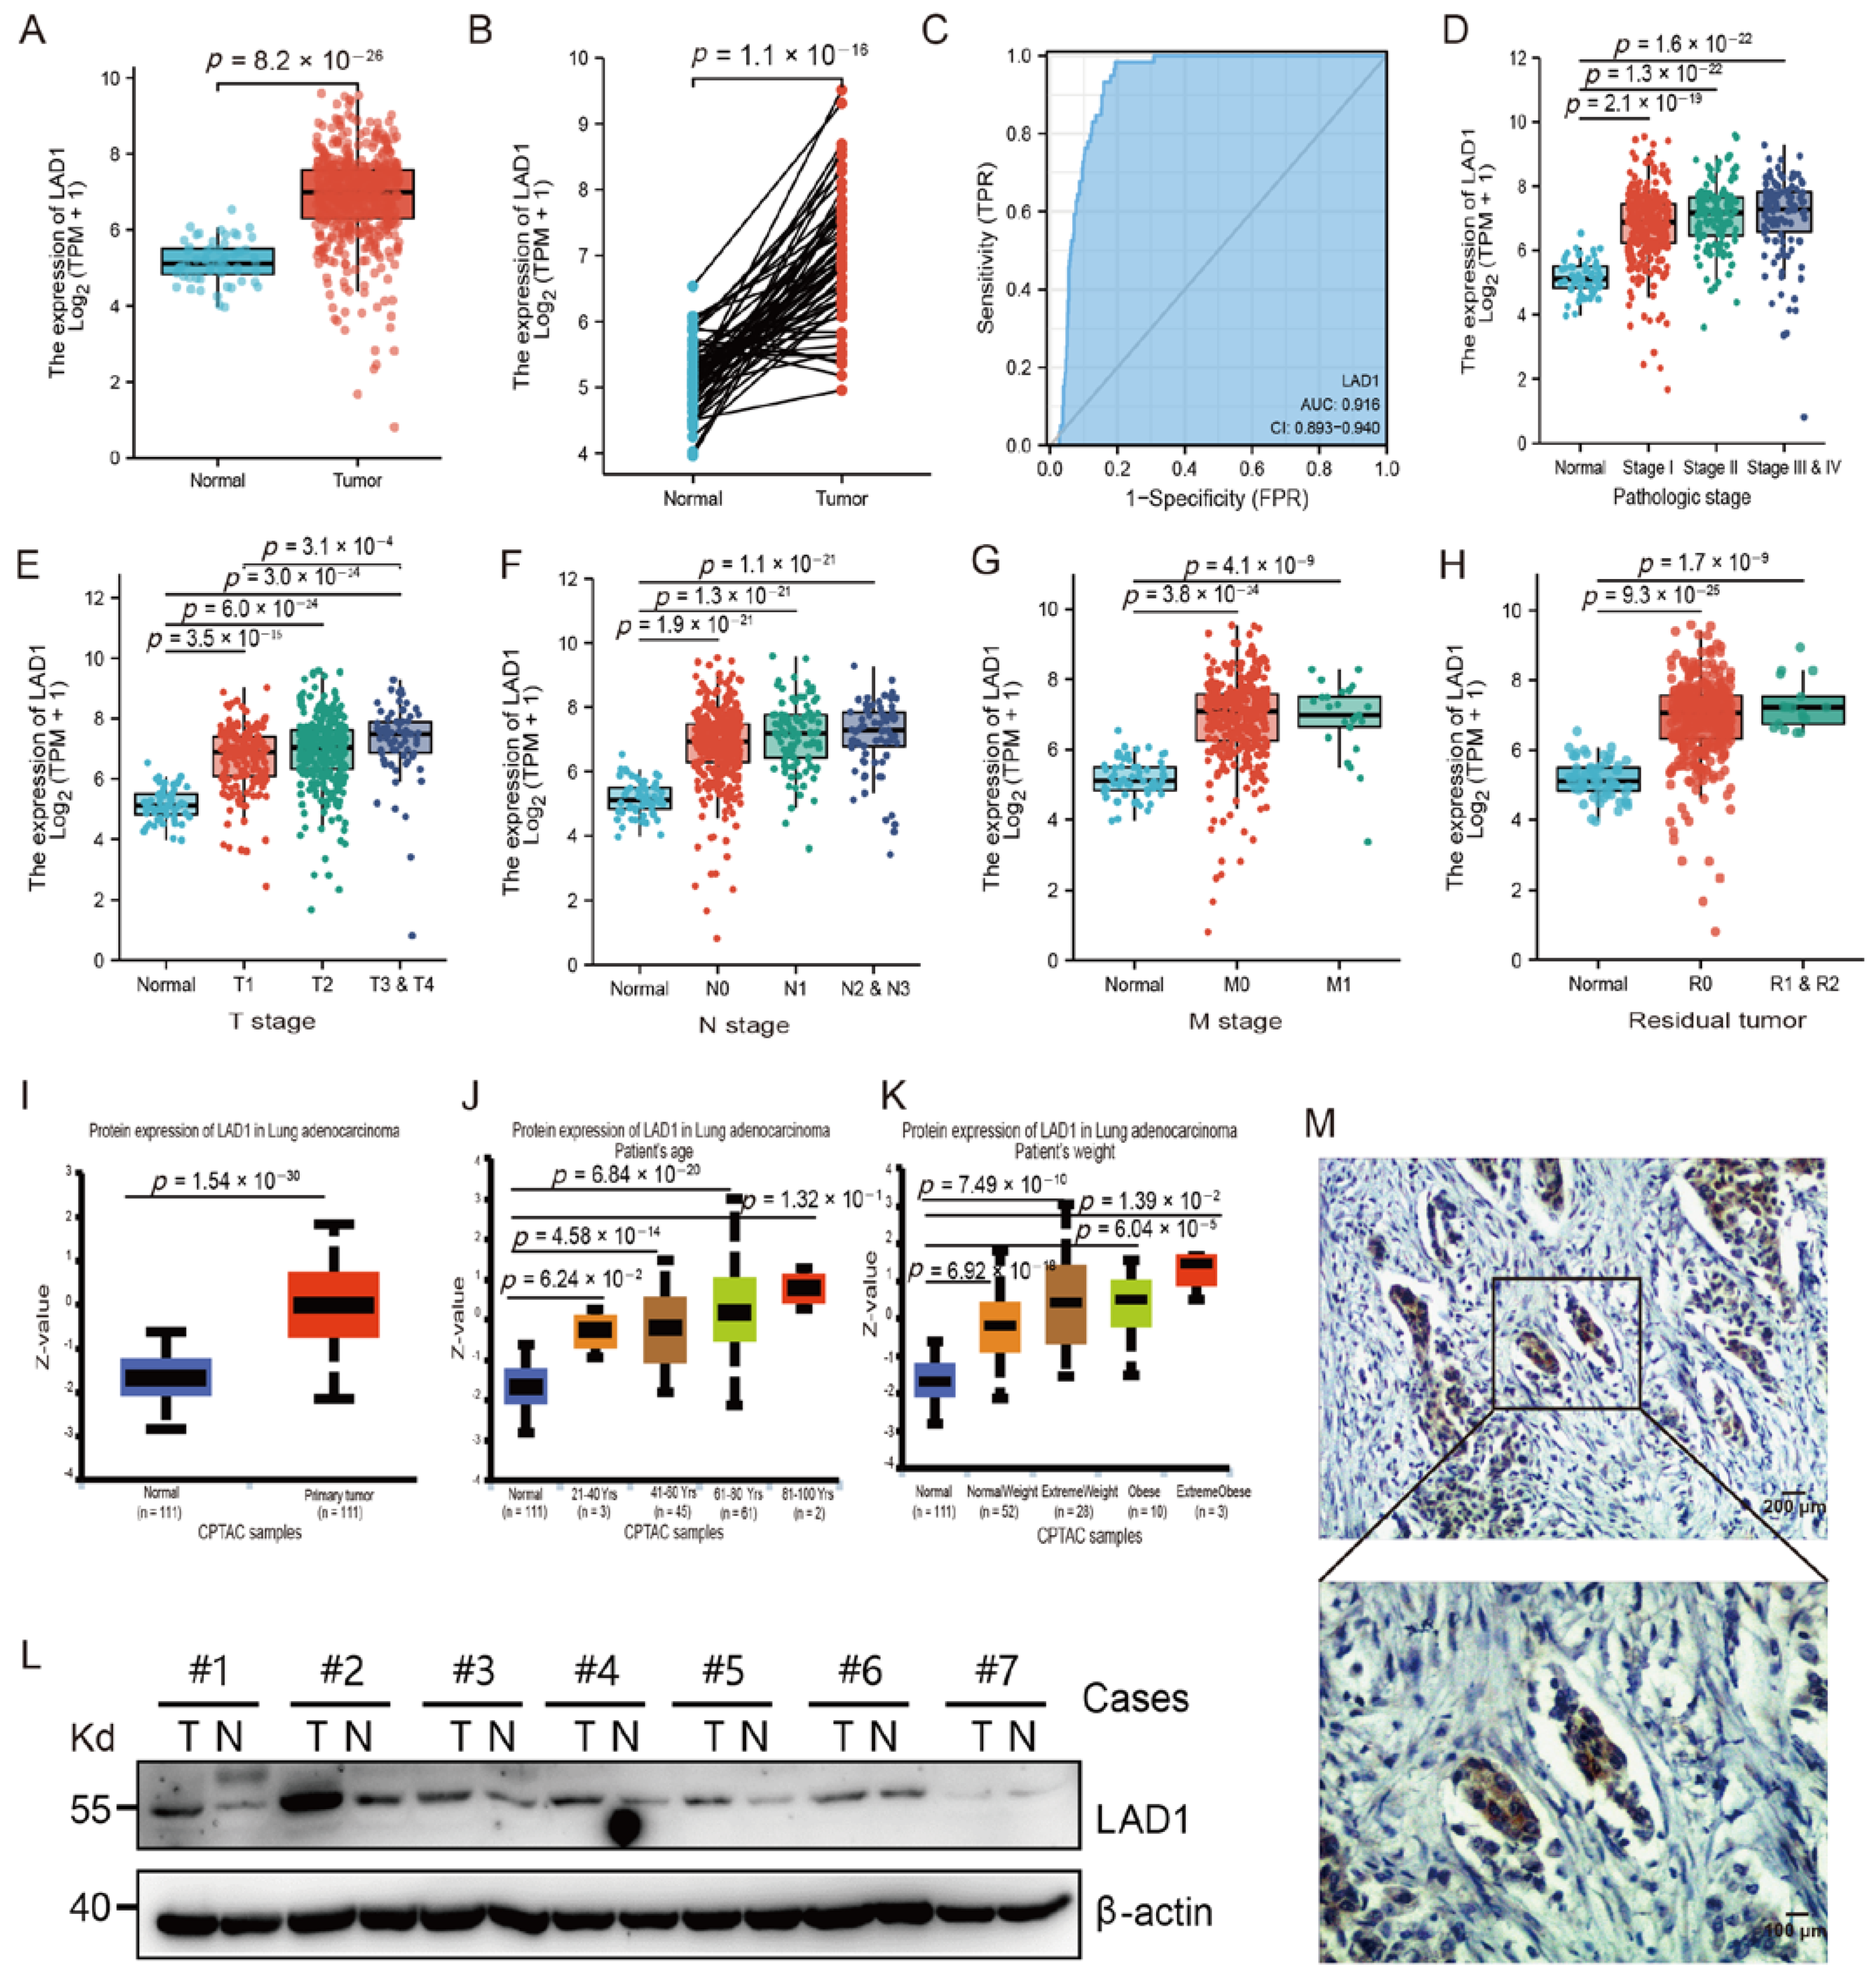
Abstract
:1. Introduction
2. Results
2.1. The Overexpression of LAD1 in LUAD
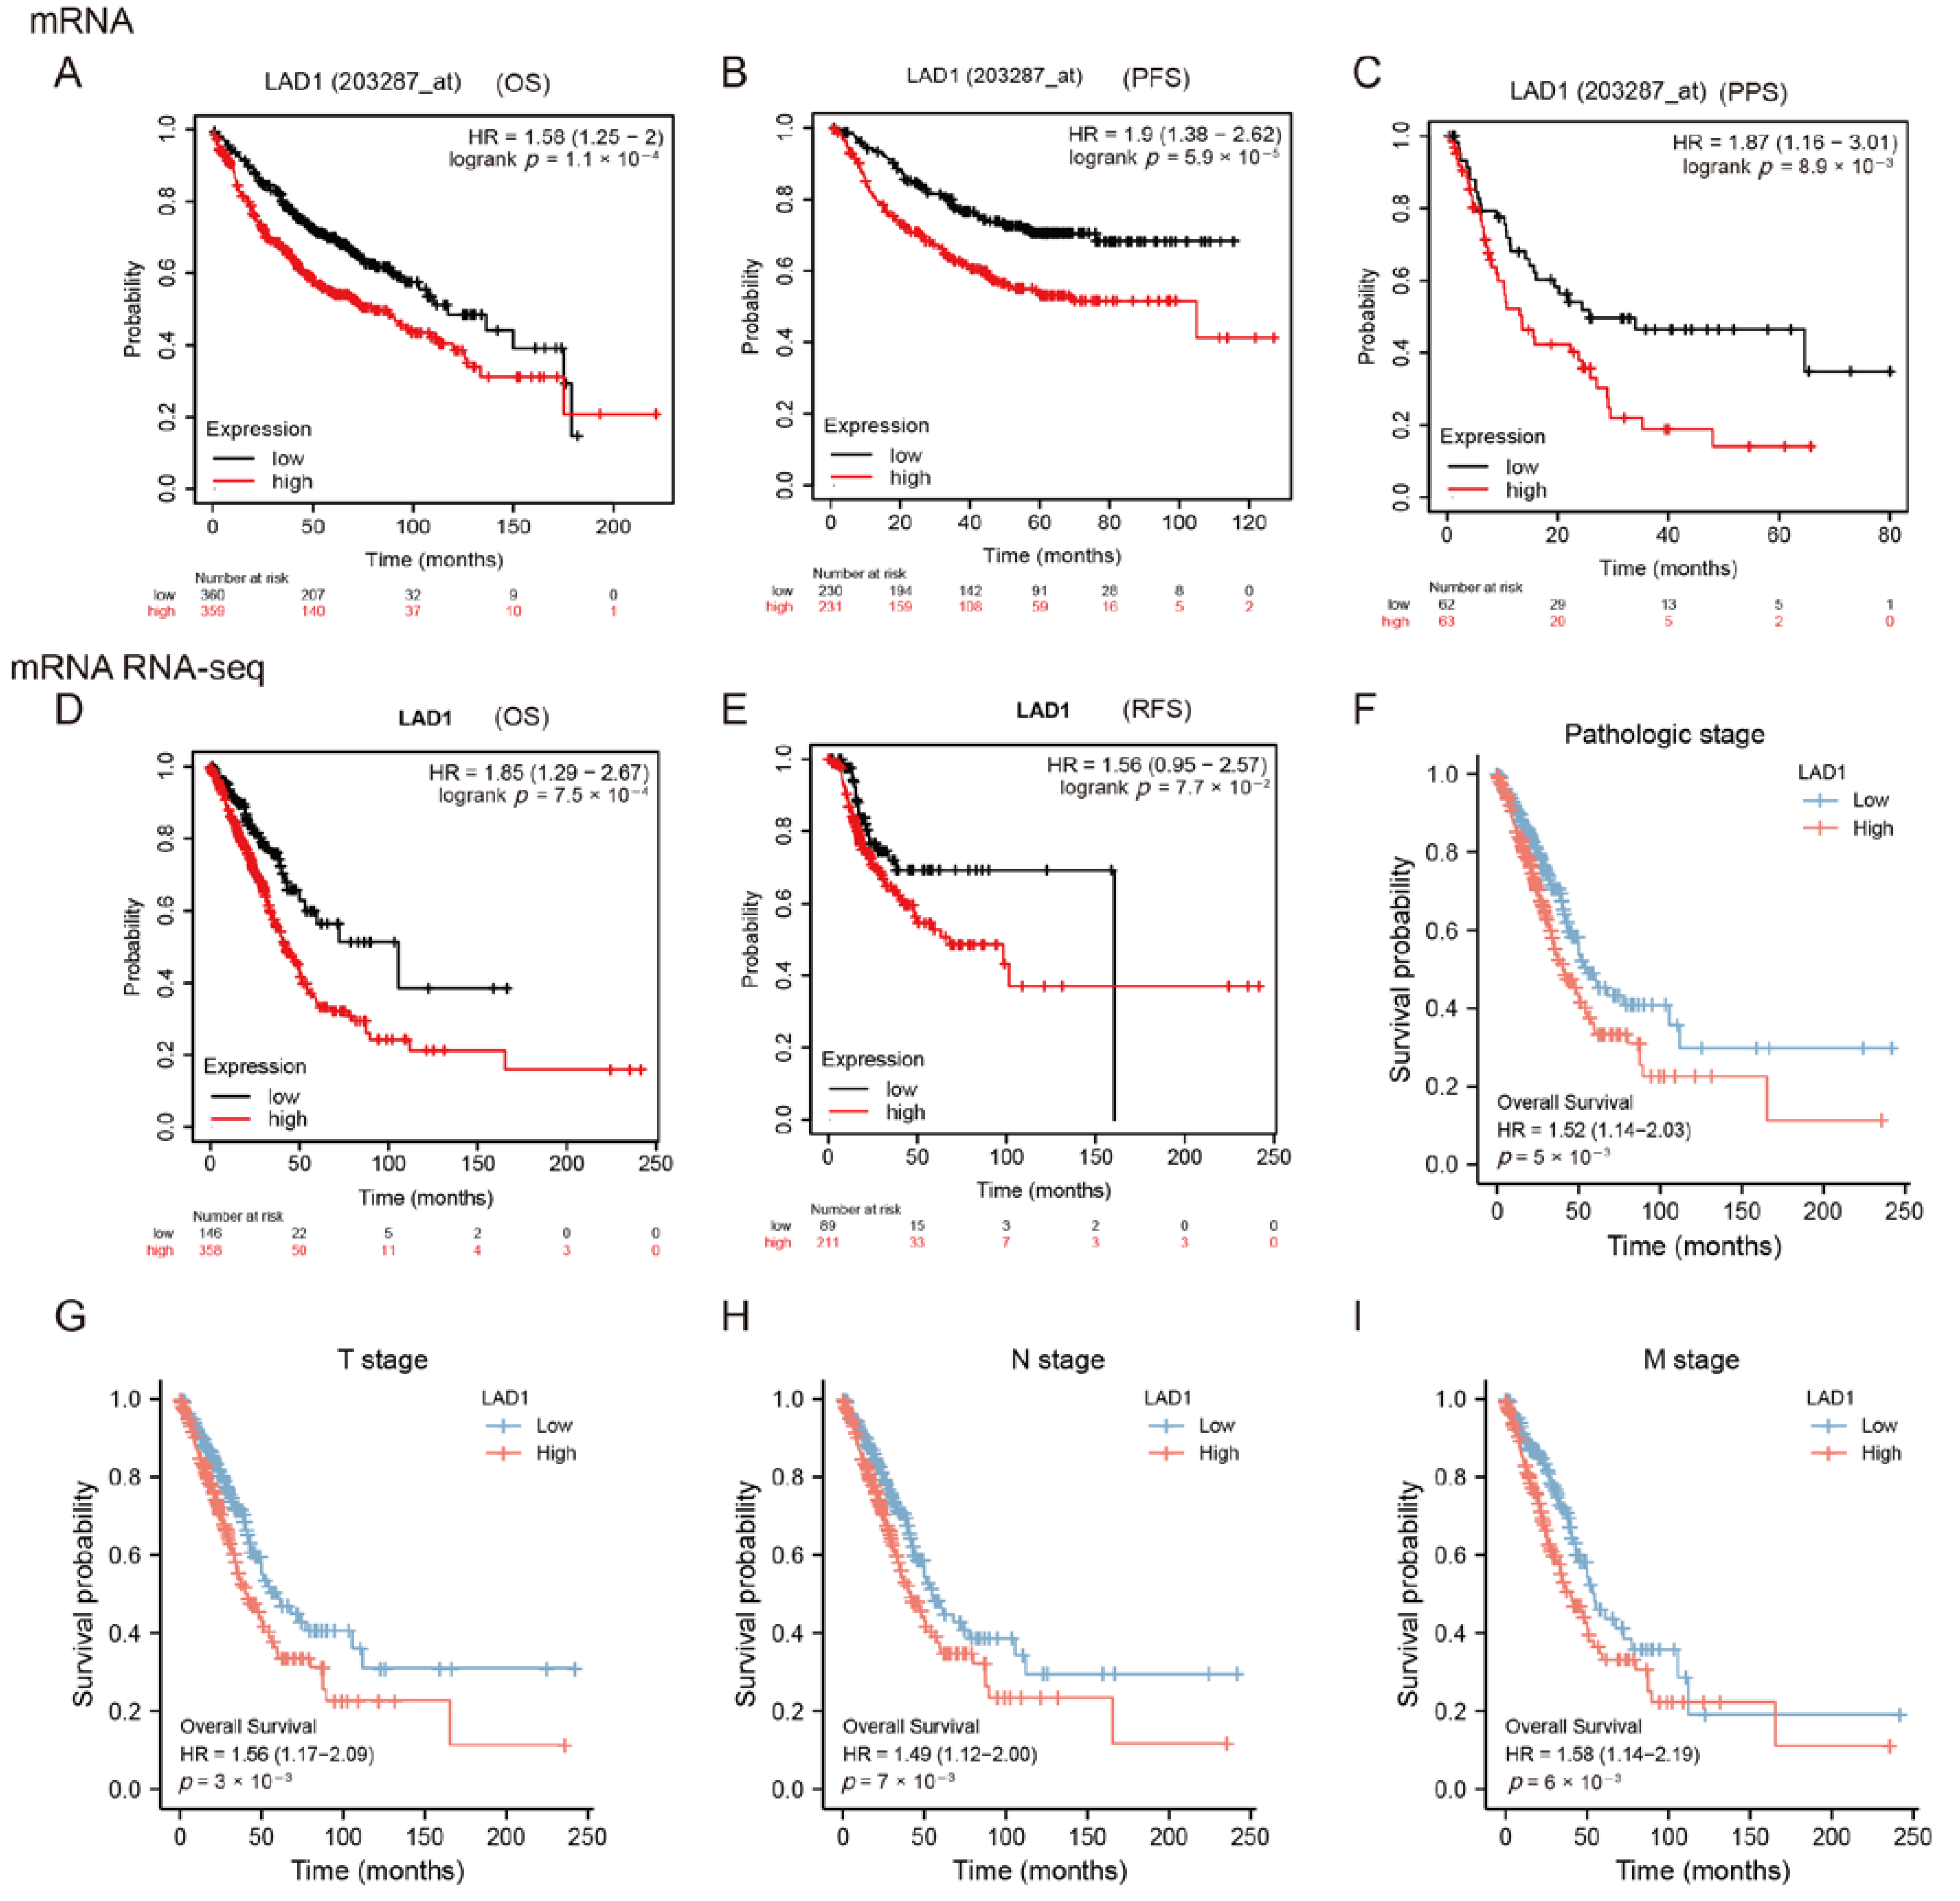
2.2. High Expression of LAD1 Predicts Poor Prognosis
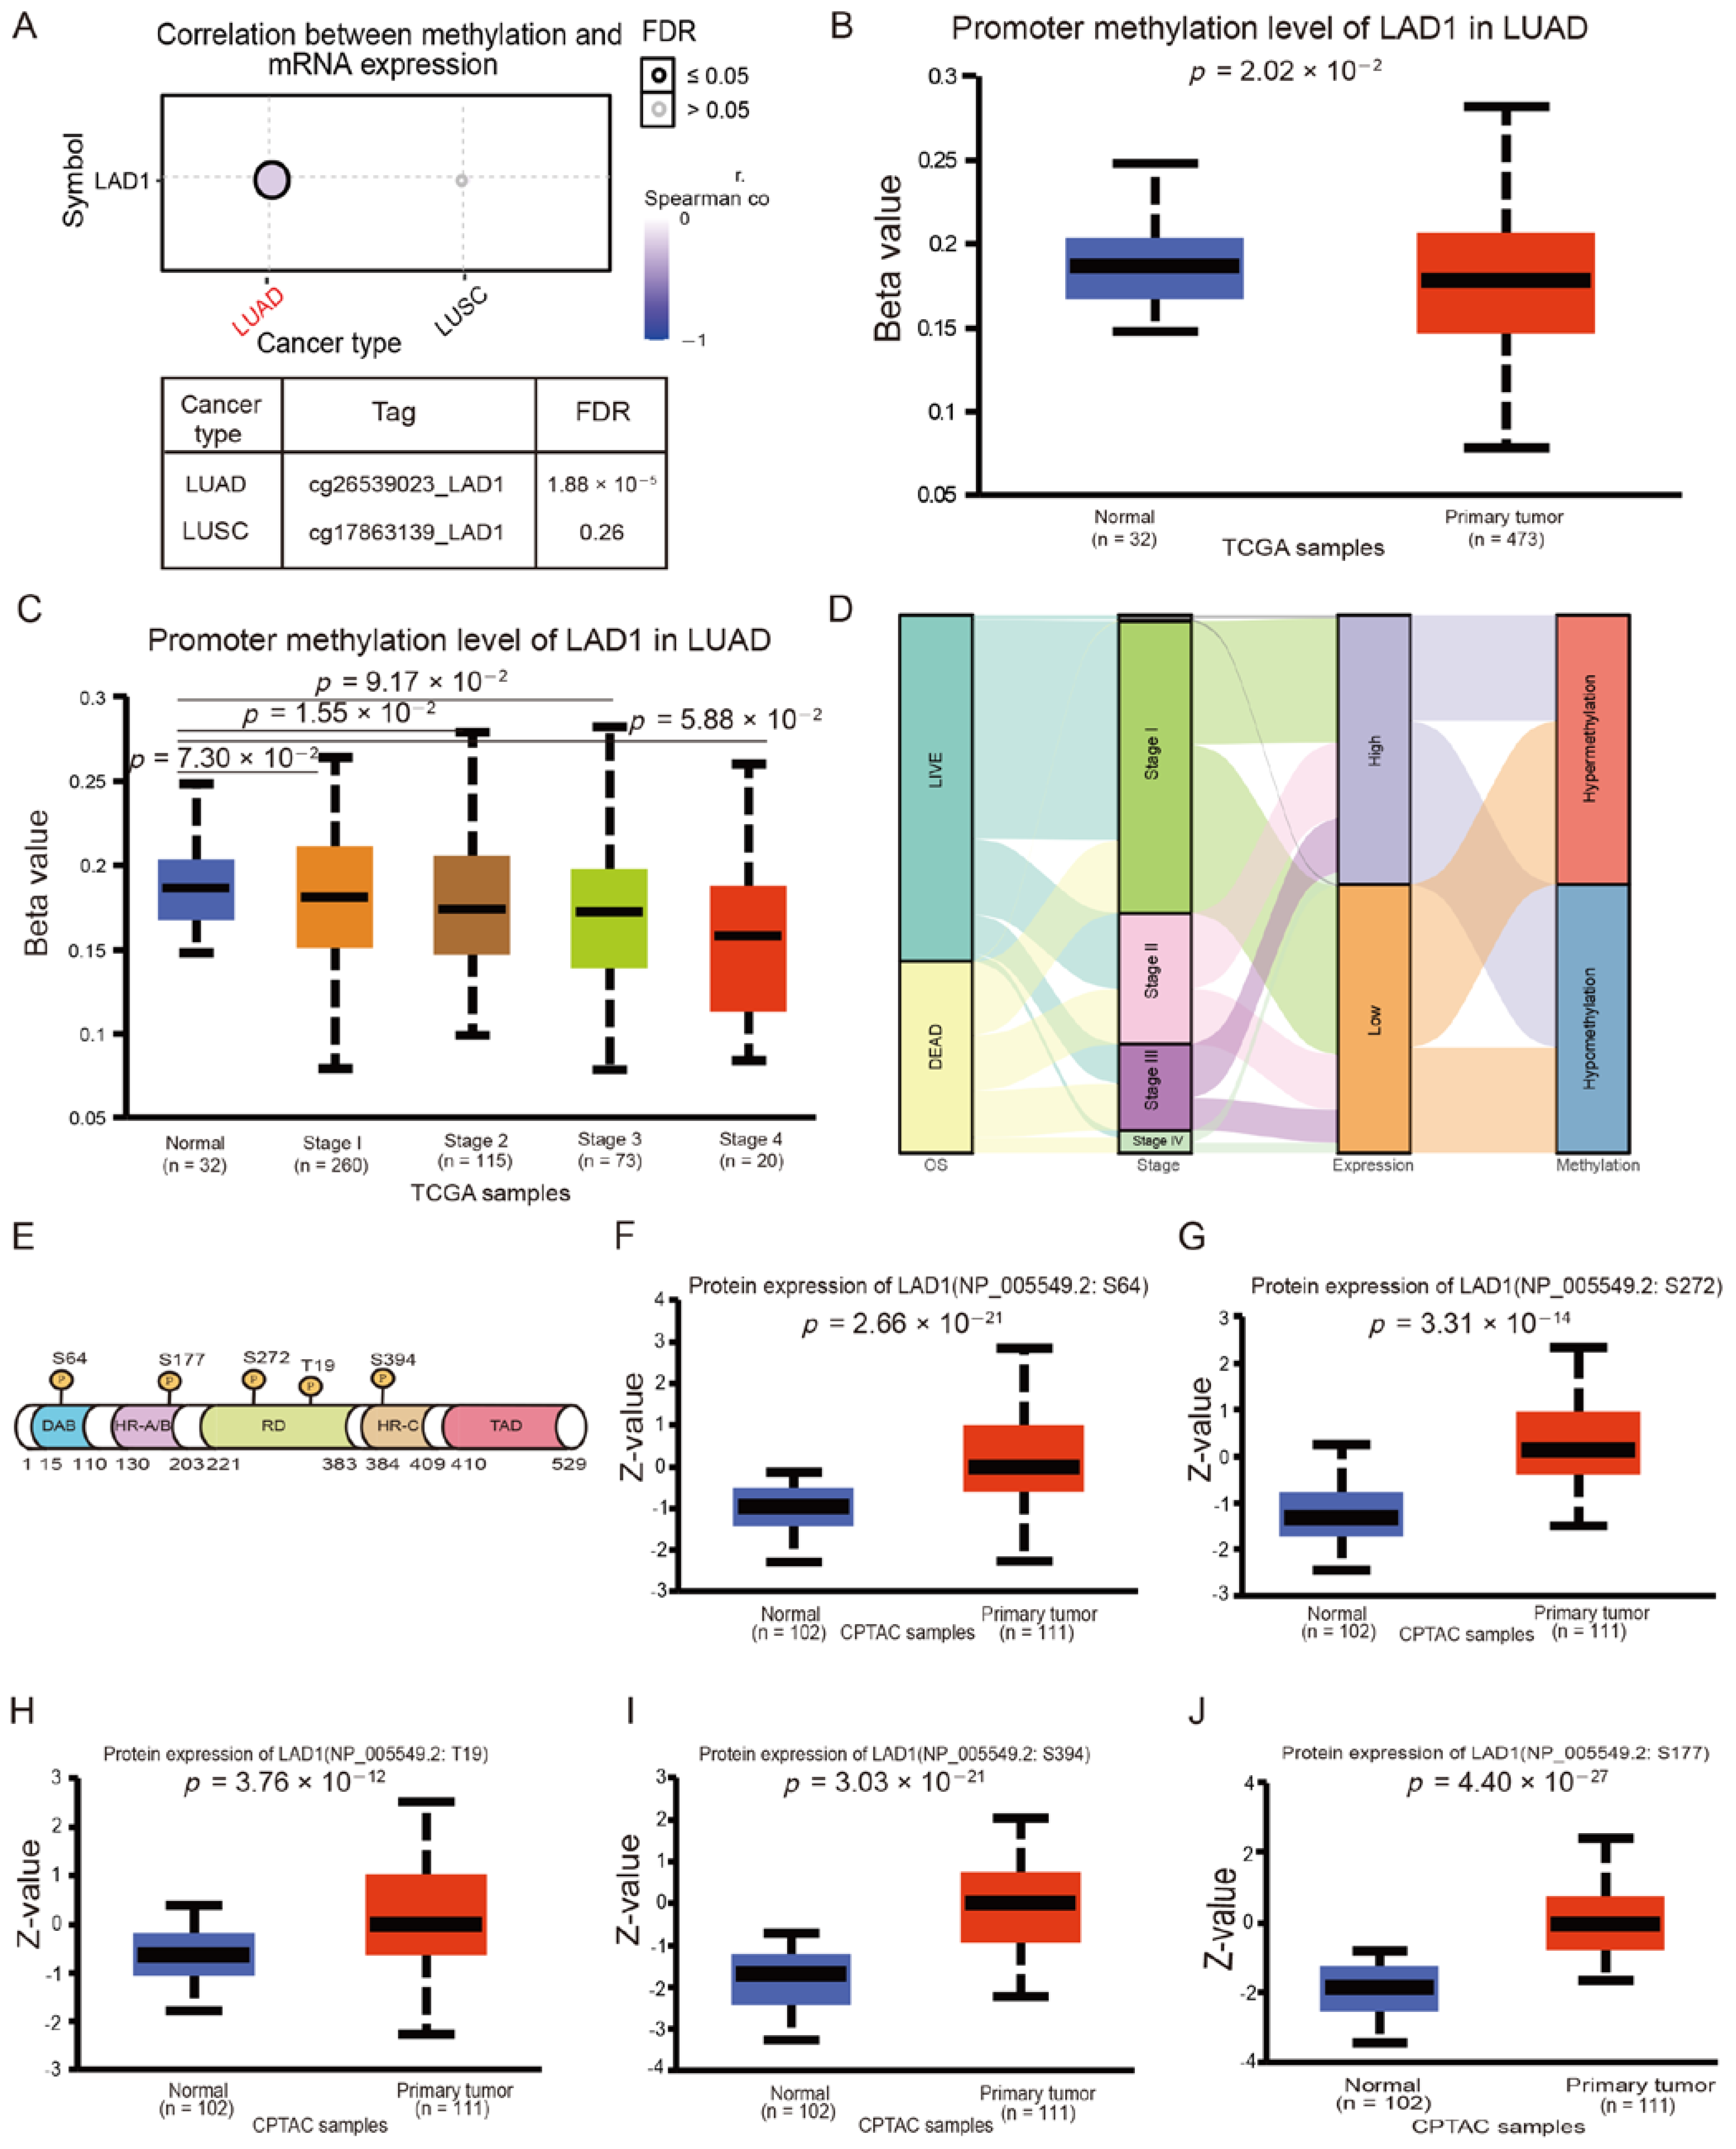
2.3. LAD1 Exhibits Promoter Hypomethylation and Protein Hyperphosphorylation in Lung Adenocarcinoma
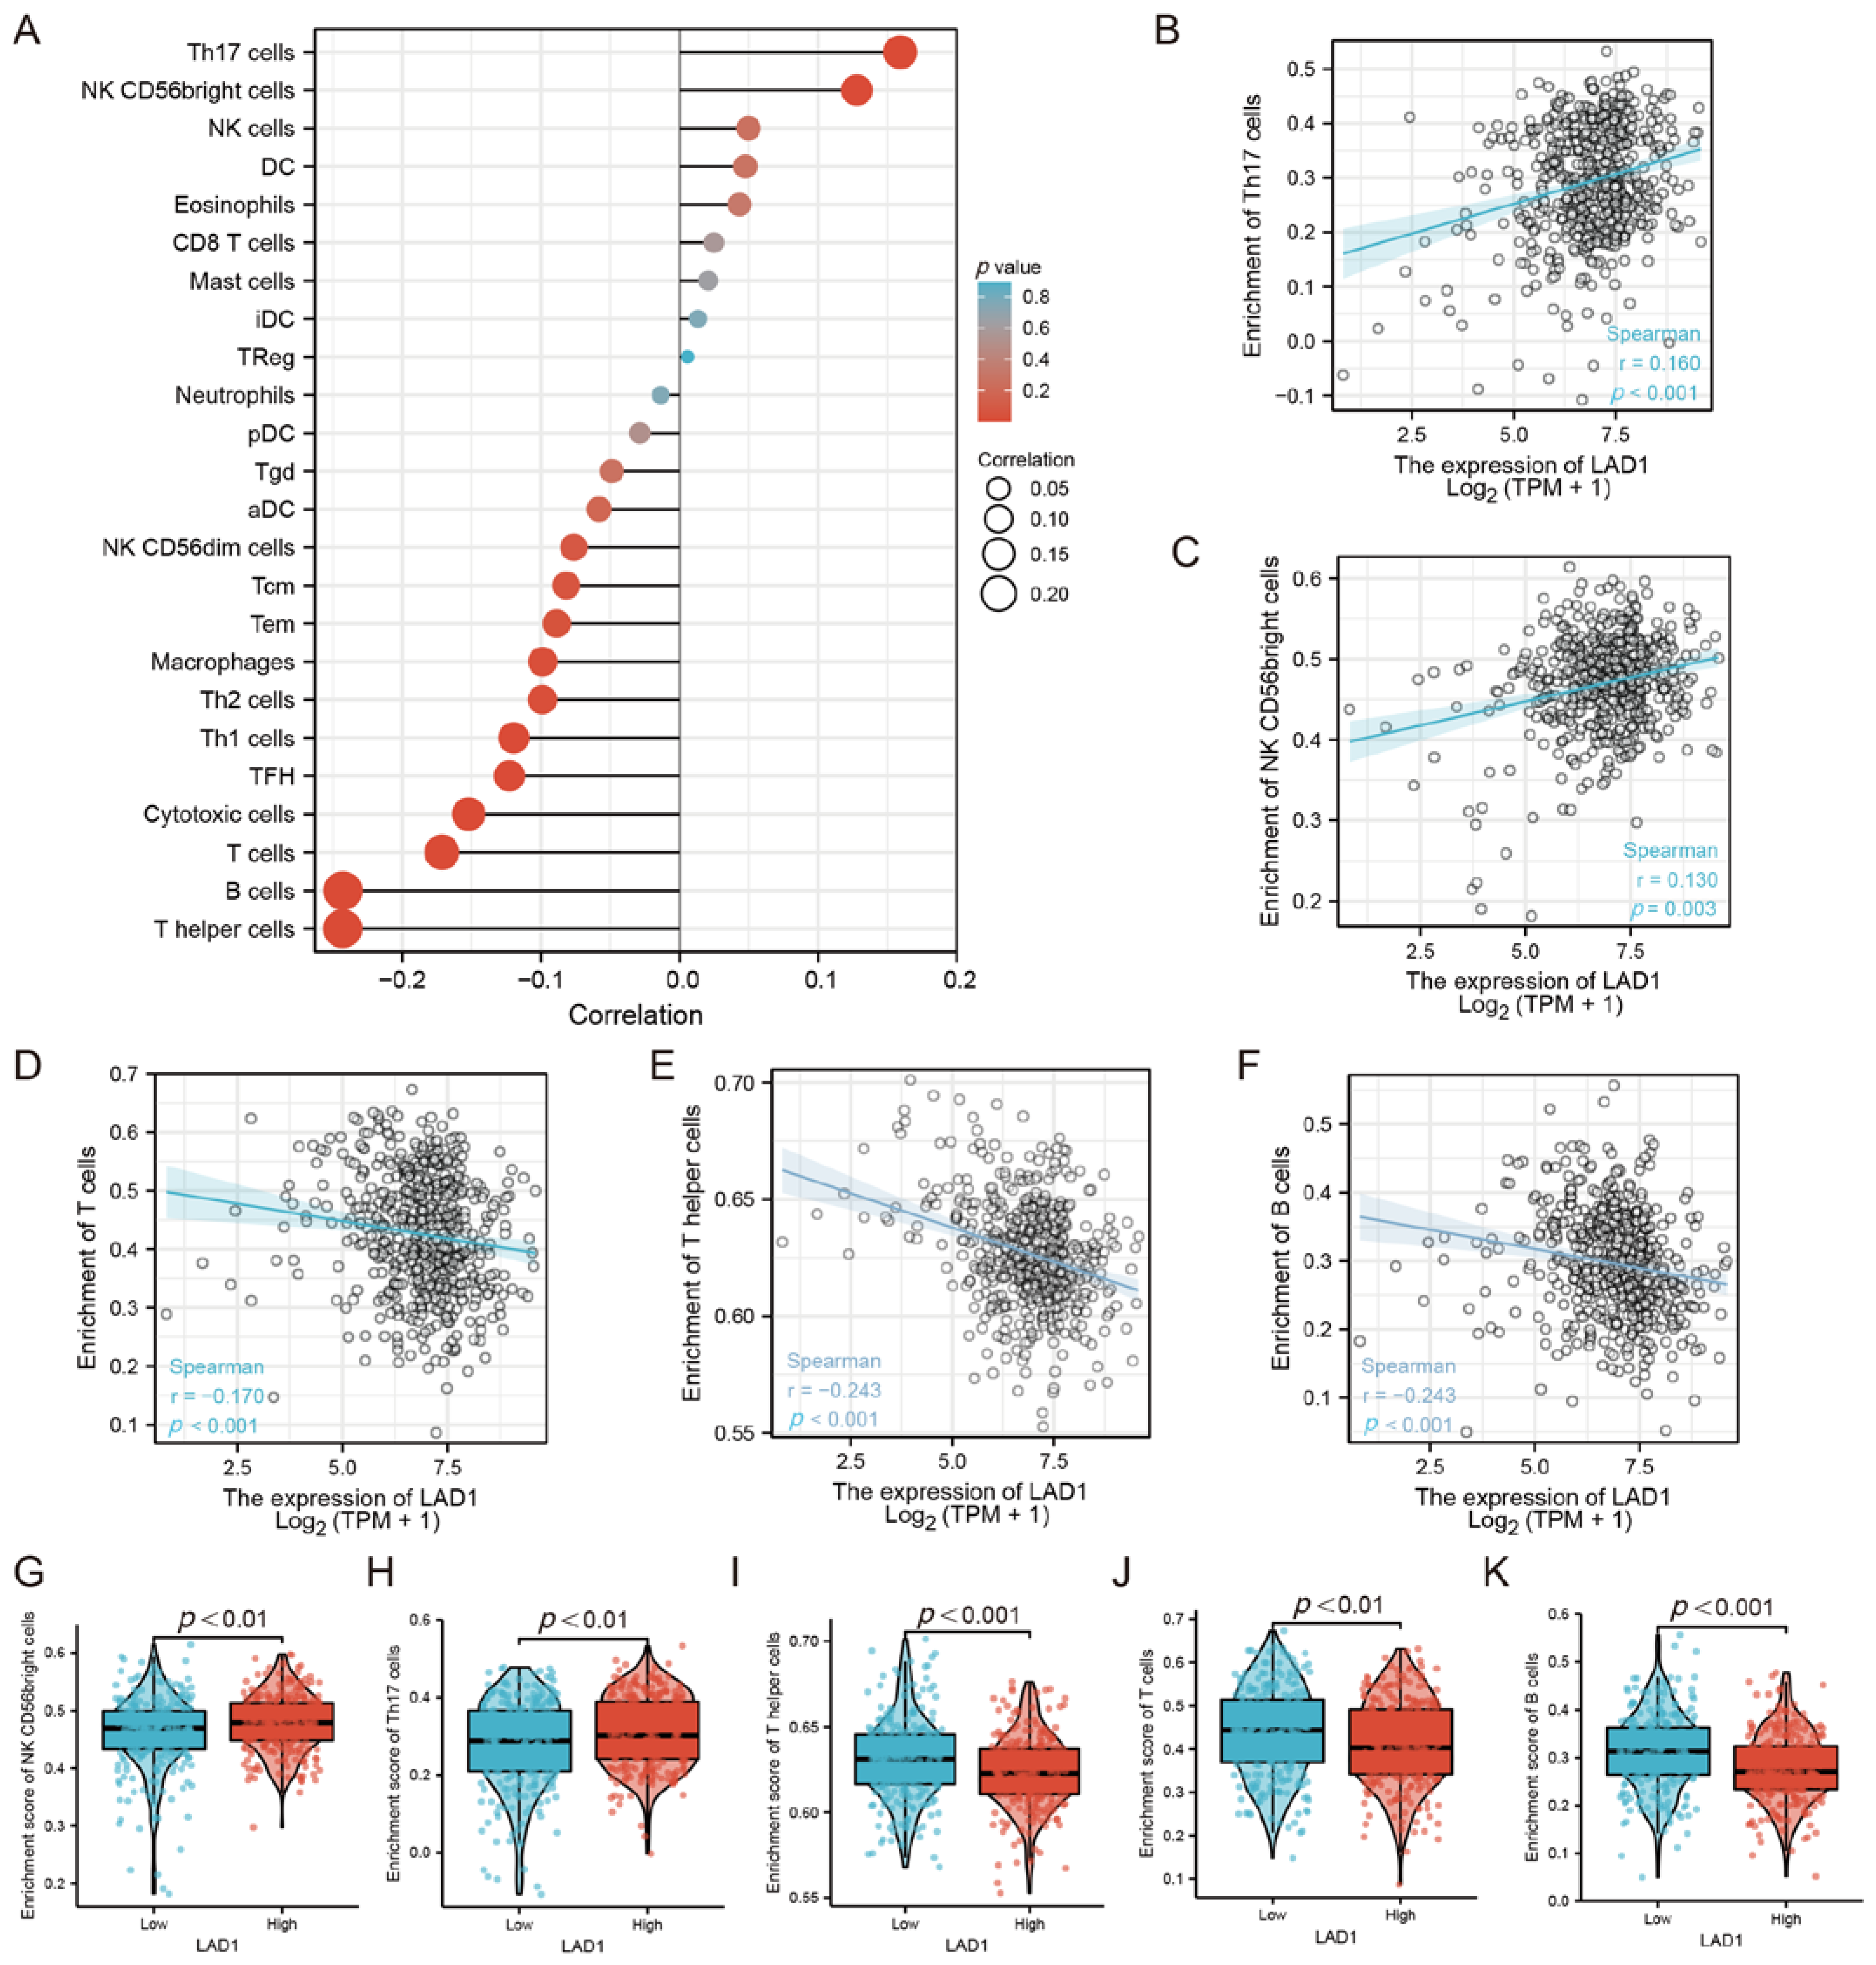
2.4. The Correlation between LAD1 Expression and Immune Infiltration
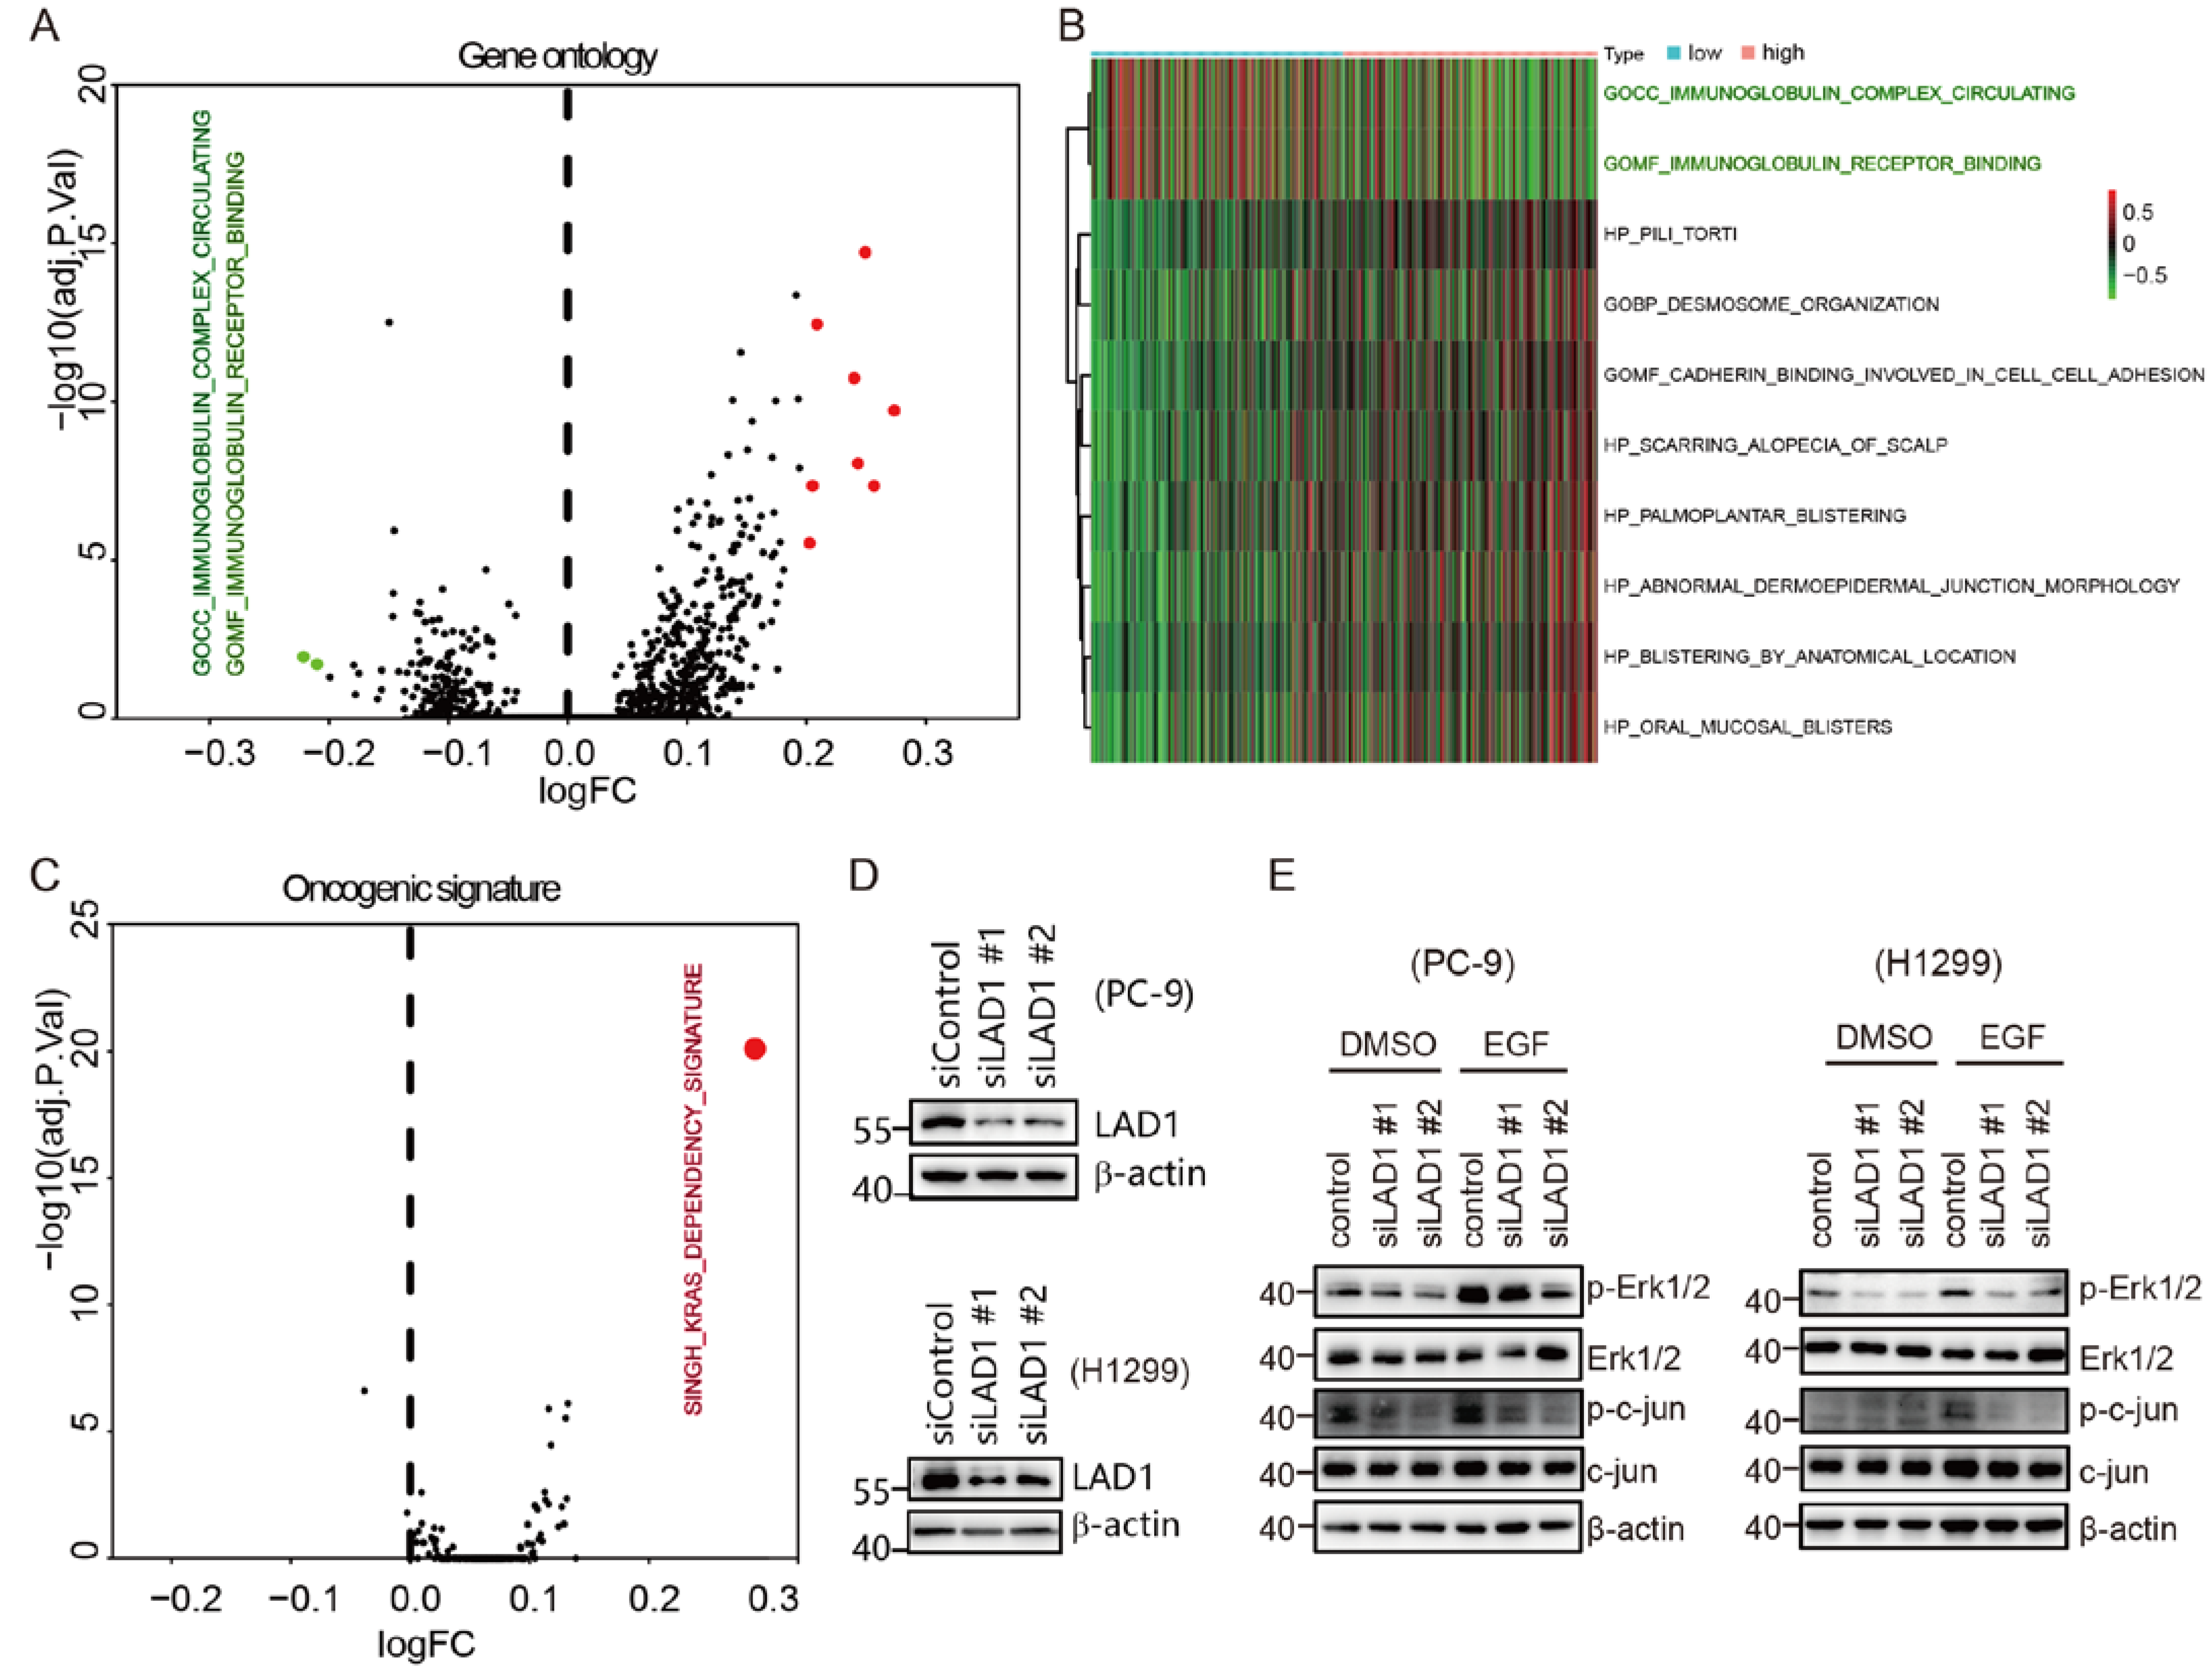
2.5. GSVA Identified LAD1 Overexpression Relates with “K-Ras Addiction” Phenotype
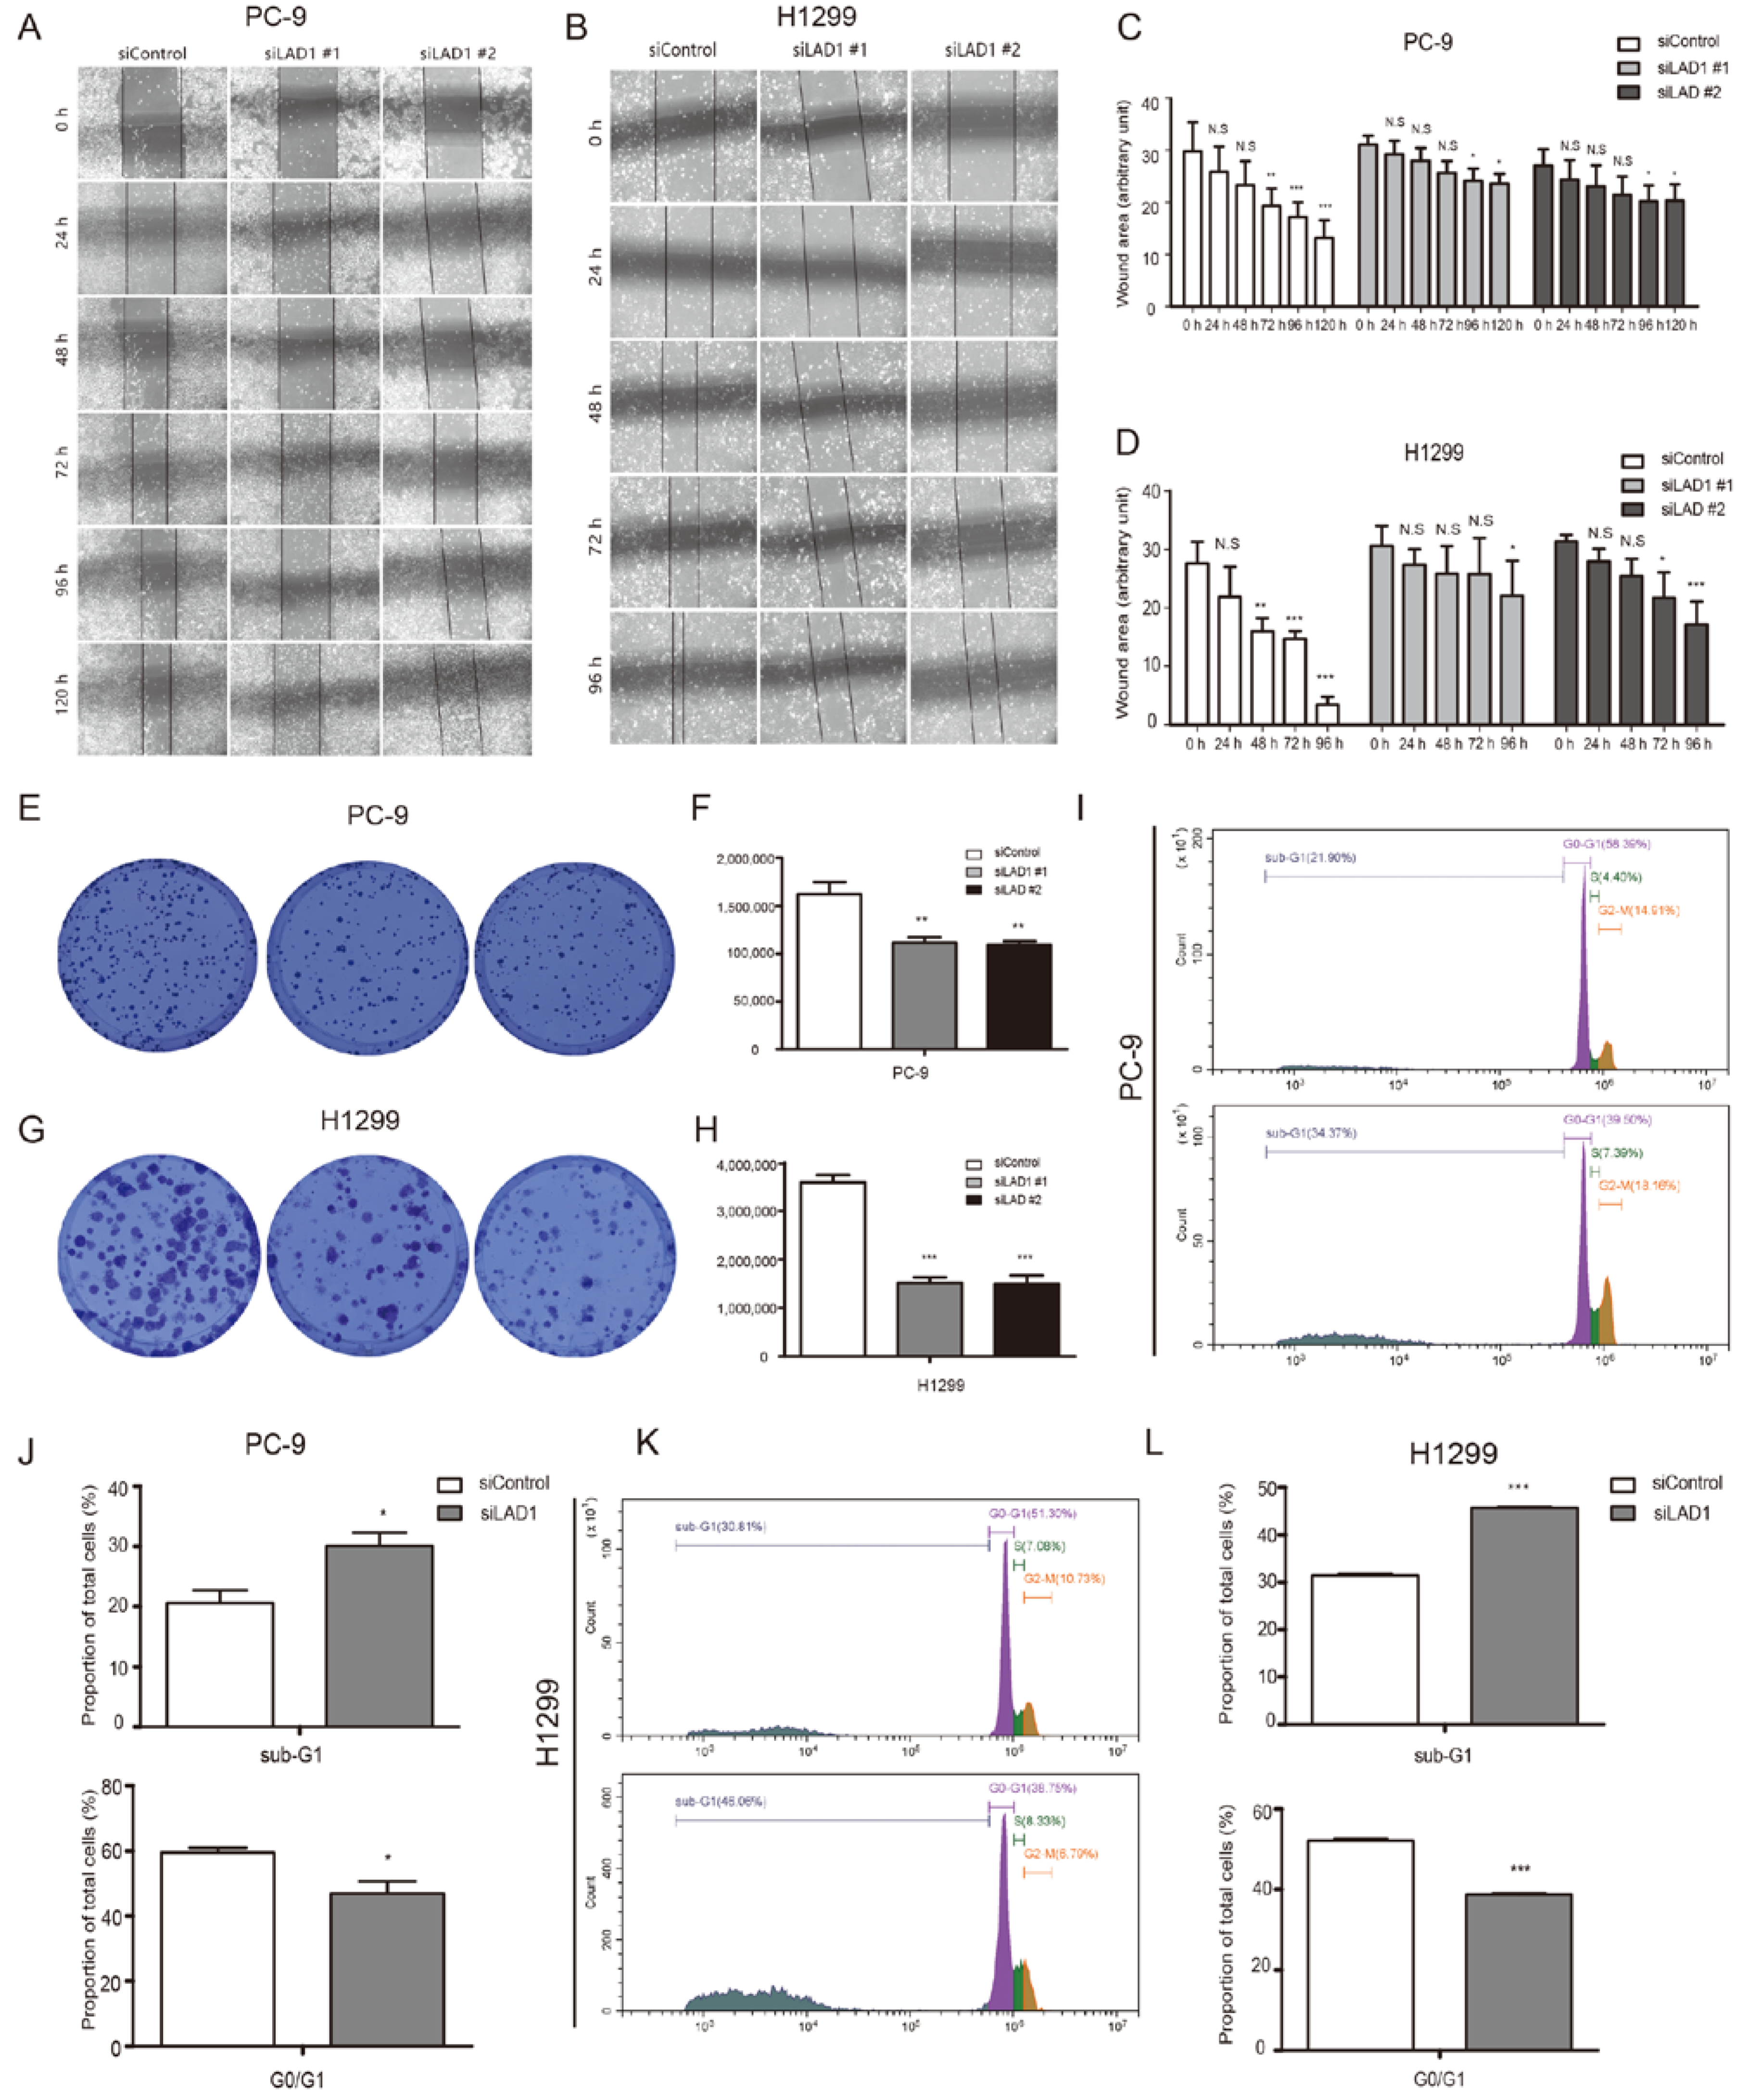
2.6. Critical Role of LAD1 in LUAD Cell Migration, Proliferation, Cell Cycle, and Apoptosis
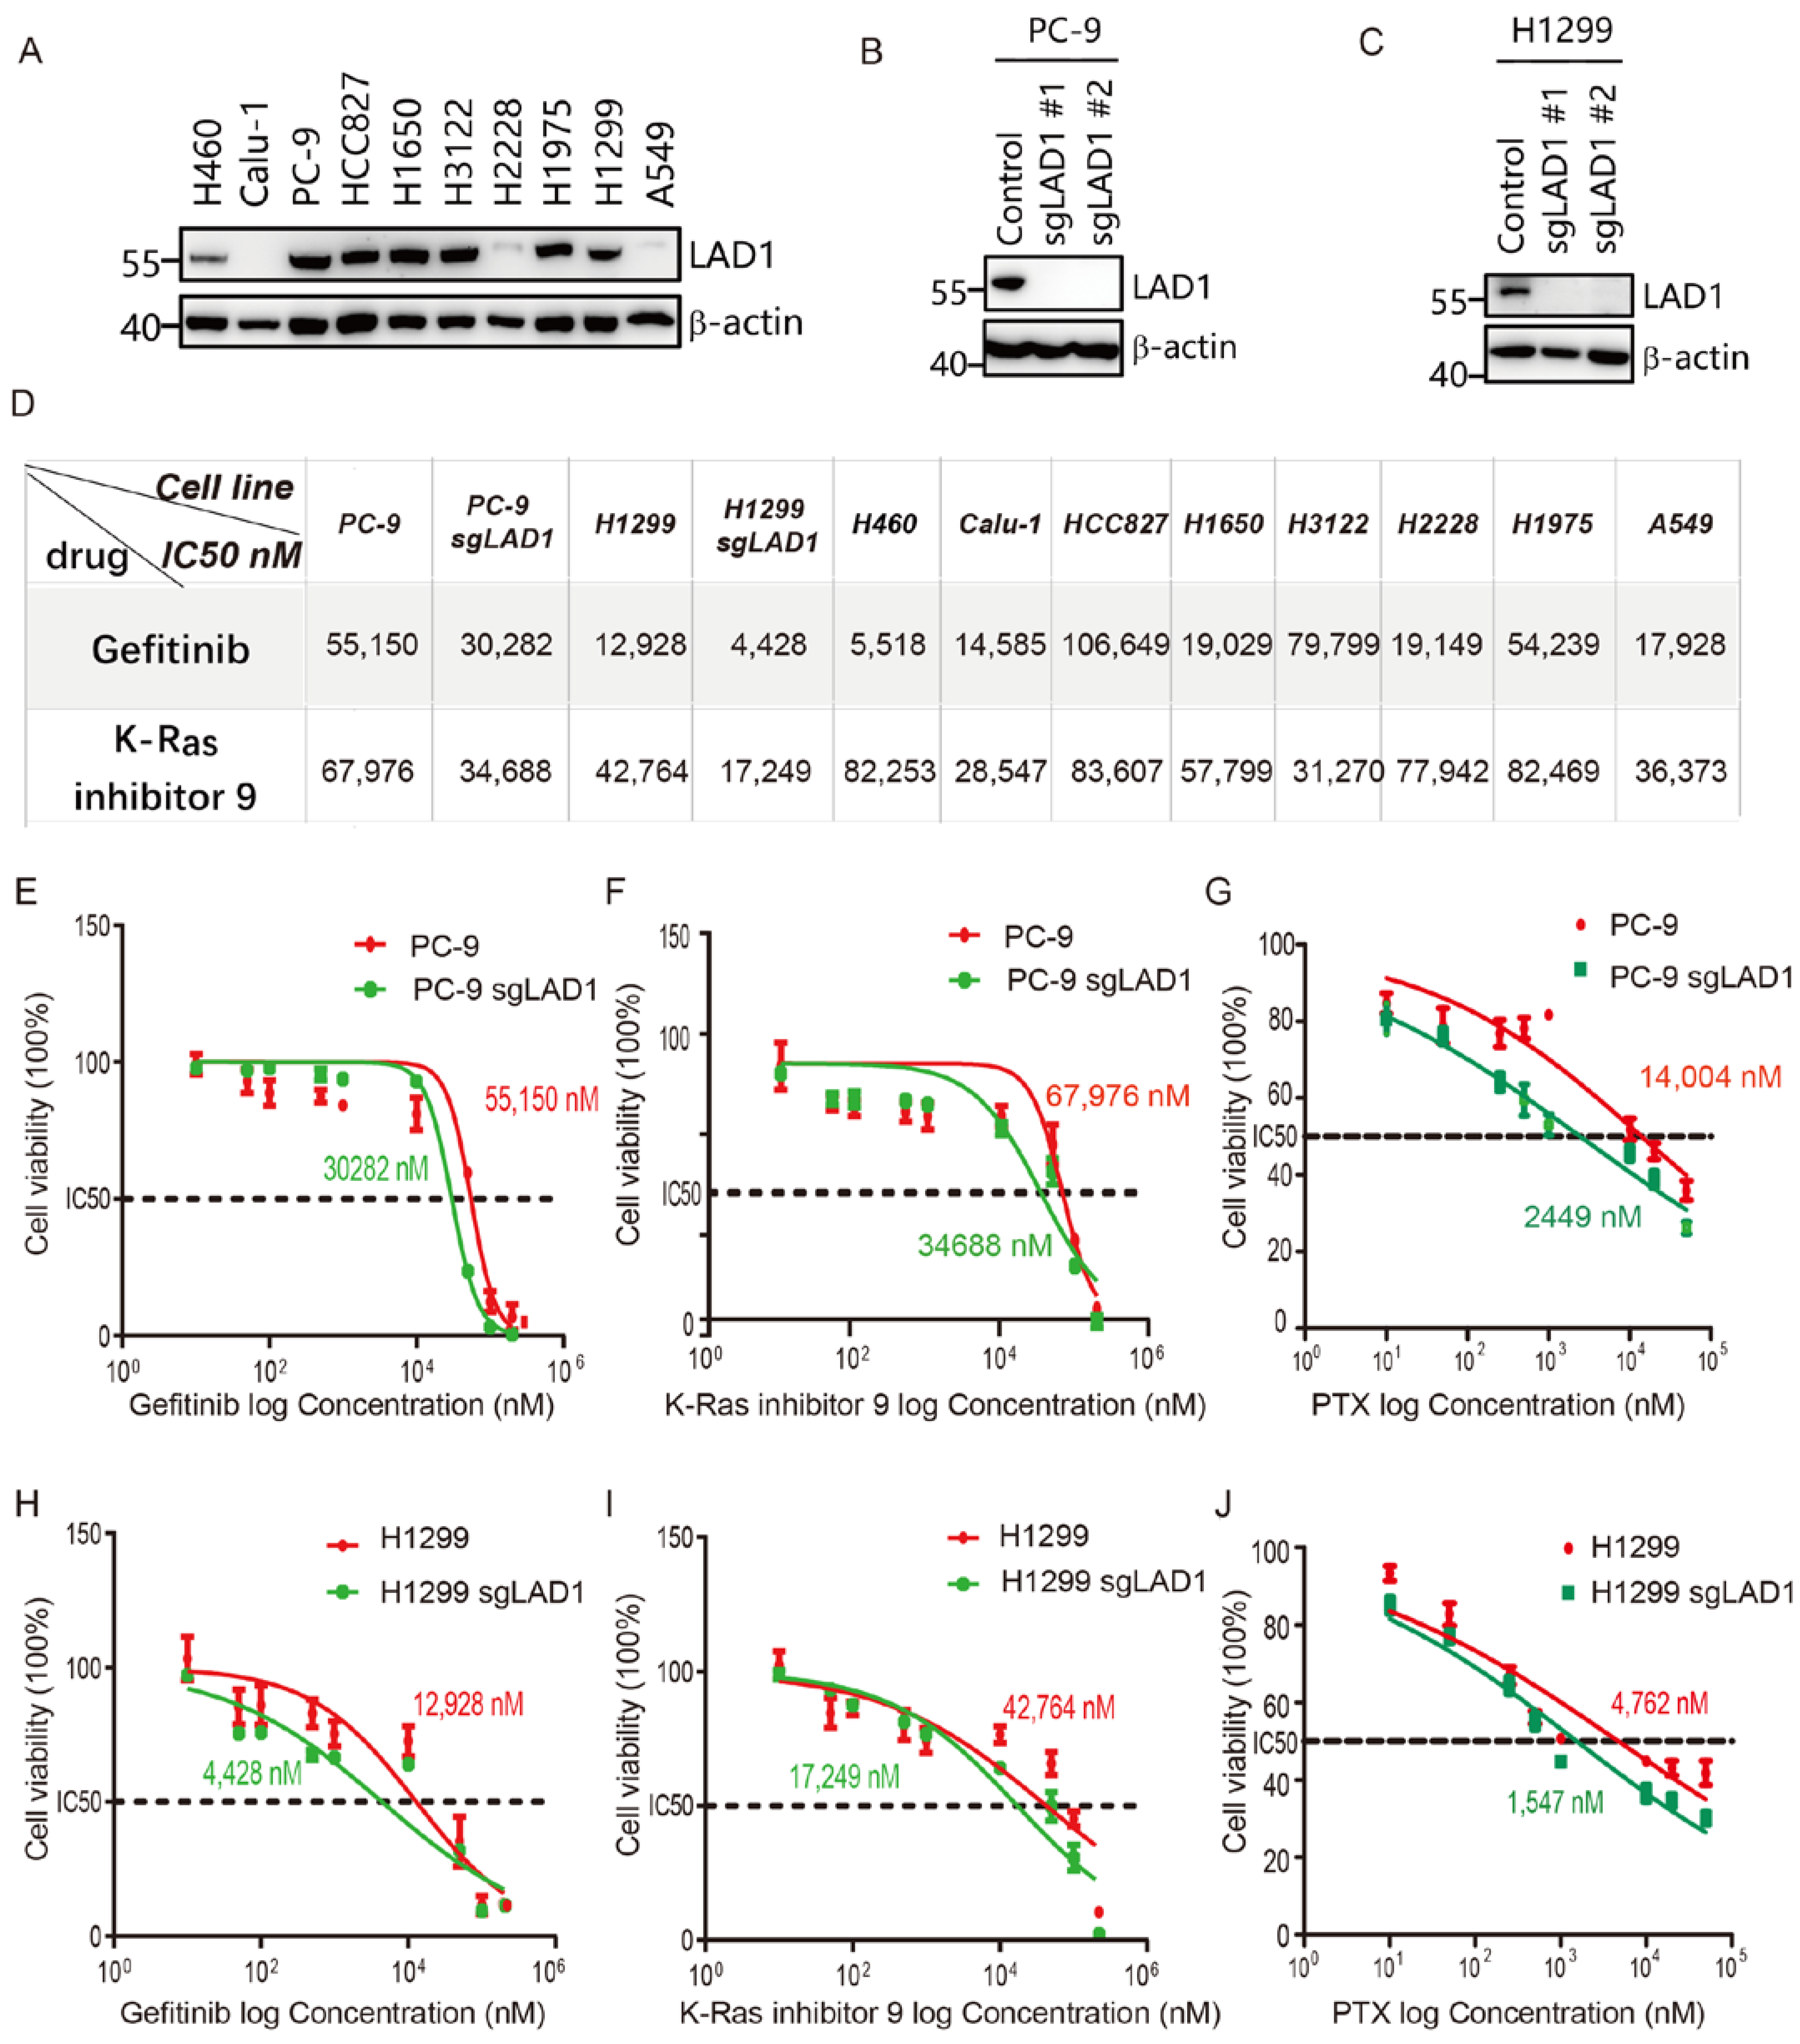
2.7. LAD1 Upregulation Contributes to Chemotherapeutic Drug Resistance in LUAD Cells
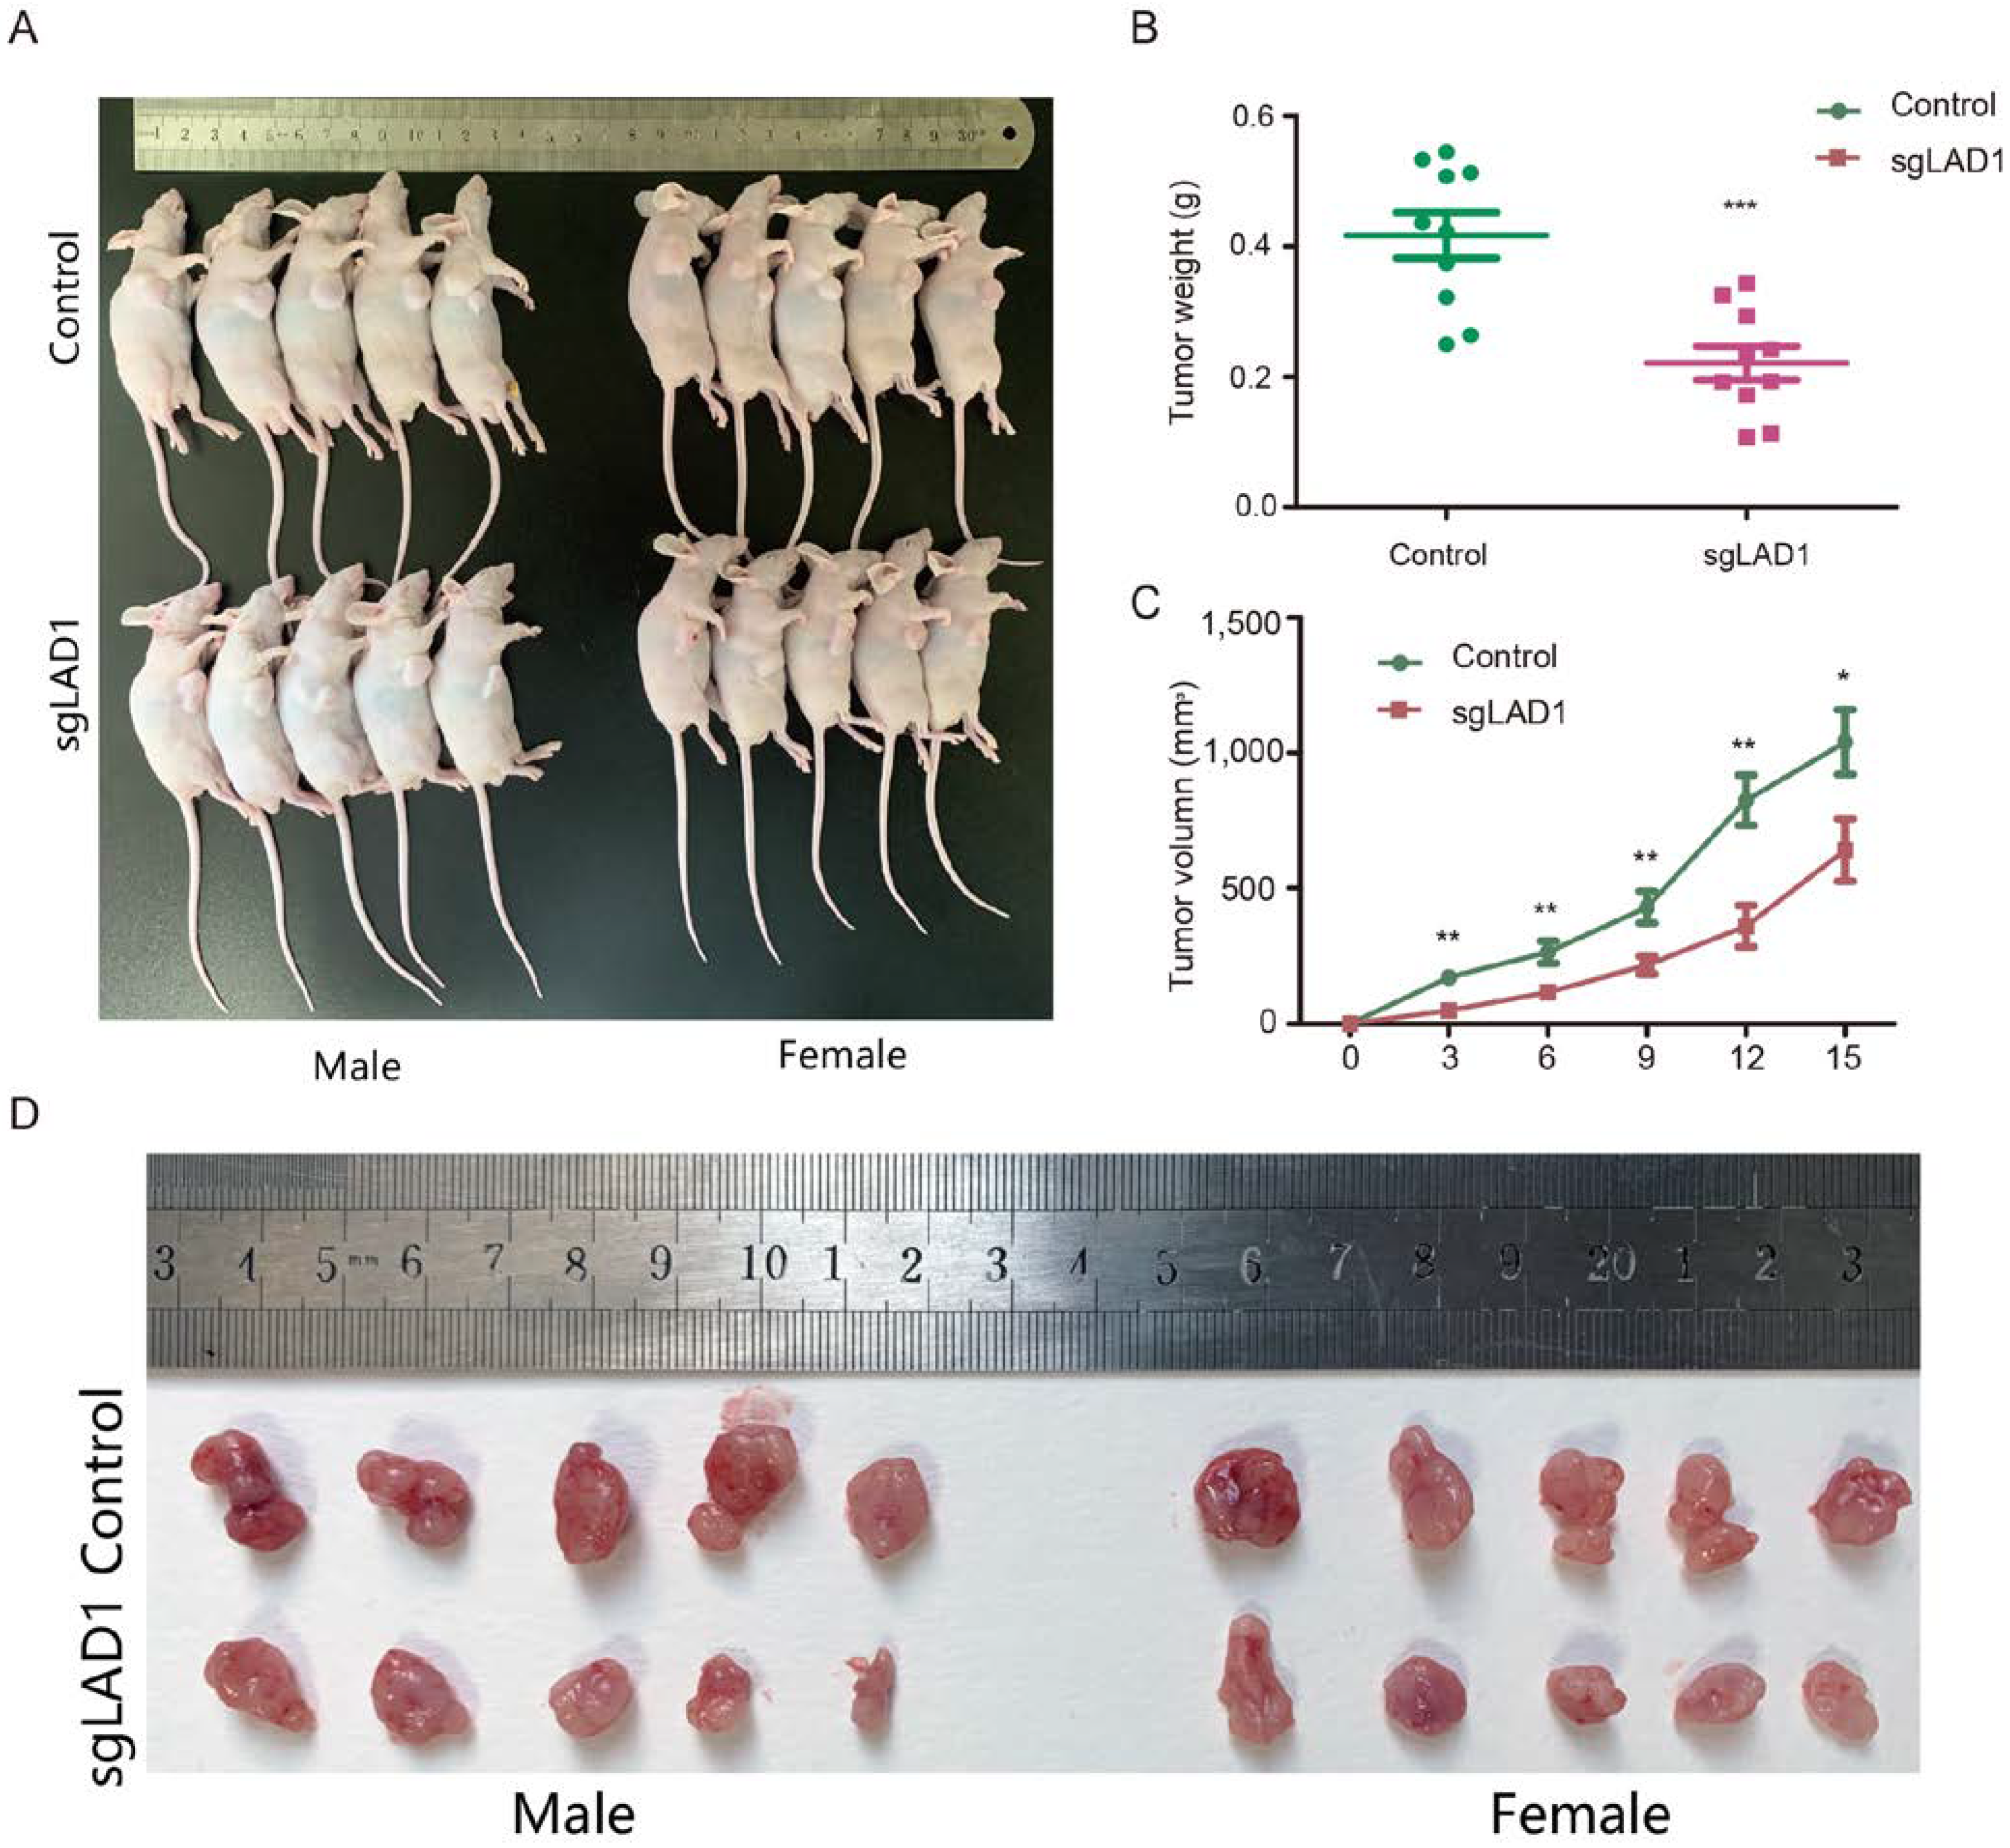
2.8. LAD1 Depletion Reduces Tumorigenicity of LUAD Cells in the Xenograft Model
3. Discussion
4. Materials and Methods
4.1. Data Source and Processing
4.2. Differential Expression Analysis of LAD1
4.3. Survival Analysis
4.4. Genome-Wide Analysis of LAD1
4.5. Gene Set Variation Analysis (GSVA)
4.6. Analysis of Immune Cell Infiltration
4.7. Cell Lines
4.8. Specimen Collection and Immunohistochemistry
4.9. Western Blotting
4.10. LAD1 Knockdown and Knockout
4.11. Cell Cycle Analysis
4.12. Reagents and Cell Viability Assay
4.13. CCK8 Assay
4.14. Wound Healing Assay
4.15. Colony Formation Assay
4.16. Animal Experiments
4.17. Statistical Analysis
5. Conclusions
Supplementary Materials
Author Contributions
Funding
Institutional Review Board Statement
Informed Consent Statement
Data Availability Statement
Conflicts of Interest
Abbreviations
References
- Xia, C.; Dong, X.; Li, H.; Cao, M.; Sun, D.; He, S.; Yang, F.; Yan, X.; Zhang, S.; Li, N.; et al. Cancer statistics in China and United States, 2022: Profiles, trends, and determinants. Chin. Med. J. 2022, 135, 584–590. [Google Scholar] [CrossRef] [PubMed]
- Global Burden of Disease Cancer Collaboration; Fitzmaurice, C.; Abate, D.; Abbasi, N.; Abbastabar, H.; Abd-Allah, F.; Abdel-Rahman, O.; Abdelalim, A.; Abdoli, A.; Abdollahpour, I.; et al. Global, Regional, and National Cancer Incidence, Mortality, Years of Life Lost, Years Lived With Disability, and Disability-Adjusted Life-Years for 29 Cancer Groups, 1990 to 2017: A Systematic Analysis for the Global Burden of Disease Study. JAMA. Oncol. 2019, 5, 1749–1768. [Google Scholar] [CrossRef] [PubMed] [Green Version]
- Siegel, R.L.; Miller, K.D.; Jemal, A. Cancer Statistics, 2017. CA. Cancer J. Clin. 2017, 67, 7–30. [Google Scholar] [CrossRef] [PubMed] [Green Version]
- Lazarus, K.A.; Hadi, F.; Zambon, E.; Bach, K.; Santolla, M.F.; Watson, J.K.; Correia, L.L.; Das, M.; Ugur, R.; Pensa, S.; et al. BCL11A interacts with SOX2 to control the expression of epigenetic regulators in lung squamous carcinoma. Nat. Commun. 2018, 9, 3327. [Google Scholar] [CrossRef] [PubMed] [Green Version]
- Chen, Z.; Fillmore, C.M.; Hammerman, P.S.; Kim, C.F.; Wong, K.K. Non-small-cell lung cancers: A heterogeneous set of diseases. Nat. Rev. Cancer 2014, 14, 535–546. [Google Scholar] [CrossRef]
- Kerdidani, D.; Chouvardas, P.; Arjo, A.R.; Giopanou, I.; Ntaliarda, G.; Guo, Y.A.; Tsikitis, M.; Kazamias, G.; Potaris, K.; Stathopoulos, G.T.; et al. Wnt1 silences chemokine genes in dendritic cells and induces adaptive immune resistance in lung adenocarcinoma. Nat. Commun. 2019, 10, 1405. [Google Scholar] [CrossRef] [Green Version]
- Ettinger, D.S.; Wood, D.E.; Aisner, D.L.; Akerley, W.; Bauman, J.R.; Bharat, A.; Bruno, D.S.; Chang, J.Y.; Chirieac, L.R.; D’Amico, T.A.; et al. NCCN Guidelines Insights: Non-Small Cell Lung Cancer, Version 2.2021. J. Natl. Compr. Canc. Netw. 2021, 19, 254–266. [Google Scholar] [CrossRef]
- Kris, M.G.; Gaspar, L.E.; Chaft, J.E.; Kennedy, E.B. Adjuvant Systemic Therapy and Adjuvant Radiation Therapy for Stages I to IIIA Resectable Non-Small-Cell Lung Cancers: American Society of Clinical Oncology/Cancer Care Ontario Clinical Practice Guideline Update Summary. J. Oncol. Pract. 2017, 13, 449–451. [Google Scholar] [CrossRef]
- Liu, Q.; Yu, S.; Zhao, W.; Qin, S.; Chu, Q.; Wu, K. EGFR-TKIs resistance via EGFR-independent signaling pathways. Mol. Cancer 2018, 17, 53. [Google Scholar] [CrossRef] [Green Version]
- Ito, H.; Matsuo, K.; Tanaka, H.; Koestler, D.C.; Ombao, H.; Fulton, J.; Shibata, A.; Fujita, M.; Sugiyama, H.; Soda, M.; et al. Nonfilter and filter cigarette consumption and the incidence of lung cancer by histological type in Japan and the United States: Analysis of 30-year data from population-based cancer registries. Int. J. Cancer. 2011, 128, 1918–1928. [Google Scholar] [CrossRef]
- Klingler-Hoffmann, M.; Mittal, P.; Hoffmann, P. The Emerging Role of Cytoskeletal Proteins as Reliable Biomarkers. Proteomics 2019, 19, e1800483. [Google Scholar] [CrossRef] [Green Version]
- Teixeira, J.C.; de Filippo, C.; Weihmann, A.; Meneu, J.R.; Racimo, F.; Dannemann, M.; Nickel, B.; Fischer, A.; Halbwax, M.; Andre, C.; et al. Long-Term Balancing Selection in LAD1 Maintains a Missense Trans-Species Polymorphism in Humans, Chimpanzees, and Bonobos. Mol. Biol. Evol. 2015, 32, 1186–1196. [Google Scholar] [CrossRef] [Green Version]
- Lancaster, O.M.; Baum, B. Shaping up to divide: Coordinating actin and microtubule cytoskeletal remodelling during mitosis. Semin. Cell Dev. Biol. 2014, 34, 109–115. [Google Scholar] [CrossRef]
- Moon, B.; Yang, S.J.; Park, S.M.; Lee, S.H.; Song, K.S.; Jeong, E.J.; Park, M.; Kim, J.S.; Yeom, Y.I.; Kim, J.A. LAD1 expression is associated with the metastatic potential of colorectal cancer cells. BMC Cancer 2020, 20, 1180. [Google Scholar] [CrossRef]
- Li, J.P.; Wang, Z.M.; Tie, C. High expression of ladinin-1 (LAD1) predicts adverse outcomes: A new candidate docetaxel resistance gene for prostatic cancer (PCa). Bioengineered 2021, 12, 5749–5759. [Google Scholar] [CrossRef]
- Klobucar, M.; Sedic, M.; Gehrig, P.; Grossmann, J.; Bilic, M.; Kovac-Bilic, L.; Pavelic, K.; Kraljevic Pavelic, S. Basement membrane protein ladinin-1 and the MIF-CD44-beta1 integrin signaling axis are implicated in laryngeal cancer metastasis. Biochim. Biophys. Acta. 2016, 1862, 1938–1954. [Google Scholar] [CrossRef]
- Roth, L.; Srivastava, S.; Lindzen, M.; Sas-Chen, A.; Sheffer, M.; Lauriola, M.; Enuka, Y.; Noronha, A.; Mancini, M.; Lavi, S.; et al. SILAC identifies LAD1 as a filamin-binding regulator of actin dynamics in response to EGF and a marker of aggressive breast tumors. Sci. Signal 2018, 11, 515. [Google Scholar] [CrossRef] [Green Version]
- Curtis, C.; Shah, S.P.; Chin, S.F.; Turashvili, G.; Rueda, O.M.; Dunning, M.J.; Speed, D.; Lynch, A.G.; Samarajiwa, S.; Yuan, Y.; et al. The genomic and transcriptomic architecture of 2000 breast tumours reveals novel subgroups. Nature 2012, 486, 346–352. [Google Scholar] [CrossRef]
- Ali, H.R.; Rueda, O.M.; Chin, S.F.; Curtis, C.; Dunning, M.J.; Aparicio, S.A.; Caldas, C. Genome-driven integrated classification of breast cancer validated in over 7500 samples. Genome Biol. 2014, 15, 431. [Google Scholar] [CrossRef]
- Pereira, B.; Chin, S.F.; Rueda, O.M.; Vollan, H.K.; Provenzano, E.; Bardwell, H.A.; Pugh, M.; Jones, L.; Russell, R.; Sammut, S.J.; et al. The somatic mutation profiles of 2433 breast cancers refines their genomic and transcriptomic landscapes. Nat. Commun. 2016, 7, 11479. [Google Scholar] [CrossRef] [Green Version]
- Wang, Y. circ-ANXA7 facilitates lung adenocarcinoma progression via miR-331/LAD1 axis. Cancer Cell Int. 2021, 21, 85. [Google Scholar] [CrossRef] [PubMed]
- Codreanu, S.G.; Hoeksema, M.D.; Slebos, R.J.C.; Zimmerman, L.J.; Rahman, S.M.J.; Li, M.; Chen, S.C.; Chen, H.; Eisenberg, R.; Liebler, D.C.; et al. Identification of Proteomic Features to Distinguish Benign Pulmonary Nodules from Lung Adenocarcinoma. J. Proteome Res. 2017, 16, 3266–3276. [Google Scholar] [CrossRef] [PubMed]
- Motoki, K.; Megahed, M.; LaForgia, S.; Uitto, J. Cloning and chromosomal mapping of mouse ladinin, a novel basement membrane zone component. Genomics 1997, 39, 323–330. [Google Scholar] [CrossRef] [PubMed]
- Singh, A.; Greninger, P.; Rhodes, D.; Koopman, L.; Violette, S.; Bardeesy, N.; Settleman, J. A gene expression signature associated with "K-Ras addiction" reveals regulators of EMT and tumor cell survival. Cancer Cell 2009, 15, 489–500. [Google Scholar] [CrossRef] [Green Version]
- Ponsioen, B.; Post, J.B.; Buissant des Amorie, J.R.; Laskaris, D.; van Ineveld, R.L.; Kersten, S.; Bertotti, A.; Sassi, F.; Sipieter, F.; Cappe, B.; et al. Quantifying single-cell ERK dynamics in colorectal cancer organoids reveals EGFR as an amplifier of oncogenic MAPK pathway signalling. Nat. Cell Biol. 2021, 23, 377–390. [Google Scholar] [CrossRef]
- Fromont-Racine, M.; Rain, J.C.; Legrain, P. Toward a functional analysis of the yeast genome through exhaustive two-hybrid screens. Nat. Genet. 1997, 16, 277–282. [Google Scholar] [CrossRef]
- Benzinger, A.; Muster, N.; Koch, H.B.; Yates, J.R., 3rd; Hermeking, H. Targeted proteomic analysis of 14-3-3 sigma, a p53 effector commonly silenced in cancer. Mol. Cell Proteomics 2005, 4, 785–795. [Google Scholar] [CrossRef] [Green Version]
- Booy, E.P.; Henson, E.S.; Gibson, S.B. Epidermal growth factor regulates Mcl-1 expression through the MAPK-Elk-1 signalling pathway contributing to cell survival in breast cancer. Oncogene 2011, 30, 2367–2378. [Google Scholar] [CrossRef] [Green Version]
- Hynes, N.E.; MacDonald, G. ErbB receptors and signaling pathways in cancer. Curr. Opin. Cell Biol. 2009, 21, 177–184. [Google Scholar] [CrossRef]
- Foulkes, W.D.; Smith, I.E.; Reis-Filho, J.S. Triple-negative breast cancer. N. Engl. J. Med. 2010, 363, 1938–1948. [Google Scholar] [CrossRef] [Green Version]
- Mendelsohn, J.; Baselga, J. The EGF receptor family as targets for cancer therapy. Oncogene 2000, 19, 6550–6565. [Google Scholar] [CrossRef] [Green Version]
- Lai, G.G.Y.; Lim, T.H.; Lim, J.; Liew, P.J.R.; Kwang, X.L.; Nahar, R.; Aung, Z.W.; Takano, A.; Lee, Y.Y.; Lau, D.P.X.; et al. Clonal MET Amplification as a Determinant of Tyrosine Kinase Inhibitor Resistance in Epidermal Growth Factor Receptor-Mutant Non-Small-Cell Lung Cancer. J. Clin. Oncol. 2019, 37, 876–884. [Google Scholar] [CrossRef]
- Bronte, G.; Bravaccini, S.; Bronte, E.; Burgio, M.A.; Rolfo, C.; Delmonte, A.; Crino, L. Epithelial-to-mesenchymal transition in the context of epidermal growth factor receptor inhibition in non-small-cell lung cancer. Biol. Rev. Camb. Philos. Soc. 2018, 93, 1735–1746. [Google Scholar] [CrossRef]
- Linardou, H.; Dahabreh, I.J.; Kanaloupiti, D.; Siannis, F.; Bafaloukos, D.; Kosmidis, P.; Papadimitriou, C.A.; Murray, S. Assessment of somatic k-RAS mutations as a mechanism associated with resistance to EGFR-targeted agents: A systematic review and meta-analysis of studies in advanced non-small-cell lung cancer and metastatic colorectal cancer. Lancet Oncol. 2008, 9, 962–972. [Google Scholar] [CrossRef]
- Singal, G.; Miller, P.G.; Agarwala, V.; Li, G.; Kaushik, G.; Backenroth, D.; Gossai, A.; Frampton, G.M.; Torres, A.Z.; Lehnert, E.M.; et al. Association of Patient Characteristics and Tumor Genomics with Clinical Outcomes Among Patients with Non-Small Cell Lung Cancer Using a Clinicogenomic Database. JAMA 2019, 321, 1391–1399. [Google Scholar] [CrossRef] [Green Version]
- Goldman, M.J.; Craft, B.; Hastie, M.; Repecka, K.; McDade, F.; Kamath, A.; Banerjee, A.; Luo, Y.; Rogers, D.; Brooks, A.N.; et al. Visualizing and interpreting cancer genomics data via the Xena platform. Nat. Biotechnol. 2020, 38, 675–678. [Google Scholar] [CrossRef]
- Gyorffy, B.; Surowiak, P.; Budczies, J.; Lanczky, A. Online survival analysis software to assess the prognostic value of biomarkers using transcriptomic data in non-small-cell lung cancer. PLoS ONE 2013, 8, e82241. [Google Scholar] [CrossRef] [Green Version]
- Chen, F.; Chandrashekar, D.S.; Varambally, S.; Creighton, C.J. Pan-cancer molecular subtypes revealed by mass-spectrometry-based proteomic characterization of more than 500 human cancers. Nat. Commun. 2019, 10, 5679. [Google Scholar] [CrossRef] [Green Version]
- Liu, C.J.; Hu, F.F.; Xia, M.X.; Han, L.; Zhang, Q.; Guo, A.Y. GSCALite: A web server for gene set cancer analysis. Bioinformatics 2018, 34, 3771–3772. [Google Scholar] [CrossRef]
- Bindea, G.; Mlecnik, B.; Tosolini, M.; Kirilovsky, A.; Waldner, M.; Obenauf, A.C.; Angell, H.; Fredriksen, T.; Lafontaine, L.; Berger, A.; et al. Spatiotemporal Dynamics of Intratumoral Immune Cells Reveal the Immune Landscape in Human Cancer. Immunity 2013, 39, 782–795. [Google Scholar] [CrossRef] [Green Version]


Disclaimer/Publisher’s Note: The statements, opinions and data contained in all publications are solely those of the individual author(s) and contributor(s) and not of MDPI and/or the editor(s). MDPI and/or the editor(s) disclaim responsibility for any injury to people or property resulting from any ideas, methods, instructions or products referred to in the content. |
© 2023 by the authors. Licensee MDPI, Basel, Switzerland. This article is an open access article distributed under the terms and conditions of the Creative Commons Attribution (CC BY) license (https://creativecommons.org/licenses/by/4.0/).
Share and Cite
Hu, L.; Liu, Y.; Fu, C.; Zhao, J.; Cui, Q.; Sun, Q.; Wang, H.; Lu, L.; Dai, H.; Xu, X.; et al. The Tumorigenic Effect of the High Expression of Ladinin-1 in Lung Adenocarcinoma and Its Potential as a Therapeutic Target. Molecules 2023, 28, 1103. https://doi.org/10.3390/molecules28031103
Hu L, Liu Y, Fu C, Zhao J, Cui Q, Sun Q, Wang H, Lu L, Dai H, Xu X, et al. The Tumorigenic Effect of the High Expression of Ladinin-1 in Lung Adenocarcinoma and Its Potential as a Therapeutic Target. Molecules. 2023; 28(3):1103. https://doi.org/10.3390/molecules28031103
Chicago/Turabian StyleHu, Lei, Yu Liu, Changfang Fu, Jiarong Zhao, Qianwen Cui, Qiuyan Sun, Hongqiang Wang, Li Lu, Haiming Dai, Xiaohui Xu, and et al. 2023. "The Tumorigenic Effect of the High Expression of Ladinin-1 in Lung Adenocarcinoma and Its Potential as a Therapeutic Target" Molecules 28, no. 3: 1103. https://doi.org/10.3390/molecules28031103