
Pharmacokinetic Comparison of Eight Major Compounds of Lonicerae japonicae flos after Oral Administration in Normal Rats and Rats with Liver Injury
 , , and
Abstract
: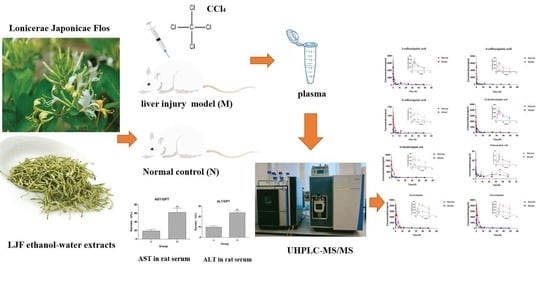
1. Introduction
2. Results
2.1. Optimization of Chromatographic Conditions
2.2. Optimization of Sample Preparation
2.3. Results of Rat Model of Liver Injury
2.4. Methodological Verification
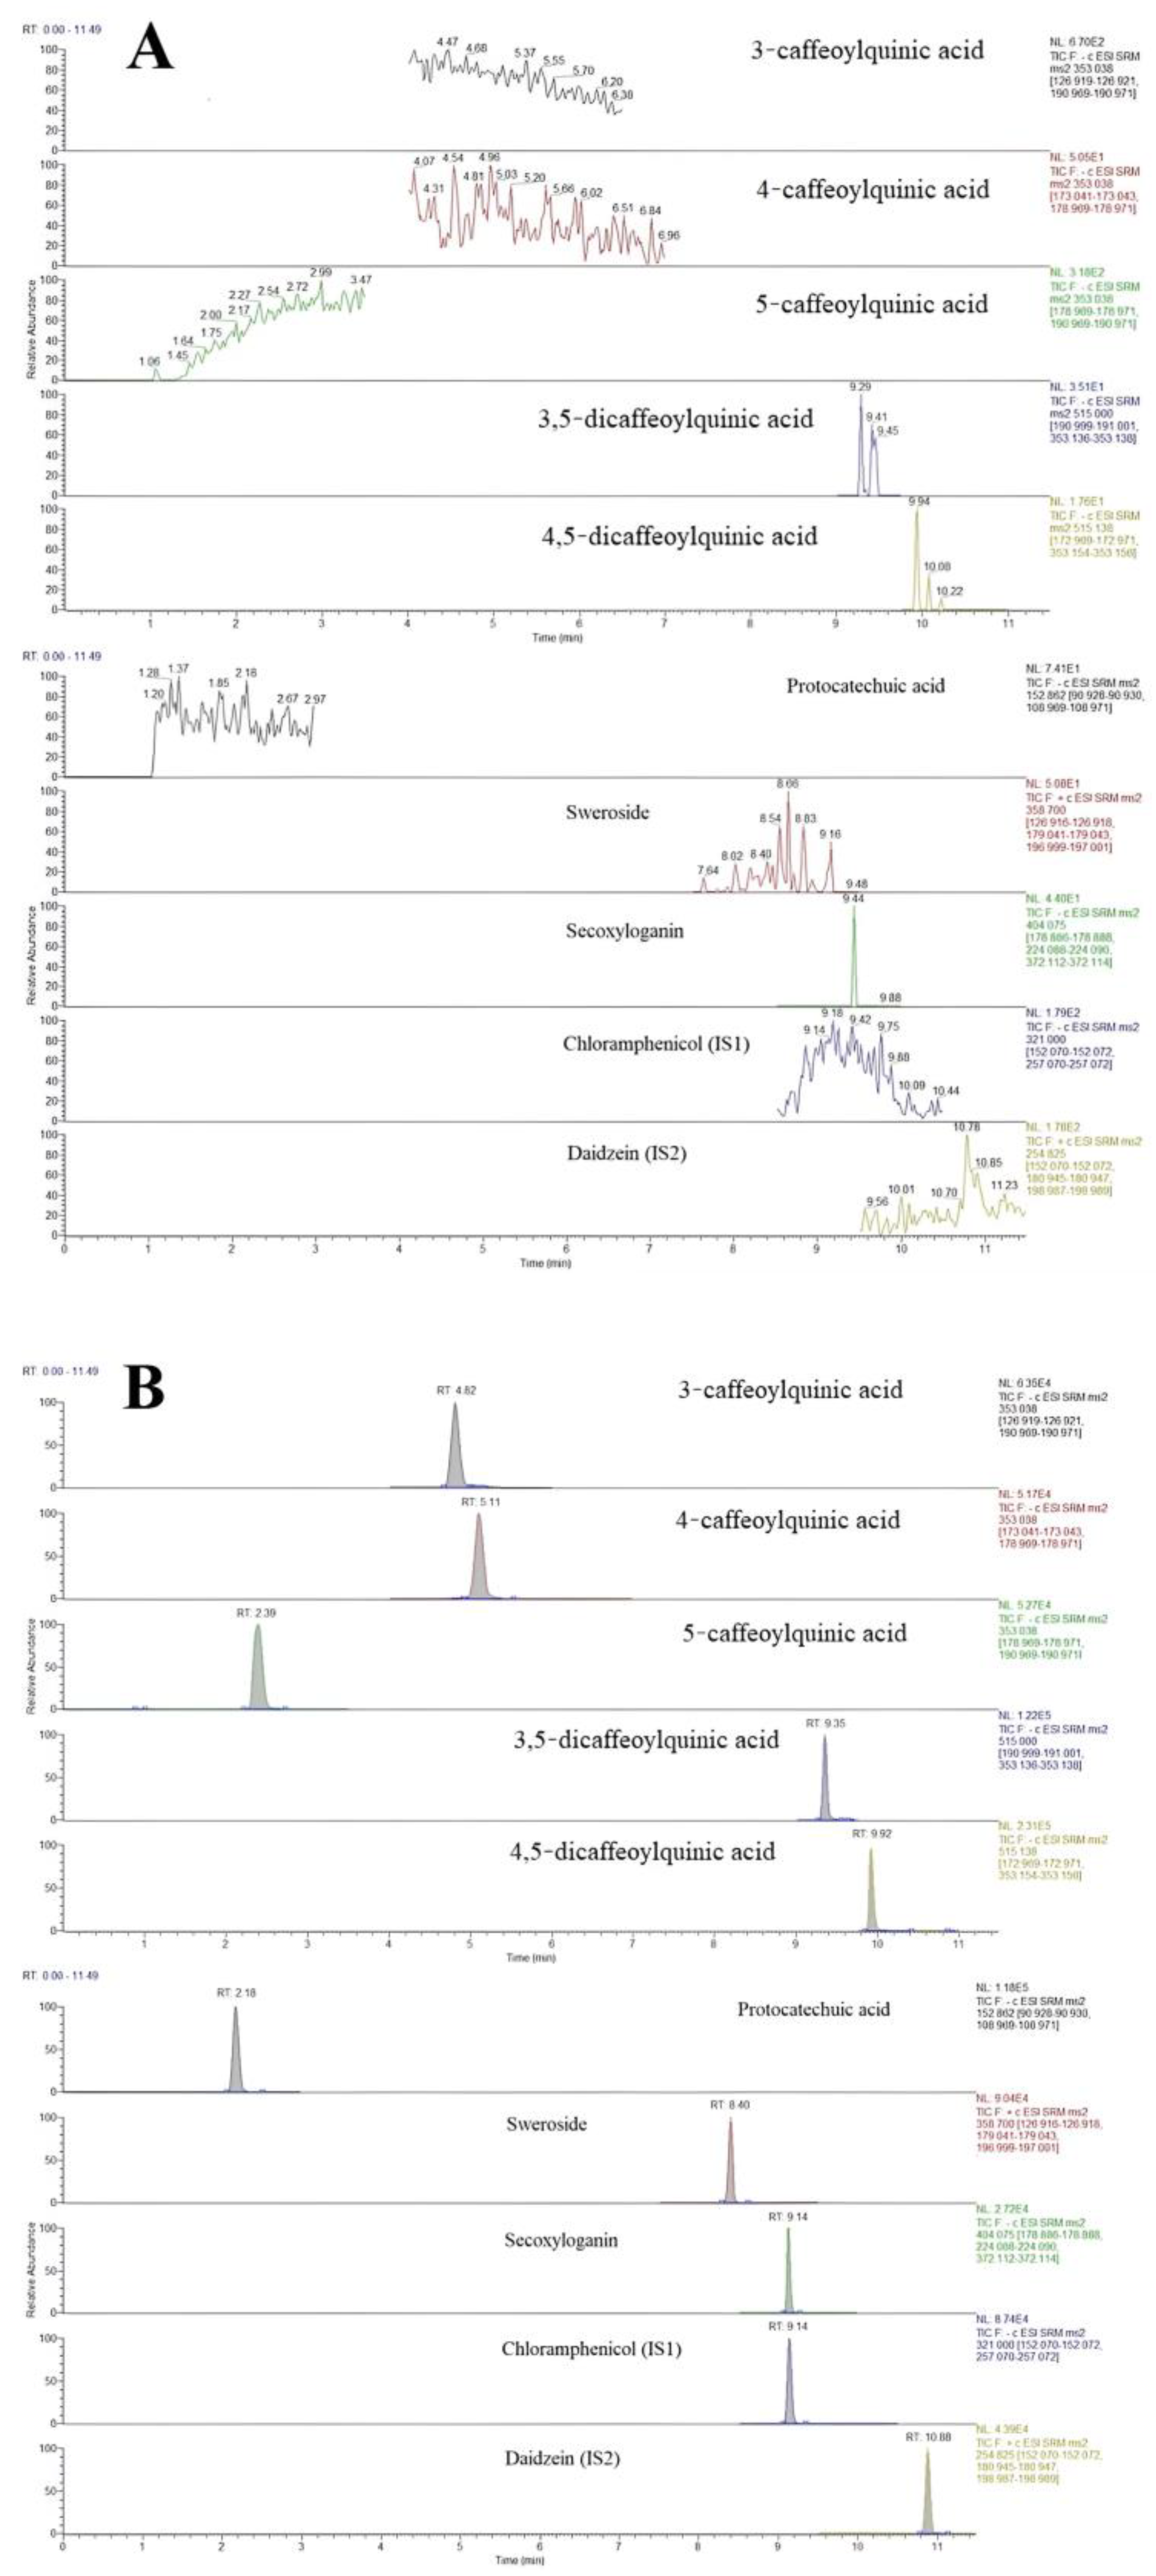
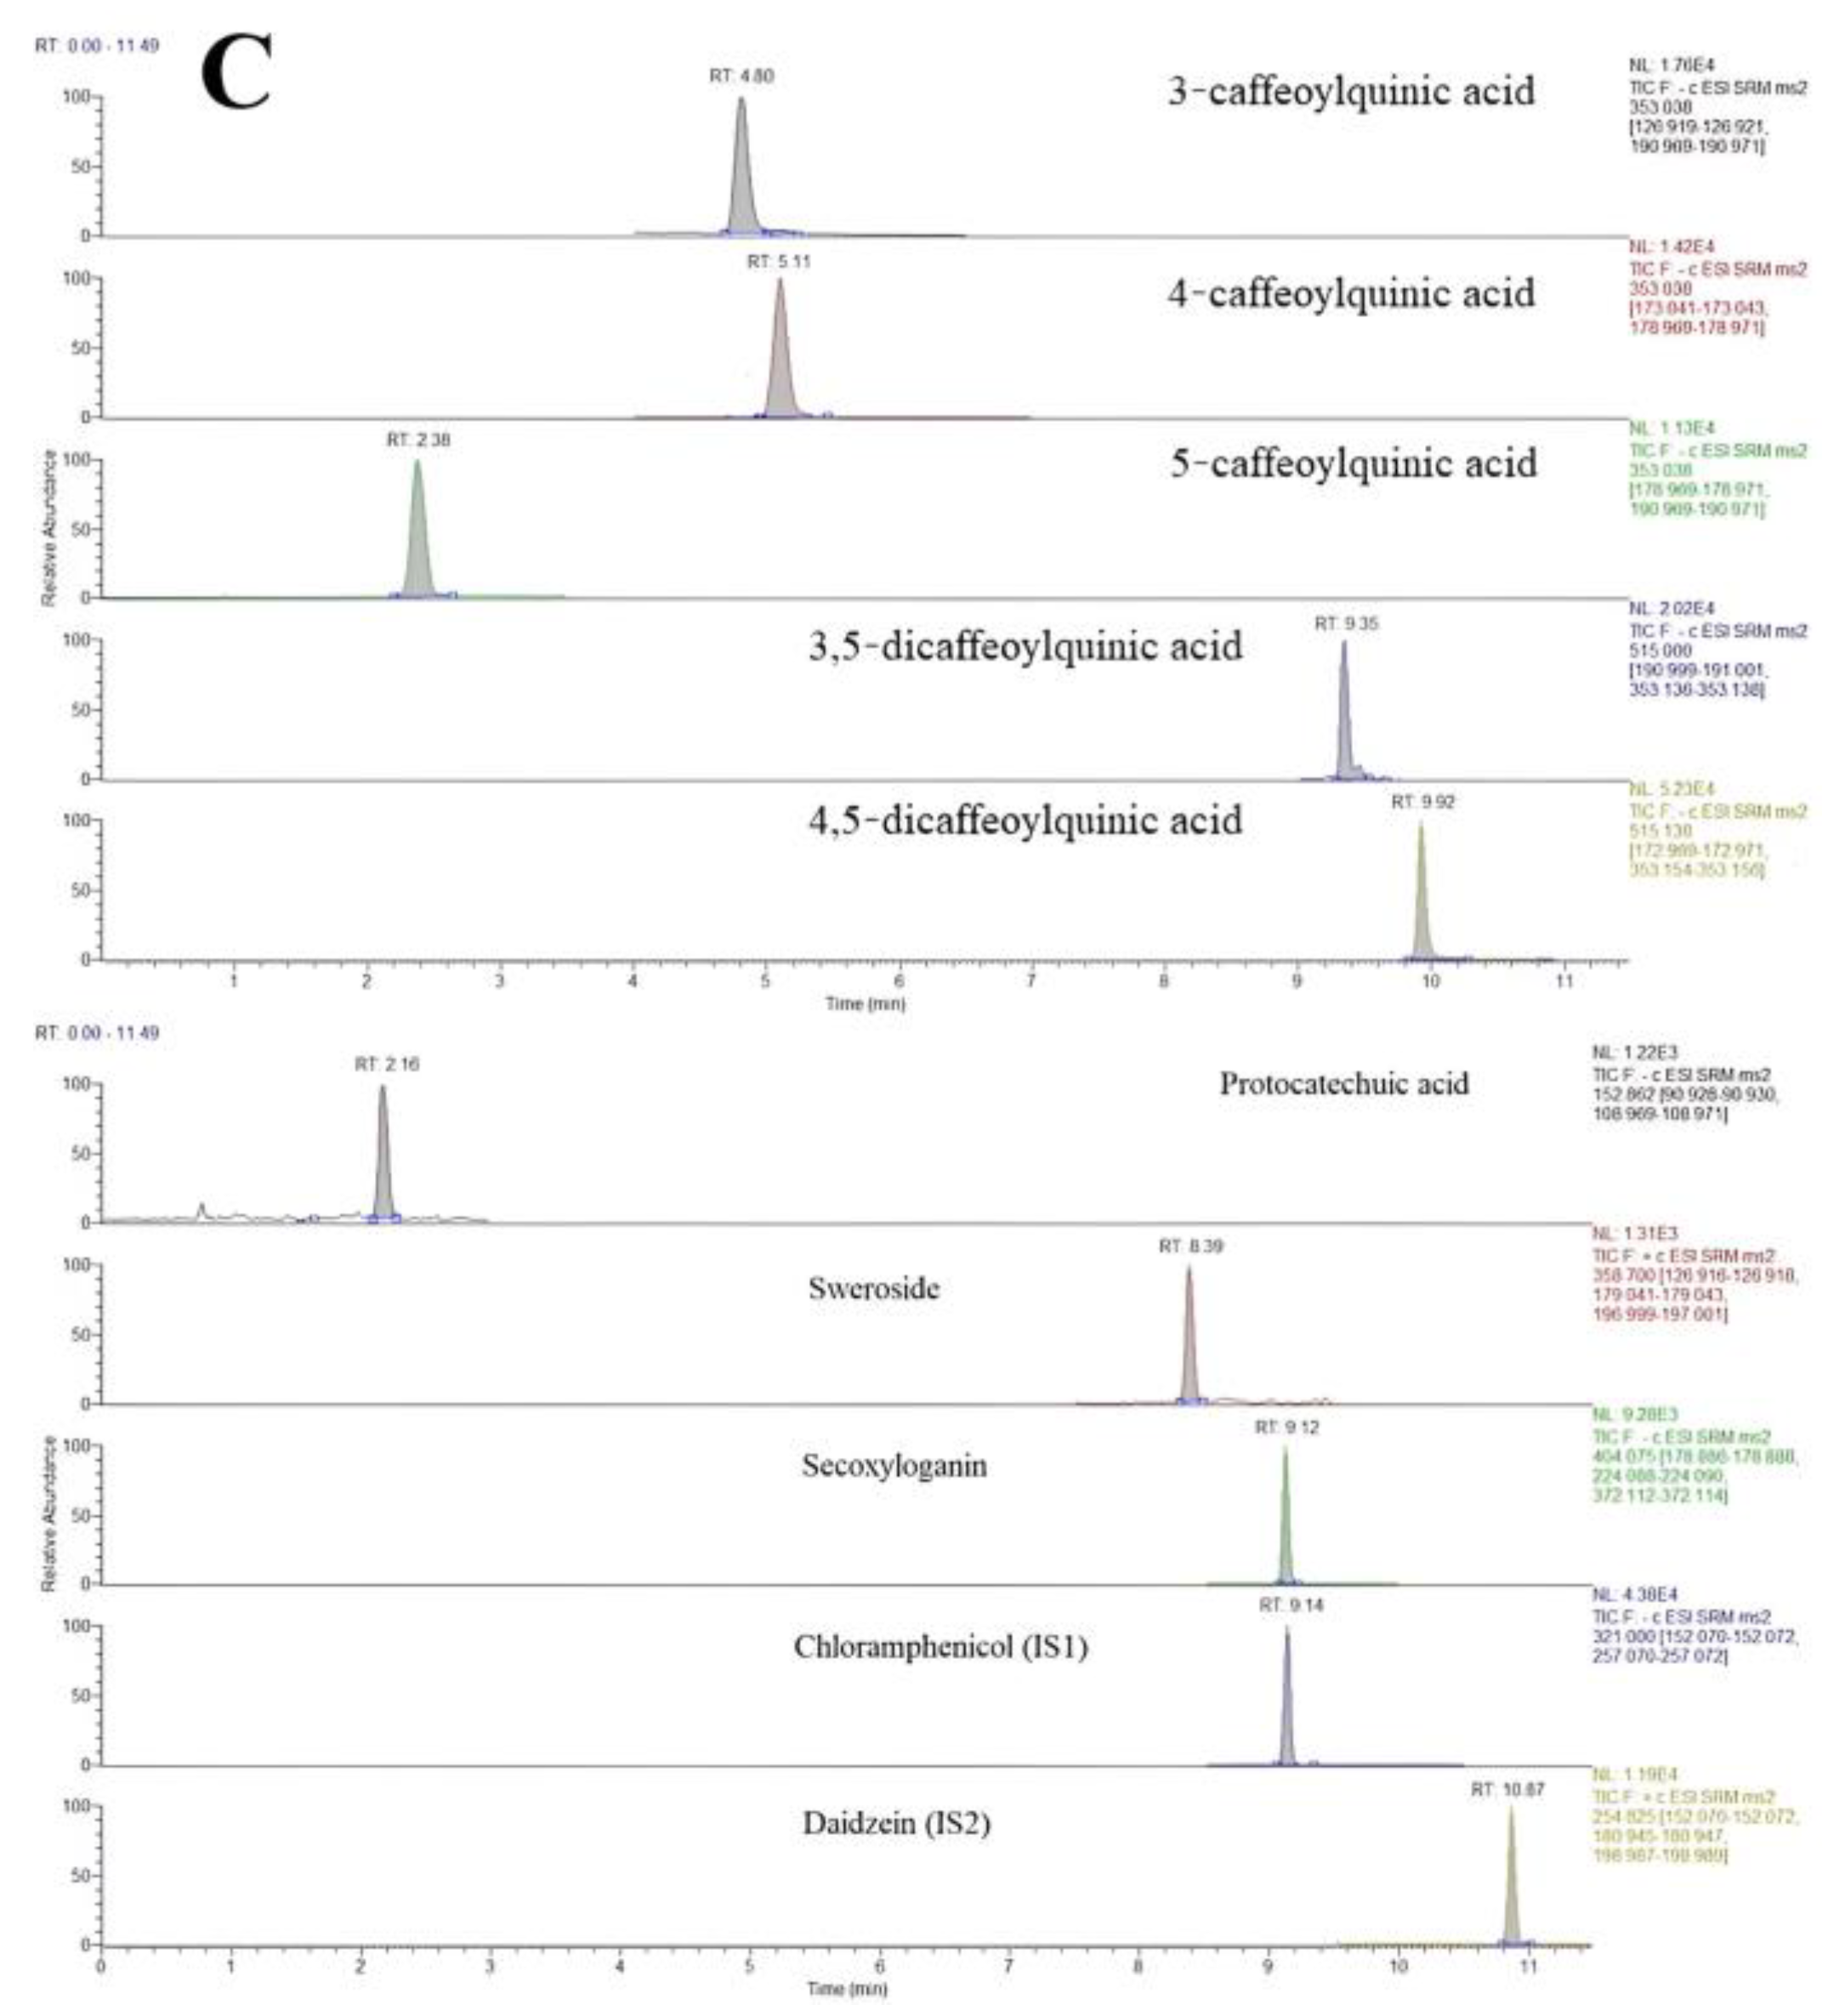
2.4.1. Specificity
2.4.2. Linearity and Lower LLOQ
2.4.3. Accuracy and Precision
2.4.4. Recovery and Matrix Effect
2.4.5. Stability
2.5. Application in a Pharmacokinetic Study in Rats
2.5.1. The Pharmacokinetic Characteristics of Phenolic Acids
2.5.2. Pharmacokinetic Characteristics of Iridoid Glycosides
3. Discussion
4. Materials and Methods
4.1. Plants, Chemicals, and Reagents
4.2. Instrumentation
4.2.1. Chromatographic Conditions
4.2.2. MS Conditions
4.3. Experiments on Animals
4.4. Pharmacokinetic Studies
4.5. Correction Curves and Quality Control Samples Were Prepared
4.6. Sample Preparation
4.7. Data Analysis
4.8. Method Validation
4.8.1. Specificity
4.8.2. Linearity and Lower Limits of Quantification
4.8.3. Accuracy and Precision
4.8.4. Recovery and Matrix Effect
4.8.5. Stability
5. Conclusions
Author Contributions
Funding
Institutional Review Board Statement
Informed Consent Statement
Data Availability Statement
Conflicts of Interest
References
- Liu, T.L.; Dong, C.M.; Gao, Q.G.; Zhang, J.S.; Qi, D.M.; Xu, X.L.; Li, J.H. Brief discussion on textual research ideas of ancient books and textual collection of predecessors:A case study of Lonicera japonica. Chin. Tradit. Herb. Drugs 2021, 52, 15. [Google Scholar]
- Wang, Y.D.; Yang, J.B.; Zhong, Z.; Ma, S.C. Research progress on Lonicerae japonicae flos. Chin. J. Pharm. Anal. 2014, 16, 1928–1935. [Google Scholar]
- Liu, S.T.; Yang, L.; Wang, S.; Wang, X.J.; Zhang, J.X.; Hou, A.J.; Jiang, H. Study on Chemical Components of Honeysuckle. Inf. Tradit. Chin. Med. 2020, 37, 18–21. [Google Scholar]
- Ehrman, T.M.; Barlow, D.J.; Hylands, P.J. In silico search for multi-target anti-inflammatories in Chinese herbs and formulas. Bioorganic Med. Chem. 2010, 18, 2204–2218. [Google Scholar] [CrossRef]
- Lou, H.X.; Lang, W.J.; Lv, M.J. Separation and structure determination of water-soluble chemical compounds in Lonicerae japonicae flos. Chin. Tradit. Herb. Drugs 1996, 27, 195–199. [Google Scholar]
- Zhang, R.; Wang, T.T.; Su, P.W.; Li, M.M.; Huang, P.; Li, H.G. Study on Quality Standard of Organic Acid Effective Part of Honeysuckle. Asia-Pac. Tradit. Med. 2020, 16, 76–80. [Google Scholar]
- Huang, L.J. Study on Synthesis of Bisantins Analogues from Lonicerae japonicae flos; Peking Union Medical College of China: Beijing, China, 2006. [Google Scholar]
- Chen, X.Y.; Qin, S.S.; Li, C.; Wu, Q.H.; Jiang, C.; Yang, J.; Guo, X.Y.; Ou, C.L. Differential Gene Expressions and Phytohormone Changes Altered Lonicera japonica Quality after Plant Introduction. World J. Tradit. Chin. Med. 2019, 60, 18–23. [Google Scholar] [CrossRef]
- Zhang, M.; Ma, X.Y.; Xu, H.L.; Wu, W.B.; He, X.; Wang, X.Y.; Jiang, M.; Hou, Y.Y.; Bai, G. A natural AKT inhibitor swertiamarin targets AKT-PH domain, inhibits downstream signaling, and alleviates inflammation. FEBS J. 2020, 287, 1816–1829. [Google Scholar] [CrossRef]
- Rahman, A.; Kang, S.C. In vitro control of food-borne and food spoilage bacteria by essential oil and ethanol extracts of Lonicera japonica Thunb. Food Chem. 2009, 116, 670–675. [Google Scholar] [CrossRef]
- Li, J.; Ma, X.B.; Shen, J.; Zhang, Z.F. Screening of active components from Chinese materia medica against SARS-CoV-2 based on literature mining and molecular docking. Chin. Tradit. Herb. Drugs 2020, 51, 845–850. [Google Scholar]
- Liu, J.; Yan, B.F.; Zeng, M.Y.; Zeng, Q.Q.; Yang, H.J.; Zhang, J.Z. Potential Mechanism of Couplet Medicines Baical Skullcap Root Honeysuckle for Coronavirus Disease 2019 Based on Network Pharmacology. World Chin. Med. 2020, 15, 502–511. [Google Scholar]
- Fu, M.R.; Qu, Q.L.; Dai, H.F. Variation in antioxidant properties and metabolites during flower maturation of Flos Lonicerae Japonicae flowers. Eur. Food Res. Technol. 2015, 240, 735–741. [Google Scholar] [CrossRef]
- Yin, H.M.; Lv, X.Y. Study on preparation technology optimization and immune activity of Polysaccharide from Flos Lonicerae Japonicae flowers. China J. Chin. Mater. Med. 2010, 35, 453–455. [Google Scholar]
- Miao, H.; Zhang, Y.; Huang, Z.L.; Lu, B.; Ji, L.L. Lonicera japonica Attenuates Carbon Tetrachloride-Induced Liver Fibrosis in Mice: Molecular Mechanisms of Action. Am. J. Chin. Med. 2019, 42, 351–367. [Google Scholar] [CrossRef] [PubMed]
- Xu, K.F.; Deng, L.H.; Mao, Z.H.; Zhang, X.R. Jinyinghua Oral Liquid in Combination with Interferon Spray for Treatment of Hand Foot and Mouth Disease in 40 Children with Pathogens Invading Lung-Spleen Pattern. J. Tradit. Chin. Med. 2021, 62, 687–690. [Google Scholar]
- Wang, S.; Yang, L.; Hou, A.J.; Liu, S.T.; Yang, L.; Jiang, H.; Kuang, H.X. Screening hepatoprotective effective components of Lonicerae japonica Flos based on the spectrum-effect relationship and its mechanism exploring. Food Sci. Hum. Wellness 2022, 12, 283–294. [Google Scholar] [CrossRef]
- Qiao, Y.R.; Wang, Z.H.; Wang, Y.F. Effect of pneumonia No.3 combined with honeysuckle granules on lung function, serum inflammatory factors and immune function in children with pneumonia. J. Guangxi Med. Univ. 2021, 38, 132–137. [Google Scholar]
- Zhang, H.T.; Chen, J.L.; Zhu, X.Y.; Zeng, H.L.; Li, J.; Sun, X.B.; Qi, X.Y.; Zeng, J.C.; Zeng, Y.R. Effect and molecular mechanism of Honeysuckle-Rhizoma coptidis in the treatment of periprosthetic joint infection based on molecular docking and network pharmacology. Chin. J. Tissue Eng. Res. 2021, 25, 3360–3367. [Google Scholar]
- Fung, J.; Lai, C.L.; Yuen, M.F. Hepatitis B virus DNA and hepatitis B surface antigen levels in chronic hepatitis B. Expert Rev. Anti-Infect. Ther. 2010, 8, 717–726. [Google Scholar] [CrossRef]
- Asrani, S.K.; Devarbhavi, H.; Eaton, J.; Kamath, P.S. Burden of liver diseases in the world. J. Hepatol. 2019, 70, 151–171. [Google Scholar] [CrossRef]
- Zhang, J.X.; Li, N.; Xu, Q.Y.; Yang, Y.; Xie, H.B.; Shen, T.; Zhu, Q.X. Kupffer cell depletion attenuates IL-6/STAT3 mediates hepatocyte apoptosis in immunological liver injury of trichloroethylene sensitized mice. Int. Immunopharmacol. 2020, 88, 106897. [Google Scholar] [CrossRef] [PubMed]
- Reuben, A.; Koch, D.G.; Lee, W.M. Drug-induced acute liver failure: Results of a u.s. multicenter, prospective study. Hepatol. Off. J. Am. 2010, 52, 2065–2076. [Google Scholar] [CrossRef] [PubMed] [Green Version]
- El-Kamary, S.S.; Shardell, M.D.; Abdel-Hamid, M.; Ismail, S.; El-Ateek, M. A randomized controlled trial to assess the safety and efficacy of silymarin on symptoms, signs and biomarkers of acute hepatitis. J. Phytomed. 2009, 16, 391–400. [Google Scholar] [CrossRef] [PubMed] [Green Version]
- Liang, L.; Bi, Q.; Dong, J.C.; Yang, X.X.; Yu, J. Progress in the development of natural drugs with liver protection. Biot. Resour. 2018, 02, 59–69. [Google Scholar]
- Hu, C.M.; Jiang, H.; Liu, H.F.; Li, R.; Li, J. Protective effect of Lonicera japonica total flavone (LTF)on immunological liver injury in mice. Pharmacol. Clin. Chin. Mater. Med. 2007, 23, 35. [Google Scholar]
- Chen, H.L. Effects of Flos Lonicerae Japonicae on acute liver injury induced by carbon tetrachloride in mice. Chin. J. Gerontol. 2011, 31, 3086–3087. [Google Scholar]
- Wang, D.S. Protective effect of extracts from Flos Lonicerae Japonicae on liver injury mice. Her. Med. 2011, 30, 1010–1012. [Google Scholar]
- Zhou, Y.L.; Zeng, R.; Pei, Q.; Liu, S.K. Pharmacokinetics and bioavailability of chlorogenic acid extracted from Jinyinhua in rats. Chin. J. Hosp. Pharm. 2016, 36, 164–167. [Google Scholar]
- Kanhar, S.; Sahoo, A.K. Meliorative effect of Homalium zeylanicum against carbon tetrachloride-induced oxidative stress and liver injury in rats. Biomed. Pharmacother. 2019, 111, 305–314. [Google Scholar] [CrossRef]
- Yang, C.C.; Fang, J.Y.; Hong, T.L.; Wang, T.C.; Zhou, Y.E.; Lin, T.C. Potential antioxidant properties and hepatoprotective effects of an aqueous extract formula derived from three Chinese medicinal herbs against CCl (4)-induced liver injury in rats. Int. Immunopharmacol. 2013, 15, 106–113. [Google Scholar] [CrossRef]
- Lee, K.J.; Choi, J.H.; Jeong, H.G. Hepatoprotective and antioxidant effects of the coffee diterpenes kahweol and cafestol on carbon tetrachloride-induced liver damage in mice. Food Chem. Toxicol. 2007, 45, 2118–2125. [Google Scholar] [CrossRef] [PubMed]
- Zhu, A.N.; Li, R.; Liu, S.H.; Qiao, Y.X.; Shi, S.; Yuan, S.X.; Zhang, J.P. Establishment of carbon tetrachloride-induced acute liver injury murine model. Chin. J. Liver Dis. (Electron. Version) 2014, 6, 27–31. [Google Scholar]
- Zhi, Y.; Song, Y.N.; Zhang, M.; Wang, J.N.; Zhao, B. Pharmacological effects on carbon tetrachloride induced acute liver injury in mice. Chin. Arch. Tradit. Chin. Med. 2022, 40, 107–109. [Google Scholar]
- Xie, Y.; Hao, H.; An, K.; Yan, L.; Xie, T.; Sun, S.; Dai, C.; Zheng, X.; Lin, X.; Li, J. Integral pharmacokinetics of multiple lignan components in normal, CCl4-induced hepatic injury and hepatoprotective agents pretreated rats and correlations with hepatic injury biomarkers. J. Ethnopharmacol. 2010, 131, 290–299. [Google Scholar] [CrossRef] [PubMed]
- Li, P.; Lu, Q.; Jiang, W.; Xue, P.; Hao, K. Pharmacokinetics and pharmacodynamics of rhubarb anthraquinones extract in normal and disease rats. Biomed. Pharmacother. 2017, 91, 425–435. [Google Scholar] [CrossRef] [PubMed]
- Du, G.F.; Dong, J.K.; Zhang, T.; Yang, X.R.; Lu, S.S.; Qu, J.H.; Lu, Y.Y.; Hong, Z.X. Correlation between Fyn and bile acid metabolism in liver fibrosis mice. Infect. Dis. Inf. 2018, 31, 326–330. [Google Scholar]
- Li, L.; Wang, Y.L.; Qing, H.Y.; Qu, Y.Y.; Yang, T.S.; Wang, Z.Y.; Xie, J.R. Research progress on berberine in treatment of nonalcoholic disease by regulation gut-liver axis. Chin. Tradit. Herb. Drugs 2021, 52, 1501–1509. [Google Scholar]
- Li, Y.T.; Wang, L.; Chen, Y.; Chen, Y.B.; Wang, H.Y.; Wu, Z.W.; Li, L.J. Effects of Gut Microflora on Hepatic Damage After Acute Liver Injury in Rats. J. Trauma 2010, 68, 76–83. [Google Scholar] [CrossRef] [PubMed]
- Wang, M.L.; Ding, Y.F.; Yin, X.; Shao, J.Z.; Zhuang, Z.R.; Zhang, T.; Su, P.L.; Peng, Y.R. Progress in understanding hepatic fibrosis and renal fibrosis based on the gut-liver-kidney axis. Acta Pharm. Sin. 2021, 56, 9–20. [Google Scholar]


| Compounds | Retention Time (min) | Polarity | Precursor–Product Ion Transition | Collision Energy (Volts) |
|---|---|---|---|---|
| 3-CQA | 4.80 | [M − H]− | m/z 353.038 → m/z 126.920; m/z 190.970 | 34.30; 16.75 |
| 4-CQA | 5.11 | [M − H]− | m/z 353.038 → m/z 173.042; m/z 178.970 | 15.65; 16.26 |
| 5-CQA | 2.38 | [M − H]− | m/z 353.038 → m/z 178.970; m/z 190.970 | 18.23; 18.87 |
| 3,5-diCQA | 9.35 | [M − H]− | m/z 515.000 → m/z 191.000; m/z 353.137 | 30.02; 15.31 |
| 4,5-diCQA | 9.92 | [M − H]− | m/z 515.138 → m/z 172.970; m/z 353.155 | 28.35; 17.92 |
| PA | 2.16 | [M − H]− | m/z 152.862 → m/z 90.929; m/z 108.97 | 24.97; 14.36 |
| Sweroside | 8.39 | [M + H]+ | m/z 358.700 → m/z 126.971; m/z 179.042; m/z 197.000 | 24.52; 18.98; 10.23 |
| Secoxyloganin | 9.12 | [M − H]− | m/z 404.075 → m/z 178.887; m/z 224.089; m/z 372.013 | 10.53; 15.50; 13.72 |
| Chloramphenicol (IS1) | 9.14 | [M − H]− | m/z 321.000 → m/z 152.071; m/z 257.071 | 16.22; 10.23 |
| Daidzein (IS2) | 10.87 | [M + H]+ | m/z 254.825 → m/z 152.071; m/z 180.946 m/z 198.988 | 42.38; 31.87; 26.00 |
| Analytes | Calibration Curves | r | Range (ng/mL) | LLOQ (ng/mL) |
|---|---|---|---|---|
| 3-CQA | y = 0.0007x + 0.0019 | 0.996 | 25–13,500 | 25 |
| 4–CQA | y = 0.002x − 0.001 | 0.996 | 7–3500 | 7 |
| 5-CQA | y = 0.005x − 0.012 | 0.998 | 2.5–2100 | 2.5 |
| 3,5-diCQA | y = 0.002x − 0.004 | 0.994 | 30–5000 | 30 |
| 4,5-diCQA | y = 0.010x + 0.061 | 0.998 | 7.5–2500 | 7.5 |
| PA | y = 0.002x + 0.001 | 0.995 | 3–300 | 3 |
| Sweroside | y = 0.0004x − 0.007 | 0.990 | 15–6000 | 15 |
| Secoxyloganin | y = 0.001x − 0.001 | 0.993 | 25–4500 | 25 |
| Analytes | Nominal Concentration (ng/mL) | Inter-Day | Intra-Day | ||
|---|---|---|---|---|---|
| Precision | Accuracy | Precision | Accuracy | ||
| (RSD, %) | (Re, %) | (RSD, %) | (Re, %) | ||
| 3-CQA | 25 | 6.27 | 13.14 | 4.84 | 8.08 |
| 65 | 2.89 | −2.68 | 6.37 | −1.57 | |
| 5000 | 7.88 | −0.72 | 11.39 | −7.01 | |
| 13,500 | 0.06 | −5.95 | 0.09 | −8.03 | |
| 4-CQA | 7 | 6.70 | −9.41 | 7.48 | −10.34 |
| 27 | 9.37 | 9.94 | 12.41 | 13.77 | |
| 2000 | 5.05 | −6.74 | 2.33 | −6.65 | |
| 3500 | 3.19 | −4.76 | 1.71 | 2.04 | |
| 5-CQA | 2.5 | 6.09 | −11.42 | 4.02 | −13.10 |
| 9 | 10.62 | 0.94 | 9.61 | −12.21 | |
| 800 | 2.52 | −3.09 | 1.84 | −4.70 | |
| 2100 | 12.52 | 10.06 | 3.40 | 4.24 | |
| 3,5-diCQA | 30 | 3.36 | −3.21 | 4.10 | −6.81 |
| 50 | 8.54 | 0.02 | 3.99 | −1.87 | |
| 3000 | 7.36 | 1.97 | 4.33 | 7.28 | |
| 5000 | 1.62 | 0.78 | 5.52 | −4.93 | |
| 4,5-diCQA | 7.5 | 3.49 | −8.61 | 3.61 | −10.23 |
| 15 | 15.63 | −3.74 | 17.39 | −9.18 | |
| 1300 | 3.59 | −6.22 | 2.53 | −3.15 | |
| 2500 | 3.95 | −12.60 | 7.95 | −13.20 | |
| PA | 3 | 9.13 | 19.84 | 5.33 | −4.32 |
| 5 | 12.09 | −14.34 | 11.01 | −1.64 | |
| 180 | 9.03 | −14.67 | 14.19 | −12.14 | |
| 300 | 2.41 | −7.23 | 5.55 | −3.43 | |
| Sweroside | 15 | 8.81 | −9.13 | 11.03 | −10.72 |
| 40 | 7.34 | −14.33 | 7.53 | −12.61 | |
| 3600 | 8.78 | −10.17 | 7.50 | −10.34 | |
| 6000 | 6.92 | −1.09 | 7.86 | −0.49 | |
| Secoxyloganin | 25 | 8.34 | −15.87 | 6.87 | −16.05 |
| 40 | 16.10 | −13.19 | 13.15 | −9.19 | |
| 2600 | 1.17 | −1.65 | 1.59 | −6.61 | |
| 4500 | 2.59 | −14.52 | 1.53 | −12.58 | |
| Analytes | Spiked Concentration (ng/mL) | Recovery (%, n = 6) | Matrix Effect (%, n = 6) | ||
|---|---|---|---|---|---|
| Mean ± SD | RSD% | Mean ± SD | RSD% | ||
| 3-CQA | 65 | 91.28 ± 2.91 | 3.75 | 95.48 ± 4.17 | 9.38 |
| 5000 | 86.34 ± 0.21 | 7.19 | 92.93 ± 3.85 | 4.14 | |
| 13,500 | 88.81 ± 6.45 | 7.26 | 96.36 ± 1.96 | 2.04 | |
| 4-CQA | 27 | 113.46 ± 11.09 | 9.78 | 93.29 ± 4.37 | 4.69 |
| 2000 | 100.31 ± 5.07 | 5.05 | 90.68 ± 3.48 | 3.84 | |
| 3500 | 95.72 ± 6.94 | 7.25 | 92.96 ± 2.36 | 2.54 | |
| 5-CQA | 9 | 104.04 ± 10.92 | 1.05 | 85.74 ± 3.22 | 3.7 |
| 800 | 102.16 ± 3.07 | 0.03 | 98.87 ± 3.09 | 3.13 | |
| 2100 | 108.59 ± 12.32 | 11.35 | 98.20 ± 4.79 | 4.88 | |
| 3,5-diCQA | 50 | 109.03 ± 12.74 | 11.68 | 90.48 ± 6.54 | 7.23 |
| 3000 | 95.63 ± 12.76 | 13.35 | 92.22 ± 4.88 | 5.30 | |
| 5000 | 98.62 ± 5.61 | 5.69 | 87.25 ± 7.64 | 8.75 | |
| 4,5-diCQA | 15 | 97.48 ± 18.82 | 13.38 | 94.69 ± 4.27 | 4.51 |
| 1300 | 101.57 ± 13.59 | 4.23 | 96.26 ± 2.56 | 2.66 | |
| 2500 | 85.56 ± 1.88 | 2.20 | 98.55 ± 2.22 | 2.25 | |
| PA | 5 | 90.22 ± 7.99 | 8.85 | 90.88 ± 4.31 | 4.74 |
| 180 | 89.21 ± 5.98 | 6.70 | 95.00 ± 5.02 | 5.29 | |
| 300 | 98.56 ± 4.85 | 4.92 | 92.31 ± 2.96 | 3.21 | |
| Sweroside | 40 | 98.31 ± 11.33 | 11.52 | 90.30 ± 4.85 | 5.37 |
| 3600 | 88.49 ± 6.69 | 7.56 | 100.61 ± 4.75 | 4.72 | |
| 4500 | 91.20 ± 7.35 | 8.06 | 96.39 ± 2.99 | 3.10 | |
| Secoxyloganin | 40 | 96.68 ± 12.60 | 13.04 | 92.32 ± 5.63 | 6.10 |
| 2600 | 99.37 ± 4.57 | 4.60 | 98.01 ± 2.88 | 2.94 | |
| 4500 | 98.05 ± 2.54 | 2.59 | 98.01 ± 12.31 | 12.56 | |
| Chloramphenicol (IS1) | 500 | 94.95 ± 0.01 | 1.95 | 84.69 ± 0.34 | 4.11 |
| Daidzein (IS2) | 500 | 100.07 ± 0.10 | 9.49 | 99.05 ± 0.93 | 0.94 |
| Analytes | Concentration (ng/mL) | 25 °C for 4 h | Frozen for 30 Days | Three Freeze–Thaw Cycles | 4 °C for 12 h | ||||
|---|---|---|---|---|---|---|---|---|---|
| (RSD, %) | (Re, %) | (RSD, %) | (Re, %) | (RSD, %) | (Re, %) | (RSD, %) | (Re, %) | ||
| 3-CQA | 65 | 2.89 | −2.68 | 6.31 | −1.03 | 4.93 | 1.10 | 4.23 | −2.19 |
| 5000 | 7.88 | 12.49 | 2.09 | 17.46 | 3.36 | 8.73 | 7.77 | 12.49 | |
| 13,500 | 6.22 | −5.95 | 3.06 | −6.35 | 2.28 | −2.45 | 10.15 | −3.34 | |
| 4-CQA | 27 | 9.37 | 9.94 | 3.23 | 14.30 | 5.52 | −14.36 | 12.30 | −10.14 |
| 2000 | 5.05 | −6.74 | 11.75 | −6.69 | 3.17 | −2.52 | 5.72 | −6.07 | |
| 3500 | 3.19 | −4.76 | 2.59 | −5.14 | 3.19 | 0.65 | 1.88 | −3.52 | |
| 5-CQA | 9 | 10.62 | 0.94 | 7.74 | −7.20 | 11.47 | 4.31 | 14.02 | 2.32 |
| 800 | 2.52 | −3.09 | 2.06 | −6.61 | 1.95 | −1.04 | 2.54 | −4.57 | |
| 2100 | 12.53 | 10.07 | 5.54 | −6.87 | 5.58 | 7.38 | 4.47 | 14.17 | |
| 3,5-diCQA | 50 | 8.54 | 0.02 | 6.75 | −3.78 | 6.91 | −5.47 | 13.71 | −10.44 |
| 3000 | 7.36 | 1.97 | 6.64 | −7.91 | 7.10 | 13.19 | 12.37 | 7.24 | |
| 5000 | 1.63 | 0.78 | 2.40 | −16.72 | 3.64 | −19.50 | 10.19 | 5.89 | |
| 4,5-diCQA | 15 | 15.63 | −3.74 | 15.19 | −5.68 | 5.44 | 0.05 | 15.94 | −11.51 |
| 1300 | 3.59 | −6.22 | 9.83 | −10.26 | 3.15 | −9.93 | 2.28 | −12.55 | |
| 2500 | 3.95 | −12.60 | 2.41 | −14.53 | 11.35 | −13.61 | 11.38 | −12.28 | |
| PA | 5 | 12.09 | −14.34 | 11.37 | −9.81 | 14.47 | −8.02 | 7.39 | −7.75 |
| 180 | 9.03 | −14.67 | 2.96 | −5.75 | 2.00 | −3.52 | 1.69 | −6.94 | |
| 300 | 2.41 | −7.22 | 7.52 | −6.93 | 4.75 | 3.29 | 6.51 | −9.11 | |
| Sweroside | 40 | 7.34 | −14.33 | 4.15 | −12.88 | 14.83 | −6.23 | 8.06 | −4.82 |
| 3600 | 8.77 | −10.16 | 3.95 | −15.16 | 5.21 | −14.19 | 5.94 | −10.82 | |
| 6000 | 6.92 | −1.09 | 3.14 | −3.77 | 3.93 | −1.03 | 2.19 | −1.19 | |
| Secoxyloganin | 40 | 16.10 | −13.19 | 12.18 | −7.49 | 14.37 | −9.66 | 13.89 | −2.74 |
| 2600 | 1.17 | −1.65 | 3.43 | −2.54 | 2.41 | −3.5 | 2.30 | −2.44 | |
| 4500 | 2.59 | −14.52 | 1.37 | −13.94 | 10.07 | −11.58 | 9.04 | −12.36 | |
| Analytes | Group | Cmax (ng/mL) | Tmax (h) | t1/2 (h) | AUC0–t (ng/L) | AUC0–∞ (ng/L) | MRT0–t (h) | MRT0–∞ (h) |
|---|---|---|---|---|---|---|---|---|
| 3-CQA | N | 5113.7 ± 1222.21 | 0.2083 ± 0.04568 | 12.9 ± 0.765 | 12,104.7 ± 2285.95 | 13,124.31 ± 2298.26 | 13.92 ± 1.31 | 18.17 ± 1.94 |
| M | 6286.14 ± 1262.72 | 0.19 ± 0.043 | 12.164 ± 3.12 | 16,356.04 ± 1719.08 ** | 17,442.89 ± 1551.76 ** | 13.45 ± 1.67 | 23.31 ± 11.25 | |
| 5-CQA | N | 265.59 ± 101.744 | 0.24 ± 0.03405 | 17.944 ± 9.969 | 1359.35 ± 249.57 | 1685.16 ± 730.52 | 17.96 ± 2.34 | 21.41 ± 2.86 |
| M | 1115.21 ± 316.23 ** | 0.25 ± 0.13 | 18.86 ± 18.4 | 3568.54 ± 686.23 ** | 3970.61 ± 712.21 ** | 11.08 ± 2.42 ** | 20.92 ± 8.54 | |
| 4-CQA | N | 1108.35 ± 447.635 | 0.2083 ± 0.04568 | 15.17 ± 5.24 | 2174.6 ± 615.543 | 2335.247 ± 568.56 | 9.65 ± 1.72 | 14.73 ± 4.18 |
| M | 2366.18 ± 425.38 ** | 0.14 ± 0.043 * | 42.24 ± 31.66 | 5965.42 ± 1804.98 ** | 6809.52 ± 1139.85 ** | 10.14 ± 1.06 | 29.72 ± 24.81 | |
| 3,5-diCQA | N | 1228.21 ± 568.97 | 0.2222 ± 0.04307 | 21.186 ± 5.35 | 4452.3 ± 414.357 | 6081.8 ± 755.098 | 16.06 ± 1.42 | 22.87 ± 5.04 |
| M | 3099.07 ± 1126.97 ** | 0.1944 ± 0.043 | 51.05 ± 47.28 | 6946.47 ± 898.12 ** | 11,219.19 ± 2773.706 ** | 13.71 ± 2.12 * | 43.44 ± 35.17 | |
| 4,5-diCQA | N | 527.74 ± 333.416 | 0.18 ± 0.034 | 5.18 ± 0.69 | 1491.24 ± 634.12 | 1493.99 ± 633.17 | 12.12 ± 5.52 | 13.19 ± 5.2 |
| M | 1579.03 ± 300.04 ** | 0.24 ± 0.14 | 50.79 ± 28.98 ** | 4017.55 ± 268.5 ** | 5898.58 ± 689.9 ** | 8.51 ± 0.72 | 41.21 ± 28.3 * | |
| PA | N | 22.56 ± 8.36 | 0.33 ± 0.13 | 24.79 ± 12.84 | 198.44 ± 36.97 | 292.41 ± 26.04 | 23.23 ± 0.86 | 44.148 ± 16.85 |
| M | 23.00 ± 2.97 | 0.18 ± 0.034 * | 25.46 ± 16.97 | 219.41 ± 59.07 | 546.58 ± 208.79 * | 26.56 ± 2.13 ** | 49.79 ± 28.86 | |
| Sweroside | N | 1928.45 ± 608.58 | 0.53 ± 0.38 | 9.78 ± 2.87 | 9685.09 ± 1410.29 | 10,003.33 ± 1540.57 | 12.29 ± 1.14 | 13.88 ± 1.86 |
| M | 2364.23 ± 440 | 0.67 ± 0.26 | 11.846 ± 1.51 | 15,990.27 ± 903.4 ** | 16,726.12 ± 967.72 ** | 11.35 ± 0.48 | 13.69 ± 1.33 | |
| Secoxyloganin | N | 1514.71 ± 331.078 | 0.46 ± 0.102 | 16.15 ± 19.09 | 6232.57 ± 1065.92 | 7613.15 ± 4120.64 | 11.89 ± 1.69 | 12.39 ± 1.04 |
| M | 4154.96 ± 376.51 ** | 0.29 ± 0.102 * | 23.56 ± 3.48 | 15,018.04 ± 2842.66 ** | 17,111.14 ± 3246.6 ** | 8.745 ± 0.58 ** | 18.2 ± 2.24 ** |
Publisher’s Note: MDPI stays neutral with regard to jurisdictional claims in published maps and institutional affiliations. |
© 2022 by the authors. Licensee MDPI, Basel, Switzerland. This article is an open access article distributed under the terms and conditions of the Creative Commons Attribution (CC BY) license (https://creativecommons.org/licenses/by/4.0/).
Share and Cite
Wang, X.; Liu, S.; Yang, L.; Dong, J.; Zhang, S.; Lv, J.; Yang, L.; Jiang, H. Pharmacokinetic Comparison of Eight Major Compounds of Lonicerae japonicae flos after Oral Administration in Normal Rats and Rats with Liver Injury. Molecules 2022, 27, 8211. https://doi.org/10.3390/molecules27238211
Wang X, Liu S, Yang L, Dong J, Zhang S, Lv J, Yang L, Jiang H. Pharmacokinetic Comparison of Eight Major Compounds of Lonicerae japonicae flos after Oral Administration in Normal Rats and Rats with Liver Injury. Molecules. 2022; 27(23):8211. https://doi.org/10.3390/molecules27238211
Chicago/Turabian StyleWang, Xuejiao, Songtao Liu, Lin Yang, Jiaojiao Dong, Shihao Zhang, Jiahao Lv, Liu Yang, and Hai Jiang. 2022. "Pharmacokinetic Comparison of Eight Major Compounds of Lonicerae japonicae flos after Oral Administration in Normal Rats and Rats with Liver Injury" Molecules 27, no. 23: 8211. https://doi.org/10.3390/molecules27238211