Article

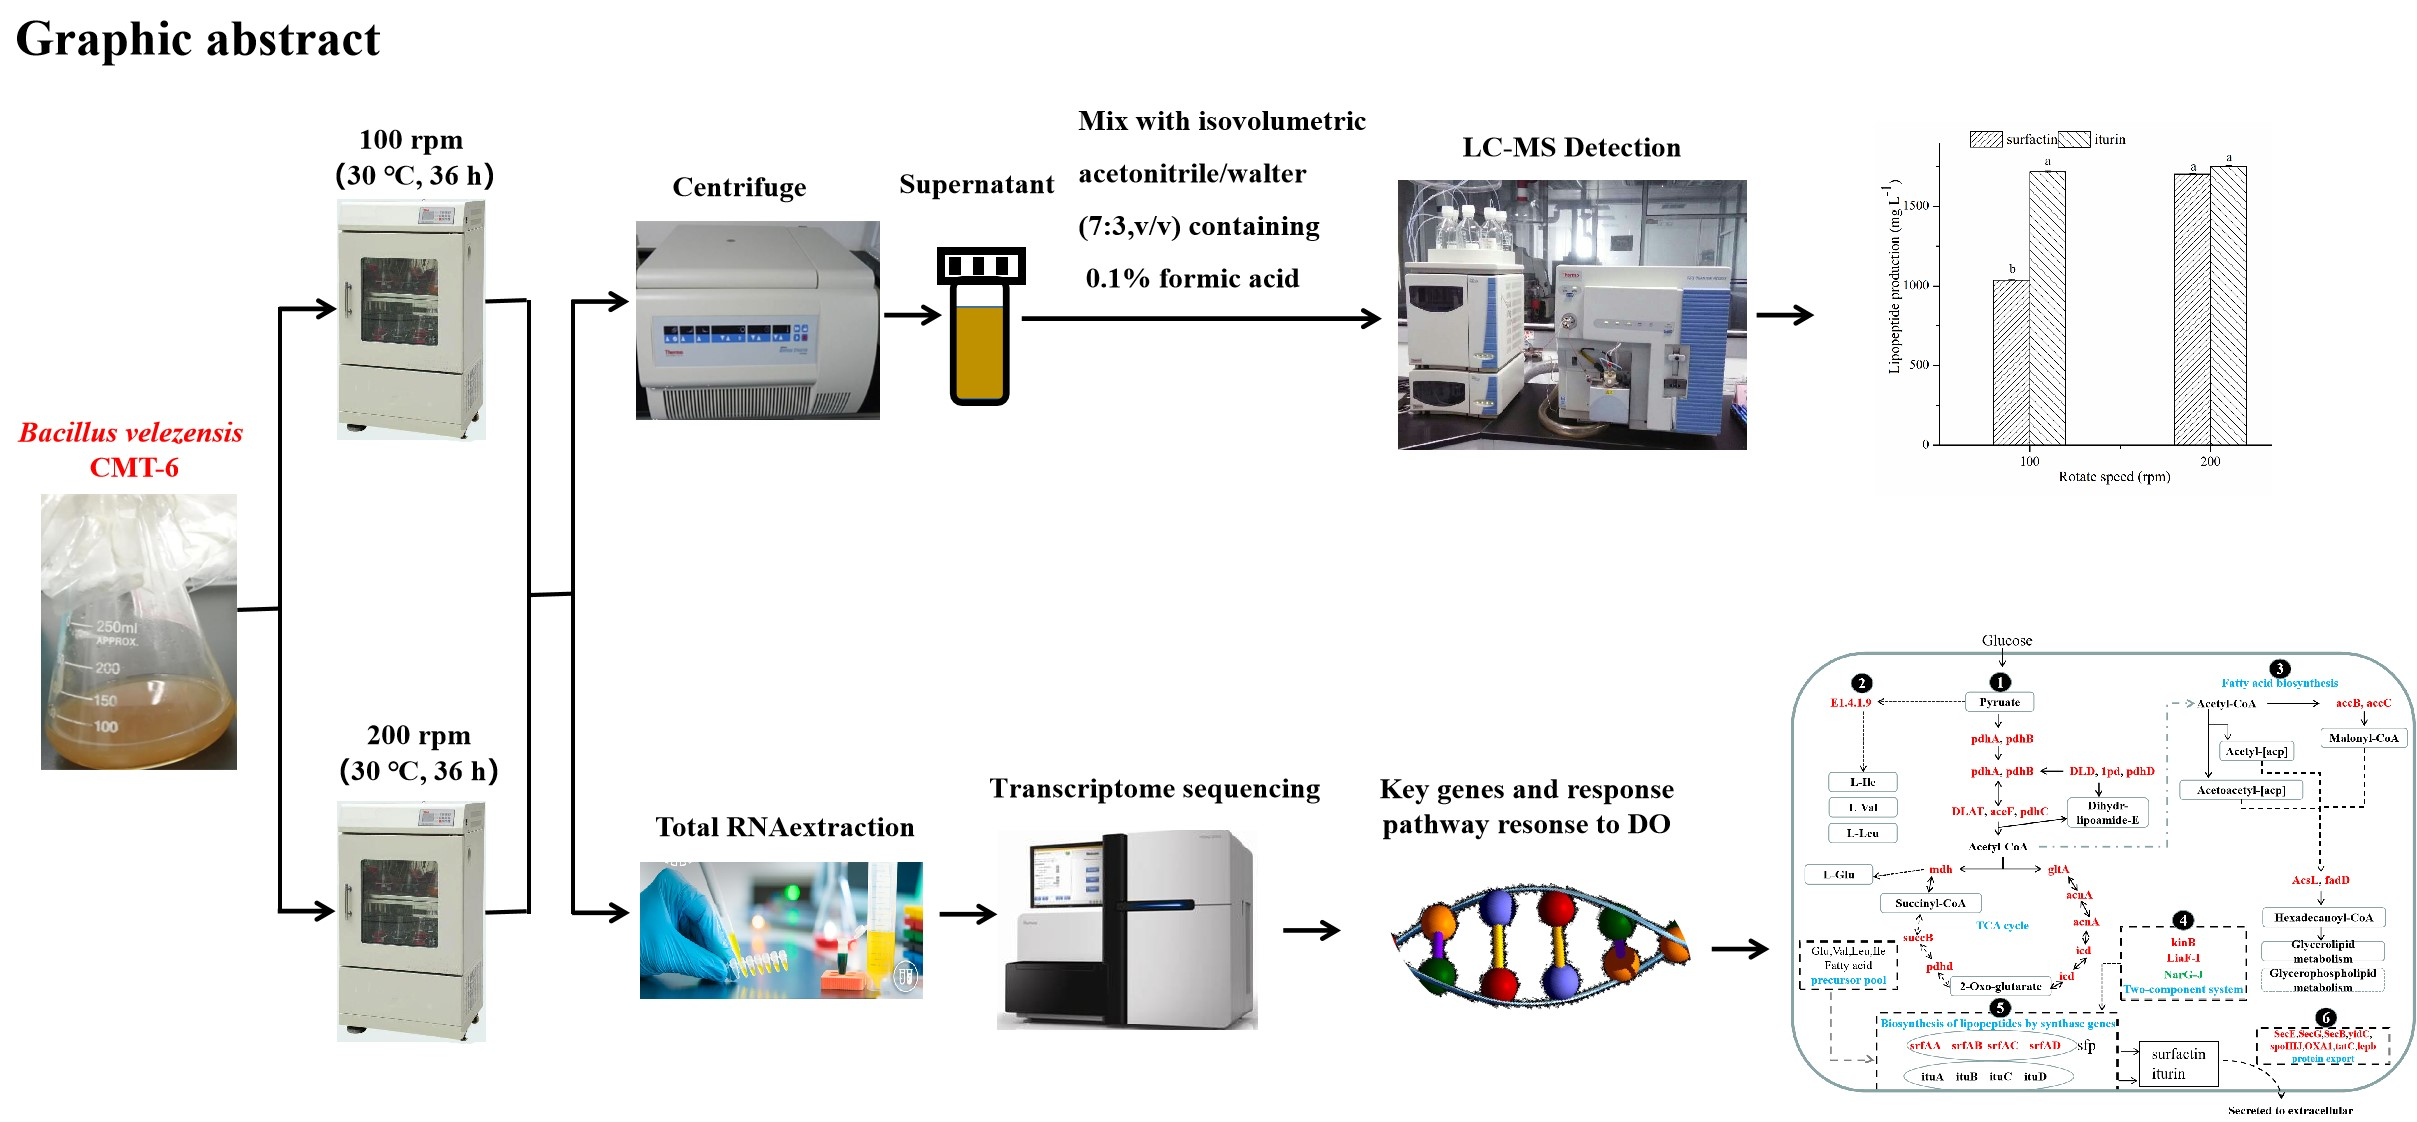
LC-MS and Transcriptome Analysis of Lipopeptide Biosynthesis by Bacillus velezensis CMT-6 Responding to Dissolved Oxygen

1
Guangdong Provincial Key Laboratory of Aquatic Product Processing and Safety, Guangdong Provincial Engineering Technology Research Center of Seafood, Guangdong Province Engineering Laboratory for Marine Biological Products, Key Laboratory of Advanced Processing of Aquatic Product of Guangdong Higher Education Institution, College of Food Science and Technology, Guangdong Ocean University, Zhanjiang 524088, China
2
Collaborative Innovation Center of Seafood Deep Processing, Dalian Polytechnic University, Dalian 116034, China
3
Zhanjiang Institute of Food and Drug Control, Zhanjiang 524022, China
4
Department of Wine, Food and Molecular Biosciences, Faculty of Agriculture and Life Sciences, Lincoln University, P.O. Box 85084, Lincoln 7647, New Zealand
*
Authors to whom correspondence should be addressed.
These authors contributed equally to this work.
Molecules 2022, 27(20), 6822; https://doi.org/10.3390/molecules27206822
Submission received: 26 August 2022 / Revised: 30 September 2022 / Accepted: 3 October 2022 / Published: 12 October 2022
(This article belongs to the Special Issue Recent Advances in Food Microbiology Control)

Abstract

:
Dissolved oxygen (DO) is an key factor for lipopeptide fermentation. To better understand the link between oxygen supply and lipopeptide productivity in Bacillus velezensis CMT-6, the mechanism of DO on the synthesis of antimicrobial lipopeptides by Bacillus velezensis CMT-6 was examined. The production of surfactin and iturin of CMT-6 was detected by liquid chromatography–mass spectrometer (LC-MS) under different DO conditions and transcriptome analysis was performed. At 100 and 200 rpm, the lipopeptides productions were 2753.62 mg/L and 3452.90 mg/L, respectively. There was no significant change in the yield of iturin but that of surfactin increased by 64.14%. Transcriptome analysis revealed that the enriched differential genes were concentrated in the GO term of oxidation–reduction process. The marked enrichment of the lipopeptides synthesis pathway, including microbial metabolism in diverse environments and carbon metabolism in the two-component system, were observed. More importantly, the expression levels of the four surfactin synthetase genes increased at higher DO, however, the iturin synthetase gene expression did not. Furthermore, modular surfactin synthetase was overexpressed (between 9- and 49-fold) at 200 rpm but not at 100 rpm, which is suggestive of efficient surfactin assembly resulting in surfactin overproduction. This study provides a theoretical basis for constructing engineering strains with high lipopeptide production to adapt to different DO.

Graphical Abstract

1. Introduction

Surfactin and iturin are the two most widely studied lipopeptides [1]. The molecular structure of the two cyclic lipopeptides mostly comprise seven amino acids and fatty acid chains (the fatty acid chain length ranges from C13 to C16 in surfactin and from C14 to C17 in iturin) [2]. Based on their unique structures, surfactin and iturin possess broad antimicrobial spectra because they can insert into a phospholipid bilayer to cause cell membrane perforation and destroy the integrity of cell wall and mycelium [2,3]. In addition, the lipopeptides are provided with strong surfactivity, excellent antibacterial activity and good foamability and emulsifiability [3,4]. Thus, they play an important role in many fields including food, medicine and cosmetic manufacture [5,6,7].
At present, lipopeptides are mainly produced by the Bacilli species. During fermentation, dissolved oxygen (DO) is an important process parameter because it affects the biomass, cell differentiation and electron transfer [8]. In addition, DO affects metabolic pathways and fluxes in Bacilli and hence lipopeptide production [9]. Lipopeptide production can be enhanced by increasing the DO availability at higher rotational speeds [10]. However, severe stirring causes serious foaming which leads to a loss of lipopeptides [11]. Therefore, it is of great significance to explore how DO regulates lipopeptide synthesis.
Both surfactin and iturin are synthesized via a systematic mechanism catalyzed by nonribosomal peptide synthetases (NRPSs) [12]. Surfactin is encoded by the srfA operon (srfAA, srfAB, srfAC, srfAD), and iturin is encoded by the itu operon (itu A, ituB, ituC, ituD) [2,13]. The synthesis of surfactin and iturin is not only regulated by synthetase genes but also mostly by the tricarboxylic acid cycle (TCA) pathway, fatty acid synthesis, amino acid synthesis and protein efflux [14]. However, the expression of these genes and pathways at different DO environments and their effects on lipopeptide production are still unknown.
In this study, LC-MS/MS was used to detect lipopeptides including surfactin and iturin at high and low DO produced at rotational speeds of 200 and 100 rpm, respectively. Comparative transcription was used to explore the metabolic pathways that respond to DO and regulate lipopeptide synthesis. This study provides new insights to better elucidate the signaling network between DO level and lipopeptide yields, and provide guidance to further improve lipopeptide production.

2. Results and Discussion

2.1. Phenotypic Assays for Biomass and Bacillus velezensis CMT-6 Lipopeptide Production

Bacilli produce lipopeptides by aerobic fermentation. The DO concentration in the fermentation broth not only affects bacterial growth but also changes the metabolic flow of lipopeptide synthesis [8,9]. The lipopeptide yield improves at higher DO concentrations. No significant change occurred in the iturin concentration (p > 0.05) but surfactin reached a maximum of 1702 mg/L at the higher DO concentration (Figure 1B). However, the biomass of CMT-6 did not increase at a higher DO. In fact, the dry cell weight of CMT-6 at a rotational speed of 200 rpm was significantly lower than that at 100 rpm (p < 0.05) (Figure 1A). It has been reported that when cells are grown vigorously, the lipopeptide production is lower [15]. Therefore, the fermentation process of increasing biomass is not an effective strategy to improve the production of lipopeptides in actual production.

2.2. Global Transcriptome Analysis

The transcriptome analysis based on the RNA sequencing of CMT-6 at the two DO culture concentrations showed the number of differentially expressed genes (DEGs) to be 795, among which 444 were up-regulated and 351 were down-regulated in the 200 rpm group compared with the 100 rpm group, while 3201 genes underwent no significant changes in expression (Figure 2).
According to the Gene Oncology (GO) analyses (Figure 3), the up-regulated DEGs were significantly enriched in the biological process, including transmembrane transport (40 genes: cydD, ydjE, nhaC, pstC, mntH, NRT, narK, nrtP, nasA, araE, iolT, HXT, pbuX, gltP, gltT, msmX, msmK, malK, sugC, ggtA, msiK, dctA, mscS, fsr, iolF, ynfM, glcP, bcr, citM, glpT, lrgA, dgoT, bcr, ynaI, mscMJ, MSL, cydC, oppA, mppA, HXT), ‘de novo’ UMP biosynthetic process (7 genes: pyrB, pyrDI, pyrDII, pyrF, pyrE, pyrC, carA), biotin biosynthetic process (5 genes: bioB, bioW, bioA, bioK, bioD), phosphoenolpyruvate-dependent sugar phosphotransferase system (13 genes: celB, ptsI, celA, mtlA, celA, lacF, celB, celC, gamP, glvB, FruB, treB, celC), histidine biosynthetic process (10 genes: hisIE, hisH, E3.1.3.15B, hisF, hisB, hisZ, hisD, hisG, hisA, hisC), oxidation–reduction process (103 genes: gldA, queF, ldh, glpA, glpD, pyrDI, pdhA, leuB, qcrC, bfcC, petD, mmsA, iolA, narH, celF, iolX, aroE, glcD, dps, pdhB, kefG, paaH, hbd, fadB, mmgB, pyrDII, betB, gbsA, araM, egsA, butB, bkdA2, iolG, adhP, katE, catB, srpA, rspB, nirB, zwf, hemY, lpd, pdhD, gapA, frmA, adhC, cydA, tyrA2, wbpA, melA, ilvC, gnd, gntZ, serA, bacC, fldA, nifF, isiB, l pd, pdhD, tdh, bdh, lpd, pdhD, bacG, dps, narI, ttuC, dmlA, coxD, ctaF, efeB, proA, hisD, glvA, gudB, rocG, osmC, dadA, bkdA1, cobA, hemD, mtlD, fldA, nifF, isiB, gbsB, gabD, serA, katE, catB, srpA, glcF, acuA, gcvPB, ME2, sfcA, maeA, bioI, nirD, gapA, ald, ssuD), carbohydrate transmembrane transport (12 genes: CelB, celA, mtlA, celA, celC, celB, lacF, glvB, mtlA, fruB, treB, celC). These results show that the effects of DO on the synthesis of lipopeptides by CMT-6 involve a range of physiological functions of CMT-6. The enriched differential genes were mostly concentrated in the transmembrane transport and oxidation–reduction processes. More genes with transmembrane transport function means that more protein translocation channels could be synthesized, including those involved in the secretion of lipopeptides, extracellularly resulting in an increase in production [16,17]. A greater number of genes with oxidation–reduction processes reduces the conversion of NADH into NAD to ensure the oxidation–reduction state (NADH/NAD+) balance at high DO concentrations [18], resulting in more ATP production with an increased utilization of substrate by bacteria, culminating in an accelerated metabolism to the synthesis of more lipopeptide [9,19].
Genes usually play a role in specific biological functions by interacting with each other. Pathway analysis can provide a deeper understanding of the biological functions of CMT-6 genes. A scatter plot of the KEGG enrichment analysis of CMT-6 at two DO concentrations (in which only the top 20 enriched pathway entries are shown) is shown in Figure 4. The differential genes of the two DO groups were significantly enriched in three pathways—microbial metabolism in diverse environments, carbon metabolism and two-component system. These metabolic pathways are closely related to lipopeptide synthesis. Firstly, the high gene expressions of those enriched in the metabolism including the carbon metabolism pathway probably acted to reduce the delay period for optimal nutrient utilization in the fermentation system and to provide sufficient precursors and energy for lipopeptide synthesis [20]. Secondly, the two-component system (TCS) can respond to external environment changes [21] and many genes could be regulated by TCS with their functions involving phosphatase synthesis, anionic polymer formation, phosphoteic acid and the synthesis of secondary metabolites [22,23,24]. There are other genes that can combine with TCS, including lipopeptide synthetase genes [25,26,27]. The expression levels of spore and biofilm regulatory genes enriched in TCS were up-regulated, which provides the most direct theoretical support for the development of high-yield fermentation processes such as the biofilm method under hypoxic conditions.

2.3. The Effect of Dissolved Oxygen on Synthetase Genes and the Key Genes Associated with Lipopeptides

The synthesis of surfactin and iturin were accomplished by non-ribosomal peptide synthetase, which are encoded by srfA and itu, respectively [14,28,29]. In this study, srfAA-srfAD were up-regulated at a high DO (Figure 5), which improved the surfactin yield. The expression levels of ituA-ituD were relatively stable (Figure 5), which resulted in no significant change in the iturin yield. Lipopeptide production is reduced when the expression of synthetase genes is inhibited [30]. However, there is also a different view that the expression of synthetase genes of the strains with high-yield lipopeptide is lower than that in the low-yield strains [14]. Therefore, there is no consistent conclusion about the relationship between the synthetase gene expression levels and the ability to synthesize lipopeptides. A possible reason is that synthetases contain multiple enzyme subunits, each containing multiple functional modules which are responsible for the activation of specific amino acids and the extension of peptide chains [30]. Therefore, the ability to synthesize lipopeptides could be determined by the synthetase gene content and its catalytic efficiency to join amino acids.
There are 14 TCA genes that respond to the changes in DO concentrations (Table 1). The gene expressions in the 200 rpm group were higher than in the 100 rpm group. The increase in DO enhanced the metabolic flow of TCA to synthesize more amino acids and fatty acids, which are the precursors for lipopeptide synthesis [31,32,33,34]. Based on these findings, the engineering strains could be constructed with the high expression level of these genes to improve the utilization efficiency of carbon sources.
Fatty acid is the main component of lipopeptide and the gene expression level in its synthesis path is positively correlated with lipopeptide production [35,36]. Certain associated genes such as accC, accB, acsL and fadD were also up-regulated at high DO (Table 2). This is probably the reason that CMT-6 can synthesize high levels of lipopeptide at high DO.
The elevated nitrogen metabolism gene expression is for the bacillus to adapt to survive under hypoxic conditions [37]. The expressions of narG, narH, narI, narJ, liaF, liaG, liaH and liaI genes were down-regulated at high DO concentrations (Table 3). This gives us inspiration: in order to reduce the dependence of the fermentation process of lipopeptides at a high DO, the expression of genes related to nitrogen metabolism could be promoted by genetic engineering technology, so the production of lipopeptides would be enhanced.

3. Materials and Methods

3.1. Experimental Strain and Medium

Bacillus velezensis CMT-6 (Gen Bank, CP025341) culture was obtained from the Food-borne Pathogenic Microorganisms and Toxins of Aquatic Products Green Control Laboratory, Food Science and Technology College, Guangdong Ocean University, Zhanjiang, China.

3.2. Cell Growth and Lipopeptide Production Assay

CMT-6 was inoculated to 100 mL LB liquid medium, cultured at 37 °C and centrifuged at 150 rpm for 24 h for seed preparation. The seed solution was added to the modified Landy (1.0 g/L K4H2PO4, 0.5 g/L KCl, 0.5 g/L MgSO4·7H2O, 20 g/L glucose, 1 g/L yeast extract, 0.0016 g/L CuSO4·5H2O, 0.0015 g/L FeSO4·7H2O, 0.05g/L MnSO4, 5 g/L L-Glutamic acid (L-Glu)) medium at a concentration of 5 % (v/v) in an Erlenmeyer flask and cultivated at 30 °C—one half at 100 rpm and the remainder at 200 rpm for 36 h. After cultivation, each CMT-6 culture was centrifuged at 5000 rpm (J2-MC, Beckman, Brea, CA, USA) for 15 min at 4 °C. The thallus was collected, freeze-dried and weighed. The supernatant was stored at 4 °C.
The crude extracts were mixed with isovolumetric acetonitrile/water (7:3, v/v) in 0.1 % (v/v) formic acid, and filtered with a 0.45 μm biofilter into the autosampler vials for the measurement of surfactin and iturin as follows [38].
Surfactin and iturin analyses were performed on a Thermo Scientific Surveyor HPLC system comprised of a Surveyor MS Pump Plus, an on-line degasser and a Surveyor auto sampler Plus coupled with a Thermo TSQ Quantum Access tandem mass spectrometer equipped with an electrospray ionization (ESI) source (Woburn, MA, USA). The separation was performed at 35 °C using a Hypersil GAcquity UPLC@BEM C18 column (5 μm, 250 mm × 4.6 mm) (Thermo Scientific, Carlsbad, CA, USA) with a flow rate of 5.0 μL/min. The mobile phase consisted of acetonitrile (A) and water containing 5 mM ammonium acetate 0.1 % formic acid (B) with the gradient elution program as follows: 0–0.3 min 45% A, 0.3–0.6 min 50% A, 0.6–1.8 min 80% A and 6 min 100% A. MS/MS detection was carried out using a triple quadruple mass spectrometer, coupled with an electrospray ionization source operated in positive (ESI+) mode (Shimadzu, Kyoto, Japan). The ionization source parameters were set as follows: capillary voltage—1.2 KV; ion source temperature—150 °C; spray temperature—450 °C; desolvent gas flow rate—600 L HR-1; impact energy—6.0 eV; molecular weight deviation within ±0.2 Da; and mass charge ratio range from 800 to 2000.

3.3. RNA Extraction and Analysis of RNA Sequencing Data

3.3.1. RNA Extraction

The thallus was obtained according to the method of 2.2, and immediately transferred to liquid nitrogen and stored at −80°C for RNA extraction. Total RNA was extracted using Trizol reagent (Invitrogen Life Technologies, Carlsbad, CA, USA) according to the manufacturer’s instructions. The integrity of the extracted RNA sample was determined by electrophoresis. The RNA concentration was measured using a NanoDrop spectrophotometer (Thermo Scientific, Waltham, MA, USA).

3.3.2. Construction of the cDNA Library and Transcriptomic Data Analysis

Sequencing libraries were generated using the TruSeq RNA Sample Preparation Kit (Illumina, San Diego, CA, USA) according to the manufacturer’s instructions. Briefly, mRNA was purified using poly-T oligo attached magnetic beads. The mRNA was fragmented using divalent cations at high temperature in an Illumina proprietary fragmentation buffer. First-strand cDNA was synthesized using random oligonucleotides and SuperScript II. Second-strand cDNA was subsequently synthesized using DNA polymerase I and RNase H. After adenylation of the 3′ ends of the DNA fragments, Illumina PE adapter oligonucleotides were ligated, and the library fragments purified were using the AMPure XP system (Beckman Coulter, Brea, CA, USA). DNA fragments with ligated adaptors on both ends were selectively enriched using Illumina polymerase chain reaction (PCR) Primer Cocktail in a 15 cycle PCR reaction. The products were purified (AMPure XP system) and quantified using the Agilent high-sensitivity DNA assay with the Bioanalyzer 2100 system (Agilent Technologies, Santa Clara, CA, USA). The sequencing libraries were sequenced using Illumina HiSeq.

3.4. Data Analysis

The transcriptome library of each sample obtained by high-throughput sequencing was converted into original sequence data, and the CASAVA base sequence identification analysis was performed. The valid data in this study were obtained by filtering adapters, aggregating N and low-quality readings from the original data. Then, the software HISAT2 V2.0.5 was used to compare the filtered RNA sequence with the reference genome of Bacillus Velez downloaded from NCBI (https://www.ncbi.nlm.nih.gov/g accessed on 25 August 2022). The HTseq software was used to process the data generated by high-throughput sequencing, and these reads were efficiently and accurately compared to the genes to estimate the gene expression levels of different genes and different comparable experiments. DESeq 2R software was used to analyze and compare the differentially expressed genes. The Benjamini and Hochberg method was used to adjust the p value, and p < 0.05 and log2 fold change2 were set together to analyze differentially expressed genes (DEGs).

3.5. Enrichment Analysis

In order to analyze the function of differentially expressed genes, genes with a correction value of p ≤ 0.05 were used as significantly rich GO terms, and all differentially expressed genes were mapped to Gene Ontology terms in the database. In order to determine the key metabolic pathways, the cluster Profiler R software was used to analyze the differentially expressed genes in the KEGG pathway.

3.6. Statistical Analysis

The data are expressed as the mean ± standard deviation (SD) and were statistically analyzed by IBM SPSS statistics 26.0 software. Significant differences between the control and the treated fish were determined by one-way analysis of variance (ANOVA), followed by Tukey’s test to compare the control and treatment group values. A p-value of <0.05 was considered significant. The figures were constructed by origin 9.0.

4. Conclusions

Transcriptomics and LC-MS were used to reveal the molecular mechanism of lipopeptide accumulation by CMT-6 responding to DO concentration. The high dissolved oxygen promoted metabolism flows more towards the synthesis of precursors, and the high expression of lipopeptide synthase genes increased the utilization of precursor substances by the strain, thus increasing the production of lipopeptides. These findings provide theoretical guidance to construct engineered bacterial strains and the development of hypoxic fermentation strategies to increase the lipopeptides yield. However, the differential responses of different lipopeptides’ synthetase genes to DO need to be further studied.

Author Contributions

Conceptualization, Q.D.; Data analysis, Q.D., H.L. and M.H.; Formal analysis, L.S.; Project administration, Q.D., H.L. and Y.P.; Resources, Z.F., S.Z.; Software, Q.D.; Supervision, R.G.; LC-MS experiment, J.L. and Q.D.; Writing—original draft, Q.D.; Writing—review and editing, Y.P. and R.G. All authors have read and agreed to the published version of the manuscript.

Funding

This research was funded by the Characteristic Innovation Project of University Colleges in Guangdong Province (No. 2020KQNCX025), Zhanjiang Competitive Allocation Project of Science and Technology Development Special Fund (No. 200915134541577) and the Innovative Team Program of High Education of Guangdong Province (2021KCXTD021).

Conflicts of Interest

The authors declare no conflict of interest.

References

  1. Sun, D.F.; Liao, J.M.; Sun, L.J.; Wang, Y.L.; Liu, Y.; Deng, Q.; Zhang, N.; Xu, D.F.; Fang, Z.J.; Wang, W.J.; et al. Effect of Media and Fermentation Conditions on surfactin and iturin Homologues Produced by Bacillus natto NT-6: LC–MS analysis. AMB Express 2019, 9, 1–9. [Google Scholar] [CrossRef] [PubMed]
  2. Deng, Q.; Wang, R.D.; Sun, L.D.; Wang, Y.L.; Pu, Y.H.; Fang, Z.J.; Xu, D.F.; Liu, Y.; Ye, R.Y.; Yin, S.J.; et al. Complete Genome of Bacillus velezensis CMT-6 and Comparative Genome Analysis Reveals Lipopeptide Diversity. Biochem. Genet. 2020, 58, 1–15. [Google Scholar] [CrossRef]
  3. Théatre, A.; Hoste, A.C.R.; Rigolet, A.; Benneceur, I.; Bechet, M.; Ongena, M.; Deleu, M.; Jacques, P. Bacillus sp.: A Remarkable Source of Bioactive Lipopeptides. Adv. Biochem. Eng. Biotechnol. 2022, 181, 123–179. [Google Scholar] [PubMed]
  4. Rajni, S.; Jagdish, S.; Neelam, V. Statistical Optimization and Comparative Study of Lipopeptides Produced by Bacillus amyloliquefaciens SAS-1 and Bacillus subtilis BR-15. Biocatal. Agric. Biotechnol. 2020, 25, 101575. [Google Scholar]
  5. Zhang, B.; Xu, L.L.; Ding, J.L.; Wang, M.Z.; Ge, R.; Zhao, H.F.; Zhang, B.L.; Fan, J.F. Natural Antimicrobial Lipopeptides Secreted by Bacillus spp. and Their Application in Food Preservation, A Critical Review. Trends Food Sci. Tech. 2022, 127, 26–37. [Google Scholar] [CrossRef]
  6. Adu, S.A.; Naughton, P.J.; Marchant, R.; Banat, I.M. Microbial Biosurfactants in Cosmetic and Personal Skincare Pharmaceutical Formulations. Pharmaceutics 2020, 12, 1099. [Google Scholar] [CrossRef]
  7. Nakamoto, H.; Yokoyama, Y.; Suzuki, T.; Miyamoto, Y.; Fujishiro, T.; Morikawa, M.; Miyata, Y. A Cyclic Lipopeptide Surfactin Is A Species-selective Hsp90 Inhibitor That Suppresses Cyanobacterial Growth. J. Biochem. 2021, 170, 255–264. [Google Scholar] [CrossRef] [PubMed]
  8. Li, J.Y.; Wang, L.L.; Yi, F.; Zhou, L.; Gang, H.Z.; Liu, J.F.; Yang, S.Z.; Mu, B.Z. Microbial Lipopeptide-Producing Strains and Their Metabolic Roles under Anaerobic Conditions. Microorganisms 2021, 9, 2030. [Google Scholar] [CrossRef]
  9. Jiang, M.L.; Qing, X.; Hu, S.Y.; He, P.H.; Chen, Y.G.; Cai, D.B.; Wu, Y.T.; Chen, S.W. Enhanced Aerobic Denitrification Performance with Bacillus licheniformis via Secreting Lipopeptide Biosurfactant Lichenysin. Chem. Eng. J. 2022, 434, 134686. [Google Scholar] [CrossRef]
  10. Sameh, F.; Krasimir, D.; Frederique, G.; Peggy, V.; Philippe, J.; Iordan, N. Impact of Energy Supply and Oxygen Transfer on Selective Lipopeptide Production by Bacillus subtilis BBG21. Bioresour. Technol. 2012, 126, 1–6. [Google Scholar]
  11. Sameh, F.; Krasimir, D.; Peggy, V.; Frédérique, G.; Guillaume, D.; Philippe, J.; Nikov, I. Oxygen Transfer in Three Phase Inverse Fluidized Bed Bioreactor During Biosurfactant Production by Bacillus subtilis. Biochem. Eng. J. 2013, 76, 70–76. [Google Scholar]
  12. Arlt, P.; Hashizume, H.; Igarashi, M.; Gross, H. Genome Sequence of Lysobacter sp. Strain BMK333-48F3, the Producer Strain of Potent Lipopeptide Antibiotics of the Tripropeptin Family. Microbiol. Resour Ann. 2021, 10, e0096921. [Google Scholar] [CrossRef] [PubMed]
  13. Narendra Kumar, P.; Swapna, T.H.; Sathi, R.K.; Archana, K.; Nageshwar, L.; Nalini, S.; Khan, M.Y.; Hameeda, B. Draft Genome Sequence of Bacillus amyloliquefaciens Strain RHNK22, Isolated from Rhizosphere with Biosurfactant (Surfactin, Iturin, and Fengycin) and Antifungal Activity. Genome Announc. 2016, 4, e01682-15. [Google Scholar] [CrossRef]
  14. Zhi, Y.; Wu, Q.; Xu, Y. Genome and Transcriptome Analysis of Surfactin Biosynthesis in Bacillus amyloliquefaciens MT45. Sci. Rep. 2017, 7, 40976. [Google Scholar] [CrossRef] [PubMed] [Green Version]
  15. Zhao, P.P.; Lei, S.Z.; Xu, X.G.; Wang, R.; Jiang, C.M.; Shi, J.L. Effect of Medium Compositions on the Production of Antifungal Components by Bacillus velezensis. Food Ferment. Ind. 2020, 46, 147–151. [Google Scholar]
  16. Wu, Q.; Zhi, Y.; Xu, Y. Systematically Engineering The Biosynthesis of A Green Biosurfactant Surfactin by Bacillus subtilis 168. Metab. Eng. 2019, 52, 87–97. [Google Scholar] [CrossRef] [PubMed]
  17. Li, X.; Yang, H.; Zhang, D.L.; Li, X.; Yu, H.M.; Shen, Z.Y. Overexpression of Specific Proton Motive Force-Dependent Transporters Facilitate The Export of Surfactin in Bacillus Subtilis. J. Ind. Microbiol. Biotechnol. 2015, 42, 93–103. [Google Scholar] [CrossRef] [PubMed]
  18. Barale, S.S.; Ghane, S.G.; Sonawane, K.D. Purification and Characterization of Antibacterial Surfactin Isoforms Produced by Bacillus velezensis SK. AMB Express 2022, 12, 7–17. [Google Scholar] [CrossRef] [PubMed]
  19. Chen, X.Y.; Zhao, H.Y.; Lu, Z.X. Research Progress in Biosynthesis and Application of Surfactin. J. Nanjing Agric. Univ. 2021, 44, 1024–1034. [Google Scholar]
  20. Valdés-Velasco, L.M.; Favela-Torres, E.; Théatre, A.; Arguelles-Arias, A.; Saucedo-Castañeda, J.G.; Jacques, P. Relationship Between Lipopeptide Biosurfactant and Primary Metabolite Production by Bacillus Strains in Solid-state and Submerged Fermentation. Bioresour. Technol. 2022, 345, 126566. [Google Scholar] [CrossRef]
  21. Gupta, V.; Jain, K.K.; Garg, R.; Malik, A.; Gulati, P.; Bhatnagar, R. Characterization of a Two Component System, Bas1213-1214, Important for Oxidative Stress in Bacillus anthracis. J. Cell Biochem. 2018, 119, 5761–5774. [Google Scholar] [CrossRef]
  22. Guo, Q.G.; Dong, L.H.; Wang, P.P.; Li, S.Z.; Zhao, W.S.; Lu, X.Y.; Zhang, X.Y.; Ma, P. The PhoR/PhoP Two-Component System Regulates Fengycin Production in Bacillus subtilis NCD-2 Under Low-Phosphate Conditions. J. Integr. Agr. 2018, 17, 149–157. [Google Scholar] [CrossRef] [Green Version]
  23. Somya, A.; Vikas, K.S.; Vatika, G.; Jaspreet, K.; Damini, S.; Abhinav, G.; Rakesh, B. Functional Characterization of PhoPR Two Component System and Its Implication in Regulating Phosphate Homeostasis in Bacillus anthracis. BBA-Gen. Subj. 2017, 1861, 2956–2970. [Google Scholar]
  24. Fan, M.; Huang, S.Q.; Li, Y.L.; Zhao, Y.J.; Fan, B. Flagella and Motility-related Properties of Bacillus: A Review. Microbiol. China 2022, 49, 1832–1845. [Google Scholar]
  25. Roggiani, M.; Dubnau, D. ComA, a Phosphorylated Response Regulator Protein of Bacillus subtilis, Binds to The Promoter Region of srfA. J. Bacteriol. 1993, 175, 3182–3187. [Google Scholar] [CrossRef] [PubMed] [Green Version]
  26. Neiditch, M.B.; Capodagli, G.C.; Prehna, G.; Federle, M.J. Genetic and Structural Analyses of RRNPP Intercellular Peptide Signaling of Gram- Positive Bacteria. Annu. Rev. Genet. 2017, 51, 311–333. [Google Scholar] [CrossRef]
  27. Zhang, Z.; Ding, Z.T.; Zhong, J.Y.; Shu, D.; Luo, D.; Yang, J.; Tan, H. Improvement of Iturin A Production in Bacillus subtilis ZK0 by Overexpression of the ComA and SigA Genes. Lett. Appl. Microbiol. 2017, 64, 452–458. [Google Scholar] [CrossRef]
  28. Rasiya, K.T.; Denoj, S. Iturin and Surfactin From the Endophyte Bacillus amyloliquefaciens Strain RKEA3 Exhibits Antagonism Against Staphylococcus aureus. Biocatal. Agric. Biotechnol. 2021, 36, 102125. [Google Scholar]
  29. Rahman, F.B.; Sarkar, B.; Moni, R.; Rahman, M.S. Molecular Genetics of Surfactin and Its Effects on Different Sub-populations of Bacillus subtilis. Biotechnol. Rep. 2021, 32, e00686. [Google Scholar] [CrossRef]
  30. Sun, J.; Liu, Y.; Lin, F.; Lu, Z.; Lu, Y. CodY, ComA, DegU and Spo0A Controlling Lipopeptides Biosynthesis in Bacillus amyloliquefaciens fmb. J. Appl. Microbiol. 2021, 131, 1289–1304. [Google Scholar] [CrossRef]
  31. Damian, N.; Maciej, J.; Marta, B.; Krzysztof, G.; Wojciech, K.; Derek, J.M. Ultrashort Cationic Lipopeptides–Effect of N-Terminal Amino Acid and Fatty Acid Type on Antimicrobial Activity and Hemolysis. Molecules 2020, 25, 257. [Google Scholar]
  32. Tan, W.; Yin, Y.; Wen, J.P. Increasing Fengycin Production by Strengthening the Fatty Acid Synthesis Pathway and Optimizing Fermentation Conditions. Biochem. Eng. J. 2022, 177, 108235. [Google Scholar] [CrossRef]
  33. Lozoya, O.A.; Martinez-Reyes, I.; Wang, T.Y.; Grenet, D.; Bushel, P.; Li, J.Y.; Chandel, N.; Woychik, R.P.; Santos, J.H. Mitochondrial Nicotinamide Adenine Dinucleotide Reduced (NADH) Oxidation Links the Tricarboxylic Acid (TCA) Cycle with Methionine Metabolism and Nuclear DNA Methylation. PLoS Biol. 2018, 16, e2005707. [Google Scholar] [CrossRef] [PubMed] [Green Version]
  34. Ding, L.S.; Guo, W.B.; Chen, X.H. Exogenous Addition of Alkanoic Acids Enhanced Production of Antifungal Lipopeptides in Bacillus amyloliquefaciens Pc3. Appl Microbiol. Biotechnol. 2019, 103, 5367–5377. [Google Scholar] [CrossRef] [PubMed]
  35. Kraas, F.I.; Helmetag, V.; Wittmann, M.; Strieker, M.; Marahiel, M.A. Functional Dissection of Surfactin Synthetase Initiation Module Reveals Insights Into The Mechanism of Lipoinitiation. Chem. Biol. 2010, 17, 872–880. [Google Scholar] [CrossRef] [PubMed] [Green Version]
  36. Yang, R.R.; Lei, S.Z.; Xu, X.G.; Jin, H.; Sun, H.; Zhao, X.X.; Pang, B.; Shi, J.L. Key Elements and Regulation Strategies of NRPSs for Biosynthesis of Lipopeptides by Bacillus. Appl. Microbiol. Biotechnol. 2020, 104, 8077. [Google Scholar] [CrossRef] [PubMed]
  37. Ikhsan, Z.S.; Oksana; Agustien, A.; Syamsuardi; Djamaan, A.; Mustafa, I. The Effect of Nitrogen Sources on Anti-phytopathogenic Activities Fermented Filtrate of Bacillus subtilis AAF2. IOP Conf. Ser. Earth Environ. Sci. 2019, 391, 012005. [Google Scholar] [CrossRef]
  38. Deng, Q.; Wang, W.J.; Sun, L.J.; Wang, Y.L.; Liao, J.M.; Xu, D.F.; Liu, Y.; Ye, R.Y.; Gooneratne, R. A Sensitive Method for Simultaneous Quantitative Determination of Surfactin and Iturin by LC-MS/MS. Anal. Bioanal. Chem. 2017, 409, 179–191. [Google Scholar] [CrossRef]
Figure 1. Biomass (A) and lipopeptide production (B) of B. velezensis CMT-6. a, b represents the difference between different treatment groups. The same letter represents no significant difference, while different letters represent significant difference.
Molecules 27 06822 g001
Figure 2. Volcano plot of differentially expressed genes in Bacillus velezensis CMT-6 at high and low dissolved oxygen concentrations. Each dot represents a gene: red dots represent up-regulated genes; blue dots represent down-regulated genes; and green dots represent differentially expressed genes for which no significant change was observed.
Molecules 27 06822 g002
Figure 3. The GO classification of the differentially expressed genes by Bacillus velezensis CMT-6 at the higher DO concentration (* represents genes with significantly enriched GO terms (p-value ≤ 0.05).
Molecules 27 06822 g003
Figure 4. KEGG classification of the differentially expressed genes of Bacillus velezensis CMT-6. RichFactor refers to the ratio of the number of differentially expressed genes annotated in the pathway term.
Molecules 27 06822 g004
Figure 5. The expression of lipopeptides, surfactin (A) and iturin (B) biosynthesis genes in Bacillus velezensis CMT-6.
Molecules 27 06822 g005
Table 1. The TCA gene expression in Bacillus velezensis CMT-6 at different dissolved oxygen concentrations.
GeneGene ExpressionGene Function
100 rpm200 rpm
pckA43.66129.17phosphoenolpyruvate carboxykinase (ATP)
aceF, pdhC6.103284.60dihydrolipoamide acetyltransferase
pdhA5.752596.92pyruvate dehydrogenase E1 component beta subunit
pdhB2.741931.38
lpd8.724663.19dihydrolipoamide dehydrogenase
pdhD39.0982.20
mdh725.331505.83malate dehydrogenase
gltA511.651315.62citrate synthetase
acnA349.26811.09aconitate hydratase
sdhB, frdB399.27582.47succinate dehydrogenase
sucB438.12783.63dihydrolipoamide succinyltransferase
icD683.051187.85isocitrate dehydrogenase
Table 2. Gene expression of fatty acid biosynthesis in Bacillus velezensis CMT-6 at different dissolved oxygen concentrations.
GeneGene ExpressionGene Function
100 rpm200 rpm
accC52.23169.80acetyl-CoA carboxylase, biotin carboxylase subunit
accB4.7714.25acetyl-CoA carboxylase biotin carboxyl carrier protein
acsL77.05151.61long-chain acyl-CoA synthetase
fadD83.39377.19long-chain acyl-CoA synthetase
Table 3. The gene expression of nitrogen metabolism in Bacillus velezensis CMT-6 at different dissolved oxygen concentrations.
GeneGene ExpressionGene Function
100 rpm200 rpm
kinC79.8747.95sporulation sensor kinase C
kinD90.3933.96sporulation sensor kinase D
narG19.121.83nitrate reductase alpha subunit
narH7.291.27nitrate reductase beta subunit
narI12.363.01nitrate reductase gamma subunit
narJ8.202.72nitrate reductase delta subunit
Publisher’s Note: MDPI stays neutral with regard to jurisdictional claims in published maps and institutional affiliations.

