Article

Deep Learning and Structure-Based Virtual Screening for Drug Discovery against NEK7: A Novel Target for the Treatment of Cancer

by
Mubashir Aziz
1,
Syeda Abida Ejaz
1,*,
Seema Zargar
2,
Naveed Akhtar
3,
Abdullahi Tunde Aborode
4,
Tanveer A. Wani
5,*,
Gaber El-Saber Batiha
6,
Farhan Siddique
7,8,
Mohammed Alqarni
9 and
Ashraf Akintayo Akintola
10
1
Department of Pharmaceutical Chemistry, Faculty of Pharmacy, The Islamia University of Bahawalpur, Bahawalpur 63100, Pakistan
2
Department of Biochemistry, College of Science, King Saud University, P.O. Box 22452, Riyadh 11451, Saudi Arabia
3
Department of Pharmaceutics, Faculty of Pharmacy, The Islamia University of Bahawalpur, Bahawalpur 63100, Pakistan
4
Department of Chemistry, Mississippi State University, Starkville, MS 39759, USA
5
Department of Pharmaceutical Chemistry, College of Pharmacy, King Saud University, P.O. Box 2457, Riyadh 11451, Saudi Arabia
6
Department of Pharmacology and Therapeutics, Faculty of Veterinary Medicine, Damanhour University, Damanhour 22511, AlBeheira, Egypt
7
Laboratory of Organic Electronics, Department of Science and Technology, Linköping University, SE-60174 Norrköping, Sweden
8
Department of Pharmacy, Royal Institute of Medical Sciences (RIMS), Multan 60000, Pakistan
9
Department of Pharmaceutical Chemistry, College of Pharmacy, Taif University, P.O. Box 11099, Taif 21944, Saudi Arabia
10
Department of Biomedical Convergence Science and Technology, Kyungpook National University, Daegu 41566, Korea
*
Authors to whom correspondence should be addressed.
Molecules 2022, 27(13), 4098; https://doi.org/10.3390/molecules27134098
Submission received: 26 May 2022 / Revised: 17 June 2022 / Accepted: 18 June 2022 / Published: 25 June 2022

Abstract

:
NIMA-related kinase7 (NEK7) plays a multifunctional role in cell division and NLRP3 inflammasone activation. A typical expression or any mutation in the genetic makeup of NEK7 leads to the development of cancer malignancies and fatal inflammatory disease, i.e., breast cancer, non-small cell lung cancer, gout, rheumatoid arthritis, and liver cirrhosis. Therefore, NEK7 is a promising target for drug development against various cancer malignancies. The combination of drug repurposing and structure-based virtual screening of large libraries of compounds has dramatically improved the development of anticancer drugs. The current study focused on the virtual screening of 1200 benzene sulphonamide derivatives retrieved from the PubChem database by selecting and docking validation of the crystal structure of NEK7 protein (PDB ID: 2WQN). The compounds library was subjected to virtual screening using Auto Dock Vina. The binding energies of screened compounds were compared to standard Dabrafenib. In particular, compound 762 exhibited excellent binding energy of −42.67 kJ/mol, better than Dabrafenib (−33.89 kJ/mol). Selected drug candidates showed a reactive profile that was comparable to standard Dabrafenib. To characterize the stability of protein–ligand complexes, molecular dynamic simulations were performed, providing insight into the molecular interactions. The NEK7–Dabrafenib complex showed stability throughout the simulated trajectory. In addition, binding affinities, pIC50, and ADMET profiles of drug candidates were predicted using deep learning models. Deep learning models predicted the binding affinity of compound 762 best among all derivatives, which supports the findings of virtual screening. These findings suggest that top hits can serve as potential inhibitors of NEK7. Moreover, it is recommended to explore the inhibitory potential of identified hits compounds through in-vitro and in-vivo approaches.

Graphical Abstract

1. Introduction

Cancer is the most common cause of death, with a high mortality rate worldwide causing 10 million fatalities per year. Cancer is characterized by unregulated cell growth and rapid proliferation [1]. Uncontrolled cell proliferation, aggregation, and an aberrant cell cycle are hallmarks of human cancer. Typically, cell division is controlled by several regulatory factors, including protein kinases [2]. Among all known protein kinases, NIMA (never in mitosis, gene A) related kinase7 (NEK7) plays a multifunctional role [3], including centrosome duplication, intracellular protein transport, mitotic spindle assembly, DNA repair, and cytokinesis [4,5,6,7].
NEK7 is a highly conserved serine/threonine kinase consisting of approximately 302 amino acids [6]. NEK7 is structurally related to NEK6, which shares 85% amino acid sequence identity. However, NEK7 is involved in critical roles that NEK6 cannot take over. NEK7 is centrosome-localized and is known to be highly expressed in a variety of vital organs such as the heart, lung, fat, brain, liver, and spleen [8]. It enhances the centrosome duplication efficiency by promoting the pericentriolar material at the centrosome during the S and G1 phases [3].
In addition, NEK7 also encourages the proliferation of resting cells, which indicates its high-level involvement in various cancer types, including non-small lung cancer, breast cancer, NLRP3-related inflammatory disease, and gastric cancer progression [9]. NEK7 also has a promising role in growth and survival. NEK9 regulates the activation of NEK7 during mitosis, which promotes spindle assembly, centrosome separation, and mitotic division of the cell [7].
Besides promoting the proliferation of various resting cells, NEK7 is also involved in the progression and development of fatal inflammatory diseases, including Alzheimer’s disease, auto-immune disorders, inflammatory bowel disease, gout, and tumor formation [10]. Researchers have reported the involvement of NEK7 in the activation of NLRP3 inflammasome via ROS species formation, lysosomal destabilization, and potassium efflux. Stimulation of inflammatory mediators by NEK7 induces fibrosis and diabetic retinopathy and leads to hepatic carcinoma [10]. In brief, any mutation or atypical expression of NEK7 leads to the development of cellular oncogenesis and may provoke a fatal inflammatory response, causing tumorigenesis of multiple organs. These findings lend testimony to the involvement of NEK7 in the progression and development of numerous deadly diseases.
NEK7 is a promising target for multiple diseases, primarily cancer-related therapy research. NEK7 came into consideration two decades ago [2], but it has yet to be explored as a therapeutic target for preventing and treating NEK7-related diseases. A few medications have recently been developed to target the NEK7-mediated inflammasome pathway, but the mechanism and treatment outcomes are not specific and consistent [2].
Moreover, there is no FDA-approved medication that can selectively inhibit the expression of NEK7. Only Dabrafenib has shown activity against BRAF-mutant melanoma, which expresses more NEK9 [1]. These findings indicate that no published work has reported the selective and potent inhibitors of NEK7. As a result, the current study seeks more specific inhibitors that will provide a beneficial treatment option for NEK7-related cancer malignancies.
The current study focused on structure-based virtual screening (SBVS) of 1200 compounds library and drug repurposing of FDA-approved drug Dabrafenib. Dabrafenib demonstrated inhibitory potential against NEK9 with an IC50 value ranging from 1–9 nM [11,12]. Dabrafenib is comprised of benzene sulphonamide scaffolds. The basic sulphonamide group occurs in numerous biological active compounds [12], including anti-microbial [13], anti-tumor [14], anti-thyroid [15], antibiotics [16], and carbonic anhydrase inhibitors [17].
Clinically, sulphonamide-possessing drugs are used to treat lower urinary tract infections, whereas aromatic or hetero-aromatic sulphonamide derivatives possess a wide range of biological activities, including anti-tumor, anti-rheumatic, anti-microbial, and anti-inflammatory [18,19,20,21]. These findings have provided a strong rationale to retrieve structural analogues of Dabrafenib containing a basic sulphonamide nucleus.
The library of 1200 structural analogues of Dabrafenib was retrieved from the PubChem database and subjected to the in-silico drug discovery process. The discovery of a new anti-cancer agent is an extensive and laborious process. Thus, computer-aided drug design (CADD) [22] methods could serve as an alternative drug development strategy [23]. Among in-silico approaches, drug repurposing is an advanced tool for revisiting the activities of already approved drugs [24], which can save time and money [25].
The current study was focused to revisit the activity of Dabrafenib against NEK7 protein [26]. In addition, structure-based virtual screening (SBVS) [26] of 1200 structural analogues of Dabrafenib was carried out using molecular docking [27] and deep learning models [28]. SBVS is an advanced technology for the identification of potential hits with significant pharmacological properties against multiple molecular targets. Several robust docking programs are available for docking purposes in commercial and academic settings. In the present study, the Auto Dock Vina was used for virtual screening [29,30]. Moreover, density functional theory studies were conducted to explore the chemical reactivity profile of top-ranked analogues obtained through virtual screening. The structural geometry optimization and frequency calculations were performed. In addition, frontier molecular orbital (FMO) analysis and global reactivity descriptors were also determined. The efficacy of any drug is determined by its interaction with targeted biomolecules. Deep learning algorithms [31] were used for prediction of binding affinity and pIC50 values of top hits obtained via virtual screening. Predicted values of top hits were compared to in-vitro activity of Dabrafenib.
Furthermore, in-silico ADMET properties were also determined using a message-passing neural network (MPNN). The MPNN model is widely used for prediction of molecular properties such as blood brain barriers, human intestinal absorption, and solubility profiles [32]. The molecular docking approach only provides a static view of the molecular interactions of the complex. Still, to determine the stability of the protein–ligand complex, molecular dynamic simulations (MD simulations) have been performed to determine the stability, which provide significant insight into the molecular interactions of top-ranked complexes under accelerated conditions. Top hits obtained through structure based virtual screening a shown in Figure 1. All hits shared the same pharmacophore with standard Dabrafenib.
This is the first comprehensive computational study for the identification of selective inhibitors of the NEK7 protein. The current study has utilized the latest computational approaches, suggesting identified hits as a new strategy for treatment of NEK7-associated malignancies. Findings of the current study suggest the exploration of the inhibiting potential of these hits at the molecular level using in-vitro and in-vivo experimental techniques.

2. Experimental

2.1. Computational Studies

2.1.1. Density Functional Theory Calculation

The ground state electronic energy is ascertained by electron density of the compound [33]. The electron density defines the number of electrons, nuclear charge and position of the nuclei in a compound [34]. Variation in electron density yields different ground state energy, and both of these properties are related by density functional theory methods [35]. DFT methods are based on suggestions that electron density can be accurately assumed by the set of specific orbitals using an exchange correlation such as B3LYP [36]. Based on their computational accuracy, DFT methods are a reliable and efficient approach for correct estimation of electronic properties of the compound [37]. The structural geometries of selected compounds were optimized through DFT studies. DFT calculations were executed on Guassian09 program [38] using B3LYPfunctional correlation and 6-31G* as a basis set [39]. It is a compelling theory to calculate the electronic structure of atoms and molecules. Gauss View 6 was used for visualization of output files [40]. In addition, DFT/B3LYP method was employed for generation of Frontier molecular orbitals (FMOs), electrostatic surface potential map and global and local reactivity of descriptors. After completion of calculations, the output log file was visualized in Gauss View 6 for determination of optimization energy, dipole moment, frequency and polarizability [41].

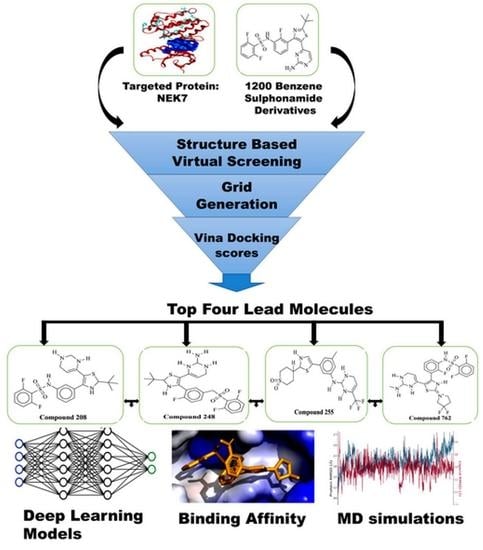
2.1.2. Structure Based Virtual Screening (SBVS)

Drug candidates were retrieved from the PubChem database (https://pubchem.ncbi.nlm.nih.gov/) (accessed on 28 April 2022) to create the ligand library. There were 1200 structural analogues of Dabrafenib in the library. PyRx software was used to prepare the compounds library, which was converted to pdbqt format for virtual screening using Auto Dock Vina. The MMFF94 force field was used to minimize the energy of ligands. The crystallographic structure of the targeted protein was retrieved from Protein Data Bank (https://www.rcsb.org/) (accessed on 1 May 2022) (PDB ID: 2WQN). After that, MGL tools were used to prepare macromolecule, which included removing Het atoms and water molecules, and the addition of polar hydrogen. The protein was examined for any missing residues. Furthermore, Kollman’s charges were used to neutralize protein, and Gasteiger charges were calculated. Finally, for virtual screening of the compound library using Auto Dock Vina, a 1-angstrom grid box was built centered on the crystalline structure of protein at the point of co-crystal ligand (ADP) binding-site coordinates. The central xyz axis of the grid box was set to 80 × 80 × 80. Virtual screening was carried out after the targeted protein was prepared utilizing Auto Dock Vina’s script-based technique. The exhaustiveness was set to 5 and the number of nodes was set to 20. The virtual screening was repeated twice to ensure the accuracy of docking results. In addition, docking protocol was validated by re-docking the co-crystal ligand with targeted protein. A RMSD value of less than 2 angstrom indicates the reliability of the docking pose. After completion of virtual screening, the output findings of the virtual screening module were analyzed and docking scores of drug candidates were compared to standard Dabrafenib. Only four compounds were found to have higher docking scores than standard Dabrafenib. The top hits were subjected to further analysis using deep learning algorithms. Deep learning models were used to predict drug affinity and determine the stability of protein–ligand complexes.

2.1.3. Molecular Dynamics Simulation

The molecular docking experiment provided an initial static protein–ligand complex for molecular dynamic studies. Desmond, a package from Schrödinger LLC [42], was used to run molecular dynamic simulation for 100 ns. Molecular docking studies provide insight into the binding state of ligand with protein. Docking produces the static orientation of a ligand molecule inside active pockets of targeted protein [43], and MD simulations measure the average displacement of atoms with respect to a reference. MD simulations provide information about the stability of the best complex [44,45].
Maestro or Protein Preparation Wizard were employed for processing of the protein–ligand complex. The system was prepared in the system builder tool of the Desmond package. The system was solvated by Monte-Carlo equilibration, TIP3P solvent model extended 10.0 angstrom in each direction. The counter NaCl ions at a concentration of 0.15 M were added to neutralize the system. The optimized potential for liquid simulation (OPLS 2005) [46] was used as a forcefield to generate parameter files [46]. The pressure control was conducted through the Martyna−Tuckerman−Klein chain coupling scheme with a coupling constant of 2 ps [47], whereas the Noose–Hoover chain coupling scheme was used for temperature control [48]. The energy minimization was performed for 20,000 steps in order to remove any intra-molecular steric clashes. Initially, the system was equilibrated (NVT ensemble) for 1 ns, and afterwards the NPT ensemble was performed for an additional 1 ns at 300 K temperature and 1 bar pressure. Finally, production run was performed for 100 ns under periodic boundaries conditions. The Particle Mesh Ewald (PME) method [49] was used to determine electrostatic interactions [50]. The Verlet/Leapfrog algorithm was used for numerical integration. A time step of 1 fs was used for minimization and a time step of 2 fs was used for molecular dynamic simulation [51]. Thermal MM-GBSA.py script [52,53] was used to calculate the ligand strain and ligand-binding free energy for docked conformations over a 100 ns period [54].

2.1.4. Prediction of Binding Affinities, pIC50 and ADMET Properties Using Deep Learning Models

Dabrafenib, which has been approved by the FDA, has been found to be effective against BRAF-mutant melanoma with a high level of NEK9 protein expression. Dabrafenib’s inhibitory concentration was in the nanomolar range, 1–9 nM [1]. The drug’s effectiveness is largely determined by its binding affinity (IC50) and ADMET profile. Therefore, we have employed deep learning models to predict IC50, pIC50, and ADMET properties of top hits acquired through virtual screening in order to provide a direct comparison of binding affinities of top hits with standard Dabrafenib. Predicting the binding affinity and ADMET characteristics in silico, rather than using an experimental method, is a promising alternative. Deep learning (DP) models were used to predict drug target interactions (DTI) in the current work, which were formulated on encoder and decoder architectures. A DL model takes the SMILES string and amino acid sequence of the targeted protein as input and uses over 17 state-of-the-art DP learning techniques to predict drug efficacy indicators (Figure 2). The MPNN-CNN deep learning algorithms were used for affinity prediction in this work, while the MPNN model was used for ADMET predictions [32].

3. Results and Discussion

The 1200-compound library was retrieved from the PubChem database and subjected to SBVS and the FDA drug Dabrafenib. Dabrafenib was maintained as the standard drug to which docking scores of 1200 compounds were compared. It was observed that only four combinations have better docking scores and binding affinity than standard Dabrafenib. These four compounds were considered top hits and subjected to further analysis, including geometry optimization and FMO analysis via density functional theory studies. Moreover, IC50, pIC50, and ADMET properties of the top four compounds were also predicted using deep learning models.

3.1. Density Functional Theory Studies (DFTs)

Quickly calculating physicochemical properties of atoms, bonds and molecules is necessary to process thousands or millions of structures in data mining investigations. Calculations in quantum chemistry based on ab initio and density functional theory (DFT) yield increasingly reliable assessments of many characteristics [55]. The B3LYP hybrid functional is likely the most popular DFT functional, and its cost-effectiveness has been widely acknowledged. Nonetheless, DFT computations are still too computationally expensive to be conducted on single workstations or tiny clusters in less than a few hours [56].

3.1.1. Optimized Geometries

In the present study, geometries of FDA-approved drug Dabrafenib and top hits were completely optimized using the DFT/B3LYP method and 6-31G* as a basis set. No negative frequencies were obtained after the geometry optimization, which demonstrates that current geometries are true local minima. Optimized structures of drug candidates are presented in Figure 3.
The compound 762 showed high value for polarizability and dipole moment, which indicates its high polarity and chemical reactivity. Optimization and polarizability values of top hits and Dabrafenib are given in Table 1.

3.1.2. Frontier Molecular Orbital (FMOs)

The way a molecule interacts with other species is determined by its frontier molecular orbitals. The highest occupied molecular orbital, or HOMO, is the outermost orbital-bearing electrons, and it primarily works as an electron donor. The lowest unoccupied molecular orbital, or LUMO, is the innermost orbital with free electron acceptor sites. The ionization potential ought to be proportional to the HOMO energy, while the LUMO energy should be proportional to the electron affinity (Table 2).
The energy gap is the difference in energy between the HOMO and LUMO orbitals, and it is the most key variable in predicting the stability of a molecule. The HOMO–LUMO energy gap is used to evaluate the chemical reactivity and kinetic stability of the molecule. A soft molecule is a structure with a narrow gap that has a higher degree of polarization. As a measure of electron conductivity, the energy difference between HOMO and LUMO was recently employed to illustrate the bioactivity of intramolecular charge transfer (ICT). The stronger the chemical reactivity and the less stable the kinetics, the smaller the gap. The compound 762 has the narrowest energy gap at 0.127 eV among all the compounds. Compound 248 has a greater energy gap, measuring 0.152 eV. Thus, it shows compound 762 is chemically more reactive than all other compounds, which are comparatively the stable ones. In addition, the electron density of HOMO orbitals for Dabrafenib was localized over morpholine and piperdinyl rings, whereas electron density of LUMO is localized to the carbonitrile and benzocarbazole moiety of the drug. FMOs orbitals are shown in Figure 4.

3.1.3. Global and Local Reactivity Descriptors

The HOMO and LUMO frontier orbitals are used to predict chemical reactivity. The HOMO orbital energy of a compound is significantly correlated with its vulnerability to electrophilic attack and ionization potential. A compound’s LUMO orbital energy is a reliable predictor of electron affinity and nucleophilic attack. The energy of LUMO is proportional to its electron affinity, indicating that it is susceptible to nucleophile attack. The frontier molecular orbital energies are also related to the hard and soft characteristics of a molecule. Hard nucleophiles have a low HOMO, whereas soft nucleophiles have a high HOMO. Similarly, hard electrophiles have a high LUMO energy, whereas soft electrophiles have a low LUMO energy. According to the frontier theory of electron reactivity, the chemical reaction occurs at the point where the HOMO and LUMO have the most overlap. All reactions require the HOMO density of the donor molecule, while all reactions require the LUMO density of the acceptor molecule. The frontier orbital densities of individual atoms can be used to quantify their reactivity inside a molecule. Chemical behavior is frequently predicted using electronegativity and hardness. Compound 248 presented greater energy gaps, indicating it to be the tougher among all compounds. Compound 208 demonstrated the greatest electrophilicity index value of 0.207 eV. This indicates that compound 208 is an excellent electrophile among all the other compounds. The HOMO–LUMO energy gap for Dabrafenib was found to be 0.159 eV. Dabrafenib showed a softness value of 6 (Table 3). The Koopman’s theorem was used to express ionization energy and electron affinity of drug candidates.
I = −EHOMO: A = −ELUMO
We evaluated the following parameters by using their respective formulas: Hardness: η = 1/2(ELUMO − EHOMO); Softness: S = 1/2η; Electronegativity: χ = −1/2(ELUMO + EHOMO); Chemical potential: µ = −χ; Electrophilicity index: ω = µ/2η.

3.2. Structure Based Virtual Screening and Predicted Binding Affinities

Initially, the Molecular docking methodology was validated by redocking a co-crystal ligand with targeted protein using the same coordinates. RMSD values of less than 2 angstrom were obtained, which demonstrate the successful validation of the docking protocol and can be used to describe ligand poses with specificity and accuracy. Afterward, virtual screening was conducted with 1200 ligands library and Dabrafenib. The coordinates of co-crystal ligand were used to dock the ligand library and Dabrafenib. Out of 1200 drug candidates, only four drug candidates showed excellent binding energies that were even better than Dabrafenib. The binding energies of top hits and Dabrafenib are tabulated in Table 4. In particular, compound 762 showed a maximum binding energy of −42.67 kJ/mol and exhibited strong binding affinity with NEK7 protein when subjected to the DL prediction model.
Among the four top hits, compound 208 exhibited promising hydrophobic and hydrophilic interactions. The amino acid residues involved in important molecular interactions were as follows: ASP115, ARG121, GLY117, ASP179, PHE168, ILE195, ALA114, ALA61, ILE40, and ASP118. It was observed that two hydrogen bonds were involved in stabilizing the protein–ligand complex. One hydrogen bond was observed with ASP118 with a bond length of 2.97 angstrom, while the second hydrogen bond was observed with GLY117 having a bond length of 3.14 angstrom. Important residues of the active site were engaged in hydrophobic interactions, including van der Waals interactions, pi-alkyl and alkyl–alkyl interactions. The docking score of compound 208 was found to be −33.47 kJ/mol. Similarly, compound 248 exhibited stronger molecular interactions with the following amino acid residues: ARG121, ASP118, ALA165, LYS63, ASN166, ASP179, PHE168, LEU111, VAL48, ALA116, ASP115, and GLY117. It was discovered that important amino acid residues of the NEK7 protein’s DLG/DFG motifs were involved in interactions. Furthermore, the amino acids LEU111 and LYS163 interacted via hydrophobic bonds. Two important hydrogen bonds were contributing toward the stability of conformations. One hydrogen bond engaged GLY117 residues with a bond length of 2.2 angstroms. Another hydrogen bond was engaging ASN166 amino acid with a bond length of 3.34 angstroms. Among hydrophobic interactions, van der Waals interactions played a pivotal role in stabilizing the complex. The docking score of the compound 248 was −35.56 kJ/mol. The putative 2D and 3D binding modes of compounds 208 and 248 are shown in Figure 5.
Another important top hit was compound 255, which exhibited potent molecular interactions with amino acid residues of the active site. It was the second-best drug candidate obtained via virtual screening. Amino acid residues involved in bonding and nonbonding interactions were as follows: PHE45, SER46, LYS63, ALA114, ASP115, GLU112, PHE168, ASP179, VAL48, GLY43, and GLN44. It was observed that two important hydrogen bonds with short bond lengths were contributing toward stabilizing the complex. One hydrogen bond occurs between the electronegative oxygen atom of the compound 255 and the SER46 residue of the targeted protein. Moreover, the second hydrogen bond was engaged in GLY117 with a bond length of 3.16 angstroms. As shown in Figure 5, amino acid residues from the active site were involved in hydrophobic interactions with compound 255.
Now referring to the top hit obtained through SBVS, namely compound 762, It has shown excellent docking scores and demonstrated significant binding affinity obtained through deep learning models. It was observed that compound 762 was engaged in three hydrogen bonds of moderate-to-strong strength. One hydrogen bond occurred between the pentazole ring of the compound 762 and the electronegative oxygen atom of TYR201. The bond length of interaction was 3.08 angstroms. Similarly, the second hydrogen bond engaged SER234 residues with a surprisingly smaller bond length of 2.92 angstroms. These interactions lend enough testimony to stronger molecular interactions and more stabilized protein–ligand complexes. Furthermore, the third and last hydrogen bond occurred between TYR237 and compound 762 with a bond length of 3.02 angstroms. All three amino acid residues involved in hydrogen bonding belong to the activation loop of the NEK7 protein. The remaining active site residues, ILE123, GLU228, PHE236, MET203, PRO200, LEU246 and LEU232, engaged in hydrophobic interactions with compound 762. The docking score and binding affinity (IC50) were predicted to be best among all top hits, i.e., −42.67 kJ/mol and 61.74 nM, respectively. Compound 762 could be a promising drug candidate for the treatment of NEK7-associated malignancies. The binding interactions of compounds 255 and 762 are shown in Figure 6.
The bonding and non-bonding interactions of standard Dabrafenib was involving important amino acid residues of NEK7 activation loop. ARG50, LYS38, ALA165, ILE40, GLY117, ASP115, PHE168, LEU111, LEU112, ALA114, LEU113, ALA161, ASP179, and ILE95 were the amino acid residues implicated in molecular interactions with Dabrafenib. Dabrafenib exhibited significant molecular interactions, which contributed towards complex binding affinity. The strong interactions were observed with targeted protein and sulphonamide rings. The sulphonamide ring was implicated in several important stabilizing contacts, including conventional hydrogen bonding with ASP115 of the activation loop, Pi-cation interaction with ARG50, and interactions with ILE40 and ASP115 by two fluorine atoms connected to the ring. PHE168 formed pi-cation and pi-pi T-shaped contacts with the butylthiazole ring, whereas the pyrimidine ring produced conventional hydrogen bonds with GLU112 and ASP179, a carbon–hydrogen connection with ALA114, and a pi-alkyl interaction with ALA161. Due to important chemical interactions, Dabrafenib has a good binding energy of −33.89 kJ/mol. van der Walls interactions are essential hydrophobic interactions that have been observed with the amino acids LYS38, ALA165, GLY117, LEU111, LEU113, and ILE95. Figure 7 depicts the probable binding mode of Dabrafenib with NEK7.

3.3. Electrostatic Surface Potential Map

Investigating the electrostatic surface potential (ESP) map is a key activity in drug design as it determines the chemical reactivity of the compound and its ability to produce important molecular interactions. It is an effective way to visualize the molecular reactivity and evaluate the nature of ligand-binding with a targeted protein. The ESP map is depicted by different colored regions depending upon the electronegativity of the compound. The highly electronegative part is represented by the color red, whereas the electropositive part is represented by the color blue. The QM calculations were performed using DFTs at the B3LYP/6-31G* level of theory. Figure 8 depicts the ESP potential and the nature of ligand-binding with the targeted protein. In this study, the contribution of the electronegative oxygen atom in all interactions is indicated by the color red, whereas the contribution of the nitrogen atom is provided in the color blue. Considering the electrostatic surface potential map, the contribution of oxygen atoms toward interaction potential is higher than that of nitrogen atoms. It was observed that in the case of compound 208, the electronegative oxygen atom was acting as a hydrogen acceptor and was producing strong hydrogen bonding with GLY117. Similarly, in compound 248, 255 and 762, electronegative oxygen atoms were involved in stronger intermolecular interactions. In contrast, nitrogen atom was involved in hydrogen bonding by donating the hydrogen bond for example, in case of compound 208, nitrogen was donating hydrogen bond to ASP118 residue. In addition, the docked conformation of ligands on the protein surface is also represented by different colored regions (Figure 8). The red surface indicates the hydrogen bond acceptor region, while the blue surface indicates the hydrogen bond donor locations. Whereas the grey color areas indicate the hydrophobic interactions, including van der Waals interactions. The red-colored surface area of protein is buried by nitrogen atoms as they act as proton donors, whereas the blue-colored protein surface is buried by electronegative atoms such as oxygen, fluorine and chlorine, which acts as a hydrogen bond acceptor. It can be observed that the grey surface area of protein is mostly involved in hydrophobic interactions, and these regions are buried by alkyl, phenyl rings and other hydrophobic groups present in all compounds.

3.4. Buried Surface Area (BSA)

Molecular interactions are the critical factors in determining the stability of protein–ligand complexes. Molecular interactions existing between protein–ligand complexes can be modelled by taking into account the physicochemical properties and complementarity of the shape of the binding interface. A useful method for determining the complementarity of the shape and extent of molecular interactions is the estimation of the buried surface area (BSA) of a protein–ligand complex. In the current study, the BSA of best complexes was calculated using a new Shrake–Ruply algorithm-based tool (dr_sasa) [57] used for calculating the solvent accessible surface area (SASA), buried surface area (BSA), and contact surface area (CSA). All four top compounds (208, 248, 255, and 762) were subjected to the calculation of BSA. It was observed that the targeted NEK7 protein was buried up to 80% and 70% by compounds 208 and 248, respectively. In particular, amino acid residues ILE40 and PHE168 were strongly buried by compound 208 (49 Å2). Compound 248, on the other hand, was strongly engaging the ARG121 and PHE168 with BSA of 39 Å2 and 41.3 Å2 respectively. The detailed buried surface area of both compounds is shown in Figure 9.
In terms of compounds 255 and 762, it was observed that both compounds significantly engaged the amino acid residues of the target protein. Compound 255, in particular, was burying the surface area of the NEK7 protein by up to 360 Å2. The BSA of compound 255 with VAL48, LYS63, ALA114, and PHE168 was 168, 212, 187, and 351 Å2, respectively, which was the best among all top hits. These values demonstrate the strong nature of molecular interactions existing between the target protein and compound 255. In the case of compound 762, important amino acid residues were buried by compound 762. In particular, TYR201, TYR237, and MET241 were significantly buried by compound 762 with BSA of 64, 72, and 25.6 Å2. Moreover, it was worth noticing that the major contributing atoms were oxygen, nitrogen, fluorine, sulphur, and chlorine, which were involved in increasing the contact surface area of compounds with a targeted protein. The BSA of compounds 255 and 762 is shown in Figure 10.

3.5. Molecular Dynamic Simulation

The molecular docking technique is comparatively rapid and imprecise. The docking deficiencies and flexibility of protein may interfere with protein–ligand complex. However, molecular dynamic simulations are computationally expensive and time-consuming but provide reliable and accurate illustration of protein displacement. Considering these facts, molecular dynamic simulations were undertaken using Desmond software package [58,59]. The root-mean-square deviation (RMSD) patterns provide significant insight into average change in displacement of atoms with respect to a frame. The RMSD trajectory provides information about the structural configuration of protein. It is computed for each frame of the trajectory. In order to gain insight into the structure of a protein, it is important to monitor the protein’s RMSD. Plotting the RMSD of the ligand is possible once the protein–ligand complex is aligned on a reference protein backbone and the RMSD of the ligand heavy atoms is measured. It is likely that the ligand has diffused from its initial binding site if measured values exceed the protein’s RMSD by a substantial margin. Molecular dynamic trajectory analysis is also used to determine the root-mean-square fluctuation of the targeted protein.

3.5.1. RMSD Analysis of Protein and Protein–Ligand Complexes

The RMSD patterns for C-alpha atoms of NEK7 protein were estimated in order to determine the effect of the bounded drug on the conformational stability of NEK7 protein. Figure 11 is displaying the progression of RMSD values for the C-alpha atoms of NEK7 as a function of time. The 2wqn–Dabrafenib complex reaches the equilibrium after around 5 nanoseconds of simulation, and although side chain residues displayed fluctuations, they remained in the permissible range of 1–4 angstroms, which can be considered insignificant [60]. The NEK7–Dabrafenib complex showed slight fluctuations after 50 ns, which again became stable after 60 ns of simulation and remained equilibrated throughout the simulated trajectory. RMSD fluctuation was observed from 70 to 90 ns, which is due to the decrease in the number of contacts during this time, but after 90 ns, the number of contacts with amino acid residues increased and RMSD pattern became stable. It demonstrate the existence of stable molecular interactions. After being equilibrated, NEK7 RMSD values fluctuated within 2 angstrom. After 80 ns, protein RMSD showed slight fluctuation up to 2.5 angstrom and dropped again after 95. The average RMSD value for the protein–ligand complex and NEK7 protein is tabulated in Table 5.
These findings suggest that the ligands stayed firmly bound to the receptor throughout the simulation period. Moreover, small RMSD patterns indicate the fewer structural re-arrangements and lesser conformational changes within binding site residues [61].
It is beneficial to identify local differences in the protein chain by using the root-mean-square fluctuation (RMSF). Figure 12 peaks on the RMSF graph represent the regions of the protein that change the most during the simulation. The average RMSF for the NEK7 backbone was 0.87 angstrom, indicating the fewer structural rearrangements (Table 5). The N- and C-terminal ends of proteins are more likely to undergo alteration than any other portion of the protein. In the range of amino acids from 180 to 220, the RMSF value fluctuated, as can be seen in the RMSF graph. These residues are found in the C-terminal lobe. The protein’s structure, such as its alpha and beta helices and strands, tends to be stiffer and less variable than its unstructured component. According to MD trajectories, the residues with the highest peaks are found in loop areas or the N- and C-terminal regions. Binding site residues with low RMSF values imply a stable ligand–protein interaction.
The contact profiles of NEK7–Dabrafenib were computed from simulated trajectories, as shown in Figure 13. FDA-approved drug Dabrafenib interacted with ILE40, LYS163 and ARG121 through Water Bridge and hydrogen bonding. The amino acid residues, ILE40, LYS163, and ARG42, were involved in H-bonding. During MD simulations, 12 hydrogen bonds were found to be dominant with significant occupancy. Details of hydrogen bonding is given in Table 6.
The hydrogen bond with ALA114 existed for more than 25% of simulation time. Hydrophobic interactions existed between VAL48, LEU113, VAL48, and PHE168. These molecular interactions contributed towards stabilizing the protein–ligand complex.

3.5.2. Radius of Gyration (Rg) and Solvent-Accessible Surface Area of Protein (SASA)

Radius of gyration (Rg) is measure of protein compactness, stability, integrity and foldness of protein backbone. The Rg trajectory for NEK7 is depicted in Figure 14. Trajectory analysis for the radius of gyration revealed that protein retained compactness throughout the simulated trajectory, and only slight fluctuations were observed around 30 ns, which stabilized after a short period of time.
Solvent-accessible surface area (SASA) is the area of protein that is accessible by the solvent. The higher the value for SASA, the lower the stability of the protein. In the current study, residue wise SASA was calculated and ranged between 180 to 350 Å2, which is quite acceptable. The average SASA value was computed to be 282.72 Å2 (Table 5). The residue wise SASA of targeted protein is shown in Figure 15.

3.5.3. Principle Component Analysis (PCA)

It is an essential multivariate statistical technique used to describe the protein dynamics in a spatial scales. It is a linear relationship that extracts essential features of protein using covariance and/or correlation matrices. These matrices are derived from the atomic coordinate that represents the accessible degree of freedom (DOF) of the protein in a simulated trajectory. In the current study, Pearson’s cross-correlation matrix was employed as it can normalize the large protein variables and prevent high atomic variations that can skew the results. In addition, eigenvectors with a specific variance value also play an important role in characterizing the motion of protein in spatial scales. In the current study, essential dynamics of protein were calculated by applying PCA analysis to the protein trajectory. It was observed that different variables were forming tight clusters with narrow angles, which indicates that they were correlated with vectors (PCs) [62]. PCs are the vectors that are used to describe protein motion with respect to variables. Two PCs are used in the current study to characterize the protein motion. In Figure 16, it can be observed that PC1 and PC2 are clearly indicating the behavior of various variables. Distribution on the scatter plot indicates the protein components are tightly clustered with small angles.
Correlation matrices are also the correlation coefficients between variables and PCs. In Pearson’s cross-correlation, the percent of variance in a protein variable is explained by PCs. Figure 17 is depicting the Pearson correlation graph for NEK7 variables.

3.5.4. MM-GBSA Energy Calculations

Molecular docking is a robust technique for determining the binding orientation of a protein–ligand complex. However, it is still lacking in its ability to correctly identify the binding affinities of docked ligands. In order to determine correct binding energies of docked conformations, MM-GBSA energy calculations were performed, which are an efficient and reliable method for the determination of binding free energies. The MM-GBSA method provides free energy calculations by taking into account all hydrophobic, hydrophilic and electrostatic interactions [63]. After energy calculations, values obtained were more negative and showed stronger binding affinities, as compared to the docking scores obtained from molecular docking. The following equation was used to calculate binding free energy [64];
ΔGbind = ΔE mm + ΔG sol + ΔG SA
The MM-GBSA energies for the protein–ligand complex was determined through the Thermal_mmgbsa script of Schrodinger. MM-GBSA energies are tabulated in Table 7.

3.5.5. MM-PBSA Energy Calculations

In MMPBSA energy analysis, the free binding energies of protein, ligand and protein–ligand complex are estimated by following equation;
G = Ebnd + Eel + EvdW + Gpol +Gnp − TS
where, Ebnd I refers to bond energy, Eel refers to electrostatic energy and EvdW represents van der Waals interactions. In the current study, Poisson–Boltzmann calculations were performed using the internal PBSA solver in mmpbsa_py_energy. All units are represented in kcal/mol. MM-PBSA energy analysis is given in Table 8.

3.6. ADMET Profile

In-silico ADMET properties of top-ranked hits were determined by deep learning models; more than 17 models were employed at the backend, which provided predictions on the ADME profile of each hit. It is an important part in drug development that can identify the desired pharmacological properties of compounds. In the current study, the message passing neural network (MPNN) is employed for the determination of ADMET properties. It was observed that compound 762 showed the lowest clinical toxicity value of 0.28%. The ADMET profile of top hits is tabulated in Table 9.

4. Conclusions

In the current study, structure-based virtual screening of a 1200-compound library and Dabrafenib was carried out using Auto Dock Vina. These compounds are in the early stages of drug development, and the in-silico approach used in this study was contributing toward investigating the inhibiting potential of these compounds through molecular docking, DFTs, and MD simulation, as well as determining the drug-like properties of these compounds through deep learning models. The FDA-approved drug, Dabrafenib, was considered as a standard drug to which in-silico findings could be compared. SBVS findings discovered four important hits having better binding energies as compared to standard Dabrafenib. In addition, the chemical reactivity profiles of top hits were determined via DFT studies. Findings from DFT studies revealed the reactive nature of the compounds. Moreover, the current study has utilized deep learning models for prediction of binding affinity, pIC50, and ADMET properties. It was observed that compound 762 showed good binding affinity and demonstrated a promising ADMET profile. Moreover, molecular dynamics simulations were performed to determine the stability of the protein–ligand complex under accelerated conditions. It was observed that the ligand remained significantly attached to the protein-activation loop, suggesting potential inhibiting activity of the compound. In short, the findings of the current study identify top hits that could prove an effective treatment strategy for NEK7-associated cancer malignancies. These findings will assist researchers to develop newer leads without consuming much time and money. Further experimental studies are also recommended for future prospects.

Author Contributions

Conceptualization, M.A. (Mubashir Aziz), S.A.E. and T.A.W.; methodology, M.A. (Mubashir Aziz), F.S., M.A. (Mohammed Alqarni) and A.A.A.; software, G.E.-S.B.; validation, M.A. (Mubashir Aziz) and S.A.E.; formal analysis, S.Z. and G.E.-S.B.; investigation, M.A. (Mubashir Aziz), A.T.A. and T.A.W.; resources, M.A. (Mubashir Aziz), G.E.-S.B., M.A. (Mohammed Alqarni) and A.A.A.; data curation, F.S.; writing—original draft preparation, M.A. (Mubashir Aziz) and S.A.E.; writing—review and editing, M.A. (Mubashir Aziz), S.A.E., N.A. and T.A.W.; visualization, S.A.E.; supervision, S.A.E.; project administration, S.A.E.; funding acquisition, T.A.W. and S.Z. All authors have read and agreed to the published version of the manuscript.

Funding

This research was funded by King Saud University, Riyadh Saudi Arabia project number (RSP-2021/357).

Institutional Review Board Statement

Not Applicable.

Informed Consent Statement

Not Applicable.

Data Availability Statement

Not Applicable.

Acknowledgments

The authors extend their appreciation to researchers supporting project number (RSP-2021/357), King Saud University, Riyadh Saudi Arabia for funding this research.

Conflicts of Interest

The authors declare no conflict of interest.

Sample Availability

Not Applicable.

References

  1. Phadke, M.; Remsing Rix, L.L.; Smalley, I.; Bryant, A.T.; Luo, Y.; Lawrence, H.R.; Schaible, B.J.; Chen, Y.A.; Rix, U.; Smalley, K.S. Dabrafenib inhibits the growth of BRAF-WT cancers through CDK16 and NEK9 inhibition. Mol. Oncol. 2018, 12, 74–88. [Google Scholar] [CrossRef] [PubMed] [Green Version]
  2. Sun, Z.; Gong, W.; Zhang, Y.; Jia, Z. Physiological and pathological roles of mammalian NEK7. Front. Physiol. 2020, 11, 1608. [Google Scholar] [CrossRef] [PubMed]
  3. Loncarek, J.; Hergert, P.; Magidson, V.; Khodjakov, A. Control of daughter centriole formation by the pericentriolar material. Nat. Cell Biol. 2008, 10, 322–328. [Google Scholar] [CrossRef] [PubMed]
  4. Tan, R.; Nakajima, S.; Wang, Q.; Sun, H.; Xue, J.; Wu, J.; Hellwig, S.; Zeng, X.; Yates, N.A.; Smithgall, T.E.; et al. Nek7 protects telomeres from oxidative DNA damage by phosphorylation and stabilization of TRF1. Mol. Cell 2017, 65, 818–831.e5. [Google Scholar] [CrossRef] [Green Version]
  5. Haq, T.; Richards, M.W.; Burgess, S.G.; Gallego, P.; Yeoh, S.; O’Regan, L.; Reverter, D.; Roig, J.; Fry, A.M.; Bayliss, R. Mechanistic basis of Nek7 activation through Nek9 binding and induced dimerization. Nat. Commun. 2015, 6, 8771. [Google Scholar] [CrossRef] [Green Version]
  6. Fry, M.A.; Bayliss, R.; Roig, J. Mitotic regulation by NEK kinase networks. Front. Cell Dev. Biol. 2017, 5, 102. [Google Scholar] [CrossRef] [Green Version]
  7. Hauwermeiren, V.F.; Lamkanfi, M. The NEK-sus of the NLRP3 inflammasome. Nat. Immunol. 2016, 17, 223–224. [Google Scholar] [CrossRef]
  8. Xu, J.; Lu, L.; Li, L. NEK7: A novel promising therapy target for NLRP3-related inflammatory diseases. Acta Biochim. Biophys. Sin. 2016, 48, 966–968. [Google Scholar] [CrossRef] [Green Version]
  9. Gupta, A.; Tsuchiya, Y.; Ohta, M.; Shiratsuchi, G.; Kitagawa, D. NEK7 is required for G1 progression and procentriole formation. Mol. Biol. Cell 2017, 28, 2123–2134. [Google Scholar] [CrossRef]
  10. Liu, G.; Chen, X.; Wang, Q.; Yuan, L. NEK7: A potential therapy target for NLRP3-related diseases. BioScience Trends 2020, 14, 74–82. [Google Scholar] [CrossRef] [Green Version]
  11. García-Galán, M.J.; Díaz-Cruz, M.S.; Barceló, D. Identification and determination of metabolites and degradation products of sulfonamide antibiotics. Trends Anal. Chem. 2008, 27, 1008–1022. [Google Scholar] [CrossRef]
  12. Supuran, C.T.; Casini, A.; Scozzafava, A.J.M. Protease inhibitors of the sulfonamide type: Anticancer, antiinflammatory, and antiviral agents. Med. Res. Rev. 2003, 23, 535–558. [Google Scholar] [CrossRef]
  13. Scozzafava, A.; Owa, T.; Mastrolorenzo, A.; Supuran, C.T. Anticancer and antiviral sulfonamides. Curr. Med. Chem. 2003, 10, 925–953. [Google Scholar] [CrossRef]
  14. Reddy, N.S.; Mallireddigari, M.R.; Cosenza, S.; Gumireddy, K.; Bell, S.C.; Reddy, E.P.; Reddy, M.R. Synthesis of new coumarin 3-(N-aryl) sulfonamides and their anticancer activity. Bioorganic Med. Chem. Lett. 2004, 14, 4093–4097. [Google Scholar] [CrossRef]
  15. Bilbao-Ramos, P.; Galiana-Roselló, C.; Dea-Ayuela, M.A.; González-Alvarez, M.; Vega, C.; Rolón, M.; Pérez-Serrano, J.; Bolás-Fernández, F.; González-Rosende, M.E. Nuclease activity and ultrastructural effects of new sulfonamides with anti-leishmanial and trypanocidal activities. Parasitol. Int. 2012, 61, 604–613. [Google Scholar] [CrossRef]
  16. Dauvergne, J.; Wellington, K.; Chibale, K. Unprecedented observation of sulfonamides in the transesterification of N-unsubstituted carbamates with sulfonyl chlorides. Tetrahedron Lett. 2004, 45, 43–47. [Google Scholar] [CrossRef]
  17. Yasuhara, A.; Kameda, M.; Sakamoto, T. Selective monodesulfonylation of N, N-disulfonylarylamines with tetrabutylammonium fluoride. Chem. Pharm. Bull. 1999, 47, 809–812. [Google Scholar] [CrossRef] [Green Version]
  18. O’Connell, J.F.; Rapoport, H. 1-Benzenesulfonyl-and 1-p-toluenesulfonyl-3-methylimidazolium triflates: Efficient reagents for the preparation of arylsulfonamides and arylsulfonates. J. Org. Chem. 1992, 57, 4775–4777. [Google Scholar] [CrossRef]
  19. Chandrasekhar, S.; Mohapatra, S. Neighbouring group assisted sulfonamide cleavage of Sharpless aminols under acetonation conditions. Tetrahedron Lett. 1998, 39, 695–698. [Google Scholar] [CrossRef]
  20. Gleckman, R.; Alvarez, S.; Joubert, D.W. Drug therapy reviews: Trimethoprim-sulfamethoxazole. Am. J. Hosp. Pharm. 1979, 36, 893–906. [Google Scholar] [CrossRef]
  21. Bushby, S.R.M.; Hitchings, G.H. Trimethoprim, a sulphonamide potentiator. Br. J. Pharmacol. Chemother. 1968, 33, 72–90. [Google Scholar] [CrossRef] [Green Version]
  22. Song, C.M.; Lim, S.J.; Tong, J.C. Recent advances in computer-aided drug design. Briefings Bioinform. 2009, 10, 579–591. [Google Scholar] [CrossRef] [Green Version]
  23. Macalino, S.J.Y.; Gosu, V.; Hong, S.; Choi, S. Role of computer-aided drug design in modern drug discovery. Arch. Pharmacal Res. 2015, 38, 1686–1701. [Google Scholar] [CrossRef]
  24. Rifaioglu, A.S.; Atas, H.; Martin, M.J.; Cetin-Atalay, R.; Atalay, V.; Doğan, T. Recent applications of deep learning and machine intelligence on in silico drug discovery: Methods, tools and databases. Brief. Bioinform. 2019, 20, 1878–1912. [Google Scholar] [CrossRef]
  25. Shoichet, B.K. Virtual screening of chemical libraries. Nature 2004, 432, 862–865. [Google Scholar] [CrossRef]
  26. Trott, O.; Olson, A.J. AutoDock Vina: Improving the speed and accuracy of docking with a new scoring function, efficient optimization, and multithreading. J. Comput. Chem. 2010, 31, 455–461. [Google Scholar] [CrossRef] [Green Version]
  27. Friesner, R.A.; Banks, J.L.; Murphy, R.B.; Halgren, T.A.; Klicic, J.J.; Mainz, D.T.; Repasky, M.P.; Knoll, E.H.; Shelley, M.; Perry, J.K.; et al. Glide: A new approach for rapid, accurate docking and scoring. 1. Method and assessment of docking accuracy. J. Med. Chem. 2004, 47, 1739–1749. [Google Scholar] [CrossRef]
  28. Sánchez-Linares, I.; Pérez-Sánchez, H.; Cecilia, J.M.; García, J.M. High-throughput parallel blind virtual screening using BINDSURF. BMC Bioinform. 2012, 13, 1–14. [Google Scholar] [CrossRef] [Green Version]
  29. Imbernón, B.; Cecilia, J.M.; Pérez-Sánchez, H.; Giménez, D. METADOCK: A parallel metaheuristic schema for virtual screening methods. Int. J. High Perform. Comput. Appl. 2018, 32, 789–803. [Google Scholar] [CrossRef]
  30. Ban, T.A. The role of serendipity in drug discovery. Dialogues Clin. Neurosci. 2022, 8, 335–344. [Google Scholar] [CrossRef]
  31. Huang, K.; Fu, T.; Khan, D.; Abid, A.; Abdalla, A.; Abid, A.; Glass, L.M.; Zitnik, M.; Xiao, C.; Sun, J. Moldesigner: Interactive design of efficacious drugs with deep learning. arXiv 2020, arXiv:03951. [Google Scholar]
  32. Huang, K.; Fu, T.; Glass, L.M.; Zitnik, M.; Xiao, C.; Sun, J. DeepPurpose: A deep learning library for drug–target interaction prediction. Bioinformatics 2020, 36, 5545–5547. [Google Scholar] [CrossRef] [PubMed]
  33. Hohenberg, P.; Kohn, W. Inhomogeneous electron gas. Phys. Rev. 1964, 136, B864. [Google Scholar] [CrossRef] [Green Version]
  34. Calais, J.L. Orthonormalization and symmetry adaptation of crystal orbitals. Int. J. Quantum Chem. 1985, 28, 655–667. [Google Scholar] [CrossRef]
  35. Rodríguez, J.I.; Ayers, P.W.; Götz, A.W.; Castillo-Alvarado, F.D.L. Virial theorem in the Kohn–Sham density-functional theory formalism: Accurate calculation of the atomic quantum theory of atoms in molecules energies. J. Chem. Phys. 2009, 131, 021101. [Google Scholar] [CrossRef]
  36. Ziegler, T.J.C.R. Approximate density functional theory as a practical tool in molecular energetics and dynamics. Chem. Rev. 1991, 91, 651–667. [Google Scholar] [CrossRef]
  37. Bartolotti, L.J.; Flurchick, K. An introduction to density functional theory. Rev. Comput. Chem. 1996, 7, 187–260. [Google Scholar]
  38. Aziz, M.; Ejaz, S.A.; Tamam, N.; Siddique, F.; Riaz, N.; Qais, F.A.; Chtita, S.; Iqbal, J. Identification of potent inhibitors of NEK7 protein using a comprehensive computational approach. Sci. Rep. 2022, 12, 6404. [Google Scholar] [CrossRef]
  39. Del Bene, J.E.; Person, W.B.; Szczepaniak, K. Properties of Hydrogen-Bonded Complexes Obtained from the B3LYP Functional with 6-31G (d, p) and 6-31+ G (d, p) Basis Sets: Comparison with MP2/6-31+ G (d, p) Results and Experimental Data. J. Phys. Chem. 1995, 99, 10705–10707. [Google Scholar] [CrossRef]
  40. Hanwell, M.D.; Curtis, D.E.; Lonie, D.C.; Vandermeersch, T.; Zurek, E.; Hutchison, G.R. Avogadro: An advanced semantic chemical editor, visualization, and analysis platform. J. Chemin. 2012, 4, 1–17. [Google Scholar] [CrossRef] [Green Version]
  41. Azarakhshi, F.; Khaleghian, M.; Farhadyar, N. DFT study and NBO analysis of conformational properties of 2-Substituted 2-Oxo-1, 3, 2-dioxaphosphorinanes and their dithia and diselena analogs. Lett. Org. Chem. 2015, 12, 516–522. [Google Scholar] [CrossRef]
  42. Aziz, M.; Ejaz, S.A.; Rehman, H.M.; Al-Buriahi, M.S.; Siddique, F.; Somaily, H.H.; Alrowaili, Z.A. Identification of NEK7 Inhibitors: Structure based Virtual Screening, Molecular Docking, Density functional theory calculations and Molecular Dynamics Simulations. Res. Sq. 2022. preprint. [Google Scholar] [CrossRef]
  43. Ferreira, L.G.; Ricardo, N. Molecular Docking and Structure-Based Drug Design Strategies. Molecules 2015, 20, 13384–13421. [Google Scholar] [CrossRef]
  44. Hildebrand, P.W.; Rose, A.; Tiemann, J. Bringing Molecular Dynamics Simulation Data into View. Trends Biochem. Sci. 2019, 44, 902–913. [Google Scholar] [CrossRef] [Green Version]
  45. Rasheed, M.A.; Iqbal, M.N.; Saddick, S.; Ali, I.; Khan, F.S.; Kanwal, S.; Ahmed, D.; Ibrahim, M.; Afzal, U.; Awais, M. Identification of lead compounds against Scm (fms10) in Enterococcus faecium using computer aided drug designing. Life 2021, 11, 77. [Google Scholar] [CrossRef]
  46. Shivakumar, D.; Williams, J.; Wu, Y.; Damm, W.; Shelley, J.; Sherman, W. Prediction of absolute solvation free energies using molecular dynamics free energy perturbation and the OPLS force field. J. Chem. Theory Comput. 2010, 6, 1509–1519. [Google Scholar] [CrossRef]
  47. Martyna, G.J.; Tobias, D.J.; Klein, M.L. Constant pressure molecular dynamics algorithms. J. Chem. Phys. 1994, 101, 4177–4189. [Google Scholar] [CrossRef]
  48. Hoover, W.G. Canonical dynamics: Equilibrium phase-space distributions. Phys. Rev. A 1985, 31, 1695. [Google Scholar] [CrossRef] [Green Version]
  49. Luty, B.A.; Davis, M.E.; Tironi, I.G.; Van Gunsteren, W.F. A comparison of particle-particle, particle-mesh and Ewald methods for calculating electrostatic interactions in periodic molecular systems. Mol. Simul. 1994, 14, 11–20. [Google Scholar] [CrossRef]
  50. Zhang, Y.; Zhang, T.J.; Tu, S.; Zhang, Z.H.; Meng, F.H. Identification of Novel Src Inhibitors: Pharmacophore-Based Virtual Screening, Molecular Docking and Molecular Dynamics Simulations. Molecules 2020, 25, 4094. [Google Scholar] [CrossRef]
  51. Humphreys, D.D.; Friesner, R.A.; Berne, B.J. A Multiple-Time-Step Molecular Dynamics Algorithm for Macromolecules. J. Phys. Chem. 1994, 98, 6885–6892. [Google Scholar] [CrossRef]
  52. Jacobson, M.P.; Pincus, D.L.; Rapp, C.S.; Day, T.J.; Honig, B.; Shaw, D.E.; Friesner, R.A. A hierarchical approach to all-atom protein loop prediction. Proteins Struct. Funct. Bioinform. 2004, 55, 351–367. [Google Scholar] [CrossRef] [Green Version]
  53. Jacobson, M.P.; Friesner, R.A.; Xiang, Z.; Honig, B. On the role of the crystal environment in determining protein side-chain conformations. J. Mol. Biol. 2002, 320, 597–608. [Google Scholar] [CrossRef]
  54. Bowers, K.J.; Chow, D.E.; Xu, H.; Dror, R.O.; Eastwood, M.P.; Gregersen, B.A.; Klepeis, J.L.; Kolossvary, I.; Moraes, M.A.; Sacerdoti, F.D.; et al. Scalable algorithms for molecular dynamics simulations on commodity clusters. In Proceedings of the 2006 ACM/IEEE Conference on Supercomputing, Tampa, FL, USA, 11–17 November 2006. [Google Scholar]
  55. Qu, X.; Latino, D.A.; Aires-De-Sousa, J. A big data approach to the ultra-fast prediction of DFT-calculated bond energies. J. Chemin. 2013, 5, 34. [Google Scholar] [CrossRef] [Green Version]
  56. Cohen, A.J.; Mori-Sánchez, P.; Yang, W. Challenges for Density Functional Theory. Chem. Rev. 2011, 112, 289–320. [Google Scholar] [CrossRef]
  57. Ribeiro, J.; Ríos-Vera, C.; Melo, F.; Schüller, A. Calculation of accurate interatomic contact surface areas for the quantitative analysis of non-bonded molecular interactions. Bioinformatics 2012, 35, 3499–3501. [Google Scholar] [CrossRef] [Green Version]
  58. Azam, F.; Alabdullah, N.H.; Ehmedat, H.M.; Abulifa, A.R.; Taban, I.; Upadhyayula, S. NSAIDs as potential treatment option for preventing amyloid β toxicity in Alzheimer’s disease: An investigation by docking, molecular dynamics, and DFT studies. J. Biomol. Struct. Dyn. 2018, 36, 2099–2117. [Google Scholar] [CrossRef]
  59. Hospital, A.; Goñi, J.R.; Orozco, M.; Gelpí, J. Molecular dynamics simulations: Advances and applications. Adv. Appl. Bioinform. Chem. AABC 2015, 8, 37. [Google Scholar] [PubMed] [Green Version]
  60. Choudhary, M.I.; Shaikh, M.; tul-Wahab, A.; ur-Rahman, A. In silico identification of potential inhibitors of key SARS-CoV-2 3CL hydrolase (Mpro) via molecular docking, MMGBSA predictive binding energy calculations, and molecular dynamics simulation. PLoS ONE 2020, 15, e0235030. [Google Scholar] [CrossRef] [PubMed]
  61. Katari, S.K.; Natarajan, P.; Swargam, S.; Kanipakam, H.; Pasala, C.; Umamaheswari, A. Inhibitor design against JNK1 through e-pharmacophore modeling docking and molecular dynamics simulations. J. Recept. Signal Transduct. 2016, 36, 558–571. [Google Scholar] [CrossRef] [PubMed]
  62. David, C.C.; Jacobs, D.J. Principal component analysis: A method for determining the essential dynamics of proteins. In Protein Dynamics; Humana Press: Totowa, NJ, USA, 2014; pp. 193–226. [Google Scholar]
  63. Vijayakumar, B.; Parasuraman, S.; Raveendran, R.; Velmurugan, D. Identification of natural inhibitors against angiotensin I converting enzyme for cardiac safety using induced fit docking and MM-GBSA studies. Pharmacogn. Mag. 2014, 10 (Suppl. S3), S639. [Google Scholar]
  64. Lyne, P.D.; Lamb, A.M.L.; Saeh, J.C. Accurate Prediction of the Relative Potencies of Members of a Series of Kinase Inhibitors Using Molecular Docking and MM-GBSA Scoring. J. Med. Chem. 2006, 49, 4805–4808. [Google Scholar] [CrossRef]
Figure 1. Top Hits obtained through SBVS. All hits were sharing same basic Pharmacophore with standard Dabrafenib.
Molecules 27 04098 g001
Figure 2. Implementation of Deep learning Model.
Molecules 27 04098 g002
Figure 3. Optimized structures of selected compounds.
Molecules 27 04098 g003
Figure 4. HOMO–LUMO structures of the selected compounds.
Molecules 27 04098 g004
Figure 5. The putative 2D and 3D binding mode of compound 208 (A) and 248 (B). Green dashes are indicating hydrogen bonding whereas red dashes are indicating hydrophobic interactions.
Molecules 27 04098 g005
Figure 6. The putative 2D and 3D binding mode of compound 255 (A) and 762 (B). Green dashes are indicating hydrogen bonding whereas red dashes are indicating hydrophobic interactions.
Molecules 27 04098 g006
Figure 7. 2D and 3D interactions of NEK7–Dabrafenib complex.
Molecules 27 04098 g007
Figure 8. Electrostatic surface potential map of all ligand complexes.
Molecules 27 04098 g008
Figure 9. Buried surface area (BSA) of compound 208 and 248.
Molecules 27 04098 g009
Figure 10. Buried surface area (BSA) of compound 255 and 762.
Molecules 27 04098 g010
Figure 11. Residue wise root-mean-square deviation (RMSD) of the C-alpha atoms of NEK7 (2wqn) and Dabrafenib Complex.
Molecules 27 04098 g011
Figure 12. Root-mean-square fluctuations (RMSF) of the C-alpha atoms of NEK7 (2wqn).
Molecules 27 04098 g012
Figure 13. NEK7-Dabrafenib Contact histogram.
Molecules 27 04098 g013
Figure 14. Radius of gyration (NEK7).
Molecules 27 04098 g014
Figure 15. Residue wise solvent accessible surface area (SASA) for NEK7.
Molecules 27 04098 g015
Figure 16. The correlation between protein variables and two top PCs.
Molecules 27 04098 g016
Figure 17. Pearson correlation graph for NEK7 variables.
Molecules 27 04098 g017
Table 1. Energetic parameters of top hits and standard Dabrafenib.
CompoundOptimization Energy
(Hartree)
Polarizability (α) (a.u.)Dipole Moment
(Debye)
Compound 208−2712.903340.58813.330
Compound 248−2391.895345.6717.283
Compound 255−2238.320304.8208.827
Compound 762−2699.752360.21310.042
Dabrafenib−2407.203319.2546.682
Table 2. ΔEgap of HOMO/LUMO orbitals of selected compounds.
CompoundEHOMO(eV)ELUMO(eV)∆Egap(eV)Potential Ionization I (eV)Affinity A (eV)
Compound 208−0.234−0.0990.1350.2340.099
Compound 248−0.222−0.0700.1520.2220.070
Compound 255−0.228−0.0830.1450.2280.083
Compound 762−0.216−0.0890.1270.2160.089
Dabrafenib−0.233−0.0740.1590.2330.074
Table 3. Global reactivity descriptors.
CompoundHardness
(η)
Softness (S)Electronegativity (X)Chemical Potential (μ)Electrophilicity Index (ω)
Compound 2080.0677.4330.167−0.1670.207
Compound 2480.0766.5660.147−0.1470.141
Compound 2550.0726.9010.156−0.1560.167
Compound 7620.0637.8800.153−0.1530.184
Dabrafenib0.0806.280 [38]0.154−0.1540.149
CompoundElectrodonating power
-)
Electroaccepting power
+)
Net Electrophilicity(Δω±)
Compound 2080.2990.1320.432
Compound 2480.2240.0770.301
Compound 2550.2540.0980.352
Compound 7620.2680.1160.384
Dabrafenib0.2360.0820.318 [38]
Table 4. Binding energies and Predicted binding affinities via Deep learning model.
CompoundBinding Energies (kJ/mol)Predicted Binding Affinity (IC50) nMpIC50 (Predicted via Deep Learning Model)
Compound 208−33.47206.266.69
Compound 248−35.56268.806.57
Compound 255−35.982836.55
Compound 762−42.6761.747.21
Dabrafenib−33.891-9 (Experimental) [1]---
Table 5. Average values obtained from MD simulations.
Protein-Ligand ComplexAverage Protein RMSD (Å)Average Protein RMSF (Å)Average Protein-Ligand Complex RMSD (Å)Average Radius of Gyration (Å)Average SASA
(Residue Wise) (Å2)
NEK7–Dabrafenib complex1.970.873.8919.76282.72
Table 6. Important Hydrogen bonding observed during MD simulations.
Sr No.Hydrogen DonorHydrogen Acceptor
1ALA114-MainLIGAND-Side
2LIGAND-SideLEU113-Side
3LIGAND-SideASP115-Side
4ARG121-SideLIGAND-Side
5LIGAND-SideASP179-Side
6LIGAND-SideGLU112-Main
7GLY117-MainLIGAND-Side
8ASP115-MainLIGAND-Side
9LIGAND-SideALA114-Main
10LIGAND-SideILE40-Main
11LIGAND-SideARG42-Main
12GLY41-MainLIGAND-Side
Table 7. MM-GBSA binding energies of Dabrafenib docked at active site of NEK7.
Binding Free Energy ΔGbind (kcal/mol)ΔE coulomb
(kcal/mol)
ΔE covalent
(kcal/mol)
ΔE H-bond
(kcal/mol)
ΔE vdW
(kcal/mol)
Lipophilic Energy (kcal/mol)Sol_GB
(kcal/mol)
Dabrafenib−50.4431.0511.71−0.18−38.88−33.98−17.74
Table 8. MM-PBSA binding energies of Dabrafenib docked at active site of NEK7.
Binding Free Energy ΔGbind (kcal/mol)ΔE vdW
(kcal/mol)
Eel
(kcal/mol)
ENPOLAR
(kcal/mol)
EPB
(kcal/mol)
EDISPER
(kcal/mol)
Dabrafenib−56.12−38.27−17.84−26.7132.3747.53
Table 9. ADMET properties of top hits predicted via MPNN model.
Property PredictedCompound 208Compound 248Compound 255Compound 762
Solubility−4.50 log mol/L−4.05 log mol/L−3.19 log mol/L−3.10 log mol/L
Lipophilicity1.82 (log-ratio)1.89 (log-ratio)1.40 (log-ratio)1.88 (log-ratio)
(Absorption) Caco-2−5.14 cm/s−5.20 cm/s−5.14 cm/s−5.21 cm/s
(Absorption) HIA91.18%89.62%89.69%92.89%
(Absorption) Pgp10.18%13.10%5.84%11.42%
(Absorption) Bioavailability F2076.34%75.94%75.46%76.42%
(Distribution) BBB76.85%76.66%93.85%86.17%
(Distribution) PPBR79.65%77.11%63.16%80.66%
(Metabolism) CYP2C1981.26%72.00%37.21%24.15%
(Metabolism) CYP2D662.01%51.90%25.60%13.64%
(Metabolism) CYP3A474.21%56.97%60.78%22.83%
(Metabolism) CYP1A236.70%10.29%9.08%21.05%
(Metabolism) CYP2C917.86%6.99%4.13%8.60%
(Execretion) Half life8.06 h8.01 h7.86 h7.88 h
(Execretion) Clearance8.23 mL/min/kg8.26 mL/min/kg8.10 mL/min/kg8.54 mL/min/kg
Clinical Toxicity14.92%15.59%24.33%0.28%
Publisher’s Note: MDPI stays neutral with regard to jurisdictional claims in published maps and institutional affiliations.

