3.1. Materials
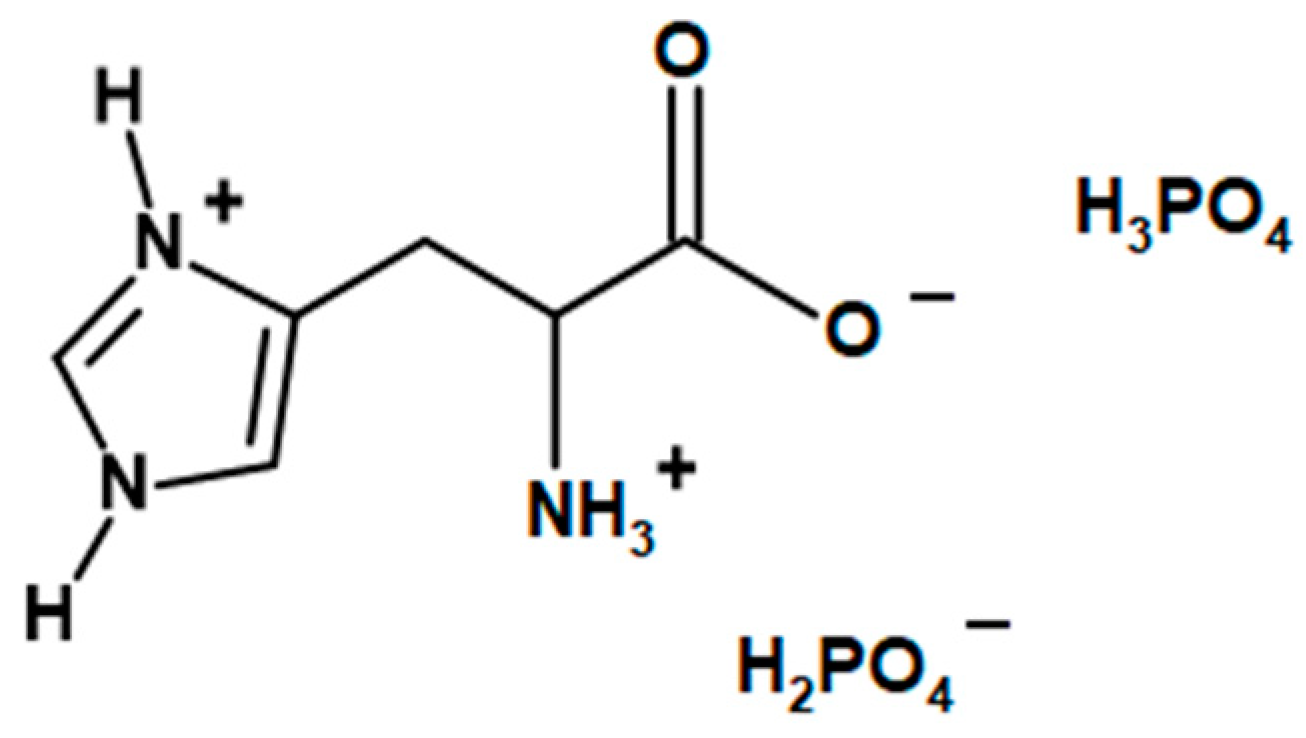
The main compounds used in the synthesis of L-histidinium dihydrogen phosphate-phosphoric acid were histidine from Apollo Scientific (> 99%) (Stockport, UK) and phosphoric acid from Honeywell (85% conc.) (Charlotte, NC, USA). Unsaturated polyester resin AROPOL M 105 TB and the initiator agent BUTANOX M-50, both from Ashland Inc. (Wilmington, DE, USA), were used as a polymer. The commercial halogen-free flame retardant ammonium polyphosphate (APP) was used to manufacture a reference material.
LHP (
Figure 12) was synthesized accordingly to previously reported studies [
34]. Initially, 78 g (0.5 mol) of L-histidine and 100 mL H
2O were mixed in a 1000 mL beaker, equipped with a mechanical stirrer. While stirring, the mixture was heated up to 50 °C in order to dissolve the amino acid. 115 g (approx. 1 mol) of 85% the solution of phosphoric acid was added dropwise during constant stirring, leading to an exothermic reaction, which heated the mixture to 80 °C. The reaction mixture was stirred at 80 °C for 2 more hours. The mixture was left to cool down while constantly stirred, which resulted in crystallization of the product after ca. two hours. The 400 mL of cooled methanol was added to the mixture, and it was left for another 15–20 min under constant stirring. The precipitate was filtered, washed with 50 mL of cooled methanol and left to dry. The amount of dried product was approx. 167 g.
Firstly, LHP (10 wt. %, 20 wt. % or 30 wt. %) was added to the resin and stirred using a high-speed mechanical stirrer with a water jacket. During mixing, the rotational speeds of 7000, 10,000 and 17,000 rpm were applied for 2, 1 and 0.5 min. (±10 s), respectively. The corresponding amount of initiator agent (1 wt. %) was introduced, and the mixture was stirred again for 1 min. Afterward, the UP was degassed for 7.5 min. (±10 s), poured into molds and cured at ambient temperature for approx. 24 h, as well as post-cured at 70 °C for 3 h. Next, the samples were conditioned at ambient temperature for 2 weeks. The formulations of flame retarded UP were given in
Table 6. It is important to notice that the addition of LHP and APP is related to different content of phosphoric acid in a final product. In the case of 10 wt. % APP, the overall input of phosphorus is 3.2 wt. % while in the case of LHP the input of phosphorus is at the level of 1.8% (higher value of the flame retardant consistently introduces a multiple of the given phosphorous contents).
3.2. Methods
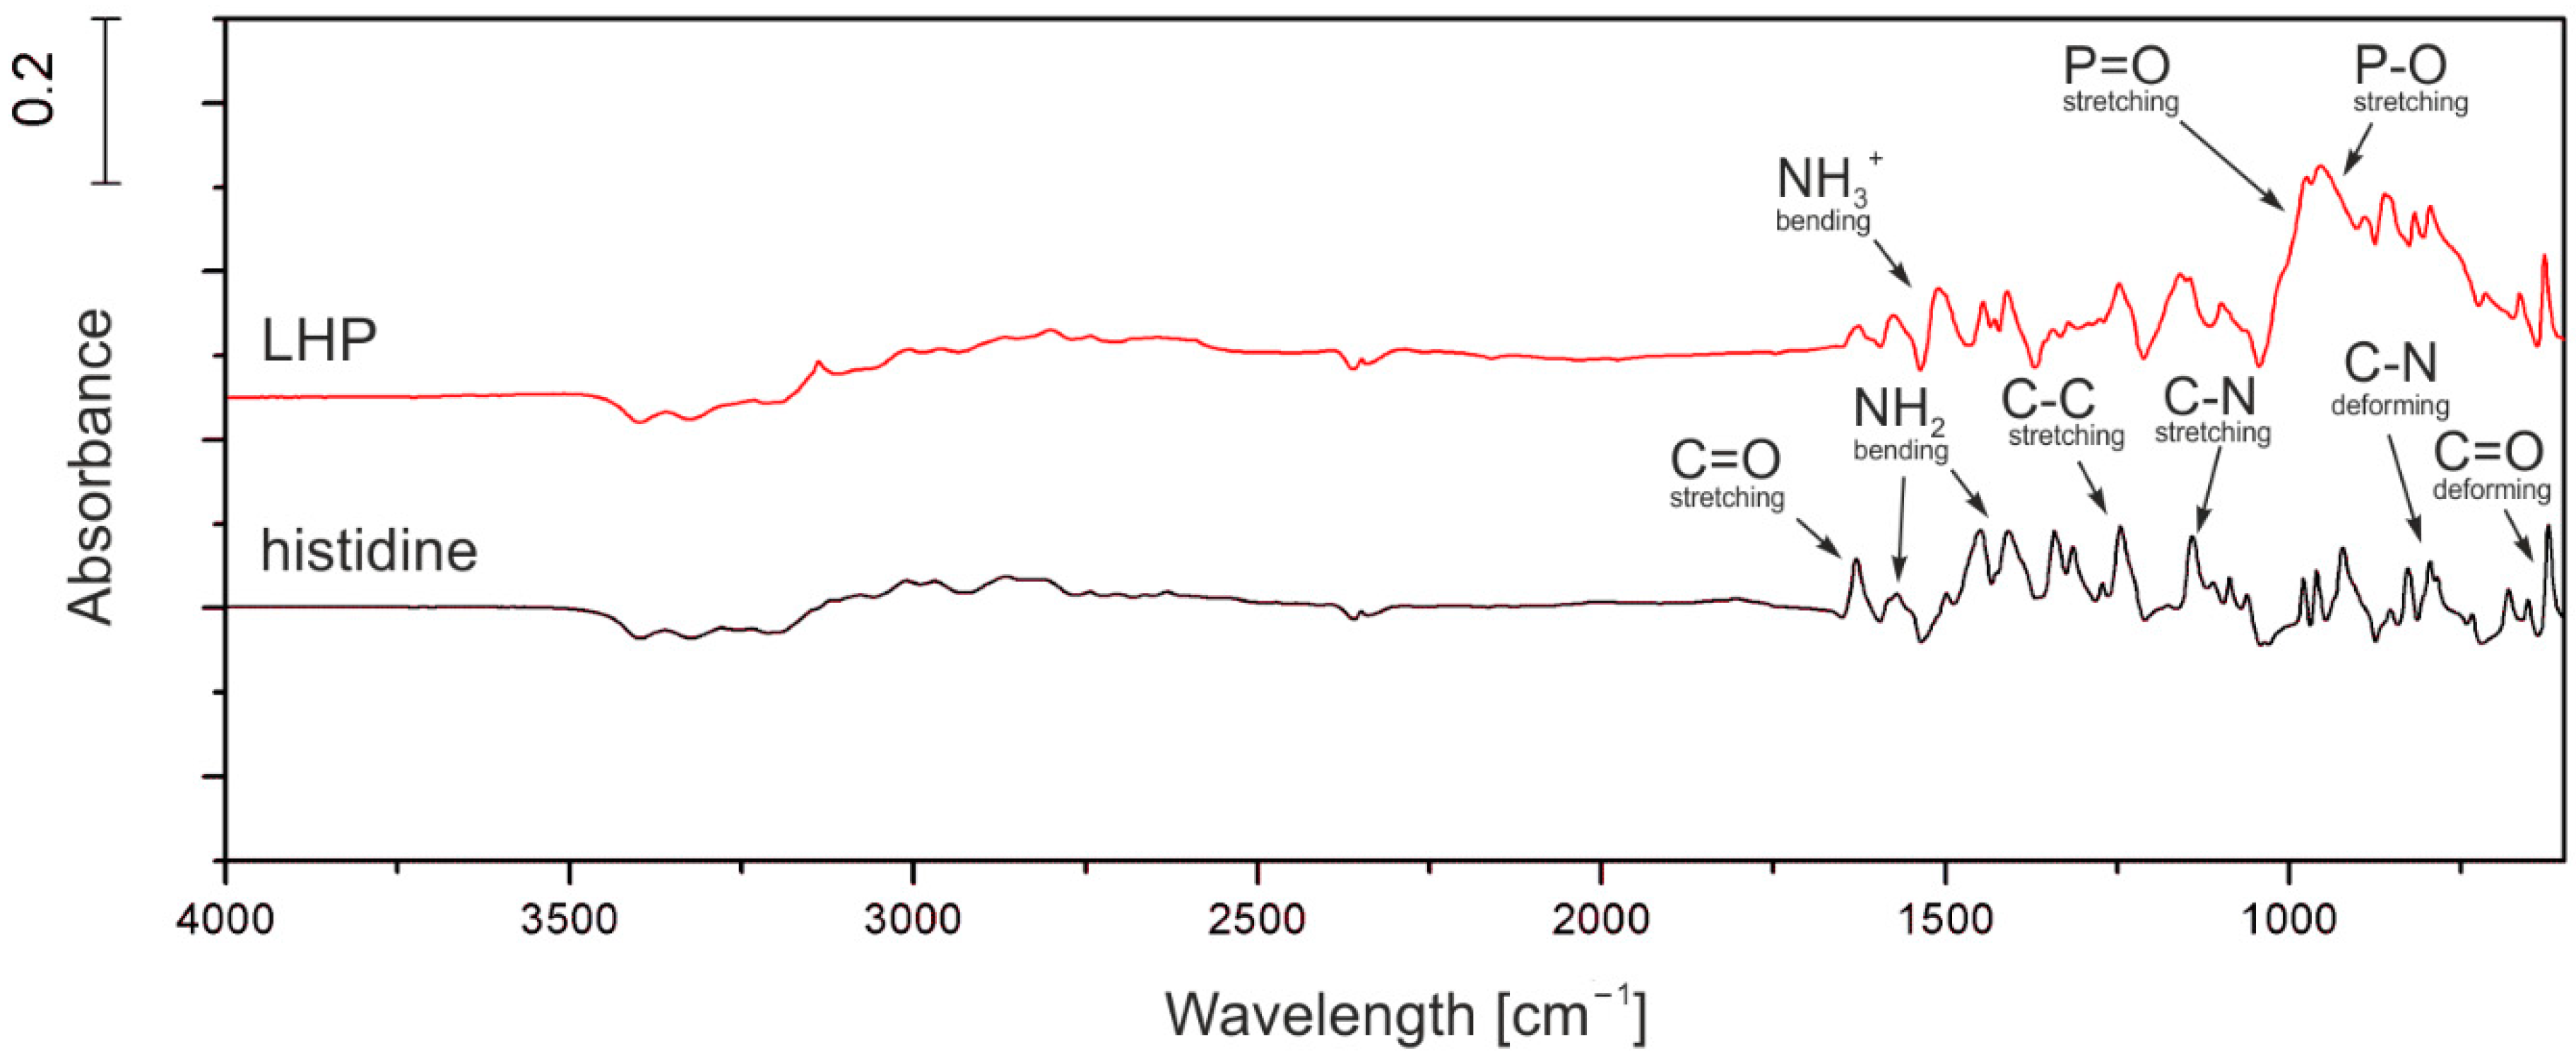
The Fourier transformed infrared (FT-IR) spectra were recorded using a Vertex 70 spectrometer from Bruker Corp (Billerica, MA, USA). Spectra in the range of 600–4000 cm−1 were obtained by 64 scans at a resolution of 4 cm−1.
Elemental analysis (CHN) data were collected using the Elementar Unicube analyzer (Elementar Analysensysteme, Langenselbold, Germany). Examined powders were initially dried at 120 °C for 12 h to remove any residual water. Samples of ca 3 mg were weighted and closed in tin cups directly before the analysis. Each analysis was repeated three times to evaluate the errors.
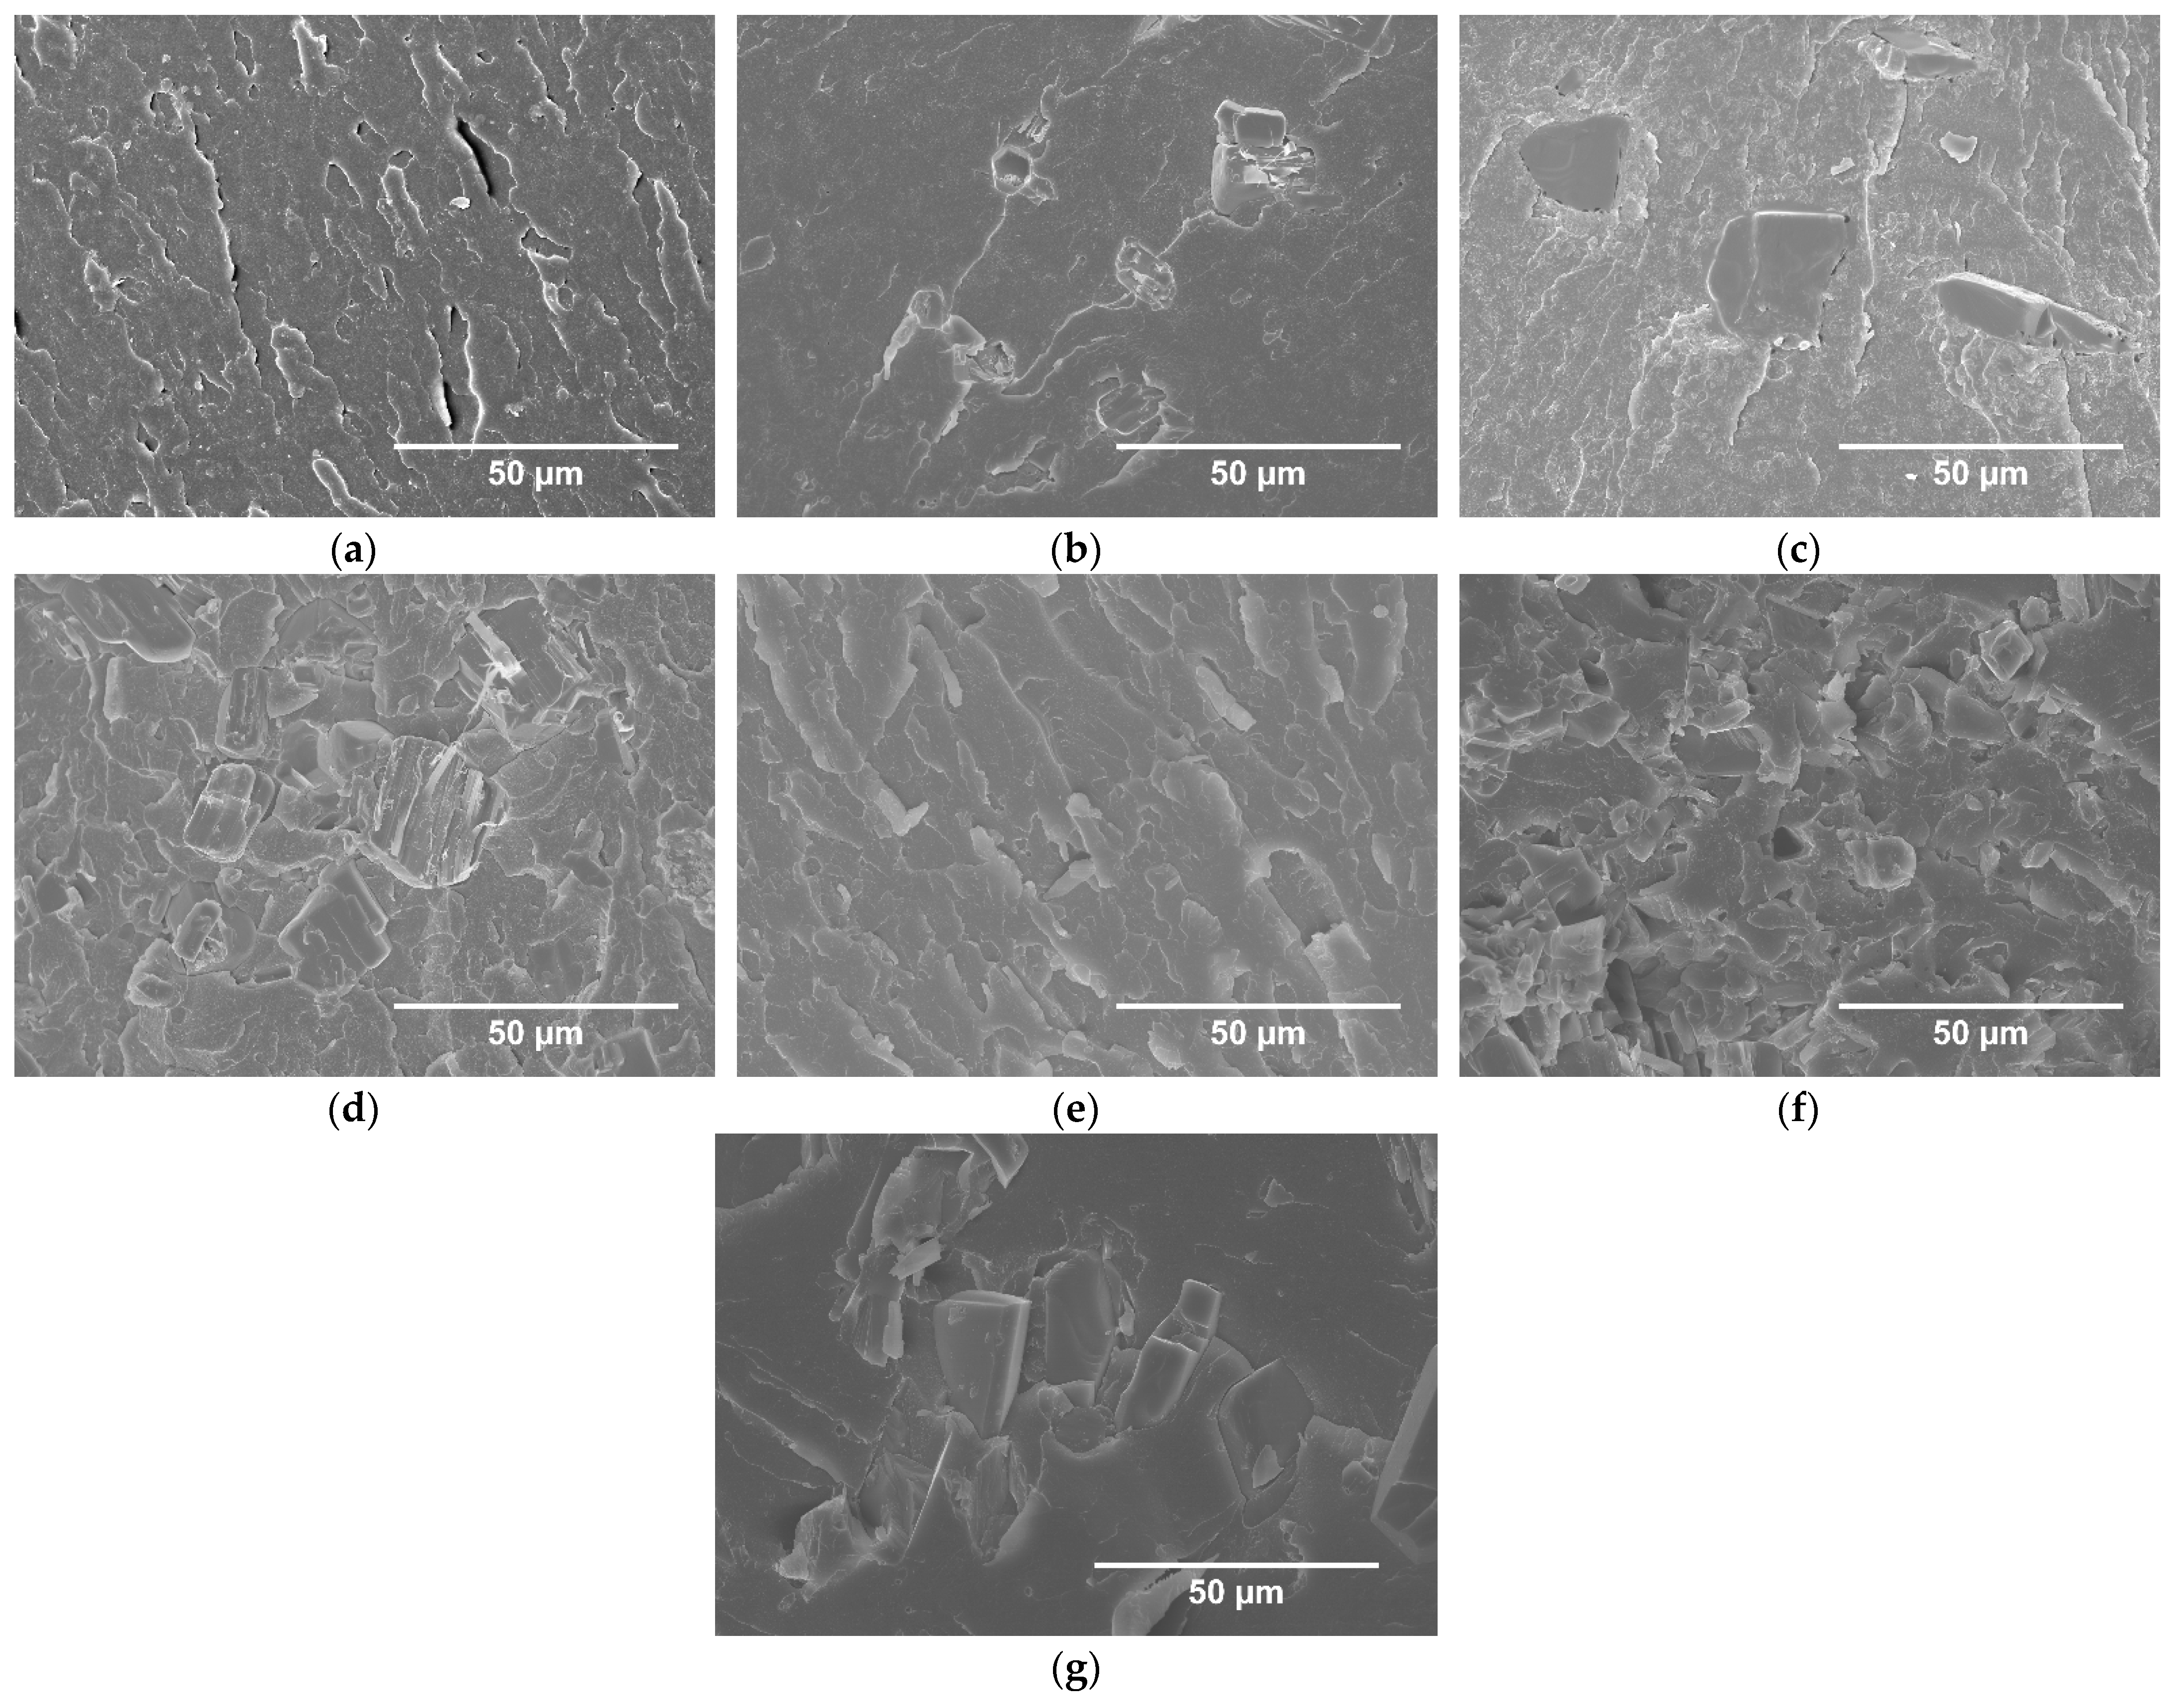
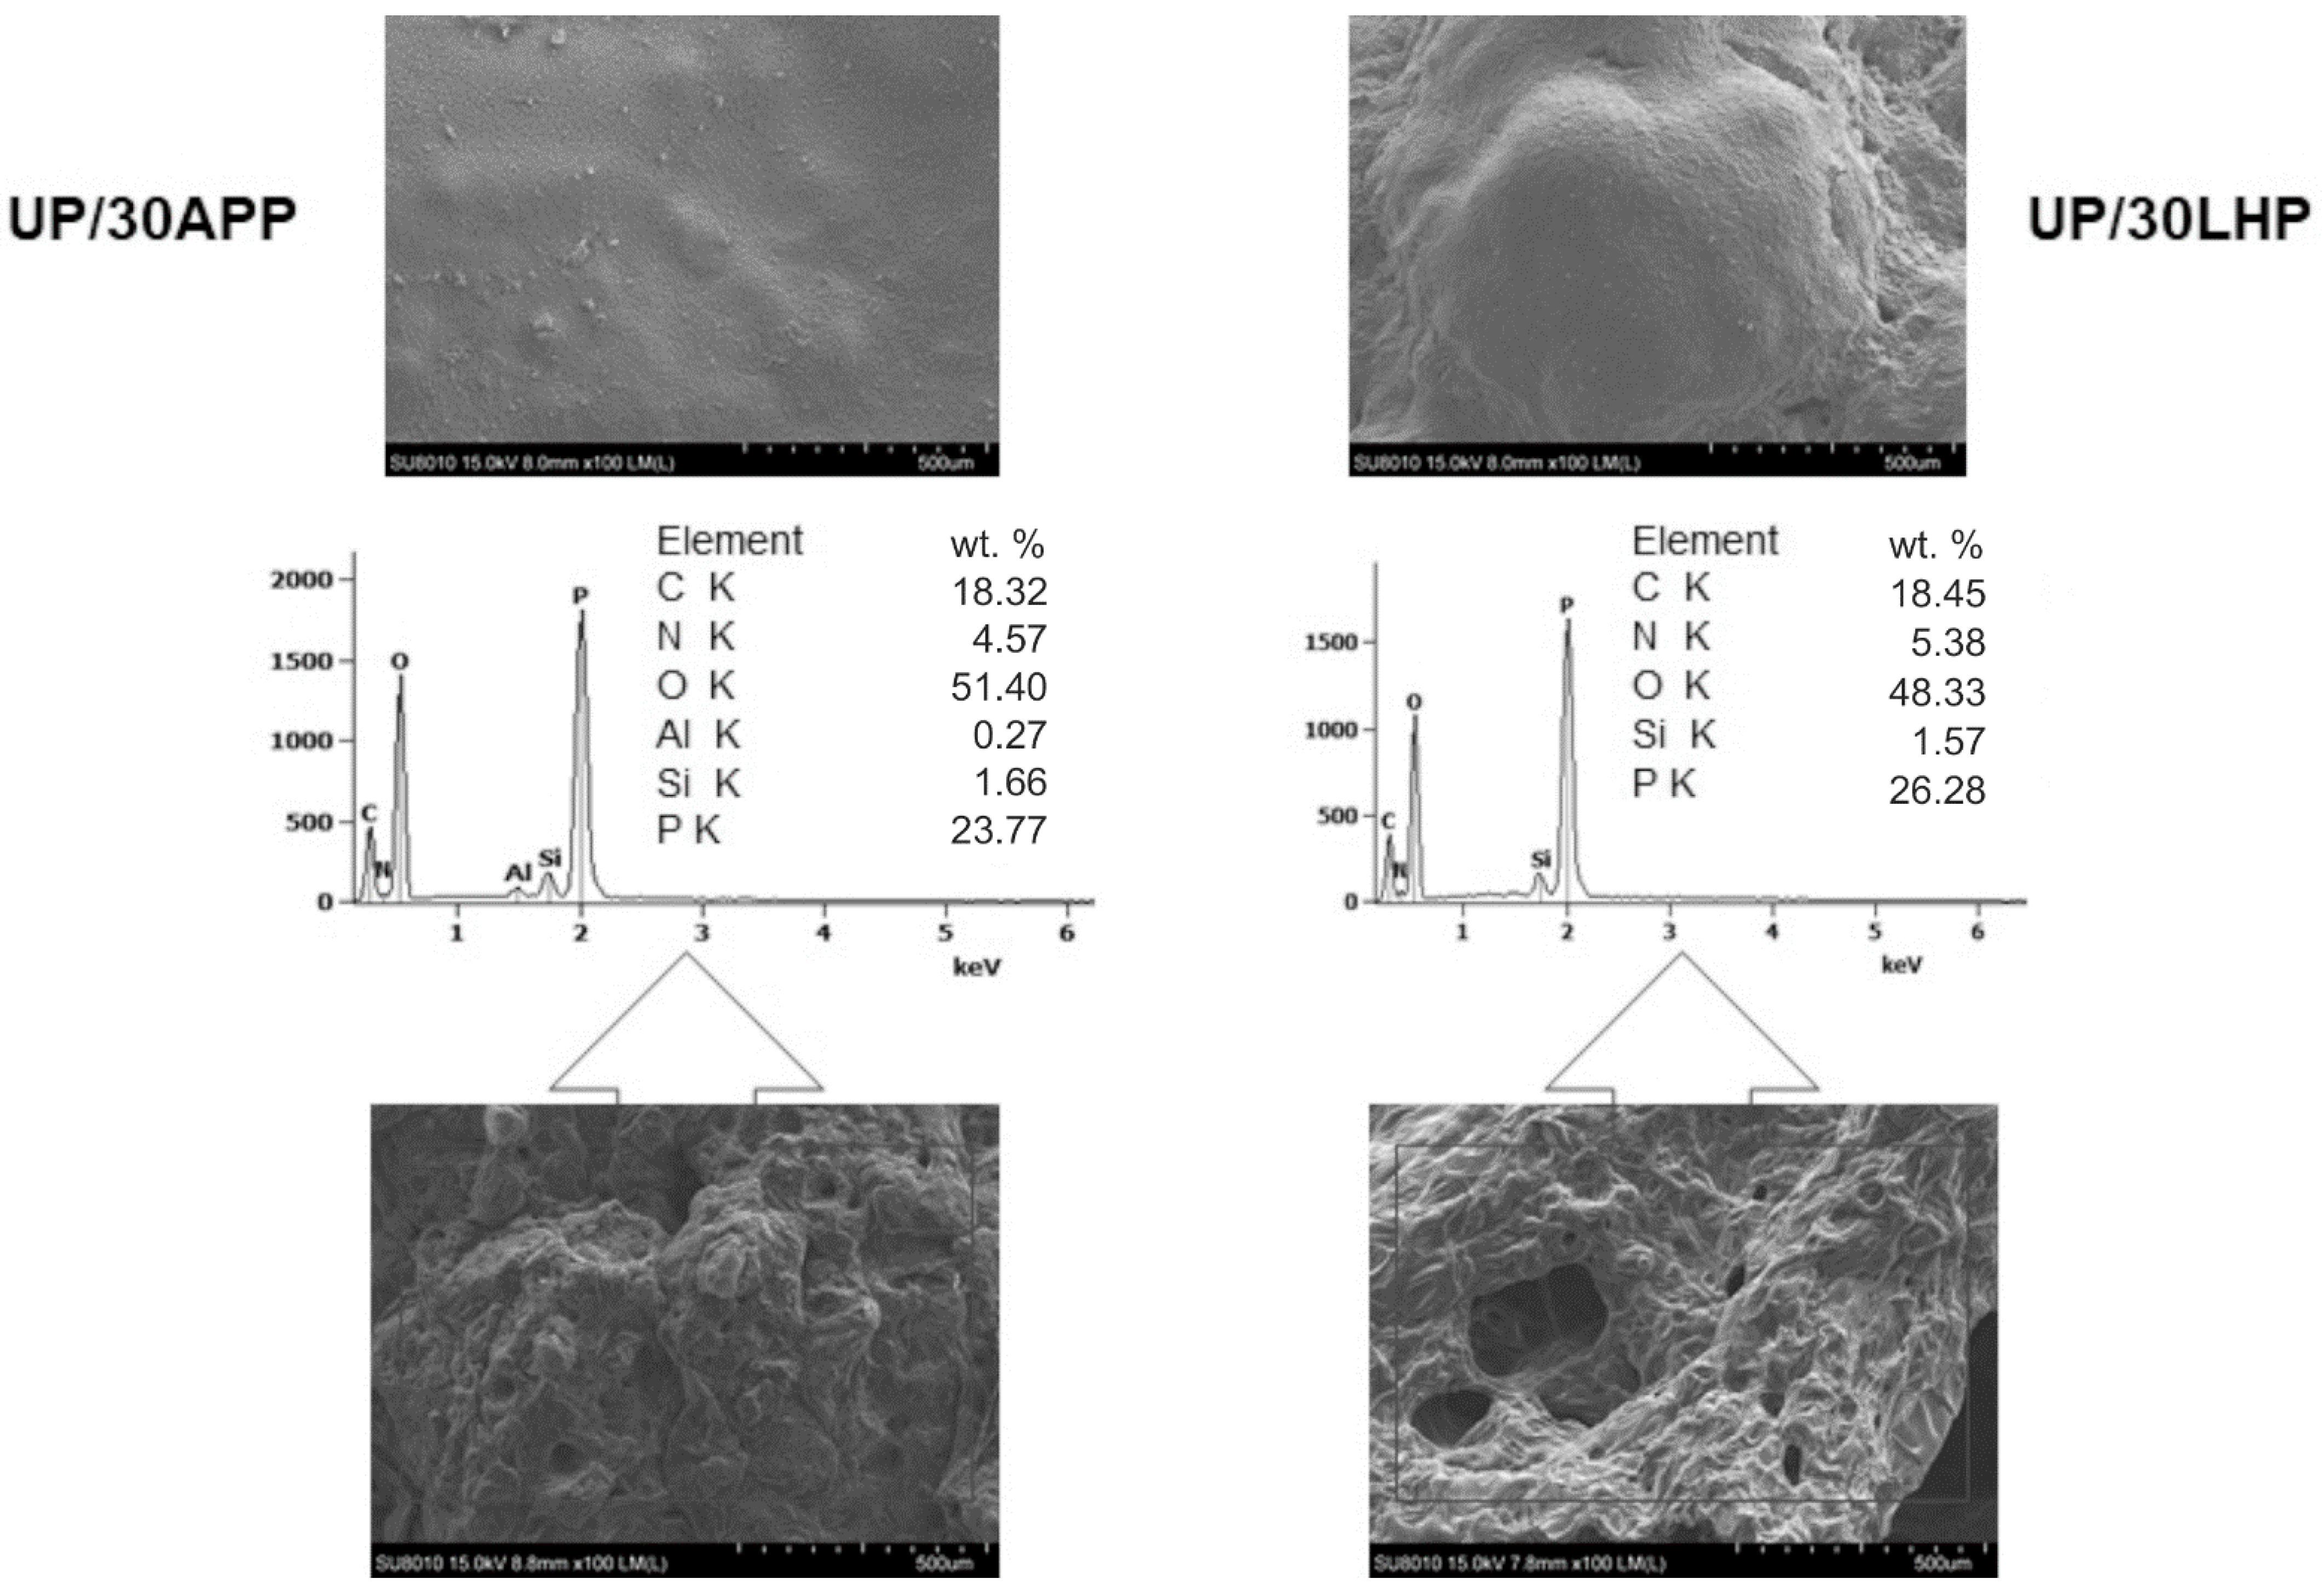
Scanning electron microscope SU8010 (Hitachi, Tokyo, Japan) was used to examine the samples’ morphology and the residues obtained from CC tests. The UP/FR was gold-coated using a Quorum Technologies Q150T ES sputter coater (Quorum, Laughton, UK) to improve the conductivity. Observations were conducted at an accelerating voltage of 5 kV and magnifications 500×. The residues did not require sputter coating and fixed on a table using LEIT-C Conductive Carbon Cement. Point elemental analysis was carried out using the Thermo Scientific NORAN System 7 equipped with an electrically cooled Silicon Drift Detector EDS detector (Thermo Scientific UltraDry, Waltham, MA, USA) to investigate the chemical composition of the residues.
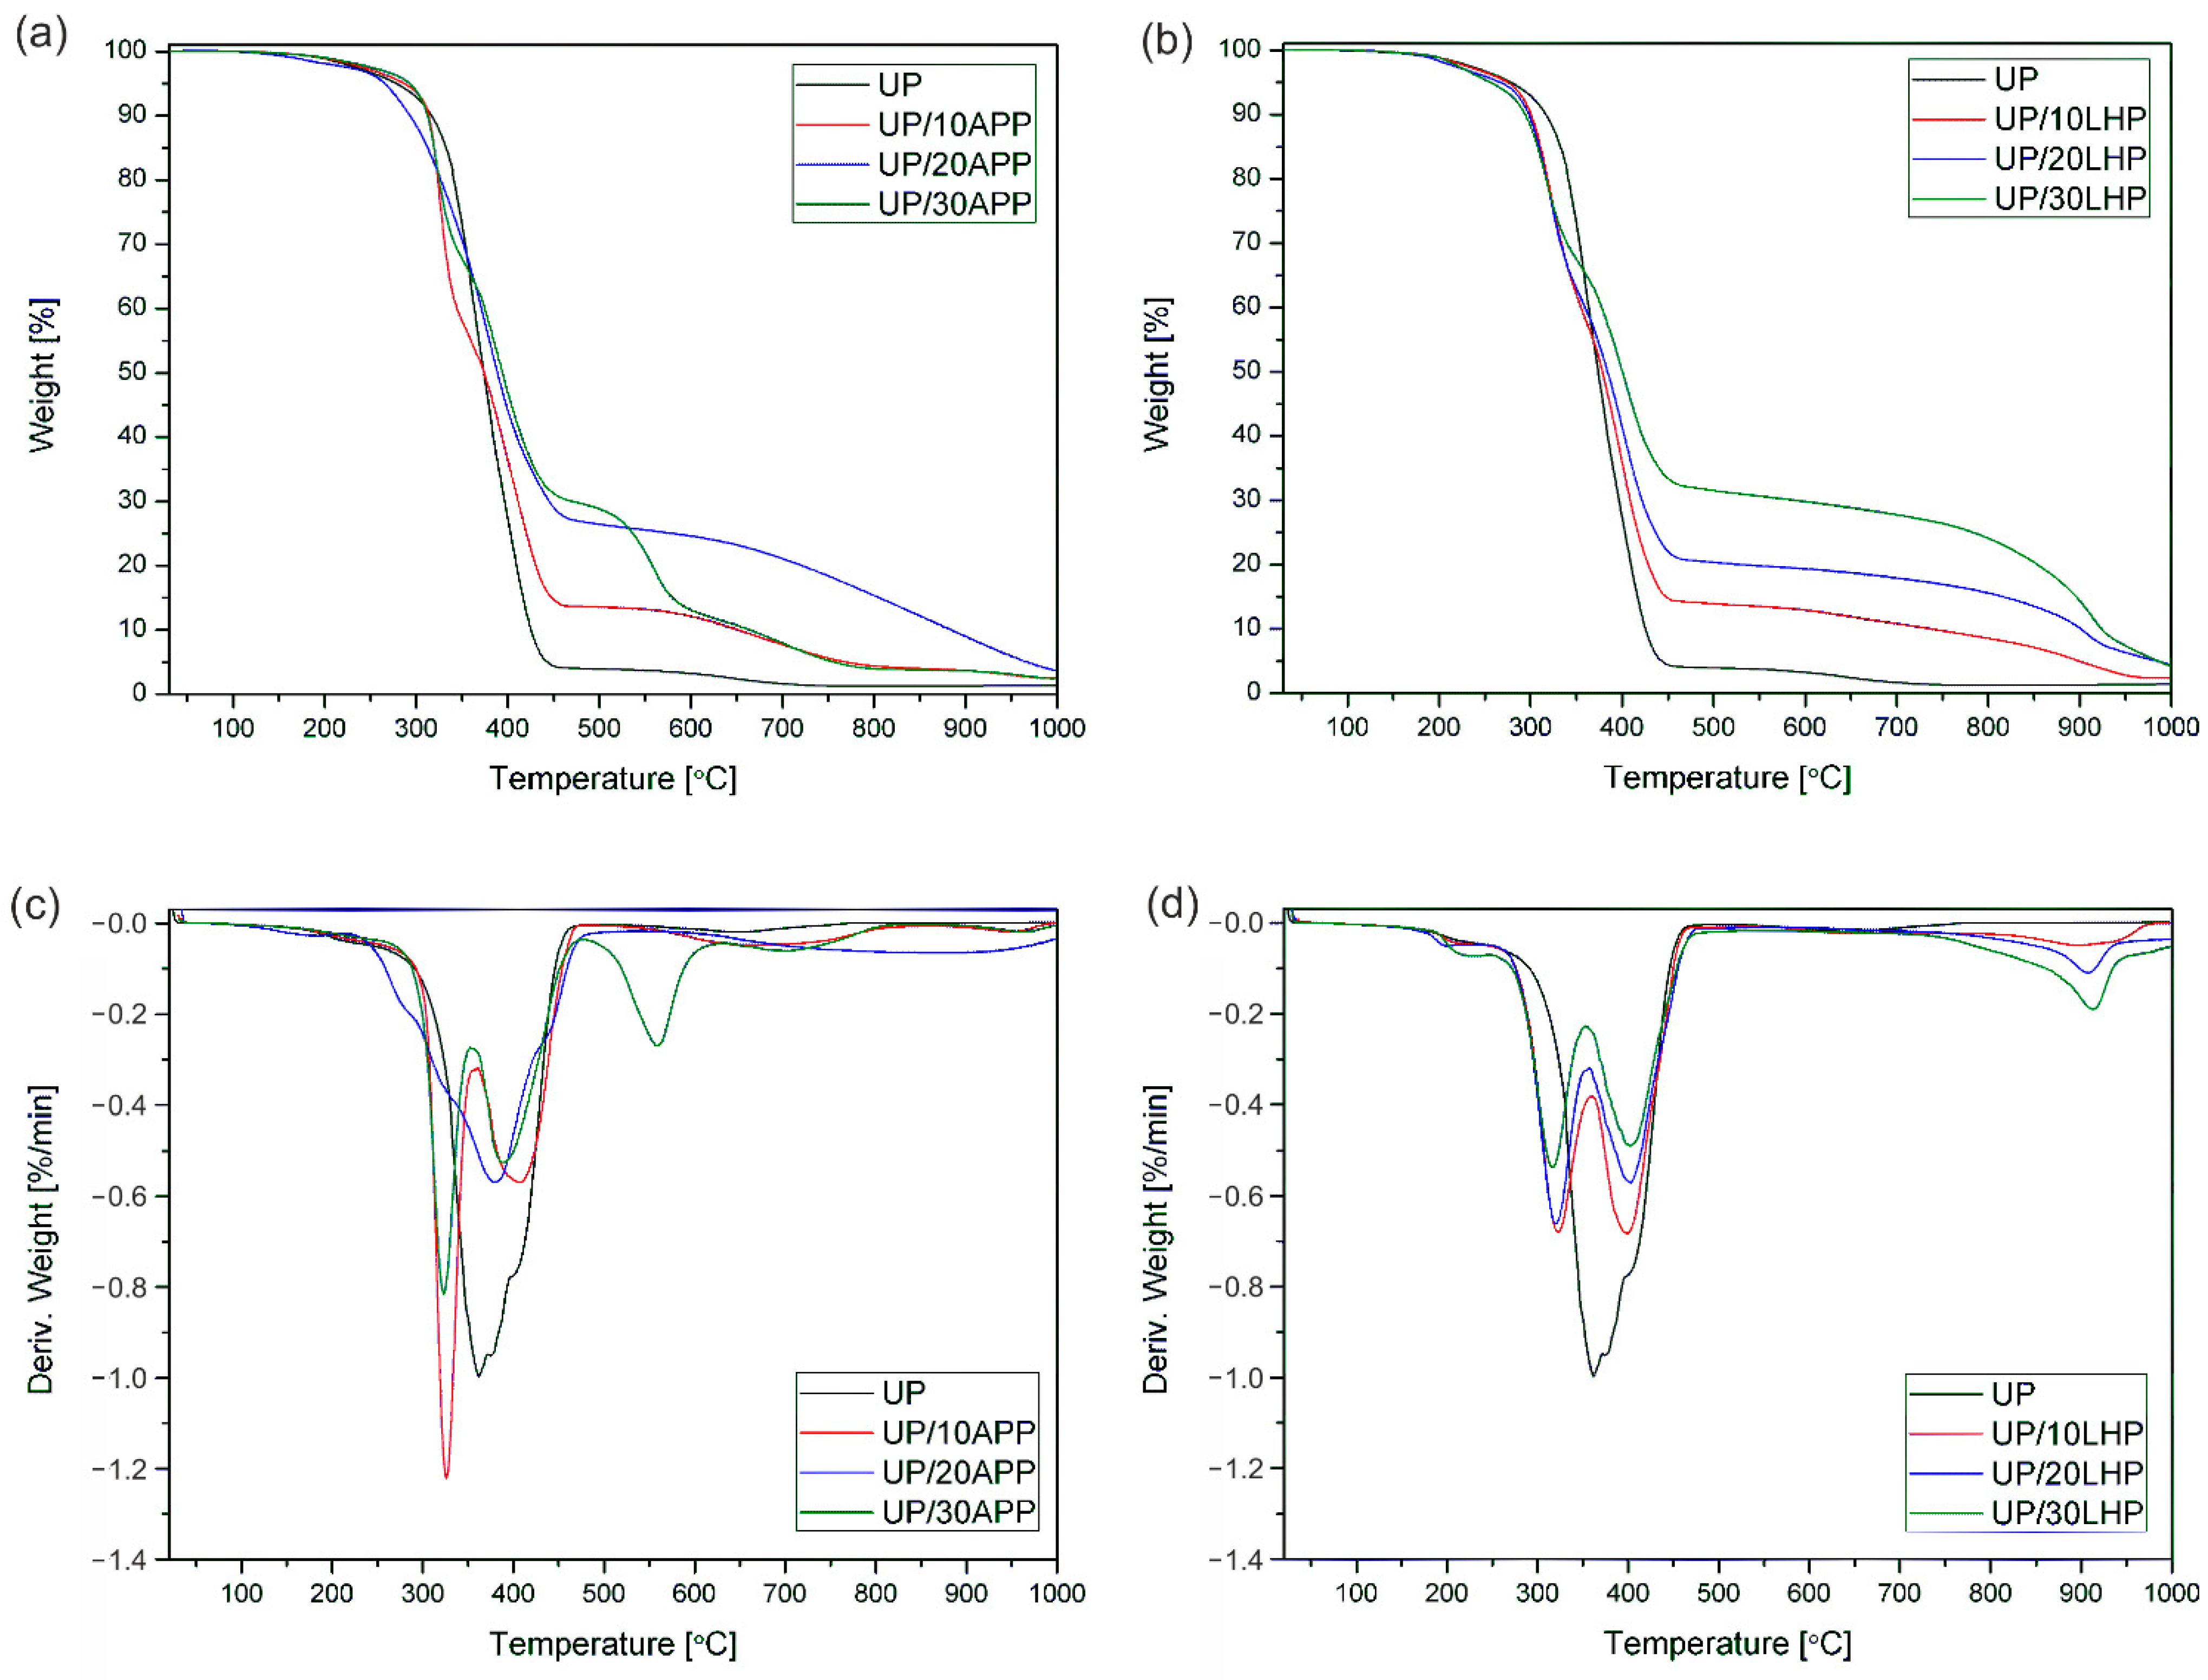
The thermogravimetric analysis was carried out on a TGA 5500 series Discovery (TA Instruments Ltd., New Castle, PA, USA). The samples (10 mg) were tested in an atmosphere of nitrogen with flow gas at a rate of 10 mL/min in the chamber and 90 mL/min in the oven. Samples were heated from room temperature up to 800 °C at a rate of 10 °C/min. The initial decomposition temperature T5% was defined as the temperature at which the weight loss was 5%, and the residual mass was determined at 800 °C. The maximum temperature and rate of degradation were also determined based on derivative thermogravimetric curves (DTG).
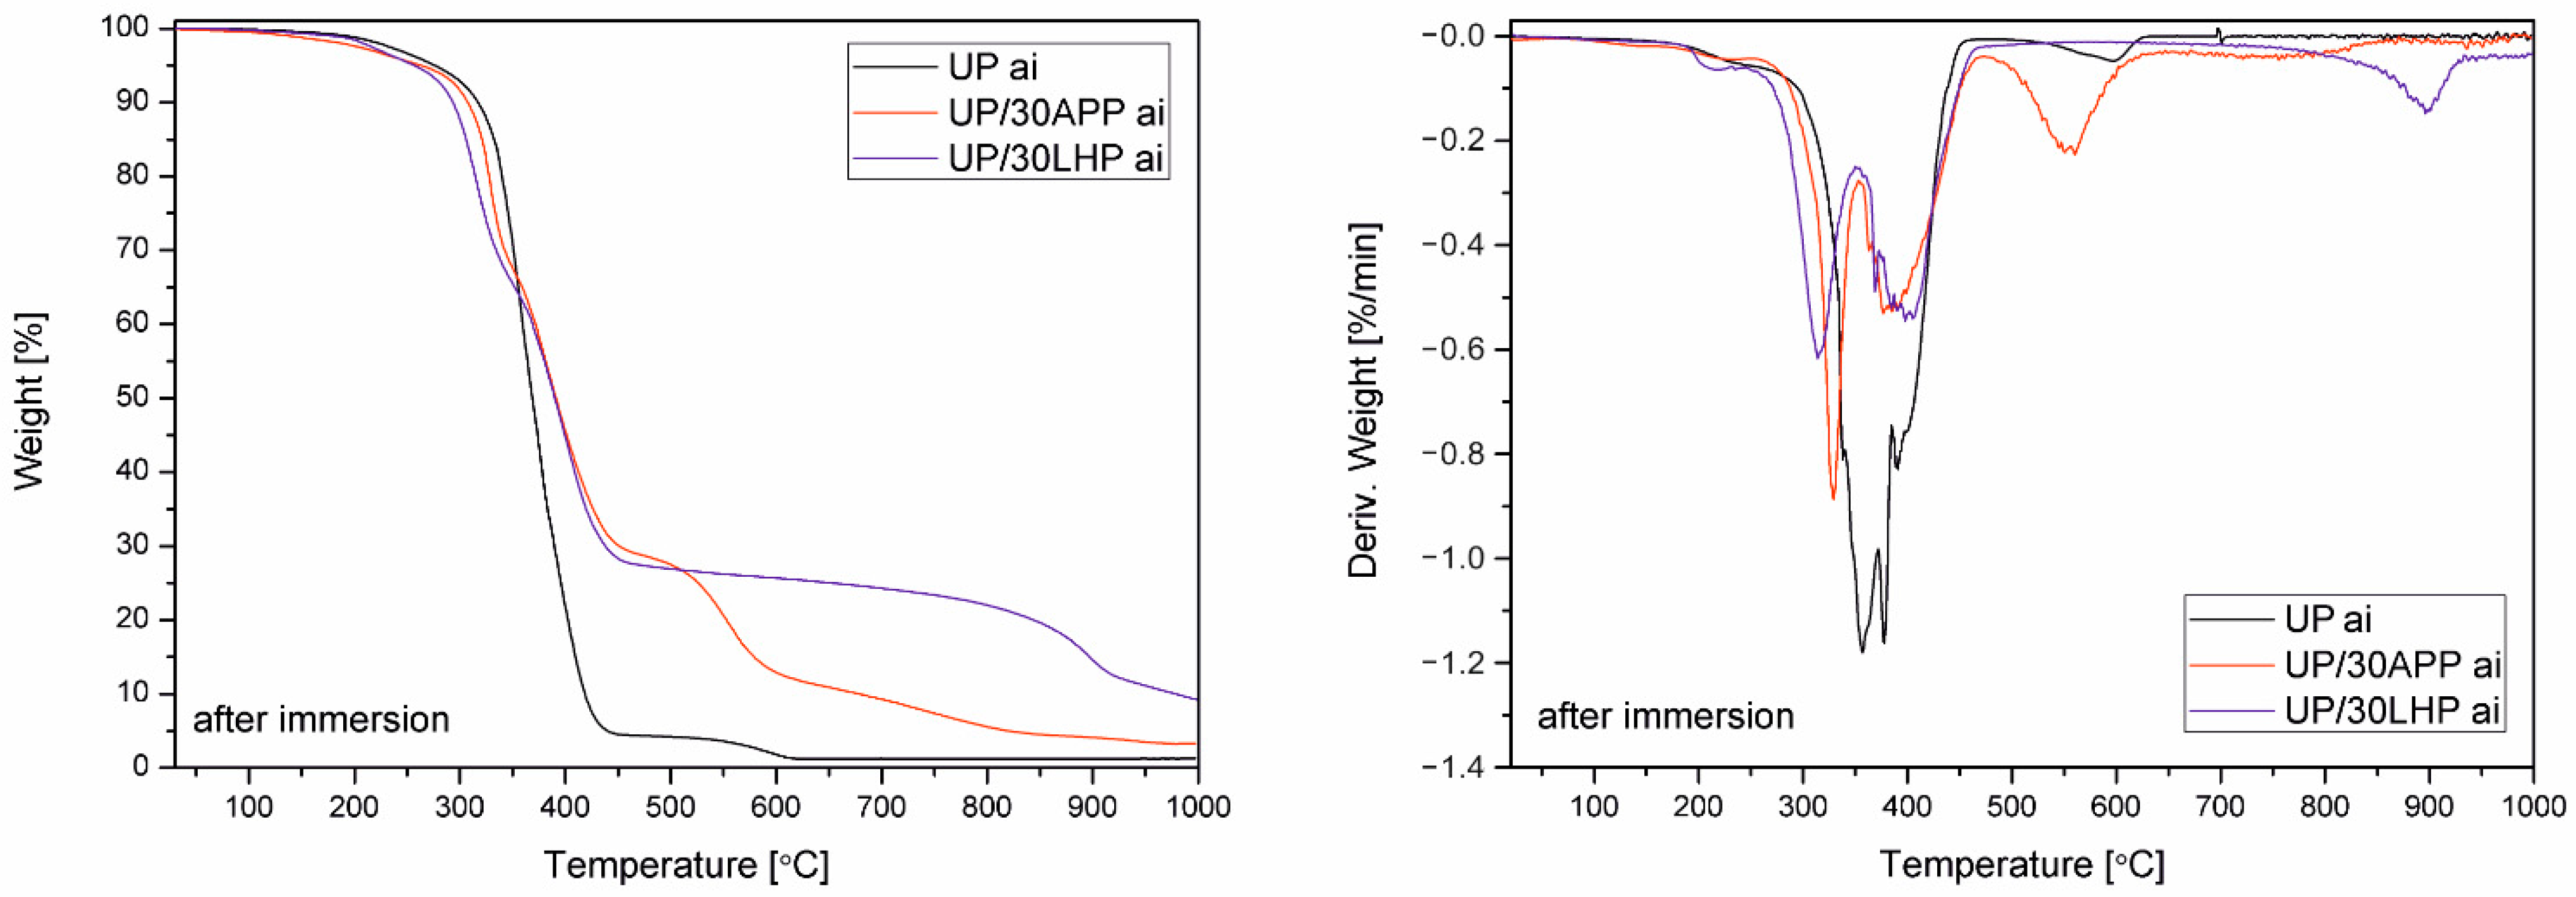
The water resistance was assessed by soaking the samples in distilled water at 70 °C for 168 h and dried at 70 °C to a constant mass using a Plus II Incubator (Gallenkamp, London, UK). The leaching of FR was calculated according to the following equation:
where
w0 is the initial mass of the sample, and W is the sample’s mass after soaking and drying. Next, the samples were subjected to a TGA conducted in accordance with the methodology described above.
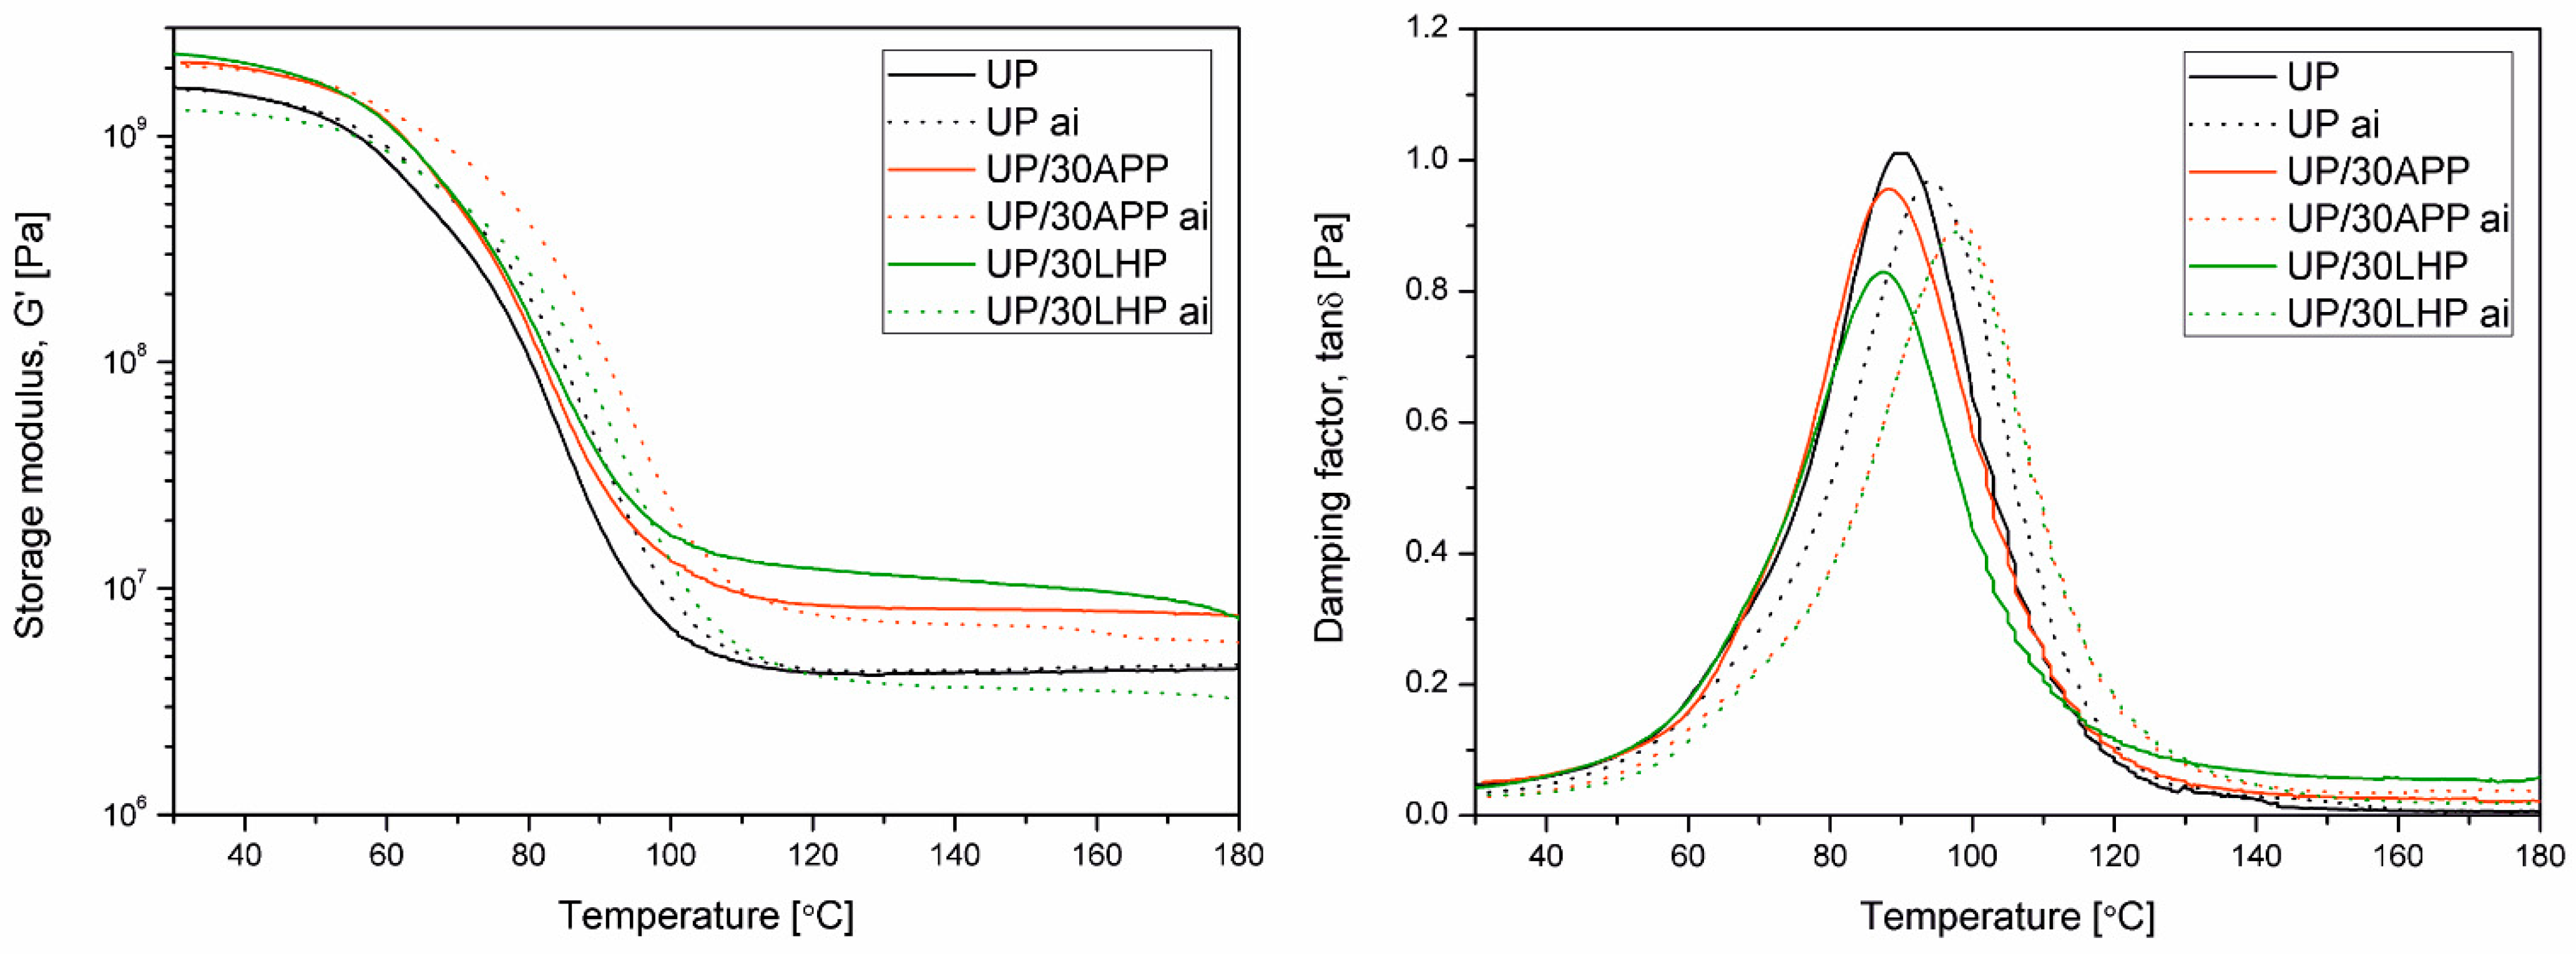
The dynamic-mechanical properties of the specimens (50 × 10 × 4 mm³) were measured using MCR 301 from Anton Paar (Graz, Austria) in torsion mode, using a frequency of 1 Hz in the temperature range of 25 °C and 200 °C and a heating rate of 2 °C/min. The position of tan δ at its maximum was taken to determine the glass transition temperature (Tg). From the rubber elasticity theory, the rubbery modulus is proportional to the cross-link density (
νe) [
38,
39], which can be evaluated from the following Equation (2) [
40]:
where
E′r is the storage modulus in the rubbery region,
R is the gas constant (8.3145 [J·mol
−1·K
−1],
ϕ is the front factor which may be assumed to unity for a good order-of-magnitude prediction, and
T is the absolute temperature. In our studies, due to the application of DMTA measurements in torsion mode, the
G′ was used instead of
E′. The
G′r values were determined in a rubbery plateau range at a constant temperature of 140 °C. From thermomechanical, data additional parameter the effectiveness of the filler, which is based on the determination of the
C factor defined as follows [
41]:
where
G′g and
G′r are the values of storage modulus determined in the glassy and rubbery state of the material; in the presented case,
G′ values were taken at 30 °C and 140 °C.
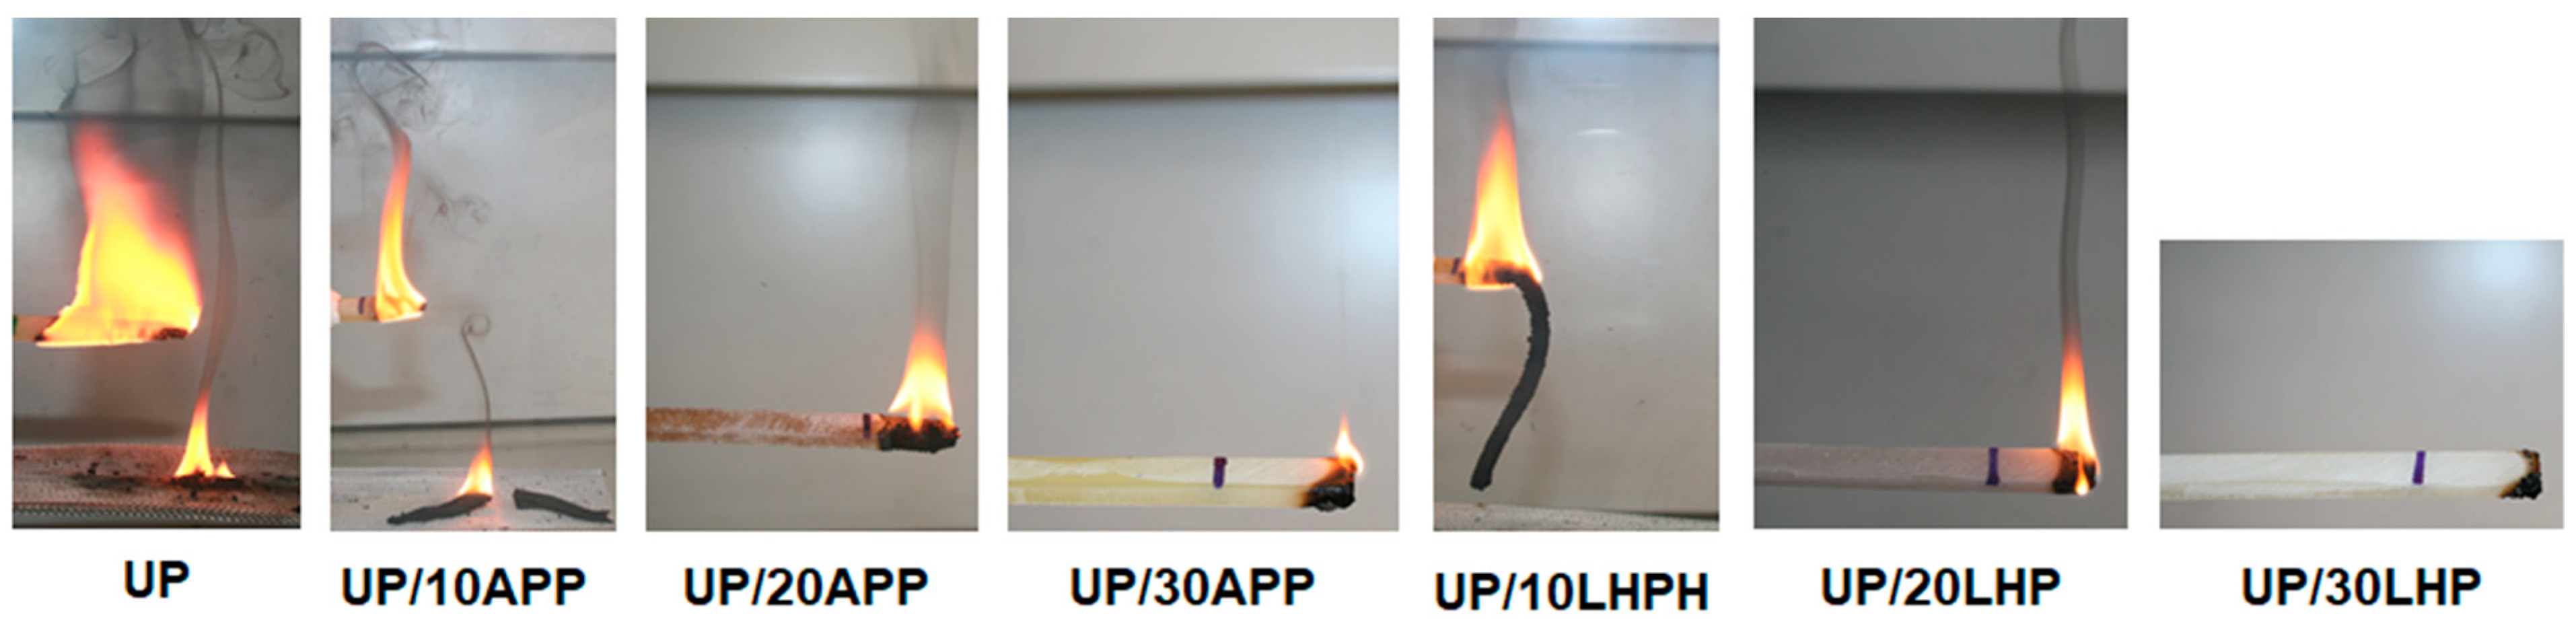
The horizontal burning tests were performed according to the standard IEC 60695-11-10. The specimens (125 × 10 × 4 mm³) were subjected to a 50 W test flame. The burning was assessed using its linear burning rate (v) calculated from the following equation:
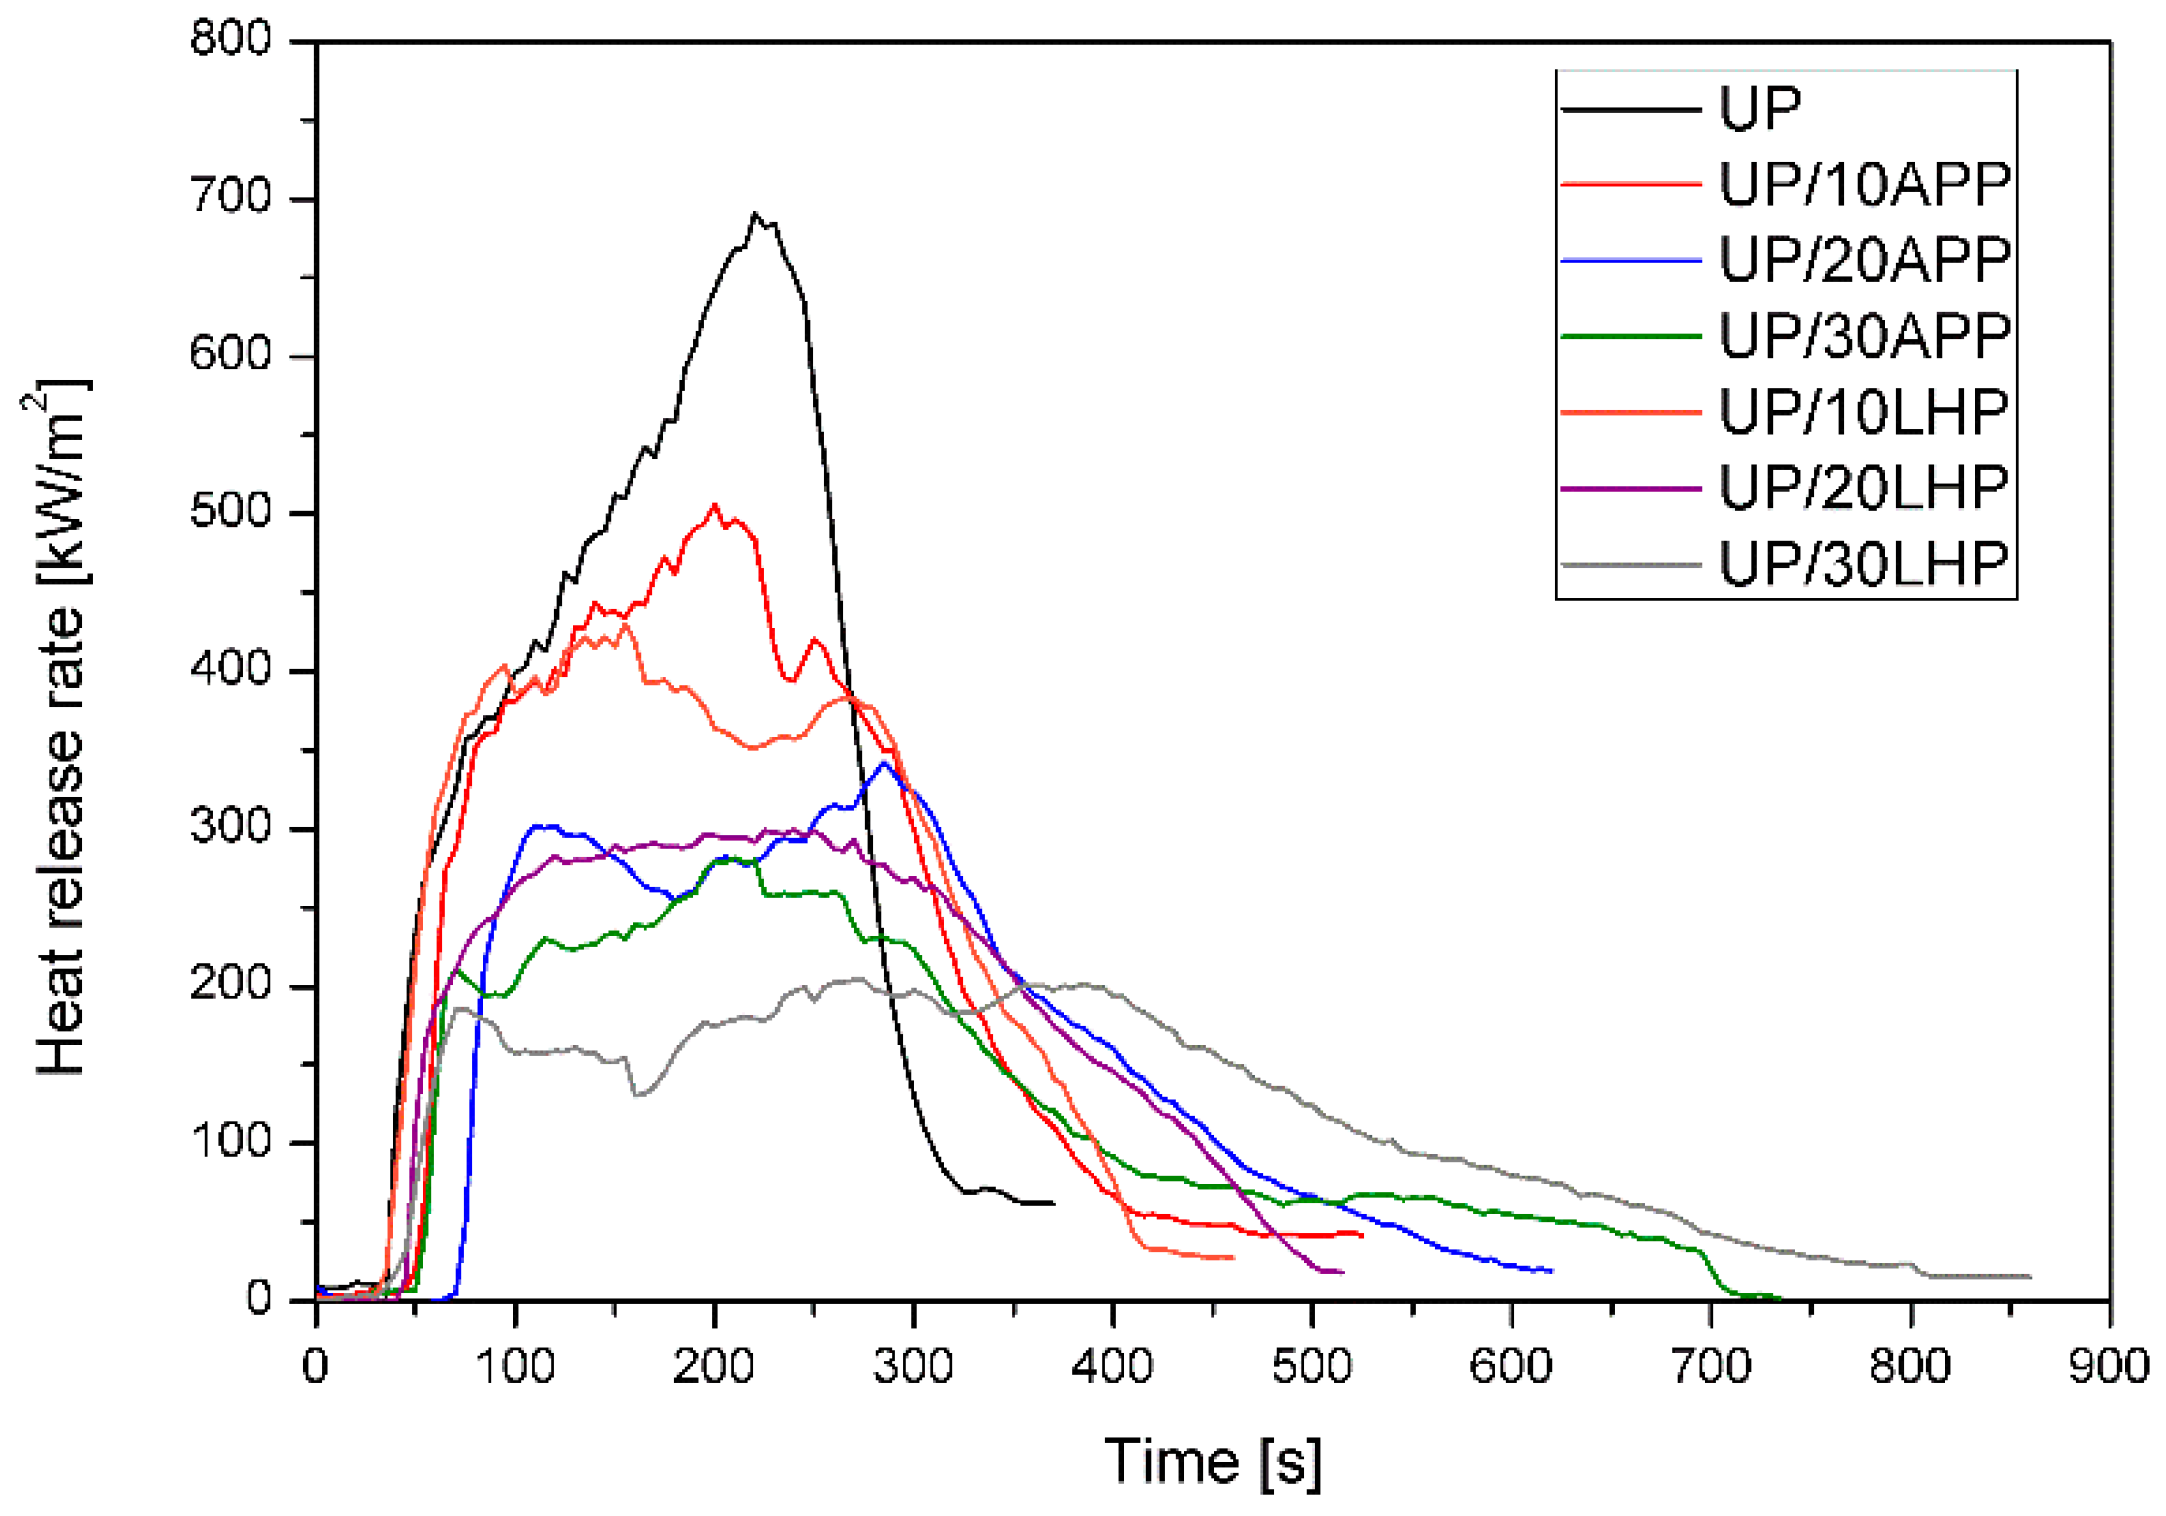
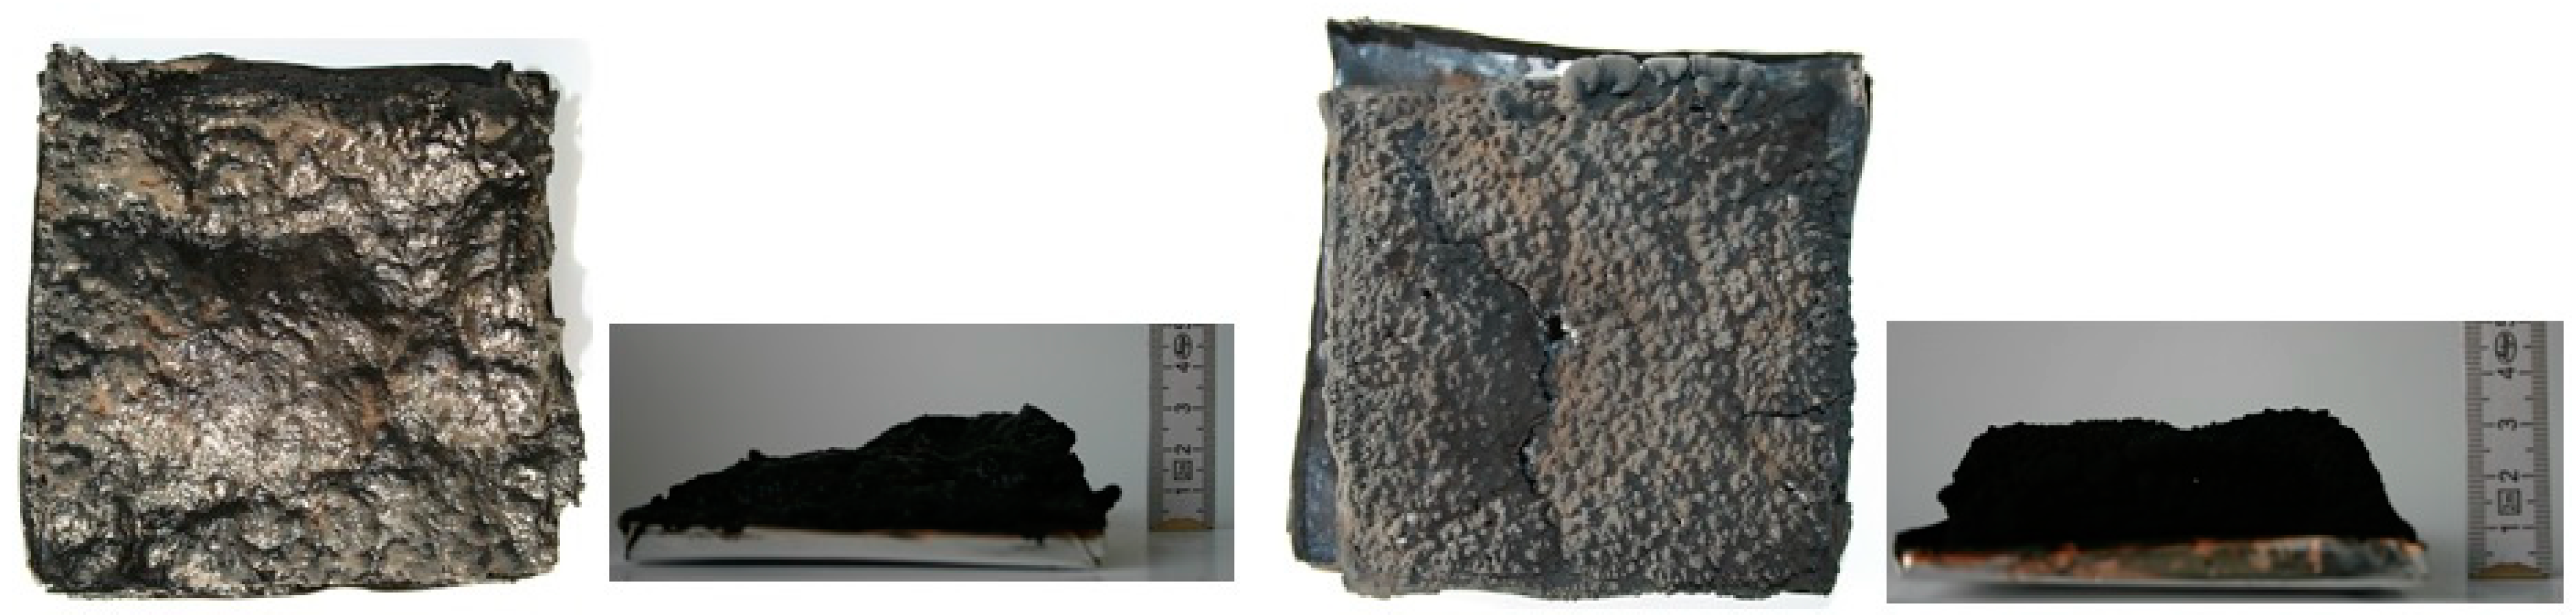
Fire behavior was assessed using a cone calorimeter (Fire Testing Technology, East Grinstead, UK). The samples (100 × 100 × 6 mm³) were placed in aluminum foil and tested at a heat flux of 35 kW/m2 applied horizontally to the sample, in conformity with ISO 5660 standard. The separation space between samples and the heater was set at 25 mm. Spark ignition was used to ignite the pyrolysis products. The residues were photographed using a digital camera EOS 400 D (Canon Inc., Tokyo, Japan).
The optical density of smoke was assessed using a smoke density chamber (Fire Testing Technology Ltd., East Grinstead, UK). The samples (75 × 75 × 6 mm³) were exposed to a heat flux of 25 kW/m2 without applying the pilot flame, in conformity with ISO 5659-2 standard. As in the CC tests case, the values are the average obtained for three samples from each series.
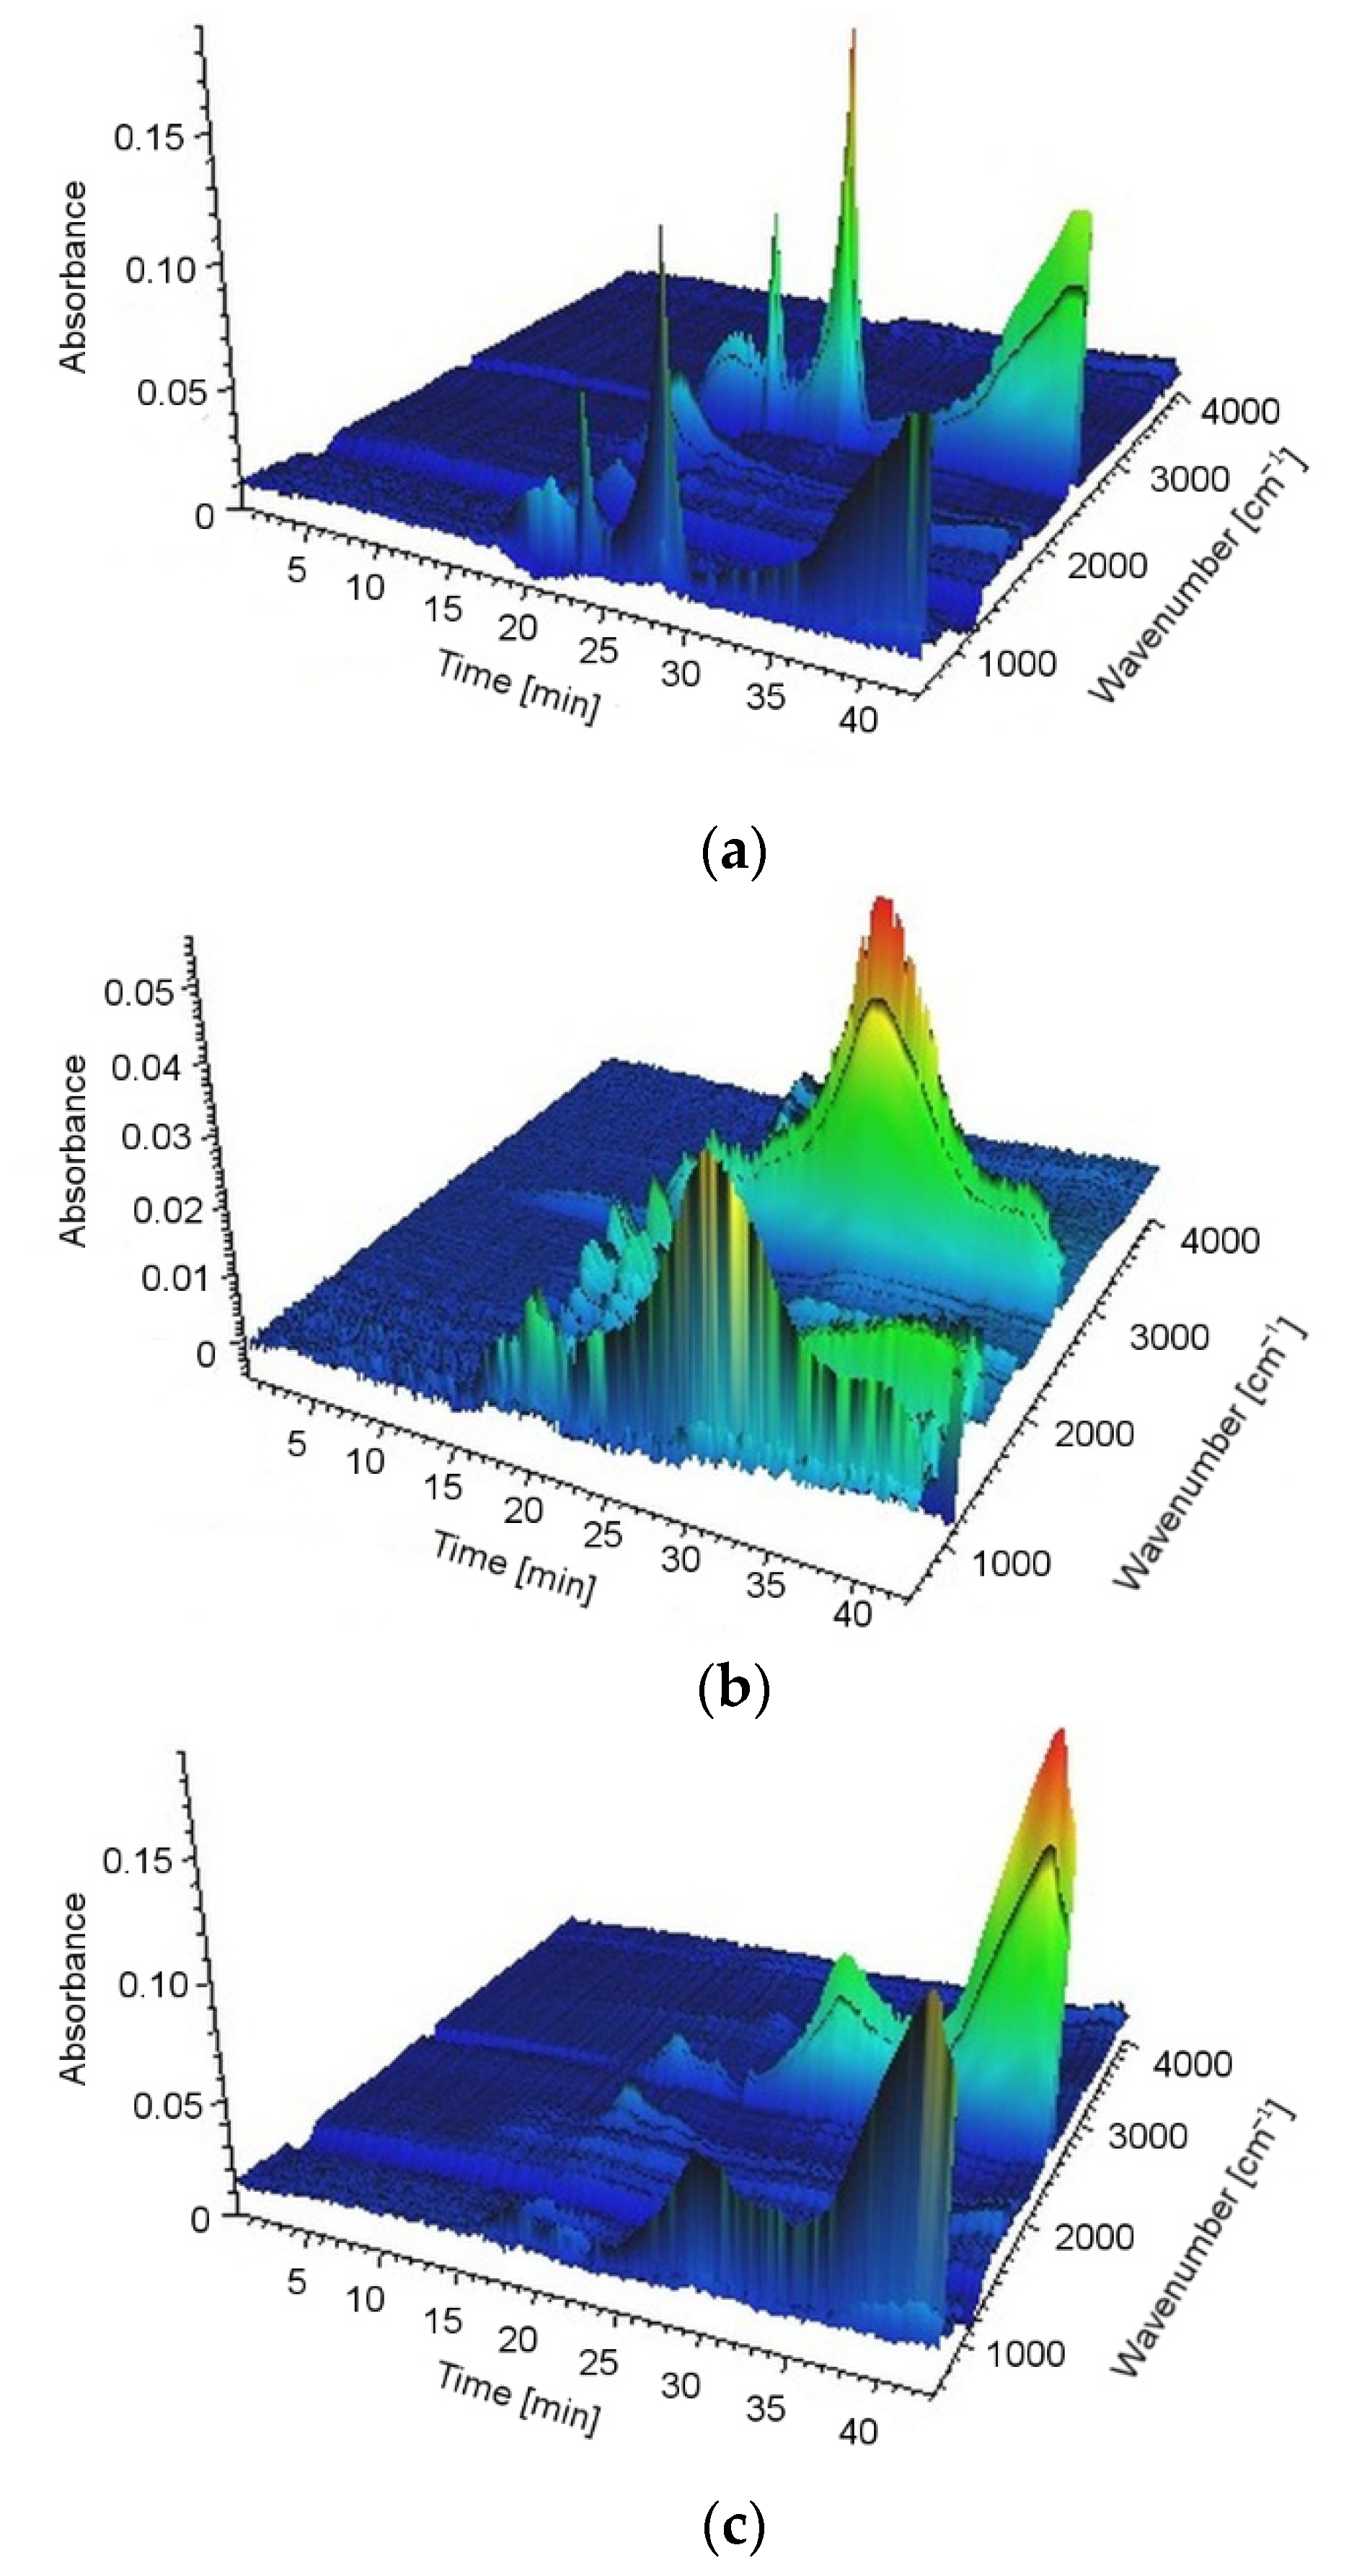
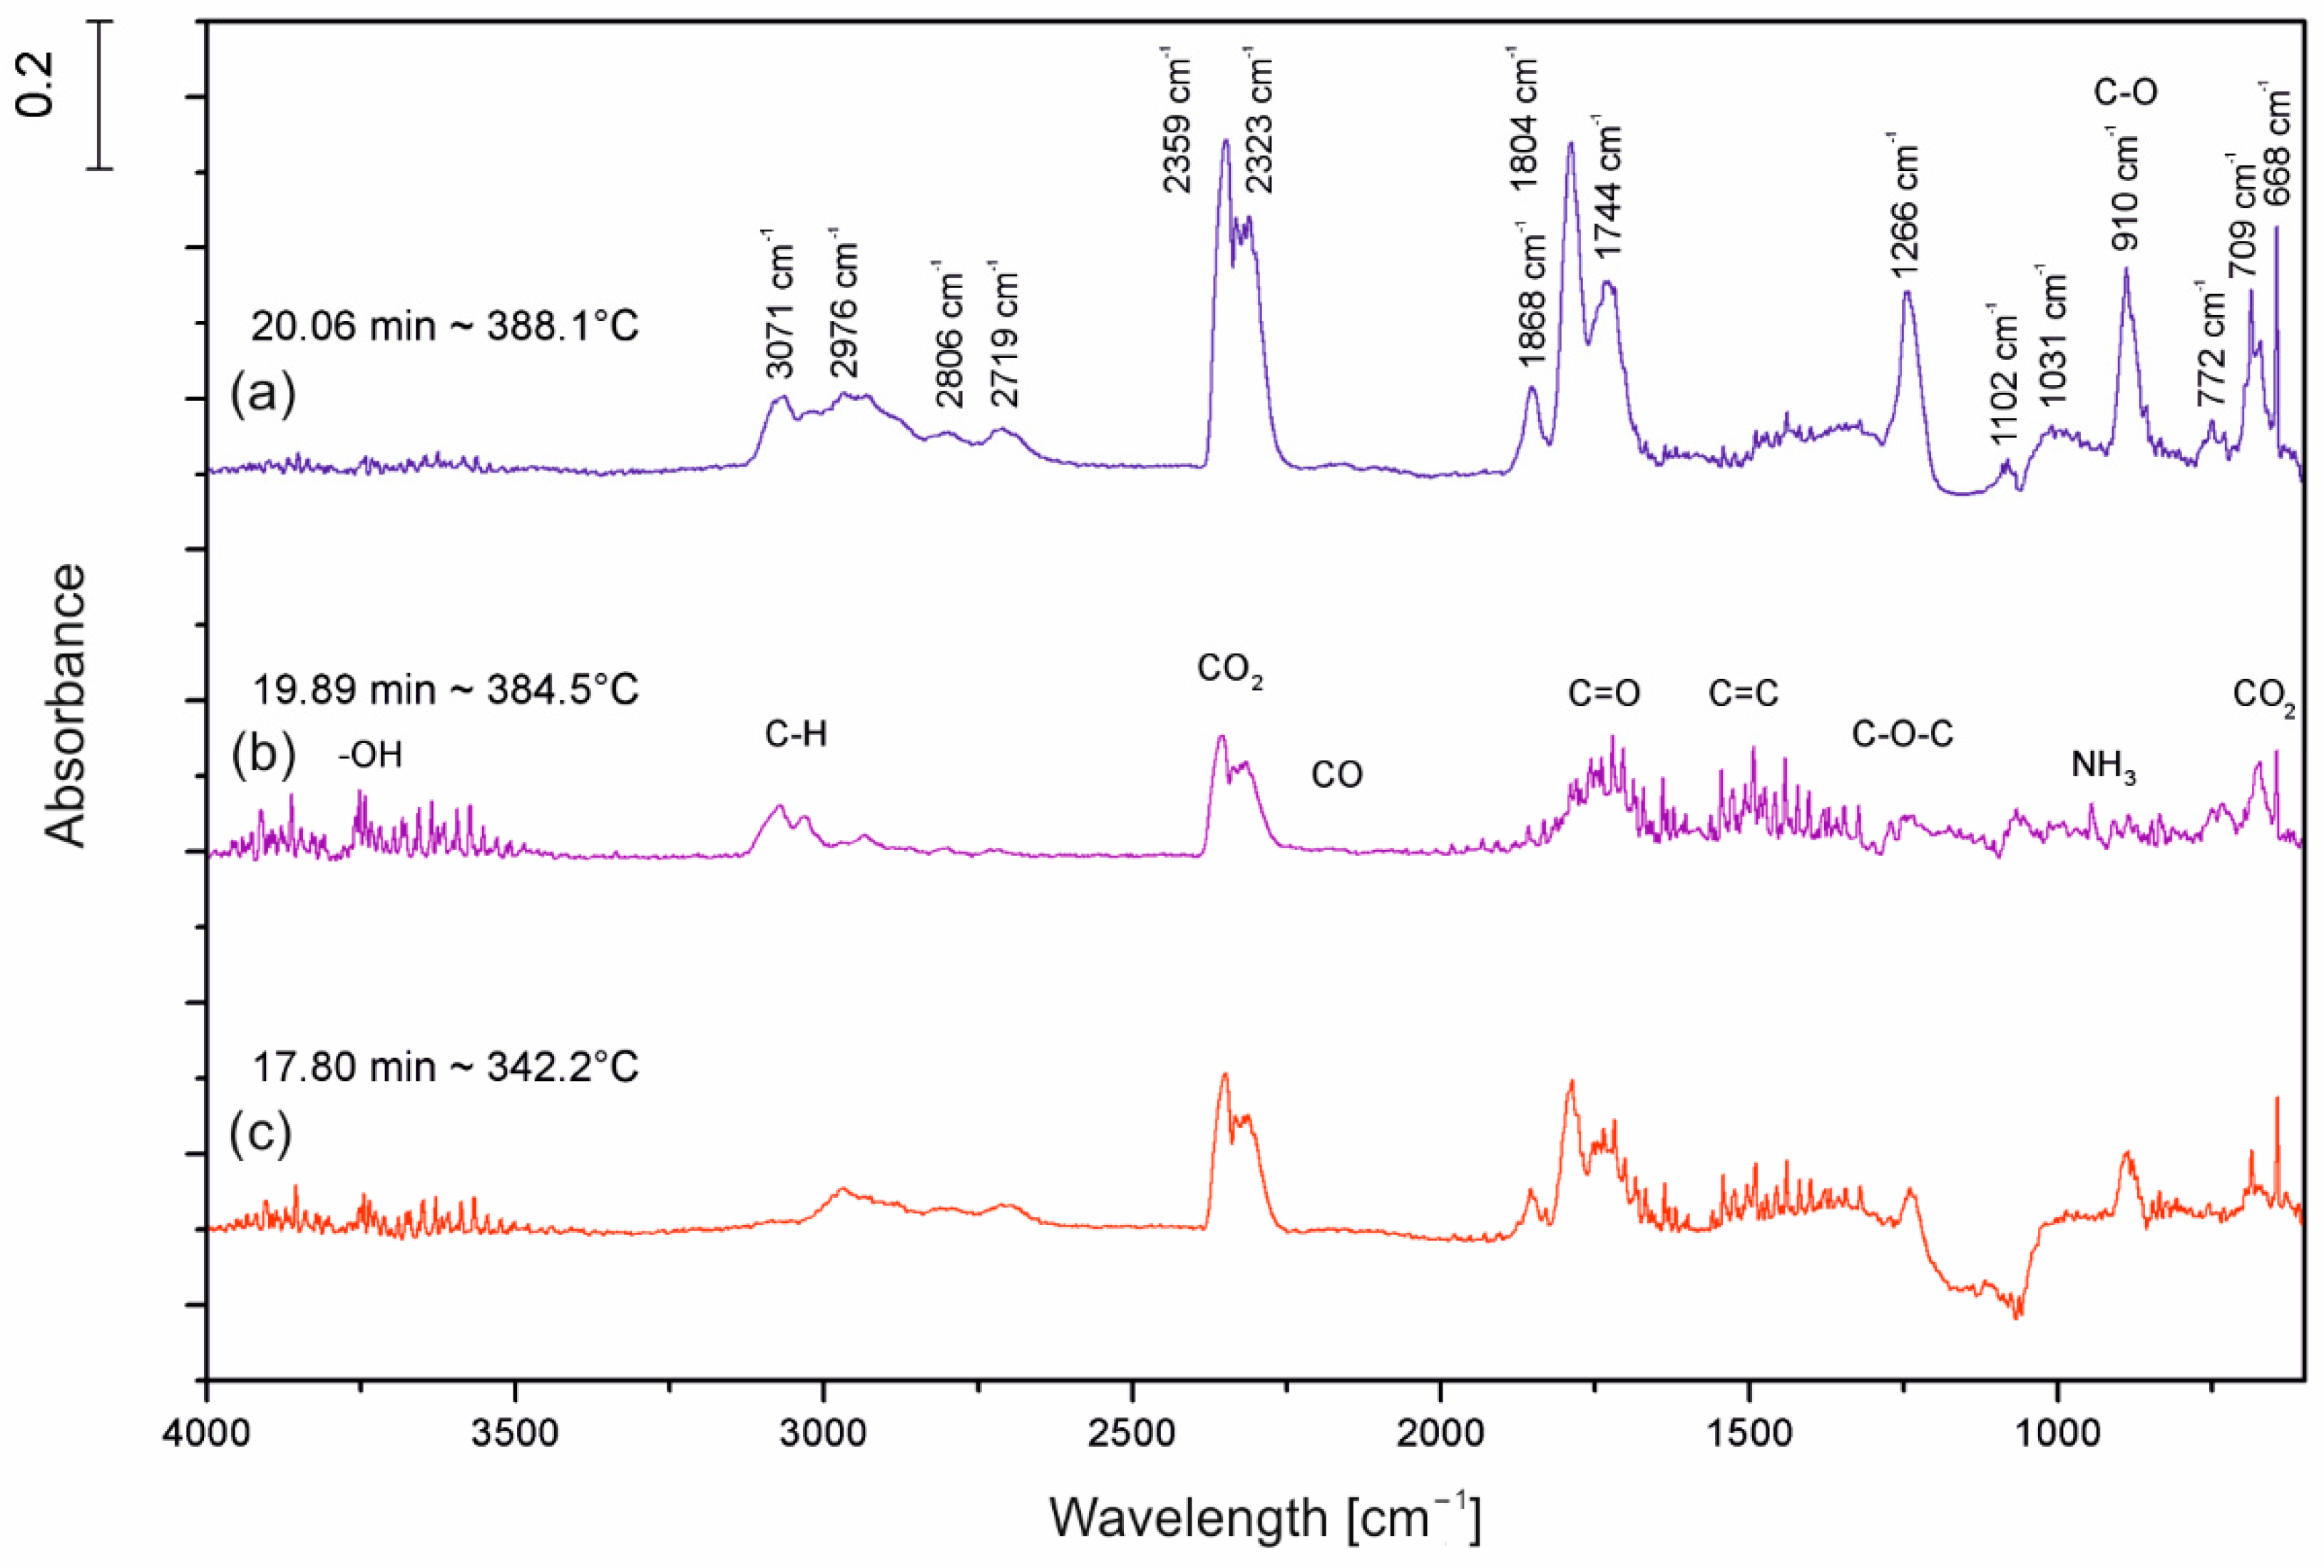
The gas-phase analysis was carried out in TGA Q500 (TA Instruments Ltd., New Castle, PA, USA) coupled with FT-IR Nicolet 6700 spectrometer (Thermo Scientific, Waltham, MA, USA), using 64 counts. The samples (10 mg) were heated in the air from room temperature up to 800 °C at a rate of 20 °C/min. To reduce the possibility of evolved products condensing along the transfer line the FT-IR gas cell was held at 240 °C, and the temperature of the transfer line was set at 250 °C. The analyses were performed in a spectral range of 400–4000 cm−1 and with a resolution of 4 cm−1.


 ,
, 


