Physicochemical Properties, Antioxidant and Antidiabetic Activities of Polysaccharides from Quinoa (Chenopodium quinoa Willd.) Seeds

 ,
,
Abstract
:1. Introduction
2. Results and Discussion
2.1. Chemical Compositions of QPs
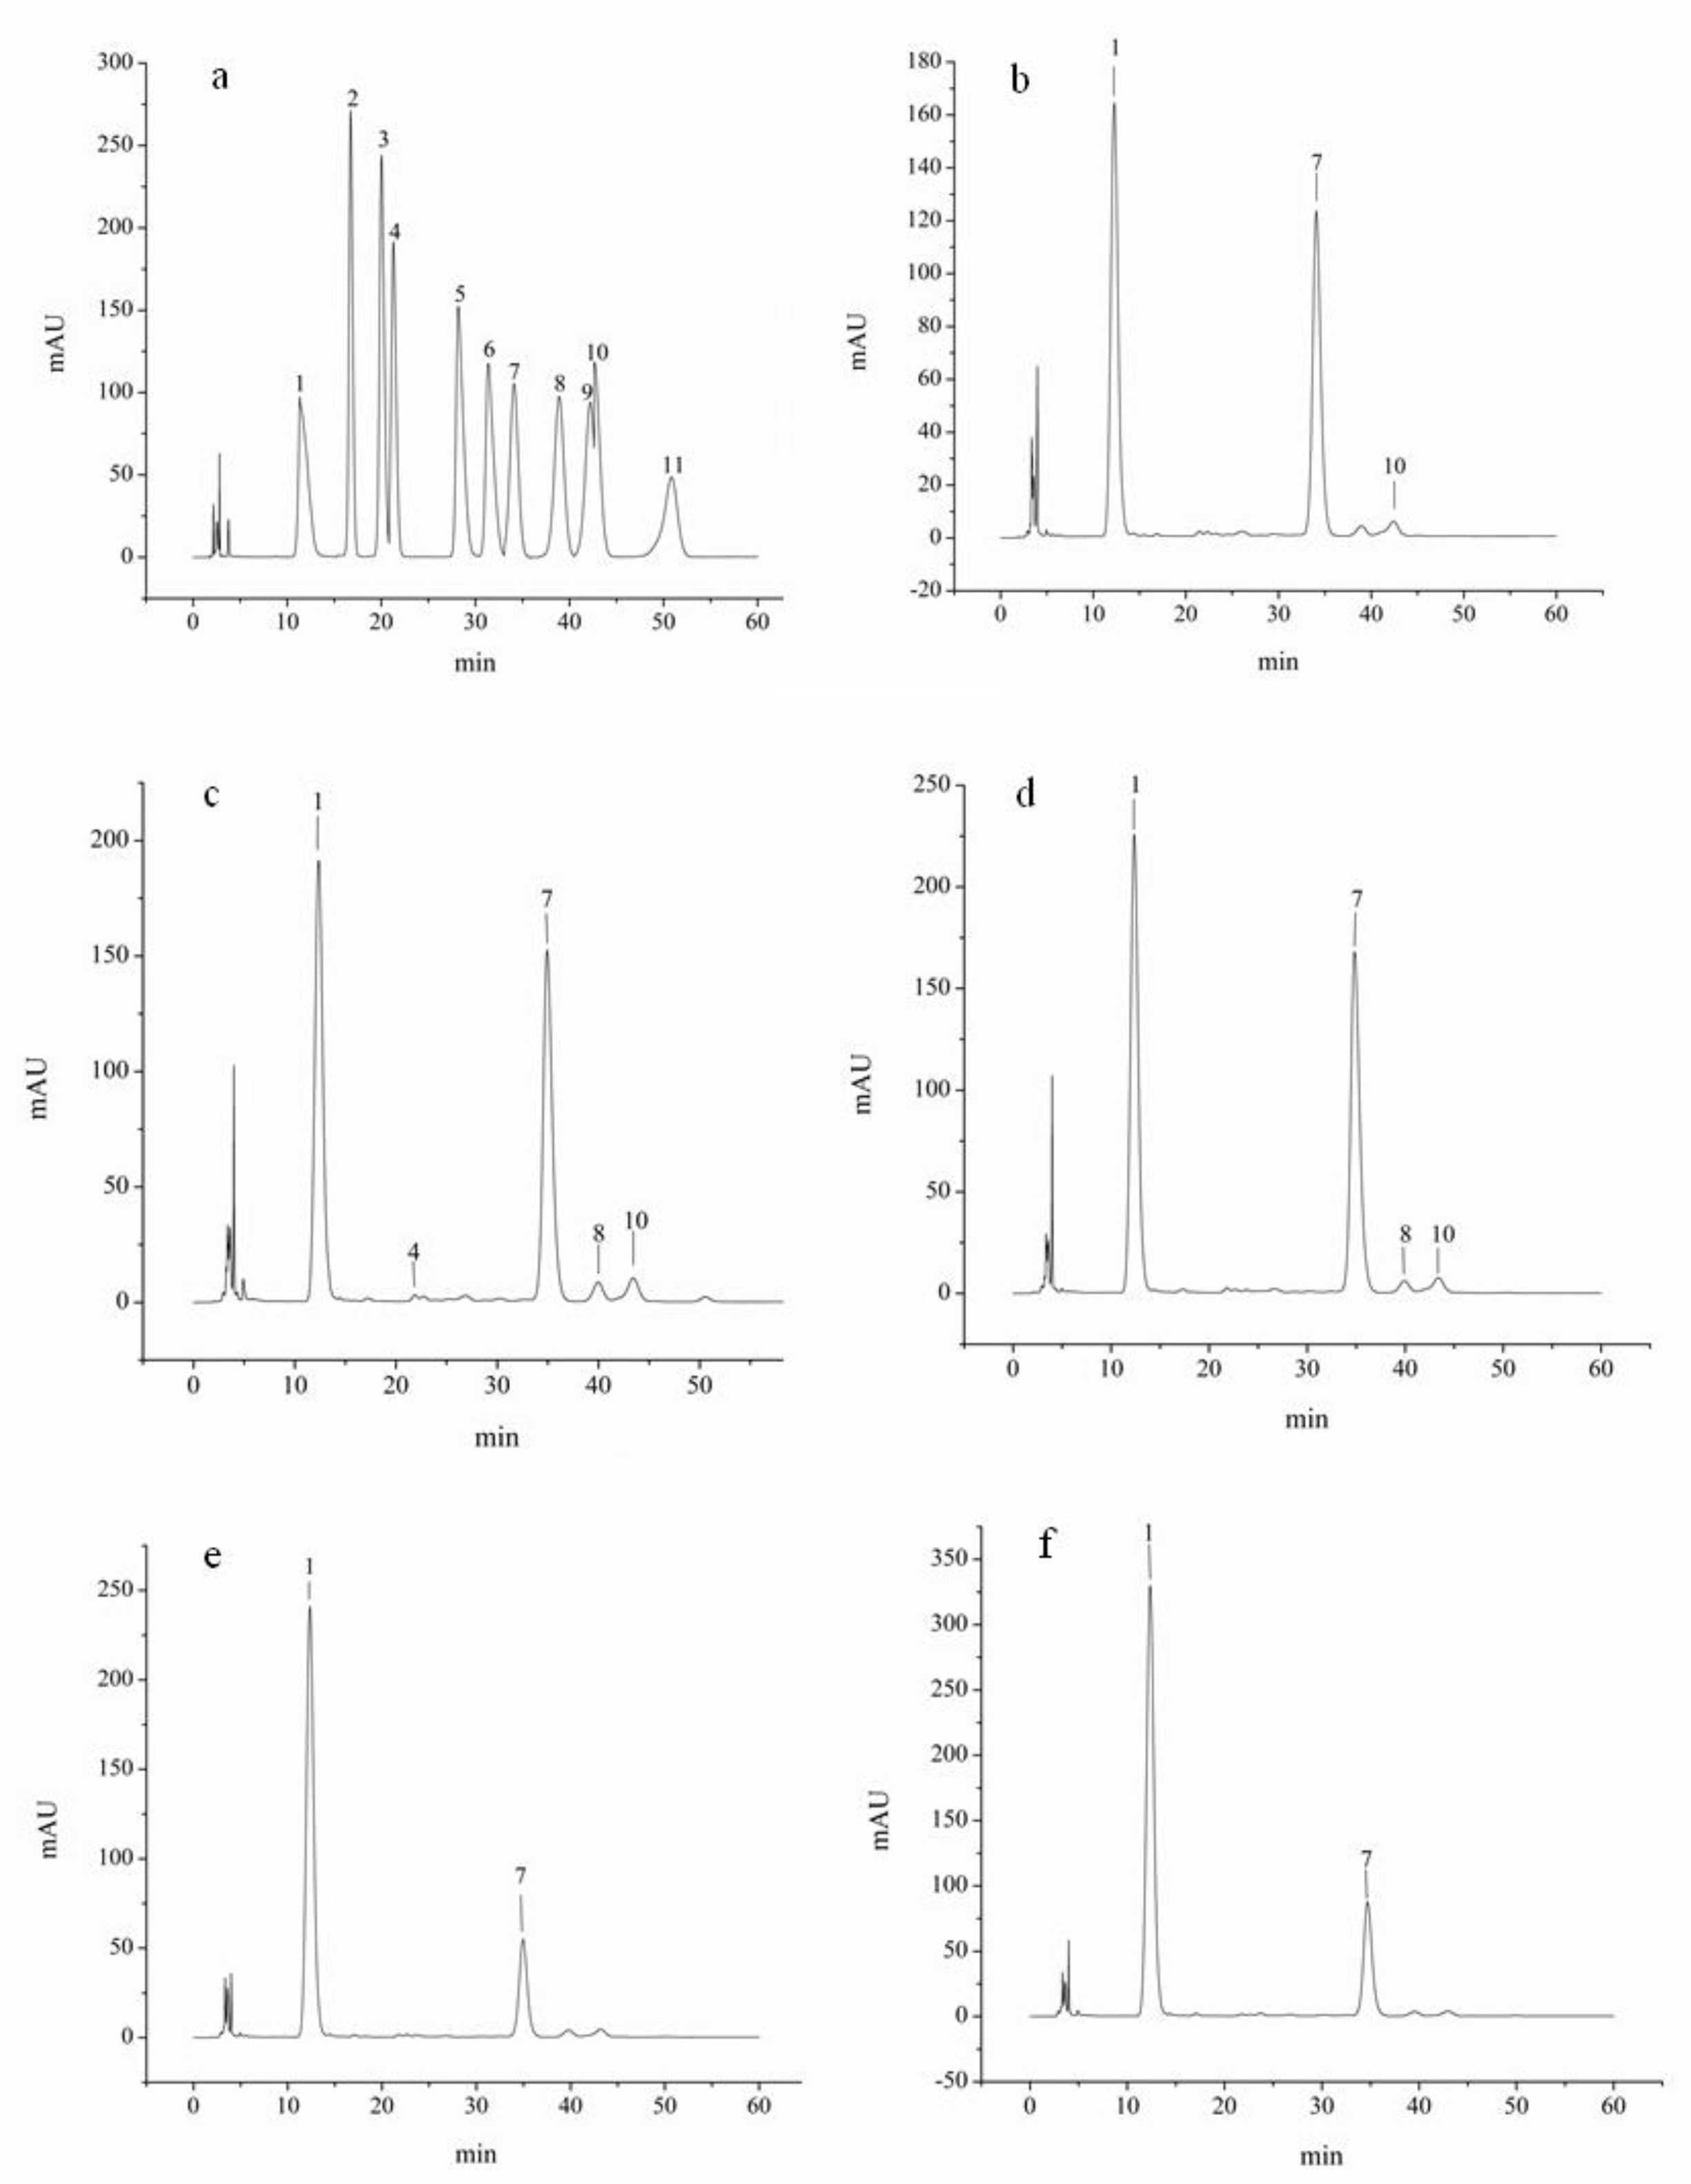
2.2. Monosaccharide Composition of QPs
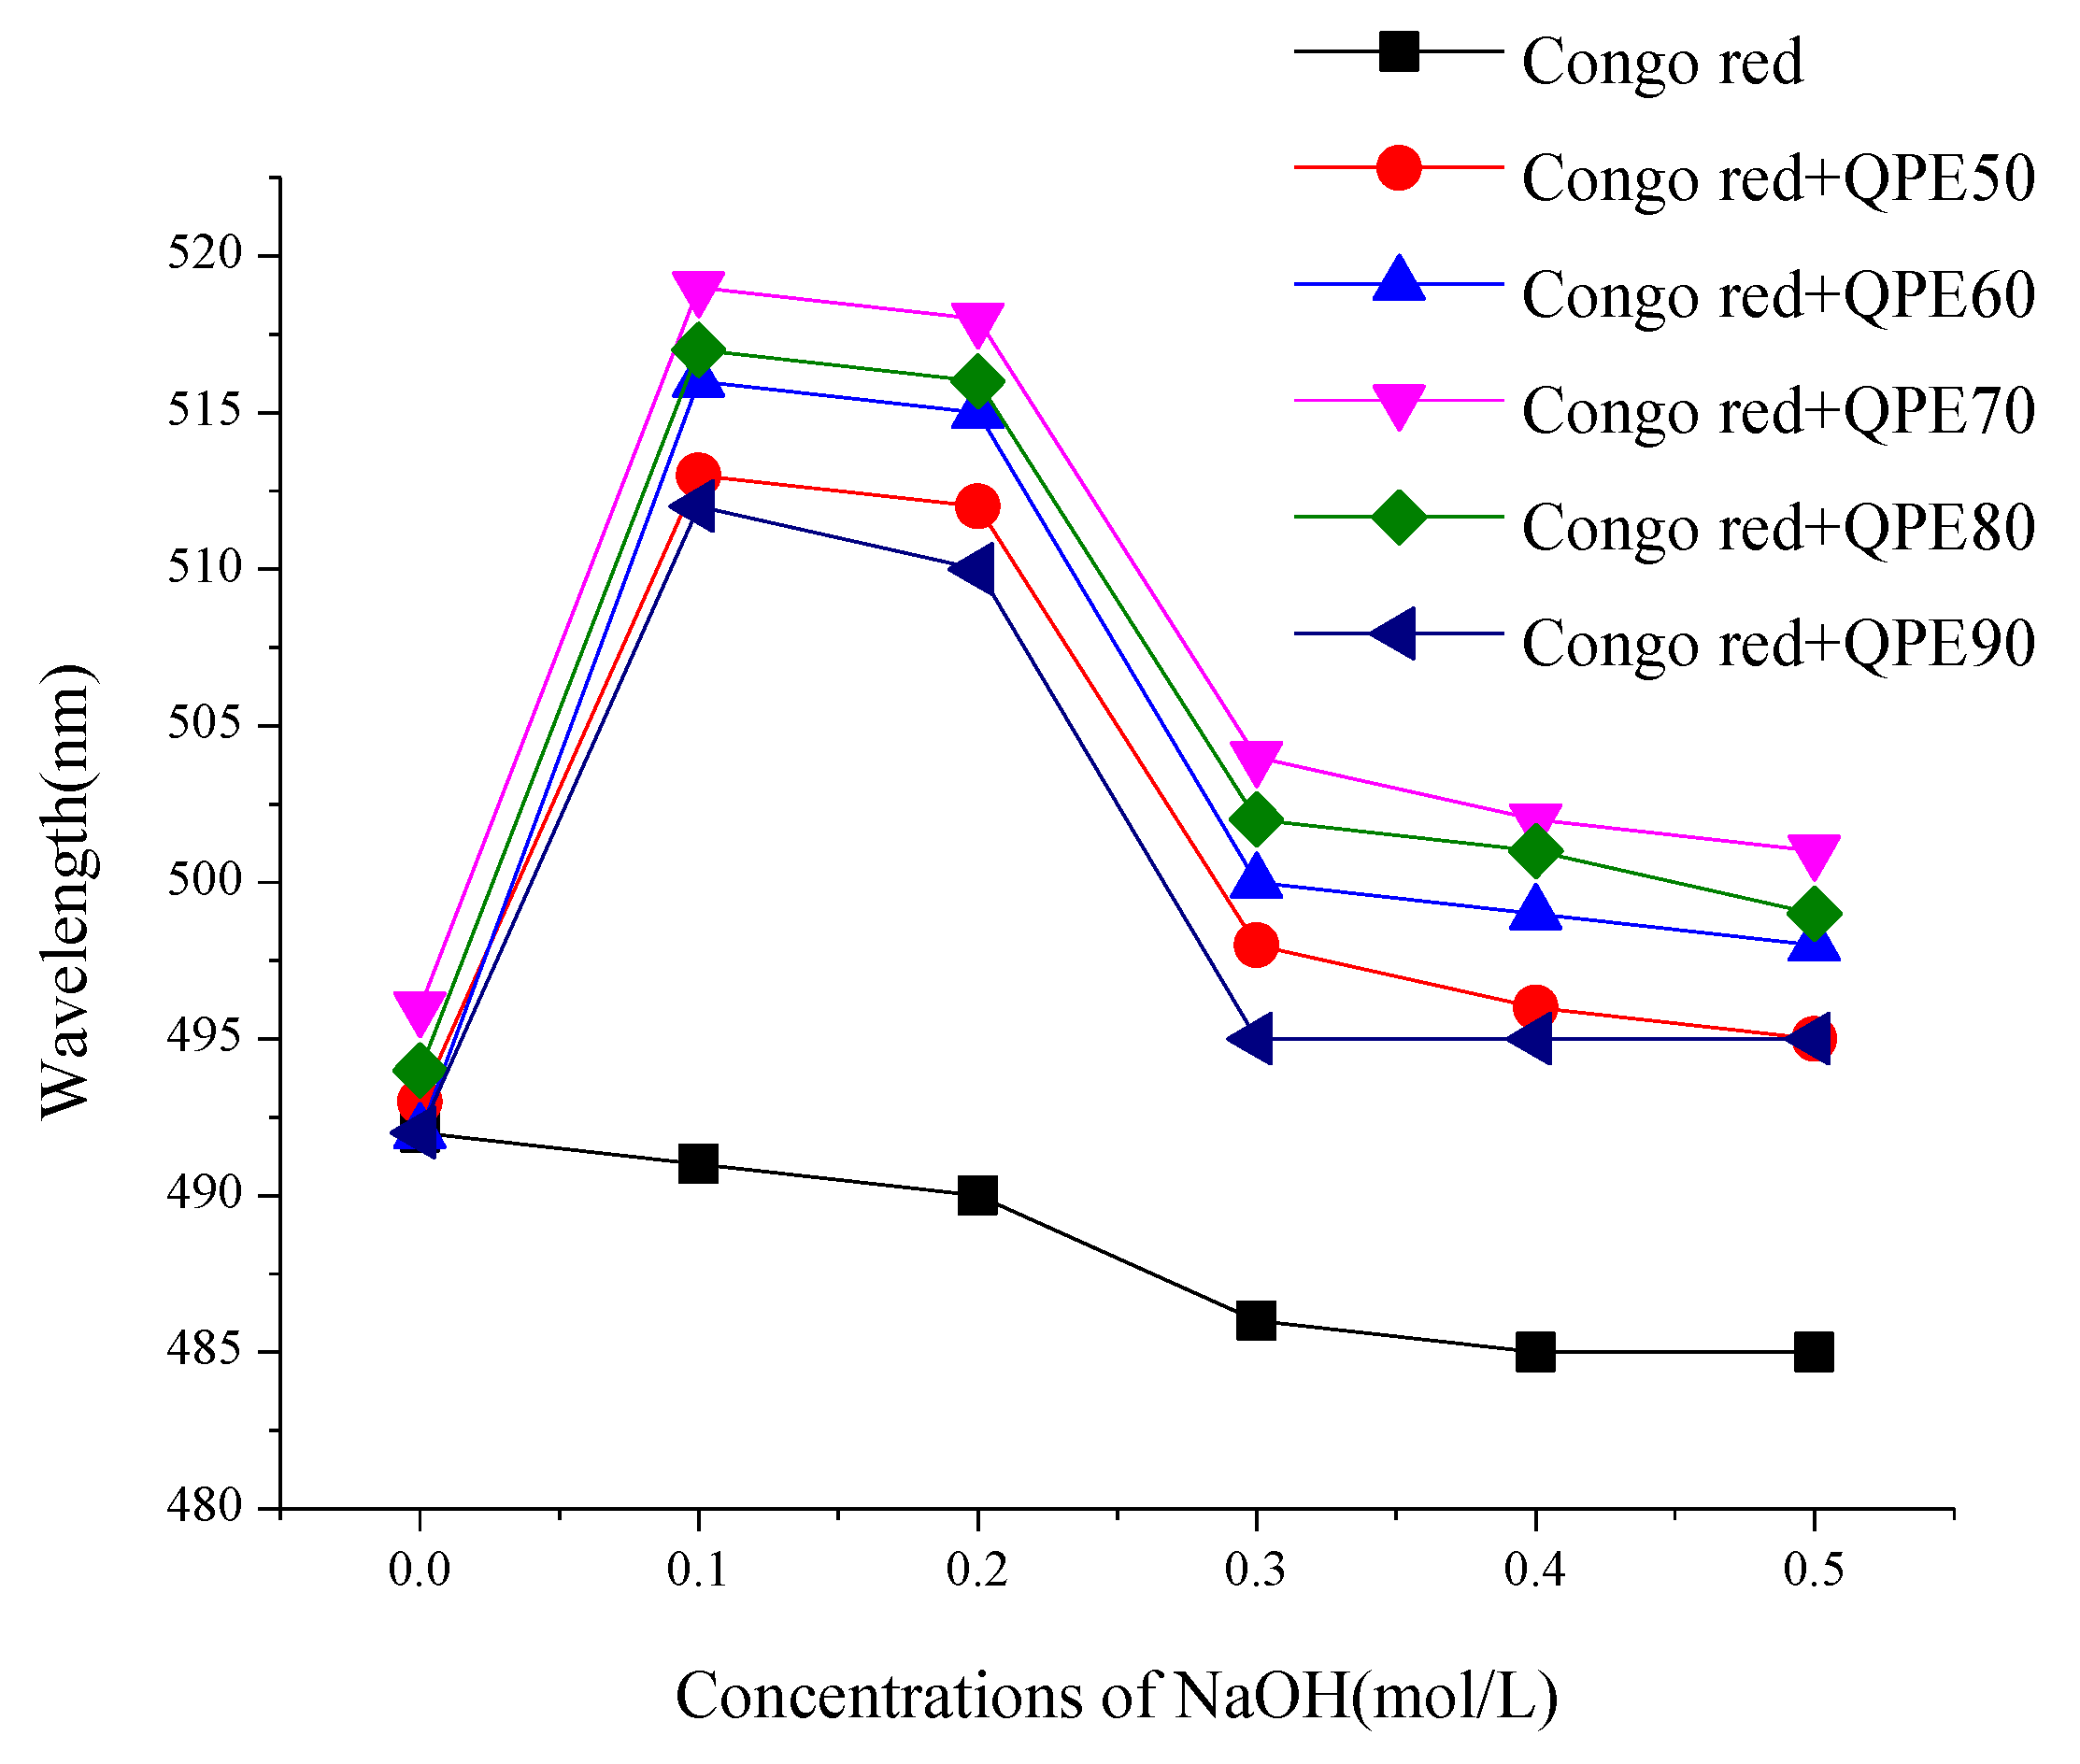
2.3. Congo Red Test
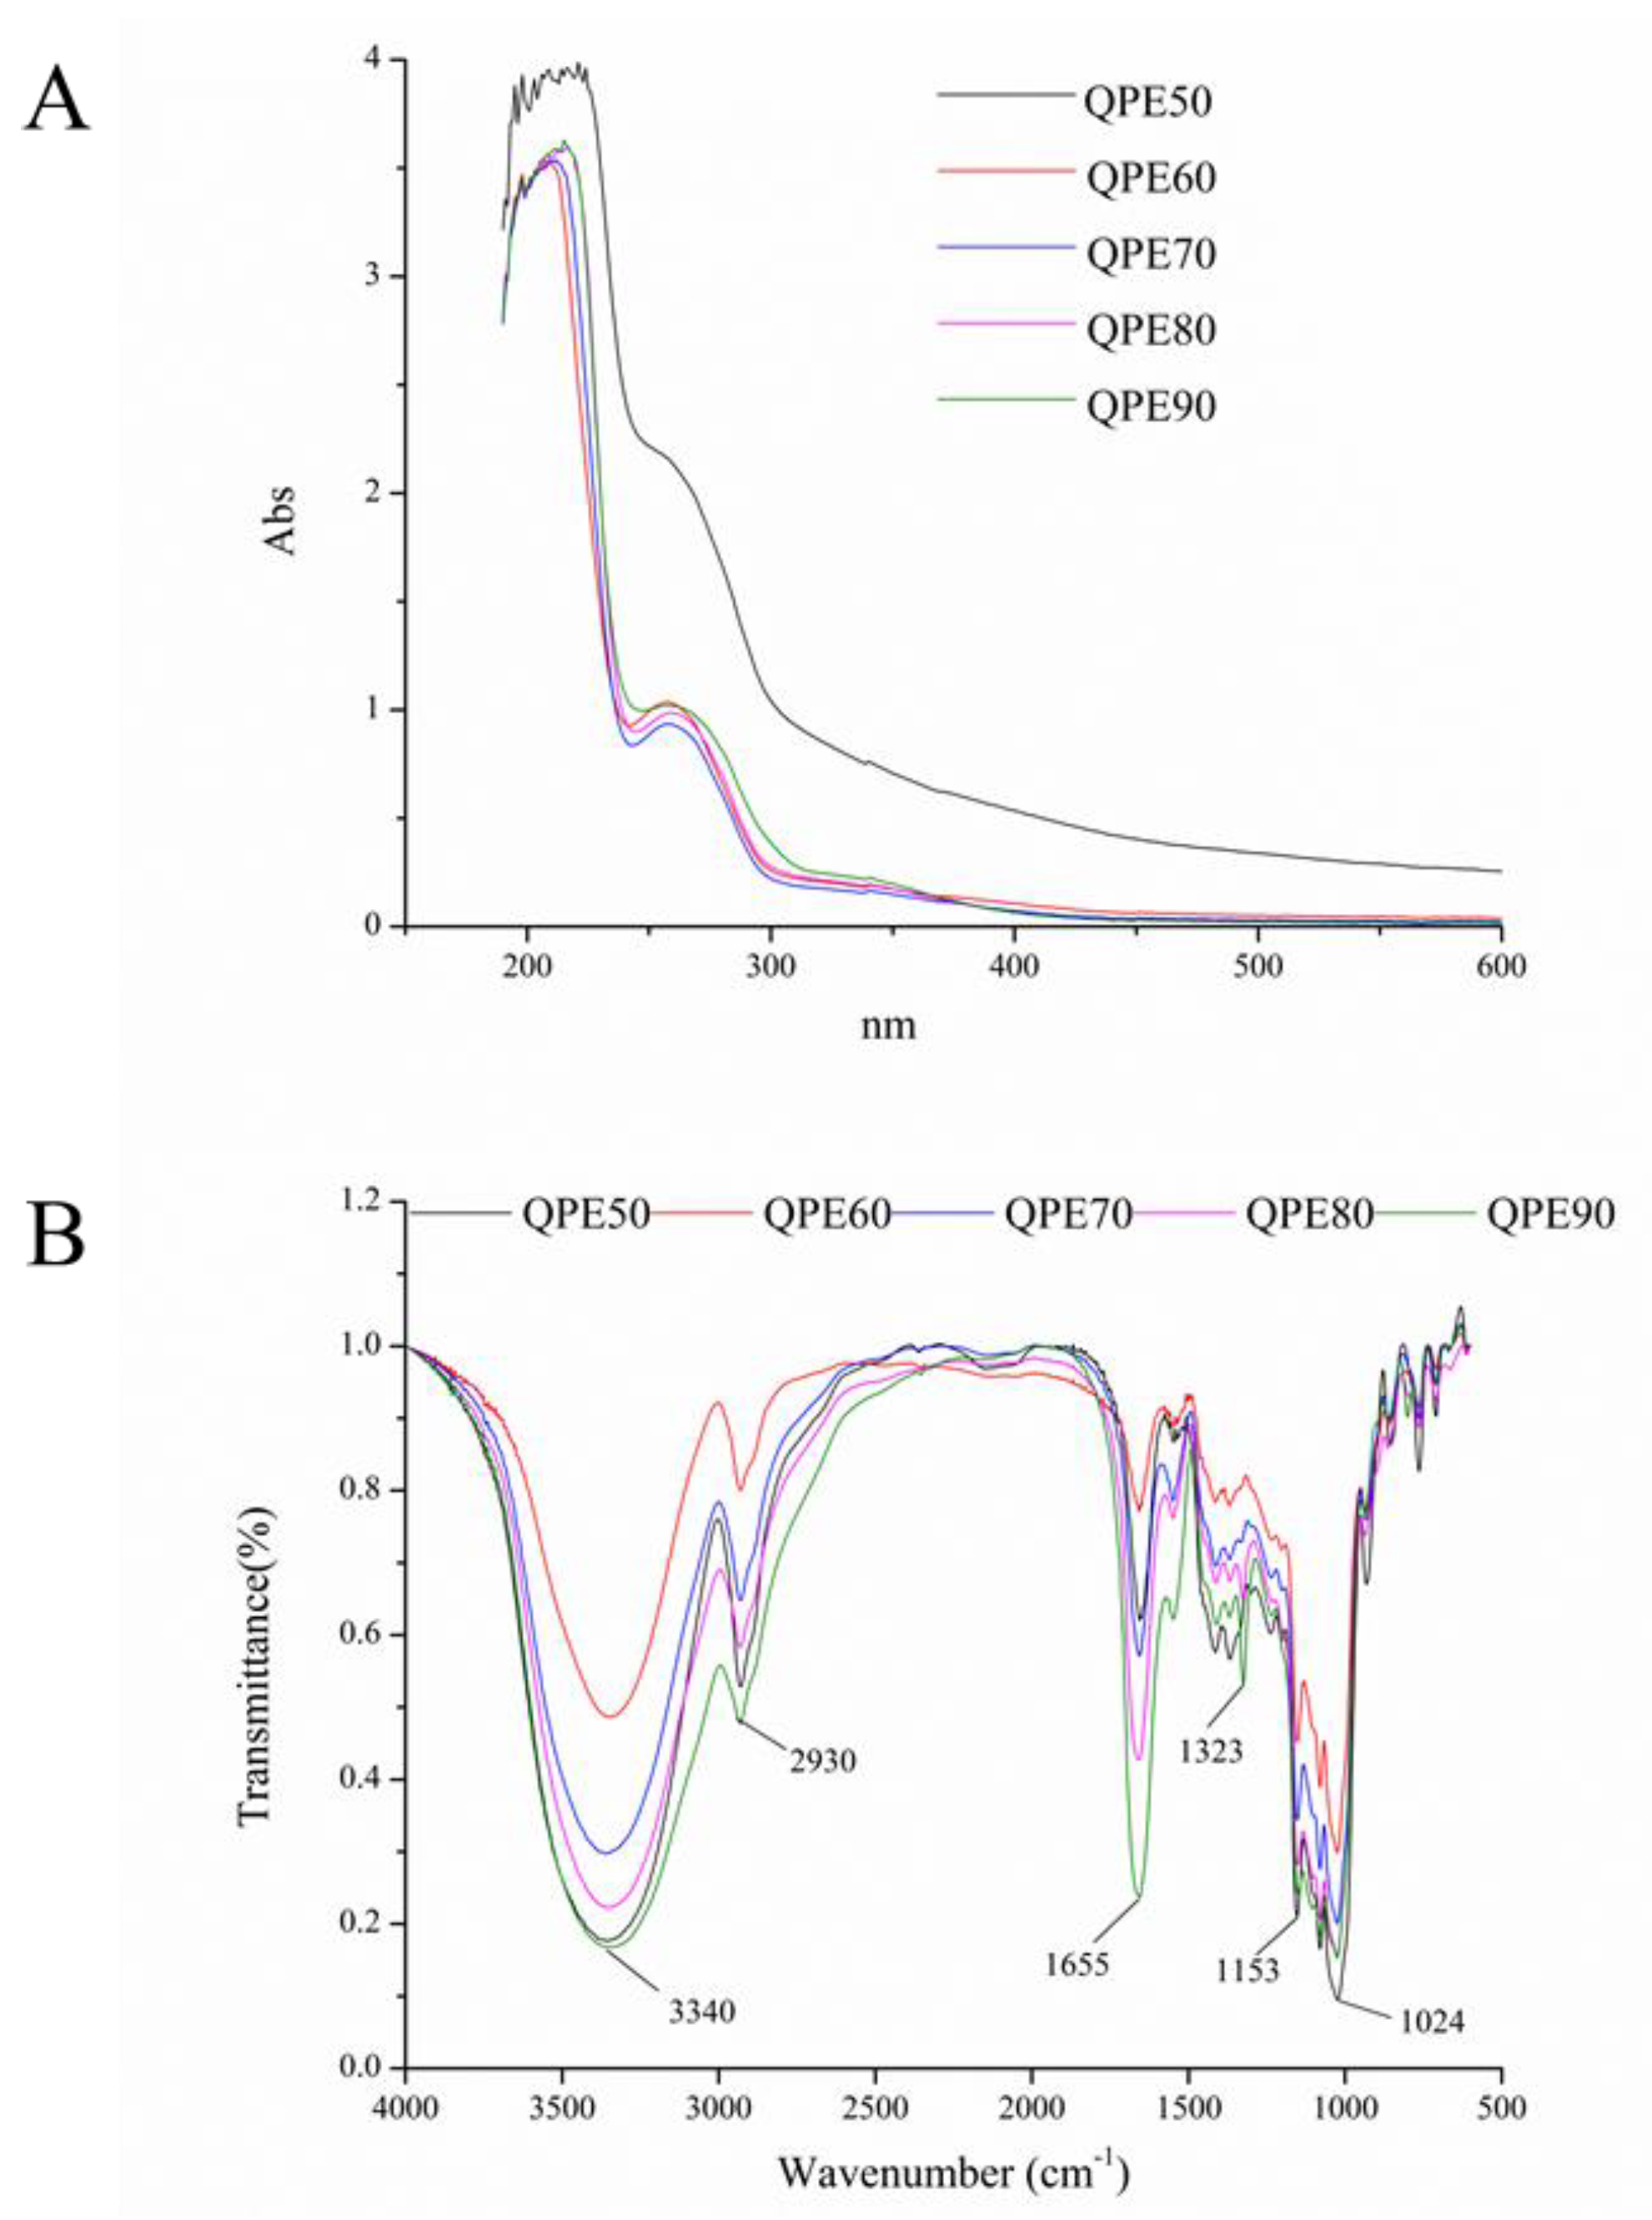
2.4. UV and FT-IR Spectroscopy of QPs
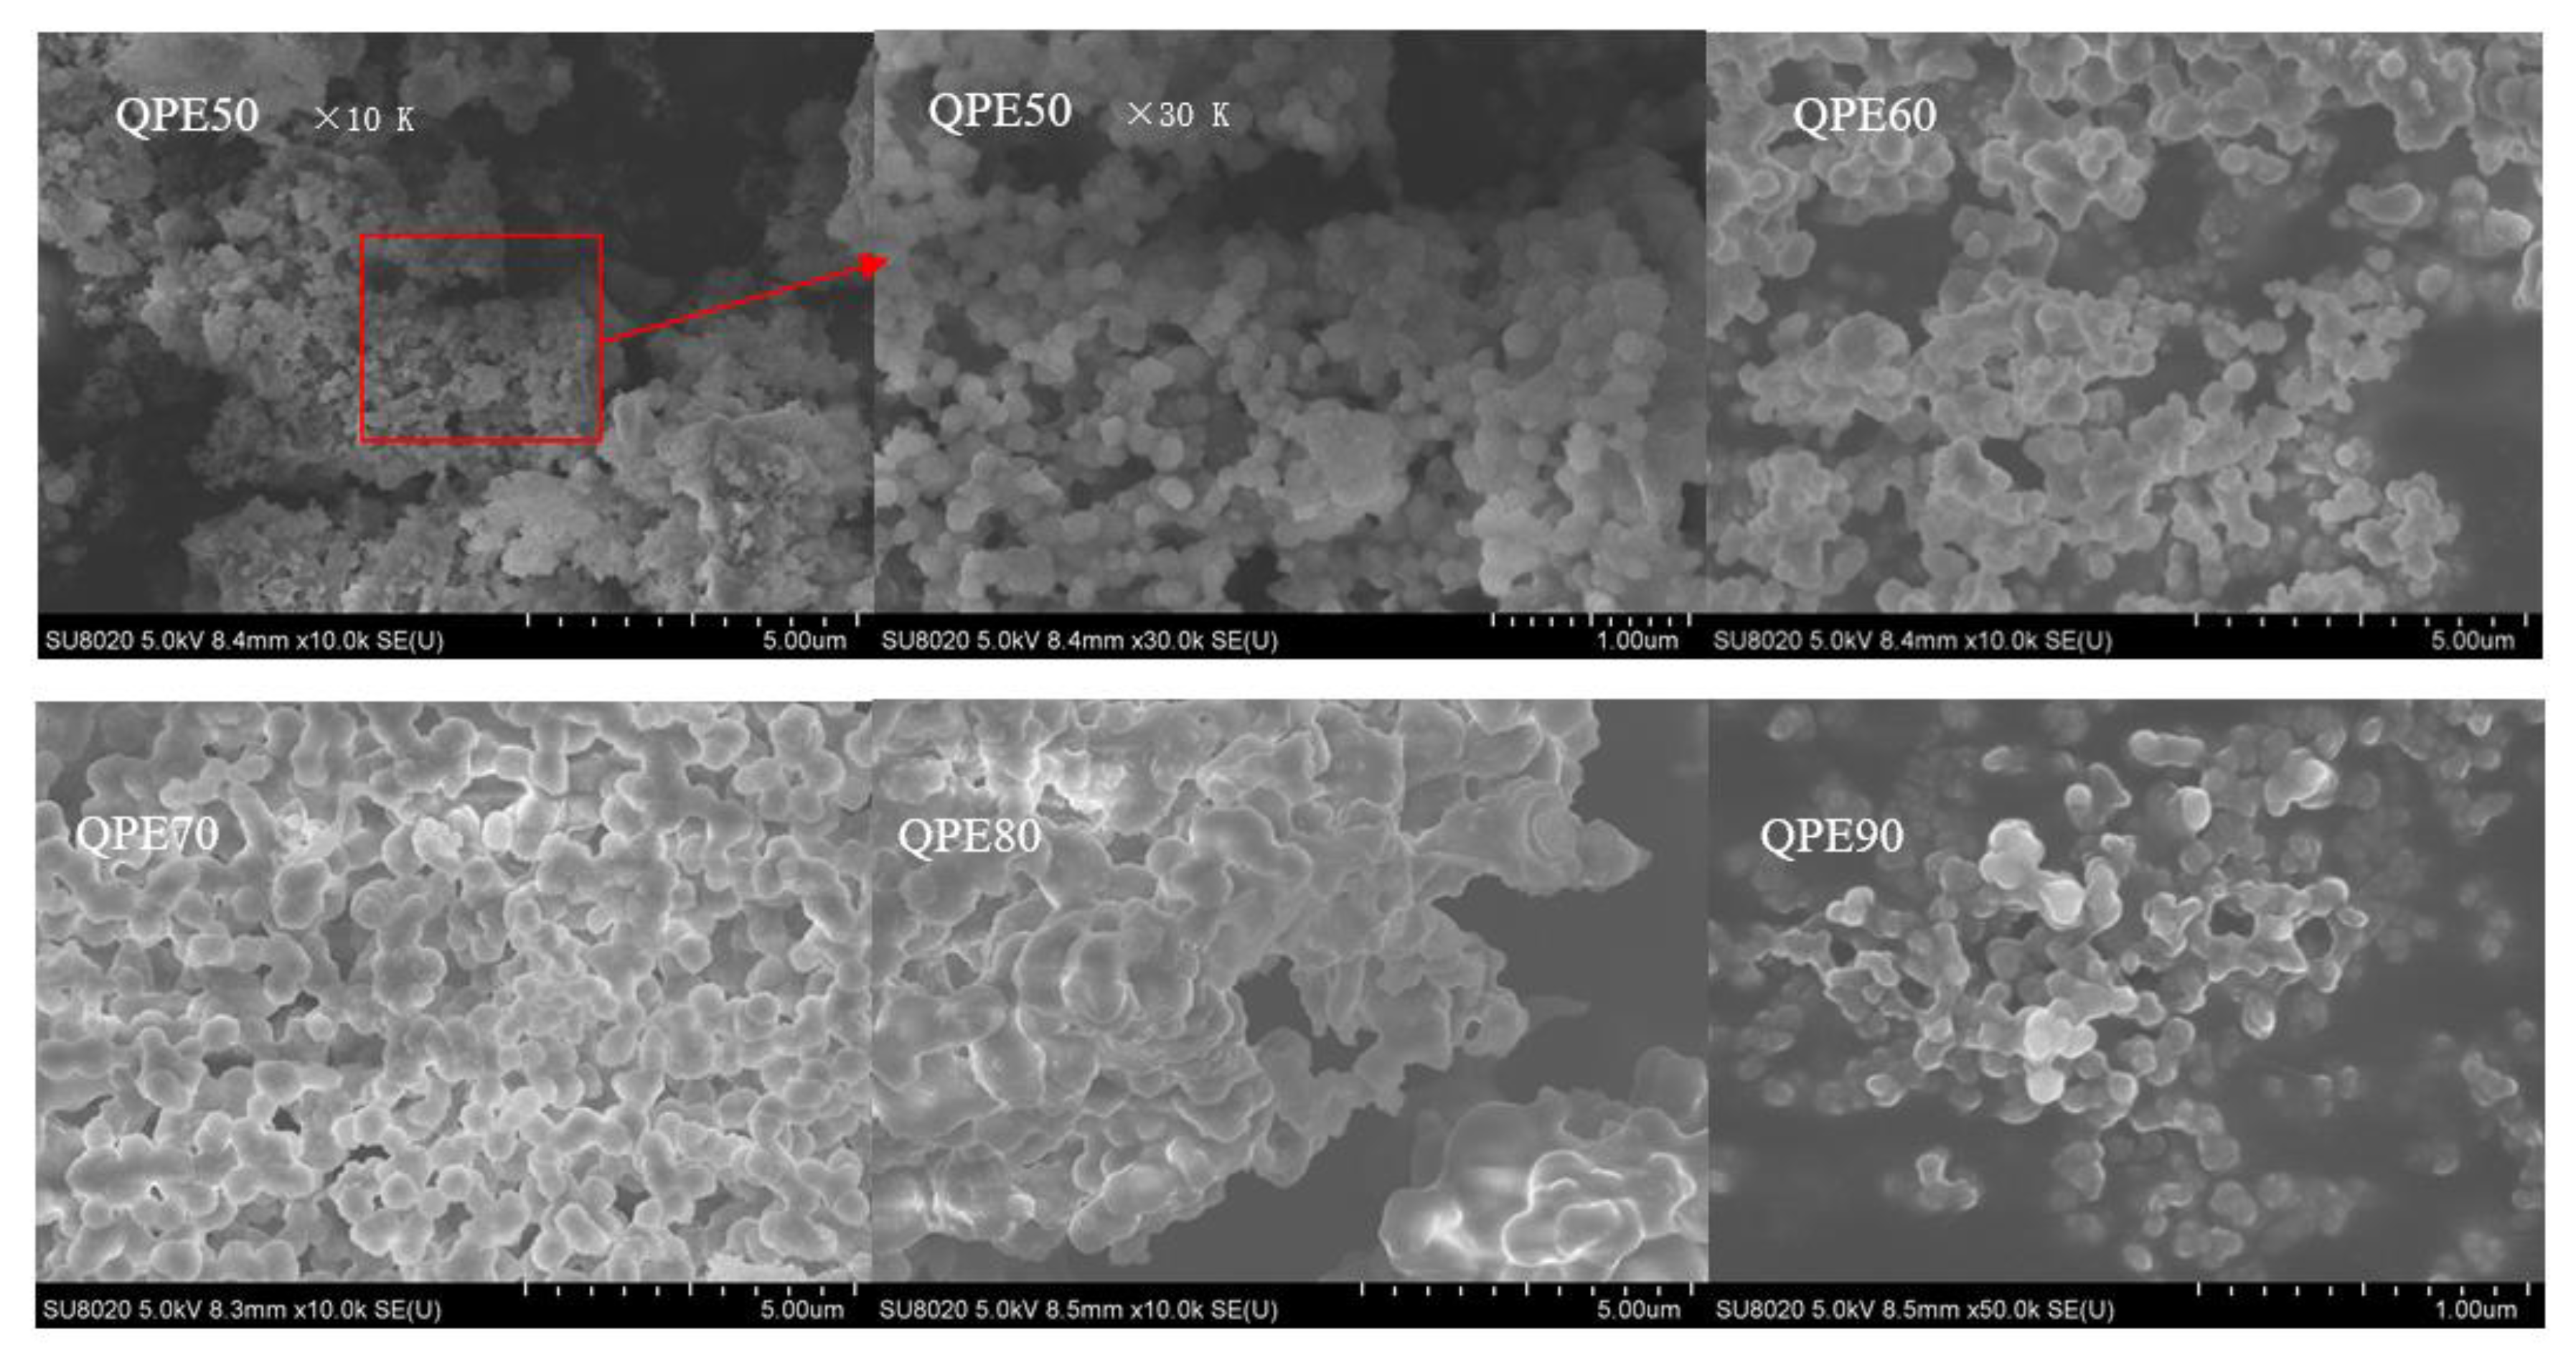
2.5. SEM Analysis
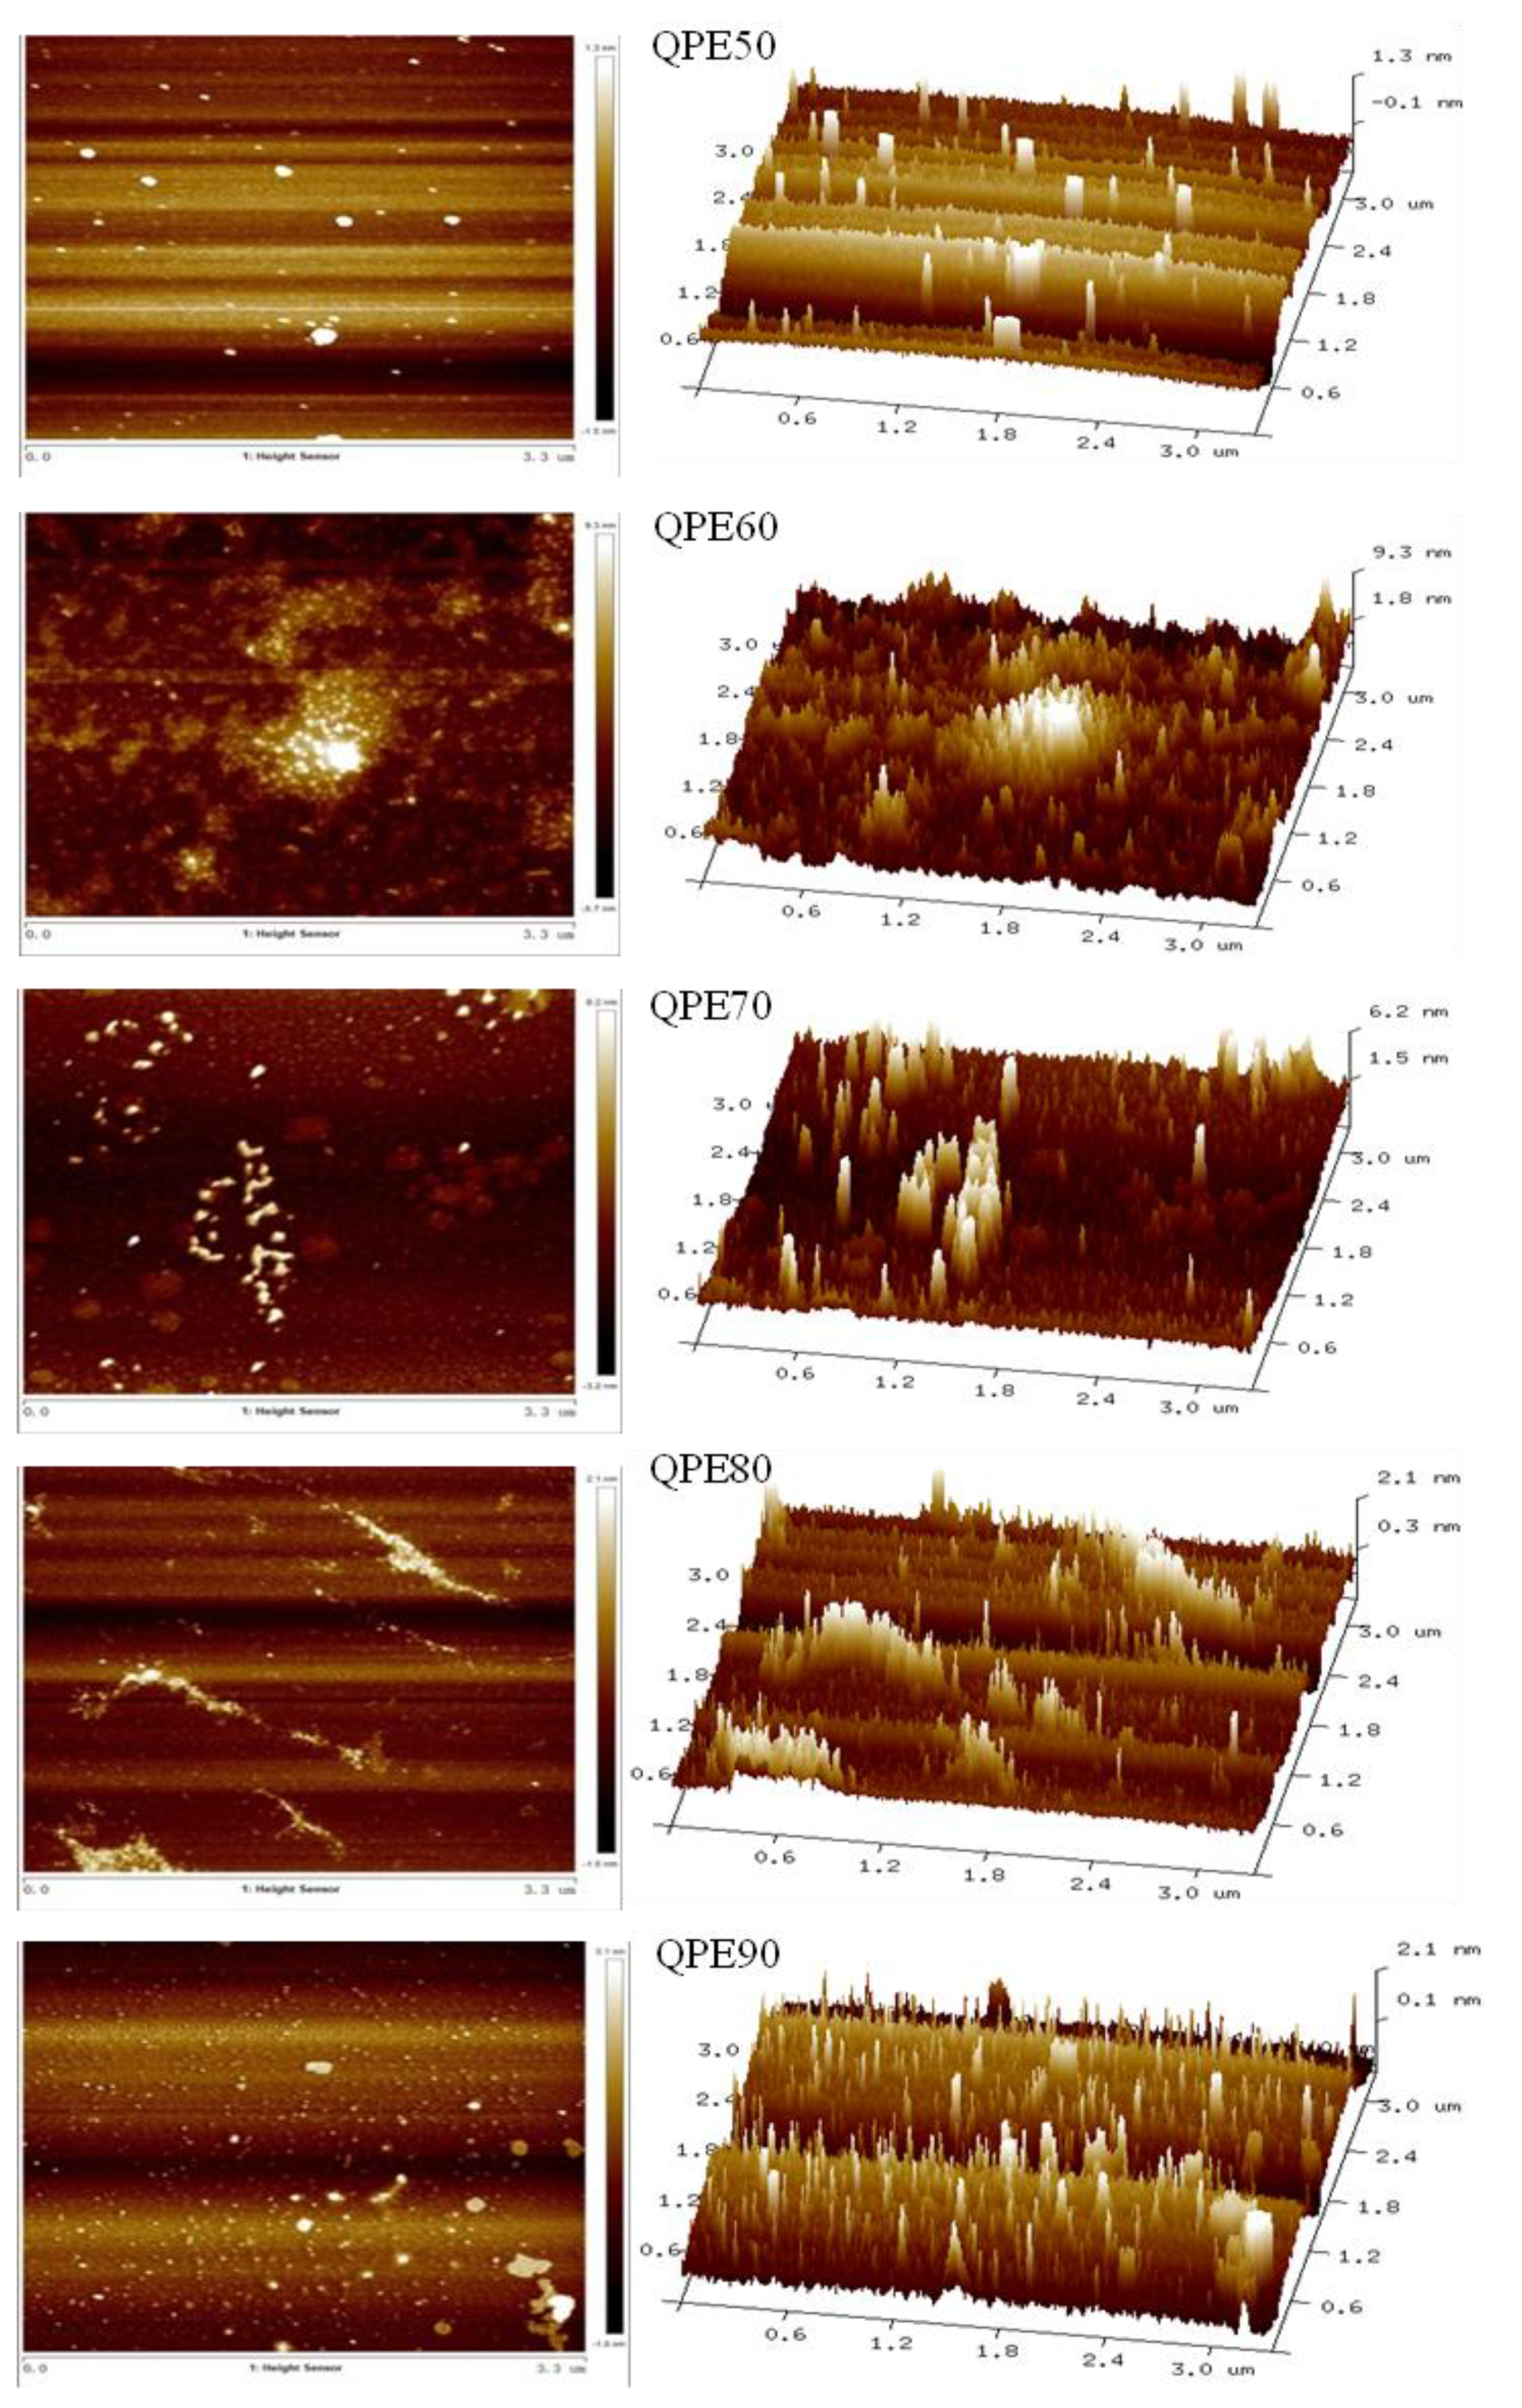
2.6. AFM Analysis
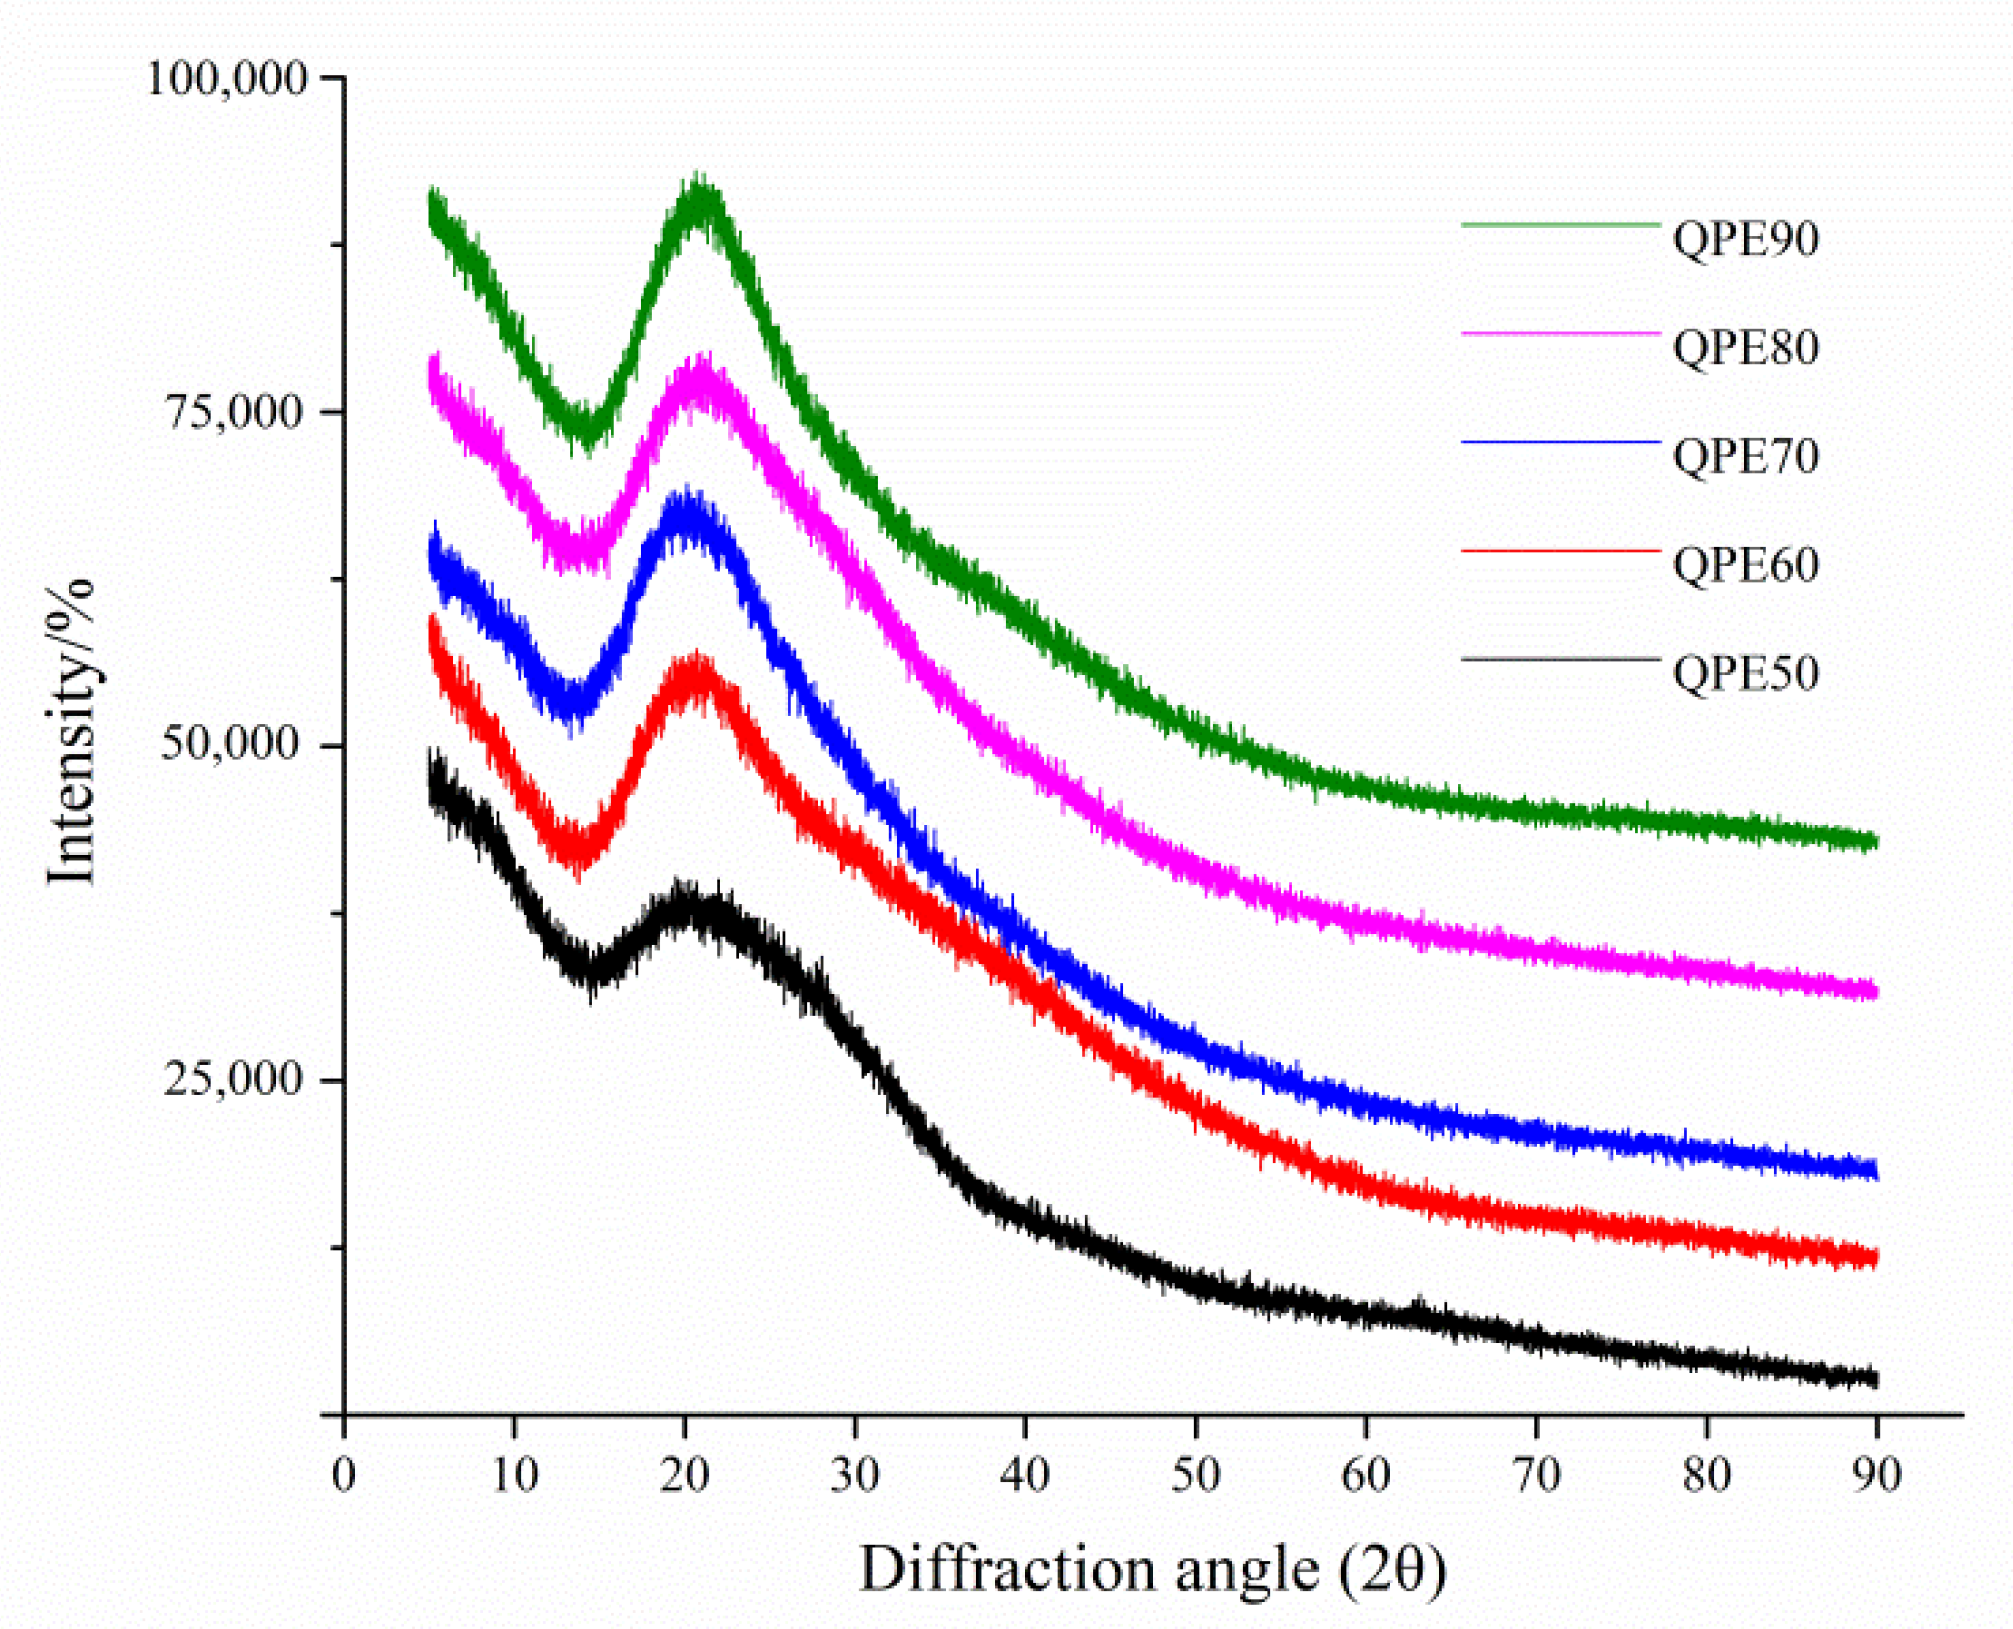
2.7. XRD Analysis
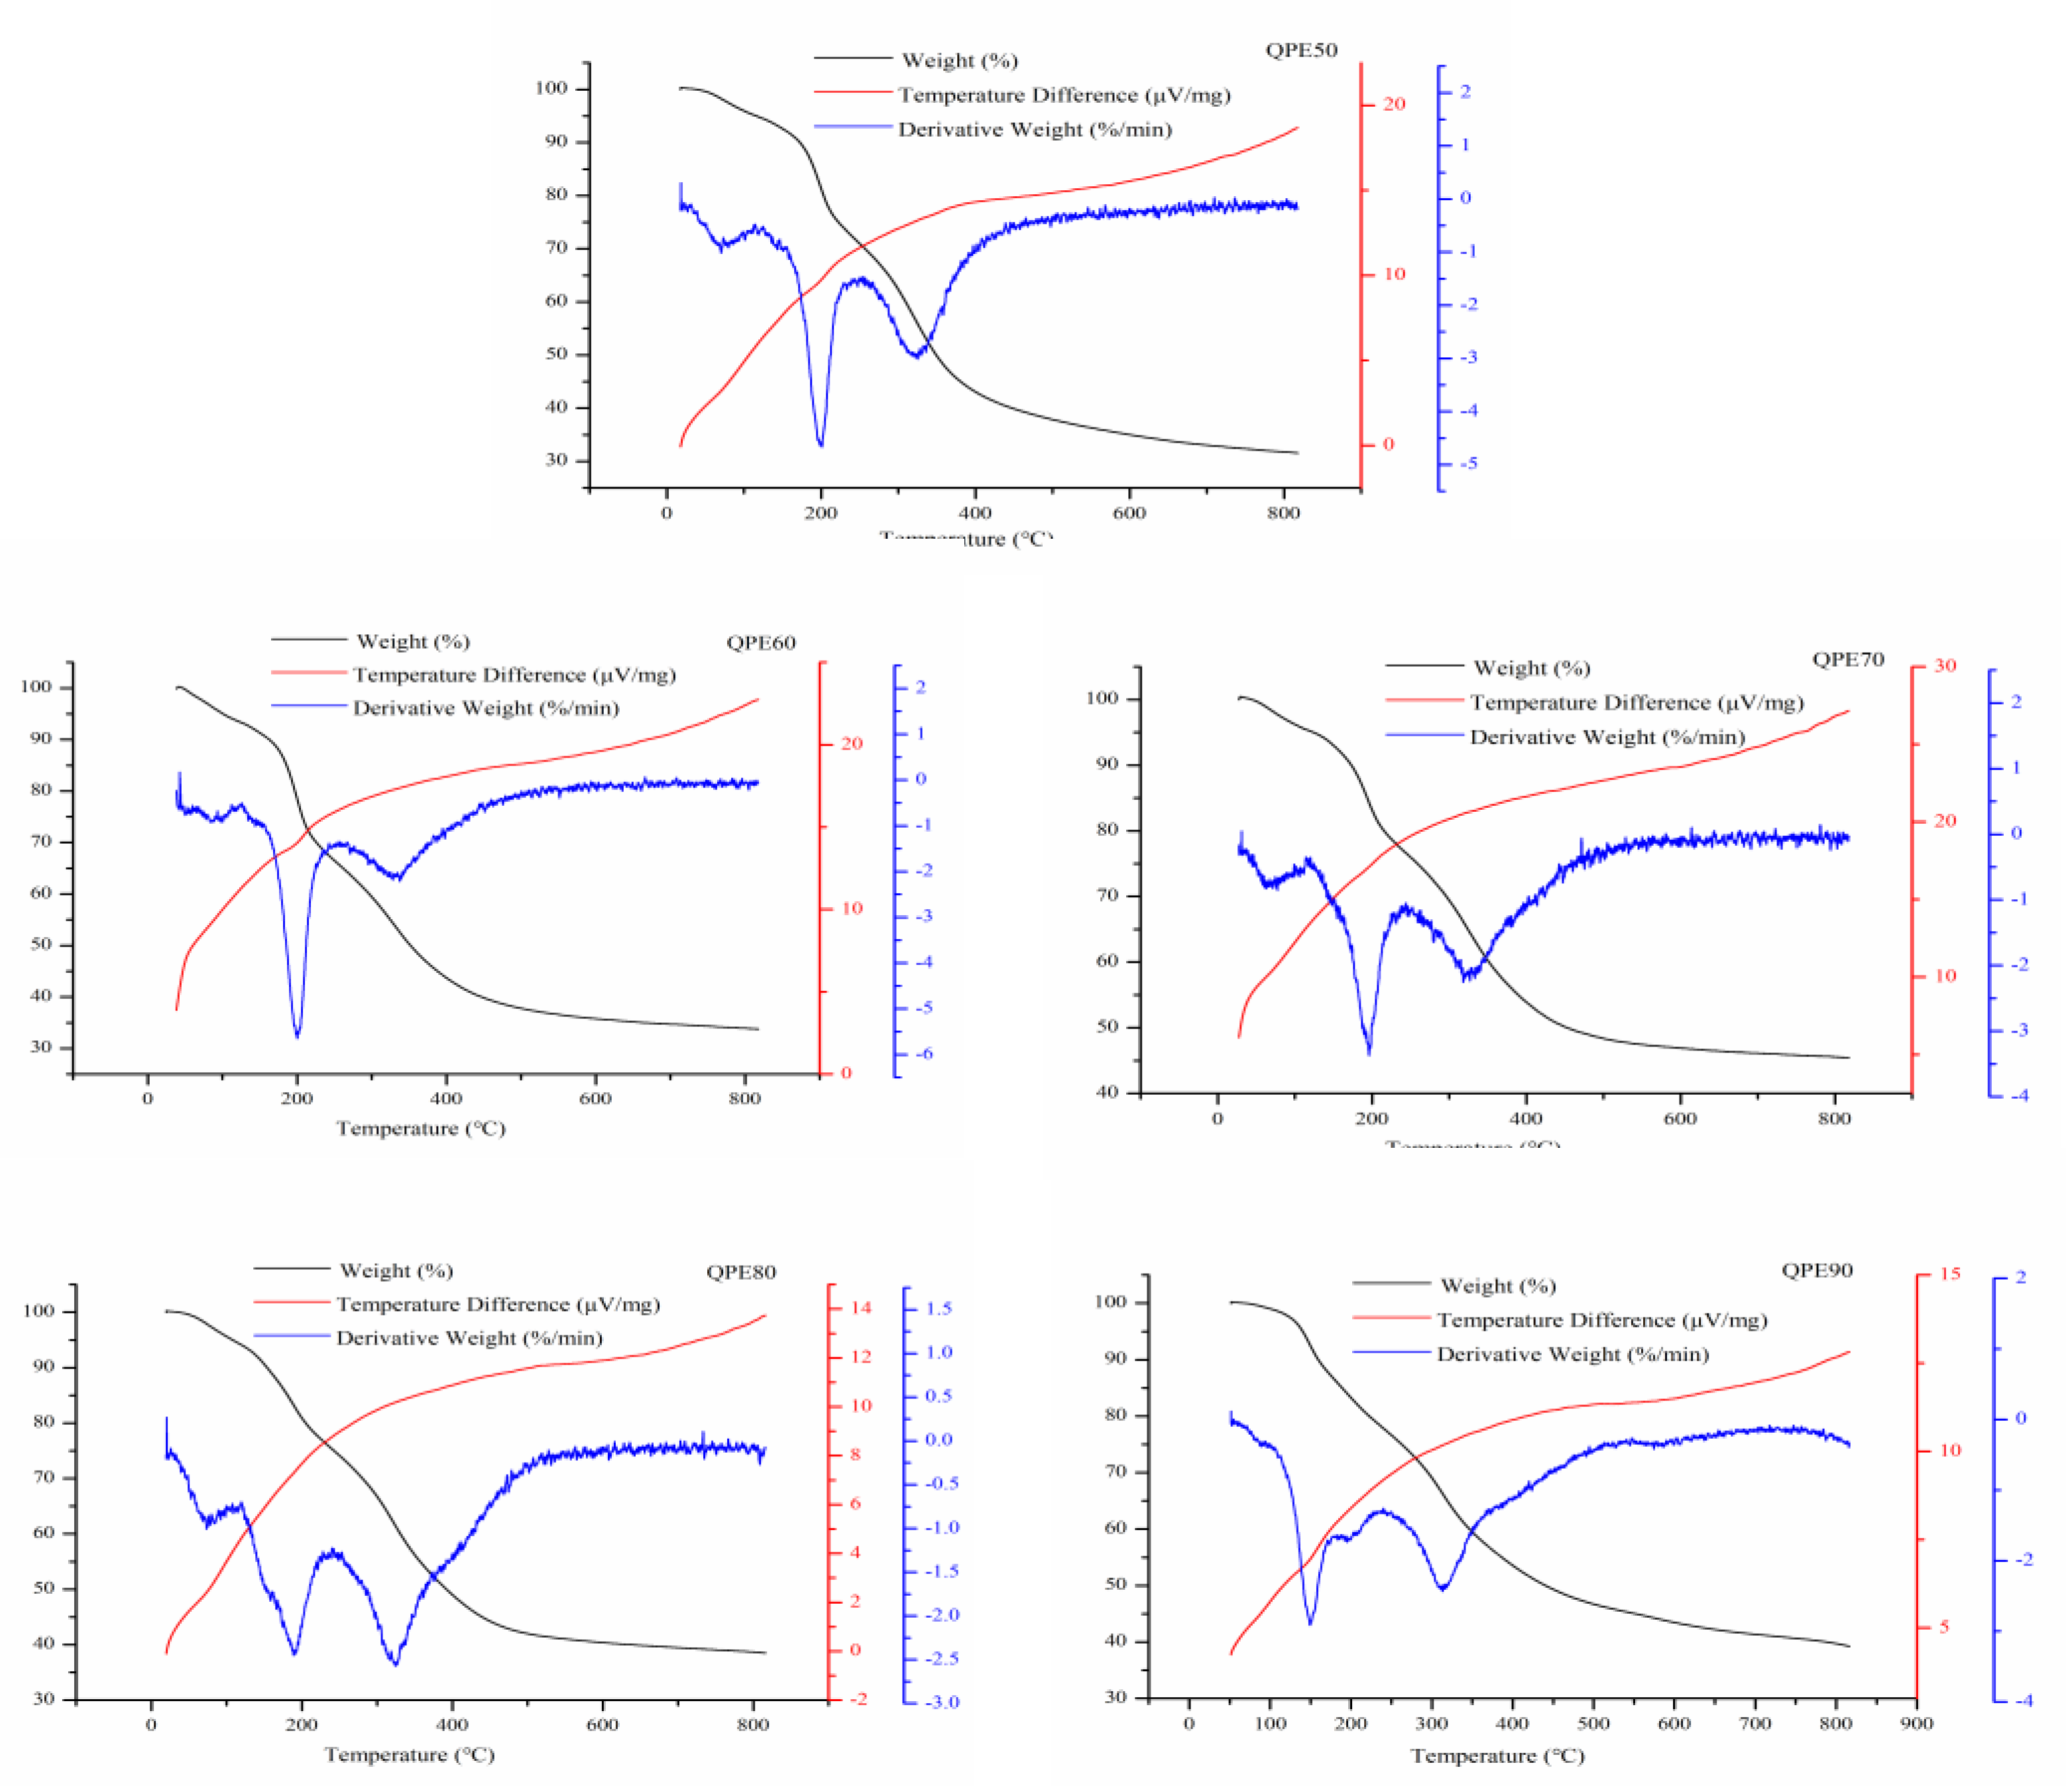
2.8. TG-DTA-DTG Analysis
2.9. Biological Activity of QPs
2.9.1. Antioxidant Activities of QPs
2.9.2. Alpha-Amylase and Alpha-Glucosidase Inhibitory Activities of QPs
2.9.3. Glycemic Index of QPs
3. Materials and Methods
3.1. Materials
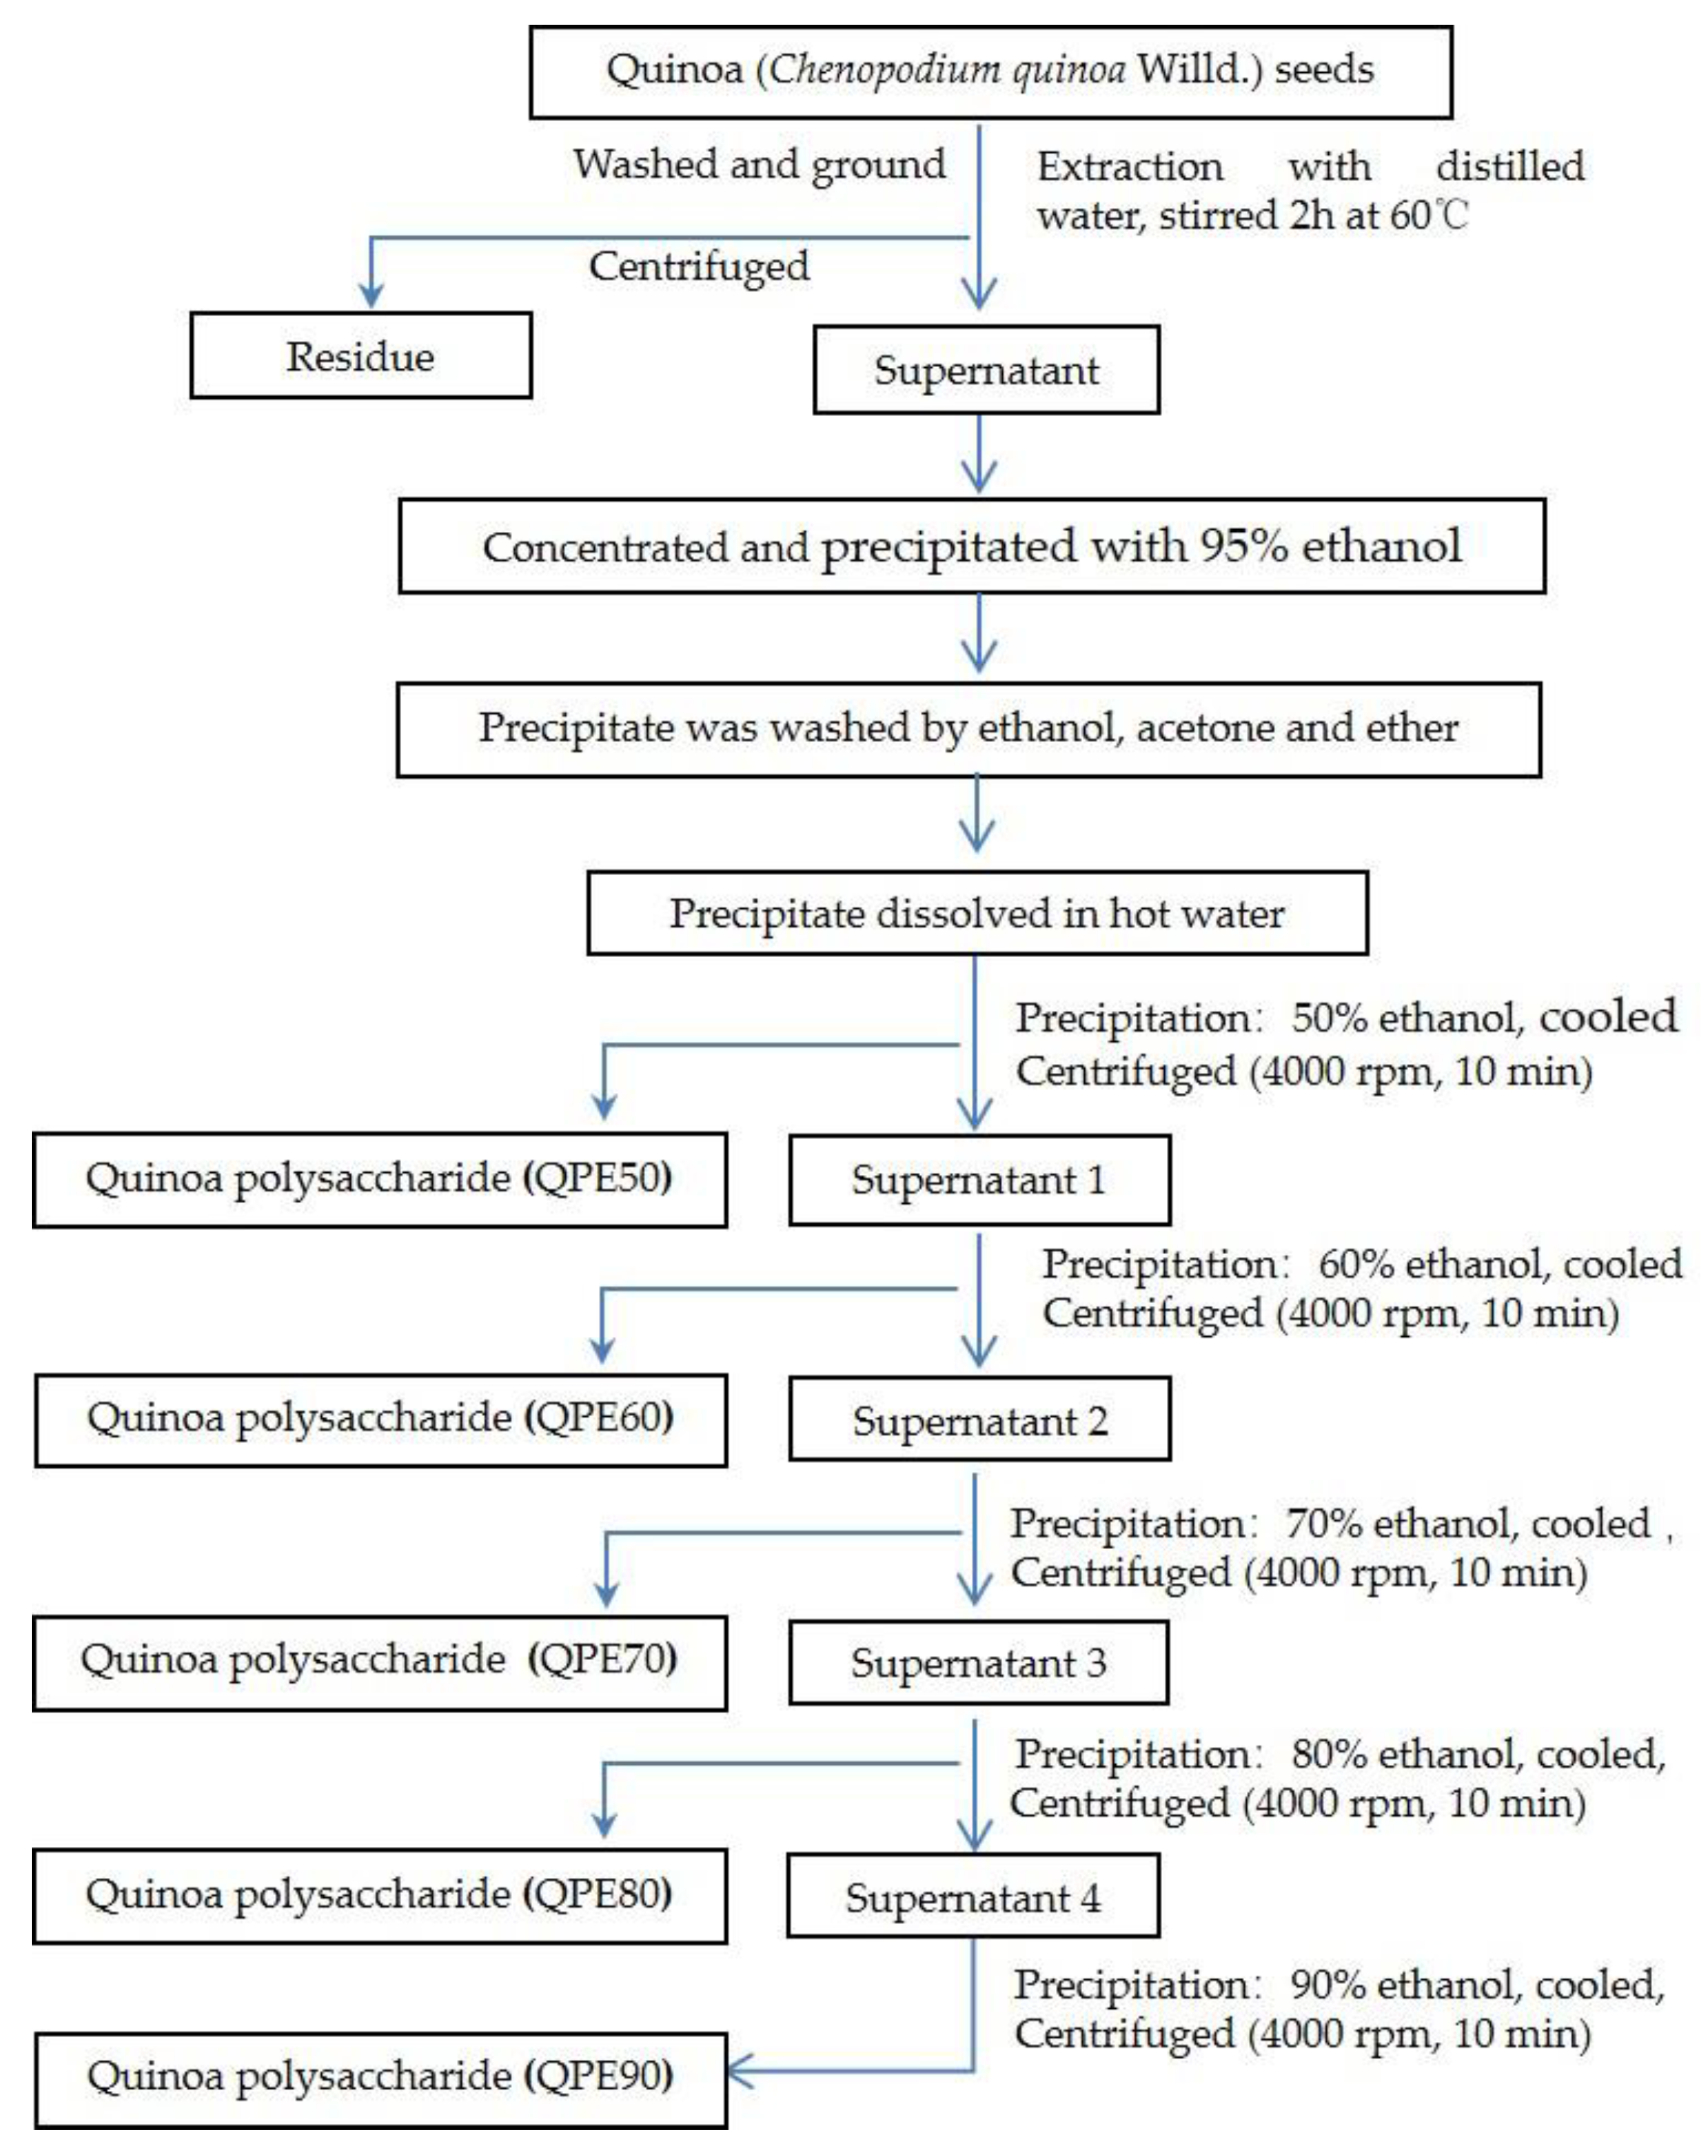
3.2. Extraction and Isolation of Quinoa Polysaccharide (QPs)
3.3. Structure and Physicochemical Properties of QPs
3.3.1. Determination of Polysaccharide Yield, Chemical Composition and Average Molecular Weight of QPs
3.3.2. Monosaccharide Composition Analysis
3.3.3. Congo Red Test
3.3.4. UV-VIS Spectroscopy and Fourier Transform Infrared Spectroscopy (FT-IR)
3.3.5. Scanning Electron Microscopy
3.3.6. Atomic Force Microscope (AFM) Observation
3.3.7. XRD Analysis
3.3.8. Thermal Analysis
3.4. Determination of Biological Activity
3.4.1. DPPH Radical Scavenging Activity
3.4.2. ABTS Radical Scavenging Activity
3.4.3. Alpha-Amylase Inhibitory Activity
3.4.4. Alpha-Glucosidase Inhibitory Activity
3.4.5. Glycemic Index of QPs
3.4.6. Statistical Analysis
4. Conclusions
Author Contributions
Funding
Conflicts of Interest
Abbreviations
| QPs | Quinoa polysaccharides |
| QPE50 | Quinoa polysaccharide precipitated with 50% ethanol |
| QPE60 | Quinoa polysaccharide precipitated with 60% ethanol after QPE50 |
| QPE70 | Quinoa polysaccharide precipitated with 70% ethanol after QPE60 |
| QPE80 | Quinoa polysaccharide precipitated with 80% ethanol after QPE70 |
| QPE90 | Quinoa polysaccharide precipitated with 90% ethanol after QPE80 |
| FT-IR | Fourier Transform Infrared Spectroscopy |
| SEM | Scanning electron microscope |
| AFM | Atomic force microscope |
| XRD | X-ray diffractometry |
| TG-DTA-DTG | Thermogravimetry-Differential Thermal Analysis-Derivative thermogravimetry |
References
- Gordillo-Bastidas, E.; Díaz-Rizzolo, D.; Roura, E.; Massanés, T.; Gomis, R. Quinoa (Chenopodium quinoa Willd), from Nutritional Value to Potential Health Benefits: An Integrative Review. J. Nutr. Food Sci. 2016, 6, 1000497. [Google Scholar]
- El Hazzam, K.; Hafsa, J.; Sobeh, M.; Mhada, M.; Taourirte, M.; El Kacimi, K.; Yasri, A. An Insight into Saponins from Quinoa (Chenopodium quinoa Willd): A Review. Molecules 2020, 25, 1059. [Google Scholar] [CrossRef] [PubMed] [Green Version]
- Bhargava, A.; Shukla, S.; Ohri, D. Chenopodium quinoa—An Indian perspective. Ind. Crops Prod. 2006, 23, 73–87. [Google Scholar] [CrossRef]
- Bhargava, A.; Shukla, S.; Ohri, D. Genetic variability and interrelationship among various morphological and quality traits in quinoa (Chenopodium quinoa Willd.). Field Crop. Res. 2007, 101, 104–116. [Google Scholar] [CrossRef]
- Vega-Galvez, A.; Miranda, M.; Vergara, J.; Uribe, E.; Puente, L.; Martinez, E.A. Nutrition facts and functional potential of quinoa (Chenopodium quinoa willd.), an ancient Andean grain: A review. J. Sci. Food Agric. 2010, 90, 2541–2547. [Google Scholar] [CrossRef]
- Pereira, E.; Encina-Zelada, C.; Barros, L.; Gonzales-Barron, U.; Cadavez, V.; Ferreira, I.C.F.R. Chemical and nutritional characterization of Chenopodium quinoa Willd (quinoa) grains: A good alternative to nutritious food. Food Chem. 2019, 280, 110–114. [Google Scholar] [CrossRef] [Green Version]
- Li, G.; Zhu, F. Quinoa starch: Structure, properties, and applications. Carbohydr. Polym. 2018, 181, 851–861. [Google Scholar] [CrossRef]
- Lamothe, L.M.; Srichuwong, S.; Reuhs, B.L.; Hamaker, B.R. Quinoa (Chenopodium quinoa W.) and amaranth (Amaranthus caudatus L.) provide dietary fibres high in pectic substances and xyloglucans. Food Chem. 2015, 167, 490–496. [Google Scholar] [CrossRef]
- Lin, M.; Han, P.; Li, Y.; Wang, W.; Lai, D.; Zhou, L. Quinoa Secondary Metabolites and Their Biological Activities or Functions. Molecules 2019, 24, 2512. [Google Scholar] [CrossRef] [Green Version]
- Baeva, E.; Bleha, R.; Lavrova, E.; Sushytskyi, L.; Copikova, J.; Jablonsky, I.; Kloucek, P.; Synytsya, A. Polysaccharides from Basidiocarps of Cultivating Mushroom Pleurotus ostreatus: Isolation and Structural Characterization. Molecules 2019, 24, 2740. [Google Scholar] [CrossRef] [Green Version]
- Zhang, X.; Zhang, L.; Xu, X. Morphologies and conformation transition of lentinan in aqueous NaOH solution. Biopolymers 2004, 75, 187–195. [Google Scholar] [CrossRef] [PubMed]
- Dunstan, D.E.; Goodall, D.G. Terraced self assembled nano-structures from laminarin. Int. J. Biol. Macromol. 2007, 40, 362–366. [Google Scholar] [CrossRef] [PubMed]
- Kashiwagi, Y.; Norisuye, T.; Fujita, H. Triple Helix of Schizophyllum commune Polysaccharide in Dilute Solution. 4. Light Scattering and Viscosity in Dilute Aqueous Sodium Hydroxide. Macromolecules 1981, 14, 1220–1225. [Google Scholar] [CrossRef]
- Wang, J.; Xu, X.; Zheng, H.; Li, J.; Deng, C.; Xu, Z.; Chen, J. Structural Characterization, Chain Conformation, and Morphology of a β-(1→3)-d-Glucan Isolated from the Fruiting Body of Dictyophora indusiata. J. Agric. Food Chem. 2009, 57, 5918–5924. [Google Scholar] [CrossRef]
- Sun, Y.; Hou, S.; Song, S.; Zhang, B.; Ai, C.; Chen, X.; Liu, N. Impact of acidic, water and alkaline extraction on structural features, antioxidant activities of Laminaria japonica polysaccharides. Int. J. Biol. Macromol. 2018, 112, 985–995. [Google Scholar] [CrossRef]
- Zhang, J.; Wen, C.; Gu, J.; Ji, C.; Duan, Y.; Zhang, H. Effects of subcritical water extractionmicroenvironment on the structure and biological activities of polysaccharides from Lentinus edodes. Int. J. Biol. Macromol. 2019, 123, 1002–1011. [Google Scholar] [CrossRef]
- Wang, S.; Zhao, L.; Li, Q.; Liu, C.; Han, J.; Zhu, L.; Zhu, D.; He, Y.; Liu, H. Rheological properties and chain conformation of soy hull water-soluble polysaccharide fractions obtained by gradient alcohol precipitation. Food Hydrocoll. 2019, 91, 34–39. [Google Scholar] [CrossRef]
- Jiang, Y.; Yu, J.; Li, Y.; Wang, L.; Hu, L.; Zhang, L.; Zhou, Y. Extraction and antioxidant activities of polysaccharides from roots of Arctium lappa L. Int. J. Biol. Macromol. 2019, 123, 531–538. [Google Scholar] [CrossRef]
- Fan, S.; Li, J.; Bai, B. Purification, structural elucidation and in vivo immunity-enhancing activity of polysaccharides from quinoa (Chenopodium quinoa Willd.) seeds. Biosci. Biotechnol. Biochem. 2019, 83, 2334–2344. [Google Scholar] [CrossRef]
- Xu, S.; Lin, Y.; Huang, J.; Li, Z.; Xu, X.; Zhang, L. Construction of high strength hollow fibers by self-assembly of a stiff polysaccharide with short branches in water. J. Mater. Chem. A 2013, 1, 4198. [Google Scholar] [CrossRef]
- Wang, L.; Liu, F.; Wang, A.; Yu, Z.; Xu, Y.; Yang, Y. Purification, characterization and bioactivity determination of a novel polysaccharide from pumpkin (Cucurbita moschata) seeds. Food Hydrocoll. 2017, 66, 357–364. [Google Scholar] [CrossRef]
- Xin, Y.; Chen, F.; Lai, S.; Yang, H. Influence of chitosan-based coatings on the physicochemical properties and pectin nanostructure of Chinese cherry. Postharvest Biol. Technol. 2017, 133, 64–71. [Google Scholar] [CrossRef]
- Chen, L.; Zhou, Y.; He, Z.; Liu, Q.; Lai, S.; Yang, H. Effect of exogenous ATP on the postharvest properties and pectin degradation of mung bean sprouts (Vigna radiata). Food Chem. 2018, 251, 9–17. [Google Scholar] [CrossRef] [PubMed]
- Zhang, L.; Zhao, S.; Lai, S.; Chen, F.; Yang, H. Combined effects of ultrasound and calcium on the chelate-soluble pectin and quality of strawberries during storage. Carbohydr. Polym. 2018, 200, 427–435. [Google Scholar] [CrossRef] [PubMed]
- Wang, Y.; Peng, Y.; Wei, X.; Yang, Z.; Xiao, J.; Jin, Z. Sulfation of tea polysaccharides: Synthesis, characterization and hypoglycemic activity. Int. J. Biol. Macromol. 2010, 46, 270–274. [Google Scholar] [CrossRef]
- Zhang, Y.; Li, S.; Wang, X.; Zhang, L.; Cheung, P.C.K. Advances in lentinan: Isolation, structure, chain conformation and bioactivities. Food Hydrocoll. 2011, 25, 196–206. [Google Scholar] [CrossRef]
- Qian, J.; Chen, W.; Zhang, W.; Zhang, H. Adulteration identification of some fungal polysaccharides with SEM, XRD, IR and optical rotation: A primary approach. Carbohydr. Polym. 2009, 78, 620–625. [Google Scholar] [CrossRef]
- Wang, K.; Wang, J.; Li, Q.; Zhang, Q.; You, R.; Cheng, Y.; Luo, L.; Zhang, Y. Structural differences and conformational characterization of five bioactive polysaccharides from Lentinus edodes. Food Res. Int. 2014, 62, 223–232. [Google Scholar] [CrossRef]
- Kong, L.; Yu, L.; Feng, T.; Yin, X.; Liu, T.; Dong, L. Physicochemical characterization of the polysaccharide from Bletilla striata: Effect of drying method. Carbohydr. Polym. 2015, 125, 1–8. [Google Scholar] [CrossRef]
- Jeddou, K.B.; Chaari, F.; Maktouf, S.; Nouri-Ellouz, O.; Helbert, C.B.; Ghorbel, R.E. Structural, functional, and antioxidant properties of water-soluble polysaccharides from potatoes peels. Food Chem. 2016, 205, 97–105. [Google Scholar] [CrossRef]
- Patel, M.K.; Tanna, B.; Mishra, A.; Jha, B. Physicochemical characterization, antioxidant and anti-proliferative activities of a polysaccharide extracted from psyllium (P. ovata) leaves. Int. J. Biol. Macromol. 2018, 118, 976–987. [Google Scholar] [CrossRef] [PubMed]
- Wang, Y.; Yang, Z.; Wei, X. Sugar compositions, α-glucosidase inhibitory and amylase inhibitory activities of polysaccharides from leaves and flowers of Camellia sinensis obtained by different extraction methods. Int. J. Biol. Macromol. 2010, 47, 534–539. [Google Scholar] [CrossRef] [PubMed]
- Sun, Q.; Spiegelman, D.; Dam, R.M.V.; Holmes, M.D.; Malik, V.S.; Willett, W.C.; Hu, F.B. White Rice, Brown Rice, and Risk of Type 2 Diabetes in US Men and Women. Arch. Intern. Med. 2010, 170, 961. [Google Scholar] [CrossRef] [PubMed]
- Brand-Miller, J.; Hayne, S.; Petocz, P.; Colagiuri, S. Low-Glycemic Index Diets in the Management of Diabetes: A meta-analysis of randomized controlled trials. Diabetes Care 2003, 26, 2261–2267. [Google Scholar] [CrossRef] [Green Version]
- Agama-Acevedo, E.; Islas-Hernández, J.J.; Pacheco-Vargas, G.; Osorio-Díaz, P.; Bello-Pérez, L.A. Starch digestibility and glycemic index of cookies partially substituted with unripe banana flour. LWT-Food Sci. Technol. 2012, 46, 177–182. [Google Scholar] [CrossRef]
- Bhat, M.; Zinjarde, S.S.; Bhargava, S.Y.; Kumar, A.R.; Joshi, B.N. Antidiabetic Indian Plants: A Good Source of Potent Amylase Inhibitors. Evid. -Based Complementary Altern. Med. 2011, 2011, 810207. [Google Scholar] [CrossRef] [Green Version]
- Dubois, M.; Gilles, K.A.; Hamilton, J.K.; Rebers, P.A.; Smith, F. Colorimetric Method for Determination of Sugars and Related Substances. Anal. Chem. 1956, 28, 350–356. [Google Scholar] [CrossRef]
- Bradford, M.M. A Rapid and Sensitive Method for the Quantitation of Microgram Quantities of Protein Utilizing the Principle of Protein-Dye Binding. Anal. Biochem. 1976, 72, 248–254. [Google Scholar] [CrossRef]
- Bitter, T.; Muir, H.M. A Modified Uronic Acid Carbazole Reaction. Anal. Chem. 1962, 4, 330–334. [Google Scholar] [CrossRef]
- Zhu, J.; Chen, Z.; Chen, L.; Yu, C.; Wang, H.; Wei, X.; Wang, Y. Comparison and structural characterization of polysaccharides from natural and artificial Se-enriched green tea. Int. J. Biol. Macromol. 2019, 130, 388–398. [Google Scholar] [CrossRef]
- Dai, J.; Wu, Y.; Chen, S.-W.; Zhu, S.; Yin, H.-P.; Wang, M.; Tang, J. Sugar compositional determination of polysaccharides from Dunaliella salina by modified RP-HPLC method of precolumn derivatization with 1-phenyl-3-methyl-5-pyrazolone. Carbohydr. Polym. 2010, 82, 629–635. [Google Scholar] [CrossRef]
- Wang, X.; Zhu, Z.; Zhao, L.; Sun, H.; Meng, M.; Zhang, J.; Zhang, Y. Structural characterization and inhibition on α- D -glucosidase activity of non-starch polysaccharides from Fagopyrum tartaricum. Carbohydr. Polym. 2016, 153, 679–685. [Google Scholar] [CrossRef] [PubMed]
- Zhou, X.; Yan, L.; Yin, P.; Shi, L.; Zhang, J.; Liu, Y.; Ma, C. Structural characterisation and antioxidant activity evaluation of phenolic compounds from cold-pressed Perilla frutescens var. arguta seed flour. Food Chem. 2014, 164, 150–157. [Google Scholar] [CrossRef]
- Re, R.; Pellegrini, N.; Proteggente, A.; Pannala, A.; Yang, M.; Rice-Evans, C. Antioxidant activity applying an improved ABTS radical cation decolorization assay. Free Radical Biol. Med. 1999, 26, 1231–1237. [Google Scholar] [CrossRef]
- Xiao, Z.; Storms, R.; Tsang, A. A quantitative starch–iodine method for measuring alpha-amylase and glucoamylase activities. Anal. Biochem. 2006, 351, 146–148. [Google Scholar] [CrossRef] [PubMed]
- Kim, J.-S.; Hyun, T.K.; Kim, M.-J. The inhibitory effects of ethanol extracts from sorghum, foxtail millet and proso millet on α-glucosidase and α-amylase activities. Food Chem. 2011, 124, 1647–1651. [Google Scholar] [CrossRef]
- Li, H.; Li, J.; Xiao, Y.; Cui, B.; Fang, Y.; Guo, L. In vitro digestibility of rice starch granules modified by β-amylase, transglucosidase and pullulanase. Int. J. Biol. Macromol. 2019, 136, 1228–1236. [Google Scholar] [CrossRef]
Sample Availability: Not available. |


| Index | Samples | ||||
|---|---|---|---|---|---|
| QPE50 | QPE60 | QPE70 | QPE80 | QPE90 | |
| Yield (w %) | 0.84 ± 0.03 | 1.95 ± 0.02 | 2.26 ± 0.31 | 1.45 ± 0.26 | 0.74 ± 0.02 |
| Total sugar (w %) | 52.82 ± 0.02 | 63.69 ± 0.07 | 67.15 ± 1.32 | 44.56 ± 1.32 | 41.01 ± 2.58 |
| Uronic acid (w %) | 20.84 ±1.23 | 21.51 ± 1.21 | 31.30 ± 1.62 | 19.61 ± 1.22 | 25.88 ± 1.16 |
| Protein (w %) | 11.13 ± 0.69 | 8.54 ± 1.06 | 9.50 ± 0.75 | 7.01 ± 0.74 | 3.32 ± 0.08 |
| Average Molecular Weights (Da) | |||||
| Mw | 13,785 | 6489 | 4732 | 3318 | 1960 |
| Mn | 8265 | 5206 | 4082 | 2943 | 1689 |
| Mw/Mn | 1.67 | 1.25 | 1.16 | 1.13 | 1.16 |
| Monosaccharide Composition | Molar Composition (mol%) | ||||
|---|---|---|---|---|---|
| QPE50 | QPE60 | QPE70 | QPE80 | QPE90 | |
| l-Rhamnose | - | 0.73 ± 0.04 | - | - | - |
| d-Glucose | 94.37 ± 1.25 | 87.92 ± 2.56 | 92.21 ± 2.57 | 100 ± 1.27 | 100 ± 1.79 |
| d-Galactose | - | 4.67 ± 0.39 | 2.98 ± 0.03 | - | - |
| d-Arabinose | 5.63 ± 0.06 | 6.68 ± 0.05 | 4.81 ± 0.04 | - | - |
| Quinoa Polyssacharides | Antioxidant activity | Antidiabetic Activity | Glycemic Index (GI) | ||
|---|---|---|---|---|---|
| DPPH EC50(mg/mL) | ABTS EC50(mg/mL) | α-Amylase IC50 (mg/mL) | α-Glucosidase IC50 (mg/mL) | ||
| QPE50 | 13.67 ± 0.59b | 5.21 ± 0.27a | 102.66 ± 0.98b | 92.38 ±0.66a | 72.19 ± 0.51a |
| QPE60 | 15.22 ± 0.50a | 2.39 ± 0.05b | 105.73 ± 1.60a | 81.79 ± 0.77b | 68.37 ± 0.39b |
| QPE70 | 8.19 ± 0.57c | 2.13 ± 0.06b | 82.17 ± 0.95c | 53.26 ± 1.02d | 65.40 ± 0.35c |
| QPE80 | 8.06 ± 0.53c | 2.22 ± 0.12b | 72.99 ± 0.90d | 57.28 ± 0.59c | 65.92 ± 0.37c |
| QPE90 | 5.22 ± 0.47d | 1.83 ± 0.03b | 61.36 ± 0.58e | 48.67 ± 0.65e | 61.68 ± 0.22d |
| Vc | 0.01 ± 0.00e | 0.01 ± 0.00c | - | - | - |
| Acarbose | - | - | 2.65 ± 0.32f | 0.23 ± 0.01f | - |
© 2020 by the authors. Licensee MDPI, Basel, Switzerland. This article is an open access article distributed under the terms and conditions of the Creative Commons Attribution (CC BY) license (http://creativecommons.org/licenses/by/4.0/).
Share and Cite
Tan, M.; Chang, S.; Liu, J.; Li, H.; Xu, P.; Wang, P.; Wang, X.; Zhao, M.; Zhao, B.; Wang, L.; et al. Physicochemical Properties, Antioxidant and Antidiabetic Activities of Polysaccharides from Quinoa (Chenopodium quinoa Willd.) Seeds. Molecules 2020, 25, 3840. https://doi.org/10.3390/molecules25173840
Tan M, Chang S, Liu J, Li H, Xu P, Wang P, Wang X, Zhao M, Zhao B, Wang L, et al. Physicochemical Properties, Antioxidant and Antidiabetic Activities of Polysaccharides from Quinoa (Chenopodium quinoa Willd.) Seeds. Molecules. 2020; 25(17):3840. https://doi.org/10.3390/molecules25173840
Chicago/Turabian StyleTan, Minghui, Senlin Chang, Jianing Liu, Hang Li, Pengwei Xu, Peidong Wang, Xiaodong Wang, Mingxia Zhao, Bing Zhao, Liwei Wang, and et al. 2020. "Physicochemical Properties, Antioxidant and Antidiabetic Activities of Polysaccharides from Quinoa (Chenopodium quinoa Willd.) Seeds" Molecules 25, no. 17: 3840. https://doi.org/10.3390/molecules25173840