Article

Modelling of the Solidifying Microstructure of Inconel 718: Quasi-Binary Approximation

1
Otto-Schott-Institut für Materialforschung, Friedrich-Schiller-Universität Jena, 07743 Jena, Germany
2
Integrated Computational Materials Engineering (ICME) Group, VTT Technical Research Centre of Finland Ltd., 02150 Espoo, Finland
3
Department of Physics and Centre for the Physics of Materials, McGill University, Montreal, QC H3A 2T8, Canada
*
Author to whom correspondence should be addressed.
Modelling 2023, 4(3), 323-335; https://doi.org/10.3390/modelling4030018
Submission received: 20 May 2023 / Revised: 13 June 2023 / Accepted: 16 June 2023 / Published: 22 June 2023

Abstract

:
The prediction of the equilibrium and metastable morphologies during the solidification of Ni-based superalloys on the mesoscopic scale can be performed using phase-field modeling. In the present paper, we apply the phase-field model to simulate the evolution of solidification microstructures depending on undercooling in a quasi-binary approximation. The results of modeling are compared with experimental data obtained on samples of the alloy Inconel 718 (IN718) processed using the electromagnetic leviatation (EML) technique. The final microstructure, concentration profiles of niobium, and the interface-velocity–undercooling relationship predicted by the phase field modeling are in good agreement with the experimental findings. The simulated microstructures and concentration fields can be used as inputs for the simulation of the precipitation of secondary phases.

1. Introduction

Ni-based superalloys are important due to their mechanical properties, especially due to their high mechanical strength and high creep resistance at elevated temperatures [1]. As a particular case of Ni-based superalloys, Inconel 718 (IN718) is studied for microsegregation and primary crystal microstructure [2]. High mechanical strength obtained after proper heat treatment of IN718 is due to solution hardening by Cr, Mo, and Nb, as well as age hardening. The high creep resistance of this alloy is due to the sluggish diffusion of alloying elements and the hindered motion of dislocations in the presence of a high density of chemically ordered and coherent γ -precipitates. IN718 has a typical polycrystalline microstructure (unlike advanced single-crystal-type superalloys). Offering good machineability and hard workability, which are two crucial processing routes achieved through casting, heat treatment, and creep-tests, rapid solidification behavior and microstructure formation in various additive manufacturing (AM) technologies [3] require its thorough study.
Experimental and modeling studies have made it possible to purposefully obtain a predictable microstructure of the alloy. In particular, the microstructure of IN718 was analysed by phase field model [4,5,6,7,8,9,10,11]. This modeling technique has been applied to the solidification of IN718 in additive manufacturing [4,7,8,9], directional solidification [10,11], and laser treatment of various samples [6]. In many cases, the phase field model has been coupled with CALPHAD-based methods [12] and shows pronounced chemical segregation of IN718 elements within the dendrite stems [4,7]. Taking multicomponent extension to IN718 [5] into account, Guillemot et al. [13] advanced the phase field modeling methodology and obtained results for the region of so-called quasi-rapid solidification (the terminology of Pinomaa and Provatas [14]).
The main goal of the present study is to reach quantitative consistency between experimental data and theoretical modeling results for the primary solidification of IN718. The results of the present study are related to
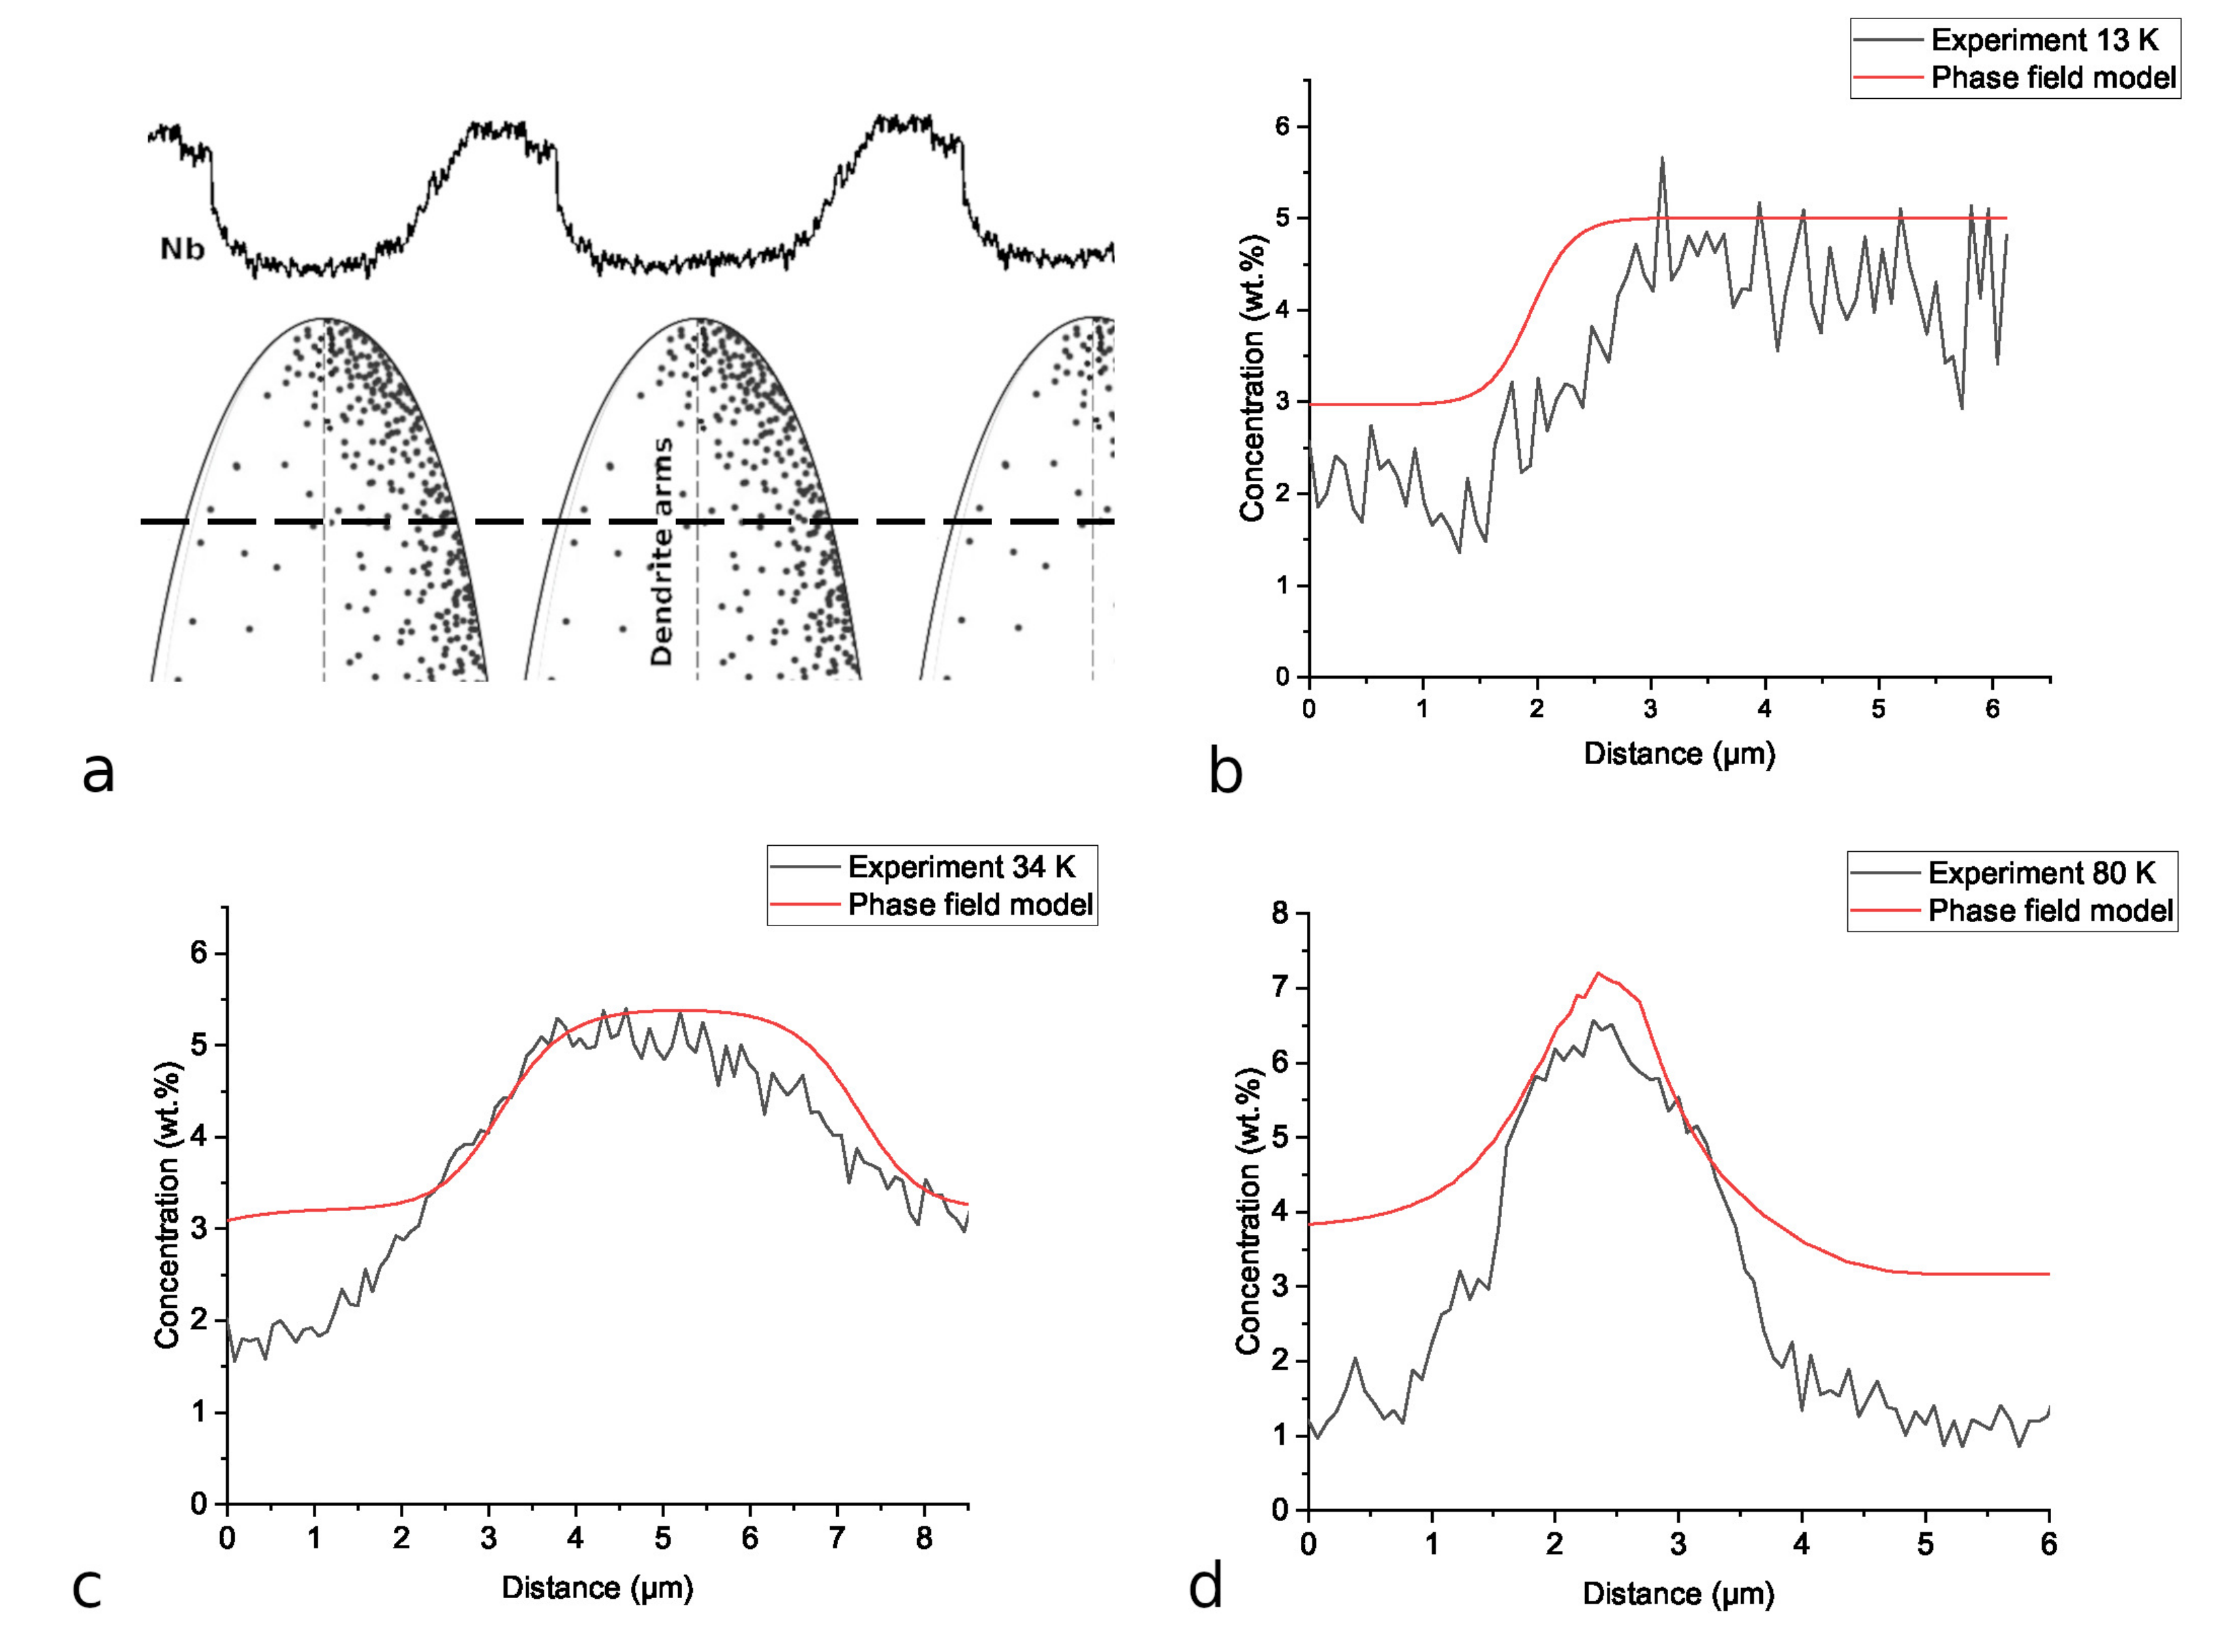
  • Concentration profiles through dendrite arms spacing;
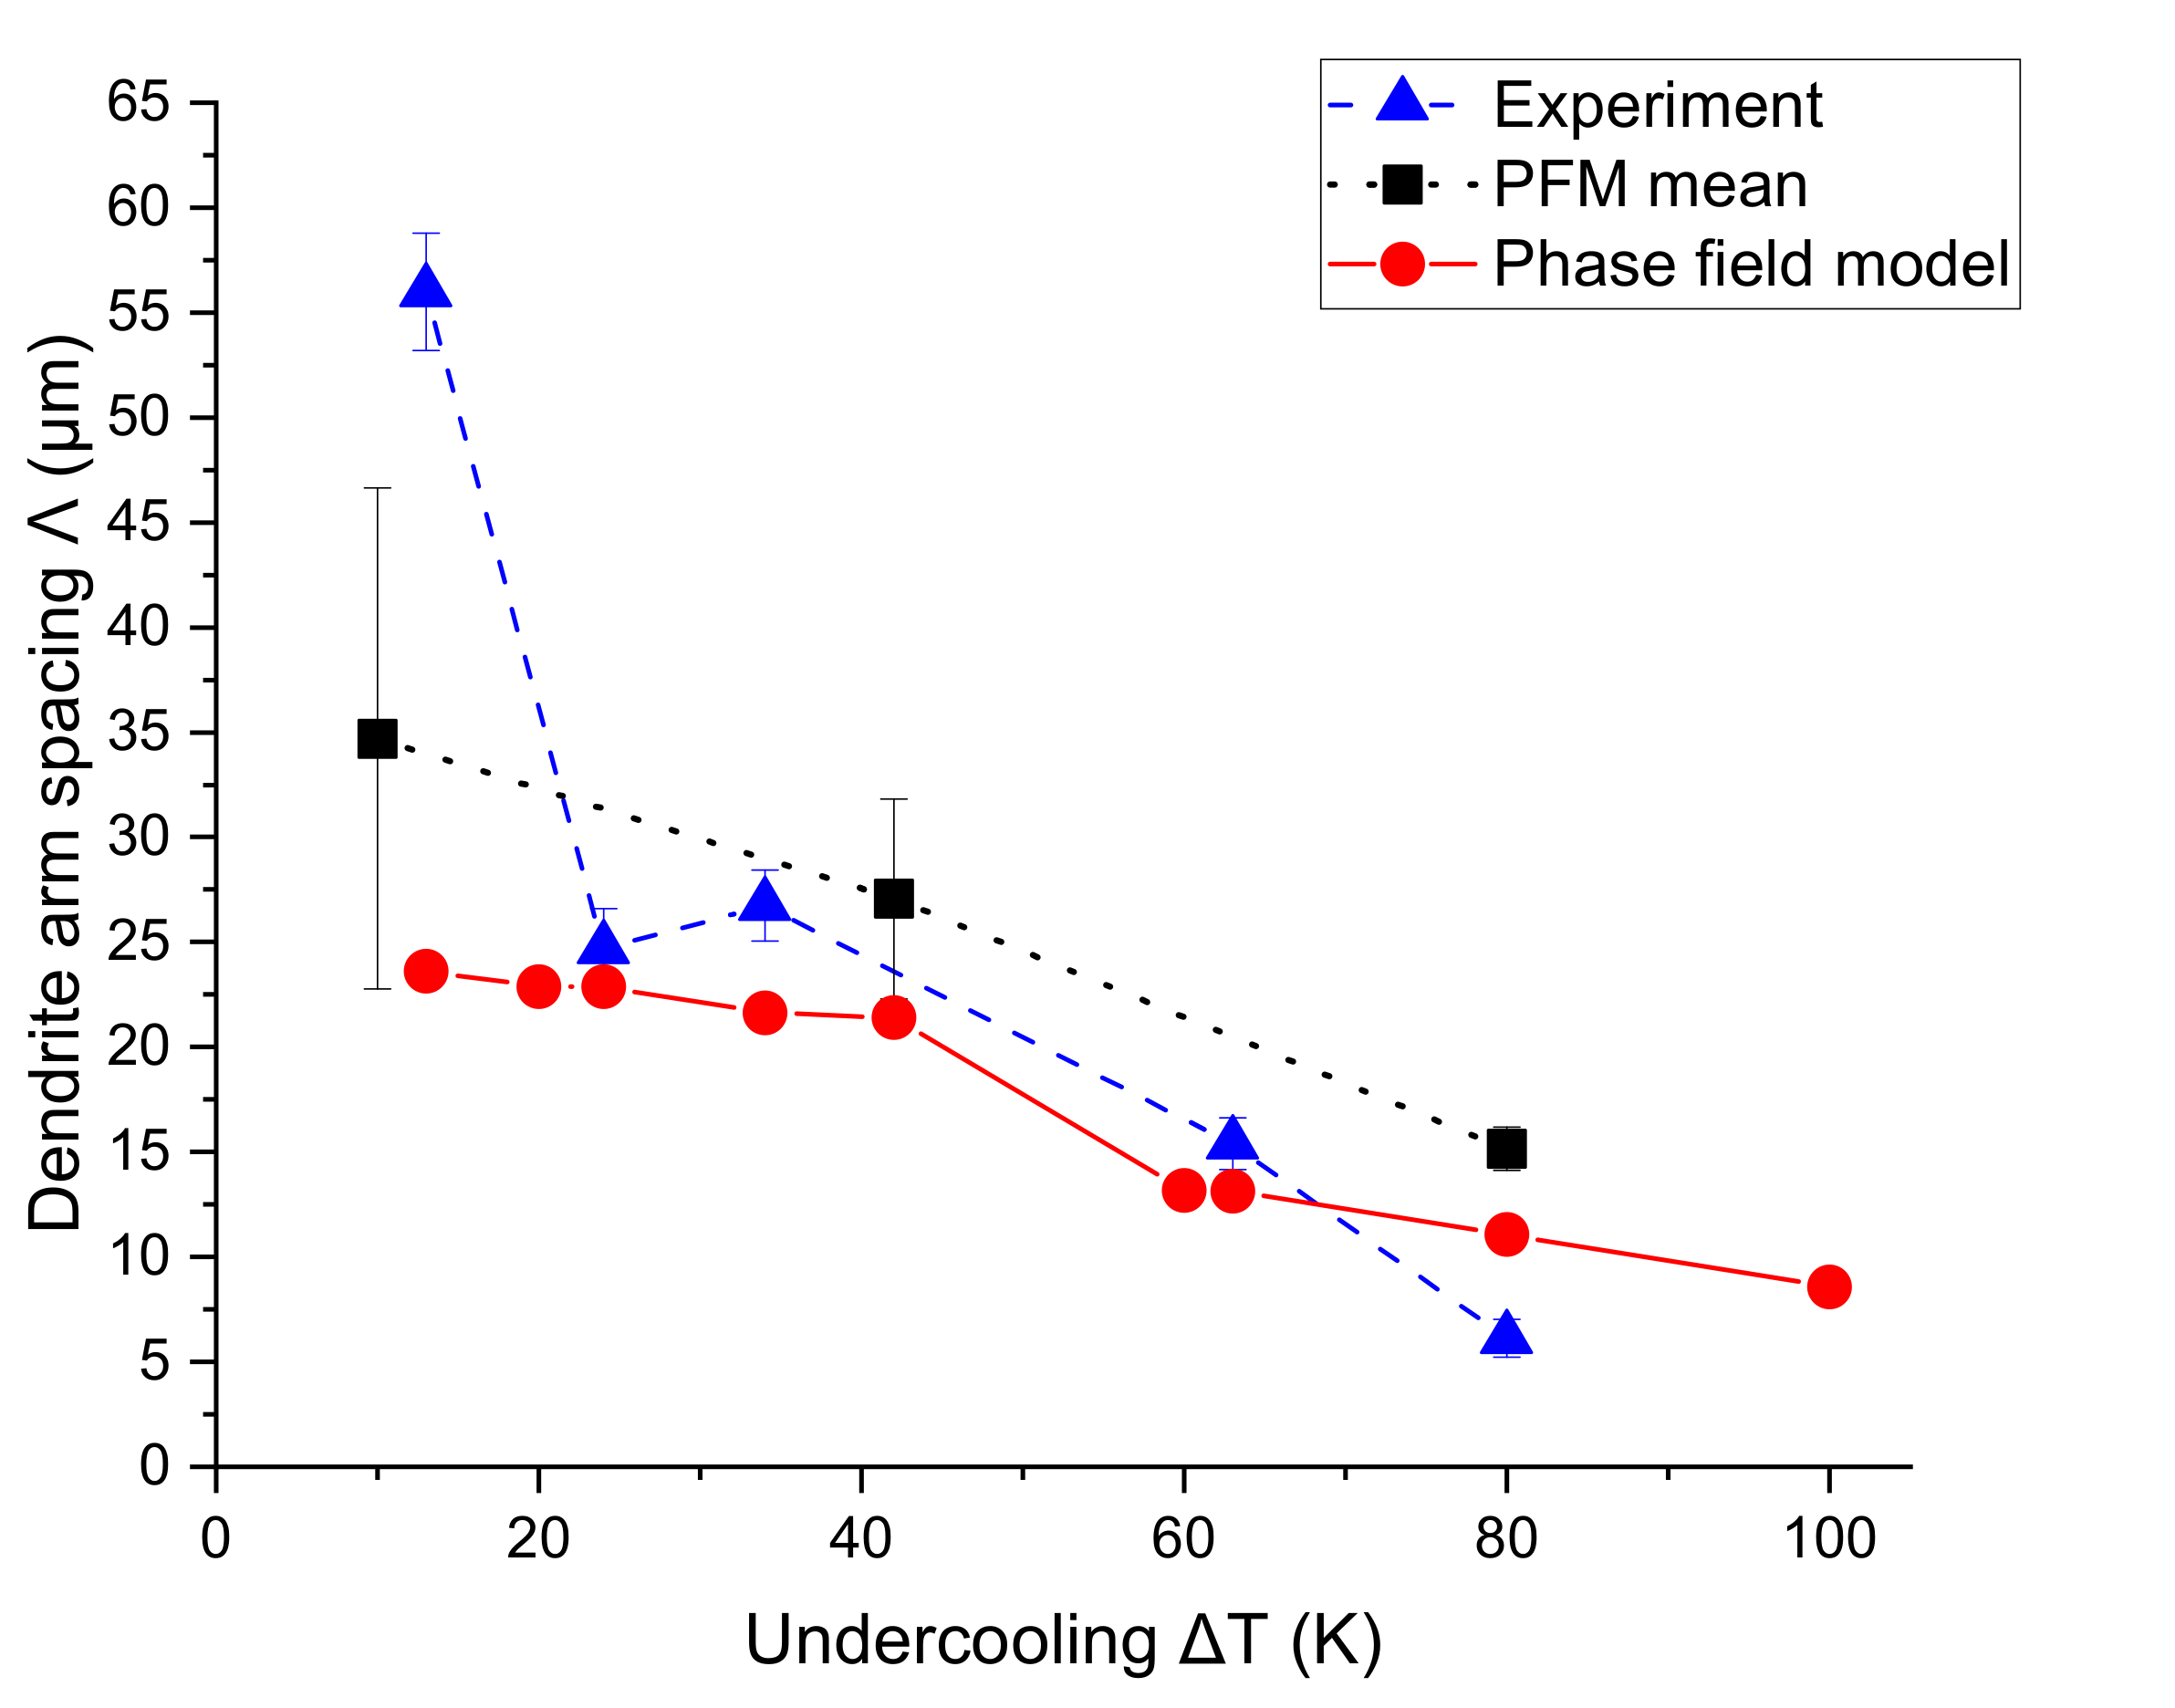
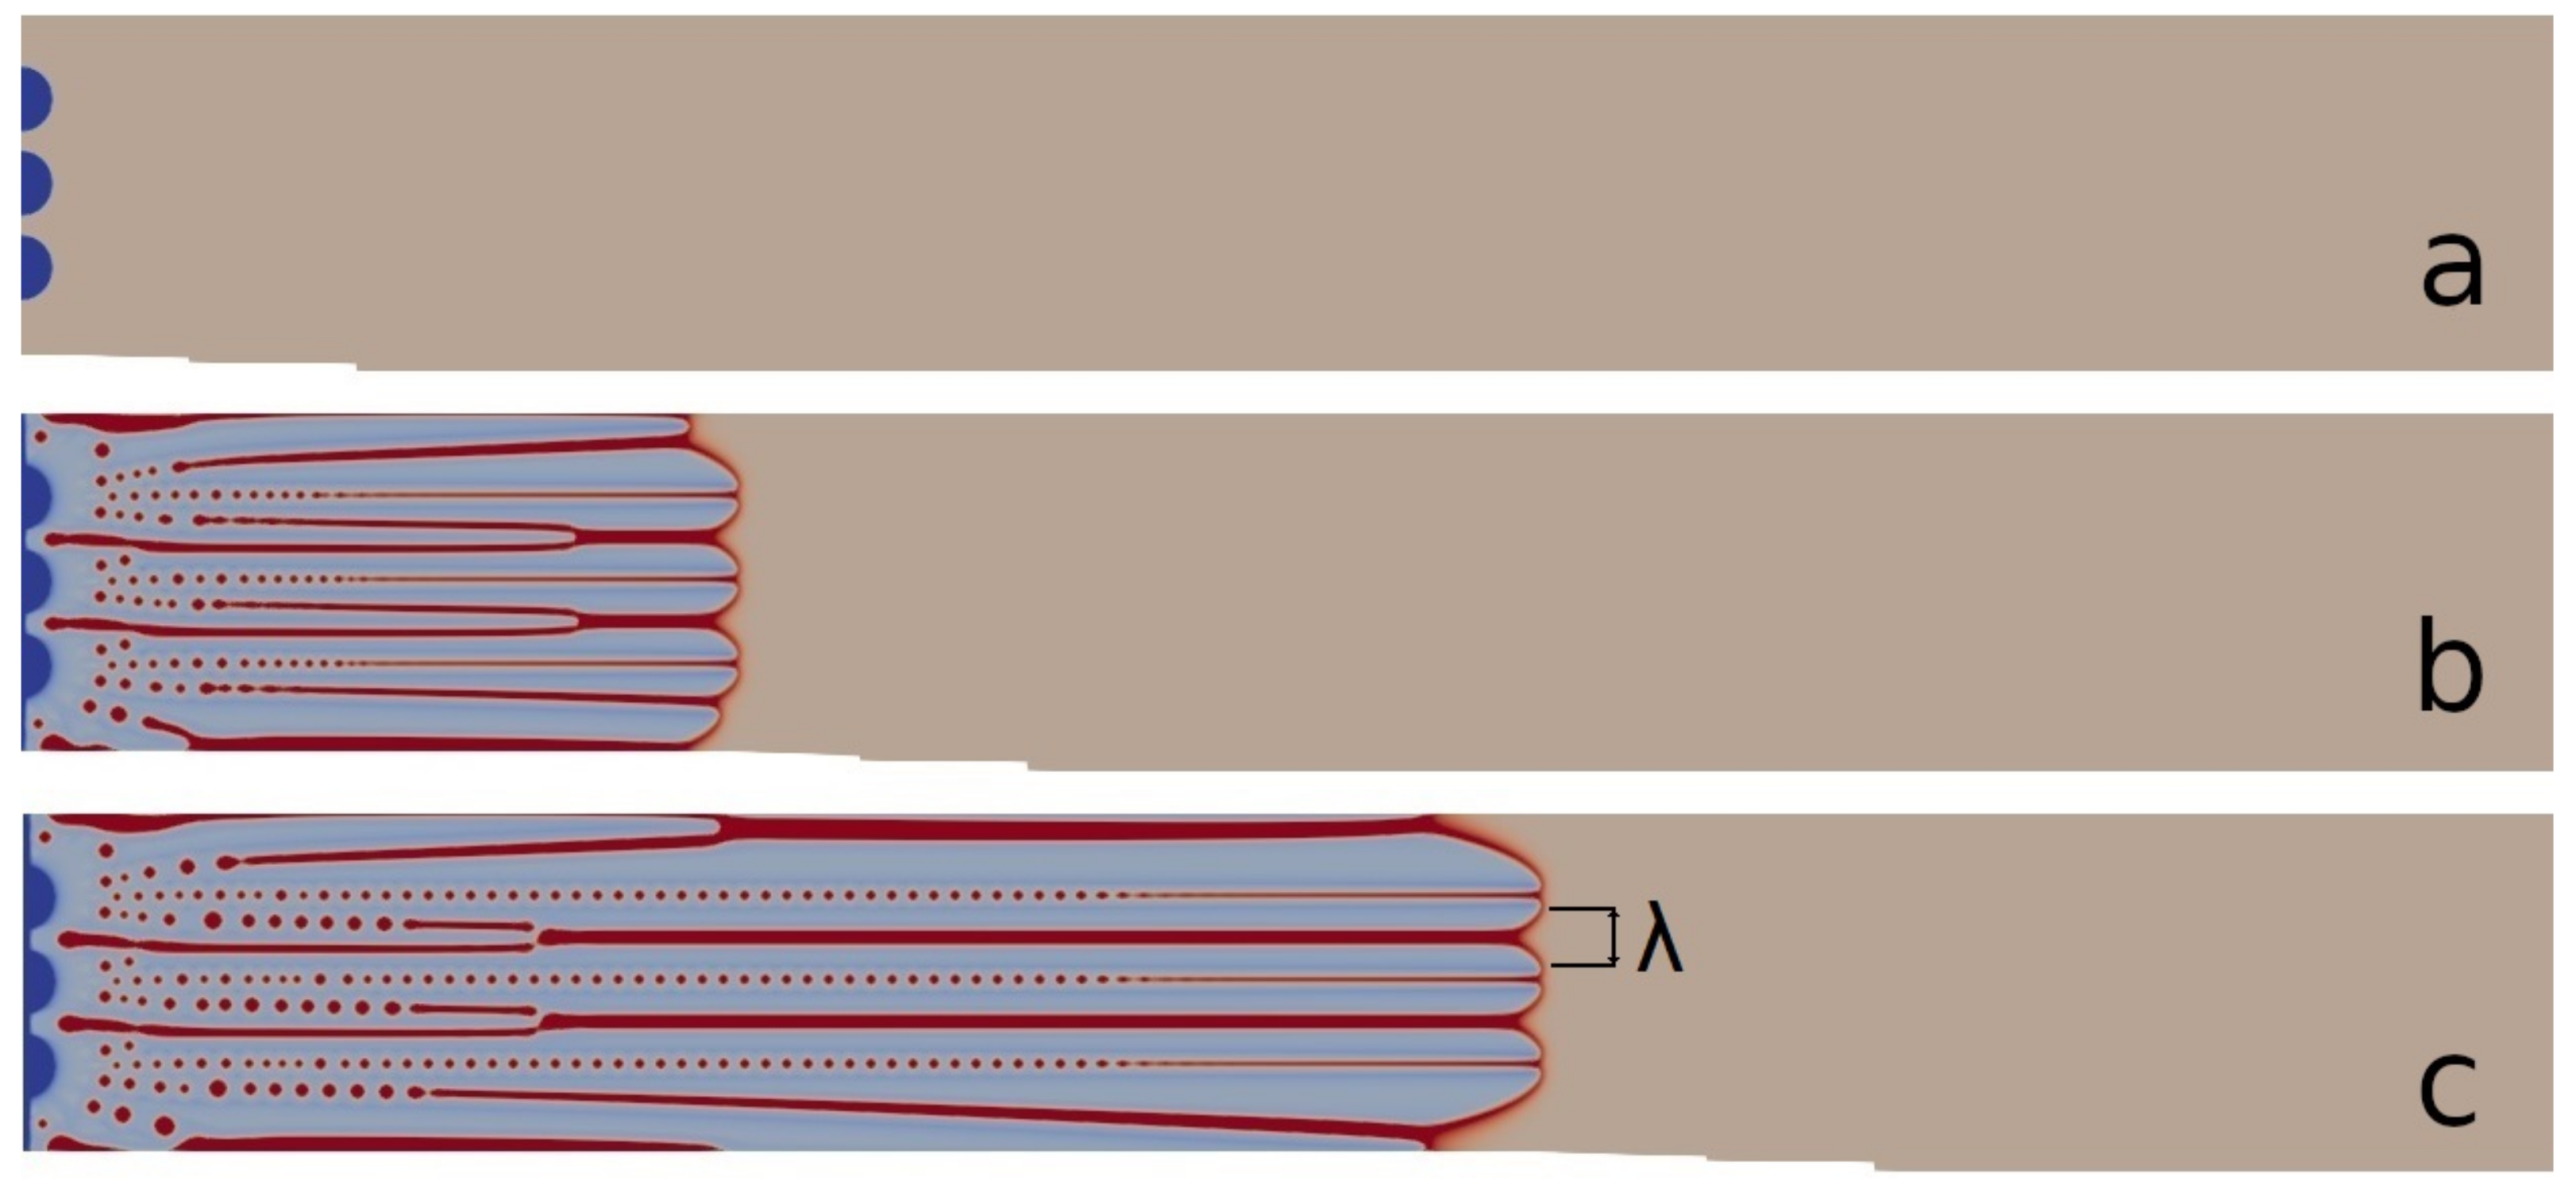
  • Dendrite arms spacing in the dendritic structure;
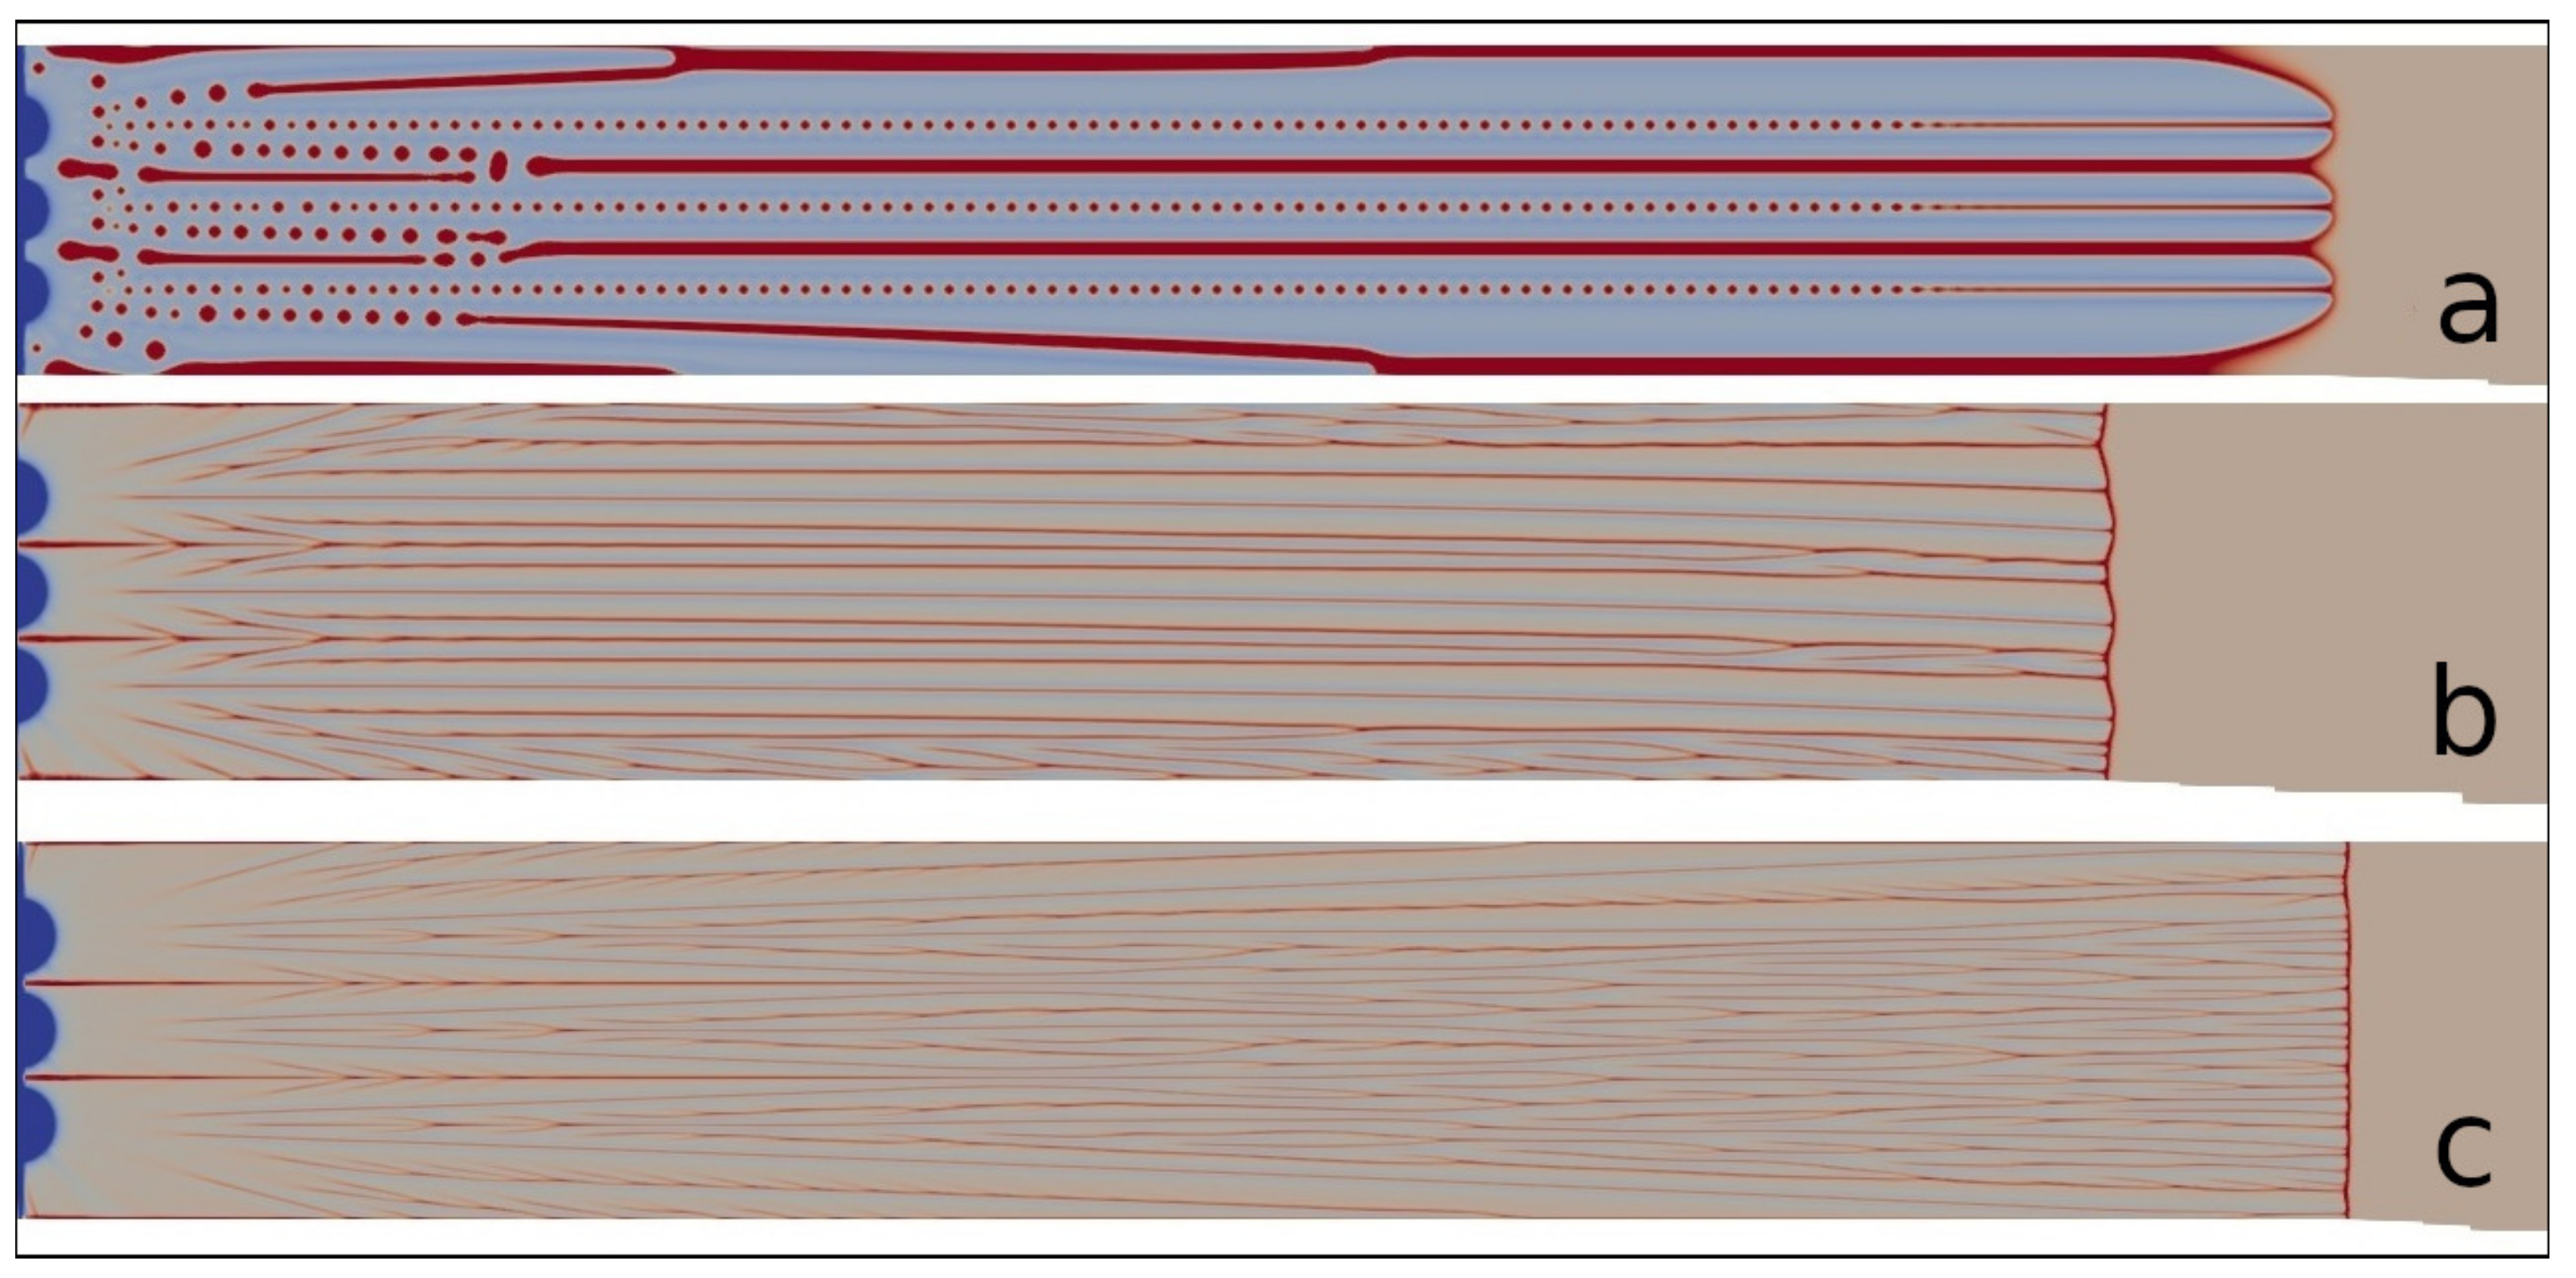
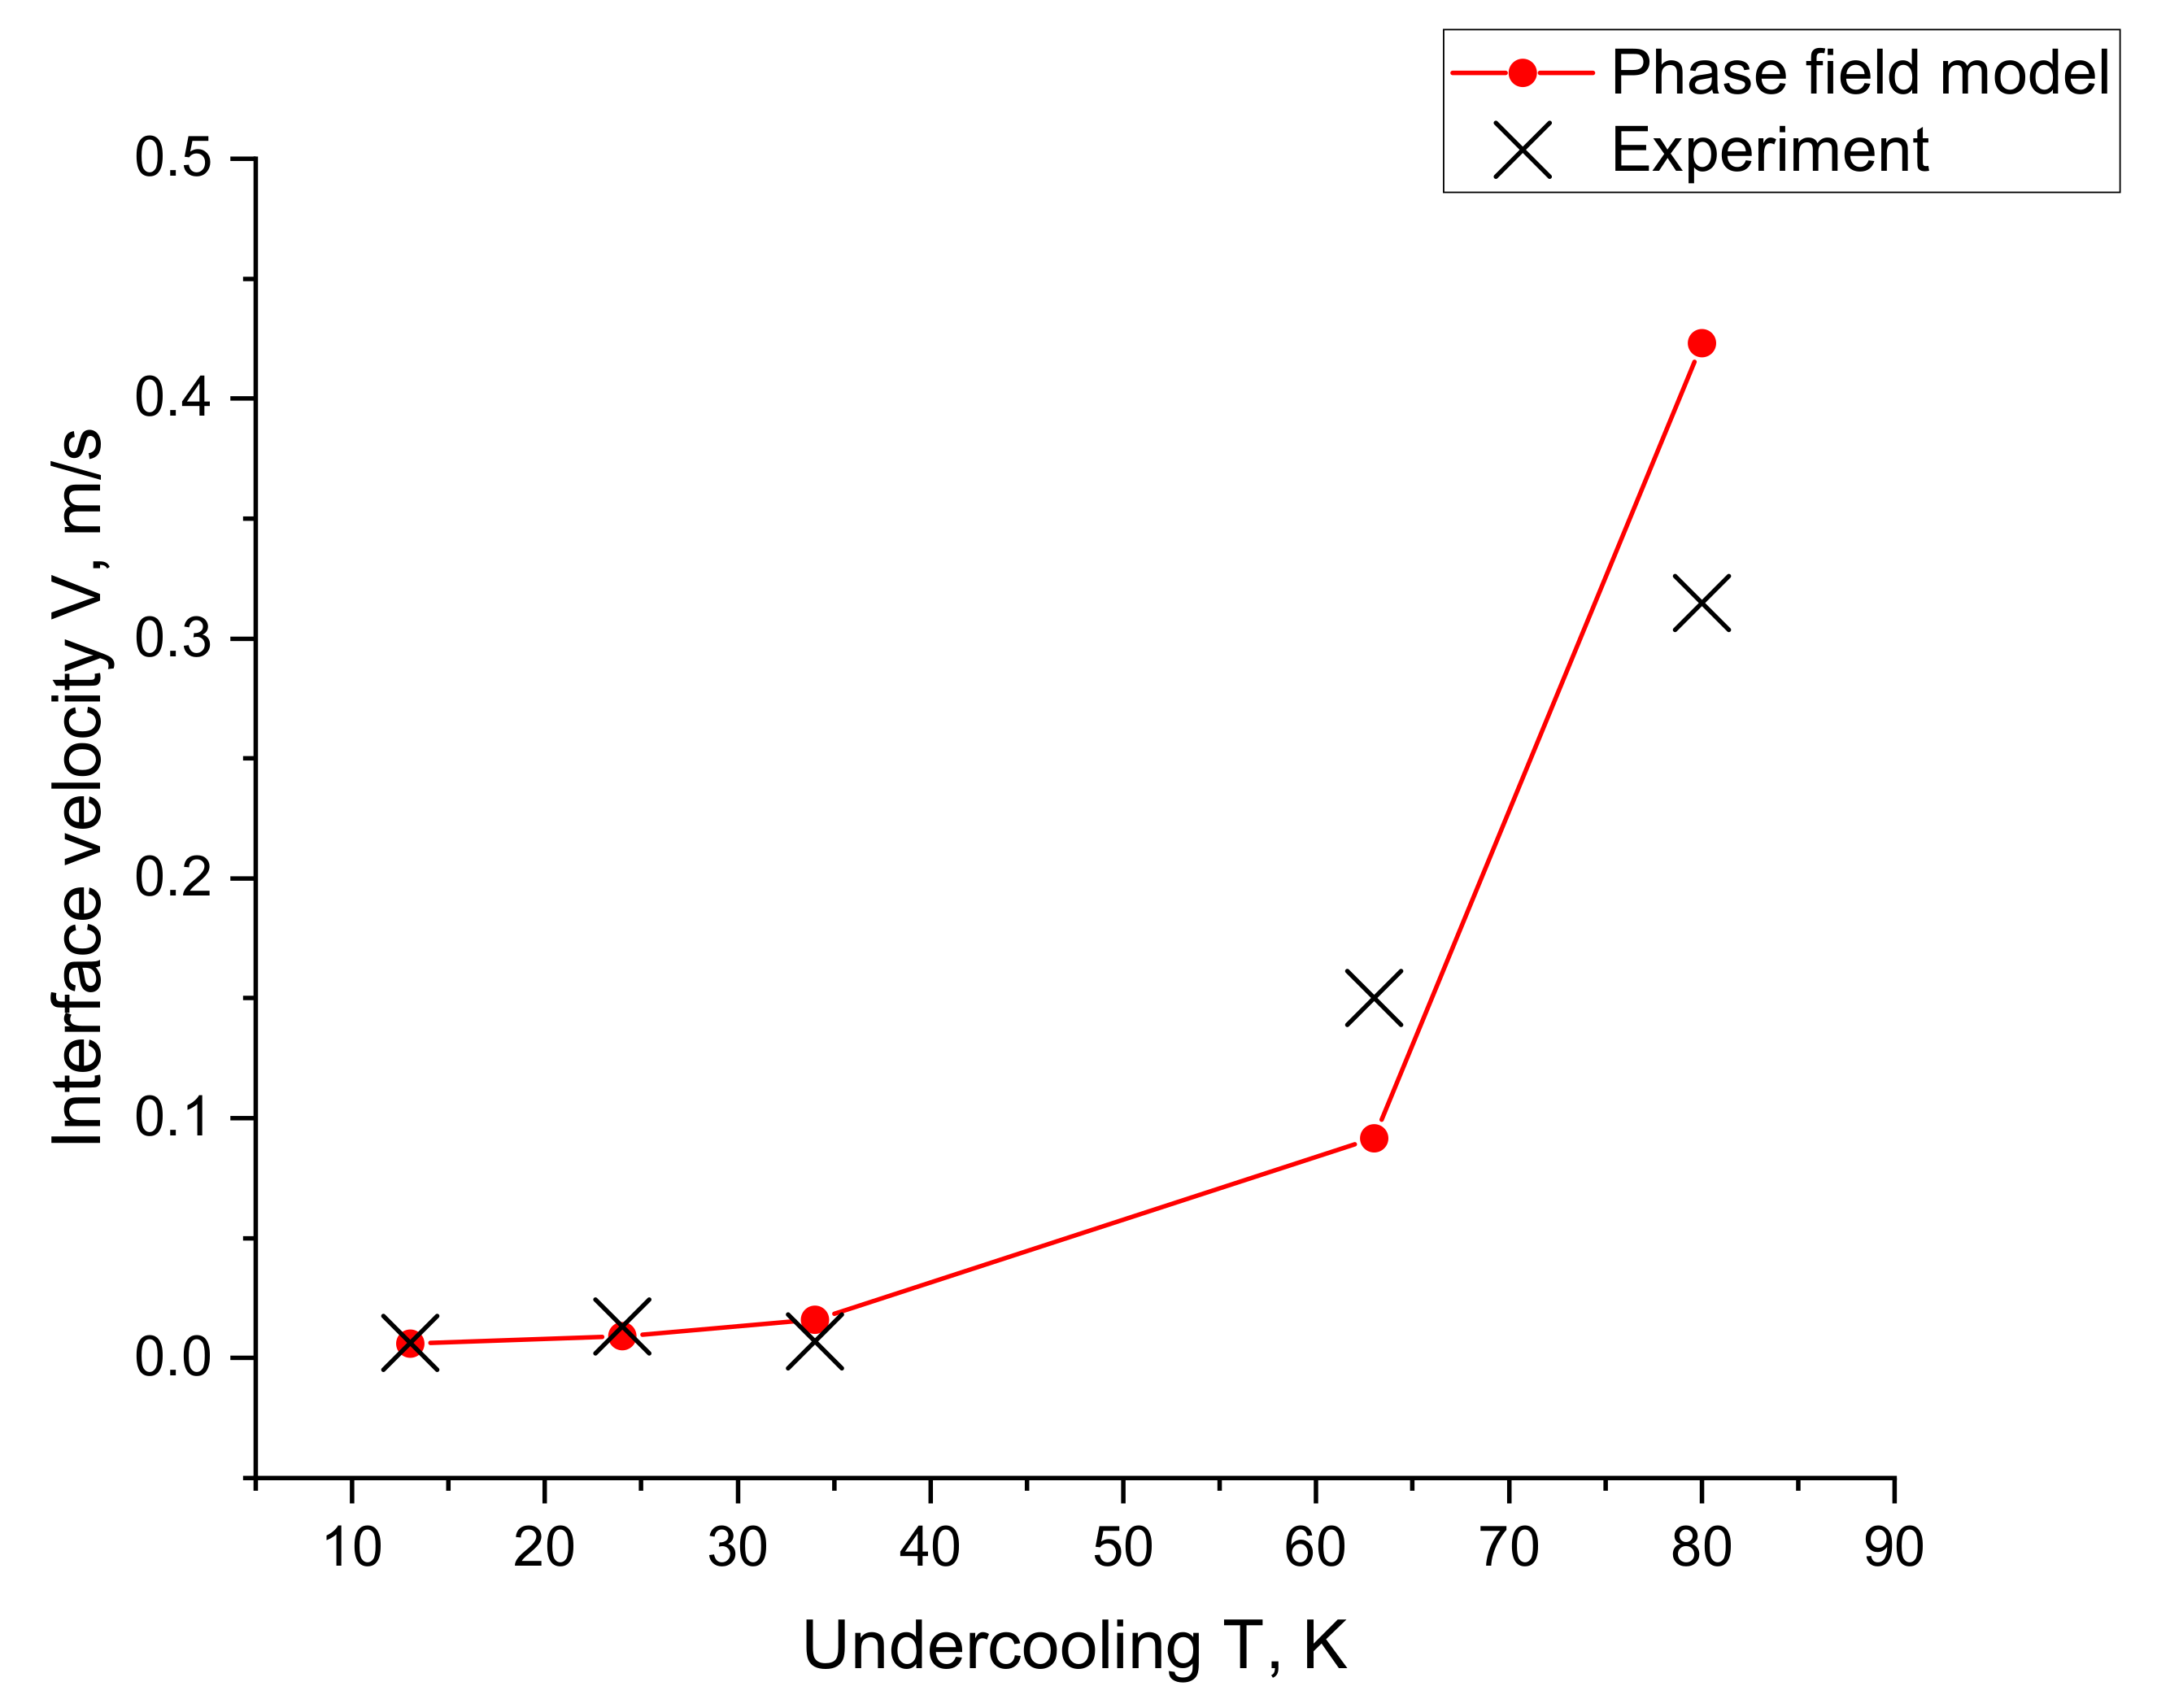
  • Quantitative estimation of dendrite growth kinetics for samples solidified from different undercoolings.
In the present work, experimental results are compared with the verification of theoretical predictions for samples processed using the electromagnetic levitation (EML) technique and in modeling using the phase field model (PFM) of dendritic solidification.

2. Modeling

In the present work, we use a nominal content of IN718 given in Table 1. Because the equilibrium high-temperature phase is the Ni-based face-centered cubic (FCC) γ -phase, the only relevant phase transformation, which is studied numerically in the present work, is the solidification of liquid-to-FCC γ -phase. From experimental data described in our common experimental paper [15], we used concentration profiles to characterize chemical microsegregation, average distances between dendritic main stems, and dendrite growth velocity for different values of undercooling.
In more specific explanations of our experimental results and techniques, we should mention that the electromagnetic levitation (EML) facility is a specially designed apparatus to study the melting, solidification, crystallization, and phase transitions of materials without the influence of the container and gravity, which provide the possibility for a deeper understanding of fundamental behavior of materials and lead to technological advances in various fields [16,17]. In order to capture the movement of the growth front during the recalescence event, a high-speed camera is positioned at the observation window. At the same time, an infrared pyrometer is employed to record the temperature history for undercooling calculation after calibration [18,19]. The solidified microstructure of samples was analyzed using scanning electron microscopy (SEM) in the back-scattering mode. The line intercept method was then utilized to measure both primary and secondary dendrite arm spacing. The focused ion beam (FIB) has been applied in the space between the secondary dendrite arm spacings (inside the chosen so-called “dendrite cell”) to prepare lamellae for further investigation by scanning transmission electron microscopy (STEM). The chemical microsegregation profiles have been analyzed using STEM in combination with energy-dispersive X-ray spectroscopy (EDX).

2.1. Phase Field Model

Phase field modeling of the IN718 solidification was provided using a model developed by Echebarria et al. [20,21], whose asymptotic analysis was originally derived to emulate the classical sharp interface kinetics of solidification at the solid–liquid interface. The model and its asymptotic analysis were later reformulated by Pinomaa and Provatas [14] to incorporate a chemical potential jump across the interface, from which emerge velocity-dependent corrections for the solute partition coefficient k ( V ) and the undercooling at the interface; this makes it possible to emulate the kinetics of the continuous growth model (CGM) [22,23] derived. This becomes relevant for the proper description of the microstructure formation during rapid solidification, where solute trapping across the interface affects cellular growth modes and solute variation, which in turn dominate metal AM structures [12,24]. In the limit of slower solidification rates, the phase field model interface kinetics naturally map back onto the classical equilibrium sharp-interface model description. This is used in the present work.
The IN718 solidification is simulated by a phase field model as a dilute solution of the pseudobinary Ni–Nb alloy’s approximation. Only the diffusion of Nb is considered, and other alloying elements (Fe and Cr) act as passive elements that solely affect the material parameters and properties, such as the liquidus slope, the partition coefficient, the Gibbs free energies of phases, and the solid–liquid interface energy for the Ni–Nb pseudobinary alloy. A similar approach was used in a number of previous works [7,9,11] and proved to be satisfactory. In particular, for Fe–Cr melt (Fe and Cr are chemical components of IN718), the separation of the liquid phase using binodal or spinodal decomposition possibly existing in the deeply undercooled melt is neglected in the present work.
According to previous works [25,26,27,28], Nb is segregated into the liquid after the primary γ -phase nucleation and controls the originating of the strengthening phase, which is formed as the secondary γ -phase. Therefore, the focus of this work is on the segregation of Nb in the IN718 superalloy since its distribution significantly influences the phase formation and mechanical properties. Despite the fact that other alloying elements, especially Ti and Mo, may influence the originating and forming γ phase, we neglect their influence on the dendritic structure in our modeling. Indeed, the diffusion coefficient of Mo is essentially smaller than Nb at the primary solidification temperature range [29]. Moreover, the chemical segregation coefficient (partitioning coefficient k e ) is essentially bigger for Mo than the segregation coefficient of Nb in Ni [30]. The values of the diffusion and segregation coefficients of Ti are close to those for Nb [31]; however, most of the Ti is consumed in the liquid alloy due to the formation of small TiN nitrides, but its initial content in the alloy is much smaller than the amount of Nb, so the tendency of Nb to segregate the liquid phase is much stronger than that of Ti [30]. Therefore, in our simulation, we neglect the Ti and Mo transport and their inhomogeneity in the first approximation of our calculations. We consider the solidification to be driven by an equilibrated external temperature field. The assumption of instantaneous thermal equilibration during the proceeding solidification is legitimated if the temperature field does not change due to the fact that the latent heat released during the phase transition is instantly distributed over the entire area. The reason for this is that the diffusion coefficient of chemical elements is typically a few orders of magnitude slower than the diffusion of heat. Thus, the conditions for the isothermal crystallization can be satisfied. As a final simplification, we also assume that convection does not affect the solidification.
We shall compute the evolution of the Nb concentration c and the order parameter ϕ , which denotes the phase field defining whether the material is liquid ( ϕ = 1 ) or solid ( ϕ = 1 ). Using the prescribed assumptions, the evolution equations that were proposed in [14,20] for two-dimensional formulation used in 2D numerical simulations are set as follows:
τ ϕ t = · W ( n ) 2 ϕ + x | ϕ | 2 W ( n ) W ( n ) ϕ x + y | ϕ | 2 W ( n ) W ( n ) ϕ y + ϕ ϕ 3 λ 1 k e ( 1 ϕ 2 ) 2 e u 1 T l T | m l e | c l 0 ,
c t = · D L c q ( ϕ ) u + a t W 0 ( 1 k e ) e u ϕ t ϕ | ϕ | ,
e u = c c e q , c e q = 1 + k e ( 1 k e ) h ( ϕ ) 2 ,
h ( ϕ ) = ϕ , q ( ϕ ) = 1 c e q 1 ϕ 2 + 1 + ϕ 2 D S D L ,
a ( n ) = 1 3 ϵ c 1 + 4 ϵ c 1 3 ϵ c ( n x 4 + n y 4 ) ,
where τ ( n ) is the anisotropic interface attachment time scale τ ( n ) = τ 0 a 2 ( n ) ; W ( n ) is the anisotropic interface width W ( n ) = W 0 a ( n ) ; n = ϕ | ϕ | is the unit normal to the interface; a ( n ) is the dimensionless anisotropy function, whose explicit form is represented in Equation (5); λ is the coupling constant; T is the temperature; T l is the liquidus temperature; m e l is the equilibrium liquidus line slope; D L and D S are the liquid and solid diffusion coefficients, respectively; c o l is the nominal Nb composition; and a t = 1 / 2 2 is the antitrapping coefficient. The relation of physical parameters used in Equations (1)–(5) are summarized in the following paragraphs and in Table 2, where details of computational solutions and numerical grid spacing are represented.
For the quantitative analysis of the model, the thin interface limit of the above phase field model is performed by using the well-established parameter relationships derived in Refs. [20,21,32]. Specifically, the parameters W ( n ) , τ ( n ) , and λ are related to the solutal capillary length d o and kinetic coefficient β according to the following equations:
d o ( n ) = a 1 W ( n ) λ , β ( n ) = a 1 τ ( n ) λ W ( n ) a 1 a 2 W ( n ) D L ,
where a 1 and a 2 are the constants from the asymptotic analysis that depend on the chosen interpolation functions. For h ( ϕ ) and q ( ϕ ) , given by Equation (4), they are
a 1 = 0.8839 ; a 2 = 0.6867 .
The capillary length d o and kinetic coefficient β are anisotropic. Since the FCC phase has cubic crystal lattice, the anisotropy can be expressed [32,33] as
d o ( n ) = d o s o l 1 3 ϵ c + 4 ϵ c n x 4 + n y 4
β ( n ) = β 0 1 + 3 ϵ k 4 ϵ k n x 4 + n y 4
where d o s o l is the magnitude of the anisotropic capillary length d o ( n ) and ϵ c is the capillary anisotropy strength. Analogously, β 0 is the magnitude of the anisotropic kinetic coefficient β ( n ) and ϵ k is the kinetic anisotropy strength.
The phase field simulations have been carried out with explicit Euler forward time stepping, with the time step size set to 0.7 of the linear stability limit for the concentration diffusion equation. That is, it satisfies the stability conditions of the finite difference scheme [34], and the estimation of the time step value can be carried out similarly to [32]. The order parameter evolution given by Equation (1) was modeled using the finite difference method, and the concentration diffusion Equation (2) was solved using the finite volume method.
Simulations of the above phase field equations were carried out using an adaptive mesh refinement (AMR) algorithm originally developed for phase-field modeling by Provatas et al. [35] and later developed for multiple-order parameter phase-field models by Greenwood et al. [36]. In AMR, the mesh is dynamically adapted to be refined around spatial locations defined by large gradients of order parameters. In this way, most of the computational cost arises near interfaces while the cost of computing at nodes in the bulk regions is significantly diminished. This greatly reduces simulation time as well as memory requirements. In this work, the smallest allowed grid spacing has been chosen to be 0.6 of the interface width, with Δ x = 0.6 W 0 . Following Equations (6) and (7), such a choice of numeric grid is smaller than the capillary length scale: Δ x 0.01 d 0 .
Periodic boundary conditions were used for the phase field variable ϕ and the concentration field c. The simulations were carried out under constant dimensionless undercoolings Δ = T l T | m l e | c l 0 . Additionally, the value of capillary length was calculated as d o s o l = Γ / ( 1 k e ) | m l e | c l 0 using material properties from Table 2.
Table 2. Phase-field model parameters for pseudobinary Ni–Nb approximation of IN718.
ParametersPhase Field ModelRef.
Equilibrium partition coefficient, k e 0.58 present work
Equilibrium liquidus slope, m l e 10.5 K/wt%[37]
Melting point of pure Ni, T m 1728 Kpresent work
Alloy concentration, c l o 5 wt%present work
Gibbs–Thomson coefficient, Γ 3.55 · 10 7 K· m[38]
Adiabatic temperature of solidification, T Q 259.72 Kpresent work
Liquid diffusion coefficient, D L 3 · 10 9 m2/s[39]
Solid diffusion coefficient, D S 1 · 10 13 m2/s[39]
Kinetic growth coefficient, β 0.024 s/mpresent work
Capillary anisotropy strength, ϵ c 0.012 present work
Kinetic anisotropy strength, ϵ k 0.012 present work
Interface width, W 0 0.6 μ mpresent work

2.2. Tests

To determine the convergence of the simulation results to the experimental data, special tests of the used model (1)–(8) were carried out. The size of the computational domain and the number of perturbations on the flat front have been varied, which should grow deeper into the undercooled melt faster, forming crystalline cells and dendrites in primary solidification. In these tests, the possibility of obtaining quantitative simulation results has been established for the growth velocity and distance between the branches of primary dendrites (almost) independently of the size of the computational domain and the number of initial perturbations on the initially established planar front of solidification.
Table 3 shows the results of computation of the microstructure simulated with different number of the initial crystalline seeds at the planar solidification front with their evolution within the square domain of 614 μ m × 614 μ m. At the final stage of modeling a distance Λ between dendrite arms has been measured with its average values shown in Figure 1 by solid squares and indicated as “PFM mean”. It can be seen that the computed Λ has the same experimentally measured tendency to be increased with the decrease of undercooling.

2.3. Simulation Procedures

The simulation starts with three circular solids equidistant from each other on the left border of an elongated system. As these seeds grow, two field variables are tracked: the phase field ϕ , and the Nb concentration c. During dendritic solidification, the solute is distributed between the solid and liquid phases; this distribution usually corresponds to equilibrium values of concentrations at low velocities, However, at medium and high velocities, the redistribution of dissolved substances may not be complete; accordingly, the compositions of dissolved substances at the interface may not correspond to the equilibrium values.
Simulations were performed until the stage of the constant growth velocity. It should be noted that we approximated the alloy IN718 to be a binary Ni-5wt.%Nb in this study, and the corresponding quasi-binary phase diagram has nearly constant liquidus slope m l e as well as partition coefficient k e . The possible formation of Ni 3 Nb in the intercellular regions or γ -phase formation is not treated in this paper. The materials parameters of the dilute Ni–Nb alloy are listed in Table 2.
In Figure 2 we present the simulated patterns for the lowest undercooling Δ T = 13 K at different time steps. Nb concentration varies significantly both in the liquid ahead of the tips and between the dendrite arms. Nb is being forced out into the liquid by the growing pattern, and thus the interdendritic regions become enriched.
It can also be seen from the low undercooling simulation that Nb-rich droplets appear. Over time, these circular droplets become highly enriched by alloying components and could transform into a secondary phase. The concentration profiles through dendritic cells (including secondary dendrite arms and interdedritic spacing—see Figure 3a) at the last time step of computations are presented in Section 3.1.
The final patterns obtained for the analysis of the dendrite arm spacing, concentration, and velocities in their comparison with EML experiments are presented in Figure 4. In order to quantitatively analyze simulation results, the average distance between the tips of neighboring γ -phase dendrite arms has been measured. The obtained values of the distance are presented in Figure 1 and described in Section 3.2 devoted to the dendrite arm spacing.
Finally, the dendrite growth kinetics is estimated by the simulating results of the phase field modeling. These results are compared with the experimental results on dendritic growth velocity obtained in the solidifying samples processed using the EML technique [15].

3. Results and Discussion

3.1. Dendrite Microstructure and Concentration Profiles

The modeled dendrite microstructure grown at various undercooling values is shown in Figure 4. It can be seen qualitatively that the microstructure becomes more dense with the increase in undercooling. This tendency shows the transition to a planar interface if the interface velocity approaches absolute chemical stability velocity [40,41].
Quantitatively, the change in the dendrite microstructure is characterized by the change in the dendrite arm spacing and the concentration profiles of Nb within the region near the tip, including a dendrite branch and a part of the interdendritic space (for undercooling Δ T = 13 K and 80 K) or within the “dendritic cell,” which includes two secondary branches of the dendrite and an interdendritic space (for undercooling Δ T = 35 K in Figure 4). The areas for analysis were chosen in such a way that their position corresponded to the chemical analysis carried out experimentally [15], and the calculated dendrite arm spacing is shown in Figure 2c.
As expected, the computed profiles effectively reproduce the tendency in concentration change within every dendrite cell. Moreover, it has been found that experimental and computed profiles almost give an equilibrium segregation coefficient: k c a l c = 0.58 k e x p = 0.58 = k e , where the segregation coefficients are given by the k c a l c , the calculation from the results of phase-field modeling; k e x p , the experimental measurements; and k e , the value obtained from the phase diagram Ni-Nb. This is shown in Figure 3b–d for values of undercooling Δ T = 13, 35, and 80 K, respectively. Figure 3b shows only part of the concentration curve, which is located near the dendrite branch and the interdendritic space, obtained in a similar location as was chosen in the experiment. Assuming that at lower undercooling, the solidification path is close enough to the low-kinetic process, the distribution of Nb can be close to the equilibrium value in both the experiment and the calculations. However, the deviation of the interdendritic spacing obtained in the experiment and in the calculation can be caused by the influence of the computational domain and the number of nuclei, as mentioned earlier in Section 2.2. The quantitative difference in these profiles is related to the different spatial scales in modeling and experimentally (spatially, two-dimensional modeling and three-dimensional experimental statements), as well as in pseudobinary approximation of phase field simulations (in comparison with chemically multi-component IN718 alloy). It is possible that the phase-field simulations slightly deviate from experimental profiles due to the relatively large interface width assumed in computations, which can lead to a departure from experimentally measured concentration profiles.

3.2. Dendrite Arm Spacing

The average dendrite arm spacing Λ of the simulated crystalline patterns was estimated by counting the number of cells appearing in the direction perpendicular to the longitudinal growth trend shown graphically in Figure 2c. The measurements of dendrite arm spacing Λ were made when the dendrite tips reached 2/3 of the computational domain.
The computed Λ as a function of undercooling Δ T is presented in Figure 1, as marked by filled circles and entitled “Phase field model”. The dendrite arm spacing, as expected, shows a tendency to decrease Λ as the undercooling Δ T increases. Considering the model assumptions and the known errors in experimental measurements, one can observe that the calculated Λ is in good agreement with the experimental data and in consistency with the tests’ PFM mean.
As can also be seen from Section 2.2, the calculation domain and number of perturbations at the planar solidification front may significantly influence the growth of the calculated structure. The deviation of the result obtained for undercooling Δ T = 13 K in the experiment from calculated values can be connected with the difference in the size of the calculation domain and the size of the real droplet. This problem especially, established at small undercooling requiring significant computational time and resources, should be thoroughly studied in future work.

3.3. Dendritic Growth Velocity

As can be seen in Figure 5, the phase field model satisfactorily describes experimental data up to undercooling Δ T = 80 K. This is the regime of quasi-equilibrium dendritic growth in which the solute trapping did not essentially come into action [42]. This experimental fact is demonstrated by the concentration profiles shown in Figure 3b–d and supported by present computations of Nb distribution through the dendrite cells. Such consistency of experimental data and computational results allow us to conclude the following:
-
The present model (1)–(8) adequately describes experiments without essential solute trapping,
-
Based on the Ni–Nb mixture, a quasi-binary approximation to model chemical composition and crystal growth velocity in IN718 can be a reasonable approach for predicting the microstructure upon primary solidification of IN718 in diffusion-limited regime.

4. Conclusions

The phase-field model was used to simulate and analyze the patterns formed during the solidification of Inconel 718 (IN718) under different values of undercooling consistent with the solute diffusion-limited growth of dendritic crystals. The predictions of the model were made in the quasi-binary approximation of IN718 assuming the solidification of Ni–Nb alloy.
Dendrite arm spacing was estimated for the steady state regime of crystal growth in which the spacing decreases with increasing undercooling from 20 μ m at Δ T = 13 K to 10 μ m at Δ T = 80 K. The obtained phase field results correspond well to the experimental data (Figure 3 and may indicate the increase in the primary γ -phase and the decrease in the γ -phase with the increase in the initial undercooling of the primary microstructure in IN718.
Nb concentrations of the dendrite cells were compared with the experimental results (Figure 3b–d). It was shown that in the range of undercooling of Δ T = 13–80 K, the pattern formation can be predicted with an equilibrium partition coefficient. In addition, the relationship “dendrite growth velocity-undercooling” calculated using the phase-field model shows agreement at the same range of undercooling.
The simulated microstructures and the concentration fields can be used as inputs for further simulations; for example, of subsequent heat treatment. Notably, secondary phase formations between the cells may arise because the Nb-rich droplets are expected to transform into Laves phases or γ phases during the following stages of solidification in IN718. The modeling of such a phase formation is planned as a further development of the phase field model in its chemically multi-component statement with application to nickel-based superalloys.

Author Contributions

Conceptualization, N.K., T.P., A.L., N.P. and P.K.G.; methodology, N.K., T.P., A.L., N.P. and P.K.G.; software, N.K., T.P., A.L., N.P. and P.K.G.; validation, N.K., T.P. and P.K.G.; formal analysis, N.K., T.P, A.L., N.P., S.L. and P.K.G.; investigation, N.K., Y.F., C.Y., M.S., K.F., S.L. and P.K.G.; resources, N.K., Y.F., C.Y., M.S., K.F., S.L. and P.K.G.; data curation, N.K., Y.F., C.Y., M.S., K.F. and P.K.G.; writing—original draft preparation, N.K., P.K.G.; writing—review and editing, all; visualization, N.K.; supervision, P.K.G.; project administration, P.K.G.; funding acquisition, P.K.G. and S.L. All authors have read and agreed to the published version of the manuscript.

Funding

This research was funded by the German Science Foundation (DFG-Deutsche Forschungsgemeinschaft) under the Project GA 1142/11-1.

Institutional Review Board Statement

Not applicable.

Informed Consent Statement

Not applicable.

Data Availability Statement

Data is available on request.

Acknowledgments

Authors thank Jianrong Gao for fruitful discussions, reading the manuscript and discussions on experimental data obtained on IN718 samples.

Conflicts of Interest

The authors declare no conflict of interest. The authors have no known competing financial interests or personal relationships that could have appeared to influence the work reported in this paper.

Abbreviations

The following abbreviations are used in this manuscript:
AMAdditive manufacturing
AMRAdaptive mesh refinement
CGMContinuous growth model
EMLElectromagnetic levitation
FCCFace-centered cubic latticle
IN718Inconel 718
PFMPhase field model
SEMScanning electron microscopy

References

  1. Reed, R.C. The Superalloys: Fundamentals and Applications; Cambridge University Press: Cambridge, UK, 2006. [Google Scholar] [CrossRef]
  2. Barker, J.F. The initial years of alloy 718—A GE perspective. In Superalloy 718 Metallurgy and Applications; TMS: Pittsburgh, PA, USA, 1989; pp. 269–277. [Google Scholar]
  3. Murr, L.E.; Gaytan, S.M.; Ramirez, D.A.; Martinez, E.; Hernandez, J.; Amato, K.N.; Shindo, P.W.; Medina, F.R.; Wicker, R.B. Metal Fabrication by Additive Manufacturing Using Laser and Electron Beam Melting Technologies. J. Mater. Sci. Technol. 2012, 28, 1–14. [Google Scholar] [CrossRef]
  4. Kundin, J.; Mushongera, L.; Emmerich, H. Phase-field modeling of microstructure formation during rapid solidification in Inconel 718 superalloy. Acta Mater. 2015, 95, 343–356. [Google Scholar] [CrossRef]
  5. Fleck, M.; Querfurth, F.; Glatzel, U. Phase field modeling of solidification in multi-component alloys with a case study on the Inconel 718 alloy. J. Mater. Res. 2017, 32, 4605–4615. [Google Scholar] [CrossRef]
  6. Radhakrishnan, B.; Gorti, S.B.; Turner, J.A.; Acharya, R.; Sharon, J.A.; Staroselsky, A.; El-Wardany, T. Phase Field Simulations of Microstructure Evolution in IN718 Using a Surrogate Ni–Fe–Nb Alloy during Laser Powder Bed Fusion. Metals 2019, 9, 14. [Google Scholar] [CrossRef] [Green Version]
  7. Wang, X.; Liu, P.; Ji, Y.; Liu, Y.; Horstemeyer, M.; Chen, L. Investigation on Microsegregation of IN718 Alloy During Additive Manufacturing via Integrated Phase-Field and Finite-Element Modeling. J. Mater. Eng. Perform. 2018, 28, 657–665. [Google Scholar] [CrossRef]
  8. Li, Y.; Olmedilla, A.; Založnik, M.; Zollinger, J.; Dembinski, L.; Mathieu, A. Solidification microstructure during selective laser melting of Ni based superalloy: Experiment and mesoscopic modelling. IOP Conf. Ser. Mater. Sci. Eng. 2019, 529, 012004. [Google Scholar] [CrossRef]
  9. Wang, X.; Chou, K. Microstructure simulations of Inconel 718 during selective laser melting using a phase field model. Int. J. Adv. Manuf. Technol. 2019, 100, 2147–2162. [Google Scholar] [CrossRef]
  10. Kumara, C.; Segerstark, A.; Hanning, F.; Dixit, N.; Joshi, S.; Moverare, J.; Nylén, P. Microstructure modelling of laser metal powder directed energy deposition of alloy 718. Addit. Manuf. 2019, 25, 357–364. [Google Scholar] [CrossRef]
  11. Nabavizadeh, S.A.; Eshraghi, M.; Felicelli, S.D. Three-dimensional phase field modeling of columnar to equiaxed transition in directional solidification of Inconel 718 alloy. J. Cryst. Growth 2020, 549, 125879. [Google Scholar] [CrossRef]
  12. Keller, T.; Lindwall, G.; Ghosh, S.; Ma, L.; Lane, B.M.; Zhang, F.; Kattner, U.R.; Lass, E.A.; Heigel, J.C.; Idell, Y.; et al. Application of finite element, phase-field, and CALPHAD-based methods to additive manufacturing of Ni-based superalloys. Acta Mater. 2017, 139, 244–253. [Google Scholar] [CrossRef]
  13. Guillemot, G.; Senninger, O.; Hareland, C.A.; Voorhees, P.W.; Gandin, C.A. Thermodynamic coupling in the computation of dendrite growth kinetics for multicomponent alloys. Calphad 2022, 77, 102429. [Google Scholar] [CrossRef]
  14. Pinomaa, T.; Provatas, N. Quantitative phase field modeling of solute trapping and continuous growth kinetics in quasi-rapid solidification. Acta Mater. 2019, 168, 167–177. [Google Scholar] [CrossRef]
  15. Fang, Y.; Yu, C.; Kropotin, N.; Seyring, M.; Freiberg, K.; Lippmann, S.; Kolbe, M.; Galenko, P.K. Crystalline microstructure, microsegregation, and mechanical properties of Inconel 718 alloy samples processed in electromagnetic levitation facility. Metals 2023. to be submitted. [Google Scholar]
  16. Herlach, D.M.; Galenko, P.; Holland-Moritz, D. Metastable Solids from Undercooled Melts; Pergamon Materials Series; Elsevier: Amsterdam, The Netherlands, 2007. [Google Scholar]
  17. Herlach, D.M.; Burggraf, S.; Reinartz, M.; Galenko, P.K.; Rettenmayr, M.; Gandin, C.A.; Henein, H.; Mullis, A.; Ilbagi, A.; Valloton, J. Dendrite growth in undercooled Al-rich Al-Ni melts measured on Earth and in Space. Phys. Rev. Mater. 2019, 3, 073402. [Google Scholar] [CrossRef] [Green Version]
  18. Fang, Y.; Galenko, P.K.; Liu, D.; Hack, K.; Rettenmayr, M.; Lippmann, S. Thermodynamic description of metastable fcc/liquid phase equilibria and solidification kinetics in Al-Cu alloys. Philos. Trans. R. Soc. Math. Phys. Eng. Sci. 2022, 380, 20200327. [Google Scholar] [CrossRef]
  19. Fang, Y.; Liu, D.; Zhu, Y.; Galenko, P.K.; Lippmann, S. Observation of Pattern Formation during Electromagnetic Levitation Using High-Speed Thermography. Crystals 2022, 12, 1691. [Google Scholar] [CrossRef]
  20. Karma, A. Phase-Field Formulation for Quantitative Modeling of Alloy Solidification. Phys. Rev. Lett. 2001, 87, 115701. [Google Scholar] [CrossRef] [Green Version]
  21. Echebarria, B.; Folch, R.; Karma, A.; Plapp, M. Quantitative phase-field model of alloy solidification. Phys. Rev. E 2004, 70, 061604. [Google Scholar] [CrossRef] [Green Version]
  22. Aziz, M.; Boettinger, W. On the transition from short-range diffusion-limited to collision-limited growth in alloy solidification. Acta Metall. Mater. 1994, 42, 527–537. [Google Scholar] [CrossRef]
  23. Aziz, M.J.; Kaplan, T. Continuous growth model for interface motion during alloy solidification. Acta Metall. 1988, 36, 2335–2347. [Google Scholar] [CrossRef]
  24. Wang, Y.; Li, K.; Li, P.; Sun, J.; Ye, L.; Dai, Y.; Tang, A.; Jiang, J.; Chen, C.; Tong, Z.; et al. Community-based comprehensive measures to prevent severe fever with thrombocytopenia syndrome, China. Int. J. Infect. Dis. 2018, 73, 63–66. [Google Scholar] [CrossRef] [PubMed] [Green Version]
  25. Nastac, L. Numerical modeling of solidification morphologies and segregation patterns in cast dendritic alloys. Acta Mater. 1999, 47, 4253–4262. [Google Scholar] [CrossRef]
  26. Nastac, L.; Stefanescu, D. Macrotransport-solidification kinetics modeling of equiaxed dendritic growth: Part II. Computation problems and validation on Inconel 718 superalloy castings. Metall. Mater. Trans. A 1996, 27, 4075–4083. [Google Scholar] [CrossRef]
  27. Knorovsky, G.A.; Cieslak, M.J.; Headley, T.J.; Romig, A.D.; Hammetter, W.F. INCONEL 718: A solidification diagram. Metall. Trans. A 1989, 20, 2149–2158. [Google Scholar] [CrossRef]
  28. DuPont, J.; Robino, C.; Marder, A. Modeling solute redistribution and microstructural development in fusion welds of Nb-bearing superalloys. Acta Mater. 1998, 46, 4781–4790. [Google Scholar] [CrossRef]
  29. Liu, X.; Hu, H.; Han, J.; Lu, Y.; Wang, C. Assessment of the diffusional mobilities in fcc Ni–Nb and fcc Ni–Mo alloys. Calphad 2012, 38, 140–145. [Google Scholar] [CrossRef]
  30. Shi, X.; Duan, S.; Yang, W.; Guo, H.; Guo, J. Solidification and Segregation Behaviors of Superalloy IN718 at a Slow Cooling Rate. Materials 2018, 11, 2398. [Google Scholar] [CrossRef] [Green Version]
  31. Jung, S.B.; Yamane, T.; Minamino, Y.; Hirao, K.; Araki, H.; Saji, S. Interdiffusion and its size effect in nickel solid solutions of Ni-Co, Ni-Cr and Ni-Ti systems. J. Mater. Sci. Lett. 1992, 11, 1333–1337. [Google Scholar] [CrossRef]
  32. Karma, A.; Rappel, W.J. Quantitative phase-field modeling of dendritic growth in two and three dimensions. Phys. Rev. E 1998, 57, 4323–4349. [Google Scholar] [CrossRef] [Green Version]
  33. Barbieri, A.; Langer, J.S. Predictions of dendritic growth rates in the linearized solvability theory. Phys. Rev. A 1989, 39, 5314–5325. [Google Scholar] [CrossRef]
  34. Samarskii, A.A.; Gulin, A.V. Stability of Difference Schemes; Nauka: Moscow, Russia, 1973. [Google Scholar]
  35. Provatas, N.; Goldenfeld, N.; Dantzig, J. Efficient Computation of Dendritic Microstructures Using Adaptive Mesh Refinement. Phys. Rev. Lett. 1998, 80, 3308–3311. [Google Scholar] [CrossRef] [Green Version]
  36. Greenwood, M.; Shampur, K.; Ofori-Opoku, N.; Pinomaa, T.; Wang, L.; Gurevich, S.; Provatas, N. Quantitative 3D phase field modelling of solidification using next-generation adaptive mesh refinement. Comput. Mater. Sci. 2018, 142, 153–171. [Google Scholar] [CrossRef]
  37. Nie, P.; Ojo, O.; Li, Z. Numerical modeling of microstructure evolution during laser additive manufacturing of a nickel-based superalloy. Acta Mater. 2014, 77, 85–95. [Google Scholar] [CrossRef]
  38. Ferreira, D.; Bezerra, B.; Collyer, M.; Garcia, A.; Ferreira, I.L. The use of computational thermodynamics for the determination of surface tension and Gibbs–Thomson coefficient of multicomponent alloys. Contin. Mech. Thermodyn. 2018, 30, 1145–1154. [Google Scholar] [CrossRef]
  39. Connétable, D.; Ter-Ovanessian, B.; Andrieu, É. Diffusion and segregation of niobium in fcc-nickel. J. Phys. Condens. Matter 2012, 24, 095010. [Google Scholar] [CrossRef]
  40. Trivedi, R.; Kurz, W. Morphological stability of a planar interface under rapid solidification conditions. Acta Metall. 1986, 34, 1663–1670. [Google Scholar] [CrossRef]
  41. Galenko, P.K.; Danilov, D.A. Linear morphological stability analysis of the solid–liquid interface in rapid solidification of a binary system. Phys. Rev. E 2004, 69, 051608. [Google Scholar] [CrossRef] [Green Version]
  42. Galenko, P.K.; Jou, D. Rapid solidification as non-ergodic phenomenon. Phys. Rep. 2019, 818, 1–70. [Google Scholar] [CrossRef]
Figure 1. Dendrite arm spacing Λ that was measured as an average distance between peaks of dendrite arms as it is shown in Figure 2c. Triangles show values that were obtained using metallographic measurements in samples processed by EML. Rounds show results of PFM modeling for three initial perturbations on the planar front evolving in the computational domain ≈ 200 μ m × 1600 μ m. Black squares show calculated mean values from the test simulation obtained on the basis of PFM modeling in the computational domain 614 μ m × 614 μ m for 1.3 and 9 perturbations at the initial planar solidification front (see Table 3).
Modelling 04 00018 g001
Figure 2. Pattern formation with undercooling Δ T = 13 K at different time steps (a)—0 ms, (b)—0.32 ms, and (c)—0.64 ms. The computational domain has a size of ≈200 μ m × 1600 μ m2. The distance Λ presents the characteristic size between dedritic arms compared with the experiment (see Figure 1).
Modelling 04 00018 g002
Figure 3. Experimentally measured and computed profiles of Nb concentration across the dendrite cells for different values of undercooling: (a) schematic illustration of the concentration profile along the dashed line drawn through the secondary dendrite arms within the final microstructure; (b) Δ T = 13 K; (c) Δ T = 35 K; (d) Δ T = 80 K. The maximum Nb-concentration belongs to the interdendritic spacing. The Minima of Nb-concentration profiles lie within the dendrite arms.
Modelling 04 00018 g003
Figure 4. Final patterns for different undercoolings (a) Δ T = 13 K; (b) Δ T = 35 K and (c) Δ T = 80 K. The computational domain has a size of ≈200 μ m × 1600 μ m.
Modelling 04 00018 g004
Figure 5. Interface velocity V for different values of undercooling measured experimentally in solidifying samples processed in the EML facility.
Modelling 04 00018 g005
Table 1. Inconel 718 composition in wt.%.
Element Ni Cr Nb Mo Ti Fe
Sample concentration53–53.0219.45.16–5.222.92–2.940.95 b a l a n c e
Used in this work 15520500 b a l a n c e
1 This choice for element concentrations is due to the fact that it makes it possible to simulate solidification in the temperature range close enough to real values.
Table 3. Microstructure evolution with undercooling Δ T = 10 K for 1, 3 and 9 seeds. Computational domain has a size of 614 μ m × 614 μ m.
Number
of Seeds
Initial StateIntermediate StateFinal State
1 seedModelling 04 00018 i001Modelling 04 00018 i002Modelling 04 00018 i003
3 seedsModelling 04 00018 i004Modelling 04 00018 i005Modelling 04 00018 i006
9 seedsModelling 04 00018 i007Modelling 04 00018 i008Modelling 04 00018 i009
Disclaimer/Publisher’s Note: The statements, opinions and data contained in all publications are solely those of the individual author(s) and contributor(s) and not of MDPI and/or the editor(s). MDPI and/or the editor(s) disclaim responsibility for any injury to people or property resulting from any ideas, methods, instructions or products referred to in the content.

