Article

Iron-Bearing Minerals in the Boda Claystone Formation: Correspondences with Stages of Evolution Revealed by Mössbauer Spectroscopy

by
Károly Lázár
1,*,
Zoltán Máthé
2,
Tibor Németh
3,4,
Viktória Kovács-Kis
4,5,
Sándor Stichleutner
1 and
Ivett Kovács
6,7
1
Laboratory for Nuclear Analysis, EKBI, HUN-REN Centre for Energy Research, Konkoly-Thege Miklós út 29-33, H-1121 Budapest, Hungary
2
Mecsekérc Environmental Ltd., Esztergár Lajos utca 19, H-7633 Pécs, Hungary
3
Department of Geology and Meteorology, University of Pécs, Ifjúság u. 6, H-7624 Pécs, Hungary
4
Department of Mineralogy, Eötvös Loránd University, Pázmány Péter Promenade 1/c, H-1117 Budapest, Hungary
5
Laboratory for Physics of Thin Layers, MFA, HUN-REN Centre for Energy Research, Konkoly-Thege Miklós út 29-33, H-1121 Budapest, Hungary
6
Institute for Geological and Geochemical Research, HUN-REN Research Centre for Astronomy and Earth Sciences, Budaőrsi út 45, H-1112 Budapest, Hungary
7
CSFK, MTA Centre of Excellence, Konkoly-Thege Miklós út 15-17, H-1121 Budapest, Hungary
*
Author to whom correspondence should be addressed.
Minerals 2024, 14(2), 196; https://doi.org/10.3390/min14020196
Submission received: 19 December 2023 / Revised: 17 January 2024 / Accepted: 9 February 2024 / Published: 14 February 2024

Abstract

:
The Boda Claystone Formation (BCF) is an extended sedimentary sequence formed in a shallow-water salt lake under semi-arid to arid climatic conditions during the middle Permian period. The rock was formed predominantly from denuded and altered products of three primary felsic sources, the Mórágy Metagranite Complex, the Baksa Metamorphic Complex and the rhyolitic Gyűrűfű Formation, resulting in the recent dominant sheet silicate components, illite and chlorite. BCF has been considered a potential host rock for high-level nuclear waste, too. Thus, it has been characterized by several powerful methods so far (X-ray diffraction (XRD), transmission electron microscopy (TEM), etc.). 57Fe Mössbauer spectroscopy may provide a unique additional tool to study iron-bearing minerals. Iron is dominantly present in a ferrous form in minerals of the fresh parent rocks (in the biotite group and amphibole), and in a ferric oxide, hematite, in altered Gyűrűfű Formation. During transformations of biotite group minerals and amphibole, the partial release of ferrous iron or its conversion to ferric form takes place with the stabilization of recent illite and chlorite, while the original layered structure is still preserved. Mössbauer spectroscopy revealed the dominant presence of ferrous iron located in cis-M2 octahedral sites both in parent biotite group minerals and in the final illite, as well as chlorite in both stages. The proportion of ferrous iron in biotite group minerals was halved during the stages of evolution by conversion to ferric iron still in sheet silicate illite or by segregation into separate hematite inclusions. The transformation process of biotite group minerals and amphibole of the source rocks is connected only to the iron-bearing smaller fraction of sheet silicates in the BCF clay mineral assemblage. Determination of Fe2+/Fe3+ ratios in sheet silicates was also pertinent in two sections of BCF. Namely, in samples from the Gorica region, Fe3+ was dominant, siting in illite, whereas Fe2+ was also present in significant portions in chlorite in samples from the Western Mecsek Anticline. The interpretation is deduced in correspondence with results of extended XRD, and high-resolution TEM studies.

1. Introduction

1.1. General Overview

BCF has been thoroughly characterized and evaluated in several research programs since 1990 due to its potential application as a host rock for the deposition of high-level nuclear waste (HLW) and received an advantageous qualification in comparison with other similar European clayey prospective host rocks [1,2,3]. Besides conventional techniques, the application of sophisticated methods is also in progress recently, e.g., tectonic features and fracture geometries are analyzed using convolutional neural network analysis [4]. 57Fe Mössbauer spectroscopy has been also used among the assessing techniques for clarifying particular issues [5].
The method is a unique tool for analyzing iron since direct information can be obtained on the electron density (oxidation state) and the symmetry of ligands around the atomic nucleus, from the parameters of isomer shift (δ), and quadrupole splitting (Δ), respectively. In particular, the ferrous (Fe2+) and ferric (Fe3+) states can clearly be distinguished in most cases. The technique has been used extensively for analyzing clay minerals as well [6], and even a special volume of the Hyperfine Interactions journal was devoted to related studies (e.g. [7,8]). In the clay fraction (grain size < 2 μm), iron is accommodated dominantly in sheet silicates (illite, chlorite, smectite, vermiculite, montmorillonite, etc.) and in oxides and oxyhydroxides (hematite, goethite, etc.). The primary structural units in each of these sheet silicates are the tetrahedral–octahedral–tetrahedral (T-O-T) sheets. Interlayer cations may vary, or further additional layers can be found between them (e.g. octahedral layers, forming T-O-T-O structure in chlorite) resulting in changes in distances between the primary sheets. Both forms of iron prefer the octahedral siting in them. In sheet silicates, the dioctahedral and trioctahedral sheets are also distinguished depending on the valency of ions in the octahedral sites. Further, -OH groups take also part in the charge neutralization, cis- and trans-symmetries can be distinguished depending on their mutual symmetry [9]. The distinction between dioctahedral/trioctahedral variants and cis-/trans- OH symmetries with Mössbauer spectroscopy is rather cumbersome [10,11]. Depending on the particular structure and conditions of the formation of sheet silicates, the Fe3+/(Fe2+ + Fe3+) partitioning may significantly vary in them [12].
With respect to the Mössbauer active element, iron, there is a consensus that its primary sources are the magmatic and metamorphic biotite group sheet silicate minerals and the chain silicate amphibole. From the point of view of our subject, the emphasis is on the ferrous iron content in them; thus, hereinafter, the biotite group minerals will be referred to in general. Rock types of BCF source rocks (the Mórágy Metagranite Complex, the Baksa Metamorphic Complex and the Gyűrűfű Formation) contain these minerals in various amounts [13,14,15,16,17,18,19]. Feldspar, the other primary component, usually does not contain appreciable amounts of iron. If iron is exceptionally present in feldspar, iron(III) replaces aluminum in tetrahedral sites [20].
The formation and alterations of clay minerals have been studied extensively and are discussed in detail in textbooks [21]. In particular, the fate of iron and transformations of the related minerals in clays have been described in various conference reports as well [22].
With iron in the foreground, redox changes can be sensitively followed up. The T-O-T silicate sheets are rather stable during transformations, the interlayer ions between them may be exchanged and these processes can occasionally be related to Fe2+/Fe3+ redox changes in octahedral sites. Illite is one of the transformed sheet silicates among the present constituents of BCF. This mineral does not have a strict stoichiometric composition, so it may accommodate iron both in ferric and ferrous form together with other di- or three-valent cations in certain concentration intervals [9]. Hereinafter, the illite term is used to describe micaceous phases of the clay-sized, <2 μm fraction of BCF containing authigenic illite–smectite and illite–muscovite.
The aim of the present communication is to provide unique insight with the tool of the Mössbauer technique by examining the redox processes of iron with a particular focus on transformations in sheet silicates, and on the fate of iron in more general. The studies are complemented with X-ray diffraction (XRD), high-resolution transmission electron microscopy (HRTEM), and X-ray fluorescence (XRF) elemental analyses in comparison of the iron-bearing minerals of the parent original rocks (the Mórágy Metagranite Complex, the Baksa Metamorphic Complex, and the Gyűrűfű Formation) with those collected from BCF.

1.2. Geological Background

The Middle Permian Boda Claystone Formation is located in the Western Mecsek Mountains, southern Transdanubia, SW Hungary (Figure 1A). The Mecsek Mts. is part of the Tisza Megaunit comprising the basement of the south-eastern half of the Pannonian Basin. In the area of the Western Mecsek, the crystalline basement is mainly built up by the Variscan granitoids of the Mórágy Metagranite Complex and the Baksa Metamorphic Complex [15,18,19,23]. The continental sedimentation in the Western Mecsek Mts. began in the Early Permian and lasted until the Lower Triassic. At the end of the Lower Permian, the deposition of continental siliciclastic sediments was interrupted by an intense acidic magmatic activity, embodied in the Gyűrűfű Formation. The BCF is part of this 2000–4000 m thick siliciclastic sequence (continental red beds). The BCF is known in an area of 150 km2, with a 15 km2 outcrop (Figure 1B). Two sections of BCF are known, namely the (i) perianticlinal structure of the W Mecsek Mountains (WMA), and the (ii) so-called Gorica Block. The outcrop of BCF is not known in the Gorica Block; several deep drillings reached the BCF, but only the borehole Ib-4 recovered the sequence of BCF in significant thickness (between 494.2 and 709 m). On the basis of the deep drillings total thickness of BCF is estimated to be about 700–900 m (in WMA), whereas its thickness is smaller in the Gorica Block (about 350 m). The corresponding vertical stratigraphy cross sections are reported in [24,25].
The sediments of the BCF are dominantly red and reddish brown in color (Figure 2a). The BCF was deposited in a shallow-water salt lake environment surrounded by dry to saline mudflat, under semi-arid to arid climatic conditions [26,27]. The main rock-forming minerals of the BCF in WMA are clay minerals (absolute dominant are illite–muscovite and chlorite, whereas smectite, kaolinite, vermiculite and mixed-layer clay minerals were identified in minor amounts), authigenic albite, detrital quartz, carbonate minerals (calcite and dolomite) and hematite. In addition, barite, anhydrite, authigenic K-feldspar and detrital constituents were also identified in trace amounts. Micas (muscovite and biotite minerals) are dominant among the detrital components, and their quantity increases in the interlayering of thin sandstone and siltstone layers (Figure 2b). The authigenic albite is present as albite cement (typical of all rock types of formation), albite-, K-feldspar- and carbonate-lined disseminated white voids (typical of albitic claystone). The BCF recovered from borehole Ib-4 (Gorica Block) contains abundant analcime in addition to the above minerals [3,24,28]. Similarly to authigenic albite, analcime is present as analcime cement and pore filling. The illite and chlorite crystallinities (Kübler- and Árkai indices, respectively), as well as vitrinite reflectance values determined in the area of WMA, indicate late or deep diagenesis, with a maximum temperature of 200–250 °C [1,25]. Higher Kübler and Árkai index values were determined in core samples of the deep drilling Ib-4 (Gorica Block), suggesting that BCF in the Gorica Block was exposed to lower-grade diagenesis [24]. The relatively felsic provenance of BCF is derived from a large number of petrological and geochemical studies performed on the Mórágy Metagranite Complex, the Gyűrűfű Formation, and the Baksa Metamorphic Complex [17,23].

2. Materials and Methods

2.1. Samples

Samples were collected from deep BCF boreholes of BAF-2, BAF-3A (WMA), and Ib-4 (Gorica Block) and the weathered rhyolitic Gyűrűfű Formation (9018) (see the sampling locations in Figure 1B). Representative rock samples from the Mórágy Metagranite Complex (ÜH-27 and BEK-8 deep boreholes) and the Baksa Metamorphic Complex (PG-1 deep borehole) were also studied (outside of the region shown in the map in Figure 1B.)

2.2. Methods

X-ray fluorescence was used for elemental analysis. Two instruments were used. Samples from starting granitic and rhyolitic rocks were analyzed with an Innov X Delta Premium-type device (Olympus Innov-X, Woburn, MA, USA). The power of its X-ray tube is 4 W, and the anode material is Rh. The device is equipped with a Peltier-cooled silicon drift detector. Soil and Mining Plus Factory calibrations were used to identify the components. Elements with Z ≤ 12 (Na, C) fall outside of the detection range for this instrument. BAF samples were analyzed with ARL 8410 wavelength dispersive equipment using flow-through proportional and scintillation detectors at the lower and the higher energy ranges, respectively.The measurements were performed at the Spectroscopy Laboratory for Material Testing, DUNAFERR Co. (Dunaújváros, Hungary), for further details see [24]. The weight loss of samples was also measured upon heating to 1050 °C, and the amount of evolved CO2 was also determined [24].
57Fe Mössbauer measurements were performed in constant acceleration mode on a modular KFKI spectrometer (KFKI/EFO, Budapest, Hungary) equipped with a 1 GBq activity 57Co/Rh source. Spectra were recorded in 1000 channels and were folded afterward. Isomer shift values are related to the spectrum center of metallic α-iron with typical line widths of 0.24 mm s−1 at room temperature. The accuracy of the positional parameters (isomer shift, δ, and quadrupole splitting, Δ) is ca. ±0.03 mm s−1. Spectra were evaluated using the SIRIUS [29] and MossWinn [30] codes and none of the positional parameters were constrained in the fittings. The quality of decompositions was assessed with the relative χ2 values, reasonable fits with the lowest χ2 values were selected. The highest relative χ2 for all the presented and discussed spectra in each case is below 1.35.
X-ray diffraction (XRD) measurements were performed on a RIGAKU Miniflex (Rigaku Corporation, Tokyo, Japan) 600 equipment at 45 kV voltage and 35 mA current applying a graphite monochromator with CuKα radiation. The quantitative analyses were carried out with full profile fitting combined with Rietveld refinement using SiroQuant V4.0 software.
High-resolution electron microscopy (HRTEM) measurements were performed on the Gorica samples with a Philips CM20 (Philips, Amsterdam, the Netherlands) apparatus used at 200 kV accelerating voltage and equipped with a Noran Energy Dispersive System (EDS). WMA samples were studied with FEI-Themis 200 G3 equipment operating at 200 kV accelerating voltage with correction of spherical aberration (Schottky FEG, with 0.8 Å resolution in HRTEM) and with FEI Super-X EDS detection system (Thermo Fischer Scientific, Waltham, MA, USA). Velox software (version 3.3, FEI Eindhoven, The Netherlands was used for recording and subsequent evaluation of the images. The TEM-EDS analyses were carried out on regions with 80–100 nm diameter.

3. Results

3.1. Chemical Compositions

Chemical compositions for all studied samples are compiled into a single summarizing table (Table 1). Iron contents of samples scatter in 1.8–9 wt% range (expressed as ferric oxide, Fe2O3tot). Compositions with all the other main elements (except O, C, H) are also shown in Table 1. The primary water content of samples is very low (<1%). The weight loss during heating to 1050 °C comes only in small part from the decomposition of carbonates (mostly calcite), the greater part originates from the conversion of hydroxyl groups in minerals to oxides.
As a first inspection, it is worth taking a rough comparison of the iron content of the three groups. The iron content in the fresh granitic samples is around 3–5 wt% Fe2O3tot, in correspondence with values found for granites of the whole Mórágy Formation [13]. The iron content of rhyolite samples is significantly lower, namely 3 wt% Fe2O3tot is an upper limit similar to the values obtained on several other samples collected from this formation [16]. In contrast, the iron content of the BCF samples exceeds 2–3 times the values mentioned before, i.e., a definite accumulation process of iron can be deduced for BCF.

3.2. Samples Characterizing the Precursor (Granitic, Rhyolitic and Metamorphic) Parent States

Rock samples originating from the Mórágy Metagranite Complex (ÜH-27 and BEK-8 deep boreholes), the Baksa Metamorphic Complex (PG-1 deep borehole) and the Gyűrűfű Formation (9018 and BAF-4 deep boreholes) were studied using the methods of XRD and Mössbauer spectroscopy.

3.2.1. XRD Measurements

XRD diffractograms collected on the listed samples of starting rock types are shown in Figure 3, and mineral compositions deduced from refined analyses of patterns are compiled in Table 2.
Biotite group minerals cannot be distinguished in the diffractograms, and their contribution is included in the peak of mica group minerals. However, the presence of biotite minerals in various amounts can be clearly identified in thin sections of fresh or partly transformed Bek-8, PGI-1, 9018 and BAF-4 samples with optical microscopy.
The few data shown for the granite samples in Table 2 coincide well with results obtained on a large number of samples collected from the entire extent of the Mórágy Granite [14,15]. Among iron-containing minerals, biotitic ones and amphibole were far more dominant, and the presence of chlorite was also detected. MgO/(MgO + FeO + MnO) ratios were determined with electron microprobe analyses in more than a hundred biotitic samples of Mórágy Metagranite, and the obtained mean value is c.a. 0.4, i.e., this group of minerals contains iron really in large amounts. The presence of montmorillonite was negligible, and illite and hematite could not be detected at all in the unaltered rock types [15].

3.2.2. Mössbauer Measurements

Mössbauer spectra recorded on granitic, metamorphic and rhyolitic rock samples are presented in Figure 4, and the corresponding extracted data are compiled in Table 3.
Two important observations are obvious already from the first inspection. Firstly, iron is dominantly present in a two-valent ferrous state (approaching and exceeding 2/3 part) in fresh granitic and metamorphic samples. The dominant part of the ferrous iron originated from a doublet and is characterized by the δ ≈ 1.1 mm s−1 and Δ ≈ 2.6 mm s−1 pair of data.
Secondly, hematite is apparently absent in the upper three spectra. In contrast, the presence of hematite dominates the two bottom spectra of rhyolitic samples, considering the wide velocity range which can include the full spectrum of hematite (~ ±10 mm s−1). This observation is in sharp contrast with the XRD patterns in which the presence of hematite is not revealed at all (Figure 3).
To resolve this contradiction in the first approach the different mass fractions of iron in sheet silicates and in hematite should be compared. The mass fraction of iron in a chlorite mineral with a 1:1 Mg to Fe ratio is 0.26 whereas in Fe2O3, hematite, is 0.67. Further, the densities of these minerals are also different, hematite is c.a. two times more dense than chlorite. Consequently, if we compare the sensitivities of XRD and Mössbauer method for a sample containing hematite and chlorite phases in the same volume, the sensitivity for hematite 5–8 times will exceed that for chlorite. Other factors, e.g., differences in probabilities of the Mössbauer effect (f-factors) in hematite compared to chlorite may also enhance the sensitivity for hematite. In summary, an expressed hematite sextet in a Mössbauer spectrum may be confronted with hardly detectable related peaks in the XRD diffractogram.
Assessment of spectra of BAF-4 and 9018 samples originating from the volcanic Gyűrűfű Rhyolite Formation shows strong weathering and removal of iron from micas resulting in the dominant occurrence of iron in hematite. Only 10–12% of iron was able to retain its original ferrous state.

3.3. BCF Samples

3.3.1. Samples from Gorica Block (Ib-4)

The estimated thickness of BCF in the Gorica Block is only c.a. 350 m, expanding in the 494.2–708.9 m depth range in the particular location of the Ib-4 borehole. A complex SEM and synchrotron XRD mineral phase analysis of the Ib-4 (570 m) sample is presented in [3].
A spatial microtomographic image was also recorded for hematite in this sample (Figure 5a). Note the fine grainy morphology of homogeneously dispersed hematite inclusions. The corresponding Mössbauer spectrum is shown in Figure 5b. The largest part of iron is present in hematite, displaying two sextet subspectra with 50.9 and 49.6 Tesla internal magnetic field (MHF) with 33.2% and 28.6% relative contributions. The connected δ and Δ pairs of values are the same within the experimental error (0.37 and −0.20 mm s−1). One third of iron exhibits a Fe3+ doublet with δ = 0.30 mm s−1 and Δ = 0.64 mm s−1 parameters. Fe2+ can only be distinguished from the appearance of a small shoulder (δ = 1.32 mm s−1, Δ = 2.22 mm s−1, 5.2% intensity). The feature that, besides the nominal 51 Tesla internal magnetic hyperfine field of hematite, another component with a lower MHF value (47–50 T) also appears, is characteristic of all BCF samples. This can be attributed to the inclusion of a certain amount of titanium and aluminum into the corundum structure of iron oxide [31].

HRTEM Studies

An Ib-4 (578 m) sample was also characterized with HRTEM. The presence of lamellar small crystals with 10 Å layer distance (black arrows) and hexagonal hematite particles (white arrow) was detected (Figure 6a). The 10 Å layer distance was confirmed with the SAED image (Figure 6a, inset).
TEM images of specimens prepared perpendicular to the T-O-T layer stacking from the same borehole Ib-4 at 510 m depth allow the identification of the textural relationship between illite and hematite [28]. According to Figure 6b, thin flakes of hematite appear in between illite layers.
Some illite particles were analyzed with EDS (marked with black arrows in Figure 6a) and dominance of dioctahedral layers with an average composition of low iron content was found, e.g., K0.11Na0.07Ca0.01(Al1.59Mg0.26Fe0.16)(Si3.95Al0.05)O10(OH)2. The dioctahedral–trioctahedral distribution may vary, the iron content can even be doubled, e.g., K0.18Ca0.04(Mg1.3Al0.37Fe0.34)(Si2.94Al1.06)O10(OH)2.

XRD Measurements

An extended XRD analysis was performed on samples to reveal the mineral composition across practically the whole borecore. There is a certain scatter in the components (Table 4). Presence of illite is overwhelming among the layered silicate phases. Hematite is also present in significant amounts.

Series of Mössbauer Spectra

The iron content in layered silicates is low, -Fe-O-Fe-O- chains are not present in them, thus characteristic doublets for ferric and ferrous iron sites appear. In contrast, in hematite these chains are present, and the magnetic sextet appears. The size of most hematite particles is in the range of microns (see Figure 5a); thus, they do not exhibit superparamagnetic behavior, which could eventually interfere with the central doublets originating from layered silicates.
Mössbauer spectra were recorded in two velocity ranges in several cases. In the larger (±12 mm s−1) range all six lines of hematite appear; however, the resolution for studying the doublets in the central region is modest. The resolution for analyzing the doublets can be improved by using a smaller velocity range (e.g., ±4 mm s−1) with the simultaneous exclusion of the outer four peaks of a sextet of hematite. In this instance, the amount of hematite can still be estimated from the intensity of the central two peaks of the sextet, which appears as a doublet with apparent parameters of δ ≈ 0.5 mm s−1 and Δ ≈ 2.55 mm s−1 considering the nominal 3:2:1:1:2:3 rule for intensities of lines in the sextet.
A few typical Mössbauer spectra recorded on samples of Ib-4 borecore are presented in Figure 7, and data extracted from fittings of seven spectra are collected in Table 5.
Ferric ions are far more predominant in sheet silicates in comparison to ferrous ones in each sample, and the contribution of the latter component does not exceed ca. 10% relative intensity.
The dominant presence of hematite is also apparent in almost all the samples. Significantly less iron is present in the sample collected from the deepest region, from 708 m (Table 1). It appears mostly as hematite sheet silicates are present only in traces (Figure 7 left, bottom, similarly as shown in the spectrum of the rhyolitic 9018 sample at the bottom of Figure 4). Thus, it shows that iron in hematite spreads over more distant regions than iron in sheet silicates.

3.3.2. Samples from Western Anticline (WMA)

The thickness of BCF in the western anticline part exceeds c.a. three times that of the strata in the Gorica Block, it reaches c.a. 1000 m. Samples were obtained from different boreholes. The longest one is BAF-2 spanning over more than 900 m (only 9.1 m thin Quaternary sediments cover the BCF in this deep borehole). Samples from an even deeper region were collected from the BAF-3A borecore.

Mössbauer Measurements

A few selected spectra obtained on BAF-2 samples recorded in the ±4 and ±12 mm s−1 velocity ranges are presented in Figure 8.
It is apparent from the first visual inspection that iron is present mostly in ferrous form in sheet silicates with the accompanying presence of hematite to various extents. Data from decompositions of spectra are collected in Table 6.
The overwhelming contribution of Fe2+ in the spectra is manifested by the doublet characterized with the permanent δ = 1.1 mm s−1, Δ= 2.65 mm s−1 pair of data (with 27–40% relative intensity). The parameters of the other Fe2+ doublet are varying and its contribution never exceeds 10%.
At the end of this part, a further point should also be mentioned with regard to Mössbauer measurements. Namely, the determination of the Fe2+/Fe3+ relative proportions extracted from room temperature Mössbauer spectra plays an important role. However, these proportions are apparent, they do not strictly correspond to the absolute Fe2+/Fe3+ ratios, since the probabilities of the Mössbauer effect (f-factors) for Fe2+ and Fe3+ ions may differ to a certain extent depending on the local structure of ions in minerals. In general, the value of the f-factor for Fe3+ may exceed that for Fe2+ with 10–15% in various minerals [33]. For determination of the accurate Fe2+ and Fe3+ ratios measurements in dependence of temperature should be performed [34]. To obtain an approximate influence on this effect in our systems ±12 mm s−1 spectra of BAF-3A (998 m) recorded at 77 K and 300 K were compared. The results of the comparison are summarized in the following short Table 7.
It is seen that the change in the relative proportions of components is uppermost 1.6% upon the change of temperature of measurement. This value is rather small; thus, the temperature dependence of the f-factors will be neglected in the following discussion. Further, the comparison of 77 K and 300 K spectra attests also that the superparamagnetism has not been observed on hematite particles since the change of relative intensities of Fe3+ components is within the mentioned 1.6%. In other words, the size for the overwhelming part of hematite particles exceeds the ca. 8 nm size threshold, below which superparamagnetism can take place. (This is in agreement with Figure 5a, in which the size of most hematite particles certainly exceeds 1 micron.)

X-ray Diffraction

Series of BAF-2 and BAF-3A samples were also analyzed with XRD, the results of refined analyses are presented in Table 8 and Table 9. For illustration, every second diffractograms collected on the BAF-3A series are also shown in Figure 9.
Remarkable differences can be observed in comparison with Ib-4 samples (Table 4) since a significant amount of chlorite is present in the BAF-2 and BAF-3A series.

HRTEM

Characteristic HRTEM images obtained on the 998 m and 1252 m samples of the BAF-3A borecore are shown in Figure 10. For the 998 m sample intergrowth of illite (10 Å) and chlorite (14 Å) platelets are identified on the top left side, and the plain illitic part is shown on the top right. For the 1252 m sample presence of hematite and illite particles is represented in a smaller magnification on the bottom left and the coexistence of illite and chlorite can be revealed from the bottom right image.
EDS analysis of components can also be performed on different regions. In correspondence, in the knowledge of the structure of the analyzed region (T-O-T, illitic, 10 Å, or T-O-T-O, chloritic, 14 Å), approximate chemical composition can be calculated (shown in Table 10).
In these formulas, the presence of ferrous iron is presumed for chlorite, and ferric iron for illite. However, the combination of interlayer H3O+ and ferrous iron in octahedral positions cannot be excluded to a limited extent for illite. It is also seen that the relative amount of iron in chlorite exceeds 5–8 times the iron content in illite in [(Al,Si)4O10] structural units.

4. Discussion

4.1. Processes Taking Place in Iron-Bearing Minerals during Formation of BCF

From the aspect of iron one of the principal net processes of diagenesis is the conversion of biotite group minerals and amphibole through a few intermediate stages finally to illite (and in part to chlorite). In the starting micas illite is not present at all, whereas chlorite may occur already. The other parallel main process is the formation and segregation of hematite during the alterations resulting in the addition of this mineral in the largest amount to the part that was present already in the weathered starting rhyolite.
The parent biotite group minerals belong to the more broad mica class with a general T-O-T-c structure (tetrahedral–octahedral–tetrahedral sheets with “c” charge compensating cations, and iron occurs only in ferrous form in octahedral siting [35]. The iron-containing phyllosilicates of BCF in the final stage are identified mainly as illite and chlorite from XRD and HRTEM analyses. The precursor aluminosilicate structure is preserved in illite, characterized by the (K,H3O)(Al,Mg,Fe)2(Si,Al)4O10(OH)2 chemical formula [36,37]. However, an important difference is that the inclusion of three-valent ions (aluminum and ferric iron) is also allowed in octahedral sites in illite. Thus, iron and magnesium may be released in the biotite mineral => … => illite gross conversion process from the octahedral sites of biotite minerals in an amount corresponding to the excess charge provided by incorporation of the three valent aluminum and ferric iron ions in replacement of previous ferrous ones in the octahedral sheets. If the released cation is iron, iron oxyhydroxide or at higher temperatures (above ≈ 150 °C) hematite is formed in the presence of potassium-containing feldspar, as described in detail in Section 4.2 in [21]. Further, amphibole can also be transformed into illite [21]. The third sheet silicate actor, chlorite has a T-O-T-O structure with corresponding (Mg,Fe)3(Si,Al)4O10(OH)2 ∙ (Mg,Fe)3(OH)6 stoichiometry. Similarly to illite, the triple T-O-T layer has an overall negative charge which, in the case of this mineral, is compensated with the positively charged second octahedral layer with (Mg,Fe)3(OH)6 composition [38]. Due to this, stoichiometry chlorite may also contain ferric iron, but usually to a lesser extent than is characteristic of illite. There are intermediate stages during the transformations, first probably swelling sheet silicates (smectite) form, then the charge compensating cations are replaced and more compact illite and chlorite are formed [39]. Even microbially induced smectite to illite transformation can also take place at temperatures below 80 °C [40]. It is worth repeating here that a significant amount of smectite and illite can be formed from the original glass and feldspar of rhyolite, besides the discussed transformations of biotite group minerals. Description of various further aspects of clay formation is discussed in detail in [21].
As for the other main iron-bearing mineral, hematite, its presence probably originates at least from three sources. Hematite as a weathering product can already be present, originating from the starting rhyolite, granite and metamorphic rocks. Further, if the iron-containing chain silicate (e.g., amphibole) is partly decomposed, the released Fe2+ ions may migrate in the aqueous phase rather far under reducing conditions, since Fe2+ ions hydrolyze and precipitate between pH values 5 and 6. In a later stage, upon reverting to oxidation conditions at the playa lake the converted Fe3+ ions immediately form hydroxide precipitate (since the threshold for hydrolysis for ferric iron is very low, pH > 2). The third source of the hematite is direct formation during illitization, as mentioned above [
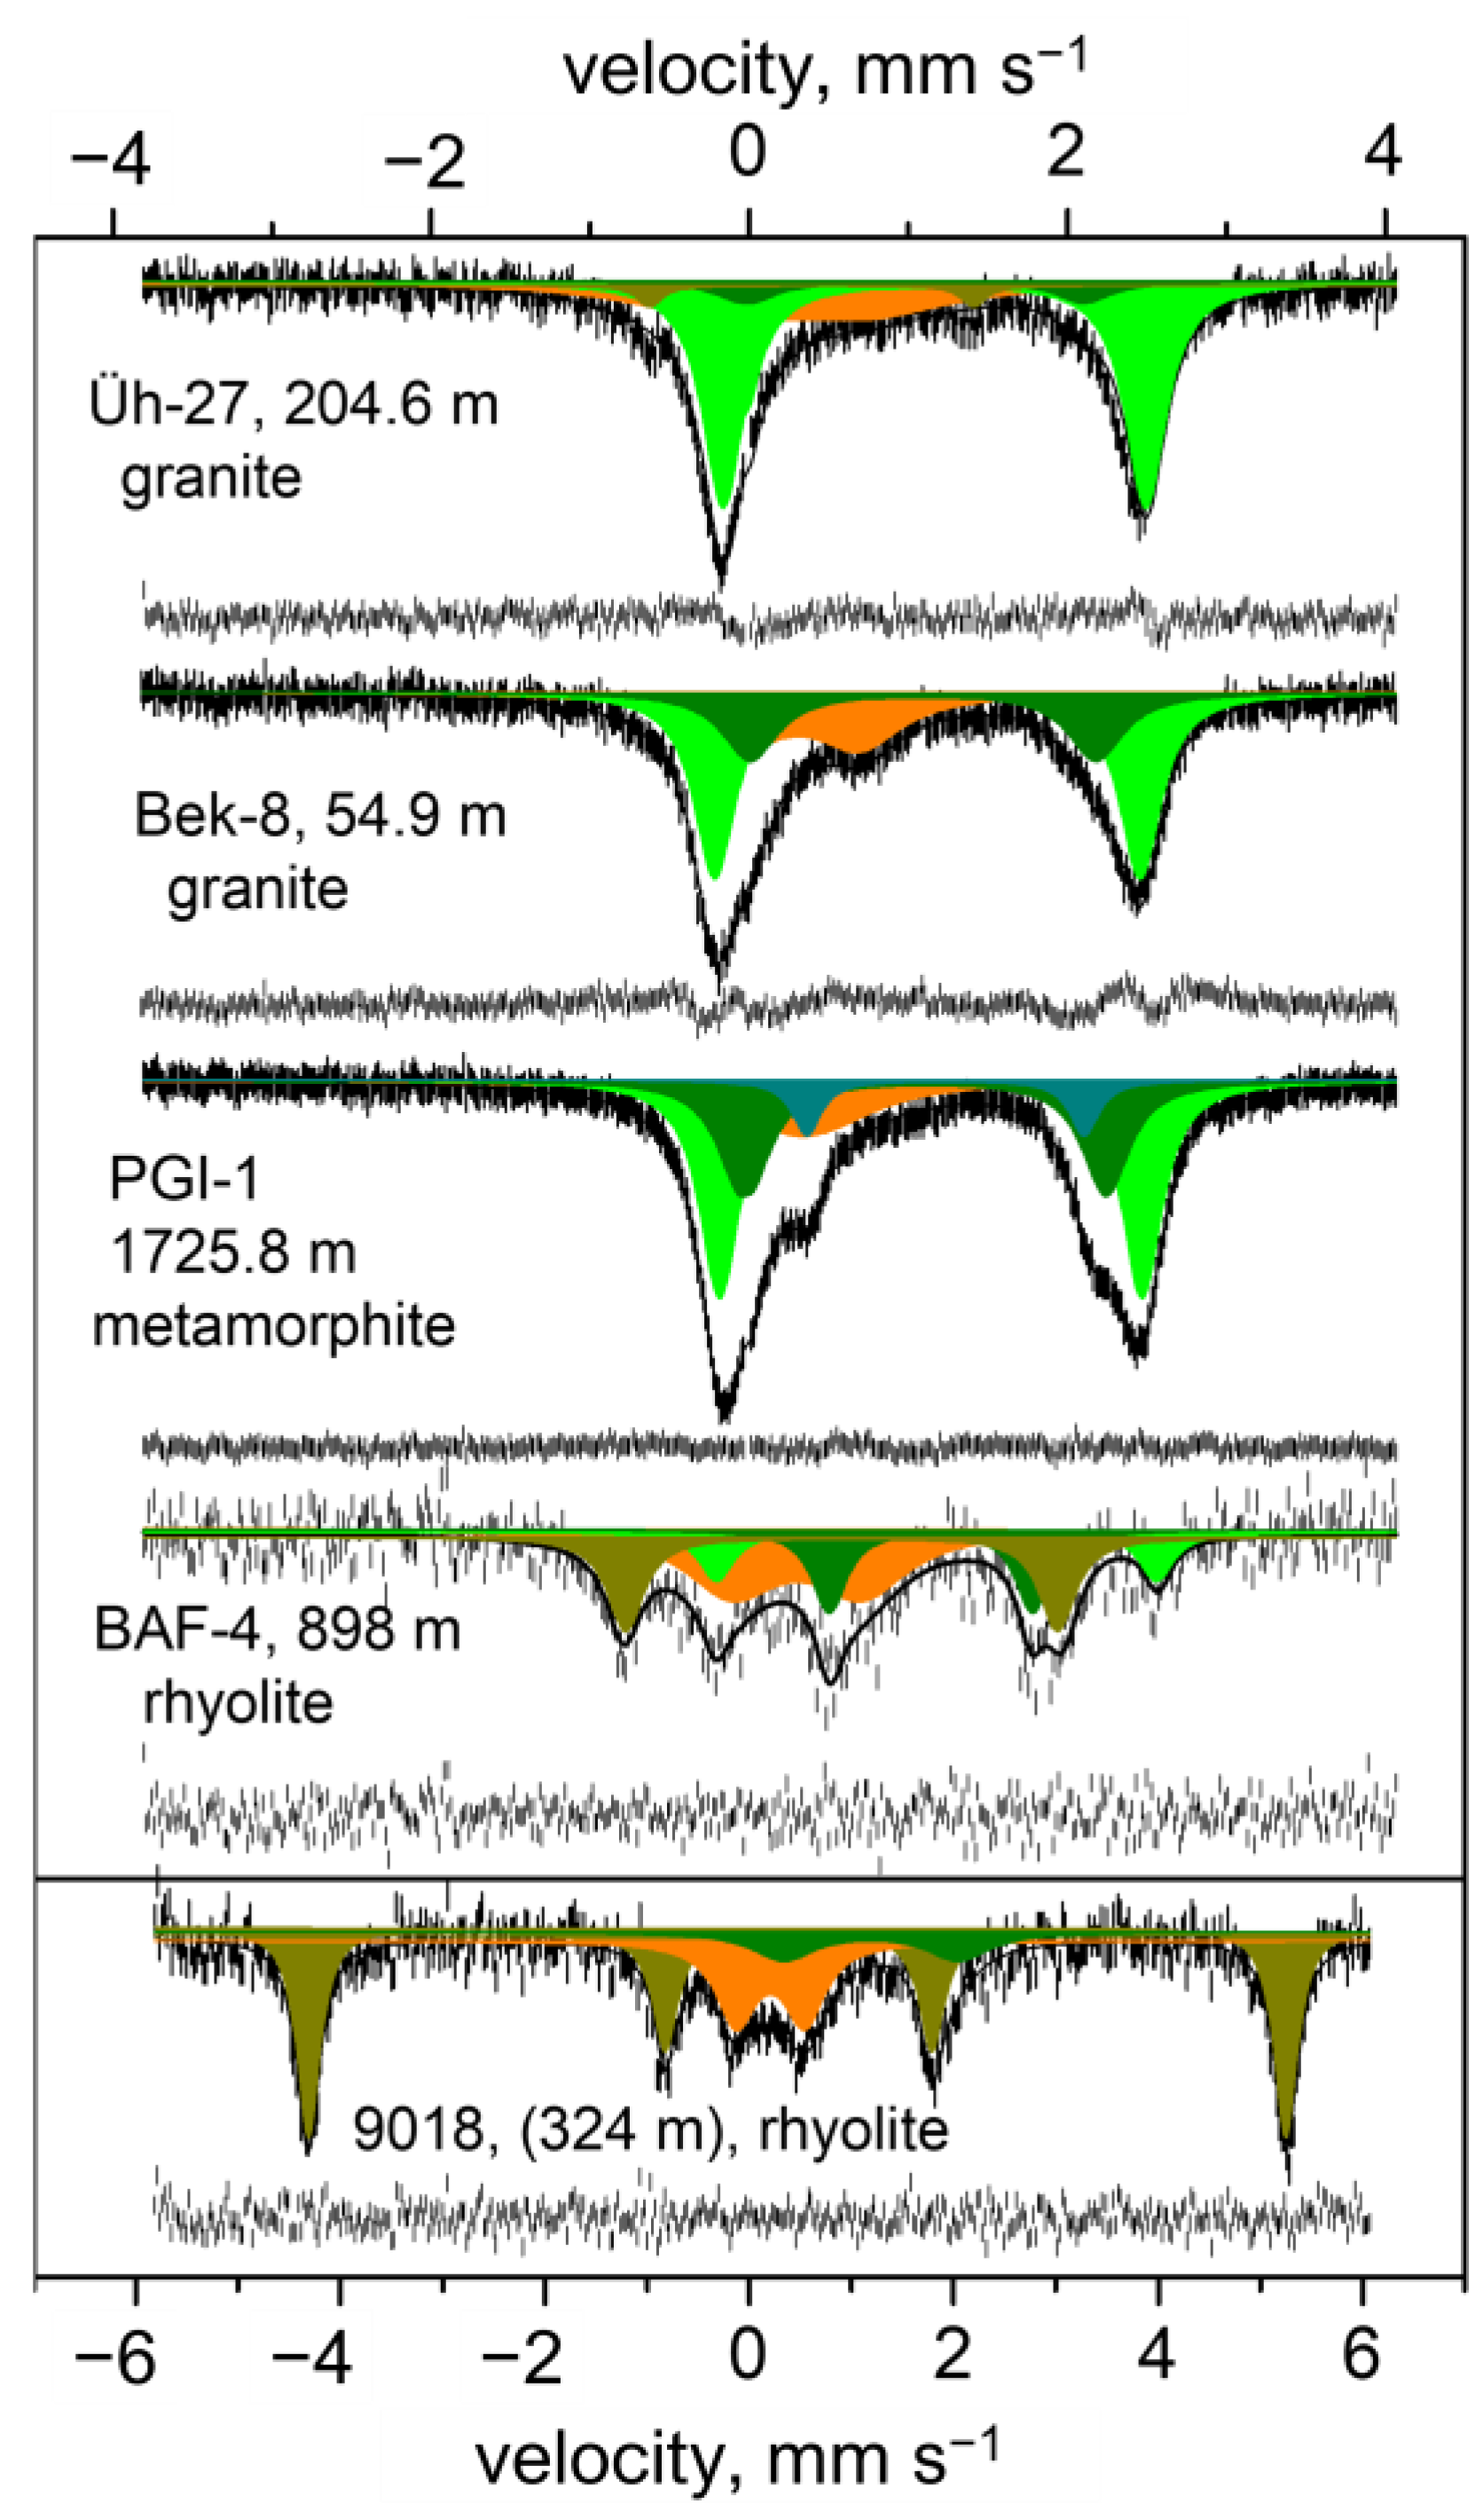
21]. The processes described above are also reflected in Mössbauer spectra.
The precursor state is characterized by the dominant presence of ferrous iron as shown in spectra of Üh-27 (204.6 m) and Bek-8 (54.9 m) in samples originating from the fresh Mórágy Metagranite in Figure 3. The overwhelming part of ferrous iron in these samples is characterized by a doublet described with δ ≈ 1.1 mm s−1 and Δ ≈ 2.6 mm s−1 pair of data. This pair of data coincides well with parameters for the cis-M2 sites (where the charge compensating –OH groups occupy cis conformation in the octahedral sheet). The presence of this doublet is dominant and permanent over several biotite samples. The other iron site with trans–OH arrangement is less expressed and the Δ parameter varies in between the 1.9–2.6 mm s−1 range [41]. The other possible starting iron-bearing mineral in granite is amphibole. The doublet characterized with the δ ≈ 1.1 mm s−1 and Δ ≈ 2.6 mm s−1 pair of data is present in the spectrum of amphibole with the simultaneous presence of another doublet in roughly the same intensity with Δ ≈ 2.9 mm s−1 [42]. This latter doublet is missing from our spectra, thus amphibole is probably a minor constituent in the examined starting Mórágy Metagranite, i.e., biotite minerals are the primary iron sources. The other starting iron-bearing rock can be the rhyolite. Its contribution to iron-bearing phyllosilicates is probably negligible since the total iron content is only c.a. one fifth that of the fresh granite and iron is mainly in the form of stable hematite which probably remains unaltered.
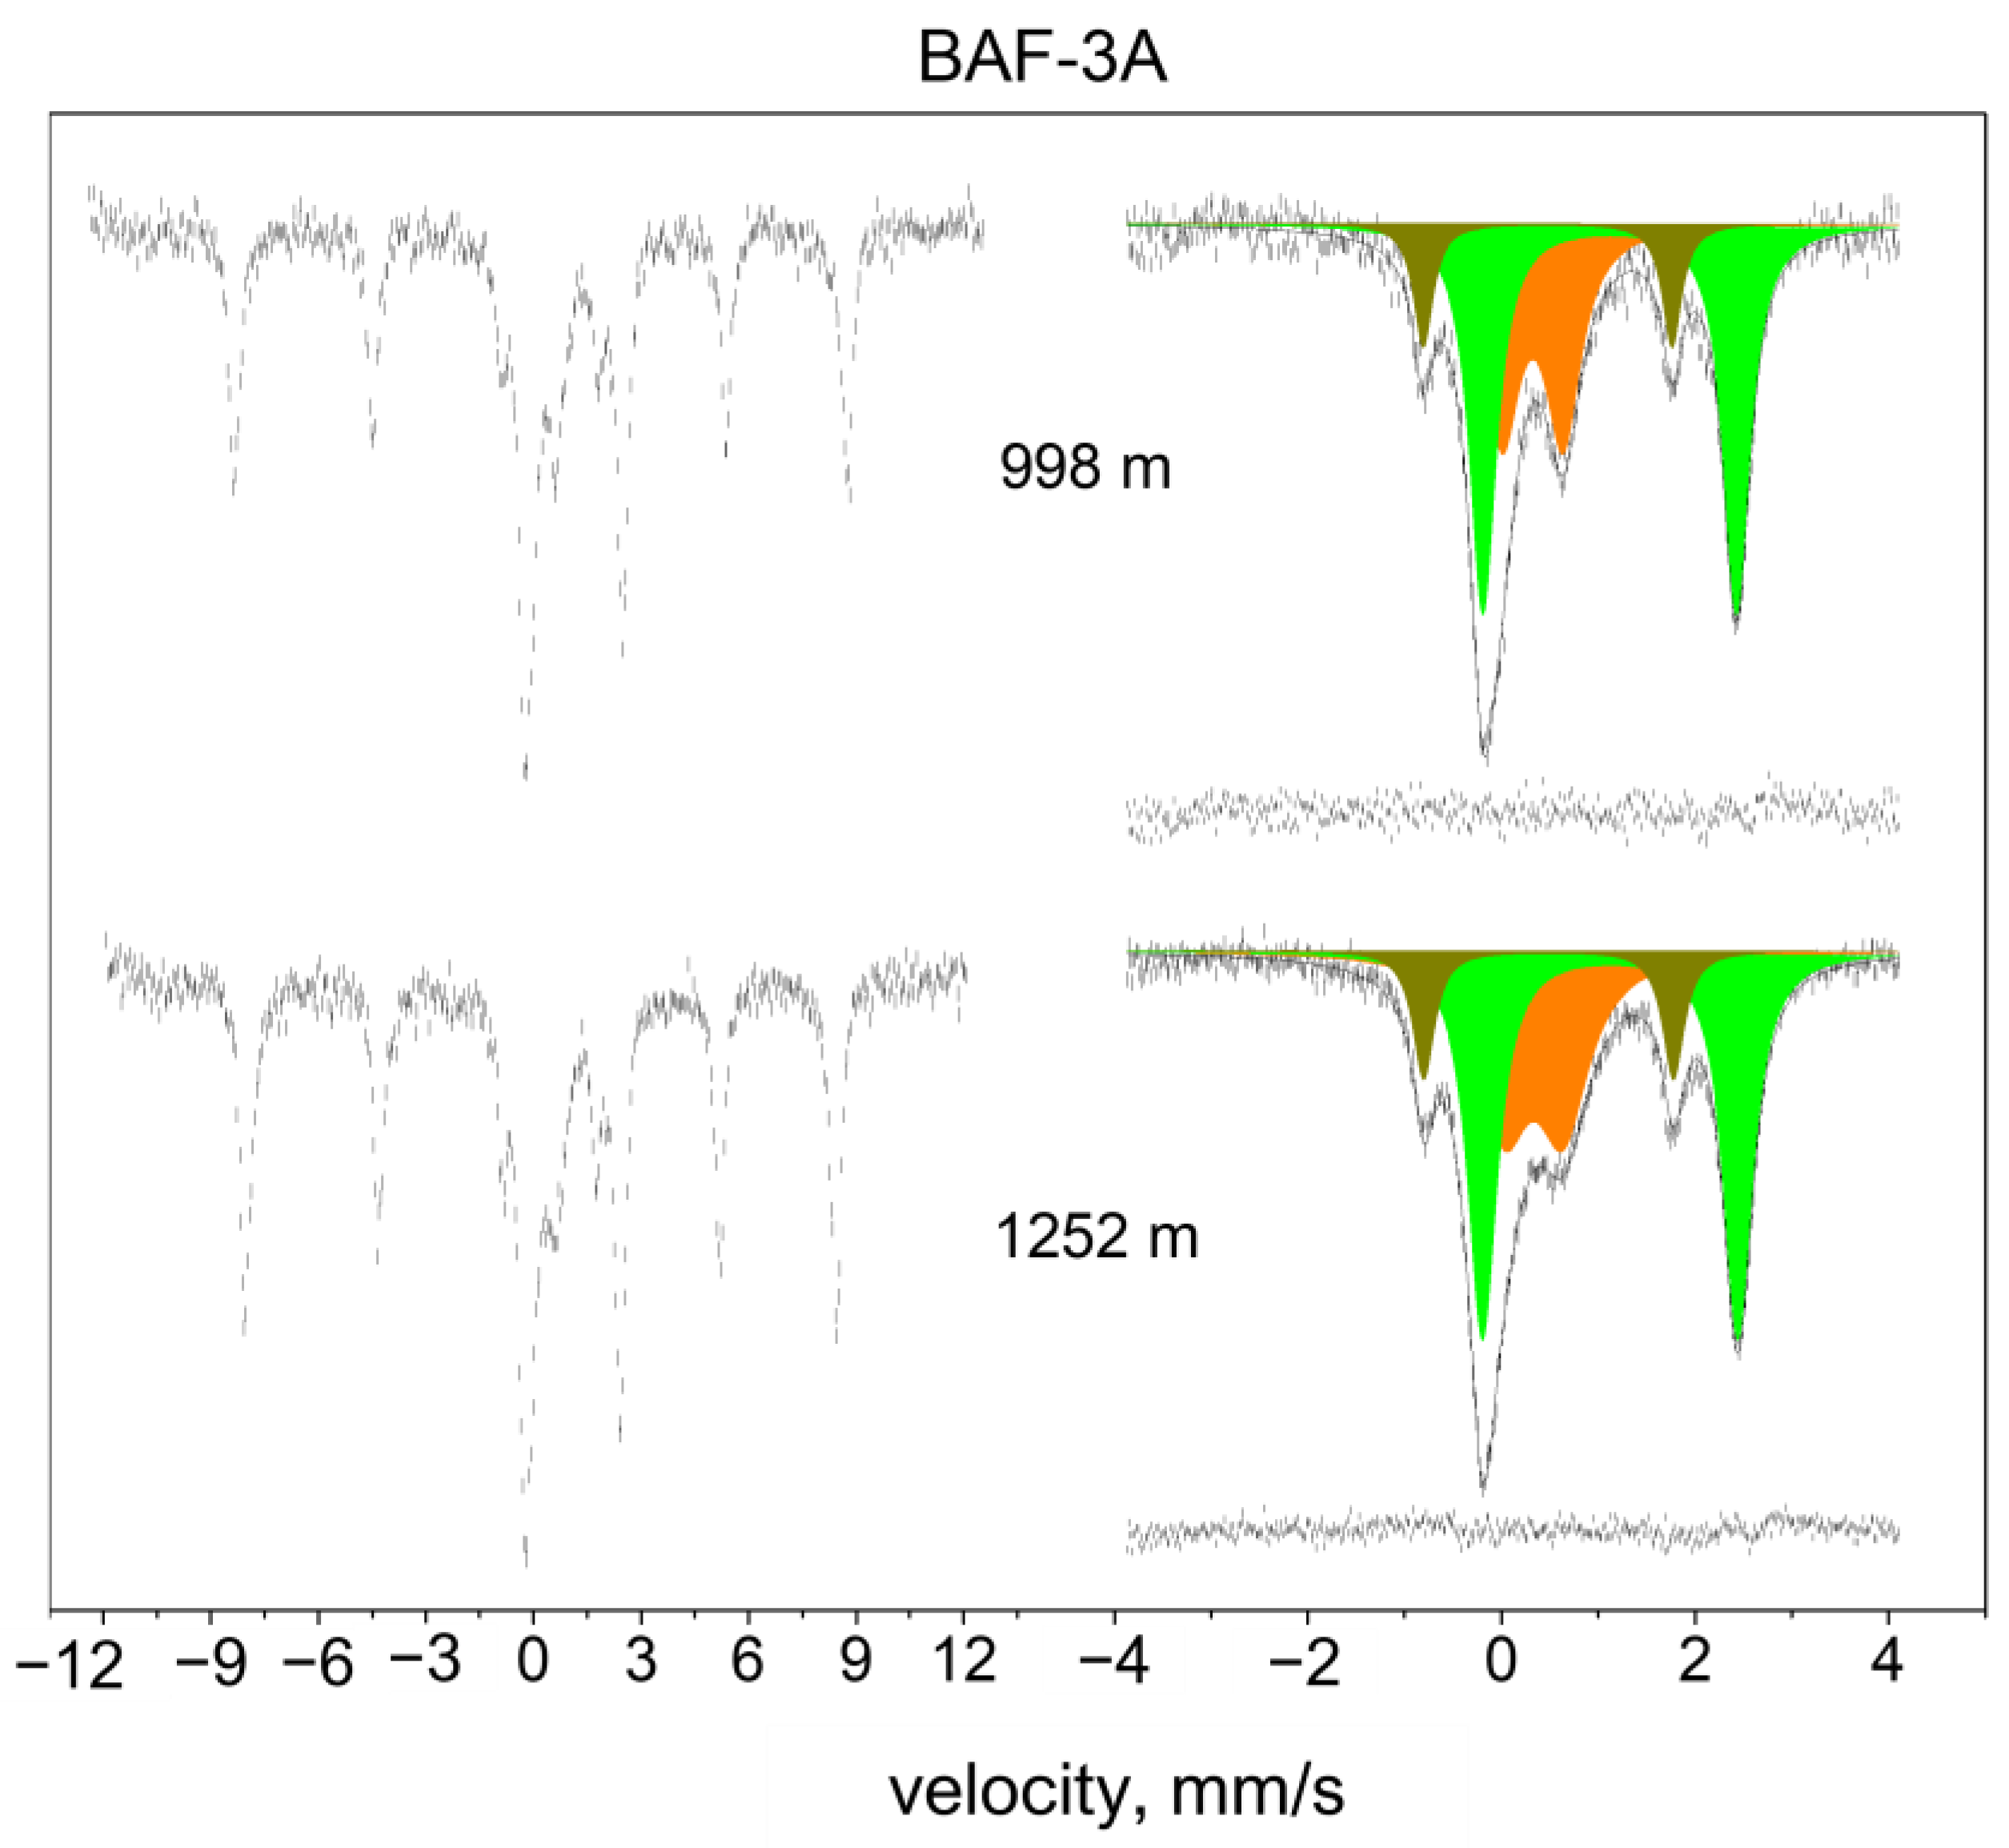
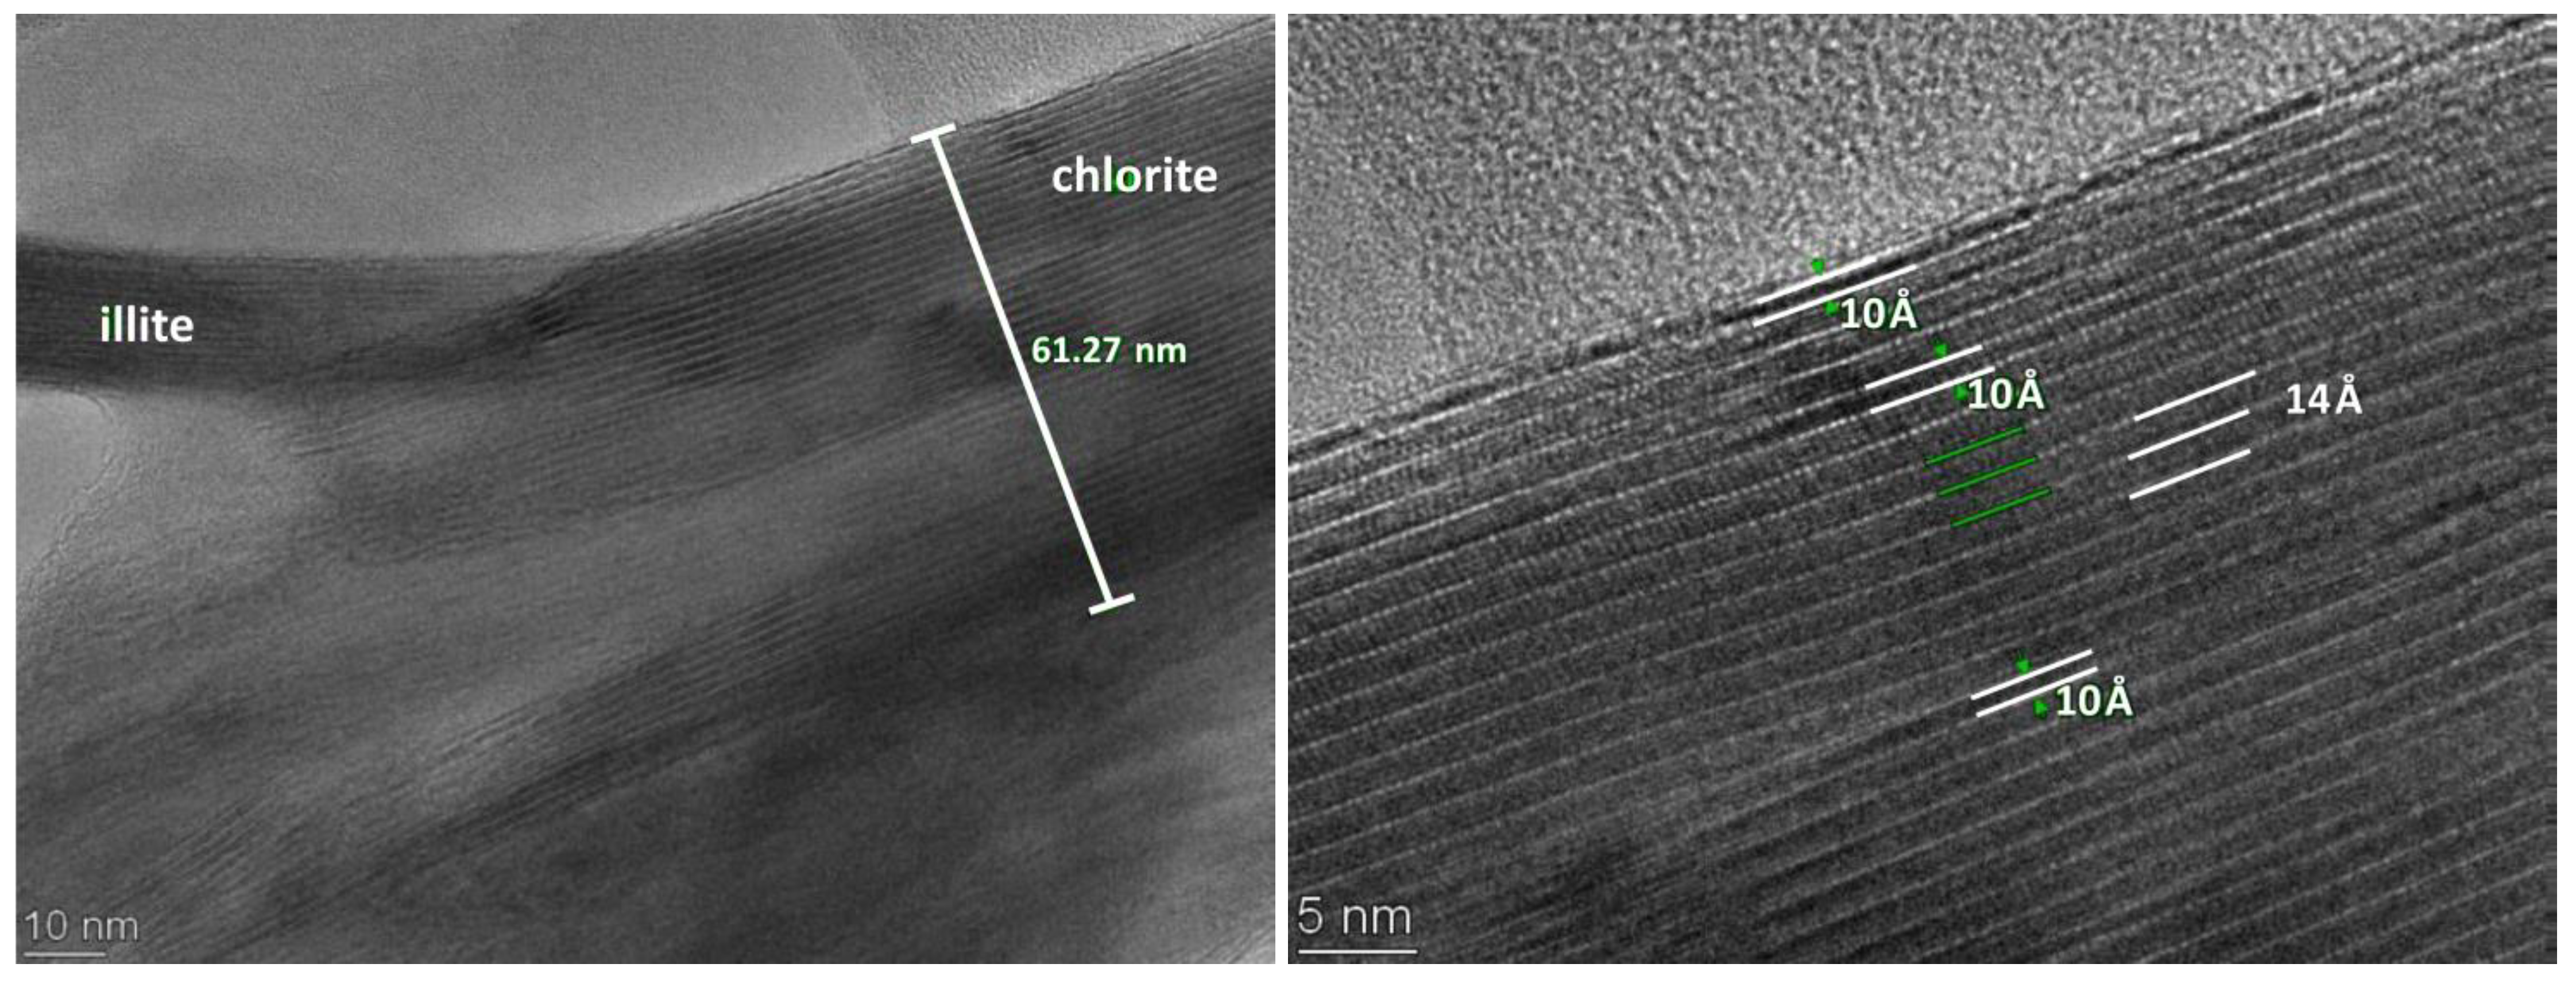
The present form of iron-bearing clay minerals in BAF is dominantly composed of illite and chlorite. During the diagenesis, the interlayer charge compensating cations may vary, as the XRD and HRTEM analyses attest. The Mössbauer spectroscopy can hardly distinguish among the various T-O-T structures since the primary information originated from iron located in the middle octahedral sheet.
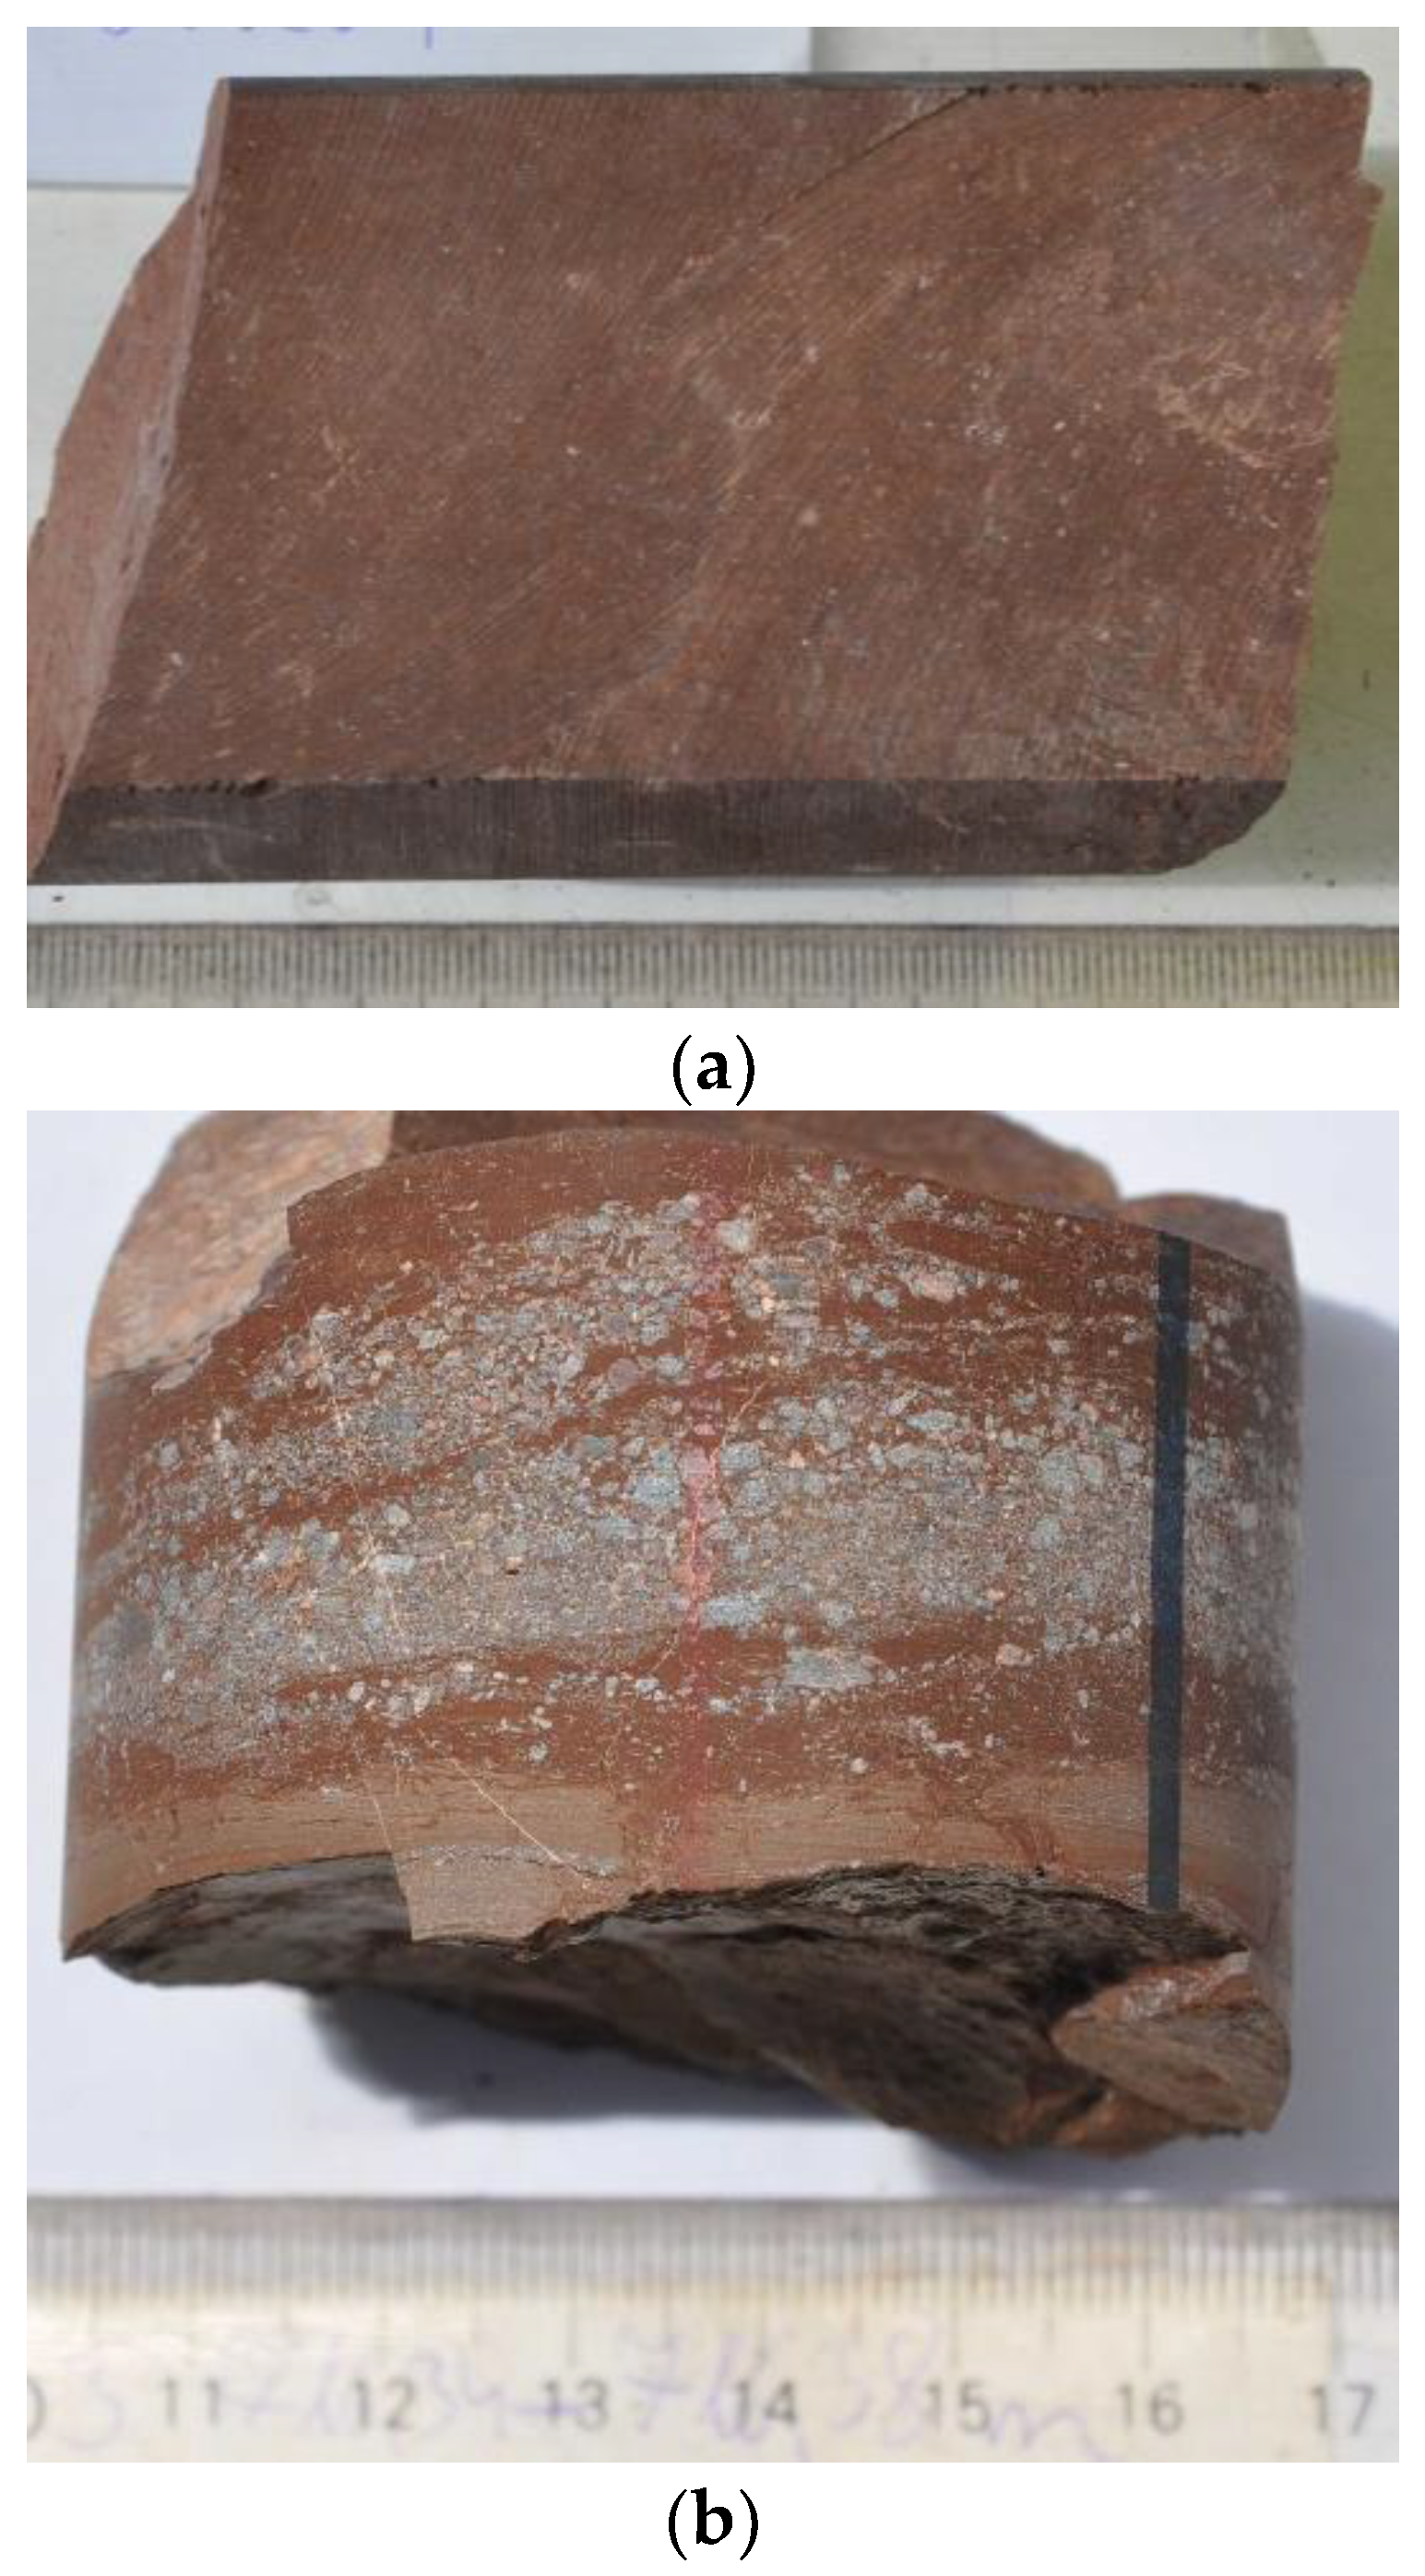
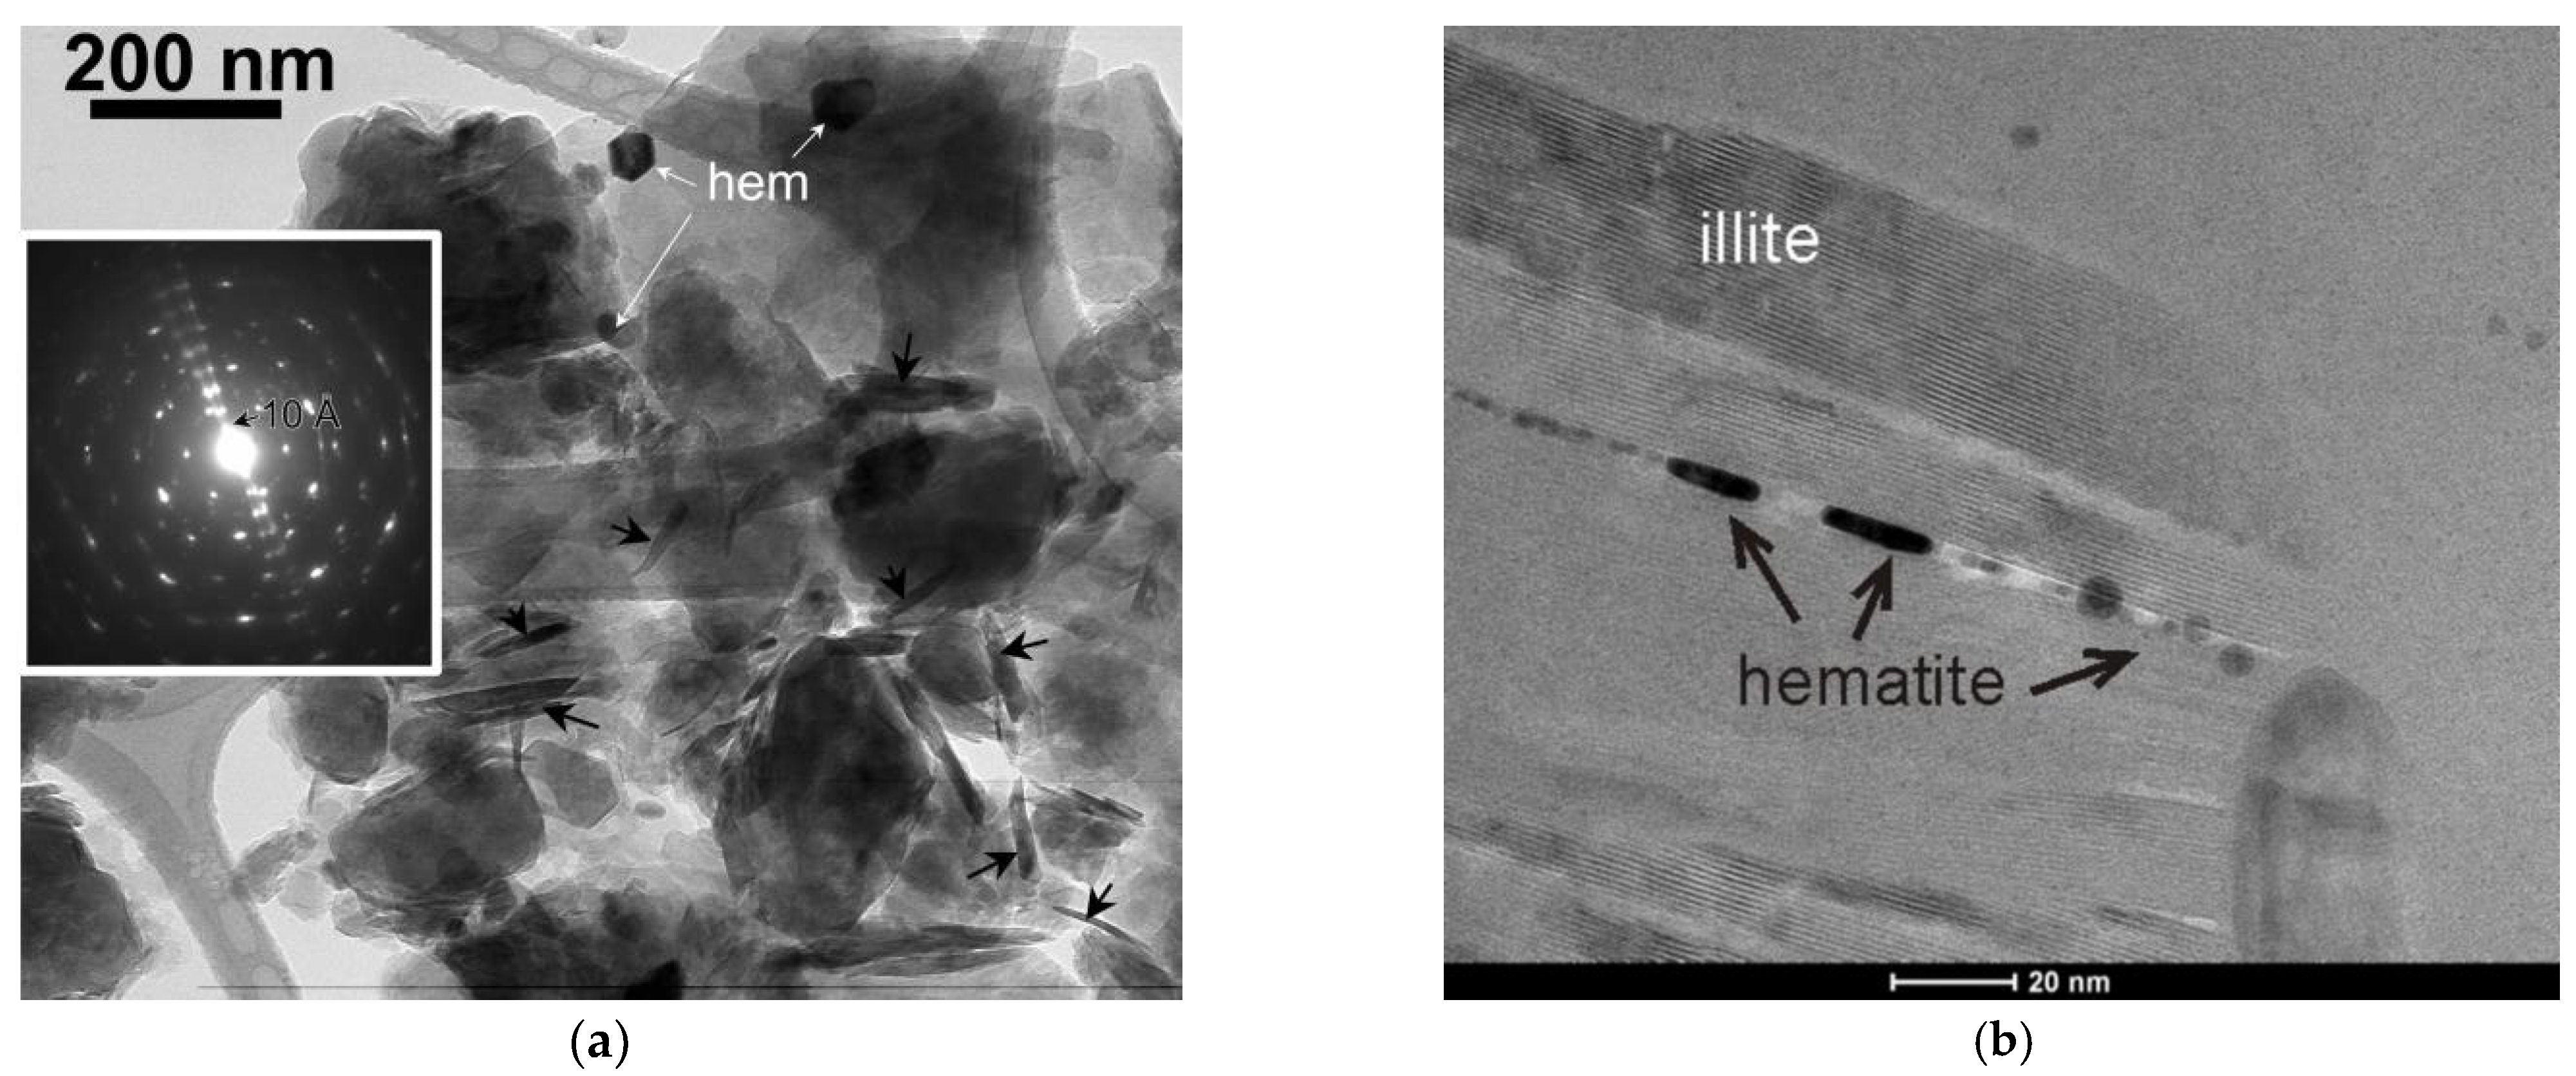
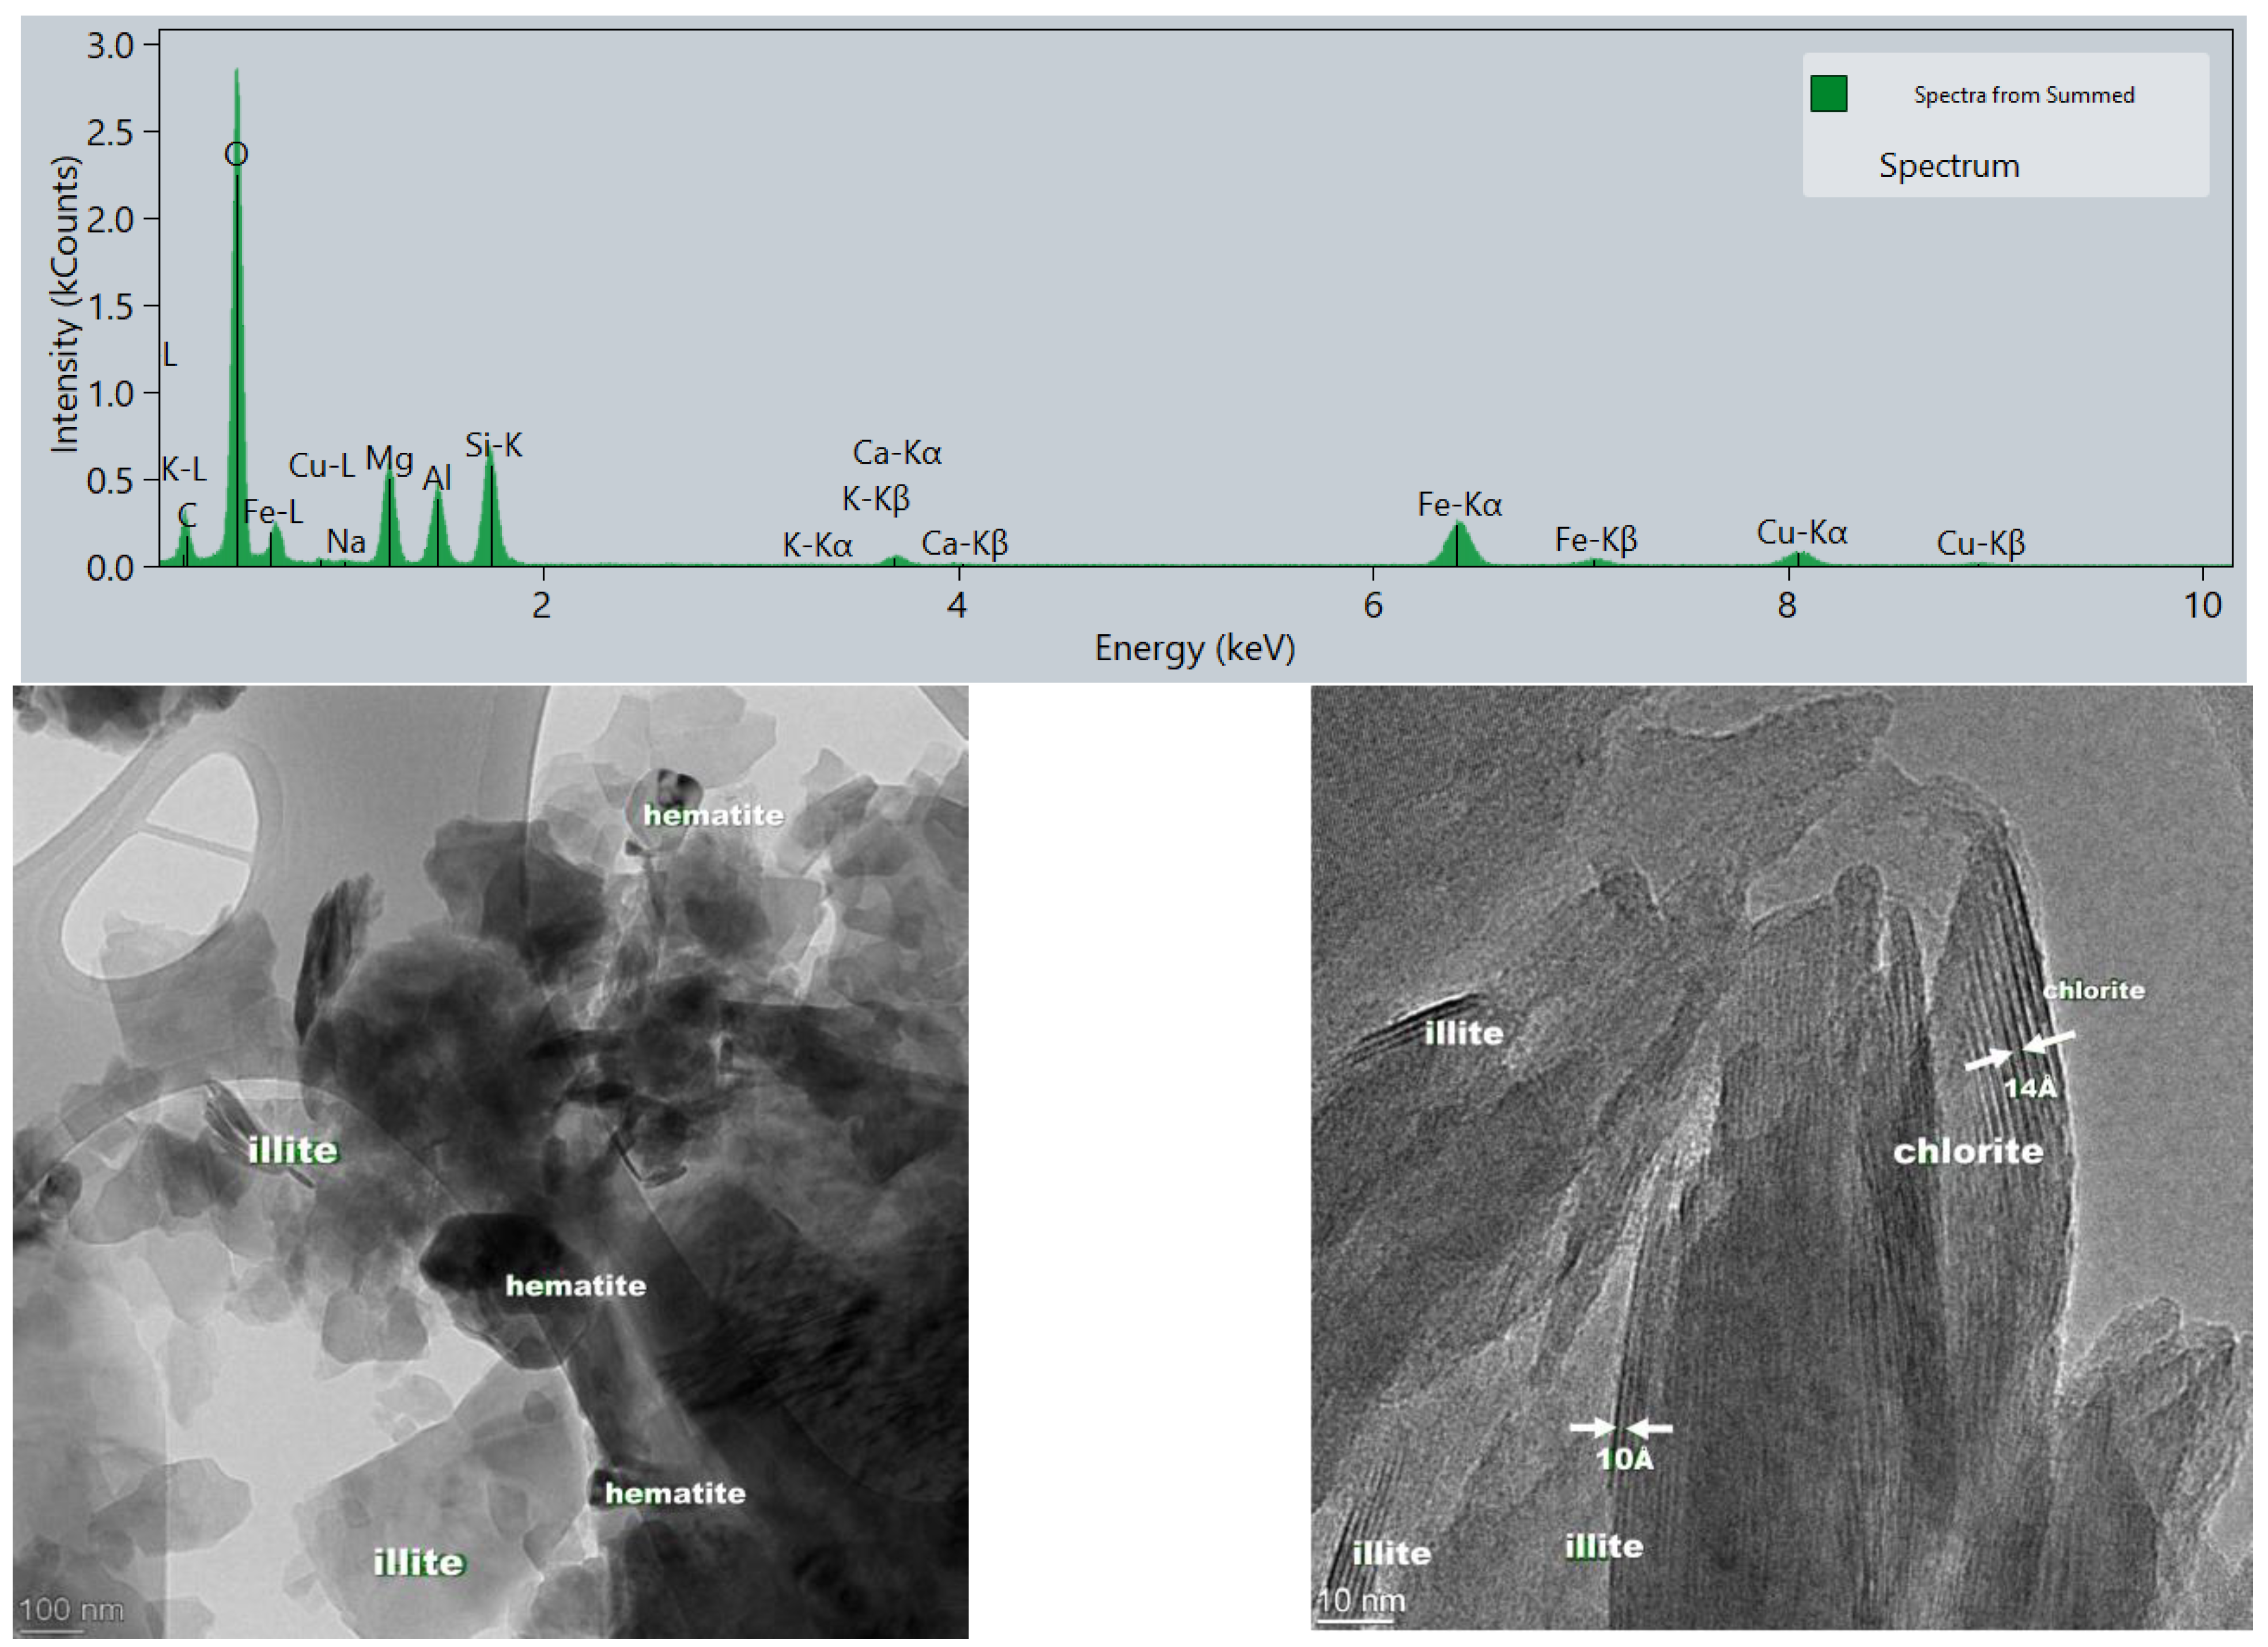
The morphology of hematite is also worth mentioning. Hematite occurs in two specific forms: in regular crystallites (e.g., in Figure 5a, and in Figure 10, bottom left) or as interparticle inclusions between illite packets (Figure 6b). The former regular large crystallites may probably develop from solutions containing Fe2+ in the first step, just after leaving the biotite frame. Iron in this ferrous form may migrate in the solution since it hydrolyzes only at pH 5–6. Following oxidation to the ferric state, during the wet-dry cycles in a playa lake, iron oxyhydroxide may precipitate immediately, since ferric ions hydrolyze already at pH 2–3. In the following stage, the oxyhydroxide is transformed into regular hematite crystallites during burial and exposure to larger pressure and temperature. The other variant, the interpacket nanoscale hematite flakes, is probably precipitated during the illite formation.
In general, the principal T-O-T structural layers in sheet silicates are probably preserved in the process of evolution of BCF. However, a part of the ferrous ions may migrate out of them, and the oxidation state of a part of the remaining central ions in the octahedra can be altered to a ferric one. This statement is based on the permanent presence of the doublet with parameters of the δ ≈ 1.1 mm s−1 and Δ ≈ 2.6mm s−1 pair of data. This particular cis-M2 ferrous doublet is present to different extents in almost all spectra. The parameters of ferric ions in the octahedral sites are less specific, so structural deduction can hardly be based on them. However, an important observation should be mentioned, namely the δ isomer shift of the Fe3+ component never drops below 0.3 mm s−1, i.e., ferric ions always occupy octahedral sites, and never are inserted into tetrahedral sheet. In a rough approximation, considering the change of proportions of iron among the different species, the extent of disintegration of the biotite (and amphibole) can also be estimated from the increase in hematite proportion, c.a. ½ portion of the original ferrous iron is converted to hematite.

4.2. Comparison of Gorica Block and WMA Samples

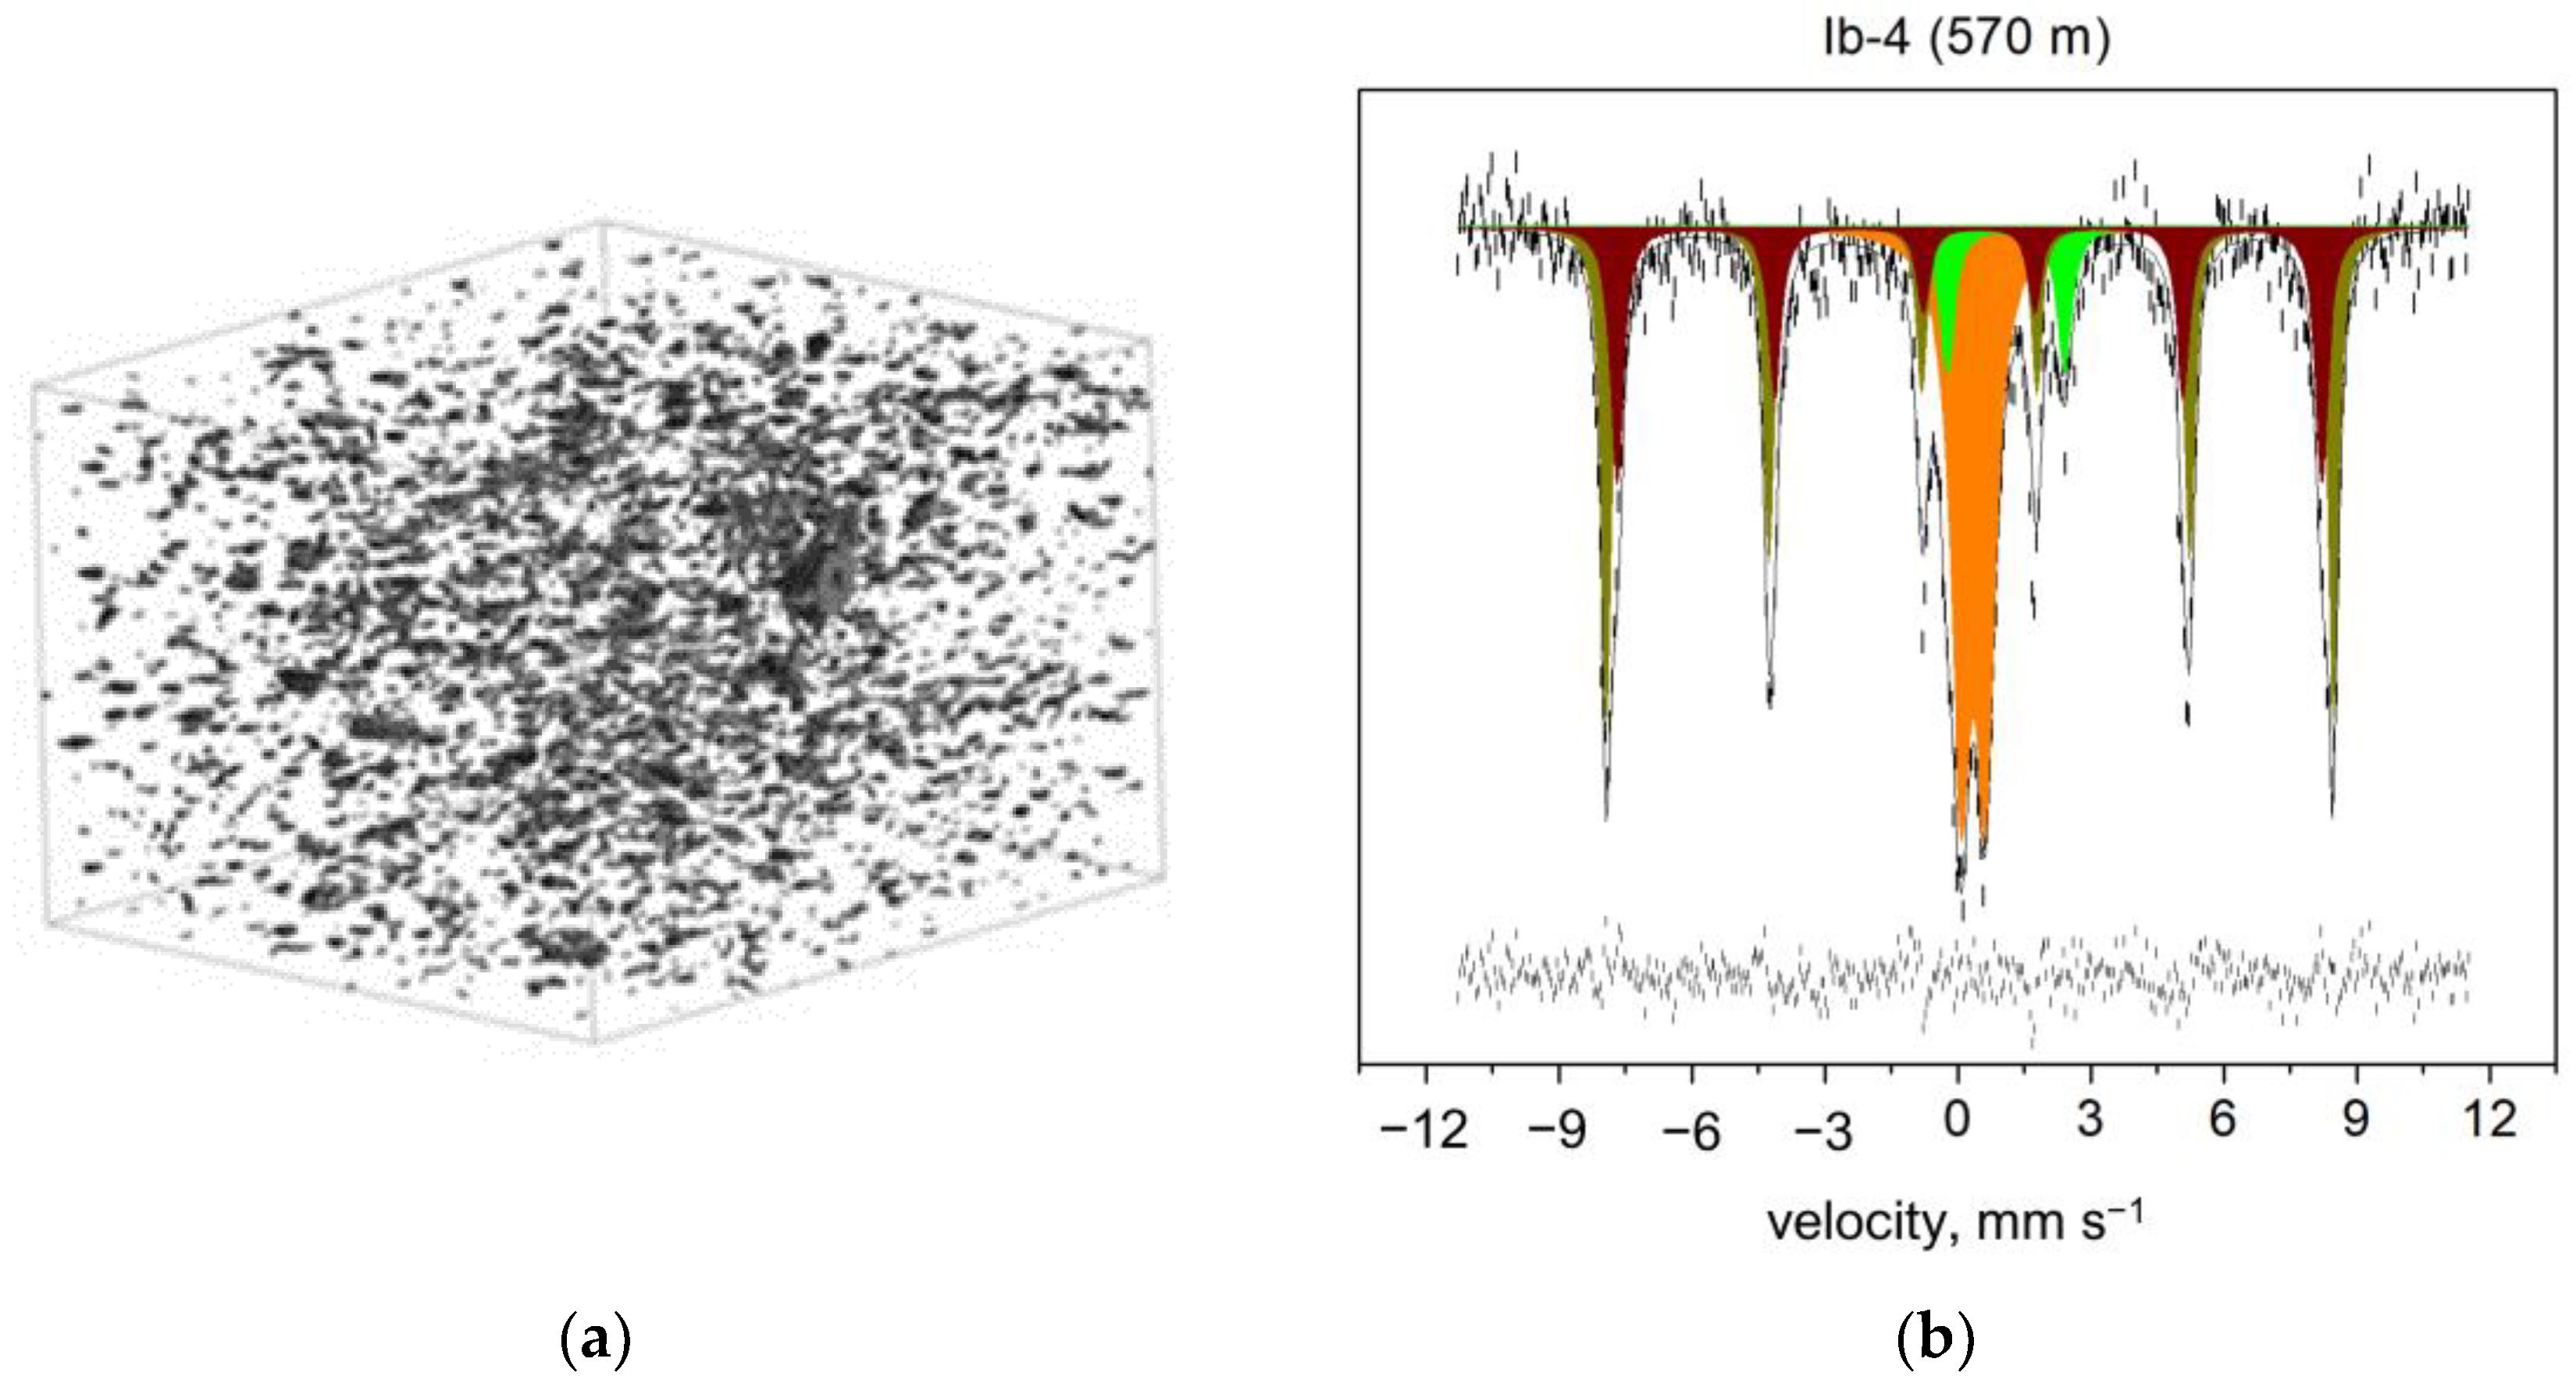
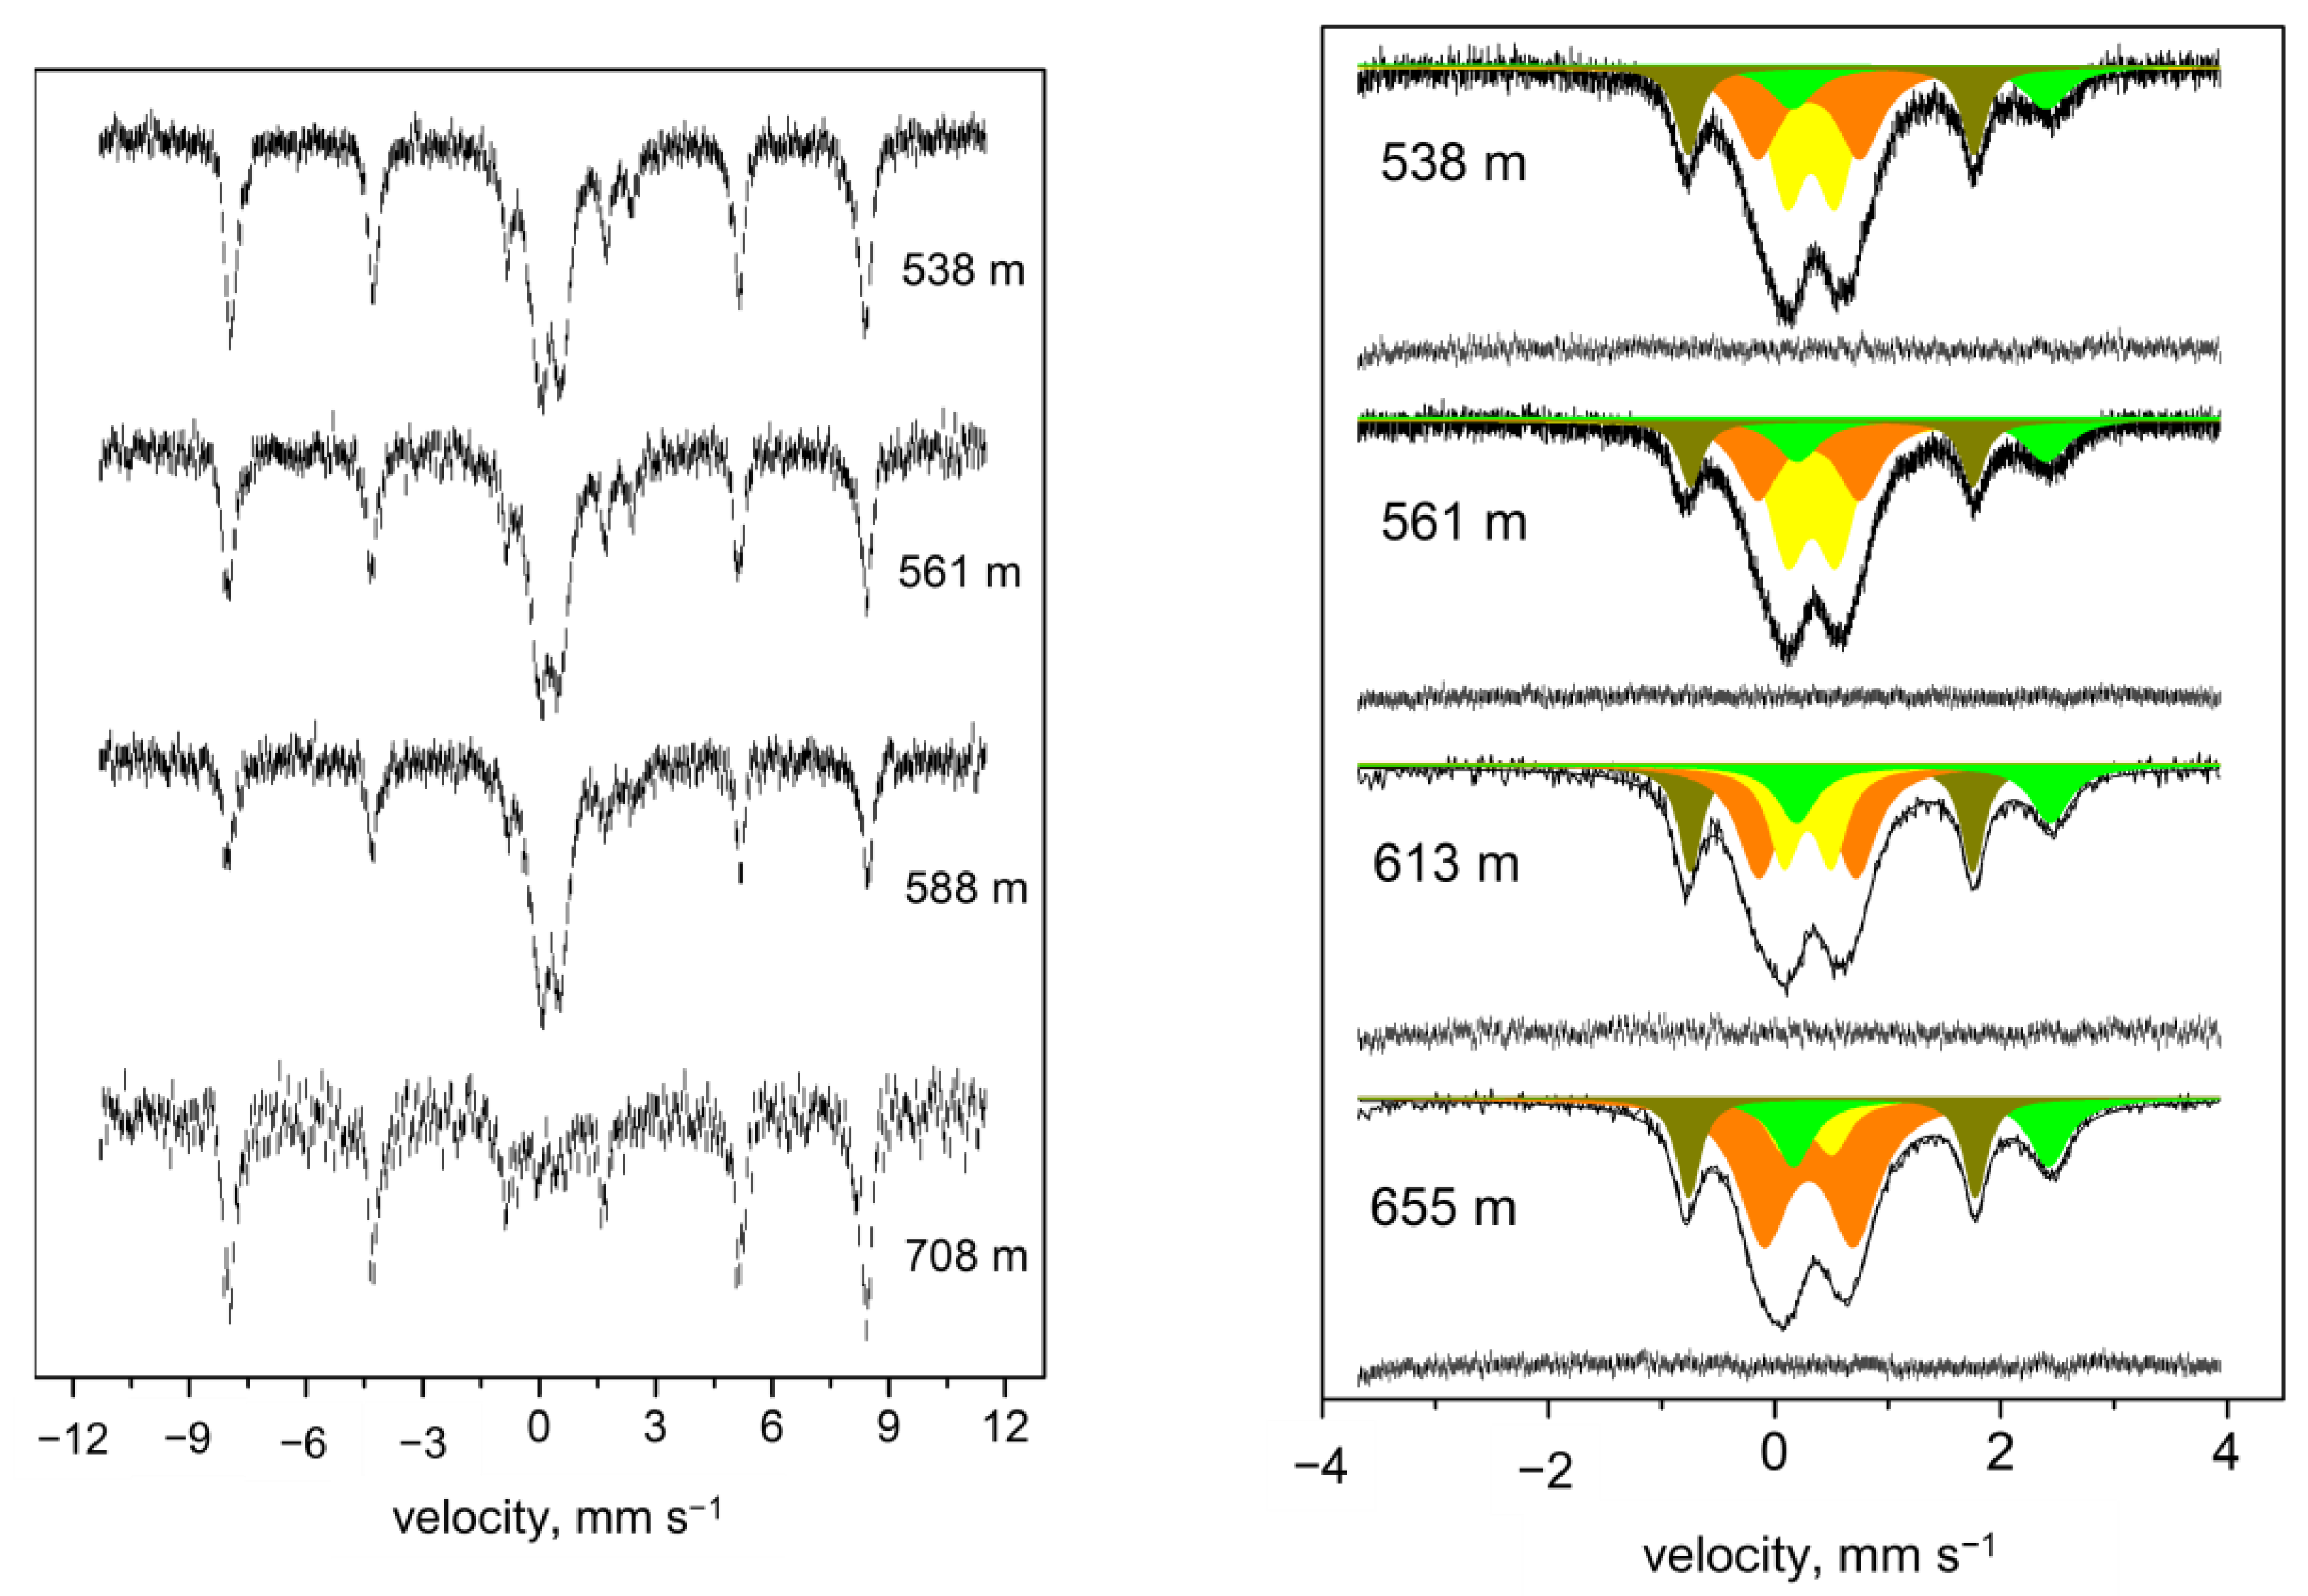
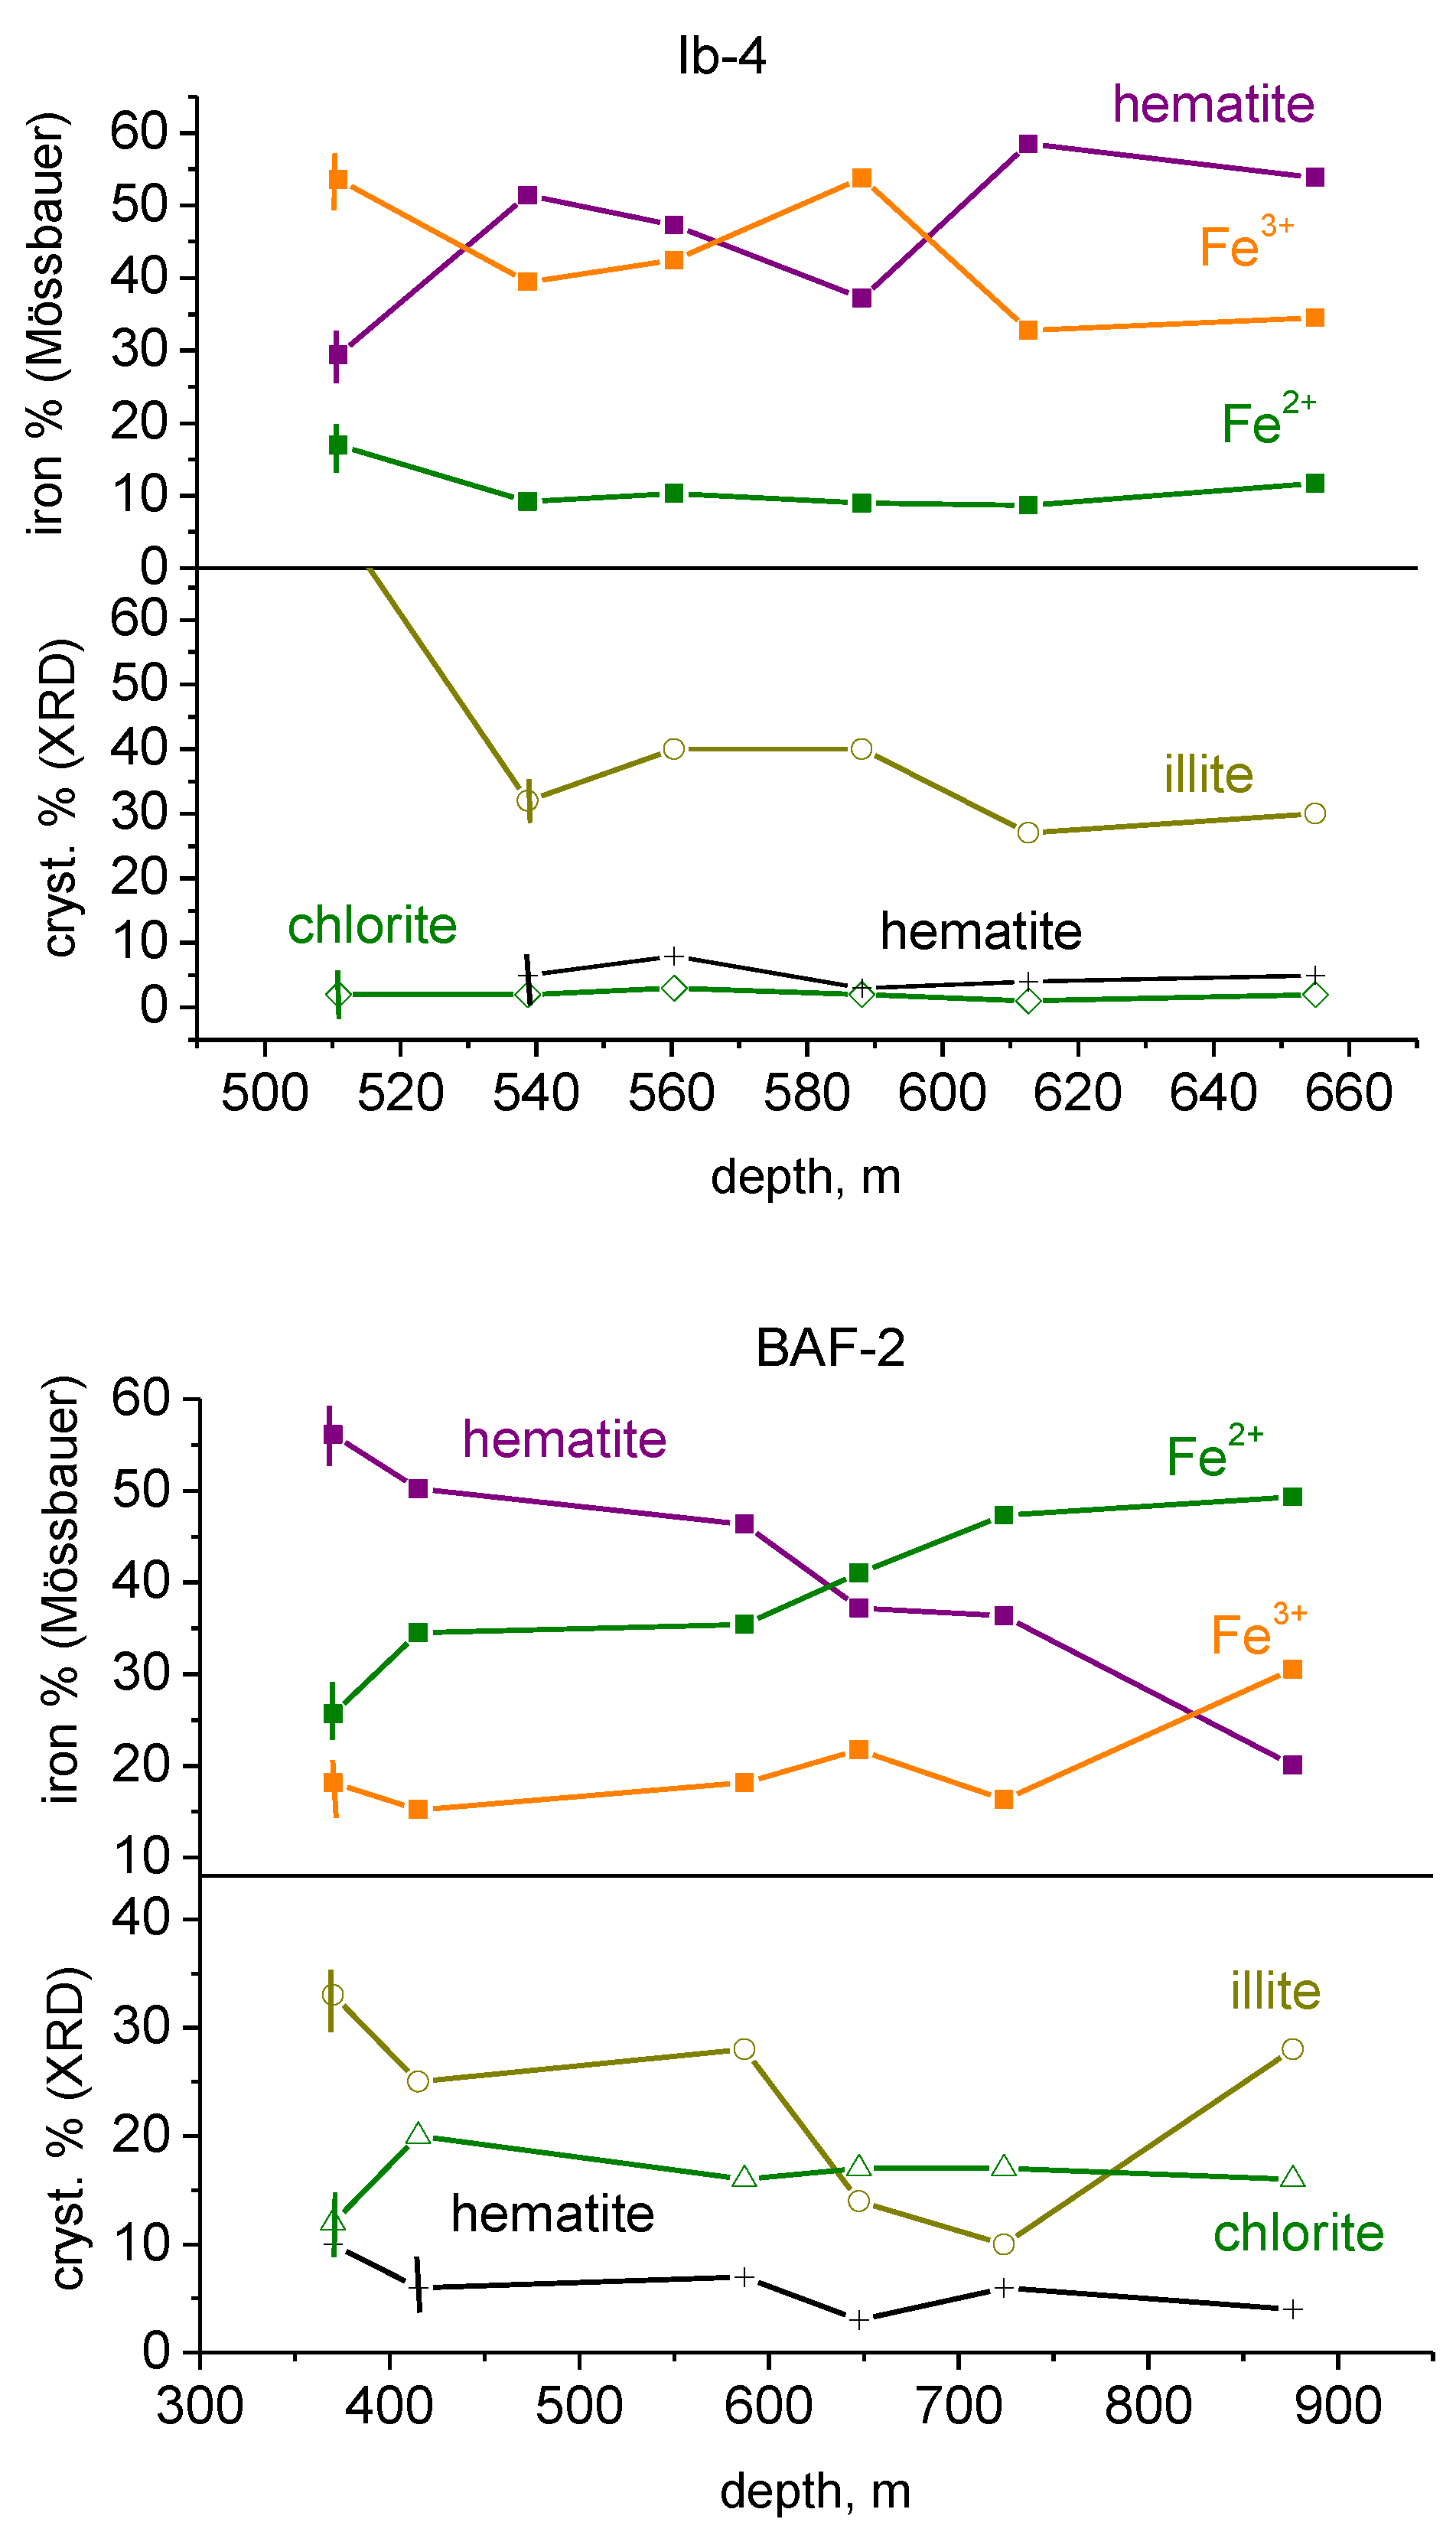
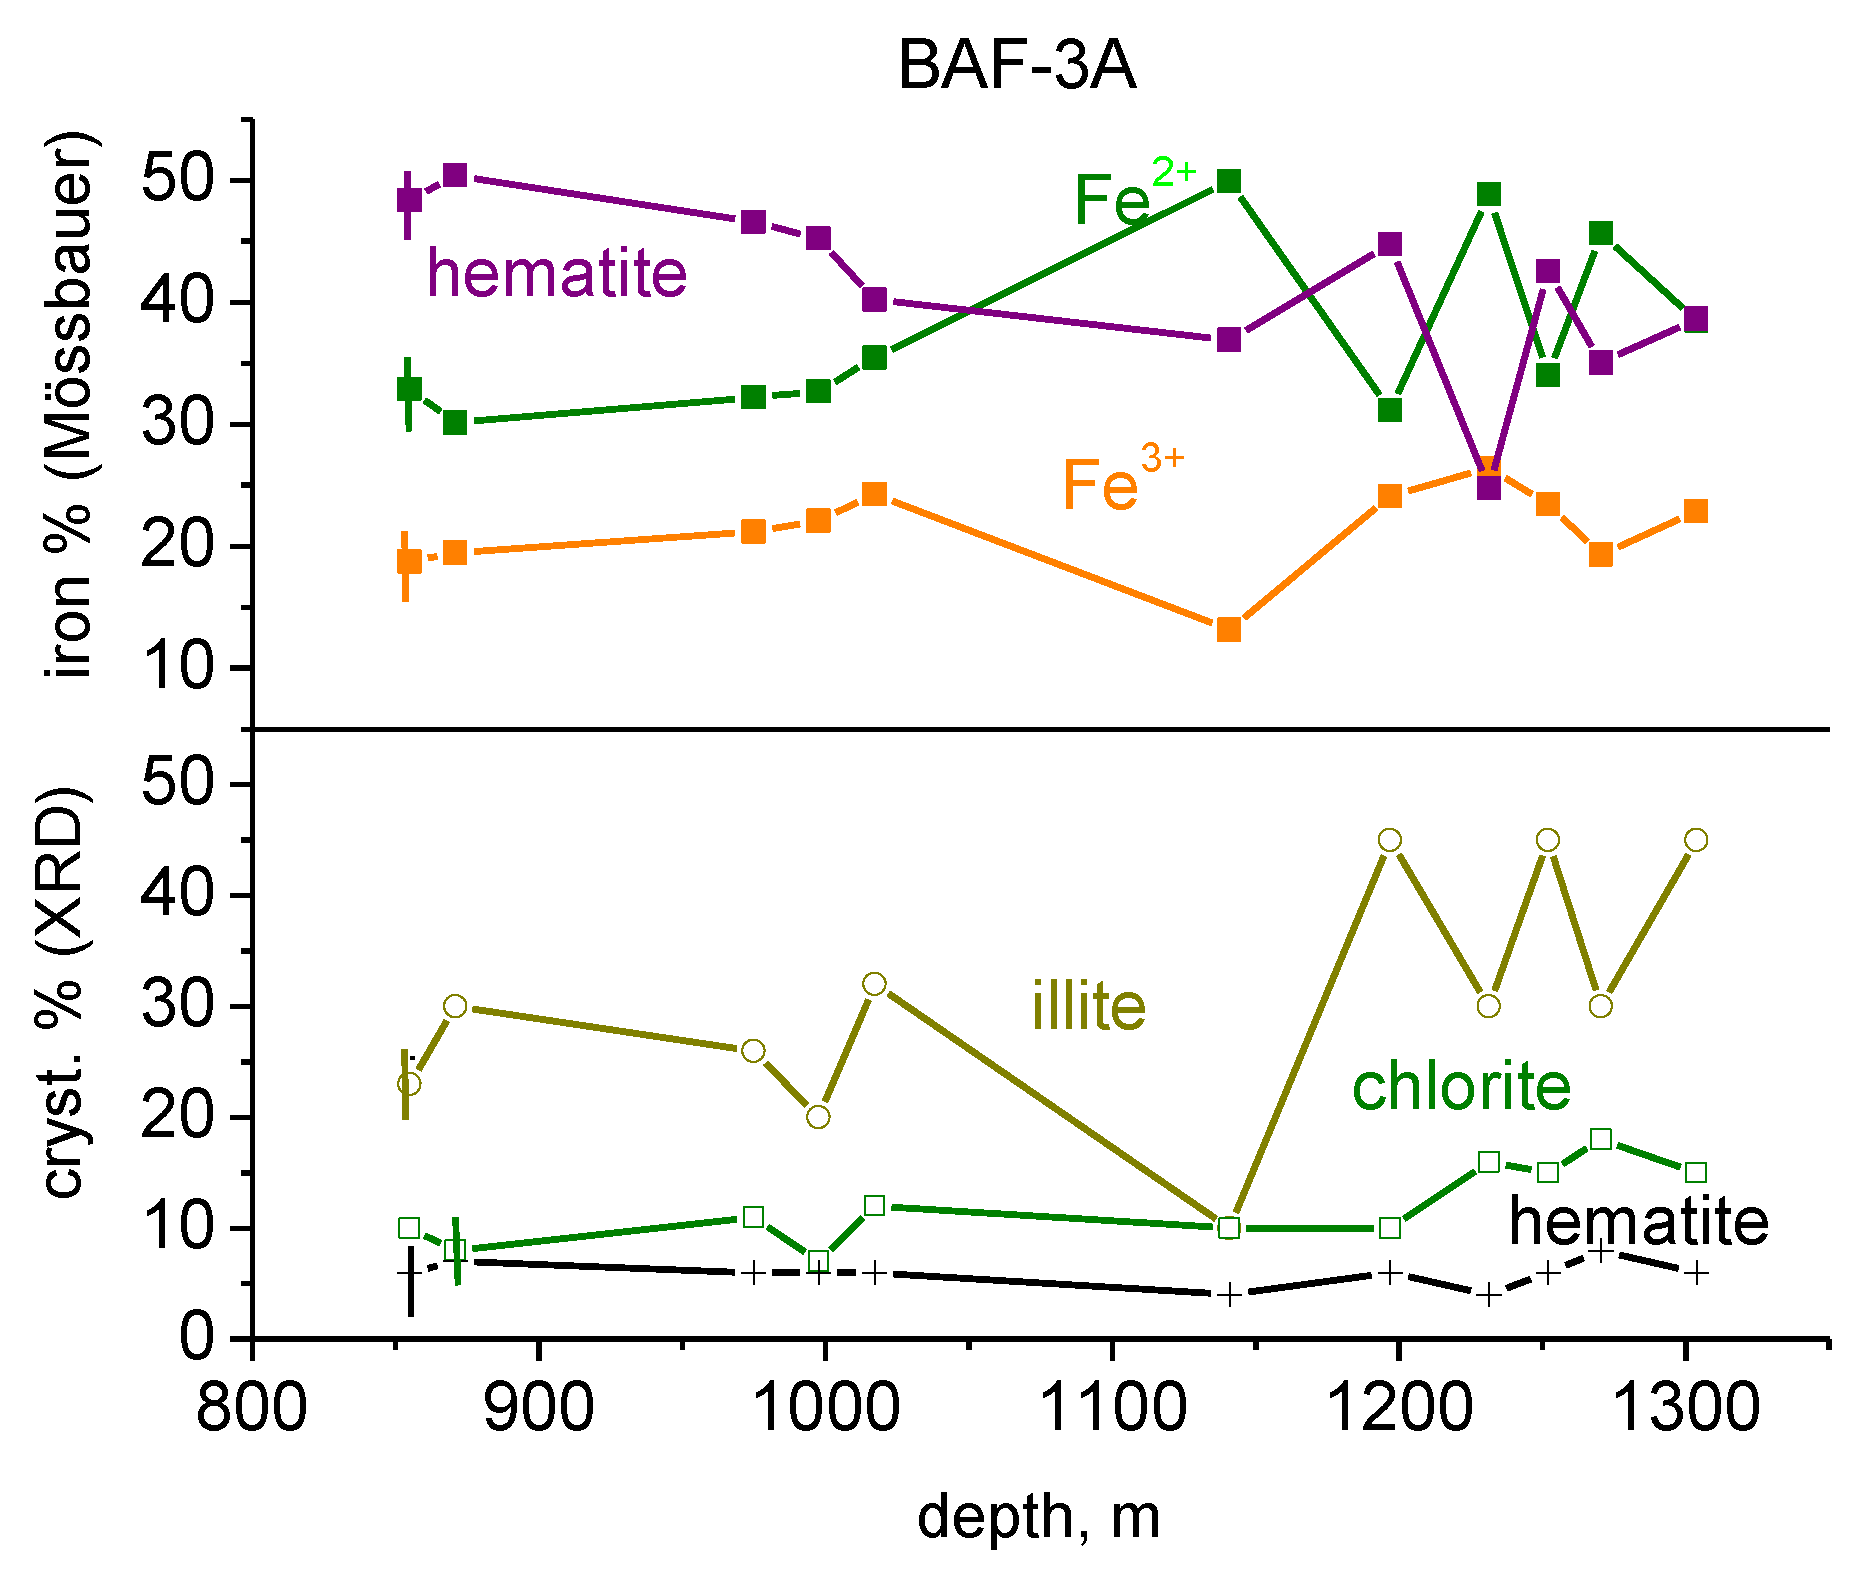
A distinct difference can be observed in the comparison of the proportions of Fe2+ and Fe3+ contributions of layered silicates in the Ib-4 (Gorica Block) and BAF-2, BAF-3A (WMA) samples. The Fe
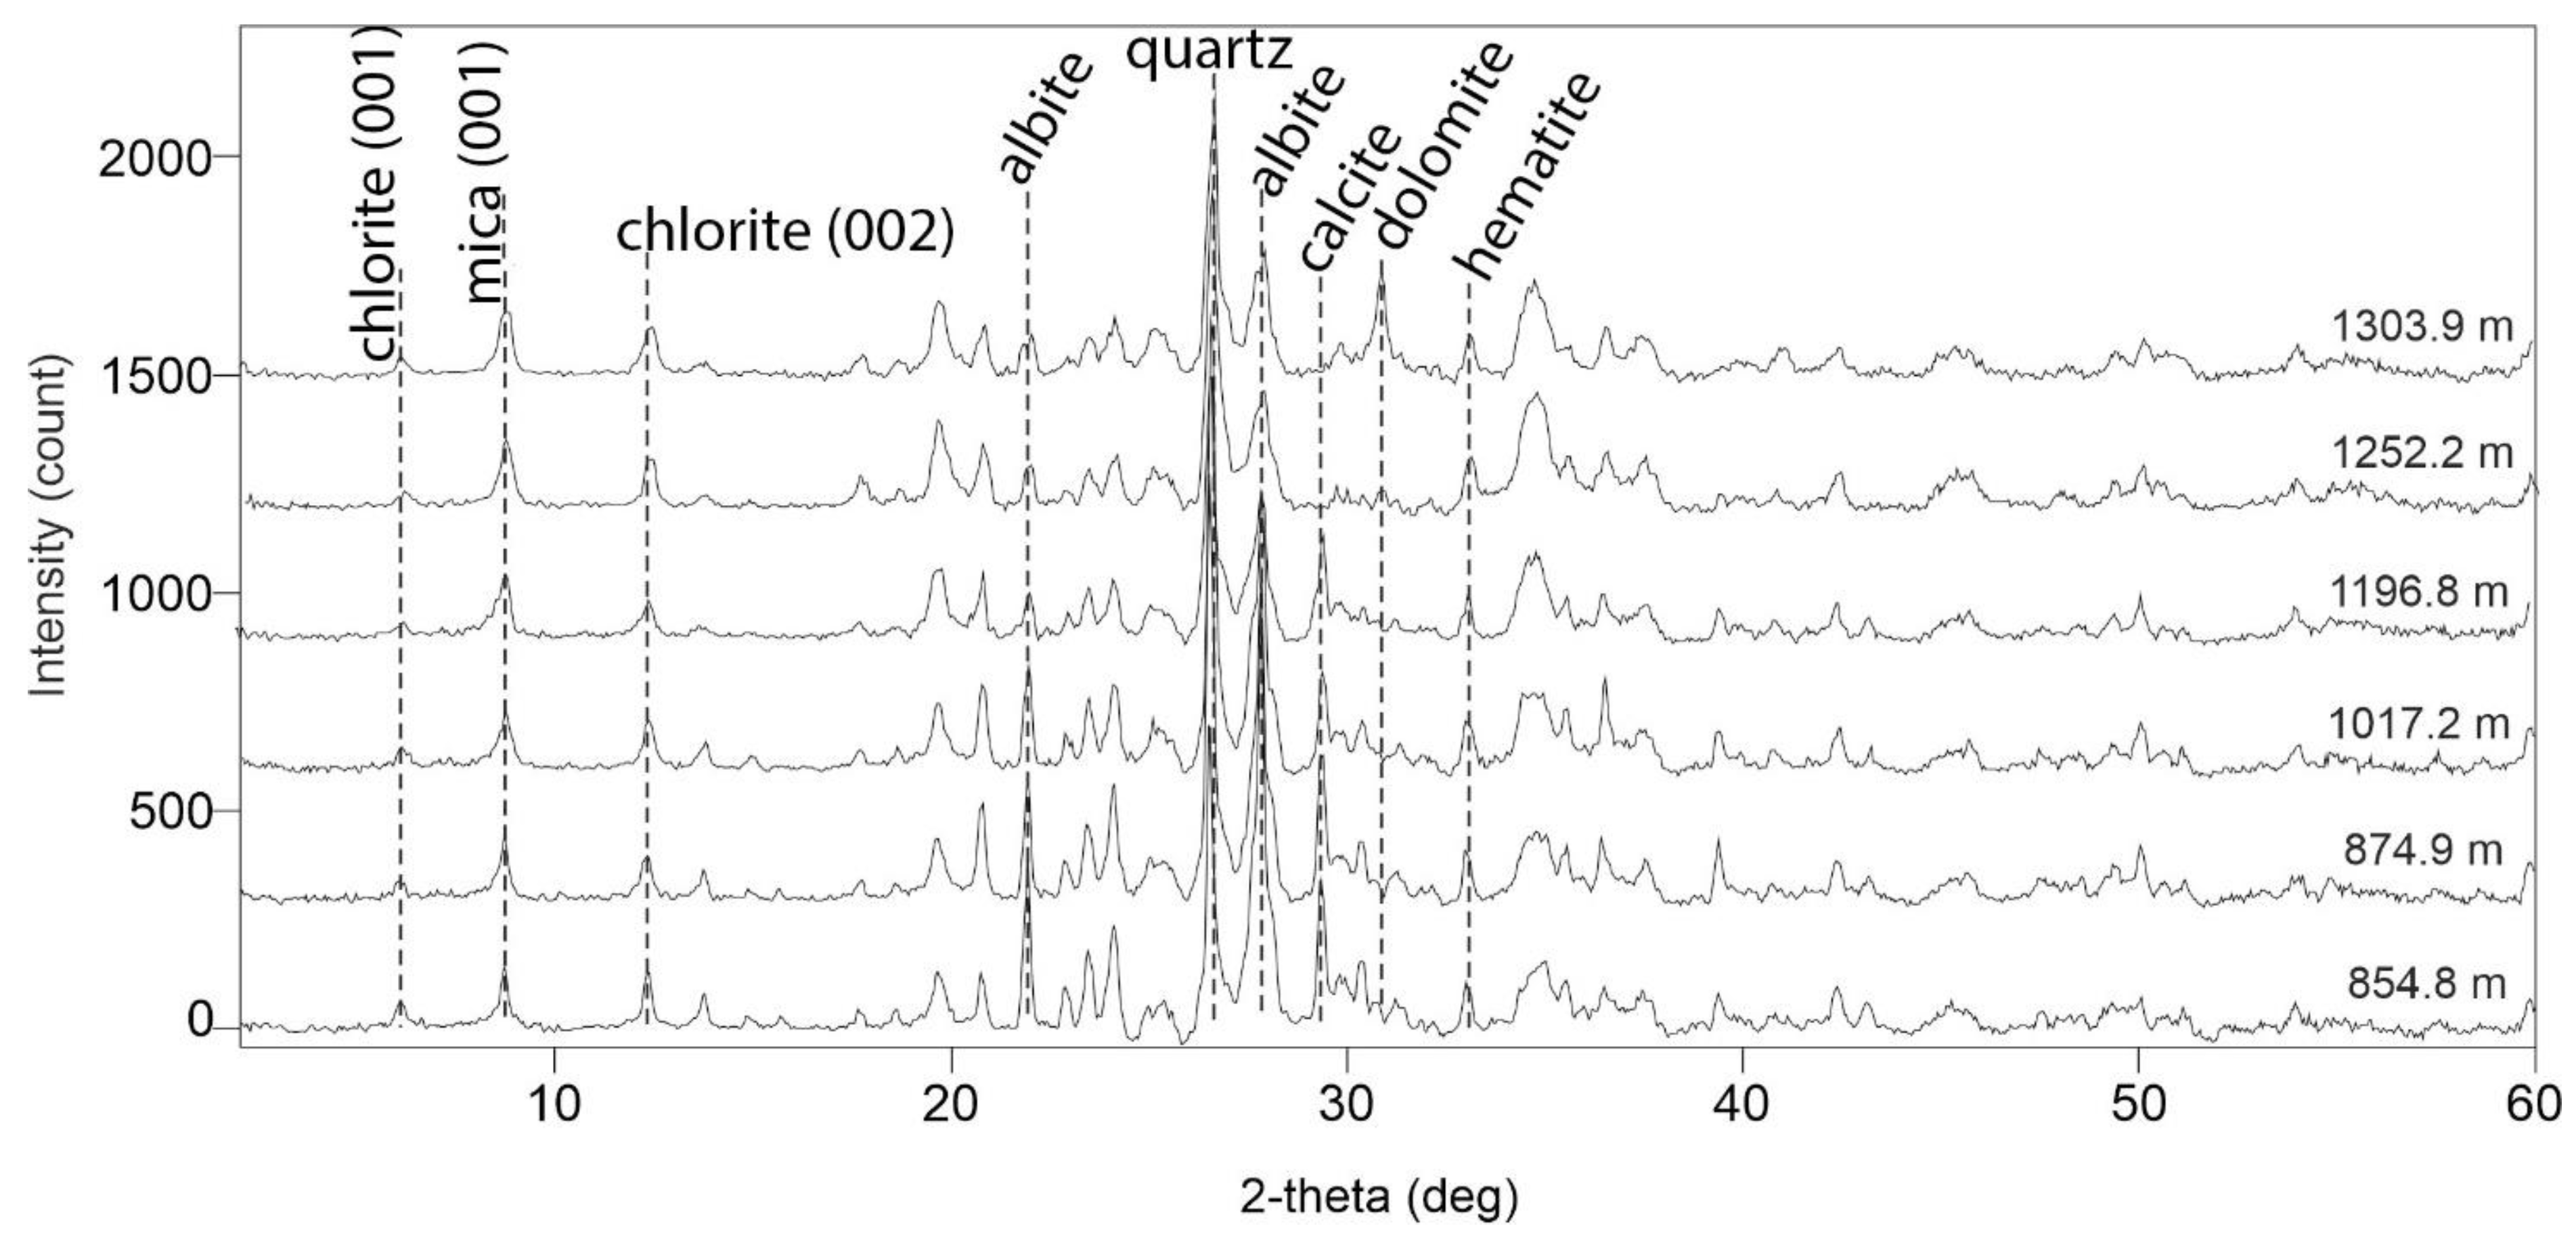
3+ contribution in Mössbauer spectra can be correlated with the illite proportion derived from XRD studies (Table 4, Table 8 and Table 9). The proportion of iron located in hematite can also be derived from Mössbauer spectra. The distribution of iron among the Fe2+, Fe3+ (doublets from layered silicates) and hematite (magnetic sextet) contributions are represented in the top panels in Figure 11. Illite, chlorite and hematite mineral proportions extracted from XRD data are also displayed at the bottom of the panels. Comparison of the top and bottom parts of the panels provides an excellent illustration of the significant difference in detection sensitivities of the Mössbauer and XRD techniques with regard to the iron-bearing phases due to the different relative iron contents of corresponding minerals, as was already mentioned in connection with biotitic minerals and hematite in interpreting spectra in Figure 3. For illite, similar considerations are valid, as illite contains 13 wt% iron in a nominal [K(Mg,Fe)2(Si,Al)4O10(OH)2] composition, compared to 67% in hematite. Thus, the partial contribution of hematite is ca. 5 times less in XRD tables than percentages obtained from Mössbauer spectra. Further, the average iron contents of illite and chlorite are also different. Illite usually contains 2–3 times less iron than chlorite, since the former usually consists of a T-O-T dioctahedral structure, whereas the latter prefers to exist in a more iron-rich trioctahedral T-O-T-O structure. The comparison of the corresponding plots attests that the Fe3+ contributions in Ib-4 samples can be correlated with the illite content, and the 50–30% illite presence in minerals (from XRD) can be correlated with 55–30% Fe
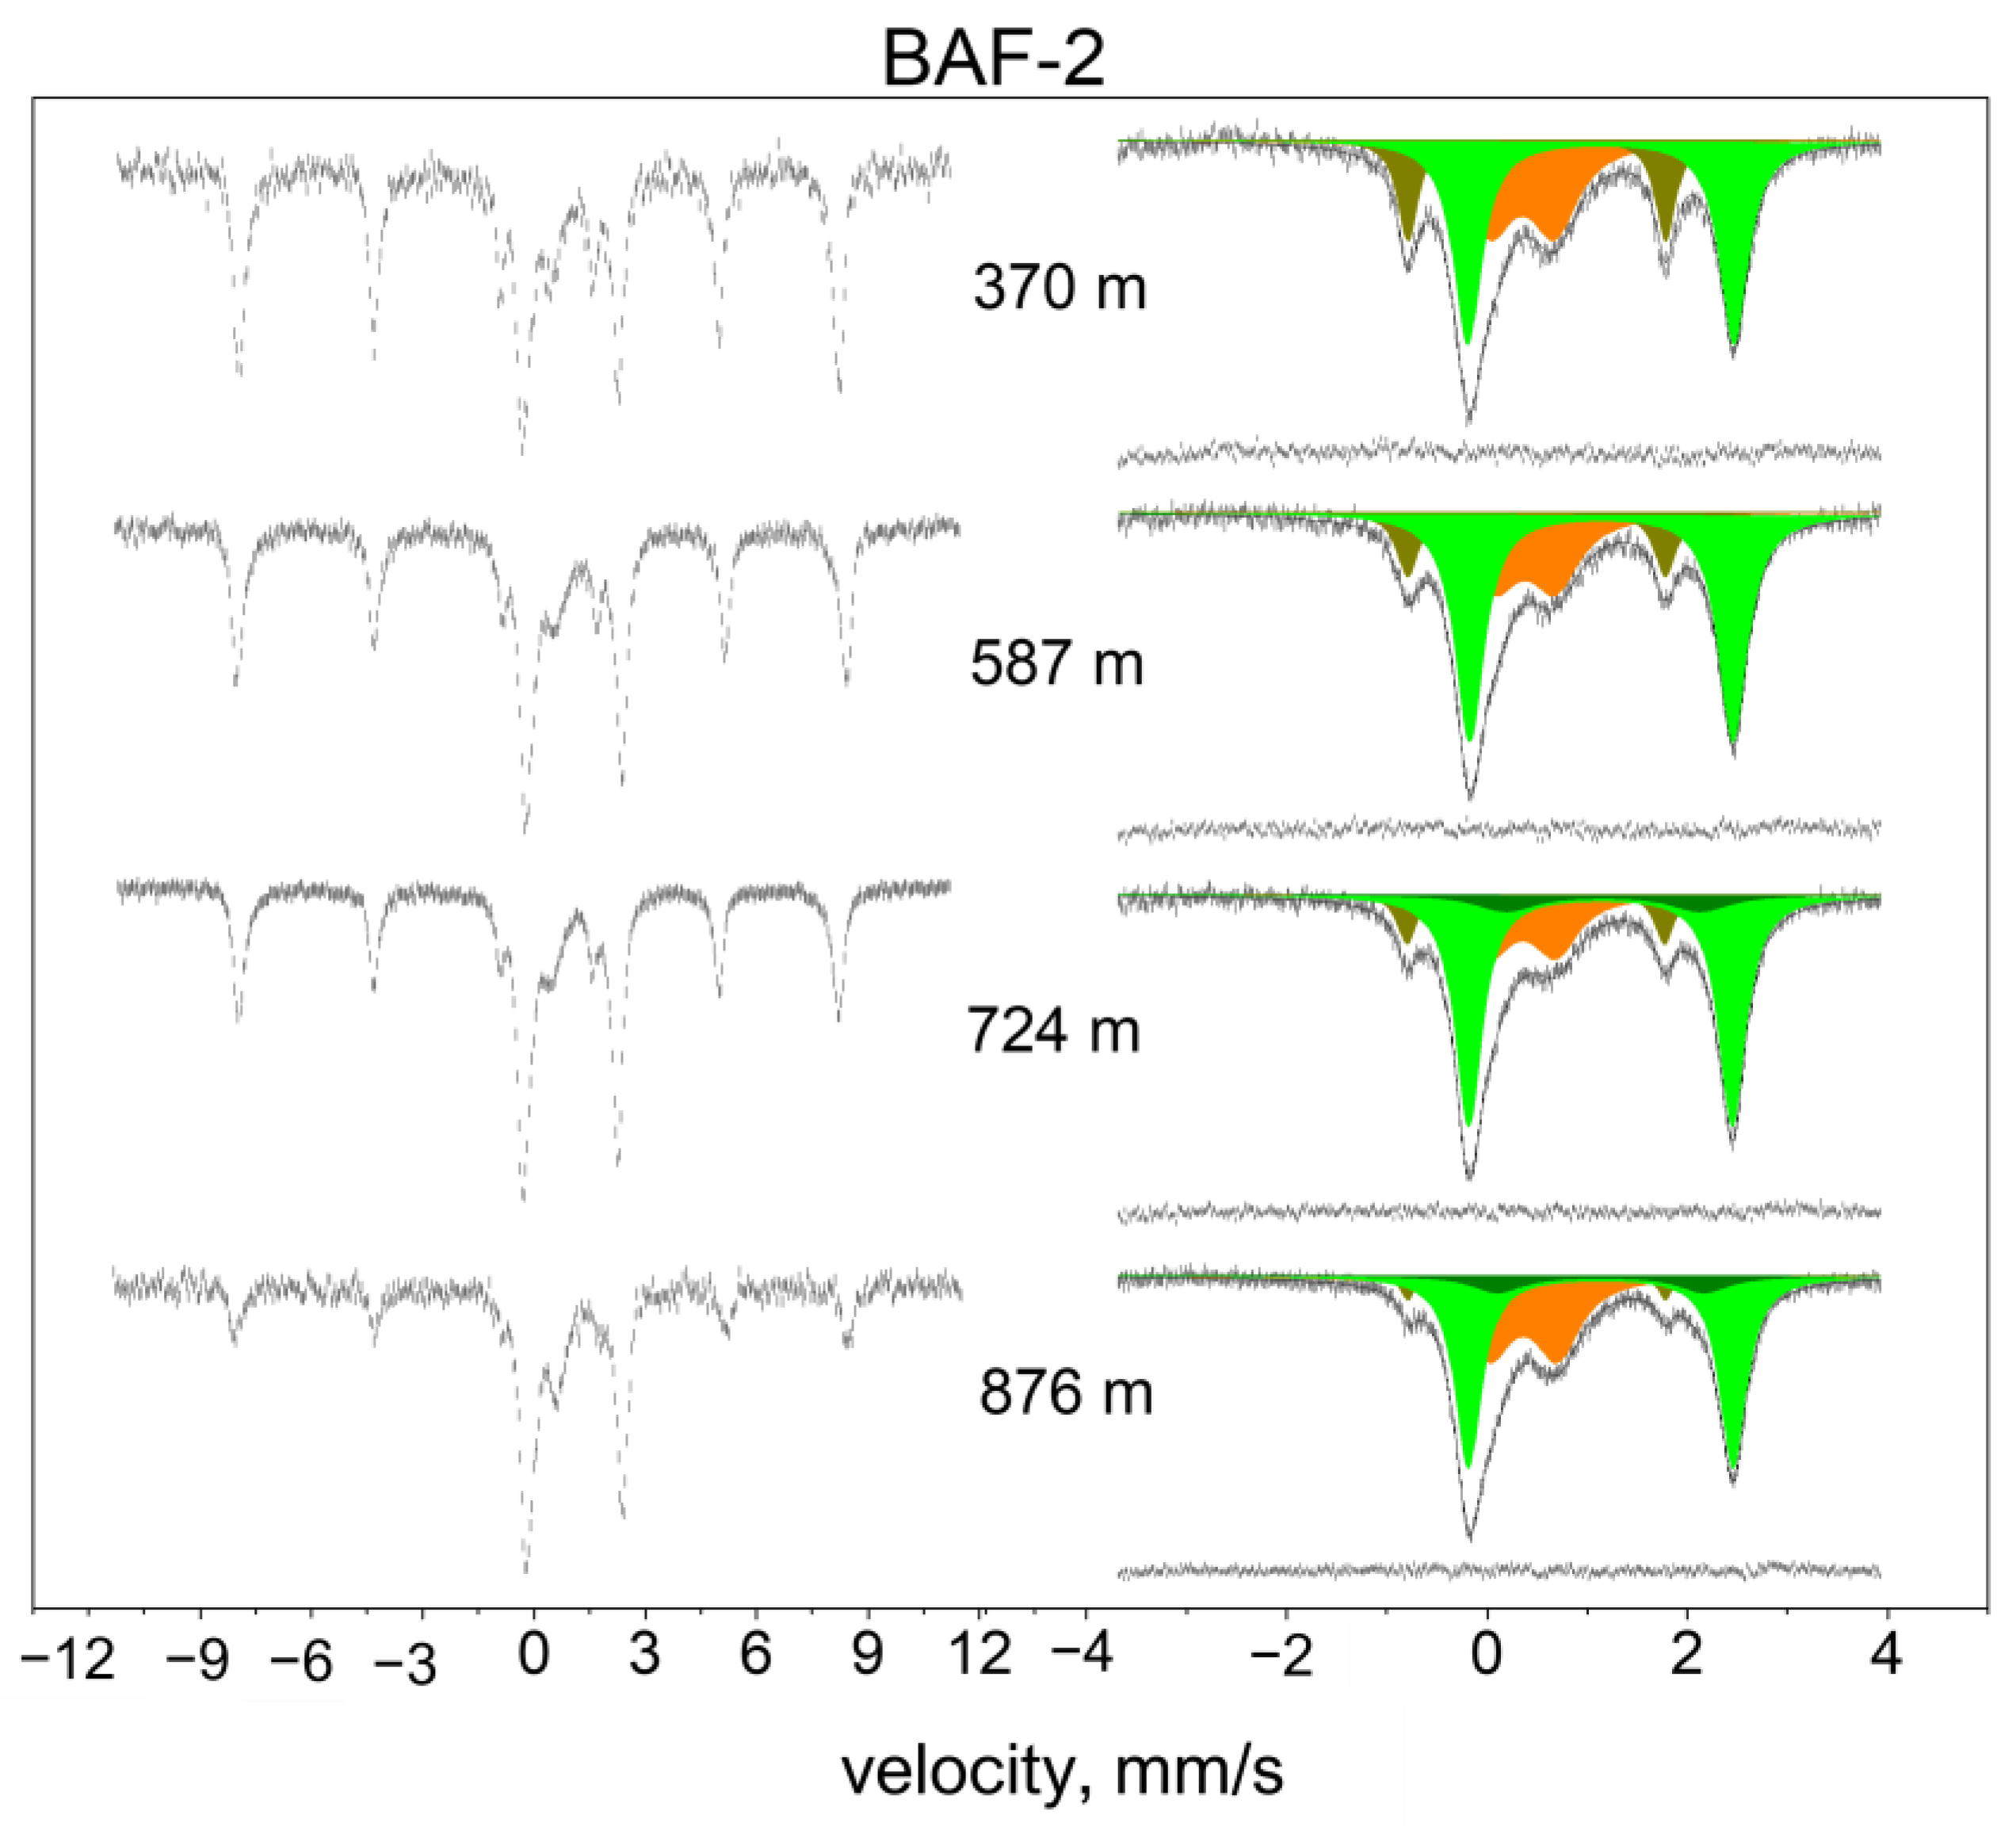
3+ iron in sheet silicates (from Mössbauer). In BAF-2 and BAF-3A 15–33% illite content is correlated only with 20–30% Fe3+. In reverse, Fe2+ is in good agreement with chlorite in BAF-2 and BAF-3A, the 10–15% amount of chlorite corresponds to 30–50% Fe2+ in sheet silicates. On the other side, the 20–40% illite content corresponds only to 20–30% Fe3+ in layered silicates of the latter two borecores. These correlations confirm the presumption that illite contains mostly Fe3+ and, in reverse, the dominant form of iron in chlorite is Fe2+.
Samples from the Gorica Block (Ib-4) and the two WMA (BAF-2 and BAF-3A) sources can be compared from further aspects. Fe3+ is predominant in Ib-4 in comparison to Fe2+, and in reverse, Fe2+ is predominant over Fe3+ in BAF-2 and BAF-3A. The conversion of ferrous iron to ferric one in sheet silicates was less expressed in the WMA region or more probably, the reducing environment sustained longer for the WMA section, the burial took place to larger depths and the process was longer. In contrast, the percentage of iron located in hematite is similar for both regions. Thus, once stable hematite was formed, its state was preserved. On the other side, iron in layered silicates was probably more sensible to changes in the local environment. This can be in correspondence with other observations. Namely, structural iron in smectite is reduced than in pure oxides [43], i.e., the similar hematite content can be accompanied by different Fe2+/Fe3+ occurrences in illite/chlorite. Further, the reduction of structural Fe3+ may proceed with interfacial electron transfer as the Mössbauer studies demonstrated [44].

5. Conclusions

The stages of transformation of sheet silicates in the genesis of BCF were followed from the parent biotite group minerals to illite and chlorite by following the changes in the state of iron ions with emphasis on the Fe2+/Fe3+ redox processes. The dominant source of iron is biotite minerals and amphibole present in the precursor rocks. Ferrous iron is removed in part from the T-O-T sheets and hematite is formed and stabilized quickly during erosion and weathering. The silicates undergo a series of transformations, mostly by changing the interlayer cations and, finally, illite is formed. Both ferric and ferrous states can be stabilized in the inner octahedral positions of aluminosilicate sheets. It should be taken into account that application of the Mössbauer method results in specific amplification for detection of hematite phase, due to high partial iron content of this mineral. The sensitivity is 6–8 times smaller for determining mineral compositions in sheet silicates by applying the method.
In the parent rocks biotite group minerals were identified as containing iron with parameters of δ ≈ 1.1 mm s−1 and Δ ≈ 2.6 mm s−1 of Fe2+ doublet characteristic for cis-M2 octahedral sites. This doublet was retained (or restored) in smaller or larger extents during transformations, i.e., the layered silicate structure was preserved at least in part. The oxidation state of iron varied, and a part of it was removed during illite formation and formed stable interlayer hematite.
In addition, samples originating from the two separate Gorica and WMA regions are different with respect to illite/chlorite distribution: the former one is richer in illite and, in agreement, the Fe3+ content is larger in comparison to WMA samples in which the chlorite content is more significant with higher Fe2+ content.
In interpreting these results, it should be taken into account that the validity of these findings is restricted only to iron-bearing minerals represented in the whole BCF rock with only 3–6 mass % content of iron. Biotite group minerals and amphibole participate in several other processes, and significant amounts of sheet silicates are also formed in other transformations without any role of iron. With more general methods (XRD and HRTEM, for instance) far broader scope of mineral transformations can be tracked. In our present study, a particular insight provided by the Mössbauer technique was utilized to follow the Fe2+/Fe3+ conversions and changes in the coordination of iron ions. Samples collected from large-scale regions were compared in the present study. This method is probably applicable to following local changes connected to iron, e.g., cracks, fractures and fissures, for which studies can be attempted in the future.
The presented results obtained from the particular aspect of iron are in good correspondence with the general view elaborated for the evolution of BCF [24,26,27].

Author Contributions

Conceptualization, K.L. and Z.M.; methodology, K.L., T.N., V.K.-K. and I.K.; resources, Z.M.; investigation and data curation, K.L., Z.M., V.K.-K., T.N., I.K. and S.S.; writing—original draft preparation, K.L. and Z.M.; writing—review and editing, K.L. All authors have read and agreed to the published version of the manuscript.

Funding

This research received no external funding.

Data Availability Statement

The data presented in this study are available on request from the corresponding author (the used data were selectively compiled from different sources).

Acknowledgments

The authors are thankful to Boglárka Maróti for performing the XRF analyses for the Üh-27, Bek-8, PGI-1 and 9018 samples.

Conflicts of Interest

Zoltán Máthé is a retiree of the Mecsekérc Environmental Ltd. This paper reflects the view of the scientists and not the company. The remaining authors declare that the research was conducted in the absence of any commercial or financial relationships that could be construed as potential conflicts of interest.

References

  1. Arkai, P.; Balogh, K.; Demény, A.; Fórizs, I.; Nagy, G.; Máthé, Z. Composition, diagenetic and post-diagenetic alterations of a possible radioactive waste repository site: The Boda Albitic Claystone Formation, suthern Hungary. Acta Geol. Hung. 2000, 43, 351–378. [Google Scholar]
  2. Altmann, S.; Tournassat, C.; Goutelard, F.; Parneix, J.C.; Gimmi, T.; Maes, N. Diffusion-driven transport in clayrock formations. Appl. Geochem. 2012, 27, 463–478. [Google Scholar] [CrossRef]
  3. Lázár, K.; Máthé, Z. Claystone as a potential host rock for nuclear waste storage, Chapter 4. In Clay Minerals in Nature—Their Characterisation, Modification and Application; Valaskova, R., Ed.; IntechOpen: Rijeka, Croatija, 2012; pp. 55–80. [Google Scholar]
  4. Lovász, V.; Halász, A.; Molnár, P.; Karsa, R.; Halmai, Á. Application of a CNN to the Boda Claystone Formation for high–level radioactive waste disposal. Sci. Rep. 2023, 13, 5491. [Google Scholar] [CrossRef] [PubMed]
  5. Lázár, K.; Máthé, Z.; Földvári, M. Various redox conditions in Boda Claystone as reflected in the change of Fe2+/Fe3+ ratio in clay minerals. J. Phys. Conf. Ser. 2010, 217, 012053. [Google Scholar] [CrossRef]
  6. Heller-Kallai, L.; Rozenson, I. The use of Mössbauer spectroscopy of iron in clay mineralogy. Phys. Chem. Miner. 1981, 7, 223–238. [Google Scholar] [CrossRef]
  7. Murad, E. Clays and clay minerals: What can Mössbauer spectroscopy do to help understand them? Hyperfine Interact. 1998, 117, 39–70. [Google Scholar] [CrossRef]
  8. Rancourt, D.G. Mössbauer spectroscopy in clay science. Hyperfine Interact. 1998, 117, 3–38. [Google Scholar] [CrossRef]
  9. Meunier, A.; Velde, B. Illite; Springer: Berlin/Heidelberg, Germany, 2004. [Google Scholar]
  10. Cuadros, J.; Michalski, J.R.; Dyar, M.D.; Dekov, V. Controls on tetrahedral Fe(III) abundance in 2:1 phyllosilicates. Am. Mineral. 2019, 104, 1608–1619. [Google Scholar] [CrossRef]
  11. Charlet, L.; Tournassat, C.; Grenèche, J.M.; Wersin, P.; Géhin, A.; Hadi, J. Mössbauer spectrometry insight into the redox reactivity of Fe-bearing phases in the environment. J. Mater. Res. 2023, 38, 958–973. [Google Scholar] [CrossRef]
  12. Forshaw, J.B.; Pattison, D.R.M. Ferrous/ferric (Fe2+/Fe3+) partitioning among silicates in metapelites. Contrib. Mineral. Petrol. 2021, 176, 63. [Google Scholar] [CrossRef]
  13. Buda, G.; Puskás, Z. Crystalline rocks of Üveghuta-1 borehole. In Annual Report of the Geological Institute of Hungary, 1996/II; MÁFI: Budapest, Hungary, 1997; pp. 77–93. [Google Scholar]
  14. Buda, G.; Puskás, Z.; Gál-Solymos, K.; Klötzli, U.; Cousens, B.L. Mineralogical, petrological and geochemical characteristics of crystalline rocks of the Üveghuta boreholes (Mórágy Hills, South Hungary). In Annual Report of the Geological Institute of Hungary, 1999; MÁFI: Budapest, Hungary, 2000; pp. 231–243. [Google Scholar]
  15. Király, E.; Gulácsi, Z.; Koroknai, B. (Eds.) Integrated Assessment of Mórágy Granite Formation (Report, RHK-K-010/08) Puram; MÁFI: Budapest, Hungary, 2008. (In Hungarian) [Google Scholar]
  16. Szemerédi, M.A. Results of the complex analyses of the Gyűrűfű Rhyolite Formation in the Tisza Mega-unit (Hungary). Ph.D. Thesis, University of Szeged, Szeged, Hungary, 2020. [Google Scholar]
  17. Szemerédi, M.; Lukács, R.; Varga, A.; Dunkl, I.; Józsa, S.; Tatu, M.; Pál-Molnár, E.; Szepesi, J.; Guillong, M.; Szakmány, G.; et al. Permian felsic volcanic rocks in the Pannonian Basin (Hungary): New petrographic, geochemical, and geochronological results. Int. J. Earth Sci. 2020, 109, 101–125. [Google Scholar] [CrossRef]
  18. Árkai, P. Polymetamorphic evolution of the South-Hungarian crystalline basement, Pannonian basin: Geothermometric and geobarometric data. Acta Geol. Hung. 1985, 23, 165–190. [Google Scholar]
  19. Szederkényi, T. Metamorphic formations and their correlation in the Hungarian part of Tisia Megaunit (Tisia Composite Terrane). Acta Mineral. Petrogr. Szeged 1996, 37, 143–160. [Google Scholar]
  20. Shchipalkina, N.V.; Pekov, I.V.; Britvin, S.N.; Koshlyakova, N.N.; Vigasina, M.F.; Sidorov, E.G. A new mineral ferrisanidine, K[Fe3+Si3O8], the first natural feldspar with species-defining iron. Minerals 2019, 9, 770. [Google Scholar] [CrossRef]
  21. Velde, B.; Meunier, A. The Origin of Clay Minerals in Soils and Weathered Rocks; Springer: Berlin/Heidelberg, Germany, 2008. [Google Scholar]
  22. Stucki, J.W.; Goodman, B.A.; Schwertmann, U. (Eds.) Iron Is Soils and Clay Minerals; NATO ASI Ser. C; Springer Science & Business Media: Berlin, Germany, 1985; Volume 217. [Google Scholar]
  23. Buda, G.; Koller, F.; Ulrych, J. Petrochemistry of Variscan granitoids of Central Europe: Correlation of Variscan granitoids of the Tisia and Pelsonia Terranes with granitoids of the Moldanubicum, Western Carpahtian and Southern Alps. Acta Geol. Hung. 2004, 47, 117–138. [Google Scholar] [CrossRef]
  24. Máthé, Z. Results of Mineralogical, Petrological and Geochemical Investigation of Boda Claystone Formation. Ph.D. Thesis, Etövös Loránd University, Budapest, Hungary, 2015. Summary in English. Available online: http://teo.elte.hu/minosites/tezis2015_angol/z_mathe.pdf (accessed on 1 February 2021).
  25. Konrád, G.; Sebe, K.; Halász, A.; Babinszki, E. Sedimentology of a Permian playa lake: The Boda Claystone Formation, Hungary. Geologos 2010, 16, 27–41. [Google Scholar] [CrossRef]
  26. Varga, A.R.; Szakmány, G.; Raucsik, B.; Máthé, Z. Chemical composition, provenance and early diagenetic processes of playa lake deposits from the Boda Siltstone Formation (Upper Permian), SW Hungary. Acta Geol. Hung. 2005, 48, 49–68. [Google Scholar] [CrossRef]
  27. Varga, A.; Raucsik, B.; Szakmány, G.; Máthé, Z. Mineralogical, petrological and geochemical characteristics of the siliciclastic rock types of Boda Siltstone Formation. Bull. Hung. Geol. Soc. 2006, 136, 201–232. [Google Scholar]
  28. Németh, T.; Máthé, Z.; Pekker, P.; Dódony, I.; Kovács-Kis, V.; Sipos, P.; Cora, I.; Kovács, I. Clay Mineralogy of the Boda Claystone Formation (Mecsek Mts., SW Hungary). Open Geosci. 2016, 8, 259–274. [Google Scholar] [CrossRef]
  29. Kulcsár, K.; Nagy, D.L.; Pócs, L. A Complete Package of Programs for the Evaluation of Mössbauer and Gamma Spectra; KFKI Report; Központi Fizikai Kutató Intézet: Budapest, Hungary, 1971; Volume 67. [Google Scholar]
  30. Klencsár, Z. MossWinn Manual. Available online: http://www.mosswinn.hu/downloads/mosswinn.pdf (accessed on 2 February 2019).
  31. Murad, E.; Cashion, J. Mössbauer Spectroscopy of Environmental Materials and Their Industrial Utilization; Springer: Berlin/Heidelberg, Germany, 2004. [Google Scholar]
  32. Lázár, K.; Megyeri, J.; Szarvas, T.; Parneix, J.-C.; Máthé, Z. Diffusion of HTO, 99TcO4 and H14CO3 in Boda Claystone samples: Composition, porosity and break-through measurements. In Proceedings of the 3rd Annual Workshop Proceedings, 6th EC FP FUNMIG IP, Edinburgh, Scotland, 26–29 November 2007; Buckau, G., Kienzler, B., Duro, L., Eds.; NDA Report: Dublin, Ireland, 2008; pp. 185–190. [Google Scholar]
  33. De Grave, E.; Van Alboom, A. Evaluation of ferrous and ferric Mössbauer fractions. Phys. Chem. Miner. 1991, 18, 337–342. [Google Scholar] [CrossRef]
  34. Dyar, M.D.; Sklute, E.C.; Schaefer, M.W.; Bishop, J.L. Mössbauer spectroscopy of clay minerals at variable temperatures. Lunar Planet. Sci. 2007, XXXVIII, 2282. [Google Scholar]
  35. Nesse, W.D. Introduction to Mineralogy; Oxford University Press: New York, NY, USA, 2000. [Google Scholar]
  36. Illite Mineral Data. Available online: www.mindat.org/min-2011.html (accessed on 10 January 2024).
  37. Illite Mineral Data. Available online: https://webmineral.com/data/Illite.shtml (accessed on 1 May 2023).
  38. Klein, C.; Hurlbut, C.S., Jr. Manual of Mineralogy, 21st ed.; Wiley: Northamptonshire, UK; New York, NY, USA, 1993. [Google Scholar]
  39. Elliott, W.C.; Matisoff, G. Evaluation of kinetic models for the smectite to illite transformation. Clays Clay Miner. 1996, 44, 77–87. [Google Scholar] [CrossRef]
  40. Kim, J.; Dong, H.; Yang, K.; Park, H.; Elliott, W.C.; Spivack, A.; Koo, T.H.; Kim, G.; Morono, Y.; Henkel, S.; et al. Naturally occuring, microbially induced smectite-to-illite reaction. Geology 2019, 47, 535–539. [Google Scholar] [CrossRef]
  41. Dyar, M.D. Mössbauer spectra of biotites from metapelites. Am. Mineral. 1990, 75, 656–666. [Google Scholar]
  42. Della Ventura, G.; Redhammer, G.J.; Robert, J.-L.; Sergent, J.; Iezzi, G.; Cavallo, A. Crystal-chemistry of synthetic amphiboles along the Rictherite—Ferro-Richterite join: A combined spectroscopic (FTIR, Mössbauer), XRPD, and microchemical study. Can. Mineral. 2016, 54, 97–114. [Google Scholar] [CrossRef]
  43. Favre, F.; Stucki, J.W.; Boivin, P. Redox properties of stuctural iron in ferruginous smectite. A discussion of the standard potential and its environmental implications. Clays Clay Miner. 2006, 54, 466–472. [Google Scholar] [CrossRef]
  44. Schaefer, M.V.; Gorski, C.A.; Scherer, M.M. Spectroscopic evidence for interfacial Fe(II)-Fe(III) electron transfer in a clay mineral. Environ. Sci. Technol. 2011, 45, 540–545. [Google Scholar] [CrossRef] [PubMed]
Figure 1. Location of the Western Mecsek Mts. within Hungary (A). Scope of the Boda Claystone Formation (B) based on [26]. Legend: 1, Paleozoic formations in general; 2, Boda Claystone Formation; 3, Late Permian Kővágószőlős Sandstone Formation; 4, Triassic sediments (sandstones, carbonates, evaporites); 5, Jurassic and Cretaceous sediments; 6, Neogene sediments; 7, fault; 8, strike-slip fault; 9, thrust fault; 10, syncline and anticline with the trend of the fold axis; 11, locations of boreholes from which the samples were obtained.
Minerals 14 00196 g001
Figure 2. Photographs of borecores. Cross-section of the albitic claystone, the most common rock type of BCF. The typical reddish brown color originates from hematite (sample from borehole BAF-3A, 870.80–870.94 m, (a) top). Thin sandstone layer containing mica platelets is embedded into the BCF host at the 716.4 m section of borecore BAF-3 with simultaneous presence of components being in different various stages of transformation, (b) bottom.
Minerals 14 00196 g002
Figure 3. XRD diffractograms collected on granitic (Üh-27, Bek-8), rhyolitic (9018a) and metamorphic (PGI-1) samples (kfs: potassium feldspar).
Minerals 14 00196 g003
Figure 4. Mössbauer spectra of the starting primary rocks (Fe3+ ochre, Fe3+ in hematite: dark yellow, Fe2+(1) green, Fe2+(2) olive, Fe2+(3) dark green). The upper four spectra were recorded in the ±4 mm s−1 velocity range, containing only the two central peaks of hematite (top scale); the bottom spectrum in the ±6 velocity range, containing the four middle peaks of hematite (bottom scale).
Minerals 14 00196 g004
Figure 5. Hematite in the Ib-4 (570 m sample). 3D microtomographic XRD image displaying hematite inclusions in a cubic segment with 200-micron edges ((a), left, adopted from [32]). The corresponding Mössbauer spectrum ((b), right). Two different sextets of hematite are shown, marked in brown and in dark yellow.
Minerals 14 00196 g005
Figure 6. HRTEM image of Ib-4 (578 m) sample ((a), left, black arrows: illite platelets) and the corresponding SAED pattern obtained from layers stacked in 10 Å repetition sequences, characteristic of illite (inset). Presence of thin hematite flakes wedged into illite layers is represented in the right image ((b), reproduced with open access license from [28]).
Minerals 14 00196 g006
Figure 7. Selected typical Mössbauer spectra collected on samples of Ib-4 borecore from different depths recorded in two different velocity ranges ±12 mm/s (left) and for better resolution for the central part in ±4 mm/s (right). (Doublets in silicates—ochre: Fe3+(1), yellow: Fe3+(2), green: Fe2+, respectively, and dark yellow: middle 3 and 4 lines of hematite).
Minerals 14 00196 g007
Figure 8. Spectra of selected typical samples obtained from different depths of BAF-2 and BAF-3A borecores ((top) and (bottom), respectively, ochre: Fe3+ and green: Fe2+ doublets in silicates, brown: central 3 and 4 lines of hematite).
Minerals 14 00196 g008aMinerals 14 00196 g008b
Figure 9. XRD diffractograms of every second sample reported in Table 9.
Minerals 14 00196 g009
Figure 10. HRTEM images obtained on the BAF-3A 998 m (top) and on 1252 m samples (bottom). Approximately 60 nm thick chlorite platelet is shown in the top left panel. Several T-O-T (10 Å) interstratifications of illite in chlorite (T-O-T-O, 14 Å) are marked in the top right panel. EDS spectrum of the chlorite region shown at the top is displayed in the middle panel. Presence of larger hematite particles is revealed in bottom left and simultaneous appearance of illite and chlorite is shown in bottom right.
Minerals 14 00196 g010aMinerals 14 00196 g010b
Figure 11. Comparison of distribution of iron among Fe2+and Fe3+ doublets and hematite sextets in Mössbauer spectra (upper part of plots) and the corresponding mineral compositions for illite, chlorite and hematite obtained from XRD diffractograms (lower part of plots) for the Ib-4 (top) BAF-2 (middle) and BAF-3A (bottom) samples. Approximate error in data points is 5%. (Solid lines are shown only to guide the view.)
Minerals 14 00196 g011aMinerals 14 00196 g011b
Table 1. Chemical compositions of studied samples expressed in oxides in wt%. Data for Ib-4, BAF-2 and BAF-3A are adopted from Ref. [24].
SampleSiO2Al2O3Fe2O3totMgOCaOK2ONa2OMnOTiO2CO2Ign. Loss a
Üh-27 (204.5 m) b67.9314.644.22<LOD2.0811.13n.d.0.040.40--
Bek-8 (54.9 m) b69.0612.425.07<LOD4.3114n.d.0.080.50--
PGI-1 (1726 m) b68.5614.049.06<LOD0.987.36n.d.0.100.63--
9018 (324 m) b76.5513.032.62<LOD1.626.18n.d.0.040.20--
BAF-4 (898 m)74.9713.271.840.710.525.580.910.020.200.561.9
Ib-4
510.9 m49.4216.936.104.273.726.241.070.080.713.0211.6
538.8 m52.5615.796.523.933.724.062.670.110.713.469.9
560.8 m49.3216.767.533.503.454.713.370.100.753.169.9
588.1 m47.8315.957.425.134.803.943.370.1040.813.3610.1
612.7 m49.8015.927.375.594.814.622.110.0920.913.368.4
655.0 m53.6711.605.190.9311.530.646.530.2080.936.707.5
708.0 m56.2411.162.890.5312.310.526.840.1530.395.986.8
BAF-2
369.9 m51.4516.878.333.673.315.462.270.070.891.986.6
587.0 m50.7116.618.094.594.364.582.520.090.902.976.9
647.5 m51.5116.748.175.013.594.212.490.100.972.426.5
724.0 m51.7317.228.714.292.335.462.070.050.922.426.8
876.2 m50.7316.688.214.673.185.761.330.080.942.347.5
BAF-3A
870.8 m51.9416.138.263.883.864.103.120.100.822.956.7
974.9 m55.3515.697.243.773.383.942.820.070.812.496.3
997.7 m54.6214.975.923.735.173.141.470.090.754.3110.4
1017.2 m54.5216.097.993.883.024.232.570.060.922.676.0
1196.8 m54.0217.007.593.823.005.051.870.060.832.486.1
1231.3 m54.3618.918.124.350.745.291.730.031.071.014.9
1252.2 m54.5518.748.103.700.975.531.600.040.911.195.2
a Ignition loss: weight loss upon heating to 1050 °C, %, b measured with Innov X Delta Premium device (Z ≤ 12 elements (e.g., Na) are out of sensitivity range, LOD: limit of detection, for Mg 4.4 wt%.).
Table 2. Mineral compositions of Bek-8, PGI-1, Üh-27, 9018 and BAF-4 samples derived from the XRD diffractograms (in wt%).
QuartzAlbiteK-FeldsparMicaChloriteAmphibole
(Hornblende)
Bek-8 (granite)123248314
Üh-27 (granite)23358151
PGI-1 (metam.)40325203-
9018a (rhyolite)30421810--
BAF-4 (rhyolite)47133010--
Table 3. Parameters extracted from spectra of Figure 4.
SampleComp.δ aΔ bFwhm cRel.int. d
Üh-27Fe3+(1)0.270.690.9825.0
(204.5 m)Fe3+(2)0.362.030.18  3.8
graniteFe2+(1)1.132.630.3163.8
Fe2+(2)0.992.110.37  7.3
Bek-8Fe3+0.330.710.6828.3
(54.9 m)Fe2+(1)1.122.670.3251.6
graniteFe2+(2)1.082.150.4020.1
PGI-1Fe3+0.310.340.9018.5
(1726 m)Fe2+(1)1.112.620.3045.4
metam.Fe2+(2)1.072.260.3527.2
Fe2+(3)1.181.740.23  8.8
BAF-4Fe3+0.270.820.7020.5
(898 m)Fe3+(H) e,f0.572.750.2666.7
rhyoliteFe2+(1)1.162.780.21  4.8
Fe2+(2)1.121.270.21  8.0
9018Fe3+(H) f,g0.55 -0.2774.6
(324 m)Fe3+0.220.690.4916.5
rhyoliteFe2+1.171.690.68  8.9
a Isomer shift, mm s−1, b quadrupole splitting, mm s−1, c full-line width at half maximum, mm s−1, d relative intensity, %, e Fe3+(H): presence of hematite is deduced from appearance of the 3, 4 central peaks of sextet with apparent δ and Δ, f the relative intensity is estimated for the corresponding full six-line sextet of hematite, g only the inner four (2,3,4,5) peaks of hematite are shown with apparent δ.
Table 4. Mineral compositions of Ib-4 samples determined by XRD (mass %).
Depth (m)IlliteChloriteSmect. aAnalcimeQuartzAlbiteCalciteDolom bHematite
505.3353 1892285
510.9752 1012
527.3402 121381446
538.8322 2828710tr. c5
553.435121814111027
560.6403 2031610<18
569.93322231112917
578.436 14101816 6
655.330222153410 5
572.1403 188179 5
588.240 31282410 3
597.340 2133010 5
612.927148123410 4
628.728 47133310 5
658.7353 1510229 6
670.03223117347 4
684.5121 23528 4
708.1tr. c 216613
a smectite, b dolomite, c traces.
Table 5. Data extracted from series of ±4 mm s−1 Mössbauer spectra of Ib-4 samples.
Depth Componentδ aΔ bFwhm cRel. Int. d
510.9 mFe3+(1)0.300.840.5133.2
Fe3+(2)0.330.430.3820.4
Fe2+1.312.240.4917.0
hematite e0.492.580.2329.4
538.8 mFe3+(1)0.310.870.4818.3
Fe3+(2)0.340.440.4221.1
Fe2+1.282.270.519.1
hematite e0.492.550.2551.4
560.8 mFe3+(1)0.300.860.4517.6
Fe3+(2)0.330.440.4224.8
Fe2+1.302.220.4810.3
hematite e0.492.570.2547.3
588.1 mFe3+(1)0.310.860.4216.9
Fe3+(2)0.340.430.4232.5
Fe2+1.322.250.47 9.3
hematite e0.502.580.2541.3
612.7 mFe3+(1)0.280.880.4618.4
Fe3+(2)0.300.450.3612.8
Fe2+1.322.240.41 8.8
hematite e0.492.540.2560.0
655.0 mFe3+(1)0.360.380.3526.5
Fe3+(2)0.350.630.52 6.8
Fe2+1.302.260.4311.2
hematite e 0.492.550.2555.5
a Isomer shift, mm s−1, b quadrupole splitting, mm s−1, c full line width at half maximum, mm s−1, d relative intensity, %, e apparent isomer shift and quadrupole splitting values for the central 3 and 4 lines of hematite with corrected full intensity values for the sextet.
Table 6. Data obtained from decompositions of series of Mössbauer spectra of samples from BAF-2 and BAF-3A borecores.
BAF-2Componentδ aΔ bFwhm cRel. Int. d
370 mFe3+0.360.650.5918.2
Fe2+1.142.660.3525.7
hematite e0.52.580.2656.1
415 mFe3+0.370.610.5715.2
Fe2+1.132.610.3534.5
hematite e0.492.550.2650.2
587 mFe3+0.370.600.6018.2
Fe2+1.132.620.3635.5
hematite e0.492.560.2846.4
647.5 mFe3+0.390.660.5621.7
Fe2+(1)0.972.530. 21 3.4
Fe2+(2)1.152.630.3037.6
hematite e0.502.580.2737.2
724 mFe3+0.380.600.6016.3
Fe2+1.122.610.3547.3
hematite e0.482.560.2736.4
876.2 mFe3+0.380.660.5830.5
Fe2+(1)1.122.310.51 9.2
Fe2+(2)1.142.650.3140.2
hematite e0.52.580.1820.1
BAF-3A
870.8 mFe3+0.350.660.6819.5
Fe2+1.122.630.3428.3
hematite e0.472.560.2450.4
974.9 mFe3+0.350.660.6621.2
Fe2+1.132.620.3632.2
hematite e0.492.570.2746.6
997.7 mFe3+0.320.630.4522.2
Fe2+1.122.620.3431.7
hematite e0.482.570.2545.4
1017.2 mFe3+0.360.700.7124.3
Fe2+(1)1.152.660.3128.6
Fe2+(2)1.152.280.45 6.8
hematite e0.512.580.2440.2
1196.8 mFe3+0.370.650.6624.1
Fe2+(1)1.152.660.3827.5
Fe2+(2)1.102.240.53 3.6
hematite e0.512.570.2544.8
1231.3 mFe3+0.340.670.6726.4
Fe2+(1)1.132.640.3244.3
Fe2+(2)1.082.240.41 4.5
hematite e0.482.590.2124.7
1252.2 mFe3+0.350.590.6523.4
Fe2+(1)1.122.660.3731.7
Fe2+(2)0.912.060.34 2.3
hematite e0.482.570.2542.6
a Isomer shift, mm s−1, b quadrupole splitting, mm s−1,c FWHM, full line width at half maximum, mm s−1, d relative intensity, %, e apparent isomer shift and quadrupole splitting values for the central 3 and 4 lines of hematite with corrected full intensity values for the full sextet.
Table 7. Comparison of parameters of 77 K and 300 K spectra of BAF-3A (998 m) sample.
Temp. Comp.δ aΔ bMHF cFwhm dRel. Int. e
77 KFe3+ (H) f0.440.2452.70.4844.2
Fe3+0.380.68-0.6824.7
Fe2+1.212.85-0.4831.1
300 KFe3+ (H) f0.360.2351.10.3344.1
Fe3+0.340.65-0.5023.2
Fe2+1.132.63-0.3632.7
a Isomer shift, mm s−1, b quadrupole splitting, mm s−1, c magnetic hyperfine field, Tesla, d full linewidth at half maximum, mm s−1, e relative intensity, %, f Fe3+ in hematite.
Table 8. Mineral compositions of BAF-2 samples determined by XRD (mass %, with 5% error).
Depth (m)VermiculiteIlliteChloriteQuartzAlbiteCalciteHematite
10.310387102249
43.3dl. *4113122155
83.2dl.3214122688
151.83133118263dl.
369.823312827610
385.1128181025106
480.5221231226106
586.1328161222127
647.531417253353
725.5310171934116
791.6315112136114
876.2dl.2816251564
908.521512243763
* dl: detection limit.
Table 9. Mineral compositions of BAF-3A samples determined with XRD (mass %, with 5% error).
Depth, mQuartzAlbiteK-FeldsparIlliteChloriteCalciteDolomiteHematite
854.8 44-23108-6
870.9740-3088-7
874.91337-26117-6
997.7 *22131120712-6
1017.21332-32125-6
1140.91848-1010374
1196.81320-45106-6
1231.41322143016-14
1252.21417-4515-36
1270.512171330182-8
1303.91016-4515-86
* with 10% exceptional smectite content.
Table 10. Approximate formulas obtained from elemental compositions extracted from TEM EDS analysis performed on chlorite and illite regions. The error in determination of elements is 6–8 relative percent.
SampleCharacter Composition
998/aChloriteNa0.17Ca0.25(Mg2.77Fe1.30Al1.34)[Al0.68Si3.32O10] (OH)8
998/billite&smectiteK0.20Na0.24Ca0.24(Mg0.48Fe0.14Al1.27)[Al0.43Si3.57O10] (OH)2
998/cillite&smectiteK0.53Na0.14Ca0.14(Mg0.44Fe0.19Al1.37)[Al0.35Si3.65O10] (OH)2
998/dillite&smectiteK0.12Na0.3Ca0.08(Mg0.44Fe0.12Al1.50)[Al0.37Si3.63O10](OH)2
1252/aChloriteK0.17Na0.1Ca0.03(Al2.21Mg2.24Fe0.68)[Al0.19Si3.81O10](OH)8
1252/billiteK0.79Na0.08 (H3O)0.13(Mg0.44Fe0.2Al1.37)[Al0.61Si3.39]O10(OH)2
1252/cilliteK0.71Na0.04 (H3O)0.21(Mg0.31Fe0.19Al1.5)[Al0.65Si3.35]O10(OH)2
Disclaimer/Publisher’s Note: The statements, opinions and data contained in all publications are solely those of the individual author(s) and contributor(s) and not of MDPI and/or the editor(s). MDPI and/or the editor(s) disclaim responsibility for any injury to people or property resulting from any ideas, methods, instructions or products referred to in the content.

