

Origin of Zn-Pb Mineralization of the Vein Bt23C, Bytíz Deposit, Příbram Uranium and Base-Metal Ore District, Czech Republic: Constraints from Occurrence of Immiscible Aqueous–Carbonic Fluids
Abstract
:
1. Introduction
2. Background
2.1. Geological Setting
2.2. Ore Mineralization of the Příbram Area
2.3. Vein Bt23C
3. Samples and Analytical Methods
4. Results
4.1. Vein Mineralogy
4.1.1. Stage 1
4.1.2. Stage 2
4.1.3. Stage 3
4.1.4. Baryte
4.2. Fluid Inclusions
4.2.1. Petrography and Typology of Fluid Inclusions
4.2.2. Microthermometry
4.2.3. Raman Spectroscopy
4.3. Stable Isotopes
5. Interpretation and Discussion
5.1. Composition, Trapping Mode, and P–T Conditions of Fluid Inclusions
5.1.1. AC, C, and Ac Inclusions
5.1.2. AL+V and AL Inclusions
5.2. Isotopic Composition of the Fluids
5.3. Possible Sources of the Fluids
5.4. Constraints on Ore Genesis in the Příbram Area
6. Conclusions
Author Contributions
Funding
Data Availability Statement
Acknowledgments
Conflicts of Interest
References
- Litochleb, J.; Černý, P.; Litochlebová, E.; Sejkora, J.; Šreinová, B. The deposits and occurrences of mineral raw materials in the Střední Brdy Mts. and the Brdy piedmont area (Central Bohemia). Bull. Miner.-Petr. Odd. Nár. Muz. 2003, 12, 57–86. (In Czech) [Google Scholar]
- Žák, K.; Dobeš, P. Stable isotopes and fluid inclusions in hydrothermal deposits: The Příbram ore region. Rozpr. Čs. Akad. Věd 1991, 1–109. [Google Scholar]
- Hamet, P. Nature of Fluid Inclusions in Some Hydrothermal Minerals from the Příbram Ore District. Bachelor Thesis, Masaryk University Brno, Brno, Czech Republic, 2013. (In Czech). [Google Scholar]
- Dolníček, Z.; Ulmanová, J.; Sejkora, J.; Knížek, F.; Škácha, P. Mineralogy and genesis of the Pb-Zn-Sb-Ag vein H32A in the Příbram uranium and base-metal district, Bohemian Massif, Czech Republic. Ore Geol. Rev. 2023, 162, 105695. [Google Scholar] [CrossRef]
- Dallmeyer, R.D.; Urban, M. Variscan versus Cadomian tectonothermal activity in northwestern sectors of the Teplá–Barrandian zone, Czech Republic: Constraints from 40Ar/39Ar ages. Geol. Rundsch. 1998, 87, 94–106. [Google Scholar] [CrossRef]
- Zulauf, G.; Schritter, F.; Riegler, G.; Finger, F.; Fiala, J.; Vejnar, Z. Age constraints on the Cadomian evolution of the Teplá–Barrandian unit (Bohemian Massif) through electron microprobe dating of metamorphic monazite. Zt. Deutsch. Geol. Ges. 1999, 180, 627–639. [Google Scholar] [CrossRef]
- Franke, W. The mid-European segment of the Variscides: Tectonostratigraphic units, terrane boundaries and plate tectonic evolution. In Orogenic Processes: Quantification and Modelling in the Variscan Belt; Franke, W., Haack, V., Oncken, O., Tanner, D., Eds.; Special Publications, Geological Society: London, UK, 2000; Volume 179, pp. 35–56. [Google Scholar]
- Dörr, W.; Zulauf, G.; Fiala, J.; Franke, W.; Vejnar, Z. Neoproterozoic to Early Cambrian history of an active plate margin in the Teplá–Barrandian unit—A correlation of U–Pb isotopic dilution-TIMS ages (Bohemia, Czech Republic). Tectonophysics 2002, 352, 65–85. [Google Scholar] [CrossRef]
- Sláma, J.; Dunkley, D.J.; Kachlík, V.; Kusiak, M.A. Transition from island-arc to passive setting on the continental margin of Gondwana: U–Pb zircon dating of Neoproterozoic metaconglomerates from the SE margin of the Teplá–Barrandian Unit, Bohemian Massif. Tectonophysics 2008, 461, 44–59. [Google Scholar] [CrossRef]
- Hajná, J.; Žák, J.; Kachlík, V.; Chadima, M. Deciphering the Variscan tectonothermal overprint and deformation partitioning in the Cadomian basement of the Teplá–Barrandian unit, Bohemian Massif. Int. J. Earth Sci. (Geol. Rundsch.) 2012, 101, 1855–1873. [Google Scholar] [CrossRef]
- Dörr, W.; Zulauf, G. Elevator tectonics and orogenic collapse of a Tibetan-style plateau in the European Variscides: The role of the Bohemian shear zone. Int. J. Earth Sci. (Geol. Rundsch.) 2010, 99, 299–325. [Google Scholar] [CrossRef]
- Holub, F.V.; Cocherie, A.; Rossi, P. Radiometric dating of granitic rocks from the Central Bohemian Plutonic Complex (Czech Republic): Constraints on the chronology of the thermal and tectonic events along the Moldanubian-Barrandian boundary. Compt. Rend. Acad. Sci. Paris Earth Planet. Sci. 1997, 325, 19–26. [Google Scholar] [CrossRef]
- Janoušek, V.; Gerdes, A. Timing the magmatic activity within the Central Bohemian Pluton, Czech Republic: Conventional U–Pb ages for the Sázava and Tábor intrusions and their geotectonic significance. J. Czech Geol. Soc. 2003, 48, 70–71. [Google Scholar]
- Žák, J.; Holub, F.V.; Verner, K. Tectonic evolution of a continental magmatic arc from transpression in the upper crust to exhumation of mid-crustal orogenic root recorded by episodically emplaced plutons: The Central Bohemian Plutonic Complex (Bohemian Massif). Int. J. Earth Sci. (Geol. Rundsch.) 2005, 94, 385–400. [Google Scholar] [CrossRef]
- Janoušek, V.; Wiegand, B.; Žák, J. Dating the onset of Variscan crustal exhumation in the core of the Bohemian Massif: New U–Pb single zircon ages from the high-K calc-alkaline granodiorites of the Blatná suite, Central Bohemian Plutonic Complex. J. Geol. Soc. 2010, 167, 347–360. [Google Scholar] [CrossRef]
- Pešek, J.; Holub, V.; Jaroš, J.; Malý, L.; Martínek, K.; Prouza, V.; Spudil, J.; Tásler, R. Geology and Deposits of the Upper Paleozoic Limnic Basins of the Czech Republic; Czech Geological Survey: Prague, Czech Republic, 2001; 243p. (In Czech)
- Martínek, K.; Blecha, M.; Daněk, V.; Franců, J.; Hladíková, J.; Johnová, R.; Uličný, D. Record of palaeoenvironmental changes in a Lower Permian organic-rich lacustrine succession: Integrated sedimentological and geochemical study of the Rudník member, Krkonoše Piedmont Basin, Czech Republic. Palaeogeogr. Palaeoclimat. Palaeoecol. 2006, 230, 85–128. [Google Scholar] [CrossRef]
- McCann, T. The Geology of Central Europe: Precambrian and Palaeozoic; Geological Society: London, UK, 2008. [Google Scholar]
- Komínek, J. Geology of the Wide Surroundings and of the Deposit, Part I and II. Final Report on the Uranium District Příbram; Unpublished Report; DIAMO: Příbram, Czech Republic, 1995; 418p. (In Czech) [Google Scholar]
- Sejkora, J.; Dolníček, Z.; Zachariáš, J.; Ulmanová, J.; Šrein, V.; Škácha, P. Mineralogical and fluid inclusion evidence for reworking of Au mineralization by Ag-Sb-base metal-rich fluids from the Bytíz deposit, Příbram uranium and base-metal ore district, Czech Republic. Minerals 2022, 12, 1539. [Google Scholar] [CrossRef]
- Píša, M. Minerogenesis of the Pb-Zn deposit in Bohutín near Příbram. Sbor. Geol. Věd, Lož. Geol. 1966, 7, 1–164. (In Czech) [Google Scholar]
- Komínek, J. Paragenetic Sequence of Hydrothermal Minerals at the Příbram Uranium Deposits; Unpublished report; Československý uranový průmysl: Příbram, Czech Republic, 1972. (In Czech) [Google Scholar]
- Blüml, A.; Slačík, J.; Tacl, A. Mineralogical Investigation of the Pošepný Vein at the Vrančice Deposit South of Milín; Unpublished report; Rudné doly: Příbram, Czech Republic, 1975. (In Czech) [Google Scholar]
- Příbram District. Available online: https://www.mindat.org/loc-779.html (accessed on 20 December 2022).
- Žák, K.; Vlašímský, P.; Snee, L.W. 40Ar/39Ar cooling ages of selected rocks of the Příbram ore region and the question of timing of sulfidic hydrothermal mineralization. Geosci. Res. 1997, 172–173. [Google Scholar]
- Kříbek, B. K-Ar mica/illite and Rb-Sr sphalerite dating and geotectonic setting of Late Variscan and Post-Variscan sulphide and uranium mineralizations of the Bohemian Massif (Czech Republic). In Proceedings of the 11th SGA Biennial Meeting, Antofagasta, Chile, 26–29 September 2011; pp. 108–110. [Google Scholar]
- Anderson, E.B. Isotopic-Geochronological Investigation of the Uranium Mineralization of Czechoslovakia; Unpublished Report 1962-87; Czechoslovak Uranium Industry: Příbram, Czech Republic, 1987. [Google Scholar]
- Prokeš, S.; Knížek, F. Polymetallic ore mineralization at the Příbram uranium deposit. Sbor Symp. Horn. Příbram Vědě Techn. Lož. Geol. 1986, 87–99. (In Czech) [Google Scholar]
- Author Collective. General Calculation of Reserves of the Příbram Uranium Deposit to 1.1.1984; Unpublished report; DIAMO SUL: Příbram, Czech Republic, 1984. (In Czech) [Google Scholar]
- Pouchou, J.L.; Pichoir, F. “PAP” (φρZ) procedure for improved quantitative microanalysis. In Microbeam Analysis; Armstrong, J.T., Ed.; San Francisco Press: San Francisco, CA, USA, 1985; pp. 104–106. [Google Scholar]
- Roedder, E. Fluid inclusions. Rev. Mineral. 1984, 12, 1–644. [Google Scholar]
- Goldstein, R.H.; Reynolds, T.J. Systematics of fluid inclusions in diagenetic minerals: SEPM Short Course 31. Soc. Sediment. Geol. 1994, 199. [Google Scholar] [CrossRef]
- Bodnar, R.J. Revised equation and table for determining the freezing point depression of H2O-NaCl solutions. Geochim. Cosmochim. Acta 1993, 57, 683–684. [Google Scholar] [CrossRef]
- Diamond, L.W. Stability of CO2 clathrate hydrate + CO2 liquid + CO2 vapour + aqueous KCl-NaCl solutions: Experimental determination and application to salinity estimates of fluid inclusions. Geochim. Cosmochim. Acta 1992, 56, 273–280. [Google Scholar] [CrossRef]
- Bozzo, A.T.; Chen, J.R.; Barduhn, A.J. The properties of hydrates of chlorine and carbon dioxide. In Proceedings of the 4th International Symposium on Fresh Water from the Sea 3, Heidelberg, Germany, 4–9 September 1973; Delyannis, A., Delyannis, E., Eds.; pp. 437–451. [Google Scholar]
- Bakker, R.J. Package FLUIDS 1. Computer programs for analysis of fluid inclusion data and for modelling bulk fluid properties. Chem. Geol. 2003, 194, 3–23. [Google Scholar] [CrossRef]
- Soave, G. Equilibrium constants from a modified Redlich-Kwong equation of state. Chem. Engineer. Sci. 1972, 27, 1197–1203. [Google Scholar] [CrossRef]
- Duan, Z.; Møller, N.; Weare, J.H. An equation of state for the CH4-CO2-H2O system: II. Mixtures from 50 to 1000 °C and 0 to 1000 bar. Geochim. Cosmochim. Acta 1992, 56, 2619–2631. [Google Scholar] [CrossRef]
- Duan, Z.; Møller, N.; Weare, J.H. A general equation of state for supercritical fluid mixtures and molecular dynamics simulation of mixture PVTX properties. Geochim. Cosmochim. Acta 1996, 60, 1209–1216. [Google Scholar] [CrossRef]
- Burke, E.A.J. Raman microspectrometry of fluid inclusions. Lithos 2001, 55, 139–158. [Google Scholar] [CrossRef]
- McCrea, J.M. On the isotopic chemistry of carbonates and a palaeotemperature scale. J. Chem. Phys. 1950, 18, 849–857. [Google Scholar] [CrossRef]
- Friedman, I.; O’Neil, J.R. Compilation of Stable Isotope Fractionation Factors of Geochemical Interest; United States Geological Survey: Reston, Virginia, 1977; pp. 1–12.
- O’Neil, J.R.; Clayton, R.N.; Mayeda, T.K. Oxygen isotope fractionation in divalent metal carbonates. J. Chem. Phys. 1969, 51, 5547–5558. [Google Scholar] [CrossRef]
- Zheng, Y.F. Calculation of oxygen isotope fractionation in anhydrous silicate minerals. Geochim. Cosmochim. Acta 1993, 57, 1079–1091. [Google Scholar] [CrossRef]
- Ohmoto, H.; Goldhaber, M.B. Sulfur and carbon isotopes. In Geochemistry of Hydrothermal Ore Deposits, 3rd ed.; Barnes, H.L., Ed.; J. Wiley & Sons: New York, NY, USA, 1997; pp. 517–611. [Google Scholar]
- Bayliss, P. Nomenclature of the trioctahedral chlorites. Can. Mineral. 1975, 13, 178–180. [Google Scholar]
- Inoue, A.; Inoué, S.; Utada, M. Application of chlorite thermometry to estimation of formation temperature and redox conditions. Clay Miner. 2018, 53, 143–158. [Google Scholar] [CrossRef]
- Borisenko, A.S. Izučenije solevovo sostava rastvorov gazovo-židkich vključenij v mineralach metodom kriometrii. Akad. Nauk SSSR Sibir. Odd. 1977, 8, 16–27. (In Russian) [Google Scholar]
- Ramboz, C.; Pichavant, M.; Weisbrod, A. Fluid immiscibility in natural processes: Use and misuse of fluid inclusion data: I. Phase equilibria analysis—A theoretical and geometrical approach. Chem. Geol. 1982, 37, 1–27. [Google Scholar] [CrossRef]
- Vityk, M.O.; Bodnar, R.J. Textural evolution of synthetic fluid inclusions in quartz during reequilibration, with applications to tectonic reconstruction. Contrib. Mineral. Petrol. 1995, 121, 309–323. [Google Scholar] [CrossRef]
- Vityk, M.O.; Bodnar, R.J.; Dudok, I.V. Fluid inclusions in “Marmarosh Diamonds”: Evidence for tectonic history of the Folded Carpathian Mountains, Ukraine. Tectonophysics 1996, 255, 163–174. [Google Scholar] [CrossRef]
- Roedder, E.; Bodnar, R.J. Geologic pressure determinations from fluid inclusion studies. Ann. Rev. Earth Planet. Sci. 1980, 8, 263–301. [Google Scholar] [CrossRef]
- Hurai, V.; Kihle, J.; Kotulová, J.; Marko, F.; Świerczewska, A. Origin of methane in quartz crystals from the Tertiary accretionary wedge and fore-arc basin of the Western Carpathians. Appl. Geochem. 2002, 17, 1259–1271. [Google Scholar] [CrossRef]
- Dolníček, Z.; Kropáč, K.; Janíčková, K.; Urubek, T. Diagenetic source of fluids causing the hydrothermal alteration of teschenites in the Silesian Unit, Outer Western Carpathians, Czech Republic: Petroleum-bearing vein mineralization from the Stříbrník site. Mar. Petrol. Geol. 2012, 37, 27–40. [Google Scholar] [CrossRef]
- Spycher, N.; Pruess, K.; Ennis-King, J. CO2-H2O mixtures in the geological sequestration of CO2. I. Assessment and calculation of mutual solubilities from 12 to 100 °C and up to 600 bar. Geochim. Cosmochim. Acta 2003, 67, 3015–3031. [Google Scholar] [CrossRef]
- Diamond, L.W. Introduction to phase relations of CO2-H2O fluid inclusions. In Fluid Inclusions in Minerals: Methods and Applications; De Vivo, B., Frezzotti, M.L., Eds.; Pontignano: Siena, Italy, 1994; pp. 131–158. [Google Scholar]
- Suchý, V.; Zachariáš, J.; Sýkorová, I.; Kořínková, D.; Pešek, J.; Pachnerová Brabcová, K.; Luo, Q.; Filip, J.; Světlík, I. Palaeo-thermal history of the Blanice Graben (the Bohemian Massif, Czech Republic): The origin of anthracite in a late-Variscan strike-slip basin. Int. J. Coal Geol. 2022, 263, 104129. [Google Scholar] [CrossRef]
- Ramsay, J.G. The crack-seal mechanism of rock deformation. Nature 1980, 284, 135–139. [Google Scholar] [CrossRef]
- Urubek, T.; Dolníček, Z.; Kropáč, K. Genesis of syntectonic hydrothermal veins in the igneous rock of teschenite association (Outer Western Carpathians, Czech Republic): Growth mechanism and origin of fluids. Geol. Carpath. 2014, 65, 419–431. [Google Scholar] [CrossRef]
- Oakes, C.S.; Bodnar, R.J.; Simonson, J.M. The system NaCl-CaCl2-H2O. I.: The ice liquidus at 1 atm total pressure. Geochim. Cosmochim. Acta 1990, 54, 603–610. [Google Scholar] [CrossRef]
- Shepherd, T.J.; Rankin, A.H.; Alderton, D.H.M. A Practical Guide to Fluid Inclusion Studies; Blackie: Glasgow, Scotland; London, UK, 1985. [Google Scholar]
- Zachariáš, J.; Pertold, Z.; Pudilová, M.; Žák, K.; Pertoldová, J.; Stein, H.; Markey, R. Geology and genesis of Variscan porphyry style gold mineralization, Petráčkova hora deposit, Bohemian Massif, Czech Republic. Miner. Deposita 2001, 36, 517–541. [Google Scholar] [CrossRef]
- Dublyansky, Y.V. Speleogenetic history of the Hungarian hydrothermal karst. Environm. Geol. 1995, 25, 24–35. [Google Scholar] [CrossRef]
- Markl, G.; Burisch, M.; Neumann, U. Natural fracking and the genesis of five-element veins. Miner. Deposita 2016, 51, 703–712. [Google Scholar] [CrossRef]
- Burisch, M.; Gerdes, A.; Walter, B.F.; Neumann, U.; Fettel, M.; Markl, G. Methane and the origin of five-element veins: Mineralogy, age, fluid inclusion chemistry and ore forming processes in the Odenwald, SW Germany. Ore Geol. Rev. 2017, 81, 42–61. [Google Scholar] [CrossRef]
- Zhu, D.; Liu, Q.; Zhang, J.; Ding, Q.; He, Z.; Zhang, X. Types of fluid alteration and developing mechanism of deep marine carbonate reservoirs. Geofluids 2019, 3630915, 1–18. [Google Scholar] [CrossRef]
- Sheppard, S.M.F. Characterization and isotopic variations in natural waters. Rev. Mineral. 1986, 16, 165–183. [Google Scholar]
- Hoefs, J. Stable Isotope Geochemistry, 4th ed.; Springer: Berlin/Heidelberg, Germany; New York, NY, USA, 1997. [Google Scholar]
- Zachariáš, J.; Pudilová, M.; Žák, K.; Morávek, P.; Litochleb, J.; Váňa, T.; Pertold, Z. P-T-X conditions of gold-bearing mineralization within the Central Bohemian Metallogenetic Zone. Acta Univ. Carol. Geol. 1997, 41, 167–178. [Google Scholar]
- Zachariáš, J.; Žák, K.; Pudilová, M.; Snee, L.W. Multiple fluid sources/pathways and severe thermal gradients during formation of the Jílové orogenic gold deposit, Bohemian Massif, Czech Republic. Ore Geol. Rev. 2013, 54, 81–109. [Google Scholar] [CrossRef]
- Johan, Z.; Povondra, P. Vanadium- and copper-bearing dolomite nodules from Permian sediments near Horní Kalná, Czechoslovakia. N. Jahrb. Mineral. Abh. 1987, 157, 245–266. [Google Scholar]
- Vavřín, I.; Frýda, J. Cu-Ag-V-Hg mineralization in melaphyre from Studenec near Jilemnice (Podkrkonoší area). J. Czech geol. Soc. 1996, 41, 33–41. (In Czech) [Google Scholar]
- Vytopilová, H. Mineralogy of Hydrothermal Occurrences with Cu-Mineralization in Palaeovolcanites of the Podkrkonoší Area. Master’s Thesis, Palacký University, Olomouc, Czech Republic, 2011. (In Czech). [Google Scholar]
- Havelcová, M.; Sýkorová, I.; René, M.; Mizera, J.; Coubal, M.; Machovič, V.; Strunga, V.; Goliáš, V. Geology and petrography of uraniferous bitumens in Permo-Carboniferous sediments (Vrchlabí, Czech Republic). Minerals 2022, 12, 544. [Google Scholar] [CrossRef]
- Bottomley, D.J.; Gregoire, C.D.; Ravens, K.G. Saline groundwaters and brines in the Canadian Shield: Geochemical and isotopic evidence for a residual evaporite brine component. Geochim. Cosmochim. Acta 1994, 58, 1483–1498. [Google Scholar] [CrossRef]
- Frape, S.K.; Fritz, P. Geochemical trends from groundwaters from the Canadian Shield. In Saline Waters and Gases in Crystalline Rocks; Fritz, P., Frape, S.K., Eds.; Geological Association of Canada: St. John’s, NL, Canada, 1987; Volume 33, pp. 19–38. [Google Scholar]
- Kříbek, B.; Žák, K.; Dobeš, P.; Leichmann, J.; Pudilová, M.; René, M.; Scharm, B.; Scharmová, M.; Hájek, A.; Holeczy, D.; et al. The Rožná uranium deposit (Bohemian Massif, Czech Republic): Shear zone-hosted, late Variscan and post-Variscan hydrothermal mineralization. Miner. Deposita 2009, 44, 99–128. [Google Scholar] [CrossRef]
- Dolníček, Z.; Fojt, B.; Prochaska, W.; Kučera, J.; Sulovský, P. Origin of the Zálesí U–Ni–Co–As–Ag/Bi deposit, Bohemian Massif, Czech Republic: Fluid inclusion and stable isotope constraints. Miner. Deposita 2009, 44, 81–97. [Google Scholar] [CrossRef]
- Dolníček, Z.; René, M.; Hermannová, S.; Prochaska, W. Origin of the Okrouhlá Radouň episyenite-hosted uranium deposit, Bohemian Massif, Czech Republic: Fluid inclusion and stable isotope constraints. Miner. Deposita 2014, 49, 409–425. [Google Scholar] [CrossRef]
- Kříbek, B.; Žák, K.; Spangenberg, J.E.; Jehlička, J.; Prokeš, S.; Komínek, J. Bitumens in the late Variscan hydrothermal vein-type uranium deposit of Pribram, Czech Republic: Sources, radiation-induced alteration, and relation to mineralization. Econ. Geol. 1999, 94, 1093–1114. [Google Scholar] [CrossRef]
- Straka, P. Anthraxolite-uranium mineral: Composition, structural features and genesis. Asp. Min. Miner. Sci. 2020, 5, 623. [Google Scholar] [CrossRef]
- Littke, R.; Krooss, B.M.; Idiz, E.F.; Frielingsdorf, J. Molecular nitrogen in natural gas accumulations: Generation from sedimentary organic matter at high temperatures. Am. Assoc. Petrol. Geol. Bull. 1995, 79, 410–430. [Google Scholar]
- Lüders, V.; Reutel, C.; Hoth, P.; Banks, D.A.; Mingram, B.; Pettke, T. Fluid and gas migration in the North German Basin: Fluid inclusion and stable isotope constraints. Int. J. Earth Sci. 2005, 94, 990–1009. [Google Scholar] [CrossRef]
- Kutina, J. Genetische Diskussion der Makrotexturen bei der geochemischen Untersuchung des Adalbert-Hauptganges in Příbram. Chem. Erde 1955, 17, 241–323. [Google Scholar]
- Škácha, P.; Sejkora, J.; Plášil, J.; Dolníček, Z.; Ulmanová, J. Grimmite, NiCO2S4, a new thiospinel from Příbram, Czech Republic. Eur. J. Mineral. 2021, 33, 175–187. [Google Scholar] [CrossRef]
- Sejkora, J.; Dolníček, Z.; Škácha, P.; Ulmanová, J.; Vrtiška, L. Unusual mineralization with willemite from the area of the central part of the Příbram uranium and base-metal district (Czech Republic). Bull. Mineral. Petrolog. 2022, 30, 224–242. (In Czech) [Google Scholar] [CrossRef]
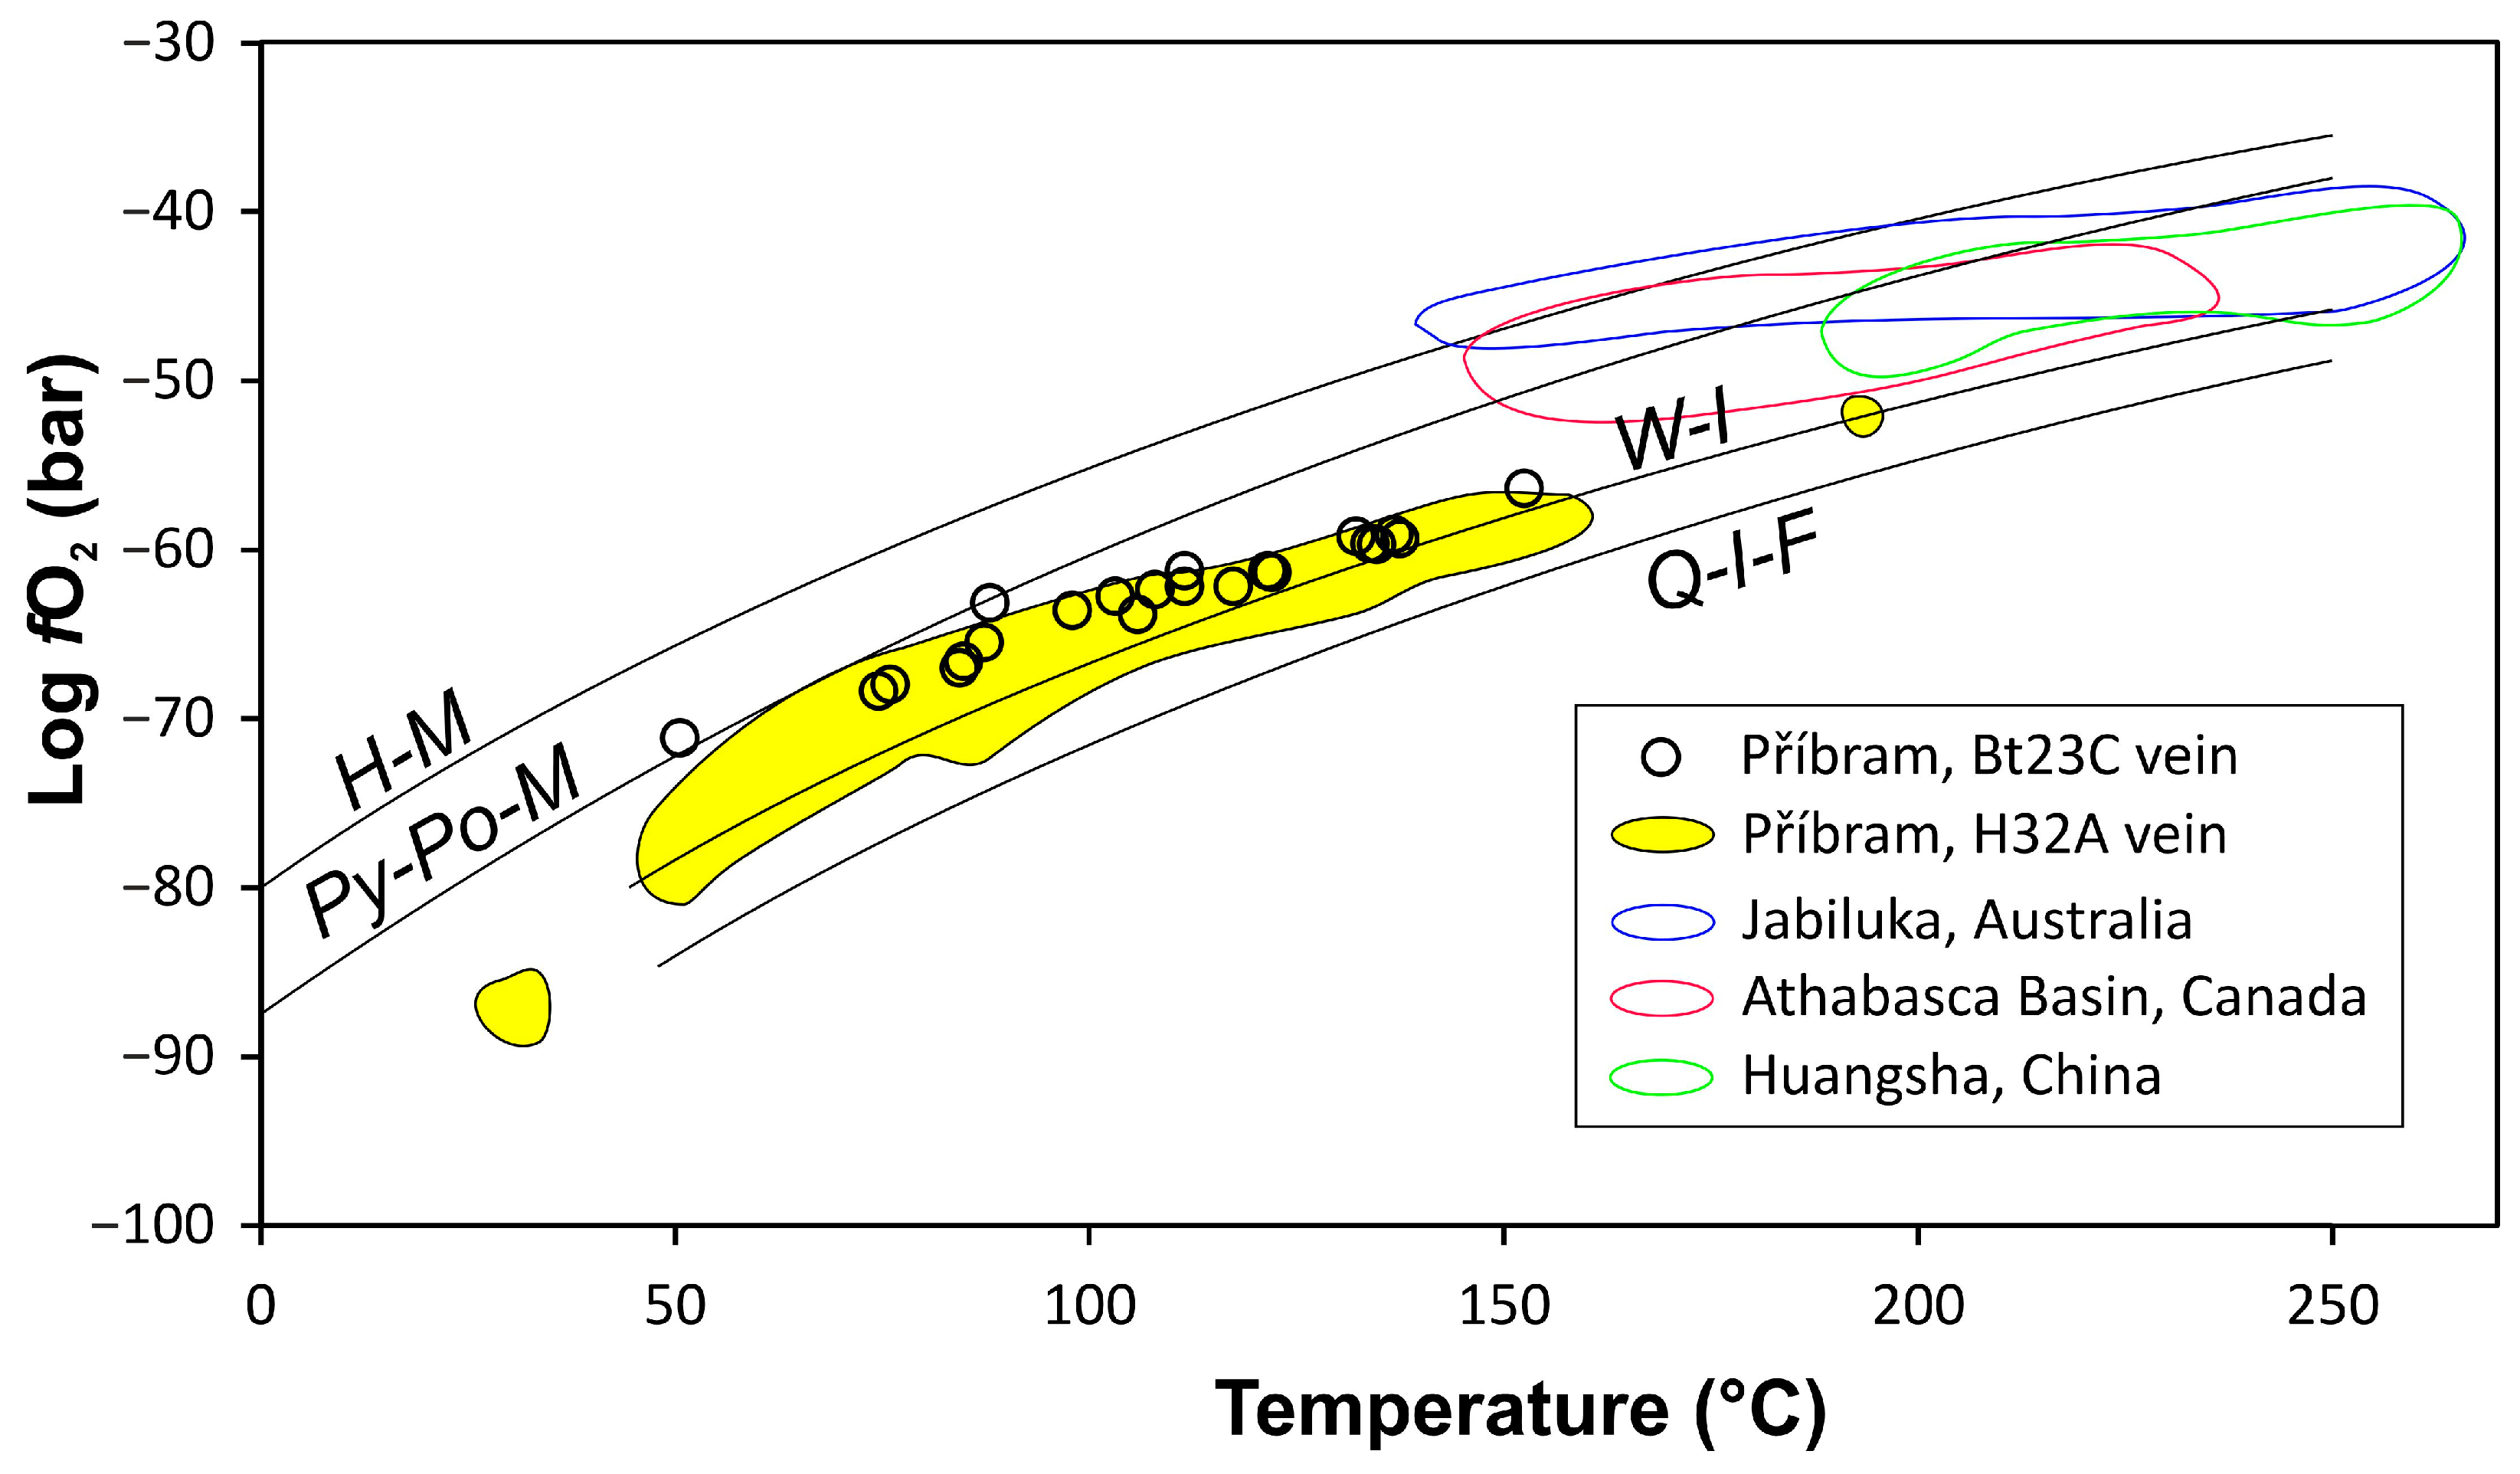
- Frost, B.R. Introduction to oxygen fugacity and its petrologic importance. Rev. Mineral. Geochem. 1991, 25, 1–9. [Google Scholar]
- Nutt, C.J. Chloritization and associated alteration at the Jabiluka unconformity-type uranium deposit, Northern Territory, Australia. Can. Mineral. 1989, 27, 41–58. [Google Scholar]
- Alexandre, P.; Kyser, K.; Polito, P. Alteration mineralogy and stable isotope geochemistry of Paleoproterozoic basement hosted unconformity-type uranium deposits in the Athabasca Basin, Canada. Econ. Geol. 2005, 100, 1547–1563. [Google Scholar] [CrossRef]
- Alexandre, P.; Kyser, K.; Jiricka, D.; Witt, G. Formation and evolution of the Centennial unconformity-related uranium deposit in the south-central Athabasca Basin, Canada. Econ. Geol. 2012, 107, 385–400. [Google Scholar] [CrossRef]
- Wu, D.; Pan, J.; Xia, F.; Huang, G.; Lai, J. The mineral chemistry of chlorites and its relationship with uranium mineralization from Huangsha uranium mining area in the Middle Nanling Range, SE China. Minerals 2019, 9, 199. [Google Scholar] [CrossRef]


| An. No | 1 | 2 | 3 | 4 | 5 | 6 |
|---|---|---|---|---|---|---|
| Sample | Pb-666 | Pb-666 | Pb-666 | Pb-666 | Pb-666 | Pb-666 |
| P2O5 | 1.58 | 1.26 | 1.58 | 2.45 | 2.26 | 2.32 |
| SiO2 | 44.02 | 44.62 | 43.66 | 43.84 | 44.44 | 42.71 |
| Al2O3 | 12.91 | 12.23 | 12.52 | 13.35 | 12.73 | 12.43 |
| V2O3 | 21.96 | 23.86 | 22.16 | 18.41 | 21.36 | 21.18 |
| Sb2O3 | b.d. | b.d. | b.d. | 0.26 | 0.18 | 0.21 |
| MgO | 1.95 | 1.75 | 1.94 | 2.55 | 1.98 | 1.93 |
| MnO | 0.09 | 0.07 | 0.08 | 0.14 | 0.12 | 0.11 |
| FeO | 2.90 | 2.70 | 3.00 | 4.37 | 3.14 | 3.09 |
| ZnO | 0.62 | 0.70 | 0.78 | 0.77 | 1.04 | 0.29 |
| CaO | 1.20 | 0.98 | 1.29 | 1.64 | 1.61 | 1.64 |
| PbO | 0.89 | 0.87 | 1.09 | 1.40 | 1.48 | 1.74 |
| Na2O | b.d. | 0.09 | b.d. | b.d. | b.d. | b.d. |
| K2O | 6.23 | 6.74 | 6.31 | 5.85 | 6.12 | 6.24 |
| F | 0.11 | 0.26 | 0.28 | 0.33 | 0.11 | 0.32 |
| Total | 94.46 | 96.13 | 94.69 | 95.36 | 96.57 | 94.21 |
| P5+ | 0.097 | 0.077 | 0.097 | 0.149 | 0.136 | 0.144 |
| Si4+ | 3.186 | 3.201 | 3.176 | 3.156 | 3.165 | 3.134 |
| ivAl3+ | 0.717 | 0.723 | 0.726 | 0.694 | 0.699 | 0.721 |
| T sum | 4.000 | 4.000 | 4.000 | 4.000 | 4.000 | 4.000 |
| viAl3+ | 0.384 | 0.311 | 0.347 | 0.439 | 0.370 | 0.354 |
| V3+ | 1.274 | 1.372 | 1.293 | 1.063 | 1.220 | 1.246 |
| Sb3+ | b.d. | b.d. | b.d. | 0.008 | 0.005 | 0.006 |
| Mg2+ | 0.210 | 0.187 | 0.210 | 0.274 | 0.210 | 0.211 |
| Mn2+ | 0.006 | 0.004 | 0.005 | 0.009 | 0.007 | 0.007 |
| Fe2+ | 0.176 | 0.162 | 0.183 | 0.263 | 0.187 | 0.190 |
| Zn2+ | 0.033 | 0.037 | 0.042 | 0.041 | 0.055 | 0.016 |
| O sum | 2.083 | 2.074 | 2.080 | 2.096 | 2.054 | 2.030 |
| Ca2+ | 0.093 | 0.075 | 0.101 | 0.127 | 0.123 | 0.129 |
| Pb2+ | 0.017 | 0.017 | 0.021 | 0.027 | 0.028 | 0.034 |
| Na+ | b.d. | 0.013 | b.d. | b.d. | b.d. | b.d. |
| K+ | 0.575 | 0.617 | 0.586 | 0.537 | 0.556 | 0.584 |
| I sum | 0.796 | 0.814 | 0.829 | 0.845 | 0.859 | 0.911 |
| Catsum | 6.769 | 6.796 | 6.787 | 6.787 | 6.762 | 6.777 |
| F- | 0.025 | 0.059 | 0.064 | 0.075 | 0.025 | 0.074 |
| An. No. | 1 | 2 | 3 | 4 | 5 | 6 | 7 | 8 | 9 | 10 | 11 | 12 | 13 |
|---|---|---|---|---|---|---|---|---|---|---|---|---|---|
| Sample | Pb-670 | Pb-670 | Pb-670 | Pb-670 | Pb-670 | Pb-667 | Pb-667 | Pb-667 | Pb-666 | Pb-666 | Pb-666 | Pb-666 | Pb-666 |
| P2O5 | b.d. | b.d. | b.d. | b.d. | b.d. | 0.13 | 0.14 | b.d. | b.d. | b.d. | b.d. | b.d. | 0.53 |
| SiO2 | 25.83 | 25.53 | 26.00 | 26.15 | 25.08 | 27.47 | 27.83 | 26.70 | 27.33 | 27.33 | 26.53 | 26.82 | 25.62 |
| Al2O3 | 18.06 | 17.72 | 18.56 | 17.58 | 19.04 | 18.15 | 19.37 | 19.12 | 18.48 | 18.04 | 16.95 | 17.30 | 15.41 |
| V2O3 | b.d. | b.d. | b.d. | b.d. | b.d. | 0.46 | 0.49 | 0.57 | 1.11 | 2.78 | 3.73 | 4.24 | 5.56 |
| Fe2O3 | 1.96 | 1.93 | 2.11 | 1.98 | 2.38 | 2.14 | 1.90 | 2.25 | 3.45 | 3.50 | n.a. | n.a. | n.a. |
| MgO | 7.11 | 7.21 | 6.98 | 7.39 | 7.12 | 10.88 | 10.39 | 9.07 | 10.93 | 8.92 | 9.81 | 9.53 | 7.90 |
| CaO | 0.56 | 0.56 | 0.67 | 0.73 | 0.68 | 0.22 | 0.12 | 0.10 | b.d. | 0.13 | 0.34 | b.d. | 0.41 |
| MnO | 0.22 | 0.21 | 0.21 | 0.24 | 0.28 | 0.19 | 0.17 | 0.32 | 0.14 | 0.24 | 0.23 | 0.14 | 0.17 |
| FeO | 33.77 | 32.94 | 33.31 | 33.00 | 32.92 | 28.14 | 27.68 | 29.97 | 26.90 | 27.42 | 30.33 | 29.29 | 27.75 |
| ZnO | b.d. | b.d. | b.d. | b.d. | b.d. | 0.17 | 0.25 | b.d. | 1.75 | 0.81 | 1.33 | b.d. | 0.23 |
| PbO | 0.20 | 0.23 | b.d. | b.d. | b.d. | b.d. | b.d. | b.d. | b.d. | b.d. | 0.17 | 0.65 | 0.51 |
| Na2O | b.d. | b.d. | b.d. | b.d. | 0.15 | b.d. | b.d. | b.d. | b.d. | 0.22 | 0.21 | b.d. | b.d. |
| K2O | b.d. | b.d. | b.d. | b.d. | b.d. | b.d. | 0.18 | b.d. | b.d. | b.d. | b.d. | b.d. | 0.28 |
| Total | 87.71 | 86.33 | 87.84 | 87.07 | 87.65 | 87.95 | 88.52 | 88.10 | 90.09 | 89.39 | 89.75 | 87.97 | 84.37 |
| P5+ | b.d. | b.d. | b.d. | b.d. | b.d. | 0.012 | 0.013 | b.d. | b.d. | b.d. | b.d. | b.d. | 0.051 |
| Si4+ | 2.882 | 2.889 | 2.881 | 2.924 | 2.792 | 2.946 | 2.948 | 2.889 | 2.882 | 2.916 | 2.873 | 2.926 | 2.932 |
| Al3+ | 2.375 | 2.364 | 2.424 | 2.317 | 2.498 | 2.294 | 2.419 | 2.438 | 2.297 | 2.268 | 2.163 | 2.225 | 2.078 |
| V3+ | b.d. | b.d. | b.d. | b.d. | b.d. | 0.040 | 0.042 | 0.049 | 0.094 | 0.238 | 0.324 | 0.371 | 0.510 |
| Fe3+ | 0.165 | 0.164 | 0.176 | 0.167 | 0.199 | 0.173 | 0.151 | 0.183 | 0.274 | 0.281 | n.a. | n.a. | n.a. |
| Mg2+ | 1.183 | 1.216 | 1.153 | 1.232 | 1.182 | 1.739 | 1.641 | 1.463 | 1.718 | 1.419 | 1.583 | 1.550 | 1.348 |
| Ca2+ | 0.067 | 0.068 | 0.080 | 0.087 | 0.081 | 0.025 | 0.014 | 0.012 | b.d. | 0.015 | 0.039 | b.d. | 0.050 |
| Mn2+ | 0.021 | 0.020 | 0.020 | 0.023 | 0.026 | 0.017 | 0.015 | 0.029 | 0.013 | 0.022 | 0.021 | 0.013 | 0.016 |
| Fe2+ | 3.151 | 3.118 | 3.087 | 3.086 | 3.065 | 2.524 | 2.453 | 2.712 | 2.372 | 2.446 | 2.747 | 2.673 | 2.656 |
| Zn2+ | b.d. | b.d. | b.d. | b.d. | b.d. | 0.013 | 0.020 | b.d. | 0.136 | 0.064 | 0.106 | b.d. | 0.019 |
| Pb2+ | 0.006 | 0.007 | b.d. | b.d. | b.d. | b.d. | b.d. | b.d. | b.d. | b.d. | 0.005 | 0.019 | 0.016 |
| Na+ | b.d. | b.d. | b.d. | b.d. | 0.032 | b.d. | b.d. | b.d. | b.d. | 0.045 | 0.044 | b.d. | b.d. |
| K+ | b.d. | b.d. | b.d. | b.d. | b.d. | b.d. | 0.024 | b.d. | b.d. | b.d. | b.d. | b.d. | 0.041 |
| Catsum | 9.848 | 9.847 | 9.819 | 9.835 | 9.876 | 9.783 | 9.739 | 9.775 | 9.786 | 9.714 | 9.906 | 9.776 | 9.718 |
| F/FM | 0.73 | 0.72 | 0.73 | 0.71 | 0.72 | 0.59 | 0.60 | 0.65 | 0.58 | 0.63 | 0.63 | 0.63 | 0.66 |
| T | 138 | 135 | 122 | 118 | 153 | 98 | 75 | 108 | 88 | 51 | n.a. | n.a. | n.a. |
| log fO2 | −59.4 | −59.7 | −61.3 | −62.2 | −56.4 | −63.6 | −68.4 | −62.4 | −63.1 | −71.1 | n.a. | n.a. | n.a. |
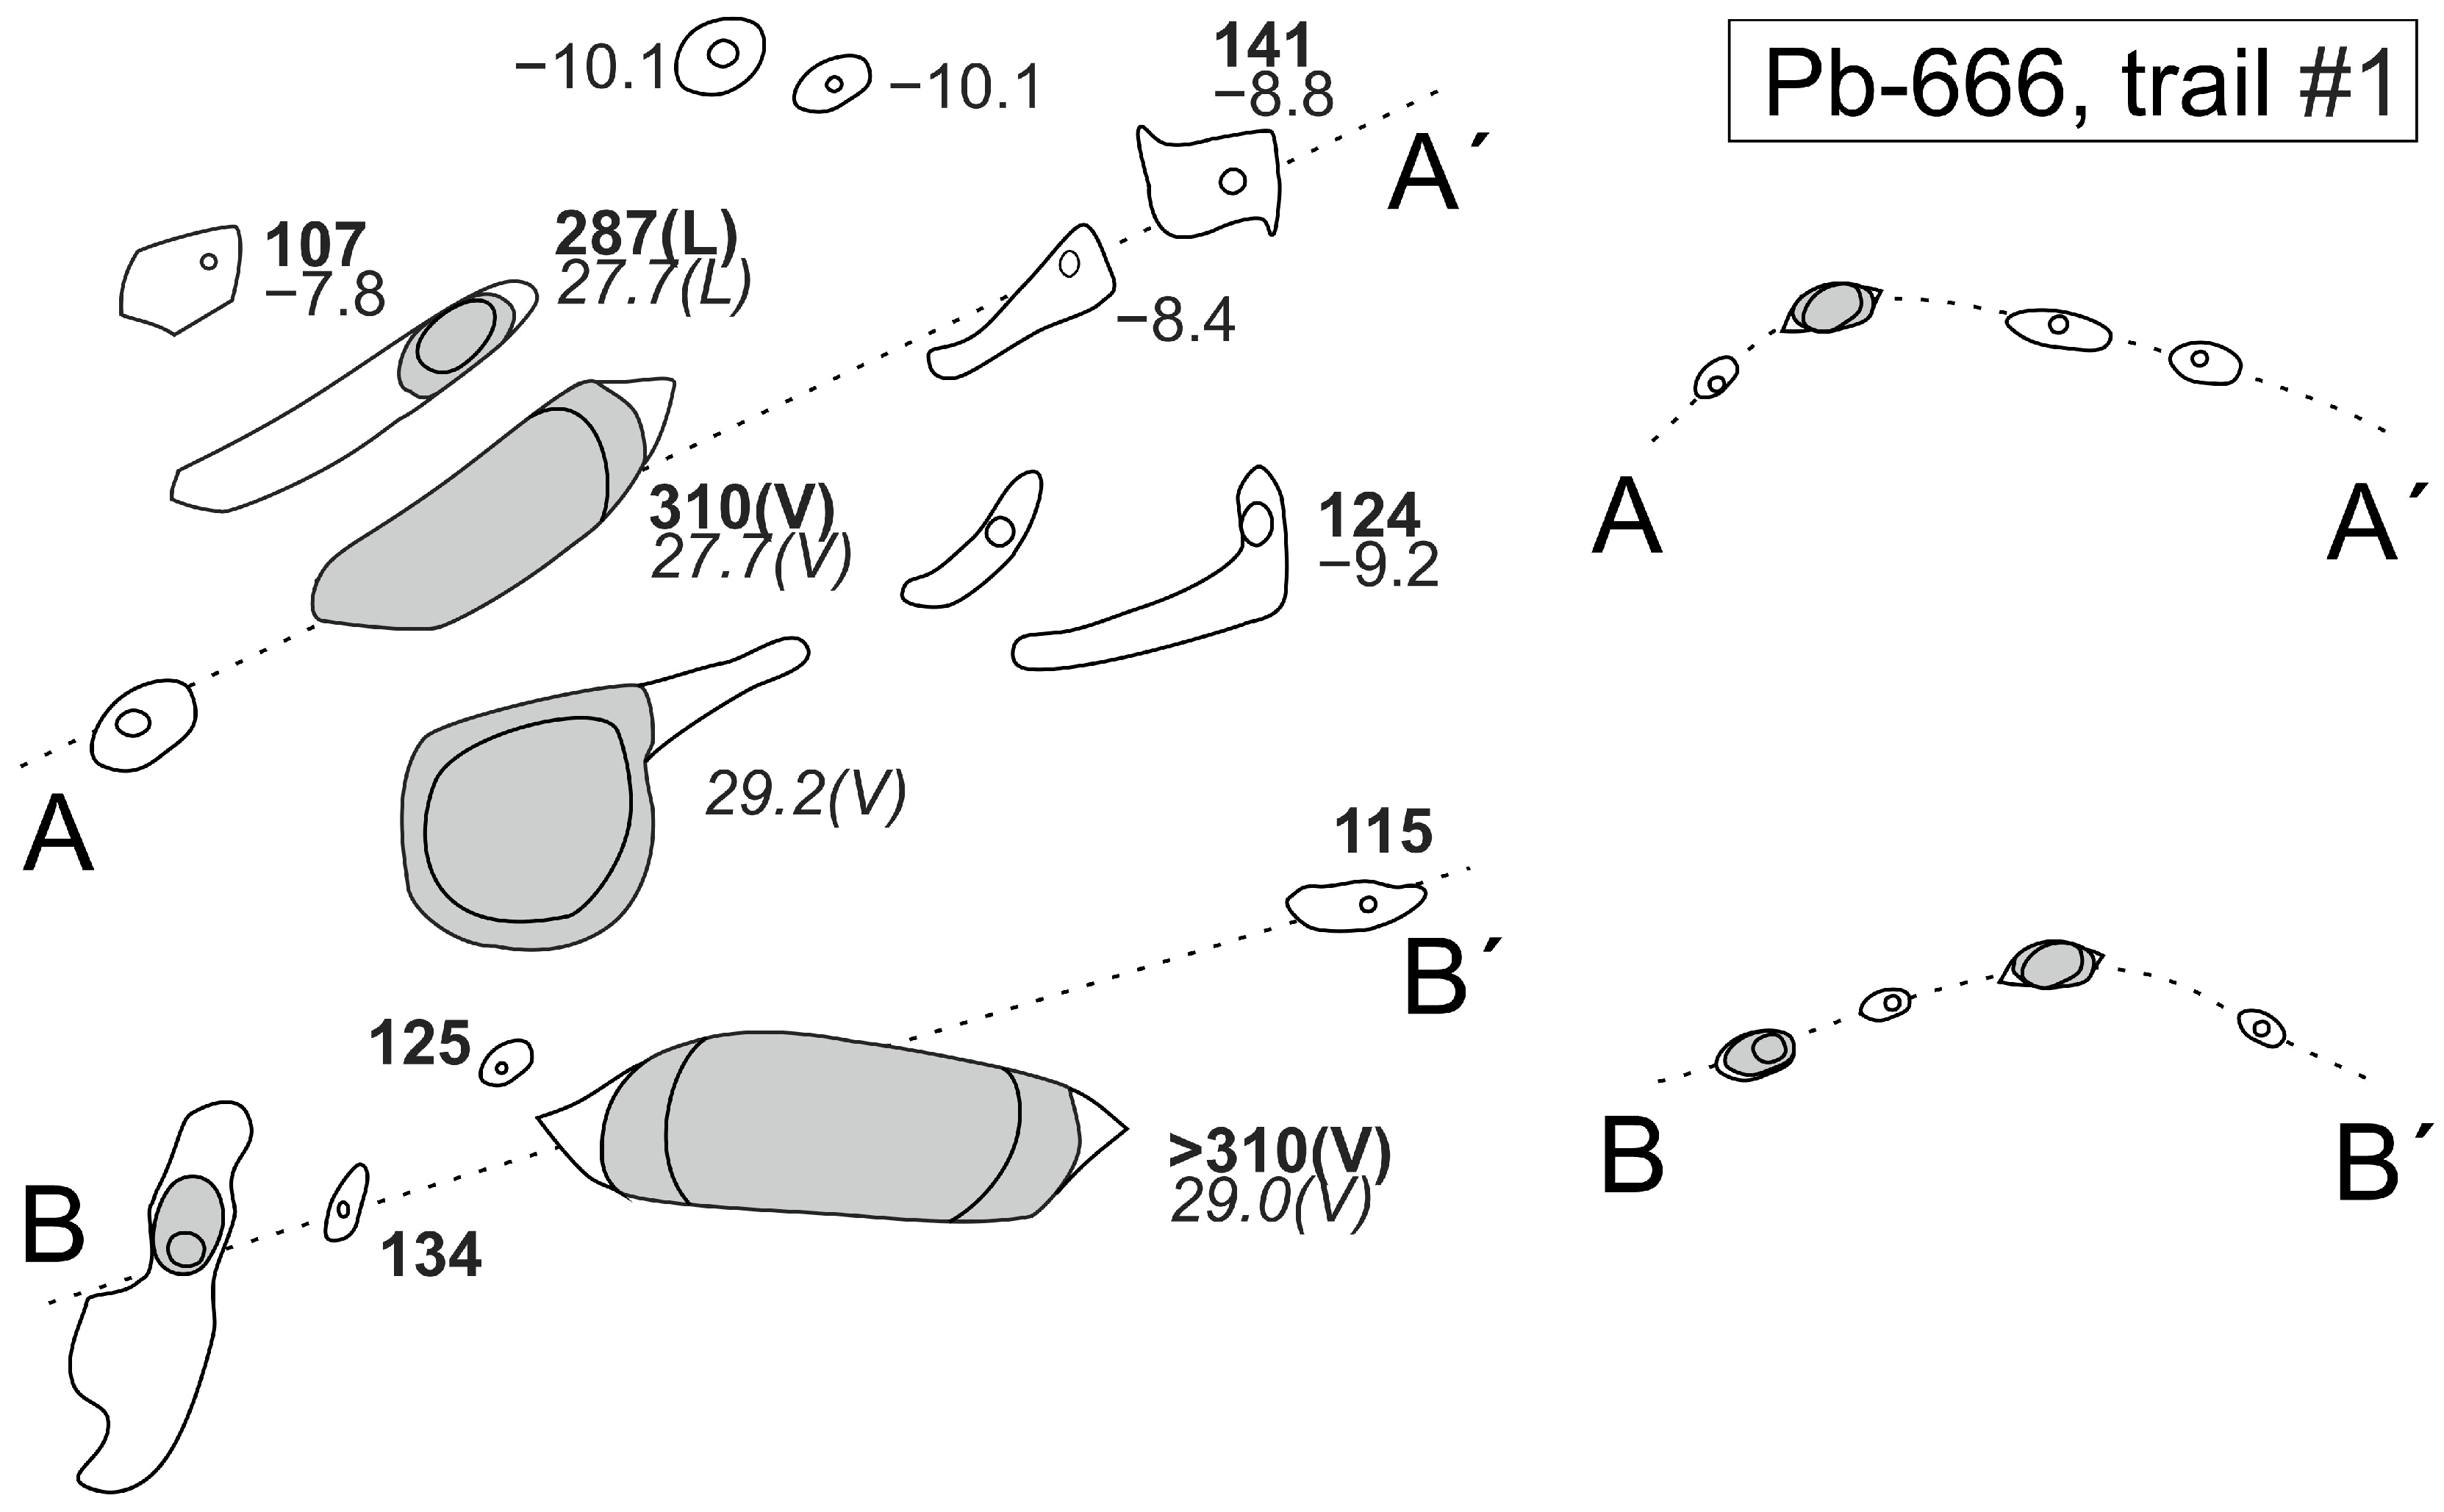
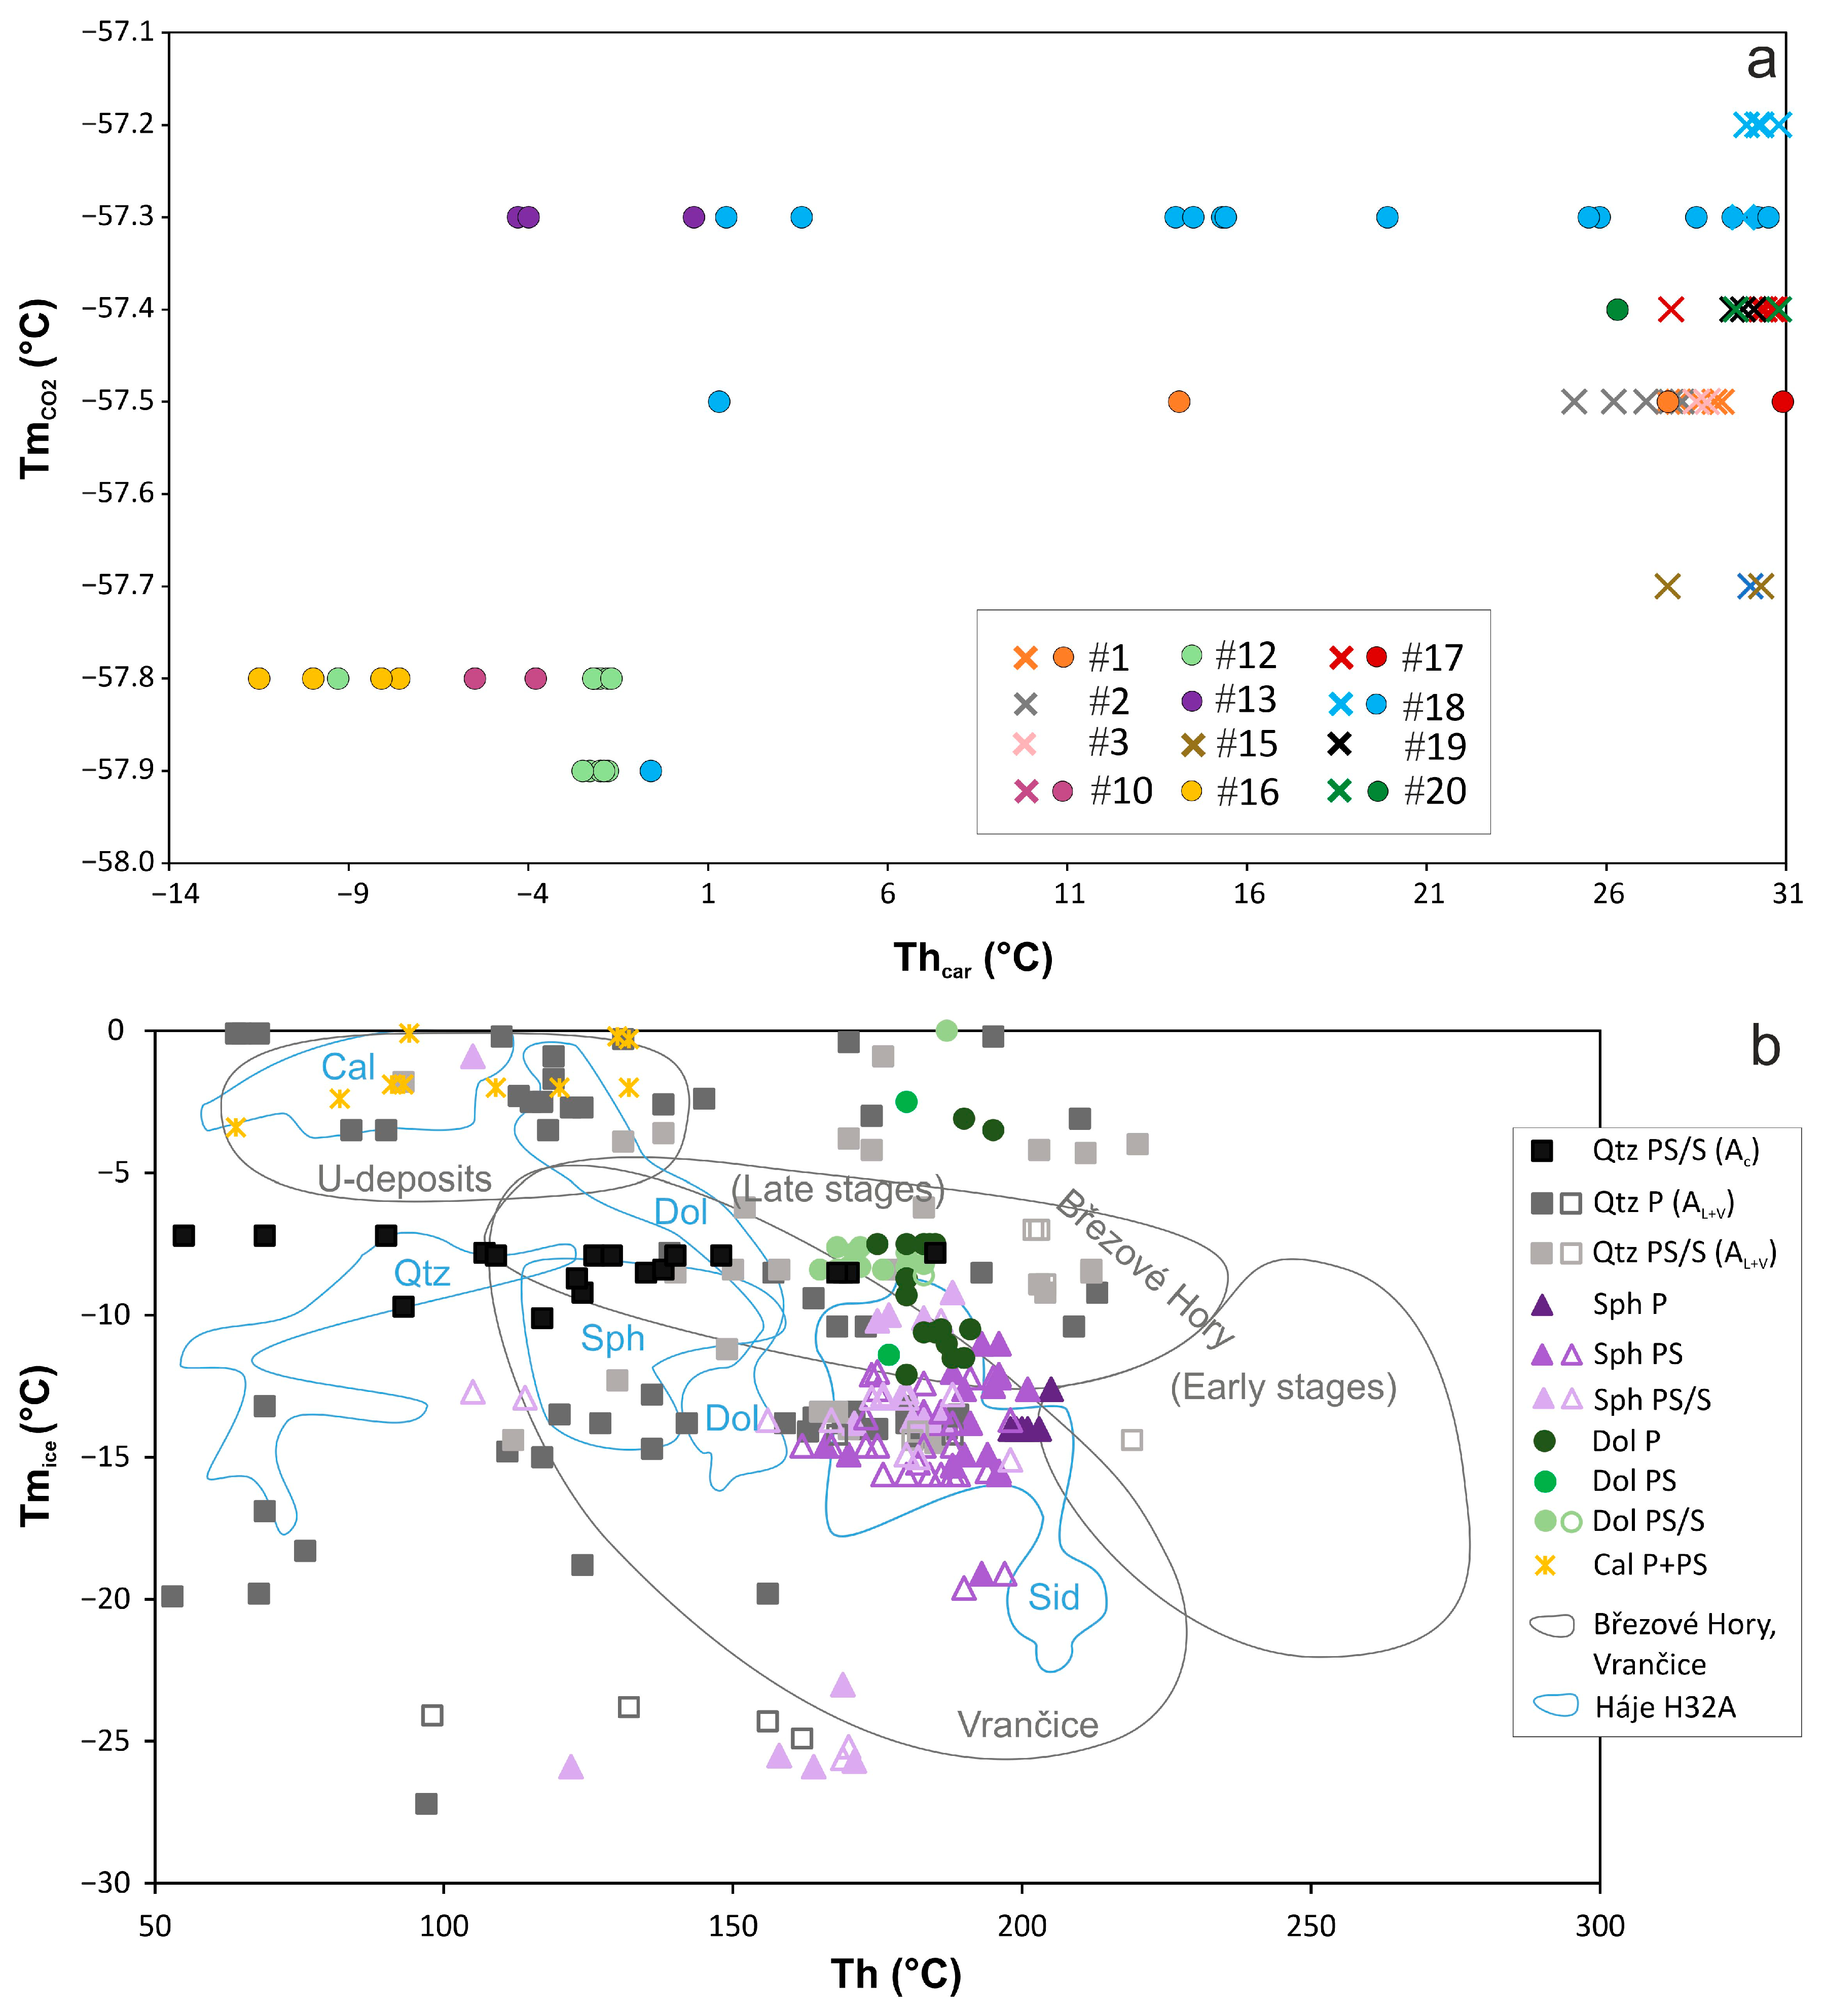
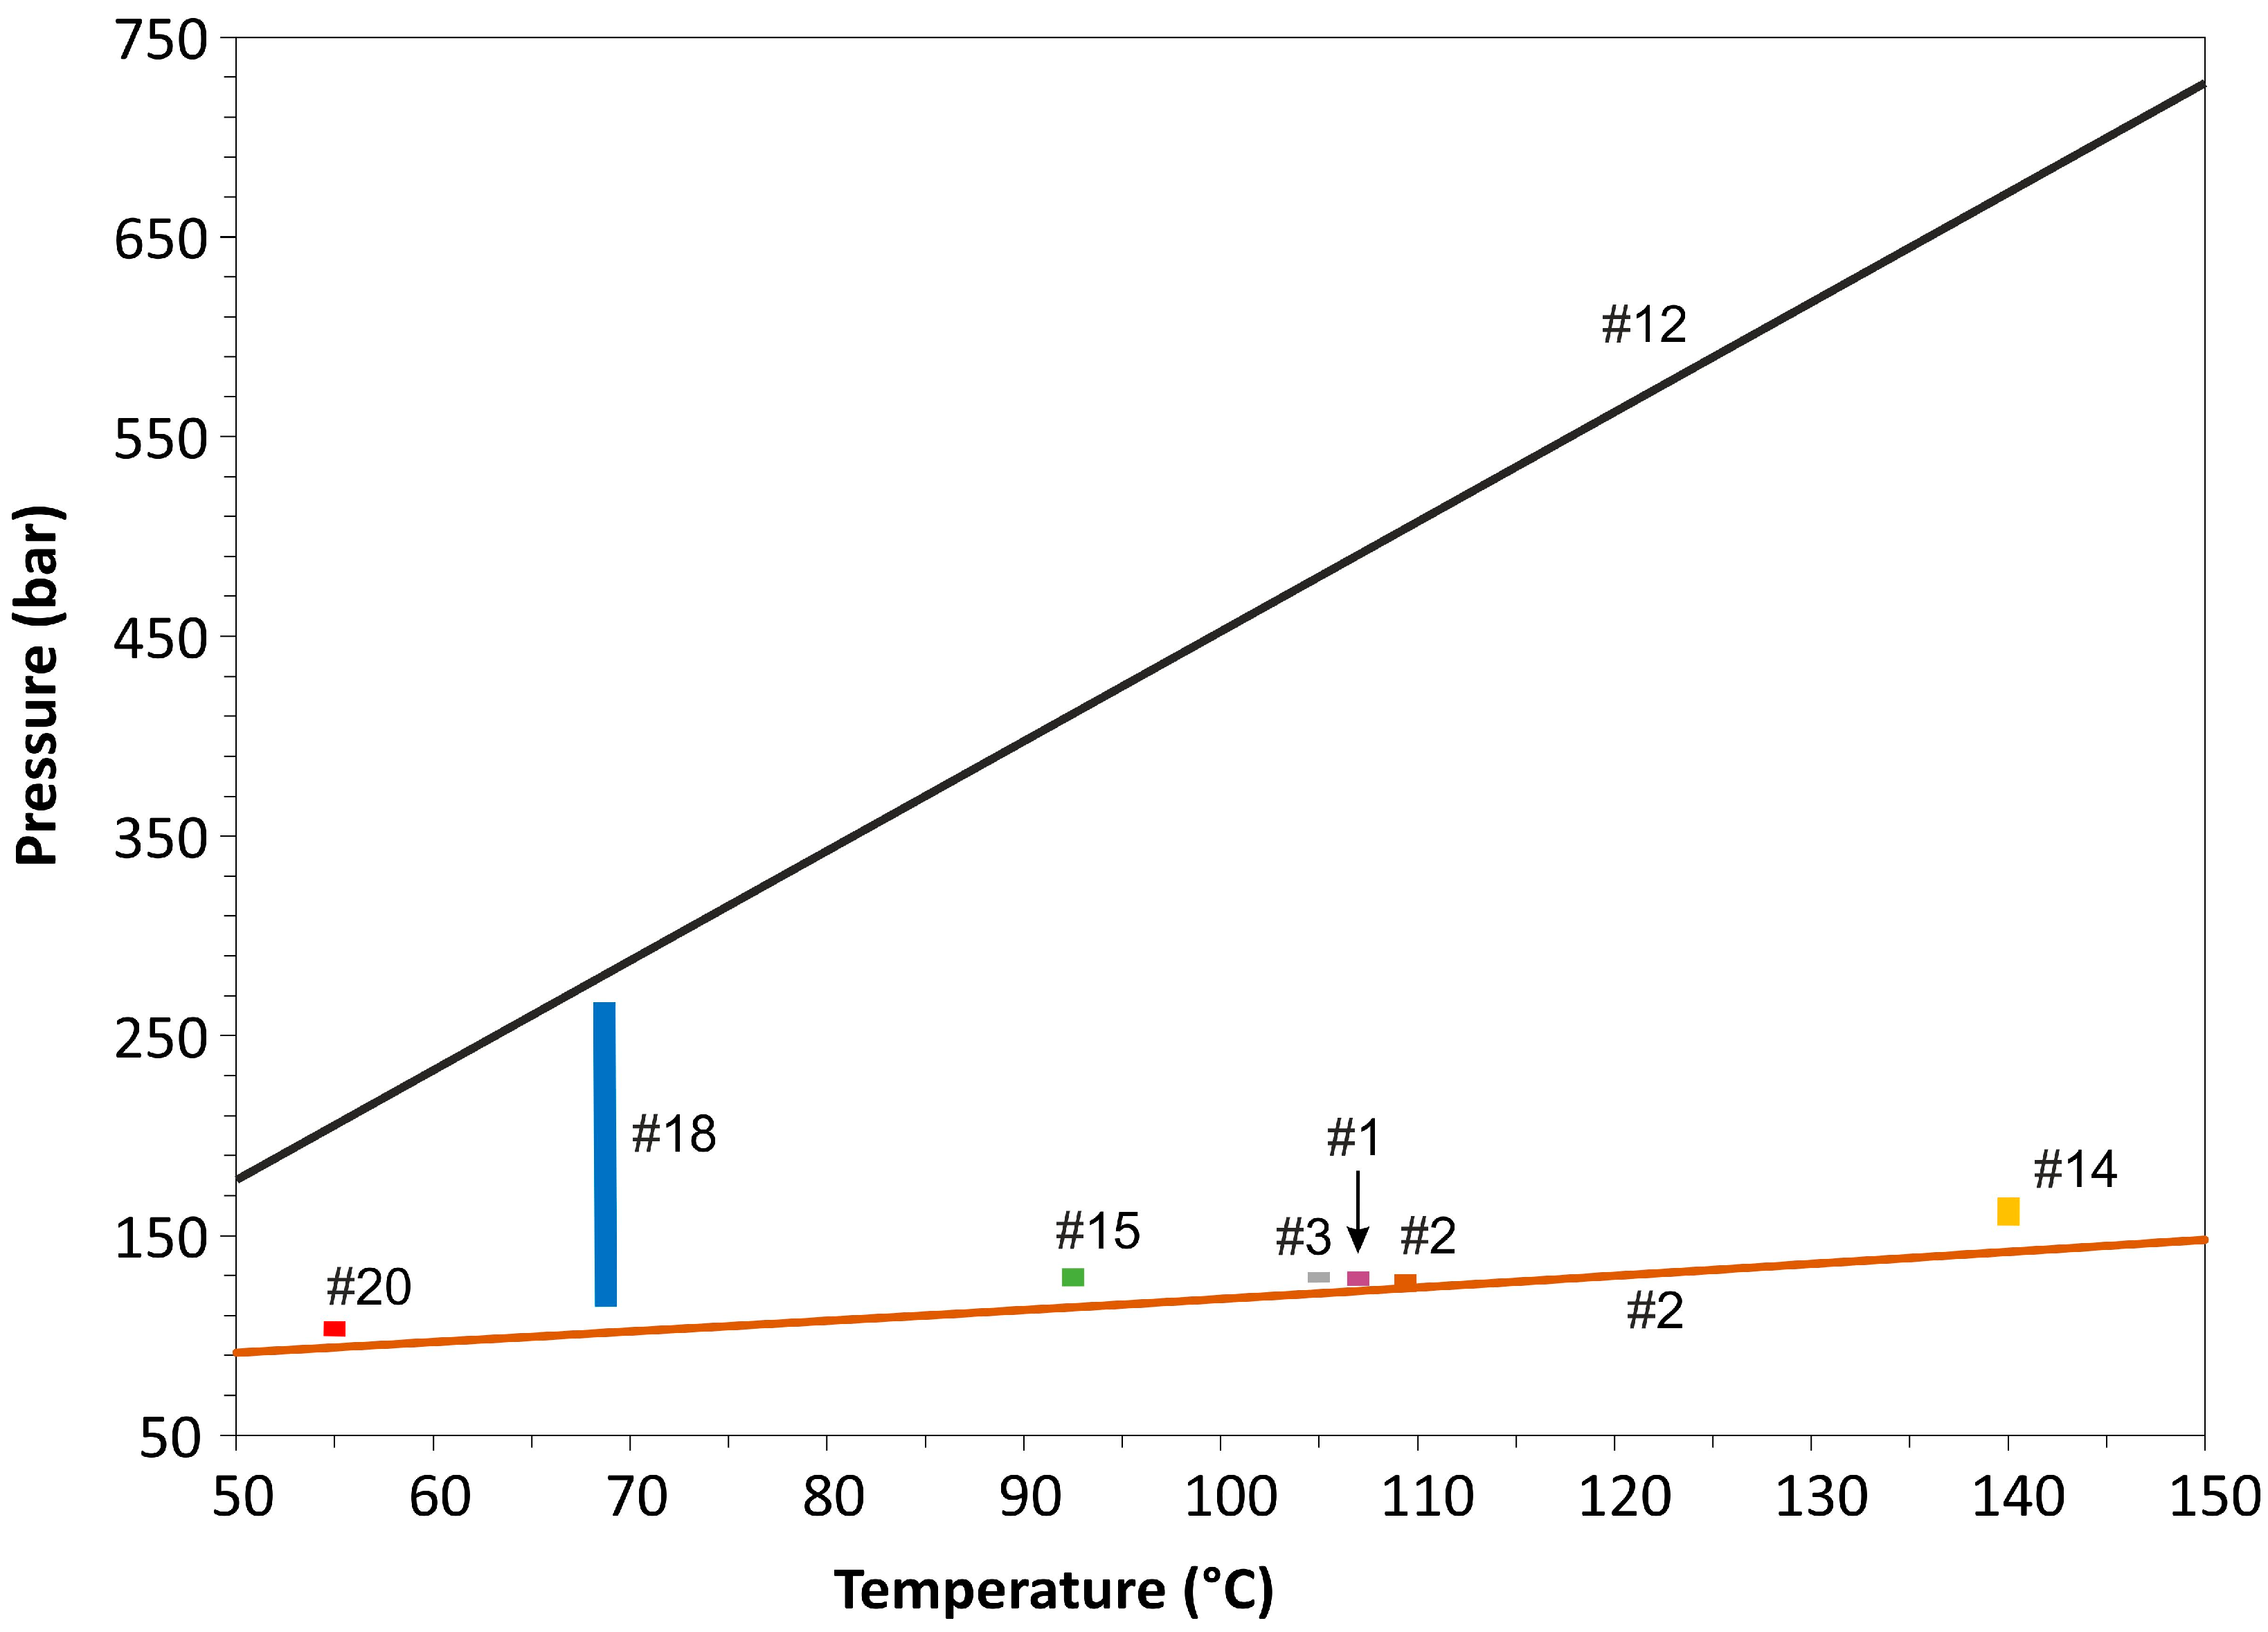
| Sample | Mineral | Trail | Gen. | Type | n | F | Thtot | Thcar | TmCO2 | Tmice | Tmcla | Salinity |
|---|---|---|---|---|---|---|---|---|---|---|---|---|
| Pb-666 | Quartz | 1 | PS | AC1 | 2 | 0.80–0.85 | 287–295 (L) | 14.1–27.7 (L) | −57.5 | 5.8–7.8 | 4.3–7.8 | |
| Pb-666 | Quartz | 1 | PS | AC2 | 3 | 0.15–0.35 | 310 (V) | 28.0–29.2 (V) | −57.5 | 3.5–8.2 | 3.6–11.3 | |
| Pb-666 | Quartz | 1 | PS | C | 2 | 27.7–29.0 (V) | −57.5 | |||||
| Pb-666 | Quartz | 1 | PS | Ac | 11 | 0.90–0.95 | 107–141 (L) | −10.1/−7.8 | 11.5–14.1 | |||
| Pb-666 | Quartz | 2 | PS | AC1 | 3 | 0.10–0.40 | 25.1–28.1 (V) | −57.5 | 3.6–4.0 | 10.6–11.2 | ||
| Pb-666 | Quartz | 2 | PS | C | 2 | 26.2–28.1 (V) | −57.5 | |||||
| Pb-666 | Quartz | 2 | PS | Ac | 8 | 0.90–0.95 | 109–170 (L) | −8.5/−7.9 | 11.6–12.3 | |||
| Pb-666 | Quartz | 3 | PS | AC1 | 1 | 0.65 | 29 (V) | −57.5 | 3.5 | 11.3 | ||
| Pb-666 | Quartz | 3 | PS | C | 2 | 28.5–29.1 (V) | −57.5 | |||||
| Pb-666 | Quartz | 3 | PS | Ac | 6 | 0.95 | 105–236 (L) | −8.7/−8.4 | 12.2–12.6 | |||
| Pb-668 | Quartz | 4 | PS | AC2 | 1 | 0.30 | 29.8 (V) | −57.2 | 8.9 | 2.2 | ||
| Pb-668 | Quartz | 4 | PS | Ac | 1 | 0.80 | 268 (L) | −4.1 | 6.6 | |||
| Pb-668 | Quartz | 5 | PS | C | 1 | 0.00 | 29.9 (L) | −57.4 | ||||
| Pb-668 | Quartz | 5 | PS | Ac | 1 | 0.80 | 210 (L) | −4.3 | 6.7 | |||
| Pb-668 | Quartz | 6 | PS | AC1 | 1 | 0.65 | 15 (L) | −57.5 | 9.1 | 1.8 | ||
| Pb-668 | Quartz | 7 | PS | AC1 | 1 | 0.55 | 29.9 (L) | −57.3 | 8.9 | 2.2 | ||
| Pb-668 | Quartz | 8 | PS | C | 1 | 28.9 (V) | ||||||
| Pb-669 | Quartz | 9 | PS | AC2 | 1 | 0.20 | 28.9 (V) | |||||
| Pb-666b | Quartz | 10 | PS/S | AC1 | 3 | 0.7–0.8 | −5.5/−2.1 (L) | −57.8 | 8.8–8.9 | 4.0–4.5 | ||
| Pb-666b | Quartz | 10 | PS/S | C | 1 | 30.0 (V) | −57.7 | |||||
| Pb-666b | Quartz | 11 | PS/S | AC1 | 1 | 0.75 | −1.9 (L) | −57.8 | 8.8 | 4.1 | ||
| Pb-666b | Quartz | 12 | PS/S | AC1 | 6 | 0.50–0.85 | −9.3/−1.8 (L) | −57.9/−57.8 | 9.0–11.7 | 3.0–4.8 | ||
| Pb-666b | Quartz | 12 | PS/S | AC2 | 5 | 0.10–0.45 | −2.2/−1.7 (L) | −57.9/−57.8 | 9.0–9.4 | 3.0–3.8 | ||
| Pb-666b | Quartz | 12 | PS/S | C | 3 | −2.3/−1.8 (L) | −57.9/−57.9 | |||||
| Pb-666b | Quartz | 13 | PS/S | AC1 | 3 | 0.50–0.60 | −4.3/0.6 (L) | −57.3 | 8.9–9.4 | 3.3–4.3 | ||
| Pb-666b | Quartz | 13 | PS/S | Ac | 1 | 0.90 | 187 (L) | |||||
| Pb-666b | Quartz | 14 | PS | C | 2 | 28.6–30.2 (V) | −57.7 | |||||
| Pb-666b | Quartz | 14 | PS | Ac | 1 | 0.95 | 140 (L) | −7.9 | 11.6 | |||
| Pb-666b | Quartz | 15 | PS/S | C | 3 | 27.7–30.3 (V) | −57.7 | |||||
| Pb-666b | Quartz | 15 | PS/S | Ac | 2 | 0.95 | 93–117 (L) | −10.1/−7.9 | 11.2–14.1 | |||
| Pb-666b | Quartz | 16 | PS/S | AC1 | 5 | 0.50–0.80 | −11.5/−7.6 (L) | −57.8 | 8.8–10.8 | 4.1–5.1 | ||
| Pb-666b | Quartz | 17 | PS/S | AC2 | 2 | 0.20–0.30 | 30.3–30.7 (V) | −57.4 | 7.5–7.8 | 4.3–4.9 | ||
| Pb-666b | Quartz | 17 | PS/S | C | 5 | 27.8–30.6 (V), 30.9 (L) | −57.4/−57.5 | |||||
| Pb-666b | Quartz | 17 | PS/S | Ac | 1 | 0.95 | 193 (L) | |||||
| Pb-666b | Quartz | 18 | PS/S | AC1 | 7 | 0.5–0.9 | 1.3–30.5 (L) | −57.5/−57.2 | 7.9–9.5 | 1.9–4.1 | ||
| Pb-666b | Quartz | 18 | PS/S | AC2 | 11 | 0.1–0.4 | 14.0–29.5 (L), 29.9–30.8 (V) | −57.3/−57.2 | 5.5–8.4 | 3.2–8.3 | ||
| Pb-666b | Quartz | 18 | PS/S | C | 2 | −0.6 (L), 29.8 (V) | −57.9/−57.3 | |||||
| Pb-666b | Quartz | 18 | PS/S | Ac | 7 | 0.8–0.95 | 69–90 (L) | −7.2/−5.2 | 8.1–10.7 | |||
| Pb-666b | Quartz | 19 | PS/S | AC2 | 1 | 0.10 | 30.1 (V) | −57.4 | 4.6 | 9.7 | ||
| Pb-666b | Quartz | 19 | PS/S | C | 2 | 29.5–29.8 (V) | −57.4 | |||||
| Pb-666b | Quartz | 20 | PS/S | AC1 | 1 | 0.50 | 26.3 (L) | −57.4 | 7.8 | 9.4 | ||
| Pb-666b | Quartz | 20 | PS/S | C | 2 | 274 (V) | 29.6–30.8 (V) | −57.4 | ||||
| Pb-666b | Quartz | 20 | PS/S | Ac | 3 | 0.85–0.95 | 55–185 (L) | −7.8/−7.2 | 10.7–11.5 | |||
| Pb-666c | Quartz | 21 | P? | AC1 | 1 | 0.70 | 0.5 (L) | 10.9 | ||||
| Pb-666b | Sphalerite | 22 | PS/S | C | 1 | 28.8 (V) | −57.6 |
| Sample | Mineral | Gen. | Type | n | Thtot (L) | Ti | Tmhh | Tmice | Tmcla | Salinity |
|---|---|---|---|---|---|---|---|---|---|---|
| Pb-666 | Quartz | P | AL+V, AL | 42 | 60–205 | −49 | −24.9/−0.1 | −5.1/−4.8 | 0.4–25.7 | |
| Pb-666 | Sphalerite | PS/S | AL+V | 42 | 116–198 | −50/−47 | −34.0/−24.0 | −25.9/−9.2 | −9.6/−0.9 | 13.1–26.4 |
| Pb-666 | Calcite | P | AL+V, AL | 16 | 120–136 | −21.9/−0.2 | 0.4–24.8 | |||
| Pb-667 | Calcite | P | AL+V, AL | 24 | 64 | −10.2/−0.2 | 0.4–14.2 | |||
| Pb-668 | Quartz | P | AL+V | 13 | 84–213 | −10.4/−3.1 | 5.1–14.4 | |||
| Pb-668 | Quartz | PS | AL+V | 11 | 137–220 | −9.2/−0.9 | 1.6–13.1 | |||
| Pb-668 | Quartz | PS/S | AL+V | 5 | 131–204 | −11.2/−3.9 | 6.3–15.2 | |||
| Pb-668 | Sphalerite | P | AL+V | 7 | 173–203 | −50/−49 | −24.7/−24.3 | −14.0/−12.6 | −7.8/−6.5 | 16.6–17.8 |
| Pb-668 | Sphalerite | PS | AL+V | 41 | 173–196 | −55/−49 | −26.0/−24.0 | −15.6/−11.0 | −5.5/−1.7 | 15.0–19.2 |
| Pb-668 | Dolomite | P | AL+V | 22 | 175–195 | −12.1/−3.1 | 5.1–16.1 | |||
| Pb-668 | Dolomite | PS | AL+V | 4 | 177–180 | −11.4/−2.5 | 4.2–15.4 | |||
| Pb-668 | Dolomite | PS/S | AL+V | 24 | 108–187 | −8.6/−7.6 | −4.8/1.3 | 11.2–12.4 | ||
| Pb-669 | Baryte | PS/S | AL | 51 | −26.1/−24.7 | −19.6/−0.2 | 0.4–22.2 | |||
| Pb-670 | Calcite | P | AL+V, AL | 15 | 82–109 | −3.3/−0.1 | 0.2–5.4 | |||
| Pb-666b | Quartz | P | AL+V | 35 | 65–198 | −49 | −31.1 | −27.2/−2.5 | −17.2/−3.2 | 3.9–27.2 |
| Pb-666b | Quartz | PS/S | AL+V, AL | 31 | 93–219 | −49 | −24.5/−22.6 | −14.5/−1.8 | −9.1/+3.4 | 3.1–18.3 |
| Pb-666b | Sphalerite | P | AL+V | 1 | 205 | −23.8 | −12.5 | 16.5 | ||
| Pb-666b | Sphalerite | PS | AL+V | 3 | 190–197 | −50 | −26.2 | −19.6/−19.1 | −7.7/−7.4 | 21.9–22.0 |
| Pb-666b | Sphalerite | PS/S | AL+V | 11 | 105–188 | −50 | −24.7 | −12.9/−12.7 | −1.1/−1.0 | 16.6–16.8 |
| Pb-666b | Sphalerite | S | AL+V, AL | 7 | 105 | −0.9/−0.2 | 0.4–1.6 | |||
| Pb-666c | Quartz | P | AL+V | 19 | 120–188 | −14.3/−12.8 | −4.0 | 16.7–18.1 | ||
| Pb-666c | Sphalerite | PS | AL+V | 7 | 162–188 | −26.3/−25.8 | −14.6 | −4.2/−2.0 | 18.3 |
| Sample | Mineral | Paragenetic Stage | δ13Cmineral (‰ V-PDB) | δ18Omineral (‰ V-SMOW) | Temperature (°C) | δ13Cfluid (‰ V-PDB) | δ18Ofluid (‰ V-SMOW) |
|---|---|---|---|---|---|---|---|
| Pb-668 | Dolomite | 2 | −7.8 | 16.2 | 175–195 | −8.2/−8.9 | +2.3/+3.6 |
| Pb-667 | Calcite | 3 | −7.1 | 18.5 | 50–64 | −9.9/−10.5 | −4.7/−2.6 |
| Pb-670 | Calcite | 3 | −7.8 | 16.3 | 82–109 | −9.8/−10.1 | −2.4/+0.6 |
| Pb-666 | Quartz-c | 3 | - | 19.0 | 60–136 | - | −8.8/+2.2 |
| Pb-666 | Quartz-r | 3 | - | 19.4 | 68–156 | - | −6.8/+4.5 |
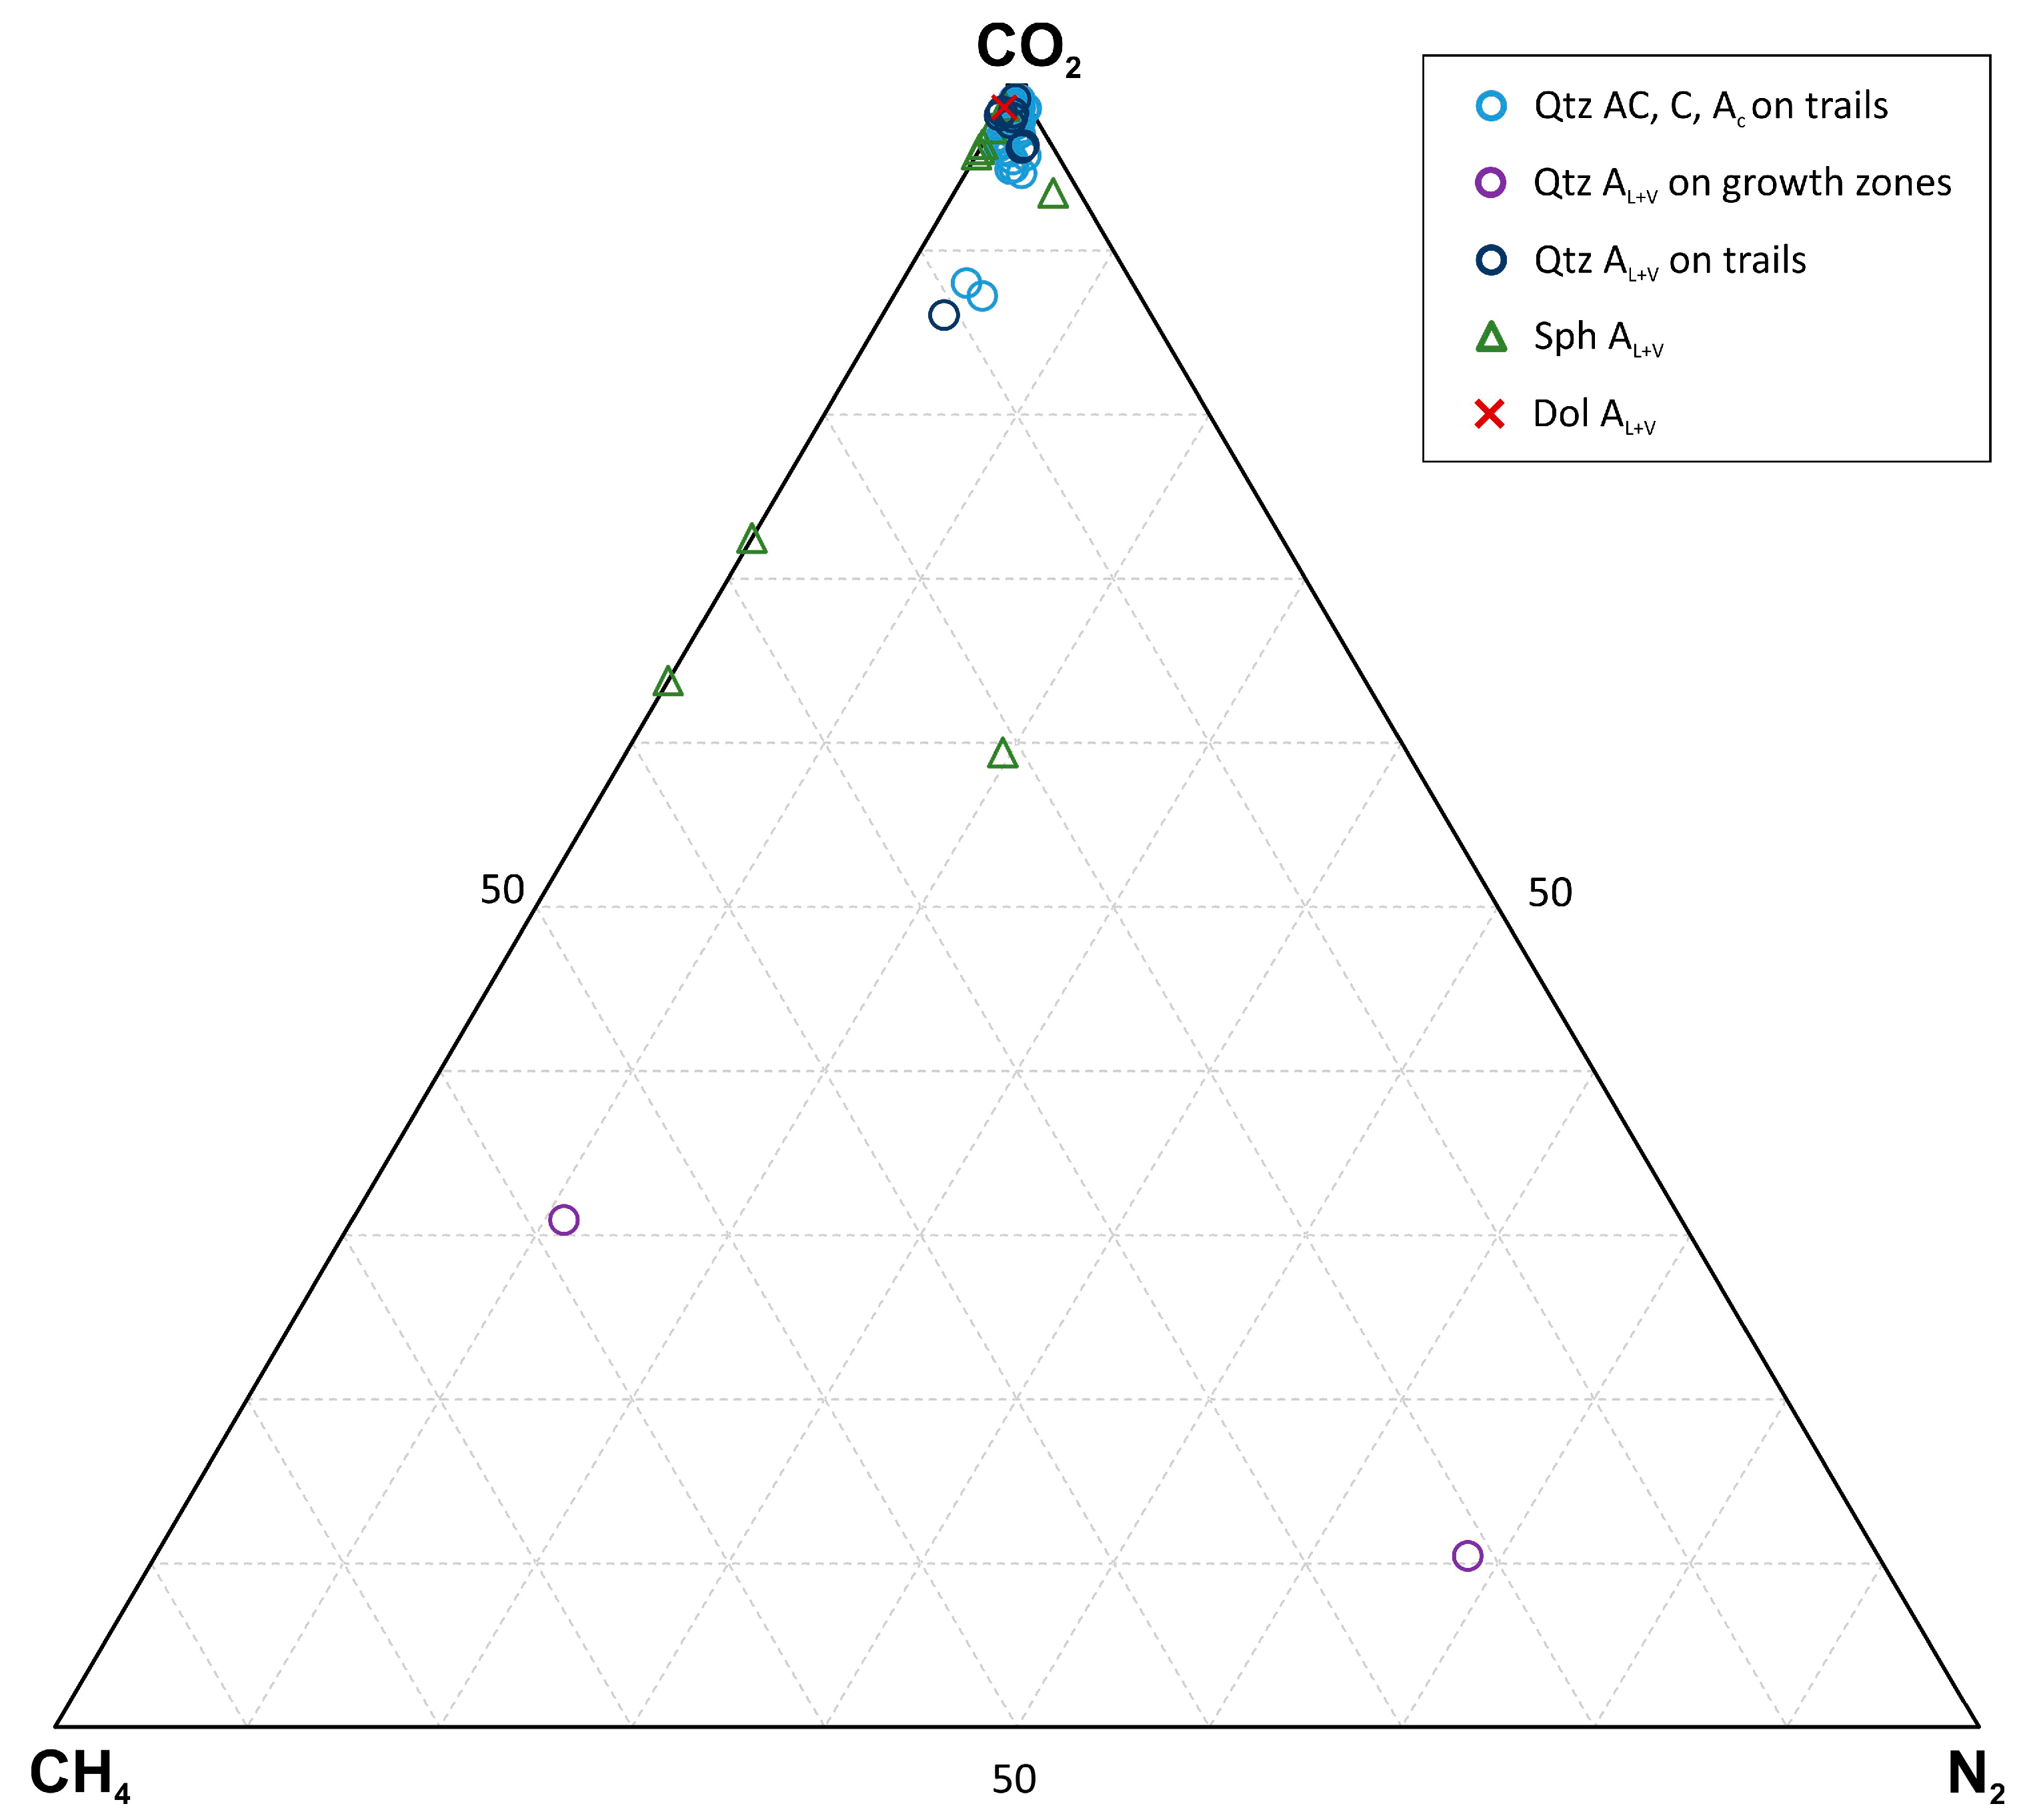
| FI No. | Trail | Thcar | TmCO2 | vol.% H2O | X (H2O) | X (CO2) | X (CH4) | X (N2) | D (g/cc) |
|---|---|---|---|---|---|---|---|---|---|
| 2146 | 1 | 29.0 (V) | −57.5 | 0.2 | 0.0180 | 0.9325 | 0.0281 | 0.0214 | 0.249 |
| 2148 | 1 | 27.7 (V) | −57.5 | 0.2 | 0.0183 | 0.9513 | 0.0216 | 0.0088 | 0.247 |
| 2154 | 2 | 26.2 (V) | −57.5 | 0.2 | 0.0194 | 0.9466 | 0.0226 | 0.0113 | 0.231 |
| 2155 | 2 | 28.1 (V) | −57.5 | 0.2 | 0.0186 | 0.9295 | 0.0234 | 0.0286 | 0.240 |
| 2149 | 3 | 28.8 (V) | −57.5 | 0.2 | 0.0176 | 0.9465 | 0.0269 | 0.0089 | 0.255 |
| 2150 | 3 | 28.5 (V) | −57.5 | 0.2 | 0.0177 | 0.9510 | 0.0243 | 0.0070 | 0.255 |
| 3363 | 12 | −2.3 (L) | −57.9 | 0.7 | 0.0198 | 0.9574 | 0.0117 | 0.0112 | 0.801 |
| 3380 | 14 | 30.2 (V) | −57.7 | 0.6 | 0.0457 | 0.9417 | 0.0065 | 0.0060 | 0.291 |
| 3381 | 14 | 28.6 (V) | −57.7 | 0.6 | 0.0495 | 0.9375 | 0.0053 | 0.0077 | 0.268 |
| 3383 | 15 | 30.3 (V) | −57.7 | 0.2 | 0.0154 | 0.9757 | 0.0040 | 0.0048 | 0.296 |
| 3384 | 15 | 27.7 (V) | −57.7 | 0.2 | 0.0163 | 0.9749 | 0.0040 | 0.0048 | 0.280 |
| 3409 | 18 | −0.6 (L) | −57.9 | 0.4 | 0.0114 | 0.9697 | 0.0132 | 0.0055 | 0.791 |
| 3413 | 18 | 29.8 (V) | −57.3 | 0.1 | 0.0092 | 0.9878 | 0.0031 | 0.0000 | 0.302 |
| 3432 | 20 | 30.8 (V) | −57.4 | 0.1 | 0.0079 | 0.9784 | 0.0025 | 0.0112 | 0.292 |
| 3433 | 20 | 29.6 (V) | −57.4 | 0.1 | 0.0084 | 0.9779 | 0.0025 | 0.0112 | 0.276 |
Disclaimer/Publisher’s Note: The statements, opinions and data contained in all publications are solely those of the individual author(s) and contributor(s) and not of MDPI and/or the editor(s). MDPI and/or the editor(s) disclaim responsibility for any injury to people or property resulting from any ideas, methods, instructions or products referred to in the content. |
© 2024 by the authors. Licensee MDPI, Basel, Switzerland. This article is an open access article distributed under the terms and conditions of the Creative Commons Attribution (CC BY) license (https://creativecommons.org/licenses/by/4.0/).
Share and Cite
Ulmanová, J.; Dolníček, Z.; Škácha, P.; Sejkora, J. Origin of Zn-Pb Mineralization of the Vein Bt23C, Bytíz Deposit, Příbram Uranium and Base-Metal Ore District, Czech Republic: Constraints from Occurrence of Immiscible Aqueous–Carbonic Fluids. Minerals 2024, 14, 87. https://doi.org/10.3390/min14010087
Ulmanová J, Dolníček Z, Škácha P, Sejkora J. Origin of Zn-Pb Mineralization of the Vein Bt23C, Bytíz Deposit, Příbram Uranium and Base-Metal Ore District, Czech Republic: Constraints from Occurrence of Immiscible Aqueous–Carbonic Fluids. Minerals. 2024; 14(1):87. https://doi.org/10.3390/min14010087
Chicago/Turabian StyleUlmanová, Jana, Zdeněk Dolníček, Pavel Škácha, and Jiří Sejkora. 2024. "Origin of Zn-Pb Mineralization of the Vein Bt23C, Bytíz Deposit, Příbram Uranium and Base-Metal Ore District, Czech Republic: Constraints from Occurrence of Immiscible Aqueous–Carbonic Fluids" Minerals 14, no. 1: 87. https://doi.org/10.3390/min14010087