3.1. Mo and U Enrichment in Surface Water
The upper reaches of the Wenyu River have a neutral pH and are weakly oxidized, but after flowing through the mining area, its characteristics have been changed. From sites (W2~W5), the pH value was between 6.18 and ~8.6 and the Eh value was between 55 and −77, indicating that the river water changed from weakly acidic to alkaline from upstream to downstream and from an oxidizing environment to a reducing environment. In addition, the farther away from the mining area, the higher the pH value and the lower the Eh value, showing a negative correlation between the pH value and the Eh value and showing that the pH value was negatively correlated with the Eh value. The Eh values ranged from 28 mV to 58 mV, with an average value of 44.75 mV, and Eh at each sampling site changed little, indicating an oxidative environment. Therefore, the water environment of the Wenyu River in the study area presented the characteristics of a neutral–weak, acid–alkaline, and weak oxidation–reduction environment from upstream to downstream. The pH of the tailing water ranged from 6.12 to 6.38, with a small change because the tailings may contain molybdenite [
9,
28], which is composed of many metal sulfide minerals (such as pyrite, etc.), and these minerals would increase the pH of the water after dissolving in the water. Molybdate in an acidic environment easily adsorb and precipitate metal ions in water, while in an alkaline environment, adsorption is not easy [
29,
30].
The average concentration of Mo in Chinese rivers ranges up to 20 μg/L, and the concentration of U is about 1 μg/L [
31] (Zao et al., 1990). The contents of Mo and U from the tailing ponds in the four water sampling sites (TW01, TW02, TW03, and T01) were 2.62 mg/L and 0.03 mg/L, respectively, which were 131 times and 30 times the background value, respectively. The Mo content of TW01, TW02, TW03, and T01 exceeded the background value by 4, 32, 62, and 33 times, respectively (
Table 3). The U content of the other three sampling sites (TW01, TW02, T01) was 2 times, 26 times, and 5 times the background value, respectively, except that TW03 had no value. The average content of U and Mo in TW01, TW02, TW03, and T01 was also 33 times and 30 times the background value, respectively (
Table 3). The content of Mo and U in the surface water at the tailings ponds was significantly higher than the background values, indicating the potential pollution of the water body.
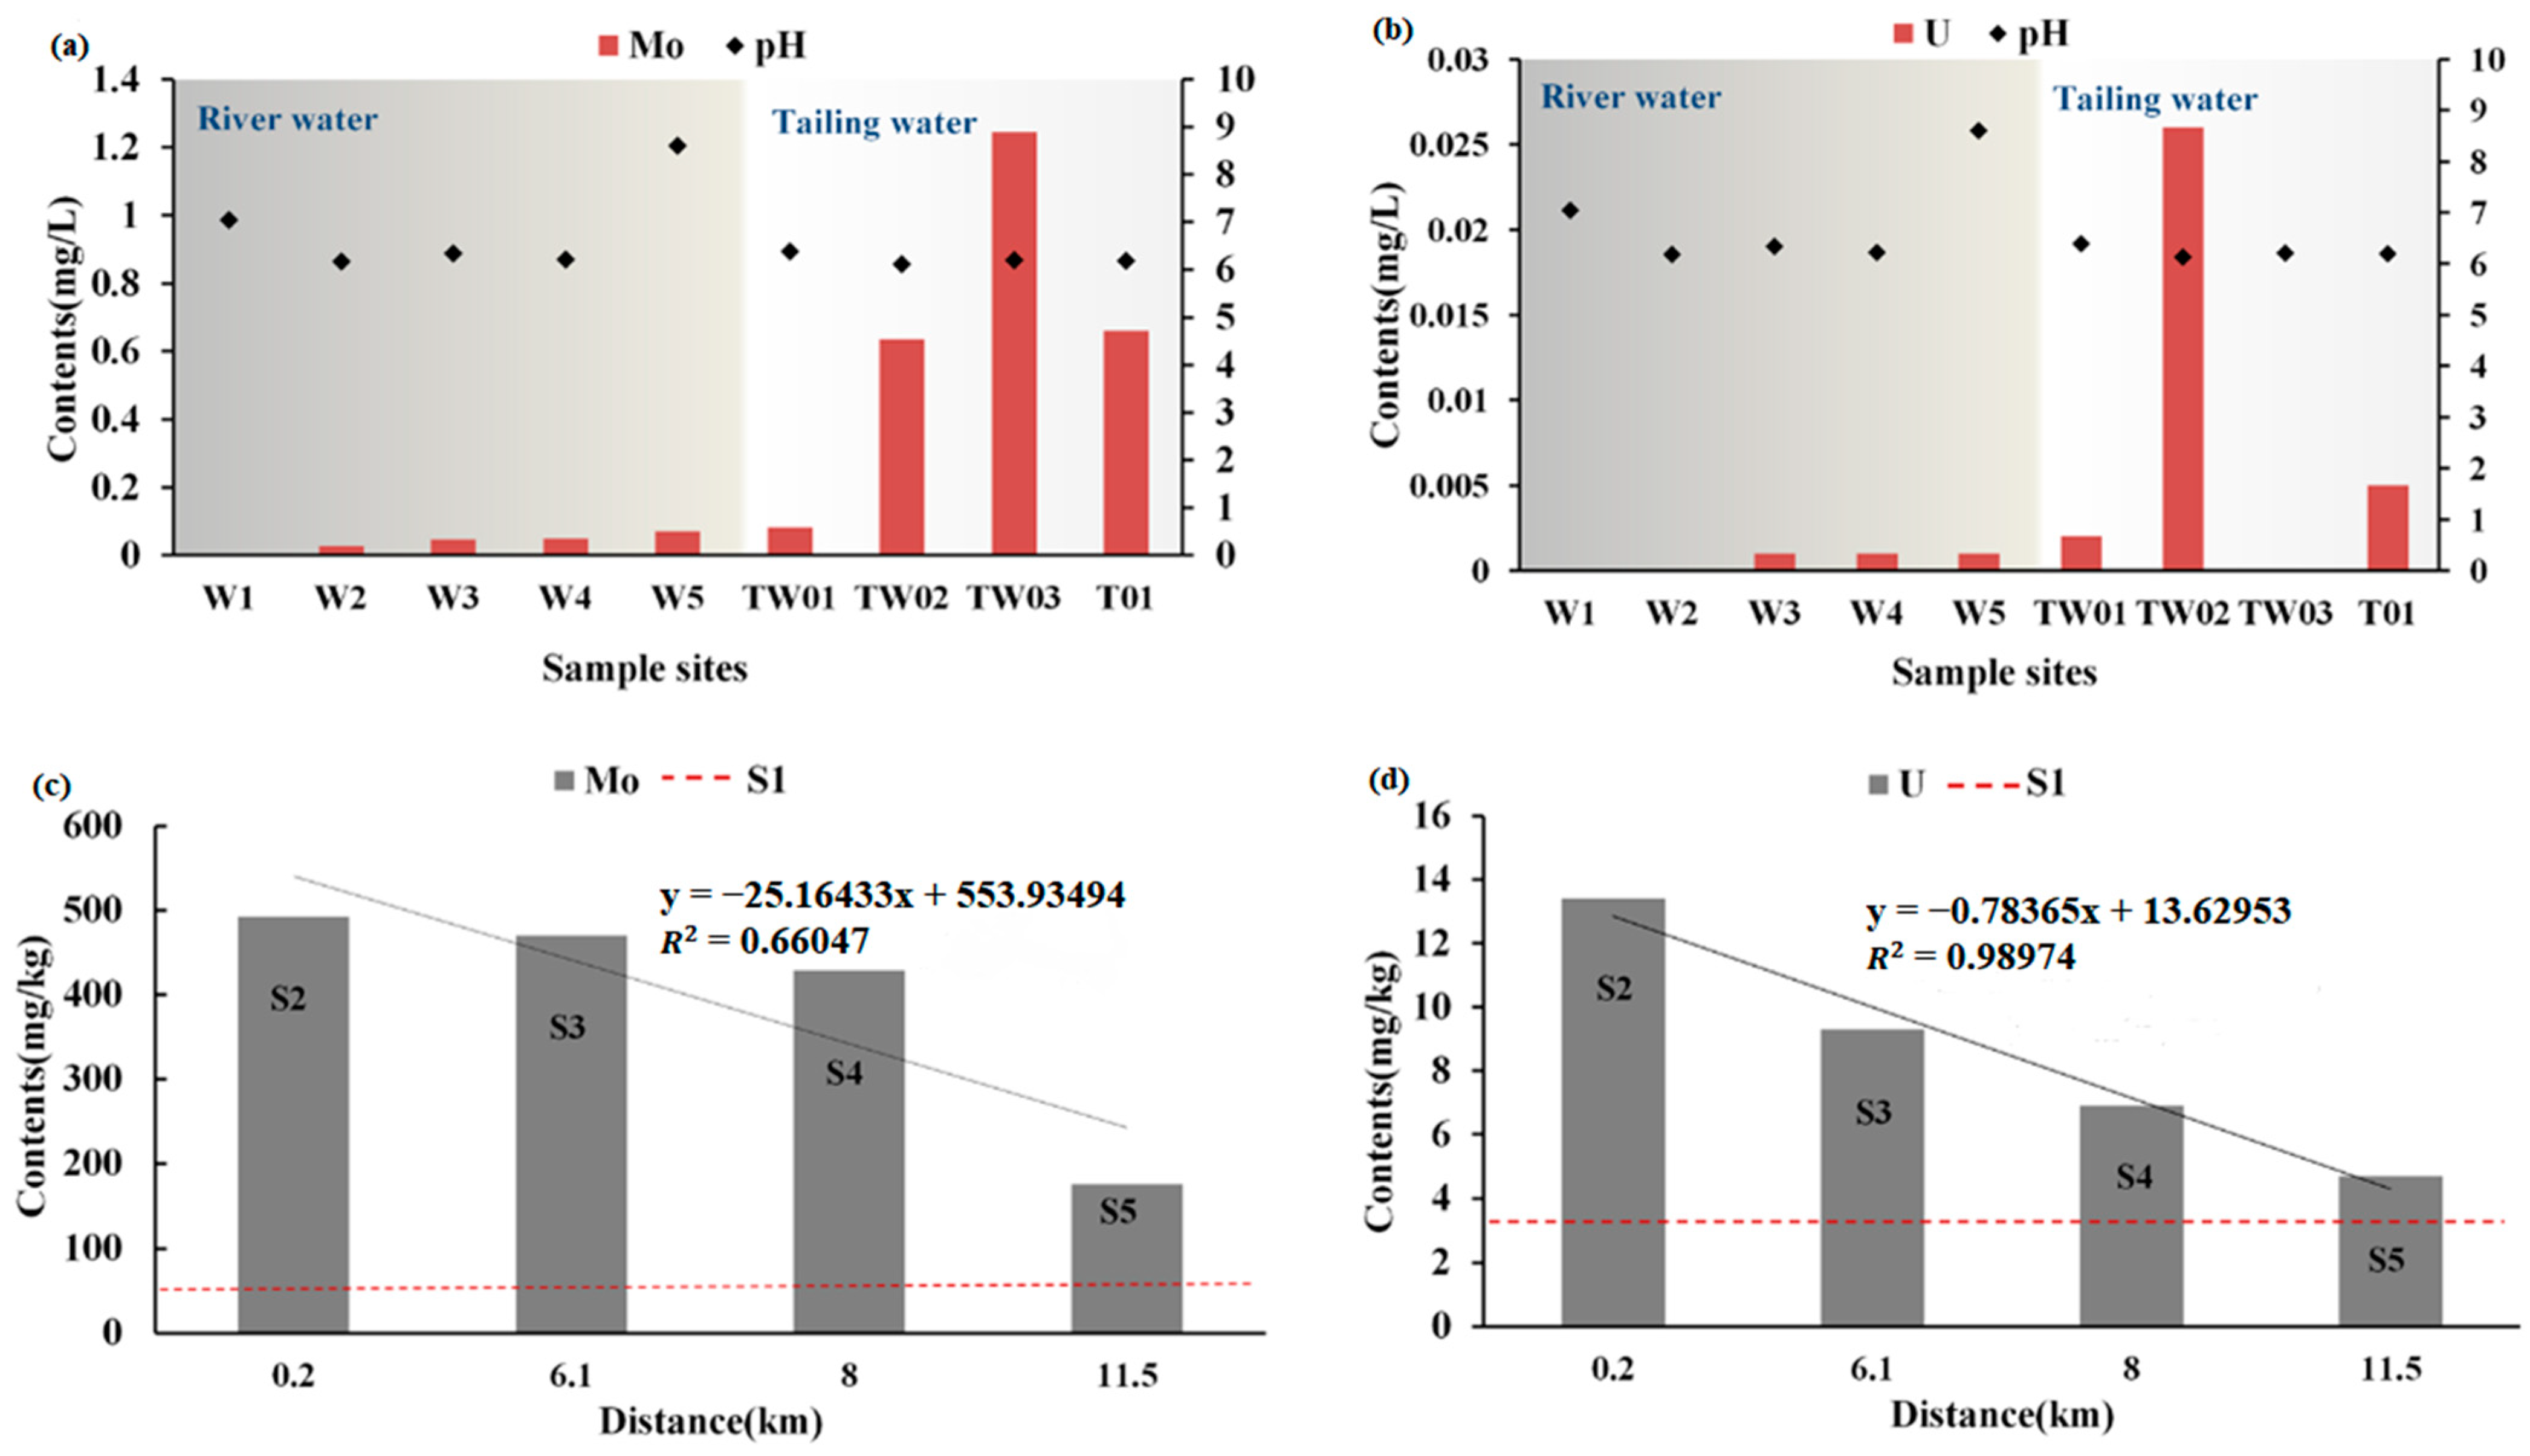
There may be many reasons for the high concentration of Mo. The average pH value of tailing water was 6.2, with no significant change, indicating a low correlation between Mo content and pH value (
Figure 3a). With the increase in pH value in river water, the content of Mo appeared at the highest value of W5 (
Figure 3a). According to previous studies, Mo is hardly adsorbed at pH > 8 [
34], while the pH value of W5 was 8.6, so Mo in water cannot be adsorbed in this environment, resulting in an increase in molybdenum content detected in rivers. In addition to the influence of pH, the upper reaches of the Wenyu River had a narrow channel, a large river-specific fall, and a fast flow rate, while the lower reaches had a wide channel, a slow flow rate, and a superior condition for trace metal enrichment compared with the upper reaches, resulting in an increasing Mo concentration with the flow direction.
In general, the optimal pH for the adsorption and precipitation of U in water by clay minerals or metal minerals is 5 [
35], and when the environment is oxidizing, U (VI) is relatively unstable and prone to migration. When the environment is a reducing environment, U (VI) will be reduced from a stable state to U (IV) and hydrolyze to precipitate. Although the pH value of the W5 sample increased to 8.6, the adsorption of U was also affected by the Eh value, and the Eh value at W5 reflected a reducing environment. Therefore, U (VI) was still reduced to U (IV) and precipitated [
20,
36,
37,
38,
39]. Therefore, the U content in the river water was very low and did not change much (
Figure 3b).
3.2. Distribution of U and Mo in Downstream Sediment
The geochemical background values of Mo and U in soil in Xi’an are 0.8 mg/kg and 2.2 mg/kg, respectively [
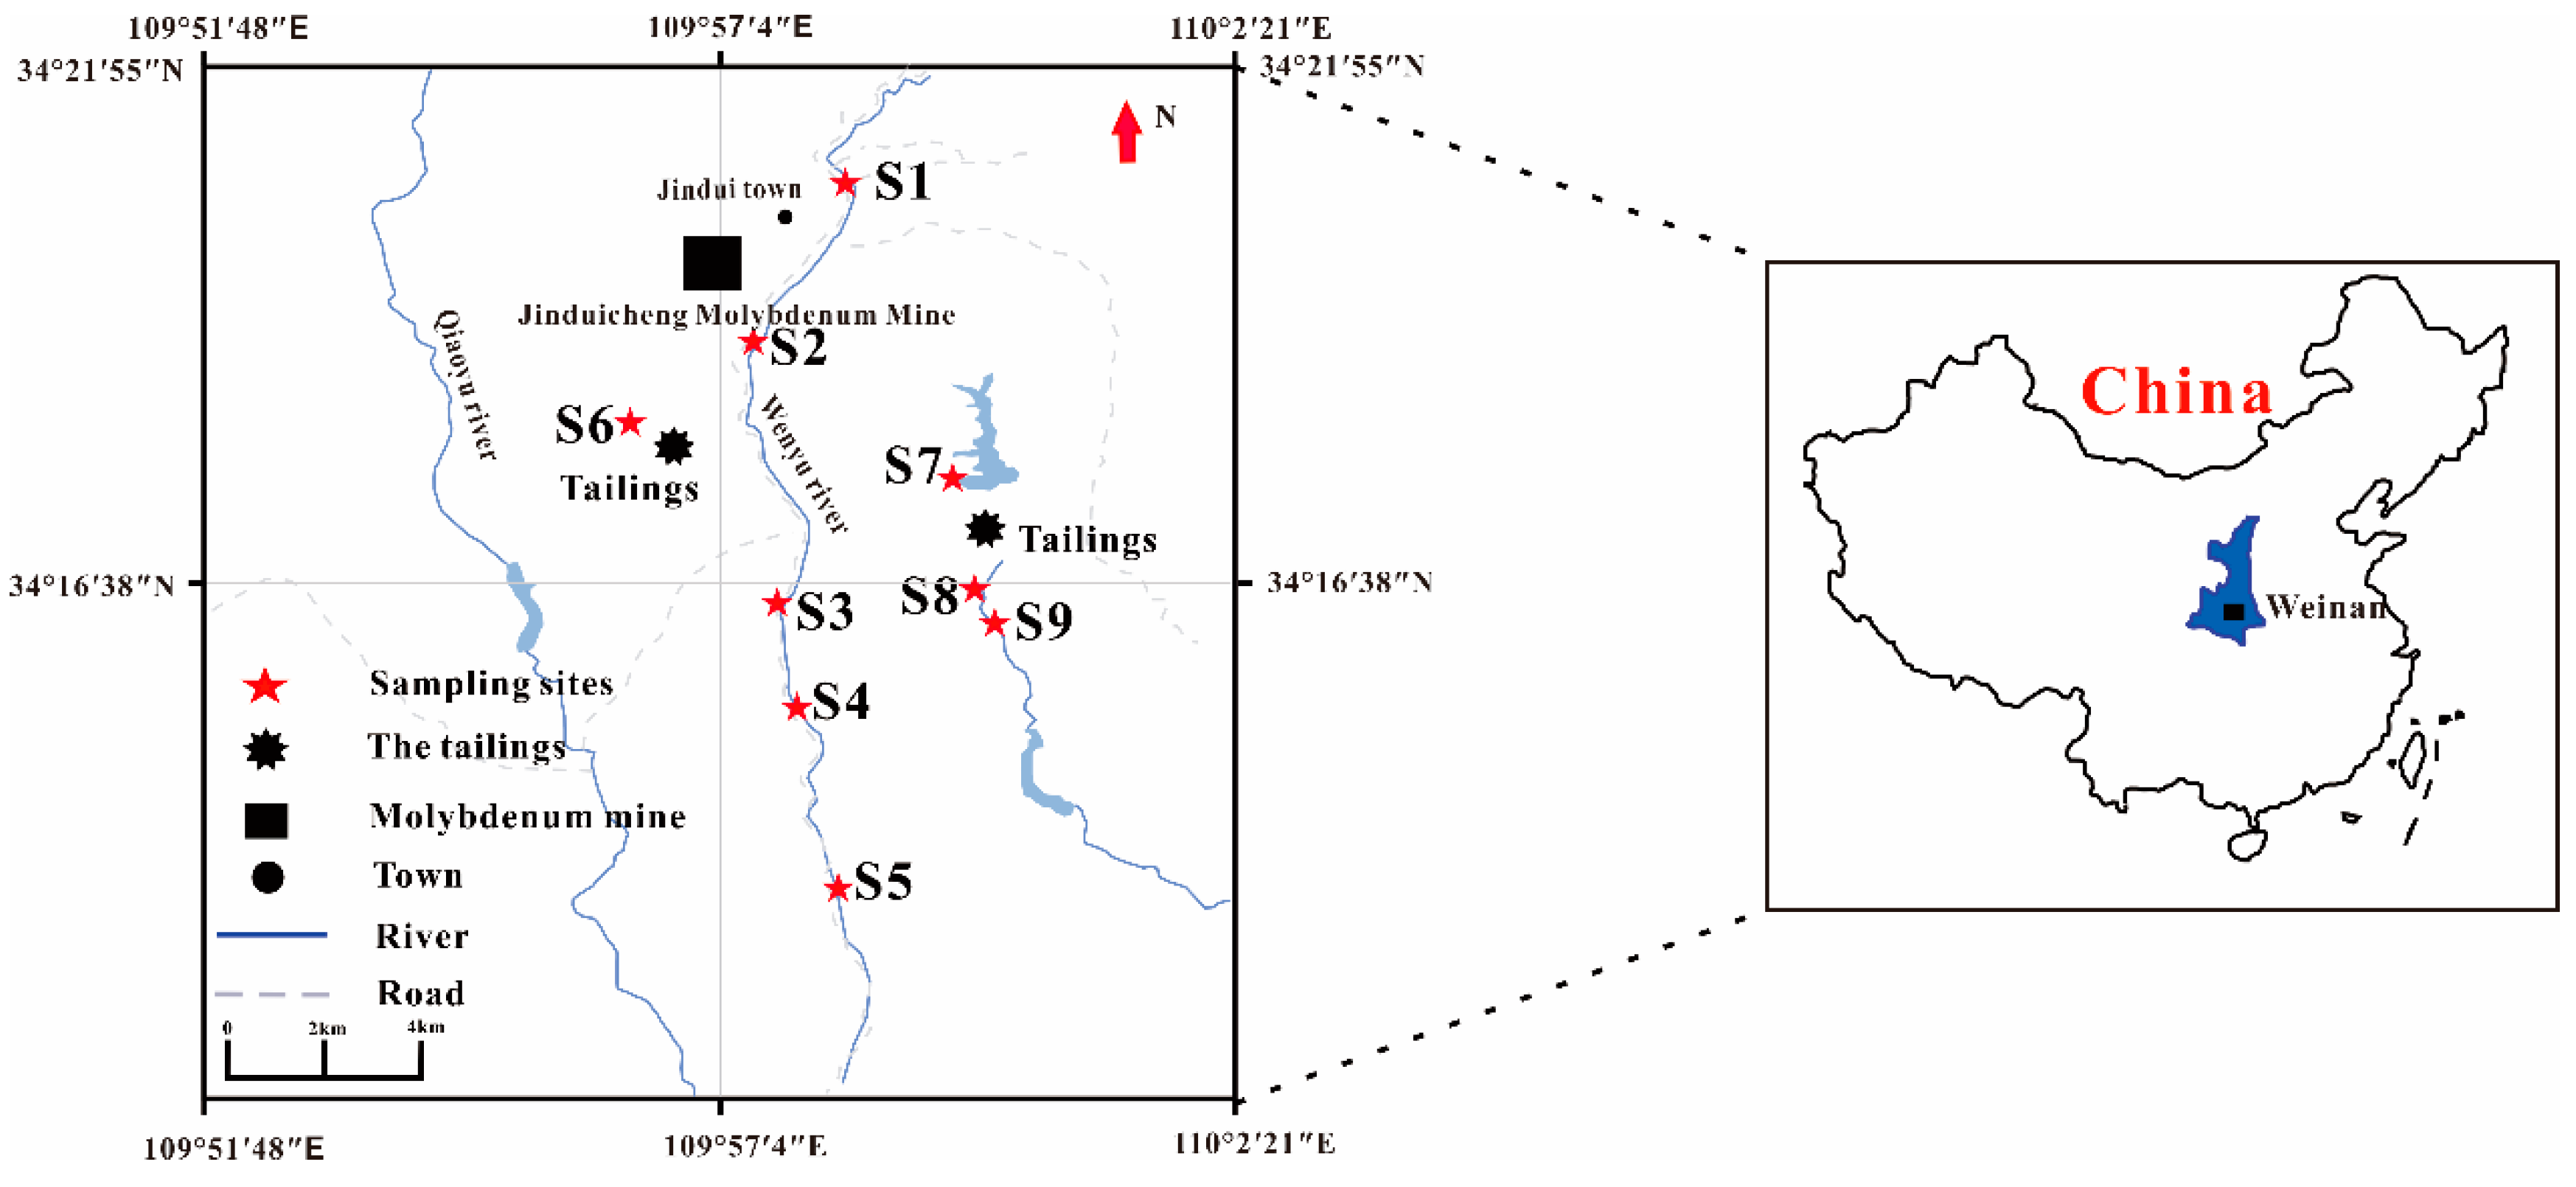
32]. Due to the proximity of the sampling point to the southeastern part of Xi’an, it was used as one of the reference factors for background values. S1 is located upstream of the mine and is not affected by mining wastewater, so the Mo and U contents in SE1 were used as the background values for the study area.
Through the analysis of sediment samples (SE2–SE5) from the Wenyu River, it was found that the total amounts of Mo and U in the sediment were 1566.5 mg/kg and 34.3 mg/kg, respectively, which were 119 times and 7.5 times higher than the background values (
Table 3). The average contents of Mo and U were 391.6 mg/kg and 8.6 mg/kg, respectively, which were 30 times and 1.9 times the background values, respectively (
Table 3). Compared to the contents of Mo and U in river water, the contents of Mo and U in sediments are significantly higher because colloids and clay minerals that enter the river may adsorb trace metals and precipitate them into sediments [
40,
41,
42,
43]. In general, the contents of Mo and U in the sediments of the Wenyu River exceeded the background values (SE1), and the content of Mo was significantly higher than the background value, indicating that Mo pollution in the Wenyu River sediments is severe (
Figure 3a,b).
Figure 3a,b also show the distribution characteristics of Mo and U in the tailing ponds. The content of Mo in TW03 was higher than that in TW02, which was related to the collection site location of TW03. TW03 is in the drainage and sedimentation tank of the tailings pond. The fluidity and turbulence of the water flow made the Mo in the tailing sand enter the water and flow downstream, so that the content of Mo in T01, located downstream of the tailing pond, was high. The content of U in the tailing pond water was relatively low, and the content in TW02 was the highest. The content of U element at T01 was less than at TW02 and TW03, indicating that U element was concentrated in the tailing pond and that the migration amount decreased with the increase in drainage.
In general, Mo and U mainly exist in sediments in the study area, and the content of Mo and U in surface water was very low. As the mining area affected the lower reaches of the river, the Mo content in the river water increased with the distance, while the U content changed little. The content of Mo and U in river sediments gradually decreased with the increase in distance, and the distance and trace metal content showed a strong positive correlation.
The spatial analysis of sediments revealed that with an increase in distance, the content of U and Mo gradually decreased (
Figure 3c,d); R
2 was 0.6605 and 0.9897, respectively. To predict the downward trend of Mo and U content in river sediments and the spatial impact range of molybdenite downstream, a linear regression equation was used to fit the data. It was calculated that the Mo content at about 21.5 km downstream of the Wenyu River was lower than the background value S1, while the U content was lower than the background value at 12 km; thus, the theoretical range of the polluted environment in the mining area was 21.5 km (Mo) and 12 km (U), respectively.
3.3. Migration of U and Mo Downstream
The enrichment and migration of trace metals mainly occurred by two mechanisms: (1) releasing from the minerals through weathering and rainfall erosion; and (2) diffusing, migrating, and transforming in the soil and water bodies through a series of physical and chemical processes, then flowing into the groundwater and sediments. In order to analyze the horizontal migration and distribution of Mo and U in river water bodies and sediments, this paper mainly analyzed the second mechanism.
The previous paper on the content of trace metal elements alone is not sufficient to explain the migration mechanism, and it is also necessary to analyze the morphology of Mo and U (
Table 4).
Many studies have suggested that the content of trace metal forms is closely related to the total amount of trace metals, and the organic matter content and pH value will also affect the content of trace metal speciation [
44,
45]. To examine if the speciation distribution of Mo and U was related to the total content, we carried out a correlation analysis (
Table 5) between the total amount and form of Mo and U. The result showed that the content of trace metals had varying degrees of influence on their speciation distribution. Except for the weak acid-soluble state, the morphological distribution of molybdenum was positively correlated with the total content. There was a significant positive correlation between molybdenum content and residual forms (
p = 0.974).
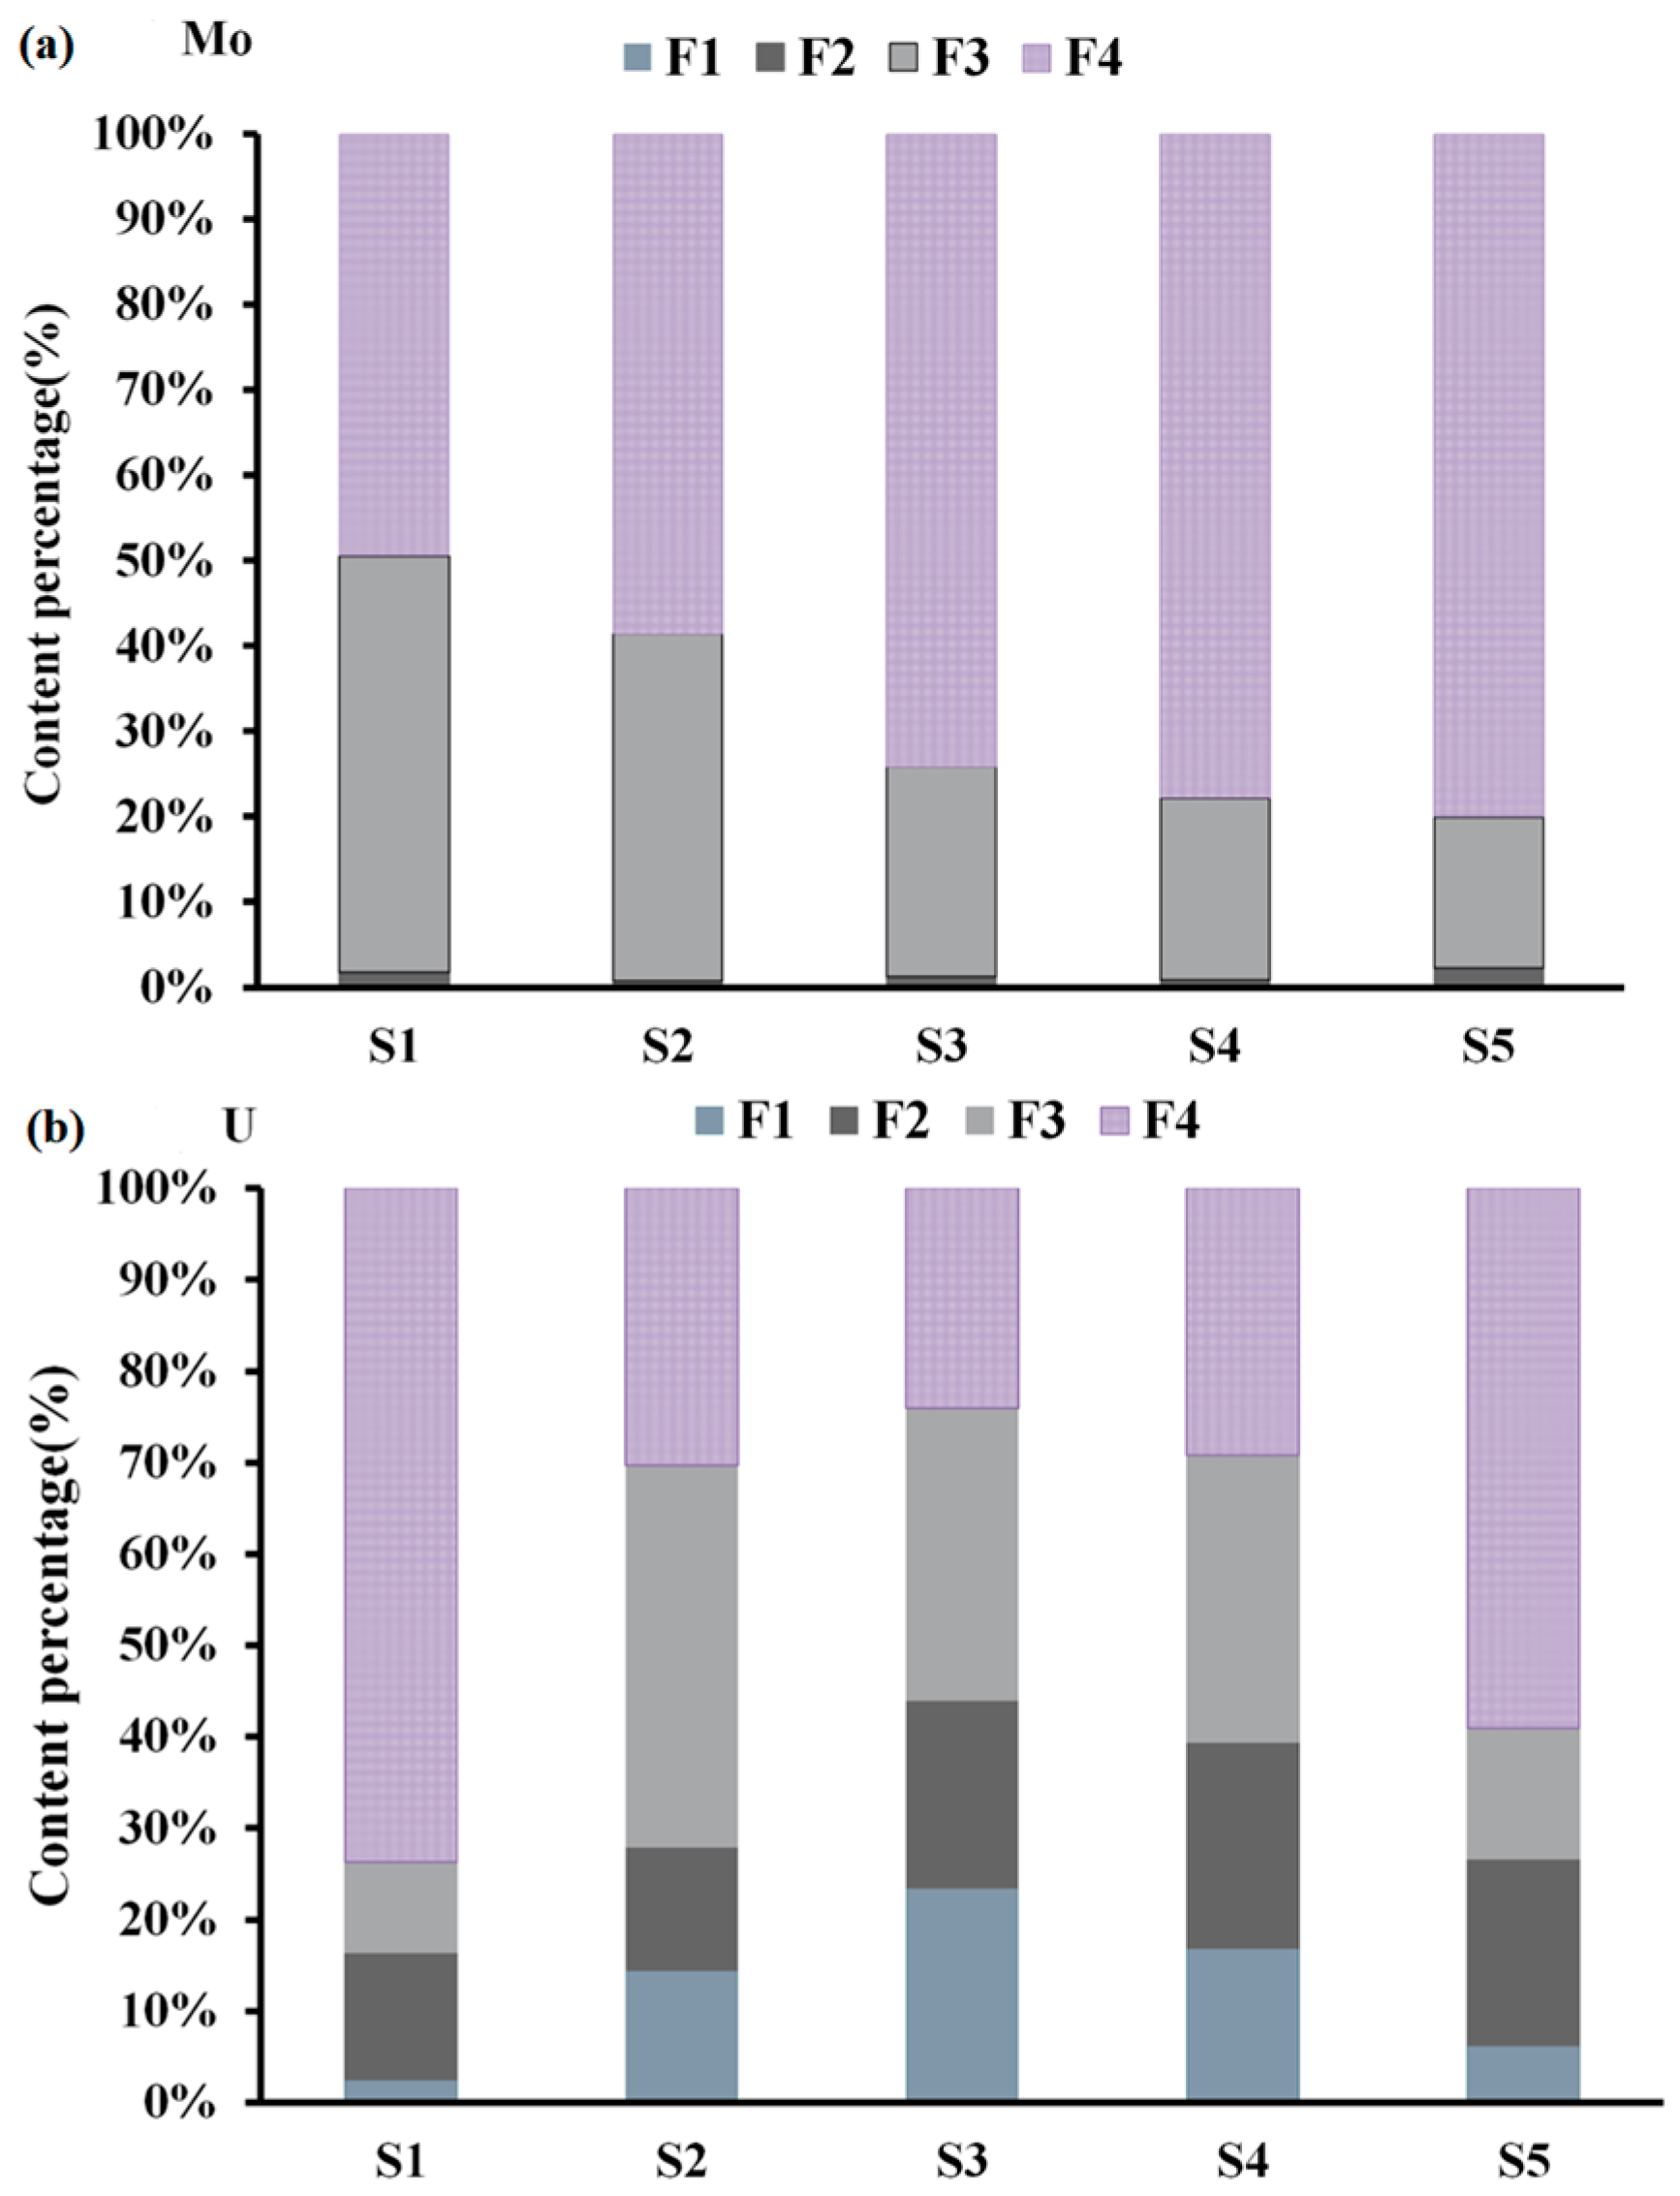
According to
Figure 4a, Mo in river sediments is mainly the residual fraction (F4), accounting for 68% of the total content. The residual fraction is the result of natural Mo ore rock weathering and soil erosion. It is hardly to migrate and has low pollution potential. S1 is in the upstream of the mining area, but the Mo of S1 had the same speciation characteristics as the Mo in the downstream of the mining area. Both were mainly the residual fraction, indicating that the Mo in the Wenyu River sediments was mainly the residual fraction. Mo has been stable in the sediment for a long time and is not easily absorbed by plants. Therefore, Mo in sediments of the Wenyu River migrated via runoff migration and deposition. In conclusion, Mo in the sediments of the Wenyu River mainly exists as a residual fraction.
Previous studies have shown that the speciation of U in natural water is mainly affected by pH and redox potential [
18]. The U in SE1 and SE5 samples is mainly a residual fraction, accounting for 73.71% and 59.07%, respectively. However, the main morphology of U had changed downstream of the mining area. The U in three samples (SE2, SE3, SE4) were mainly non-residual fractions (F1 + F2 + F3), on average accounting for 65% (
Figure 4b). In addition, U was a residual fraction at SE5, and the speciation distribution of SE5 and SE1 was highly similar (
Figure 4b). This explains that the Wenyu River downstream was affected by the discharge of sewage from the mining area and the slag accumulation, resulting in the enrichment of U. It also showed that the migration and morphological transformation of U in water were affected by external factors, such as human activities.
The U speciation distribution also had a strong positive correlation with the total content in addition to the residual fraction of U. And the content of U had a high correlation coefficient with the oxidizable speciation (p = 0.987). Therefore, for the high proportion of the residual fraction of U in SE5 to have had little correlation with the total content, the explanation is that because U is a geochemically sensitive element and U (IV) is stable in a reducing environment and difficult to migrate, more of the residual fractions were embedded in the mineral lattice.
The distribution coefficient of trace metals in the water sediment phase reflects the migration ability of trace metals between the water phase and the sediment phase and also reflects the pollution potential of trace metals [
46,
47]. The distribution coefficients of Mo and U at five sampling sites in the Wenyu River were calculated. The results showed
(Mo) >
(U), indicating that Mo mainly exists in sediments and the migration of U in water is stronger than Mo (
Table 6). Therefore, the pollution potential of U in the study area was stronger than that of Mo. The Mo and U in the sediment were about 5 orders of magnitude higher than those in the water, indicating that the sediment had a greater influence on the distribution and migration of Mo and U.
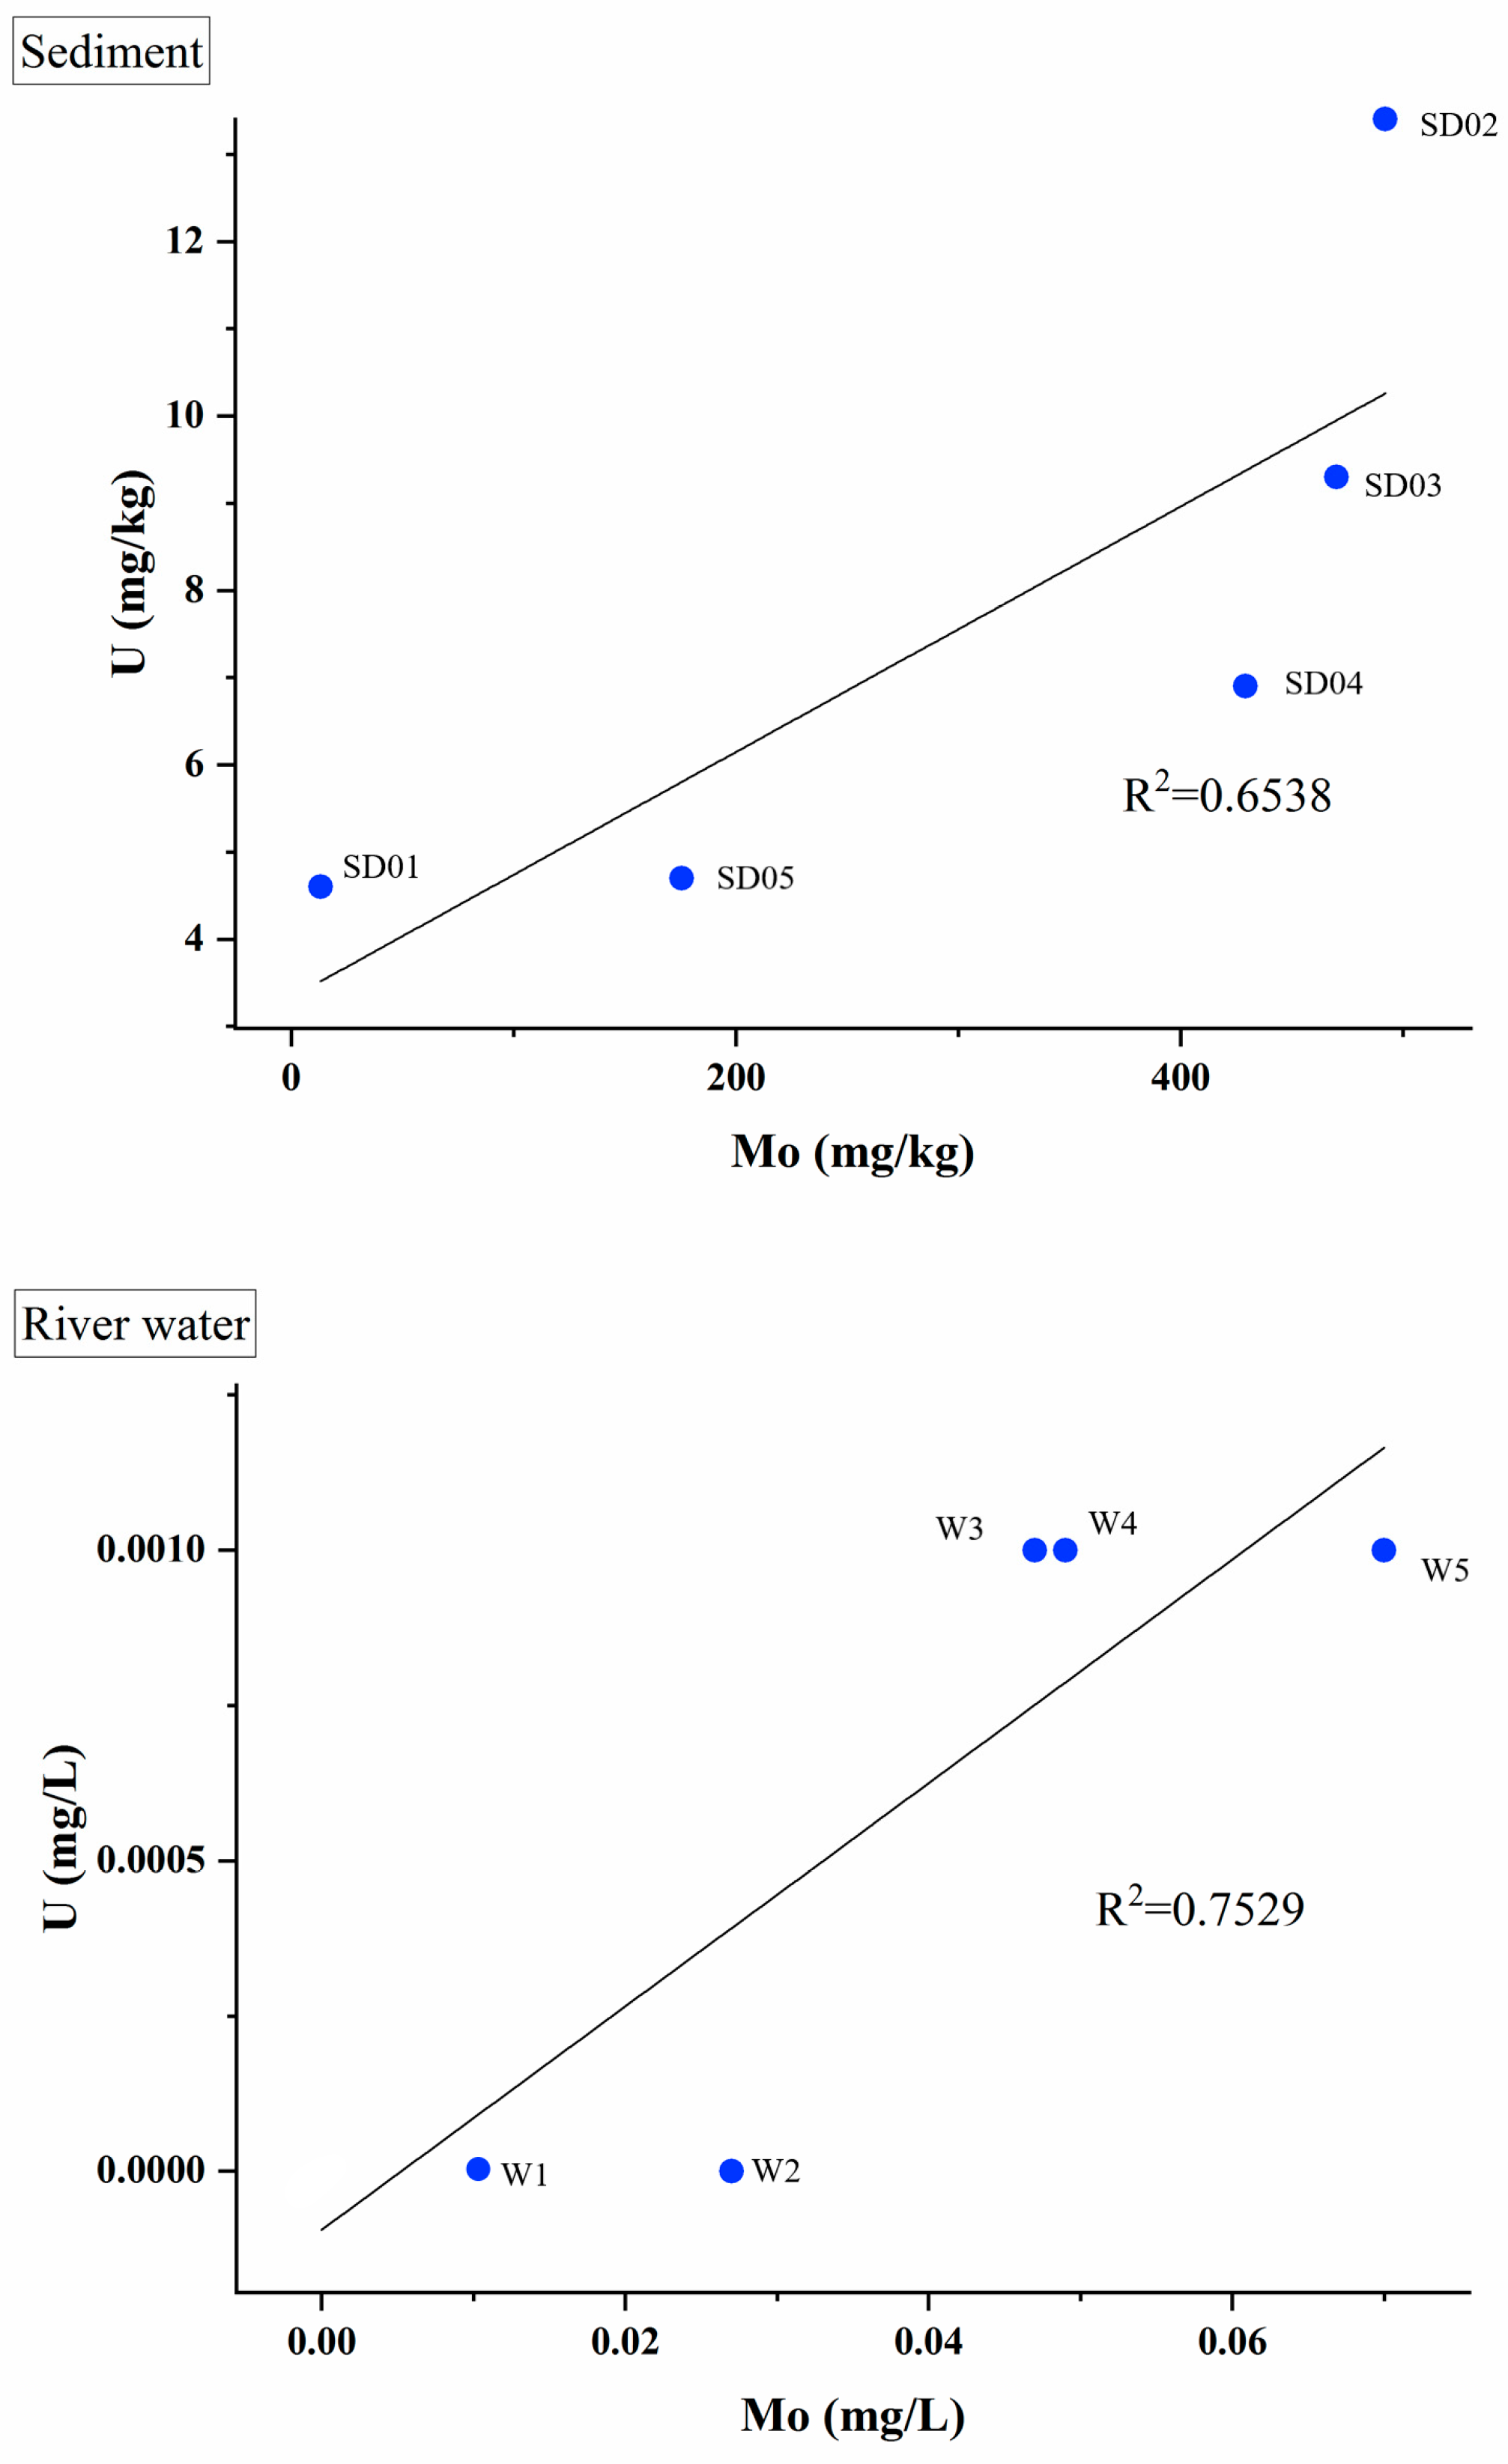
To gain a deeper understanding of the downstream migration of U and Mo, a linear correlation analysis was conducted on the Mo and U concentrations in the river water and sediments downstream of the mining area. The results show that the correlation coefficient is R
2 = 0.6538 (sediments) and R
2 = 0.7529 (river water), indicating that U and Mo in sediments and water had similar sources, especially natural mineral weathering (
Figure 5). The results were consistent with the findings of Kayzar et al. (2014) [
23,
48]. On this basis, it is suggested that the high content of U downstream of the mining area may be the result of U enrichment in molybdenite.

 and
and 


