Article

Dehydroxylation of Kaolinite and Halloysite-Rich Samples: An In Situ Study of the Texture and Structural Evolutions

by
Imane Daou
1,
Cristian Mocuta
2,
Gisèle Laure Lecomte-Nana
1,*,
Nicolas Tessier-Doyen
1,
Claire Peyratout
1,
René Guinebretière
1 and
Dominique Thiaudière
2
1
IRCER (Institut de Recherche sur les Céramiques), Université de Limoges, 12 rue Atlantis, 87068 Limoges, France
2
Synchrotron SOLEIL, L’Orme des Merisiers, Départementale 128, 91190 Saint-Aubin, France
*
Author to whom correspondence should be addressed.
Minerals 2023, 13(11), 1418; https://doi.org/10.3390/min13111418
Submission received: 17 September 2023 / Revised: 31 October 2023 / Accepted: 2 November 2023 / Published: 7 November 2023
(This article belongs to the Special Issue Microstructural Characterization in Applied Mineralogy)

Abstract

:
Halloysite and kaolinite are dioctahedral TO phyllosilicates that drive the interest of scientists for formulating environmentally friendly materials, and consequently in the field of ceramics. The main scope of this study was the understanding of the texture evolution upon the dehydroxylation reaction and the influence of the presence of halloysite. In situ synchrotron (002) and (111) poles figures were recorded on the DiffAbs beamline at SOLEIL Synchrotron, from room temperature to 1000 °C, on kaolinite and/or halloysite-rich samples shaped by tape casting. Commercial kaolins and halloysite provided by Imerys company were used. The samples were labeled KRG100, KCS100, H100, KRG50H50 and KRG59H50 in relation with the wt. % of kaolin (KRG, KCS) or halloysite (H) clays. In samples KCS100 and KRG100, a strong texture was observed until in situ annealing at 700 °C, with respect to the c-axis of kaolinite. On the contrary, the texture with respect to the c-axis of halloysite for the sample H100 was weak whatever the temperature was. Moreover, this weak texture disappeared before the complete dehydroxylation of halloysite. This is due to the opening of some halloysite tubes. When considering the samples KRG50H50 and KCS50H50, a significant texture was observed with the c-axis preferentially oriented perpendicular to the sample surface. The presence of kaolinite platelets predominated onto the alignment of halloysites tubes. Furthermore, it was noted that the halloysite influenced the (002) diffracted intensity into the temperature range 20 °C to 400 °C. Above 400 °C, the behavior obtained for the (002) reflection in samples KRG50H50 and KCS50H50 was similar to the behavior noticed for pure kaolins KRG100 and KCS100, respectively. The dehydroxylation temperature range appeared to be relevant with combined effect of kaolinite and halloysite transformations arising from KRG100 or KCS100 and H100 samples. Therefore, the onset point of dehydroxylation is 550 °C ± 25 °C for KRG100, KCS100, KRG50H50 and KCS50H50. For the pure halloysite H100 sample, the dehydroxylation starts at the lower temperature 475 °C. It was also noted that during the dehydroxylation of kaolinite, the characteristic portion of ring related to the diffracted intensity of the (111) reflection located at χ = 45° tended to disappear above 550 °C and led to the formation of a new transitory phase with a (111) reflection with perpendicular alignment to the c-axis. Indeed, an epitaxial relationship with the (111) kaolinite reflection could be assumed. Further X-ray scattering experiments allowed highlighting the effective offset temperature of the dehydroxylation, which was identified as close to 720 °C. The metakaolinite achieved structural transformation to another transitory phase at 1000 °C.

1. Introduction

Kaolinite and halloysite are clay minerals that are frequently used to formulate a large variety of materials ranging from low-added to high-added values products [1,2,3]. Raw clays containing kaolinite and halloysite are used for applications ranging from domestic uses through the biomedical and energy fields [1,2,3]. The advantage of these clay minerals is their availability and environmentally friendly impact. In addition, some drawbacks are related to the occurrence of secondary phases in their main deposits, which lead to the requirement of different physical and chemical treatments in order to control the purity of their respective raw materials [3,4,5,6]. Both kaolinite and halloysite are TO dioctahedric phyllosilicate, but kaolinite is characterized by platelet-like particles while halloysite exhibits a tubular and/or cylindrical shape [7]. Halloysite has the same general chemical composition as kaolinite with additional water content. Two types of halloysite are usually considered, according to the general formula Al2Si2O5(OH)4·nH2O, where the (001) d-spacing is equal to 7 Å or 10 Å when n = 0 and 2, respectively [8,9]. Consequently, the two types of halloysite are labelled “halloysite 7 Å” and “halloysite 10 Å”. These differences in shape and water content may influence the microstructure and thermal transformations behavior of materials containing these halloysite and/or kaolinite. In the case of ceramics, the shaping process can enhance the initial texture, and during the sintering, the clay minerals are significantly modified [10,11,12,13,14], thus leading to the evolution of final structure and properties. For kaolinite and halloysite, the literature indicates that upon heating [5,6,7,8,9,10,11,12,13,14], these clay minerals will undergo dehydration, dehydroxylation and recrystallization transformations. It has also been shown that these transformations are influenced by the initial crystallinity degree, the particle size and the number of local defects of the kaolinite and halloysite raw materials. Following former studies that were performed regarding the correlation between the formulation and sintering behavior of some ceramics [14,15,16,17,18,19], the present study aims at characterizing the texture evolutions of kaolinite and halloysite-based samples from room temperature until complete dehydroxylation. The in situ poles figures of the appropriate (hkl) reflections were recorded from 25 up to 1000 °C on the DiffAbs beamline at SOLEIL Synchrotron.

2. Materials and Methods

2.1. Clay Materials and Sample Preparation

The raw materials used in this study were two kaolins and a halloysite (NZCC halloysite), to which we assigned the labels KRG, KCS and H, respectively. All these raw materials were supplied by Imerys Limoges, France. Their main characteristics were already presented in a former paper [20] and are listed in Table 1, Table 2 and Table 3. Their silica to alumina mass ratios are close to the expected chemical formula, 1.1. Also, the densities are in the range 2.55 to 2.65 g/cm3 as expected for such clay materials. Kaolins KRG and KCS contained kaolinite clay mineral (99%), while the halloysite (noted H) mainly included halloysite clay mineral and a few secondary minerals (quartz and cristobalite).
Shaping of samples was performed using the tape casting method in order to promote the preferential alignment of clay particles along the casting support. Optimized amounts of dolaflusB11® (CERADEL, Limoges France), Polyvinyl alcohol 22000® (VMR, Fontenay-sous-Bois, France) and Polyethylene glycol 300® (ALDRICH, St. Quentin Fallavier, France) were derived from preliminary studies [14,20]. They were used as dispersant, binder and plasticizer, respectively, in the kaolinite and halloysite-based slurries. The slurry preparation started with the mixture of kaolinite and or halloysite-rich clays (52.5 wt. % of sold content) with deionized water containing 0.2 g of dolaflux B11. After the homogenization of the previous mixture overnight onto a roll-mixer, a first grinding step was conducted in a planetary mill (Fritsch, France) for 6 h at 180 rpm. Then the optimized binder and plasticizer content was added (binder to plasticizer ratio = 1) prior to the second milling/mixing step for 16 h at 100 rpm in the planetary miller. Finally, the as-obtained slurry was set on the roll-mixer in order to remove the entrapped bubbles and sieved at 125 µm before the tape casting operation to eliminate the non-solubilized binder and plasticizer. Five slurries were formulated using each clay material and then a mixture of equivalent mass ratio of kaolin and halloysite. The related samples were named: KRG100, KCS100, H100, KRG50H50 and KCS50H50 according to the relative mass content of the clay material.
All slurries were cast with non-continuous equipment, using a casting rate of 0.42 mm/min and the casting gap that defined the thickness of the green tapes (ranging between 200 µm and 300 µm) could be precisely monitored. The green tapes were air-dried at room temperature for 24 h before collecting disk-like (10 and 30 mm in diameter) and square-like samples for the in situ experiments.

2.2. Methods

The structural evolution of the samples as a function of the temperature, namely the texture within samples containing different amounts of halloysite and kaolinite and shaped by tape casting, was studied by X-ray diffraction at the DiffAbs beamline located in SOLEIL Synchrotron. In addition, the typical dehydroxylation onset and offset temperatures were determined as well as the earlier structural reorganization. Poles figures were derived upon in situ measurements performed up to 800 °C. Furthermore, the furnace allowed heating samples up to 1100 °C and using a peculiar configuration to extract pair distribution functions. We used the DHS 1100 furnace supplied by Anton Paar Company. The confinement of the atmosphere around the sample is realized using a hemispherical PEEK (PolyEther Ether Ketone) dome. The measurements were done using the Kappa diffractometer available on the beamline and an XPAD S140 hybrid pixel detector [24] located on the 2θ arm. All the poles figures were extracted according to the methodology described in [25].
X-ray diffraction (XRD) patterns were recorded on dried samples shaped by tape casting. The samples were previously cut into small squares of 5 mm in edge, and then fixed onto silicon wafers using metallic grafting. According to the energy of the X-ray beam that was fixed at 17.9 keV, the incident angle was fixed at 5.54° in order to match the reflection conditions of the (002) planes of kaolinite and halloysite. The heating rate was fixed at 20 °C/min with an acquisition every 25 °C. These conditions were defined during previous measurements at the ESRF D2AM beamline [20]. The recording duration was a couple of minutes for each poles figure.
The laboratory X-ray diffraction (XRD) experiments were also conducted on the raw tapes, using a D8 Advance DaVinci diffractometer (Bruker, Madison, WI, USA), operating in Bragg–Brentano geometry with CuKα1 radiation (λ = 0.1540598 nm). The raw materials samples were deposited in a classical transparent resin sample holder and the shaped materials were glued on the same type of specimen holder. The nature of the crystalline phases present in the raw materials was determined on powdered samples through qualitative analysis of XRD patterns (DIFFRAC.SUITE EVA software, Bruker Company, Madison, WI, USA) collected in a range of 2° < 2θ < 60° with a step of 0.02°, integration time of 0.54 s/step, and width of the slits of 15 mm. The DIFFRAC.SUITE EVA software was granted with the ICDD (PDF2, PDF4 plus), PDF4 AXIOM and COD reference databases [20].
The scanning electron microscopy (SEM) observation of the shaped samples was performed using a FEI Quanta 450 FEG device (Thermo Fisher Scientific, Waltham, MA, USA) equipped with EDS detector. Dry tapes were carefully split into two parts in order to observe the cross-section and flat surface (parallel to the casting plate). A thin coating of Pd-Au (10 nm) was deposited onto each specimen prior to SEM observation to ensure a good electron conductivity of the external surfaces.

3. Results and Discussion

3.1. Texture Characterization Using (002) and (111) Reflections Poles Figures

The materials texture plays a significant role on their final properties such as mechanical resistance, thermal conductivity and electrical resistance, etc. Since in the case of phyllosilicate-based ceramics, the layered structure of clay minerals may induce preferential orientation, it is of great interest to understand how the texture can be influenced by such particles alignment. Moreover, the structural changes like dehydroxylation could be highlighted in relation with the starting phyllosilicate(s). In the present study, tape casting, which is a liquid route shaping process, could favor the texture within samples containing layered silicates. SEM images of the starting sample are presented in Figure 1. These images show that for the kaolin sample (KRG100 and KCS100), the kaolinite platelets tended to be parallel to the casting plate. In the case of the halloysite sample (H100), the tubular-like particles of halloysite are randomly distributed. This trend reflects the effects of particle shape on the control of microstructure of tape-cast samples.
The (002) and (111) crystallographic planes were considered for kaolinite and halloysite in order to point out the initial texture and the differences occurring due to the phyllosilicates’ characteristics and the heat treatment in the range 300 to 800 °C. In a first set of experiments, samples constituted with only one type of raw clay were analyzed: H100, KCS100 and KRG100. Thereafter, mixtures having 50% halloysite and 50% kaolin were analyzed, namely: KCS50H50 and KRG50H50. The XRD patterns of the studied samples are provided in Figure 2. It is obvious that for most samples, the shaping through tape casting enhanced the intensity of the (00ℓ) reflections due to in-plane alignment of platelets.

3.1.1. Texture Characterization of the Kaolin and Halloysite Samples
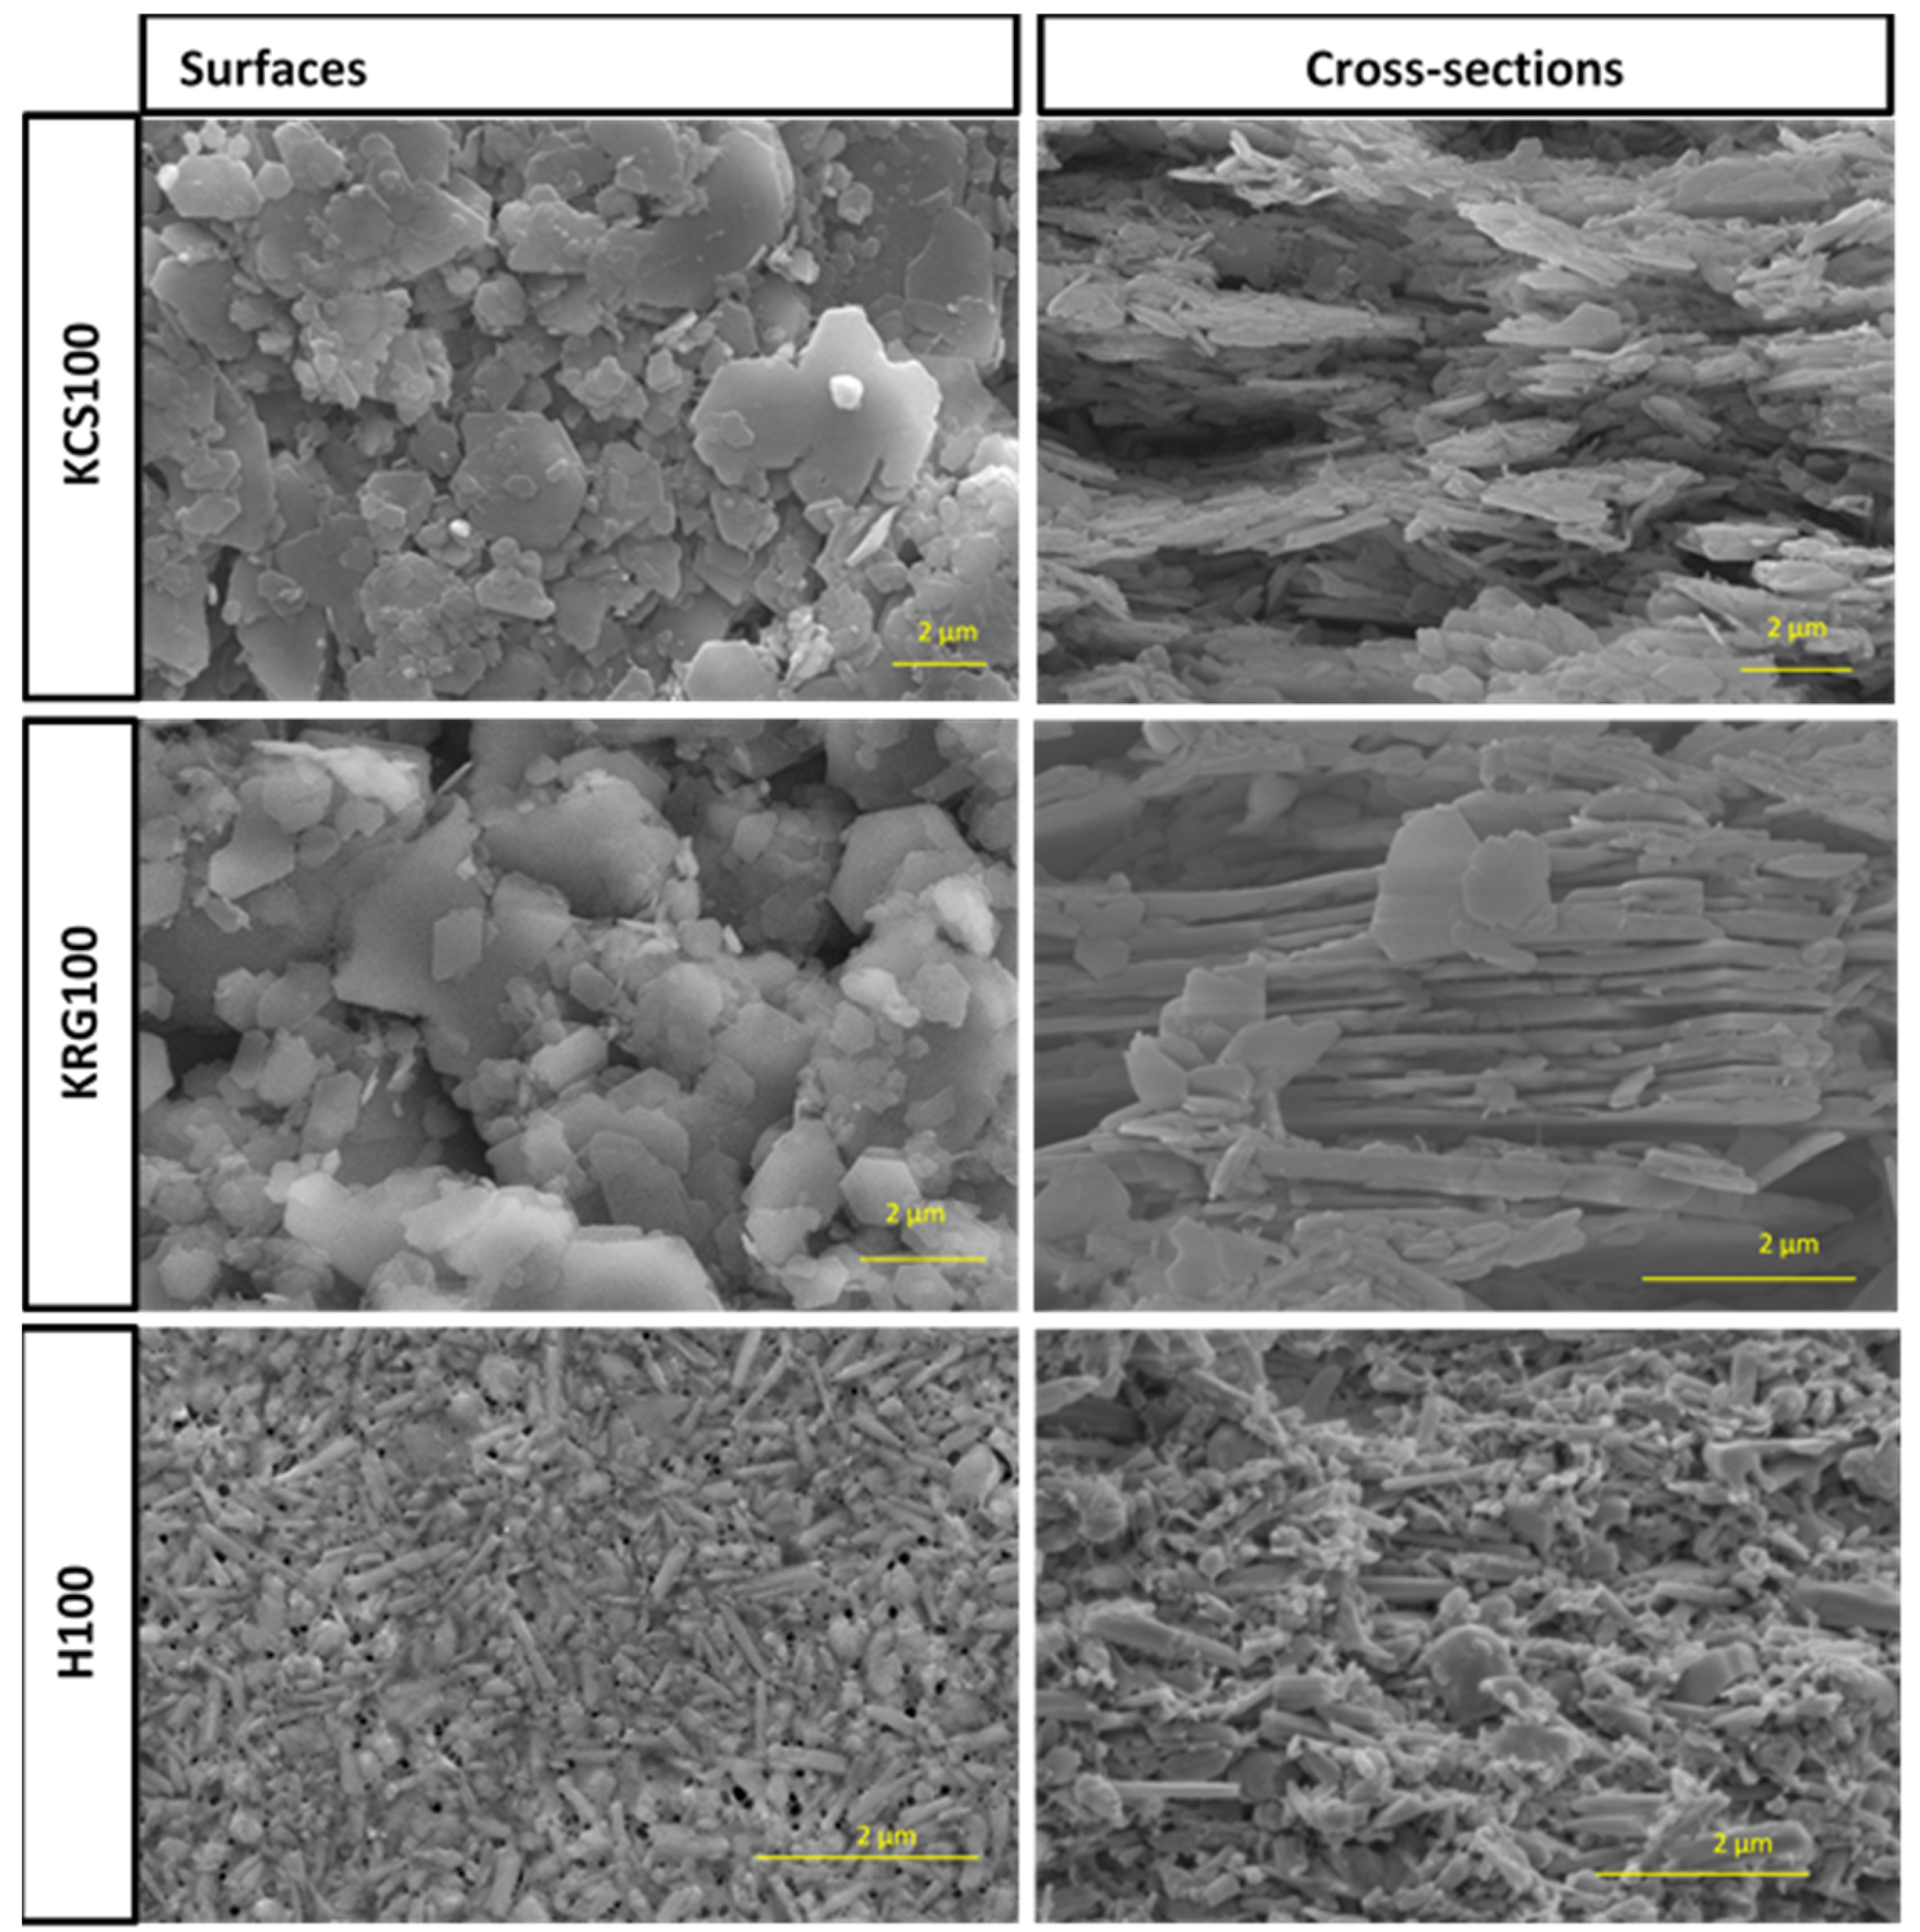
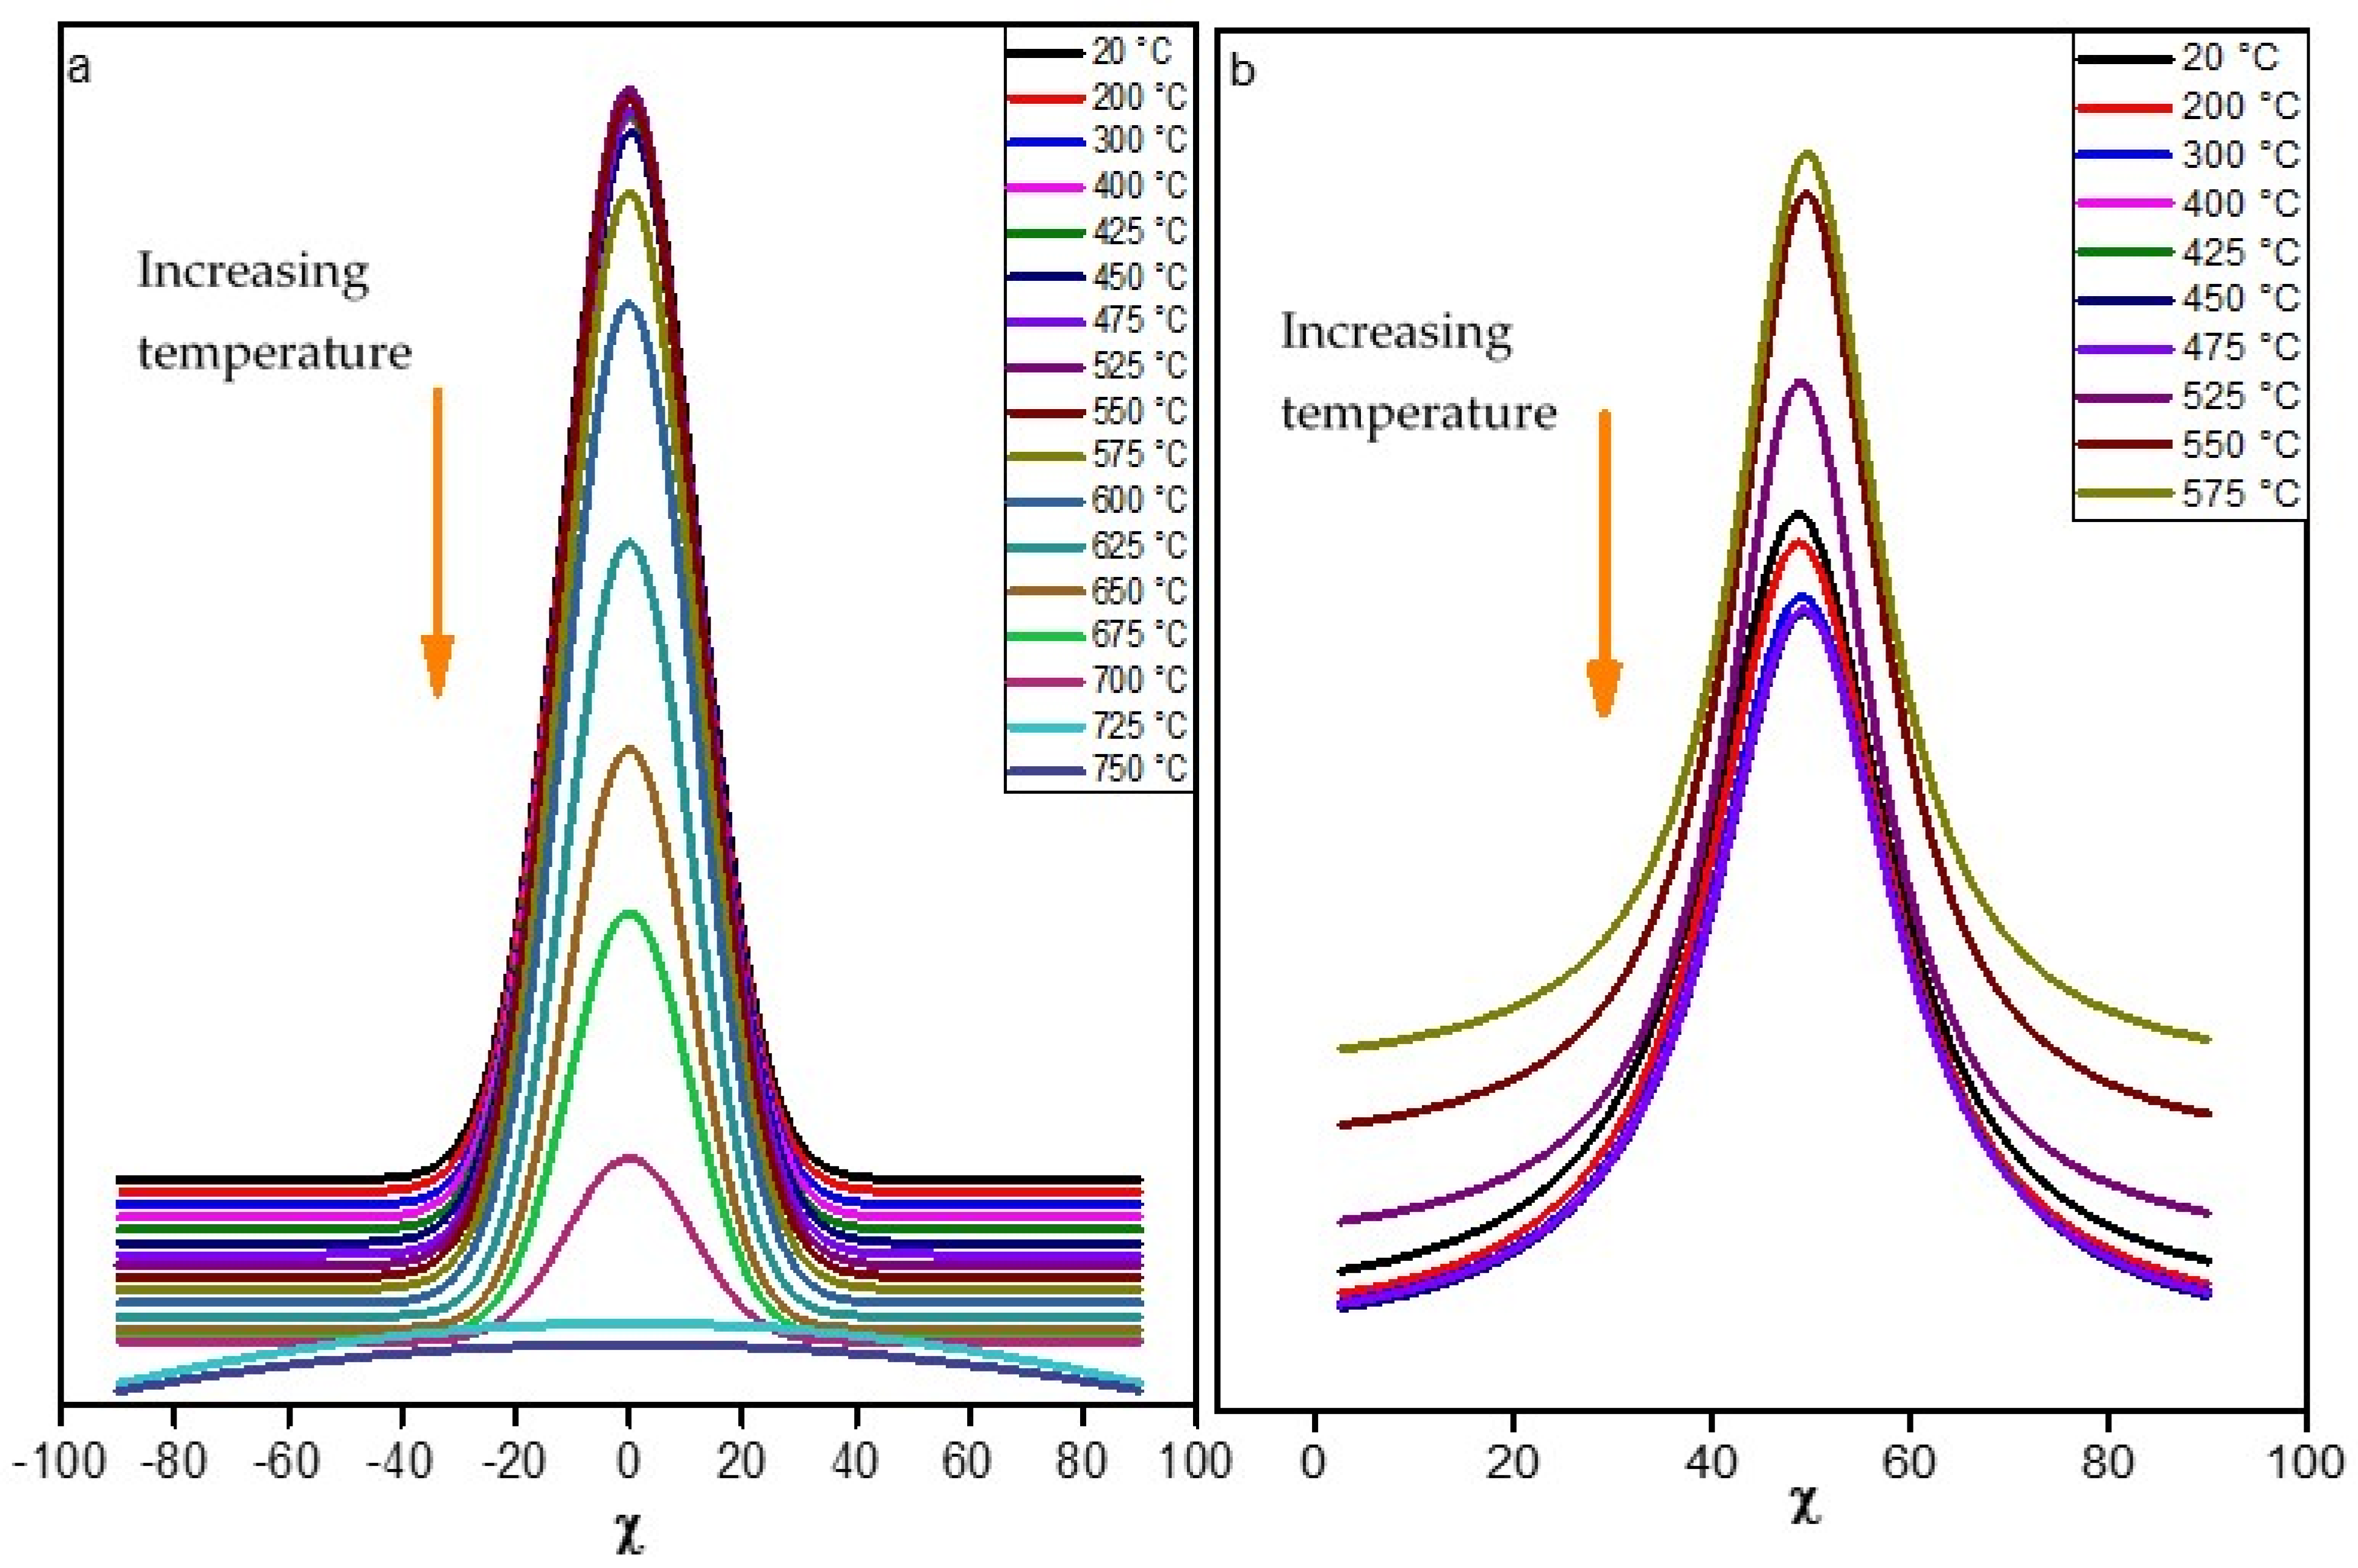
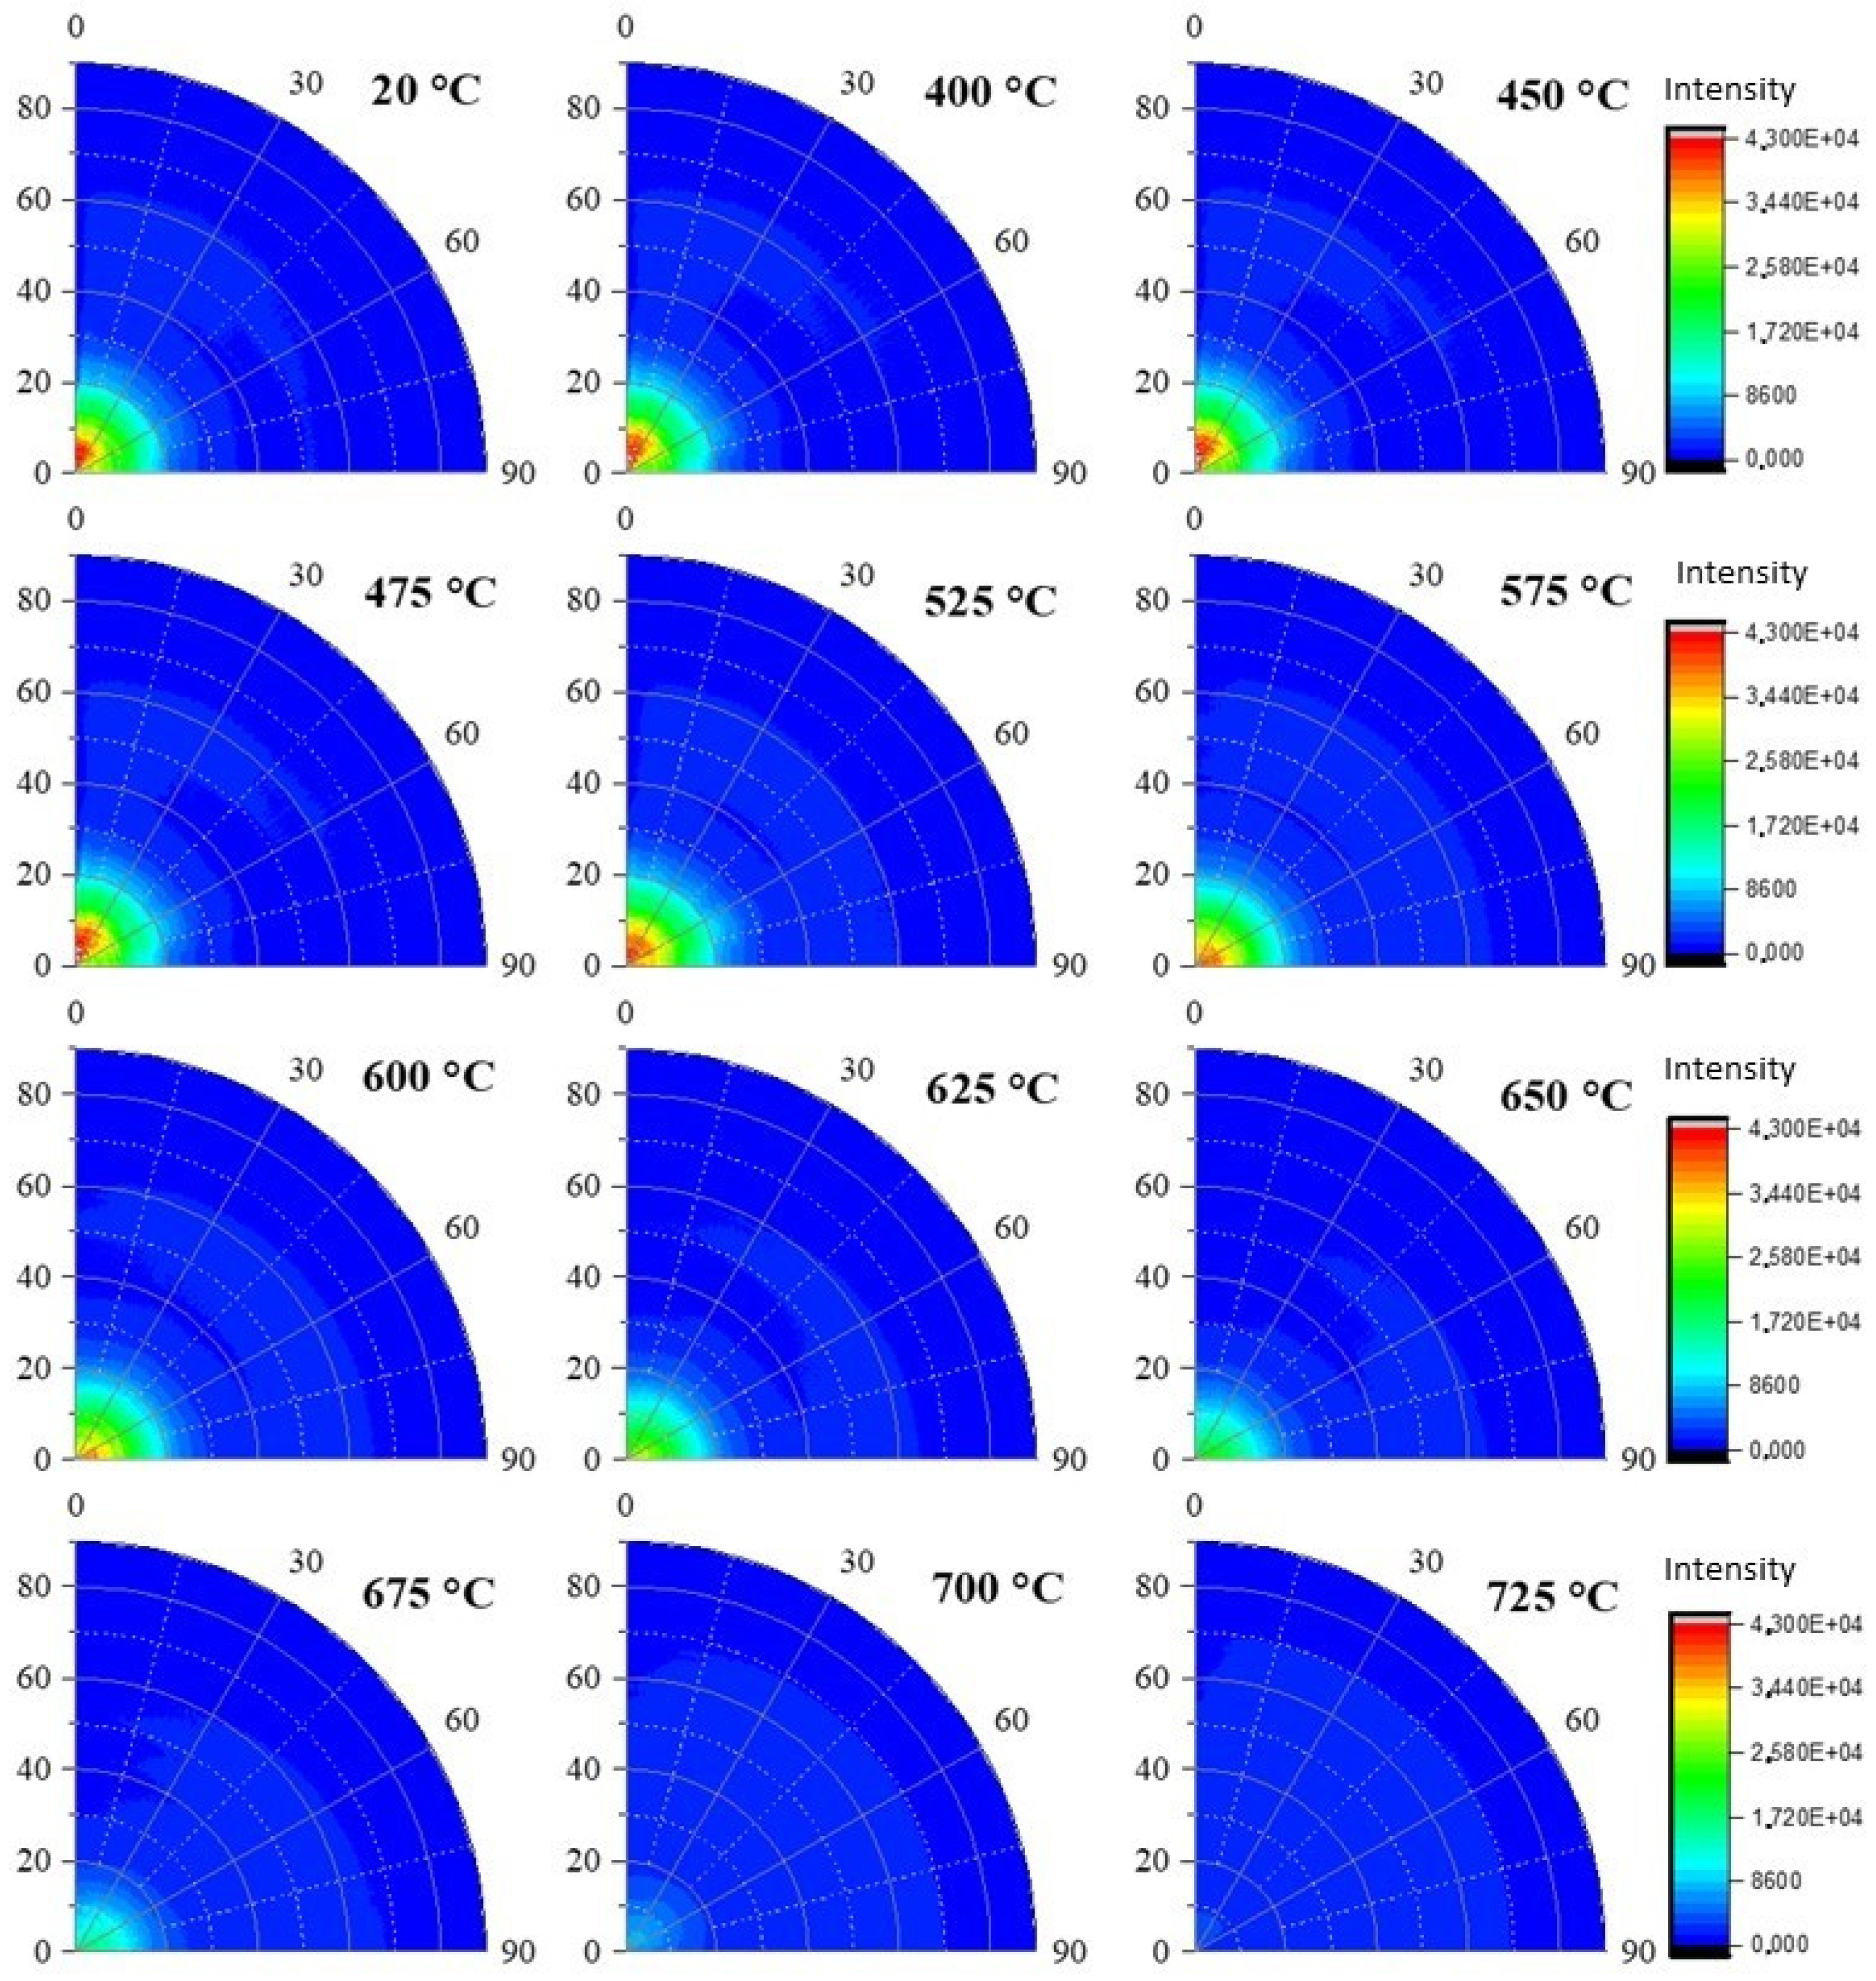
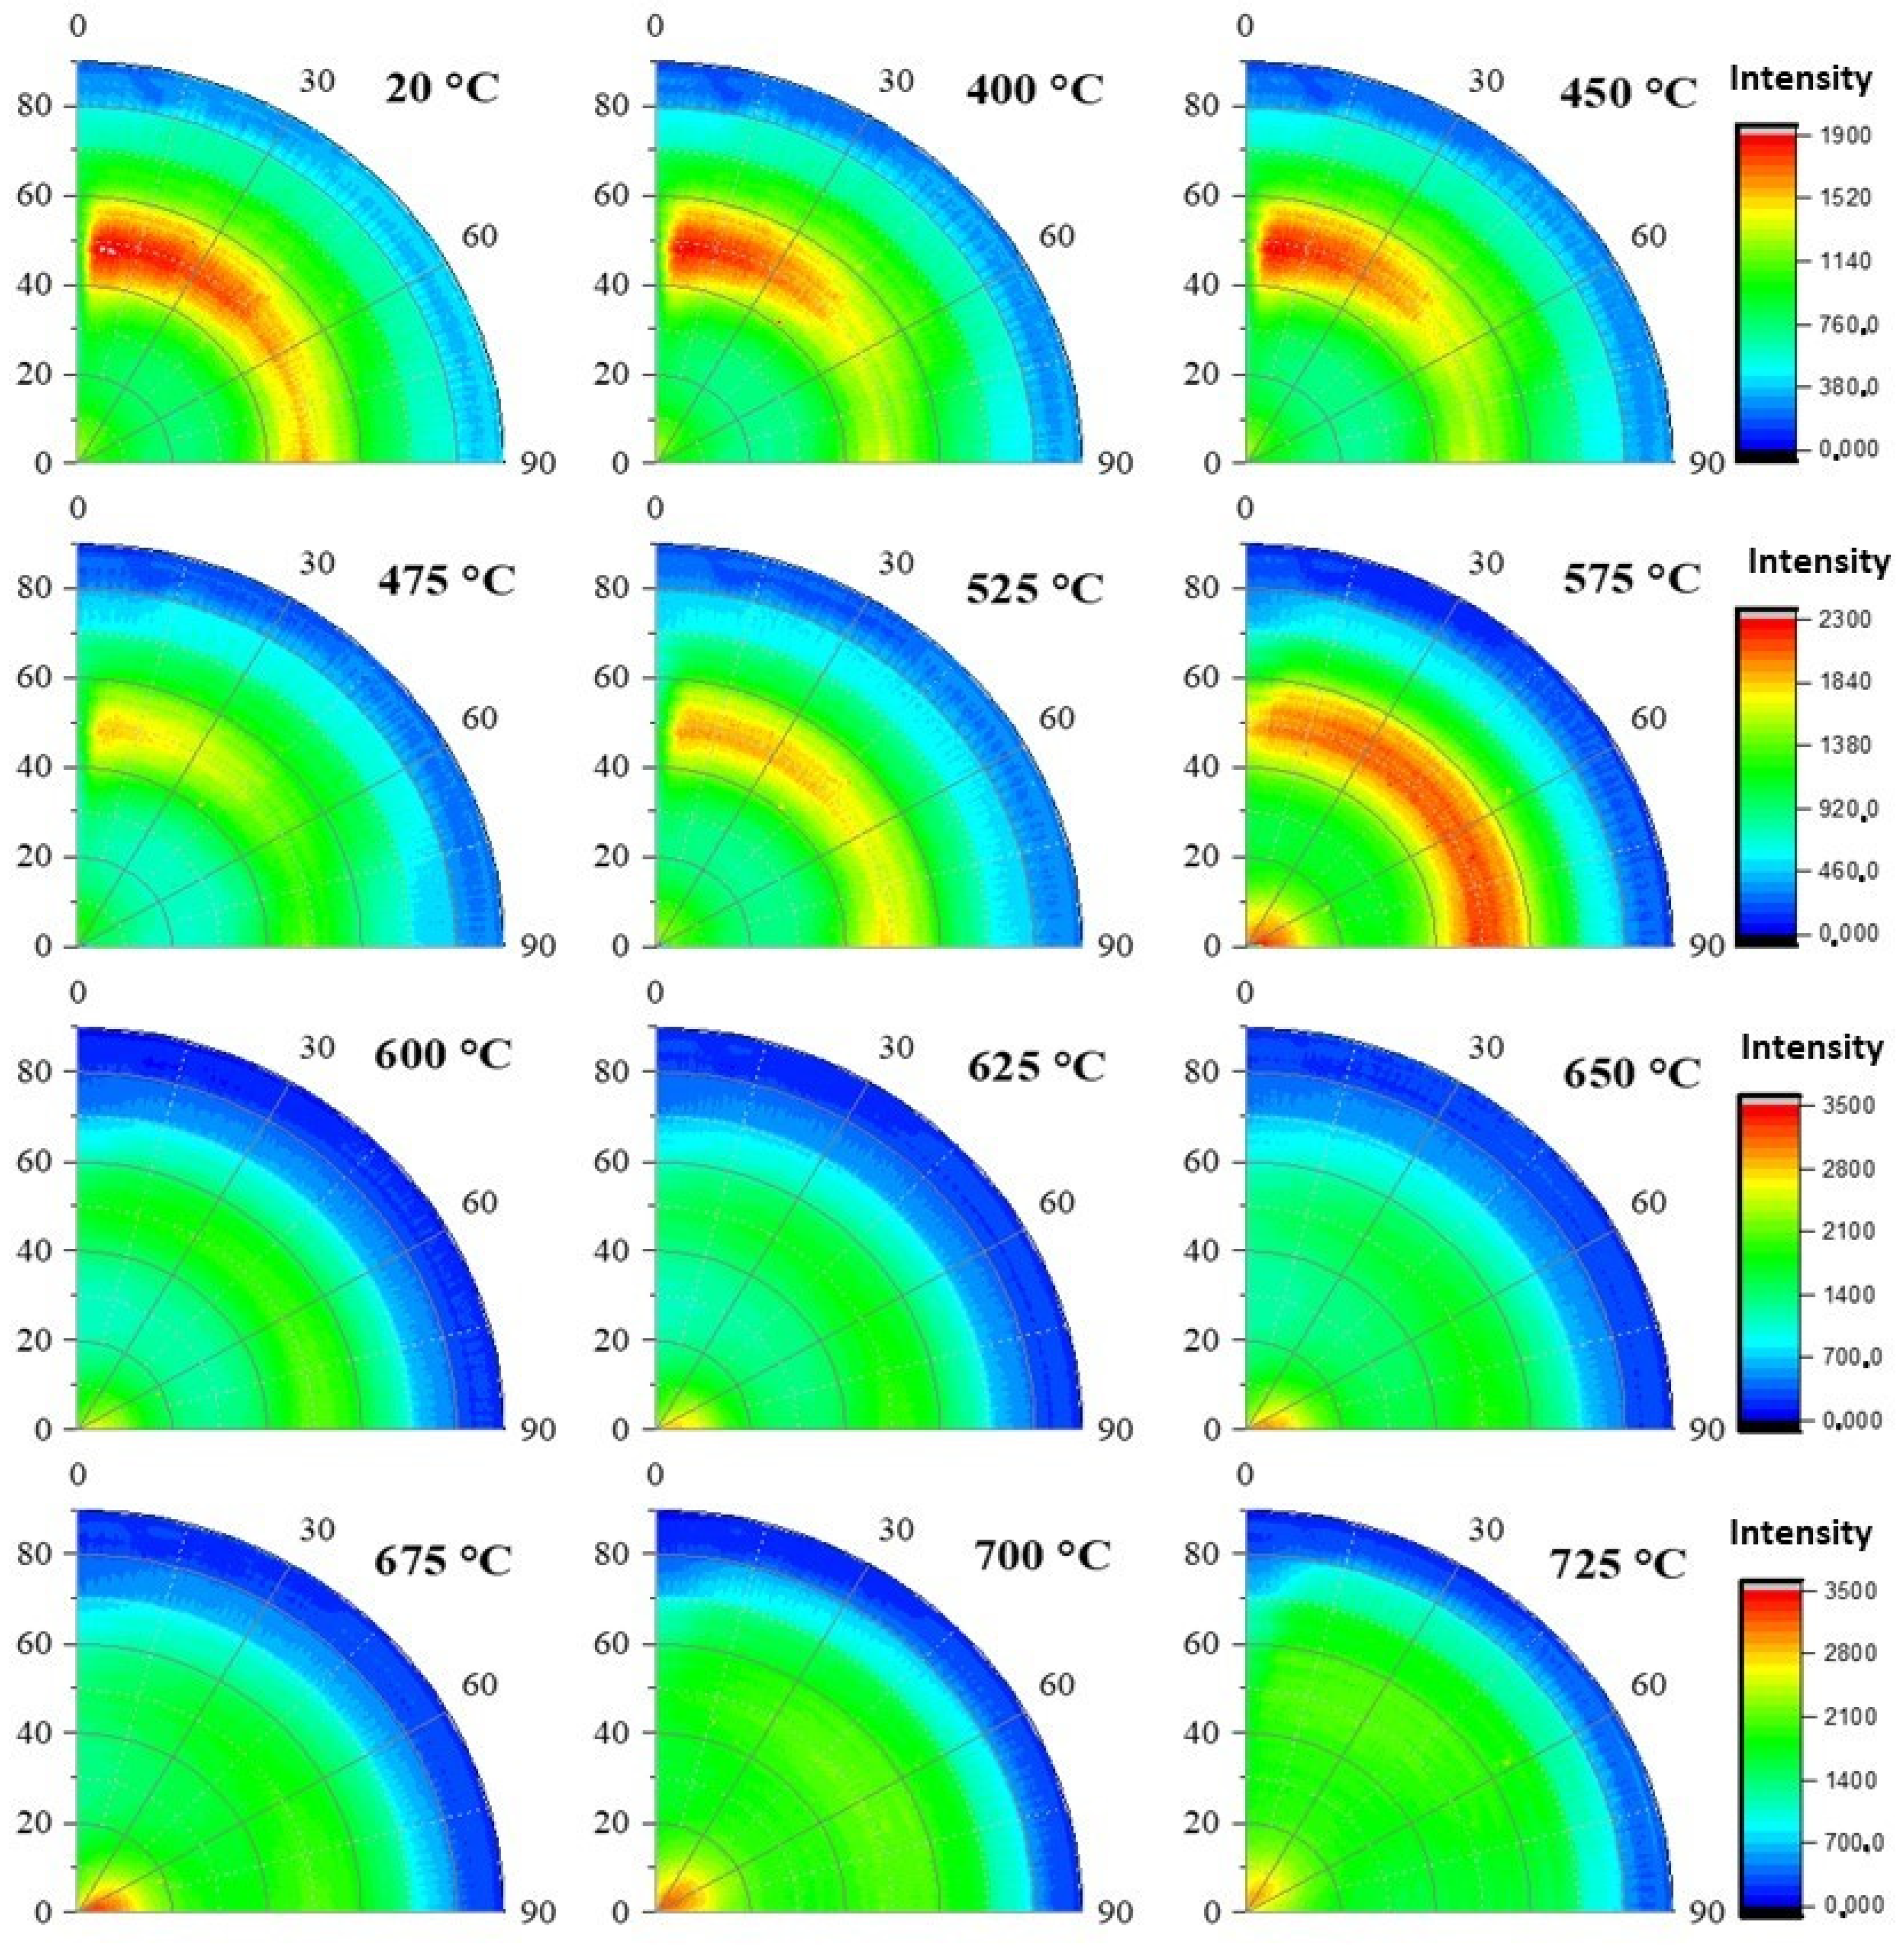
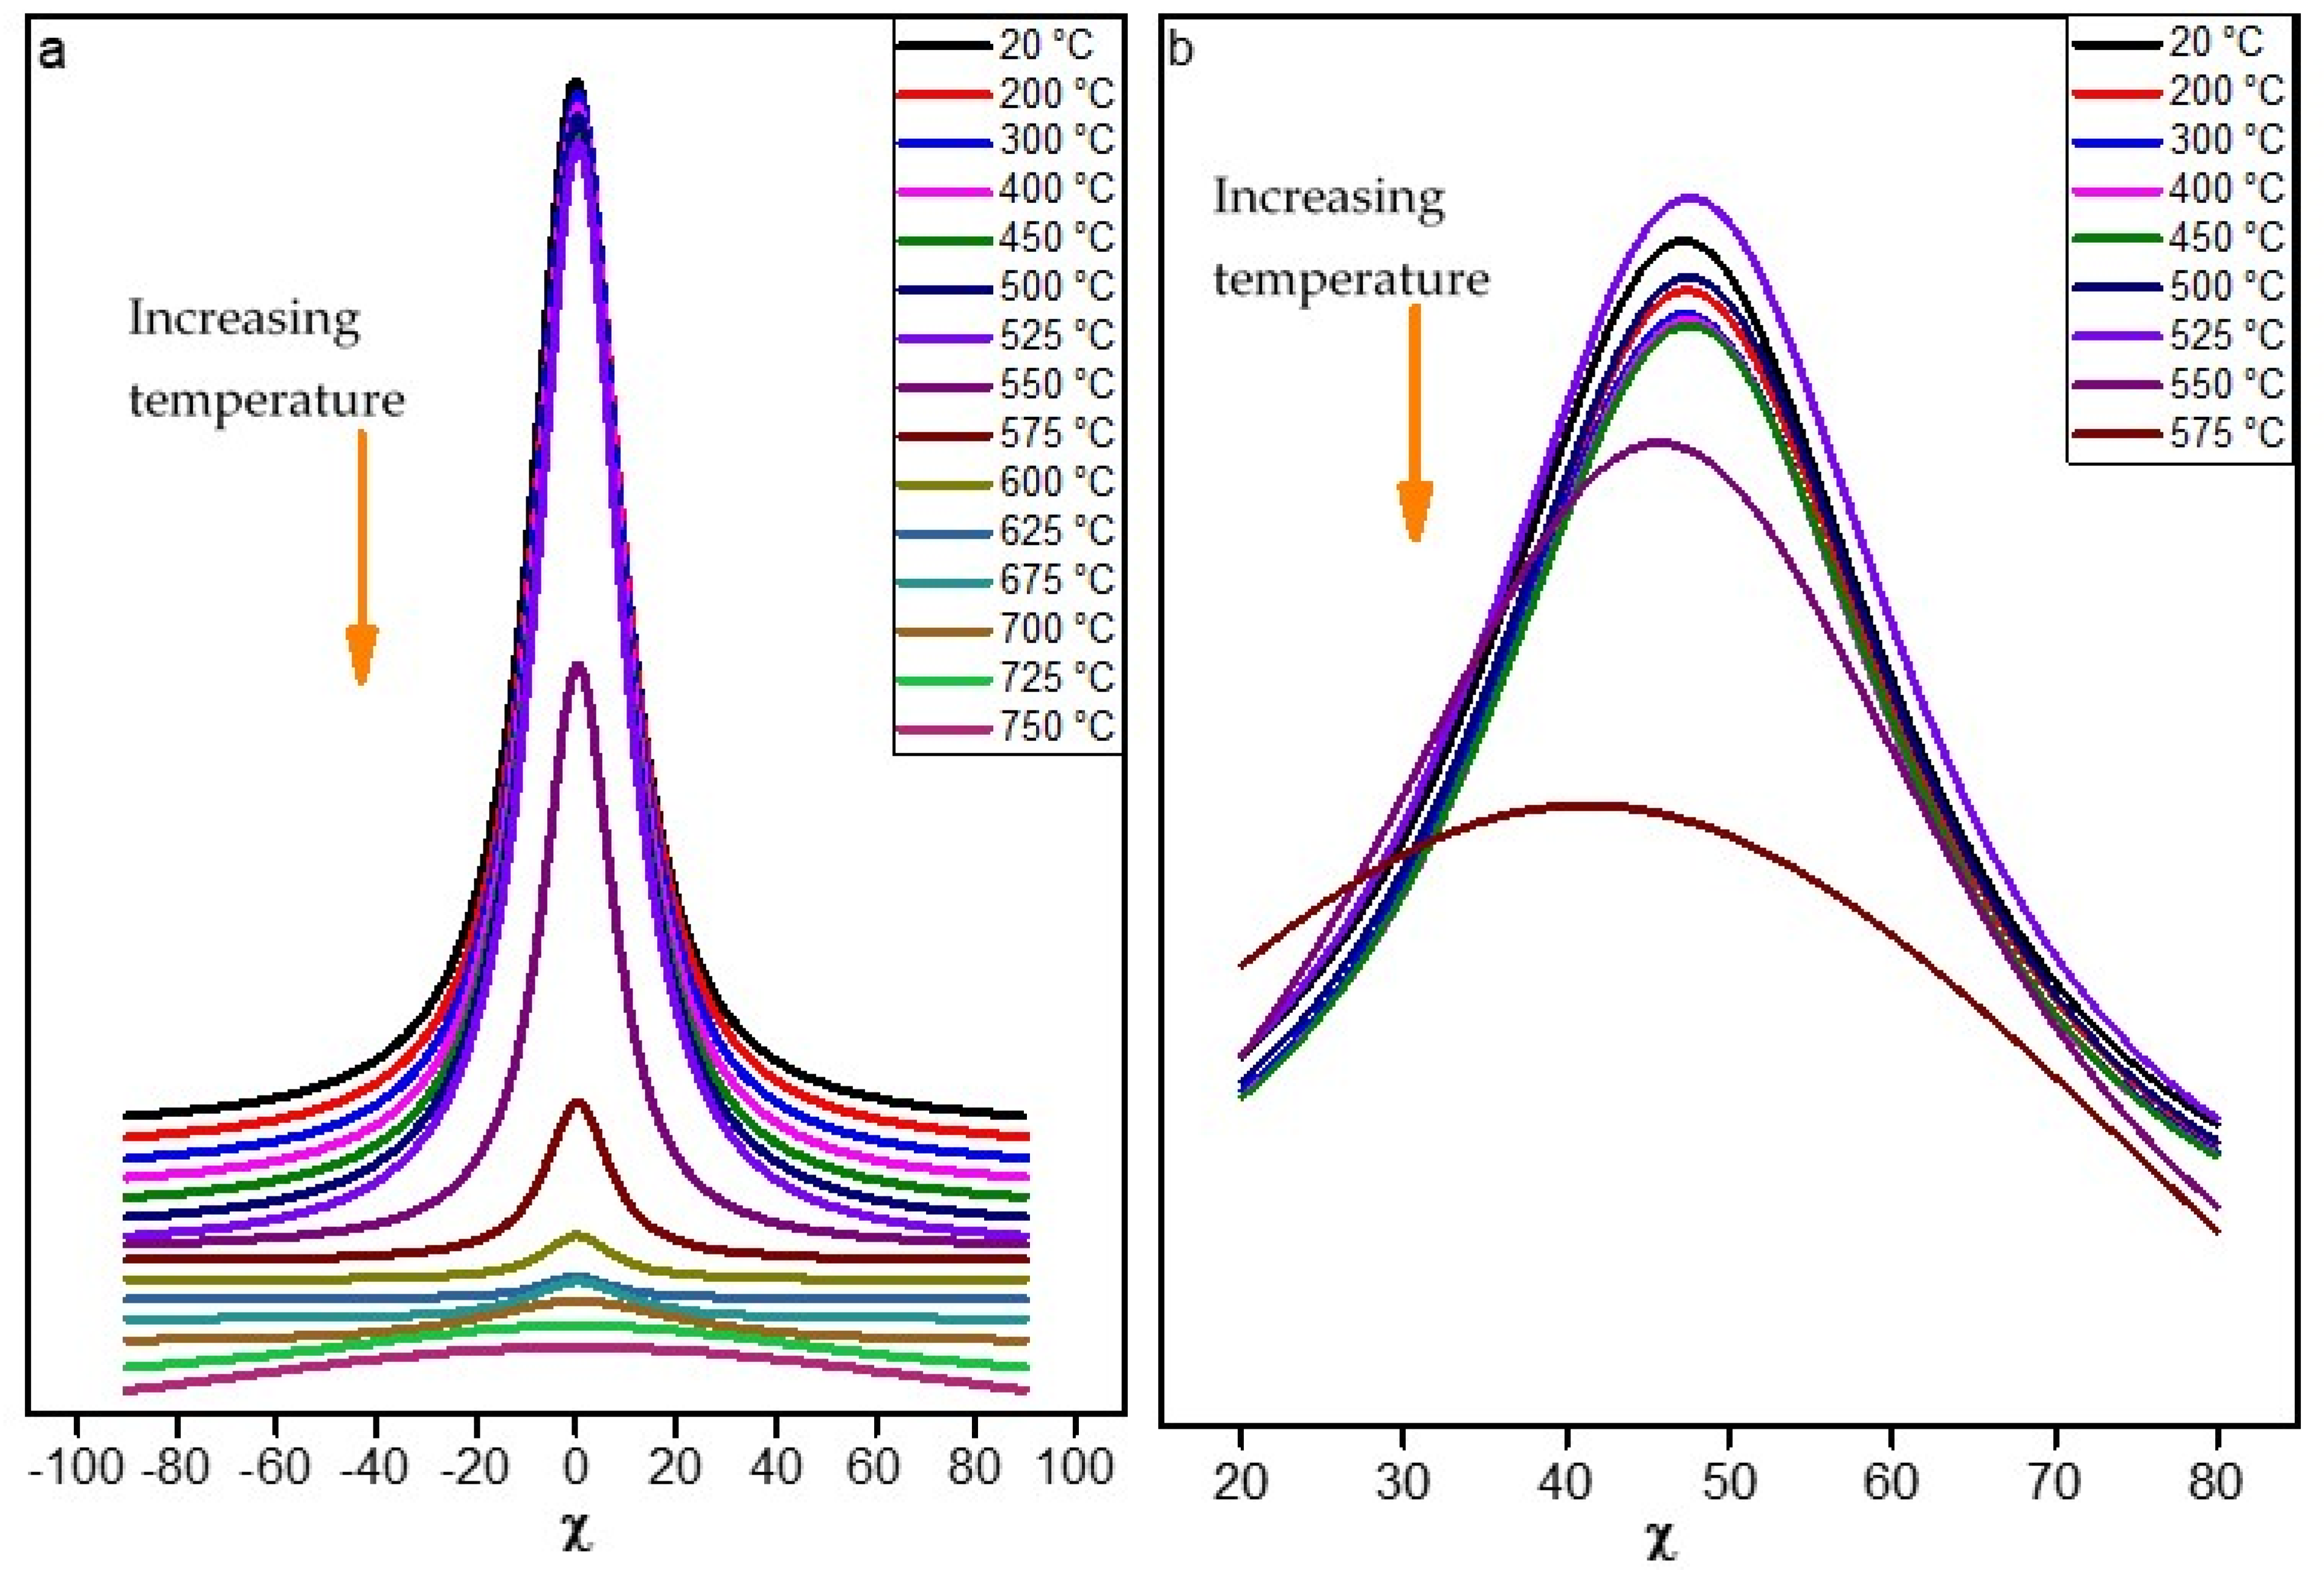
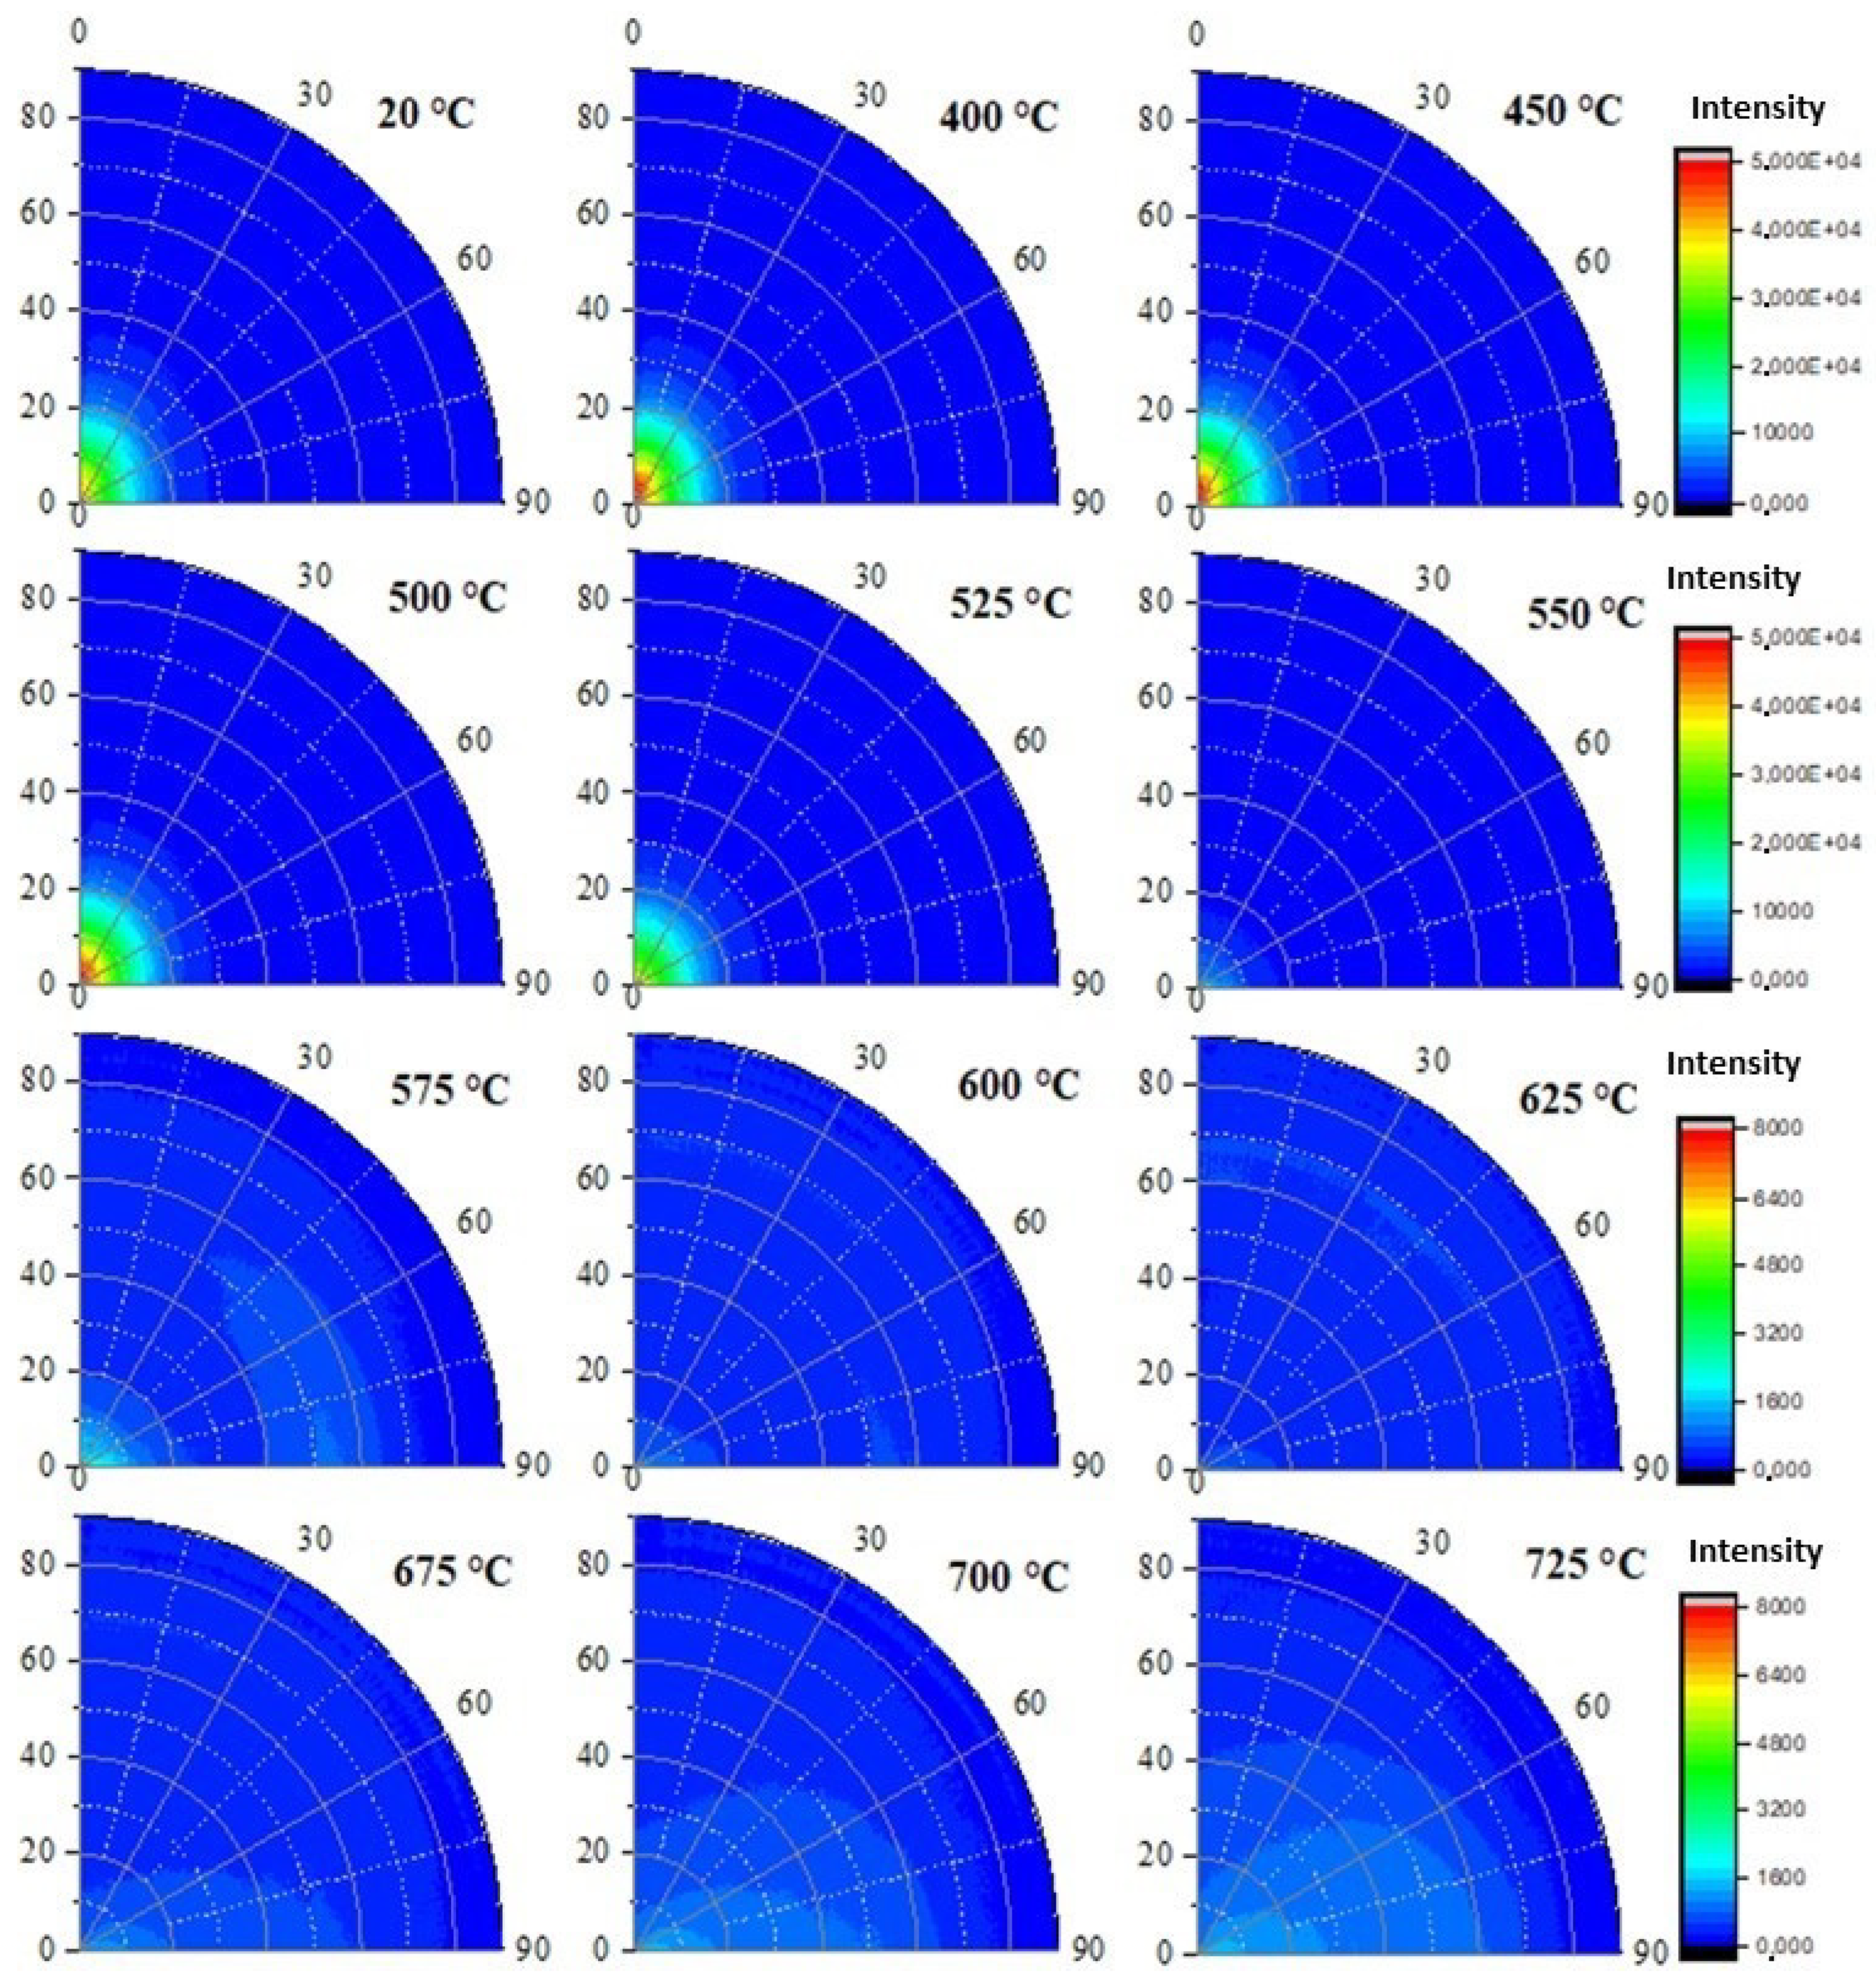
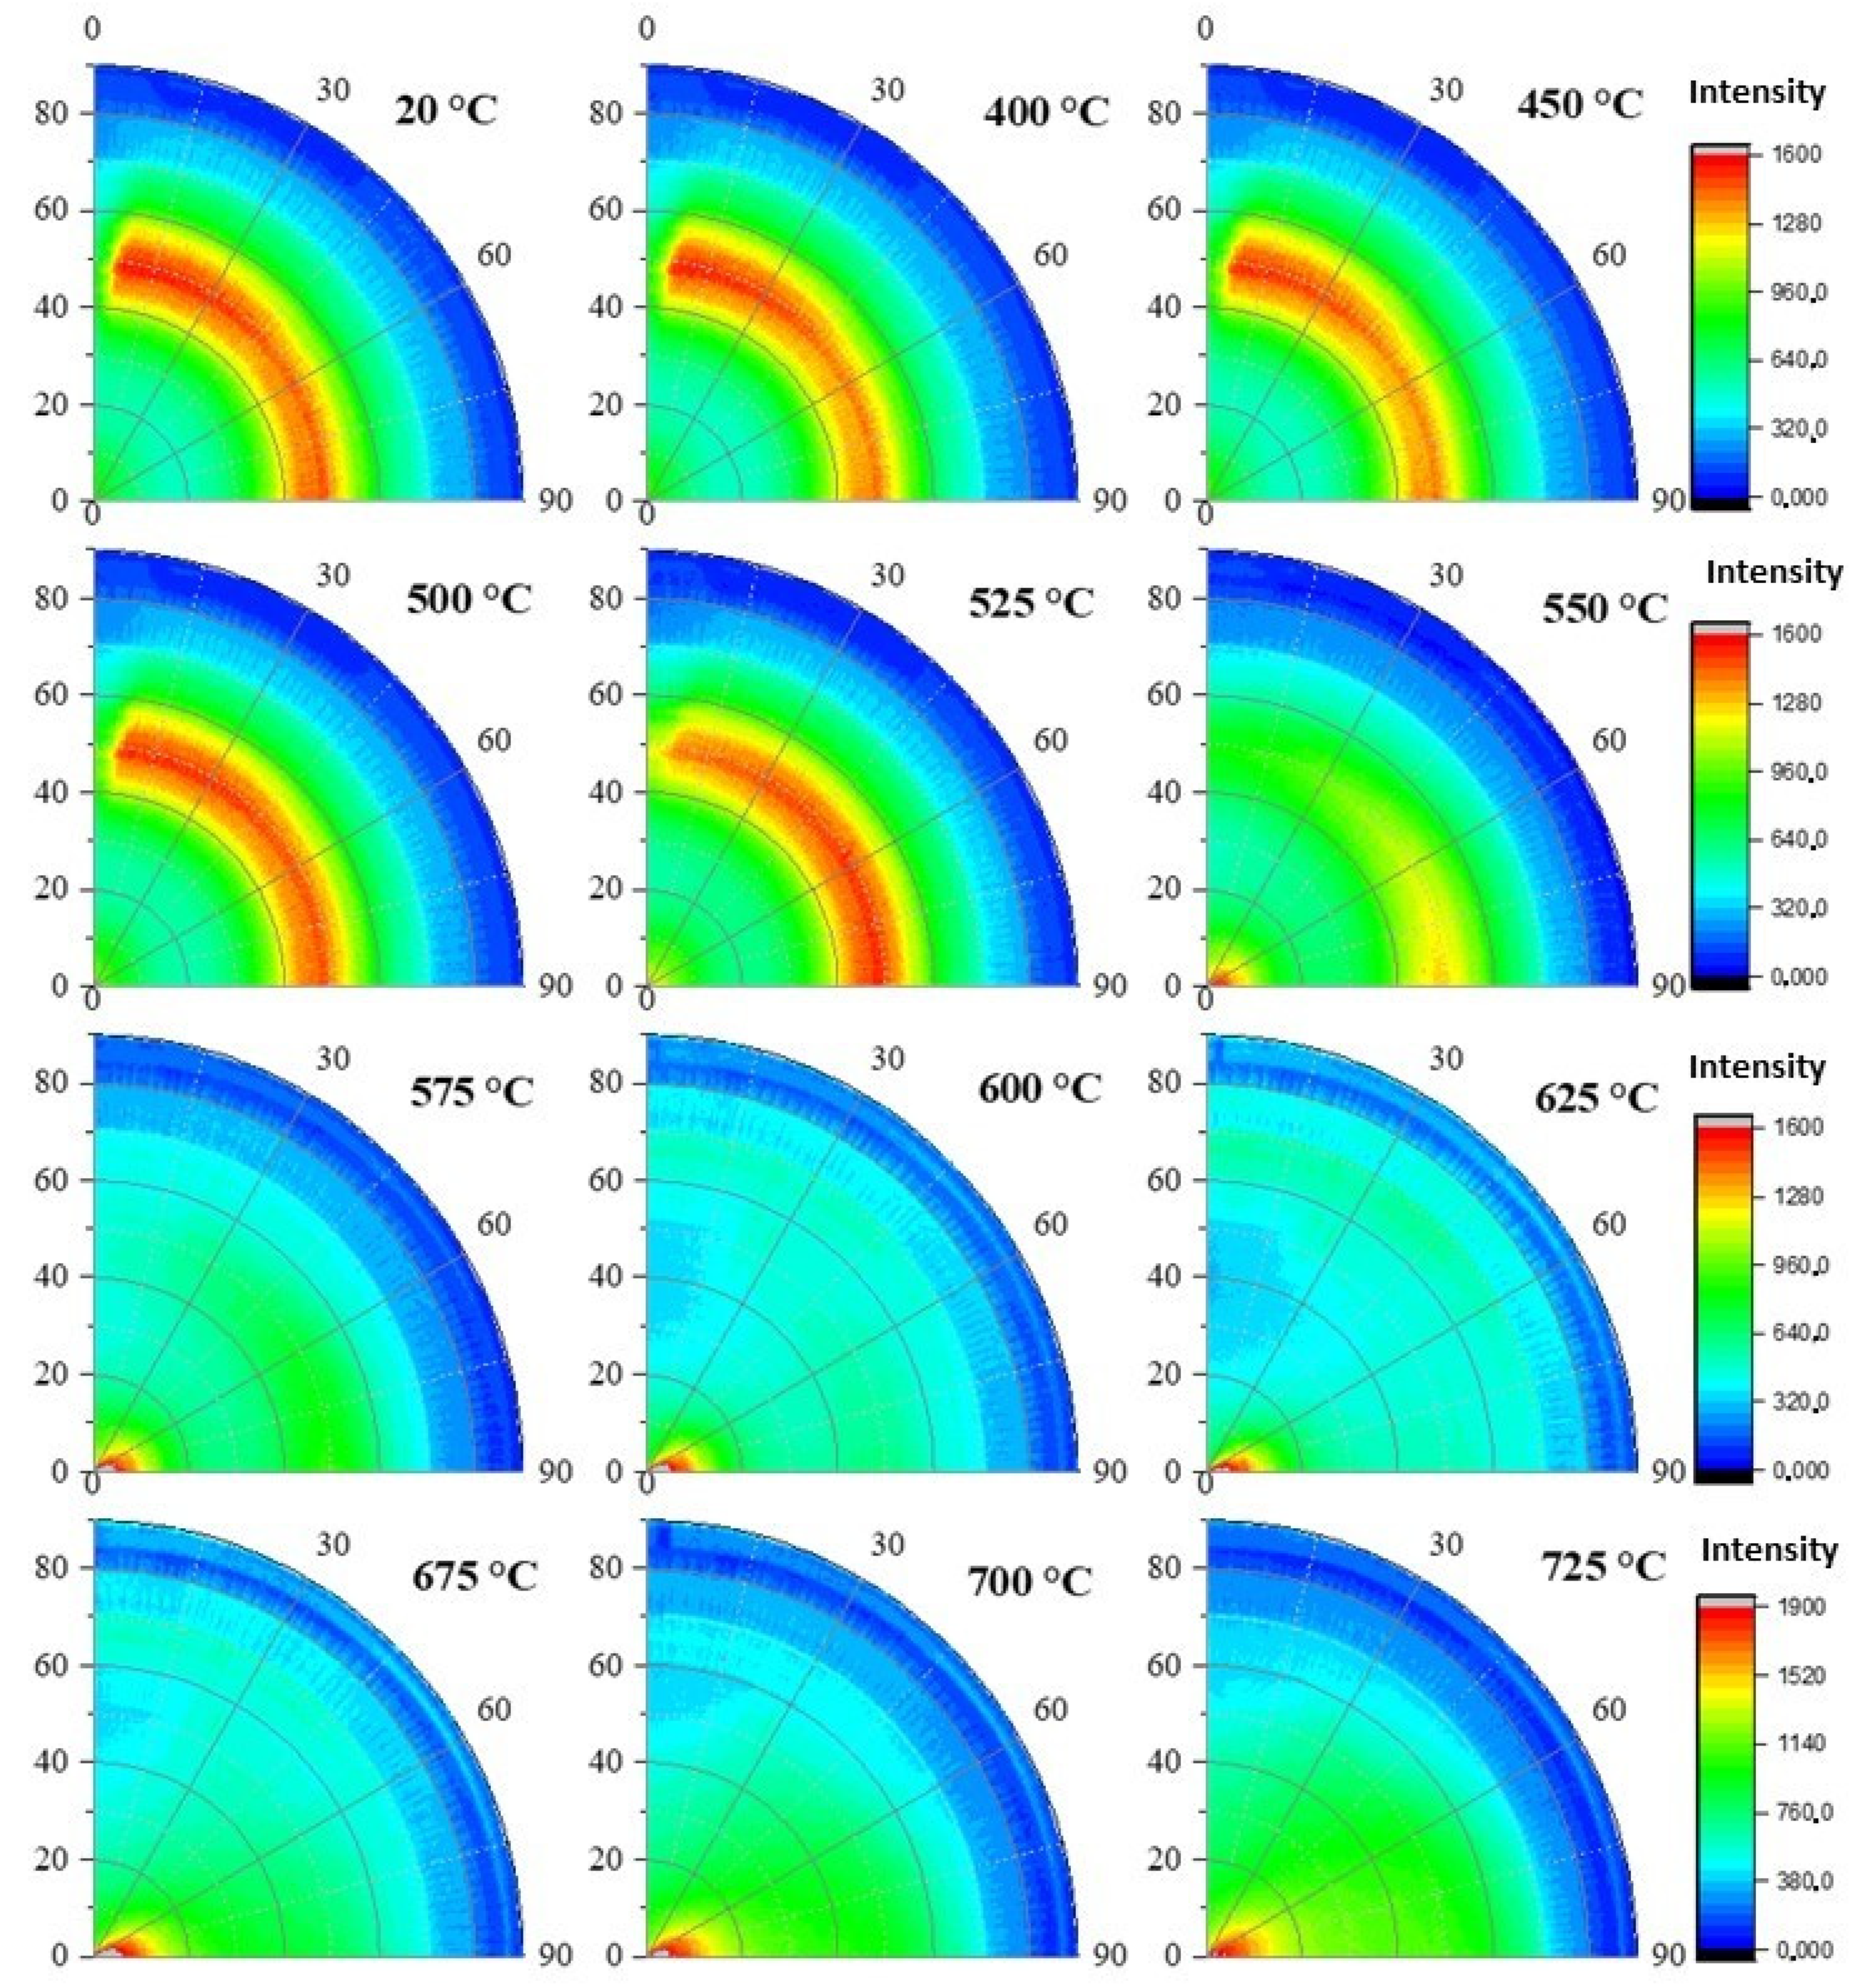
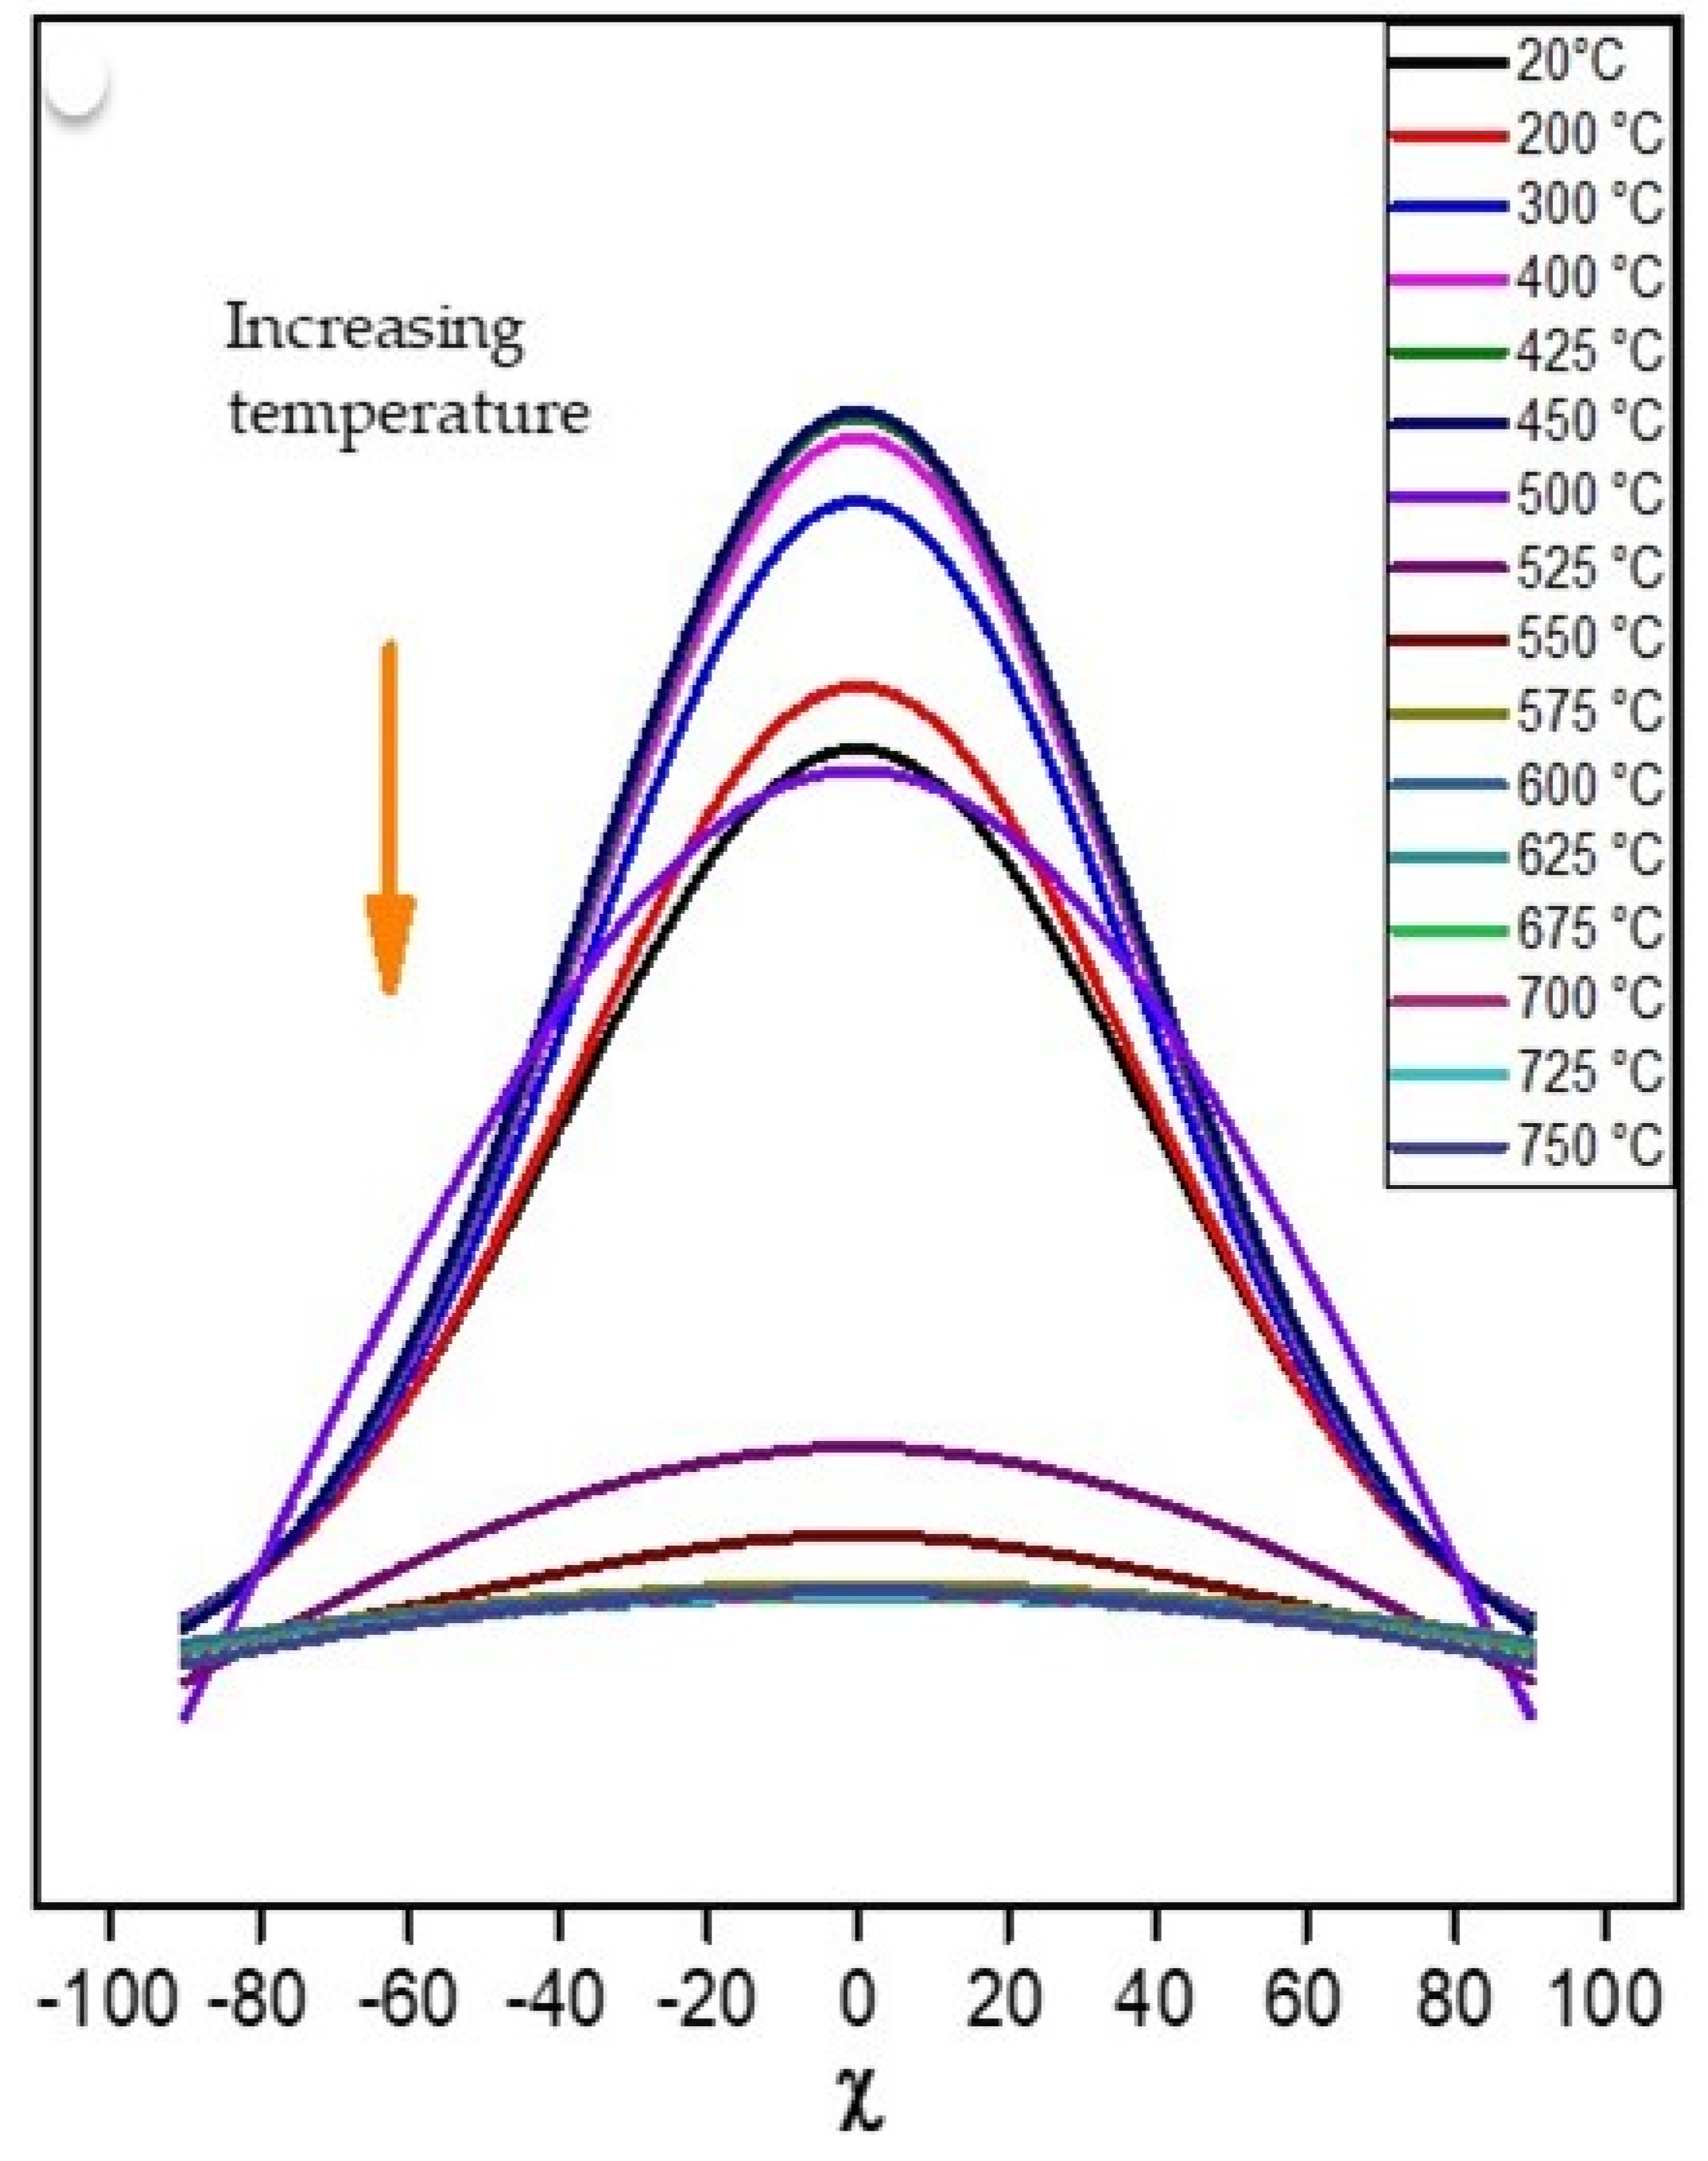
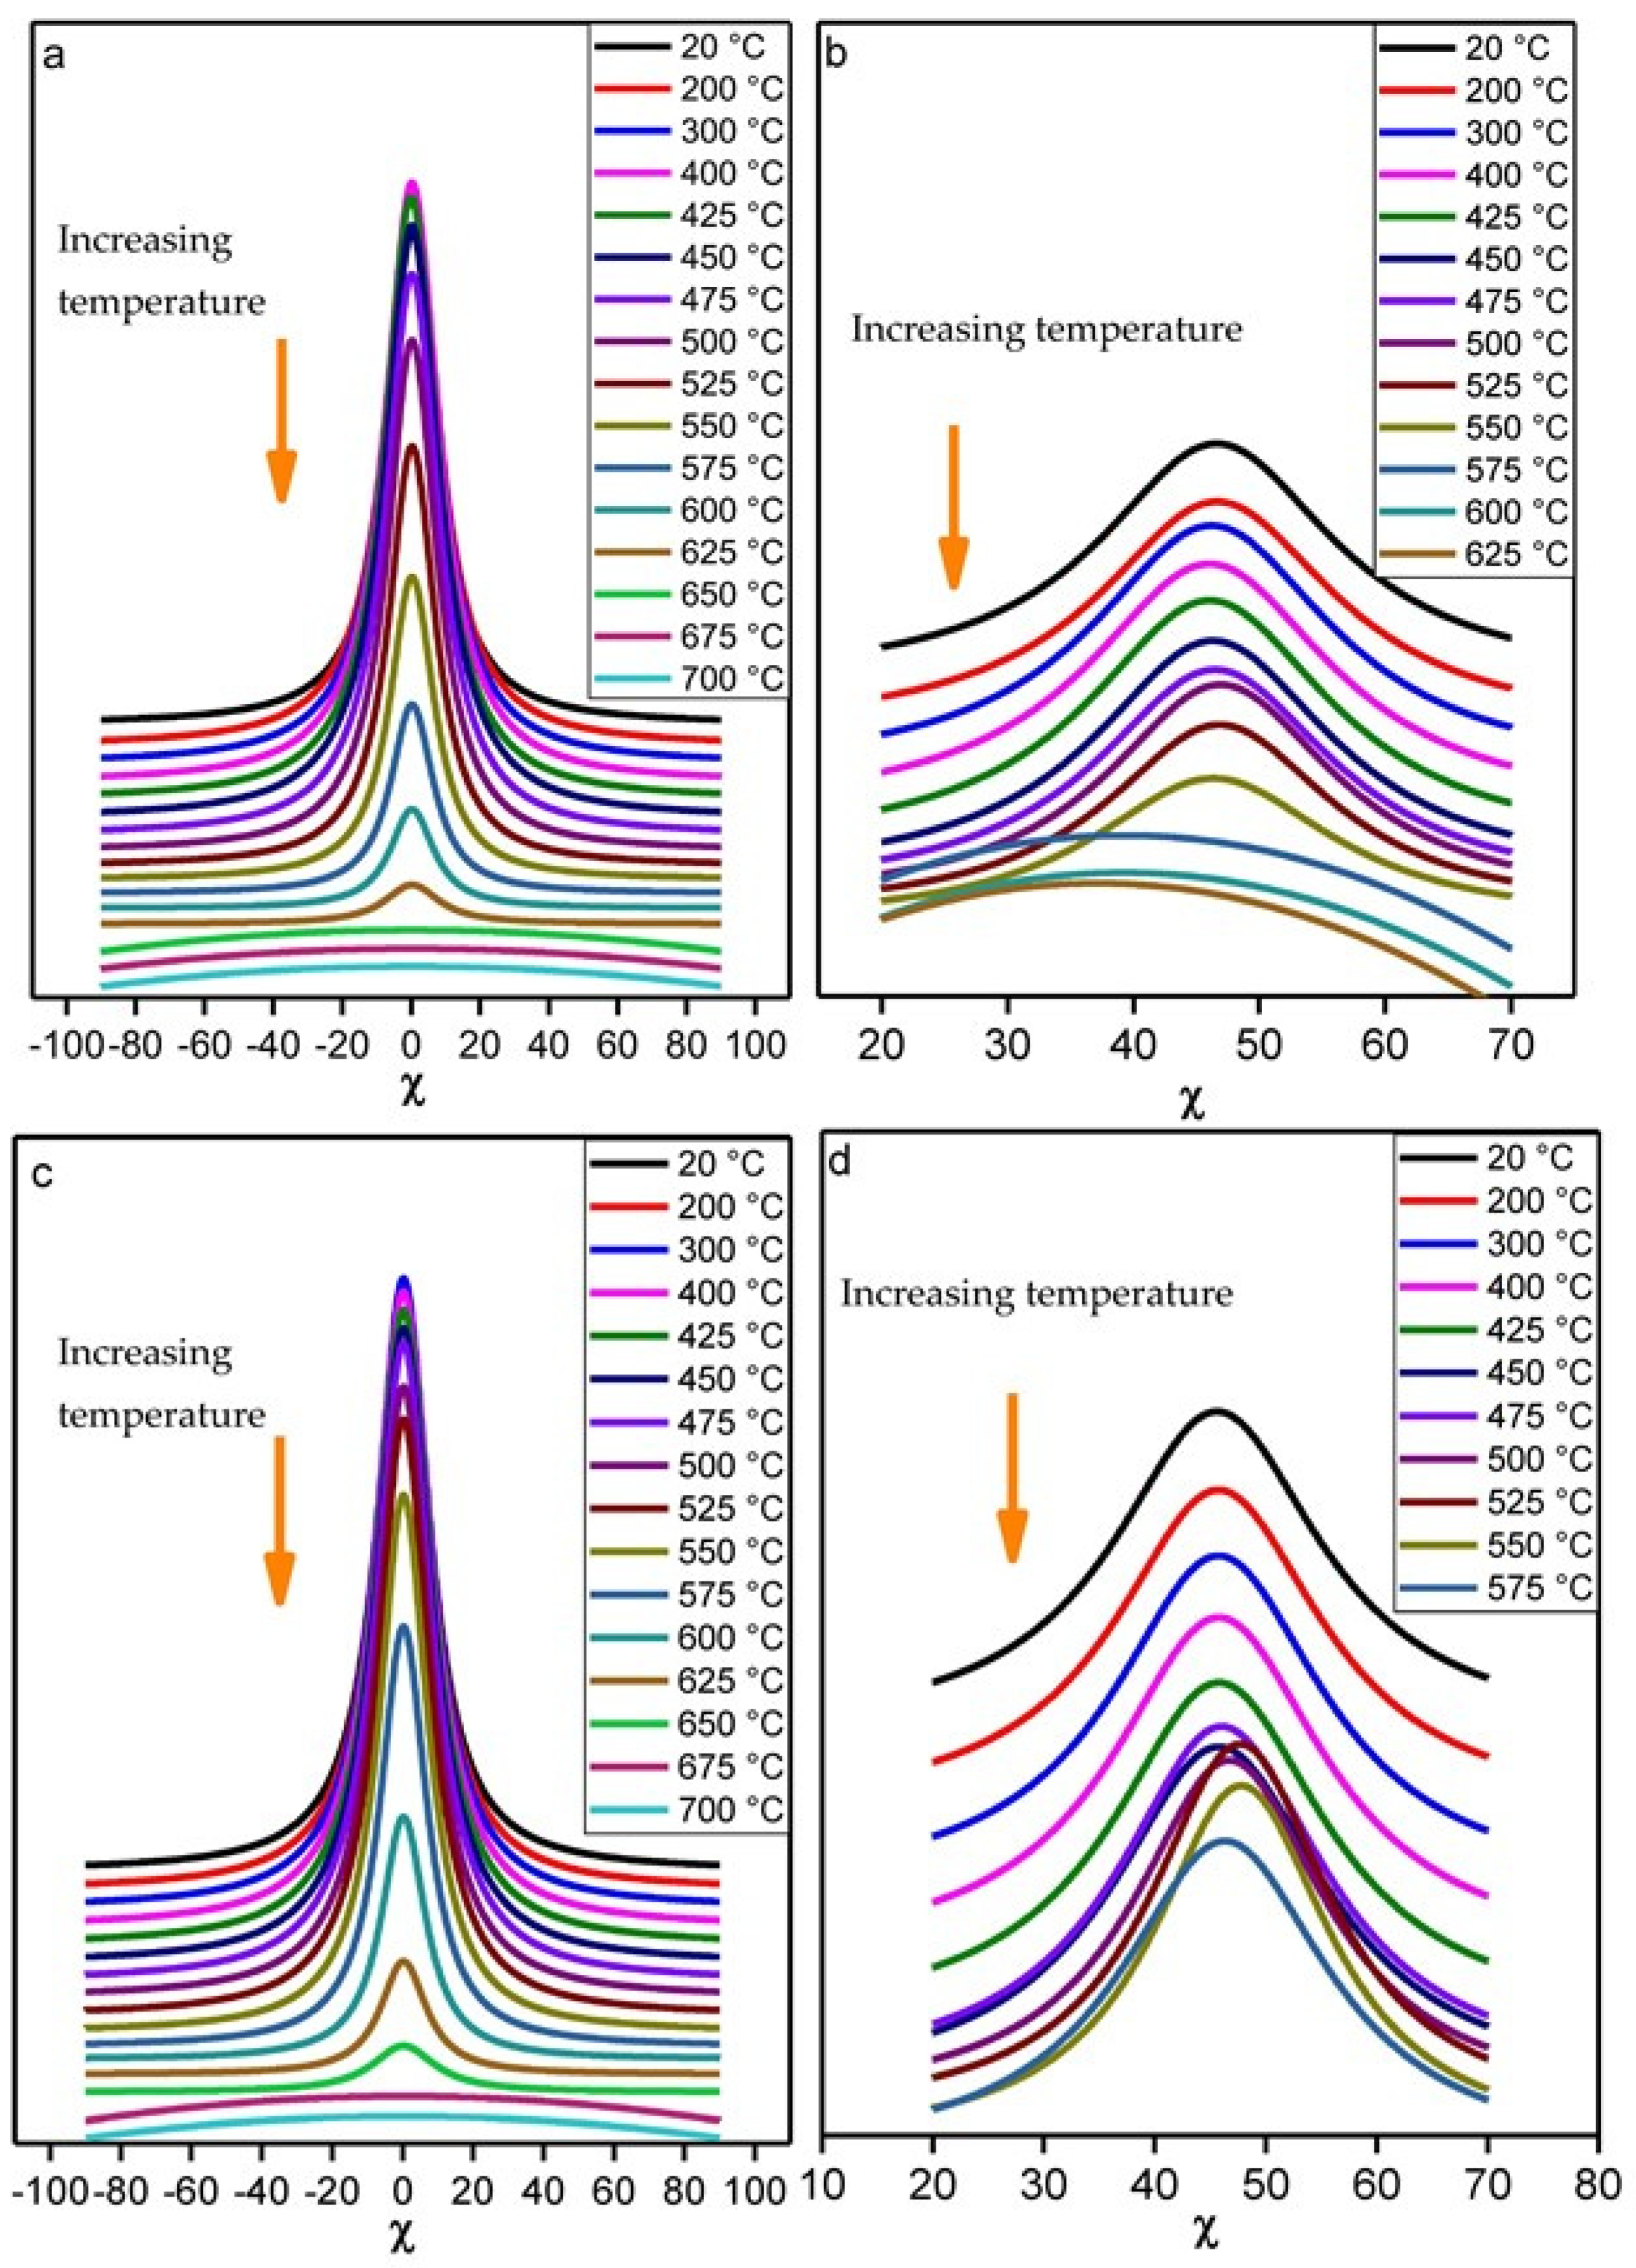
The influence of the temperature on the crystal preferential orientation was investigated through in situ high temperature measurements on samples KRG100, KCS100 and H100 until the end of the dehydroxylation of kaolinite and halloysite (1). Figure 3 shows the evolution of the diffracted intensity of the (002) kaolinite reflection as a function of the χ tilt angle and the temperature. The local arrangement of the hydroxyl groups that will be removed during the dehydroxylation reaction is illustrated in Figure 4.
Al2Si2O5(OH)4 → Al2Si2O7 + 2H2O

KRG100

The main trend observed for the distribution of (002) and (111) diffracted intensities with respect to tilt angle χ during the in situ heat treatment of KGR100 is presented in Figure 5. From room temperature to 550 °C, the intensity of the (002) and (111) reflections remains quite constant. Above 575 °C, the intensity of (002) reflection decreases progressively and finally vanishes close to 750 °C. In the case of (111) reflection, no intensity was collected above 575 °C. These behaviors for the (002) and (111) reflections are in line with a strong texture of kaolinite platelets along the c-axis, and the preservation of this preferred orientation until the complete transformation of kaolinite into metakaolinite.
In order to highlight the differences between the two reflections (002) and (111), the poles figures were represented for specific temperatures, as shown in Figure 6 and Figure 7. For both the azimuthal (φ) and tilt (χ) angles, the range selected was between 0° and 90°. As expected, a centered and intense maximum appeared in the range 0 to 20° of angle χ onto the poles figures related to (002) reflection (Figure 6). A maximum of intensity is noted in the temperature range [25–575 °C], followed by a continuous decrease until 725 °C. The (111) reflection (Figure 7) exhibited a ring-like intensity distribution located around χ = 50° onto the poles figures in the temperature range [25–575 °C]. Above this temperature, the ring-like intensity vanishes while a point (higher intensity region) appeared close to the center of the poles figures (χ = 0°) for the (111) reflection (Figure 8). It is noted that the ring intensity is not uniform. This is due to the wiggling of the flat sample/foil (edges lifting from the flat surface) with the temperature, most likely creating shadows.
Considering the aforementioned results, three main points can be cited:
  • The studied samples exhibited a fiber-type texture with the c-axis aligned preferentially perpendicular to the sample surface;
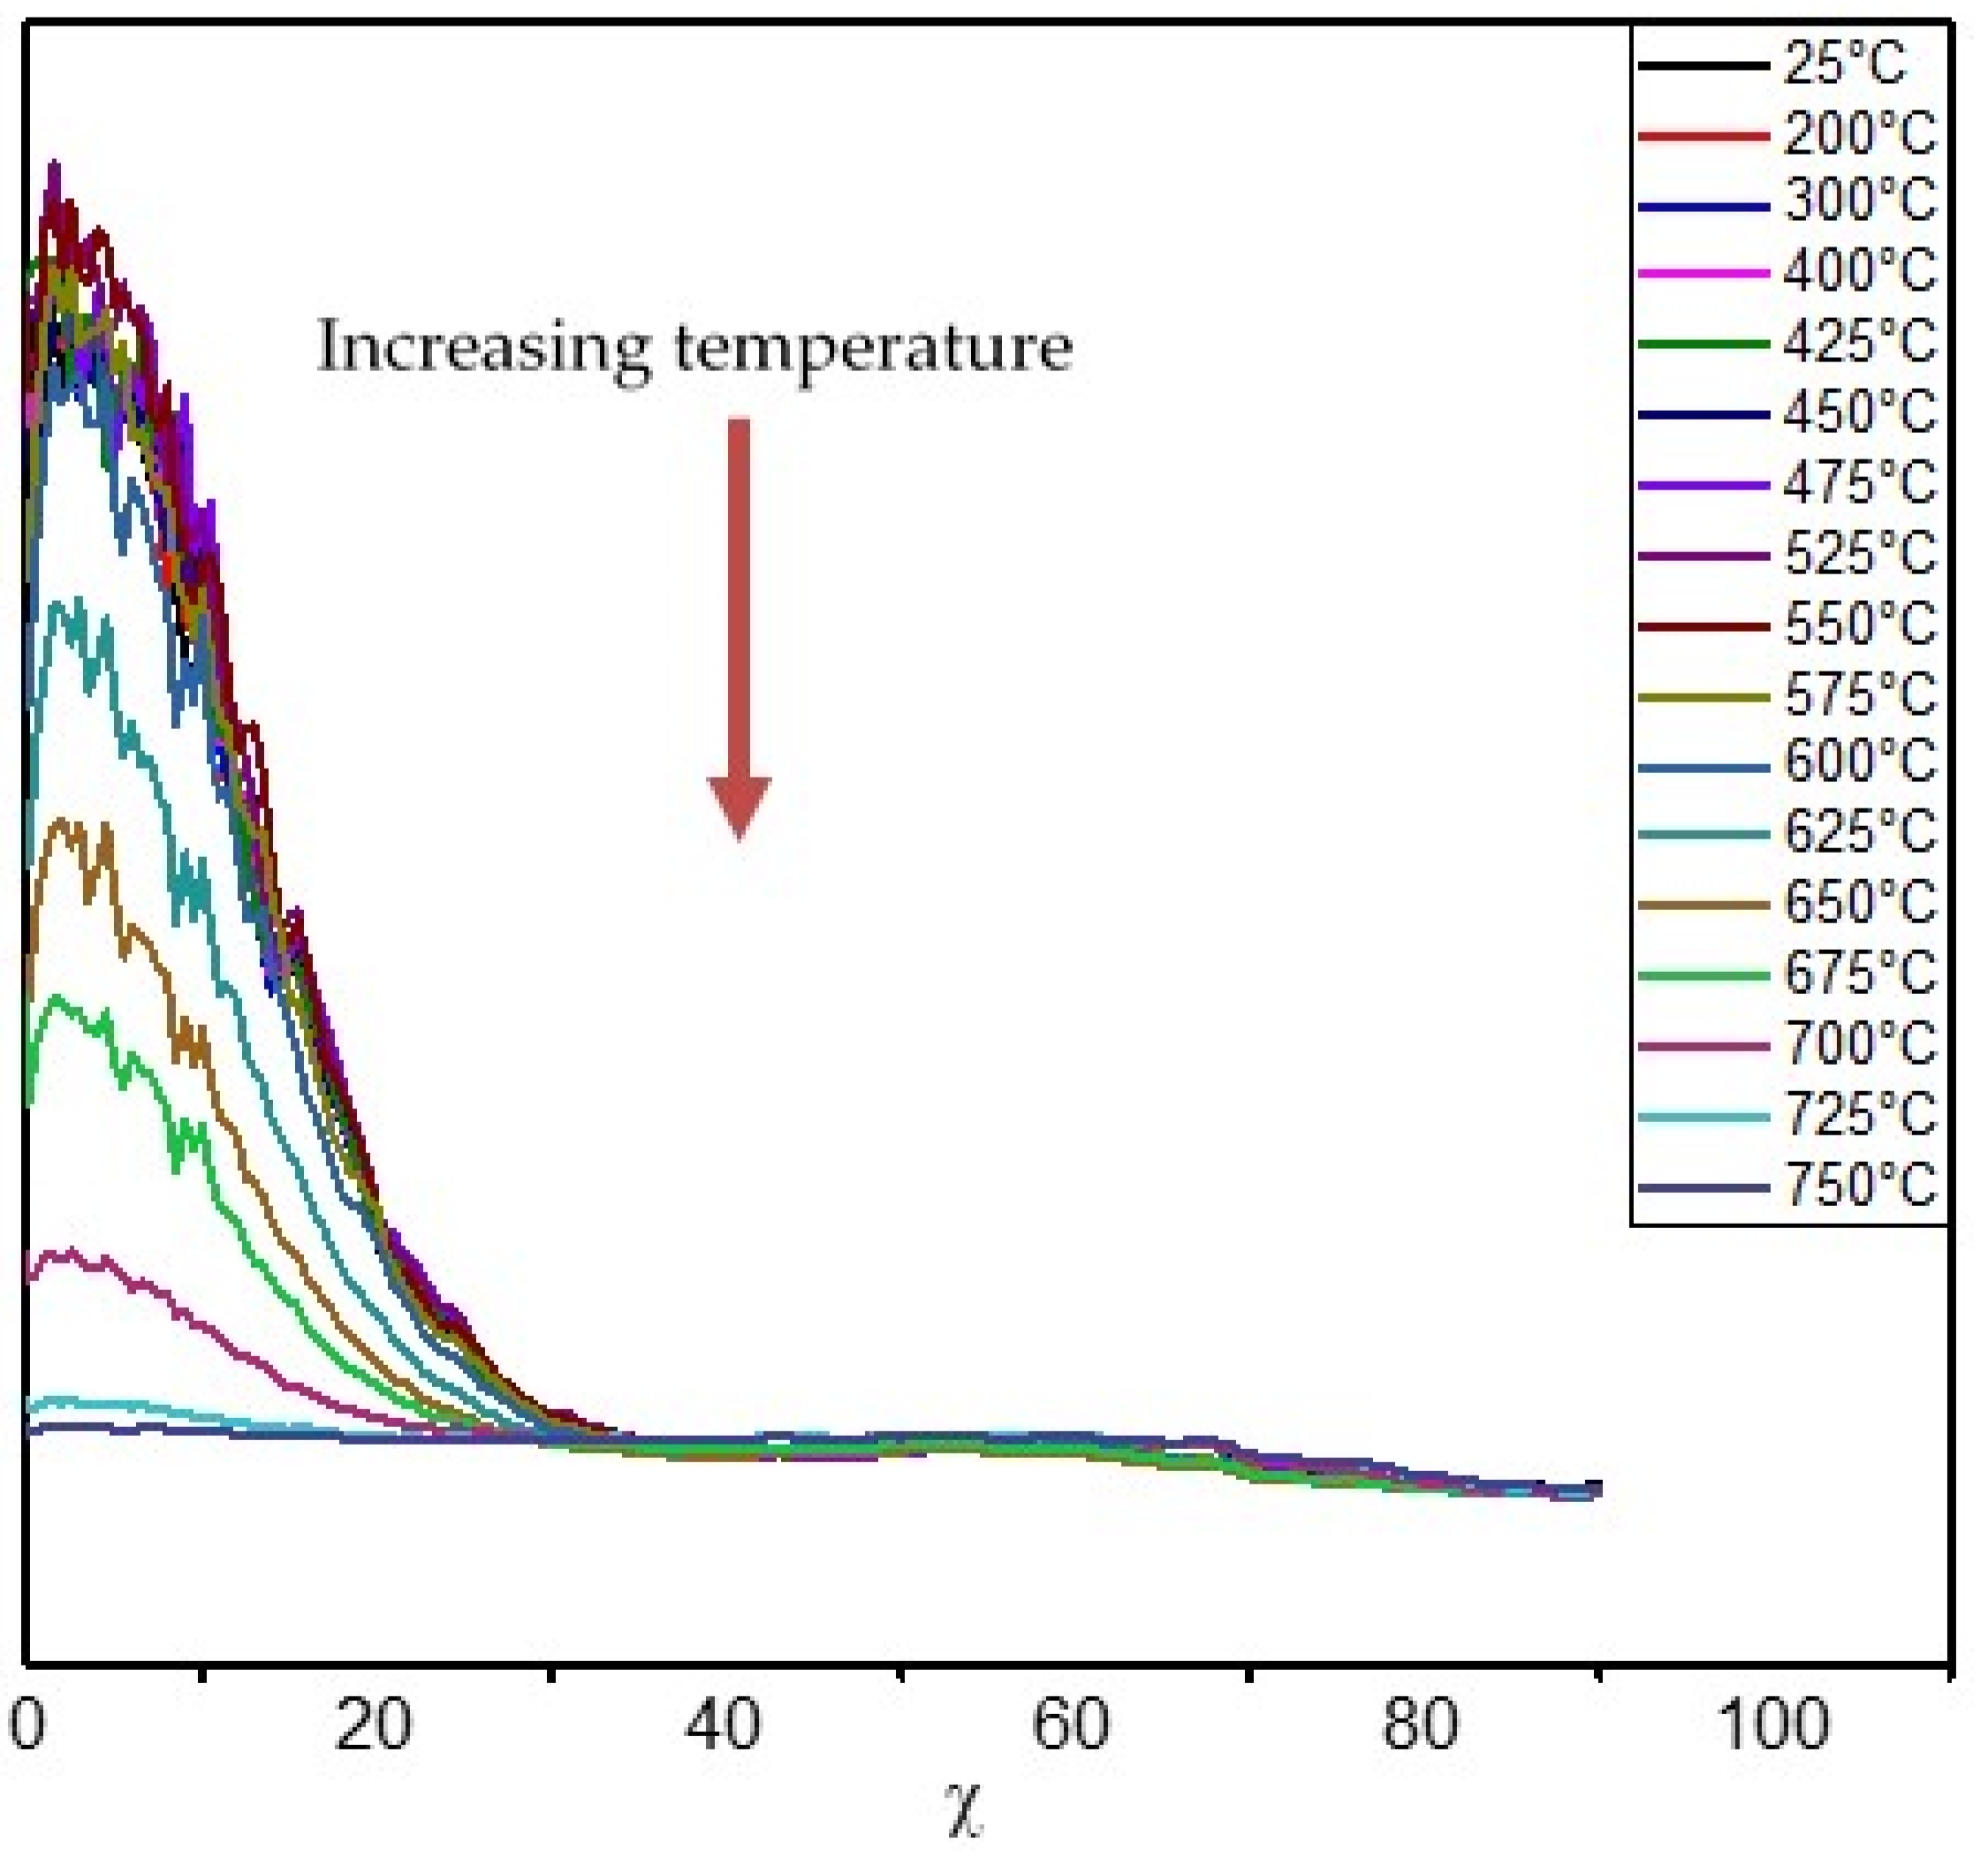
  • The dehydroxylation of kaolinite started around 575 °C for sample KRG100;
  • The initial preferred alignment along the c-axis is kept unchanged until the total dehydroxylation of kaolinite observed at 725 °C within KRG100, in agreement with the disappearance of the reflections (002) and (111);
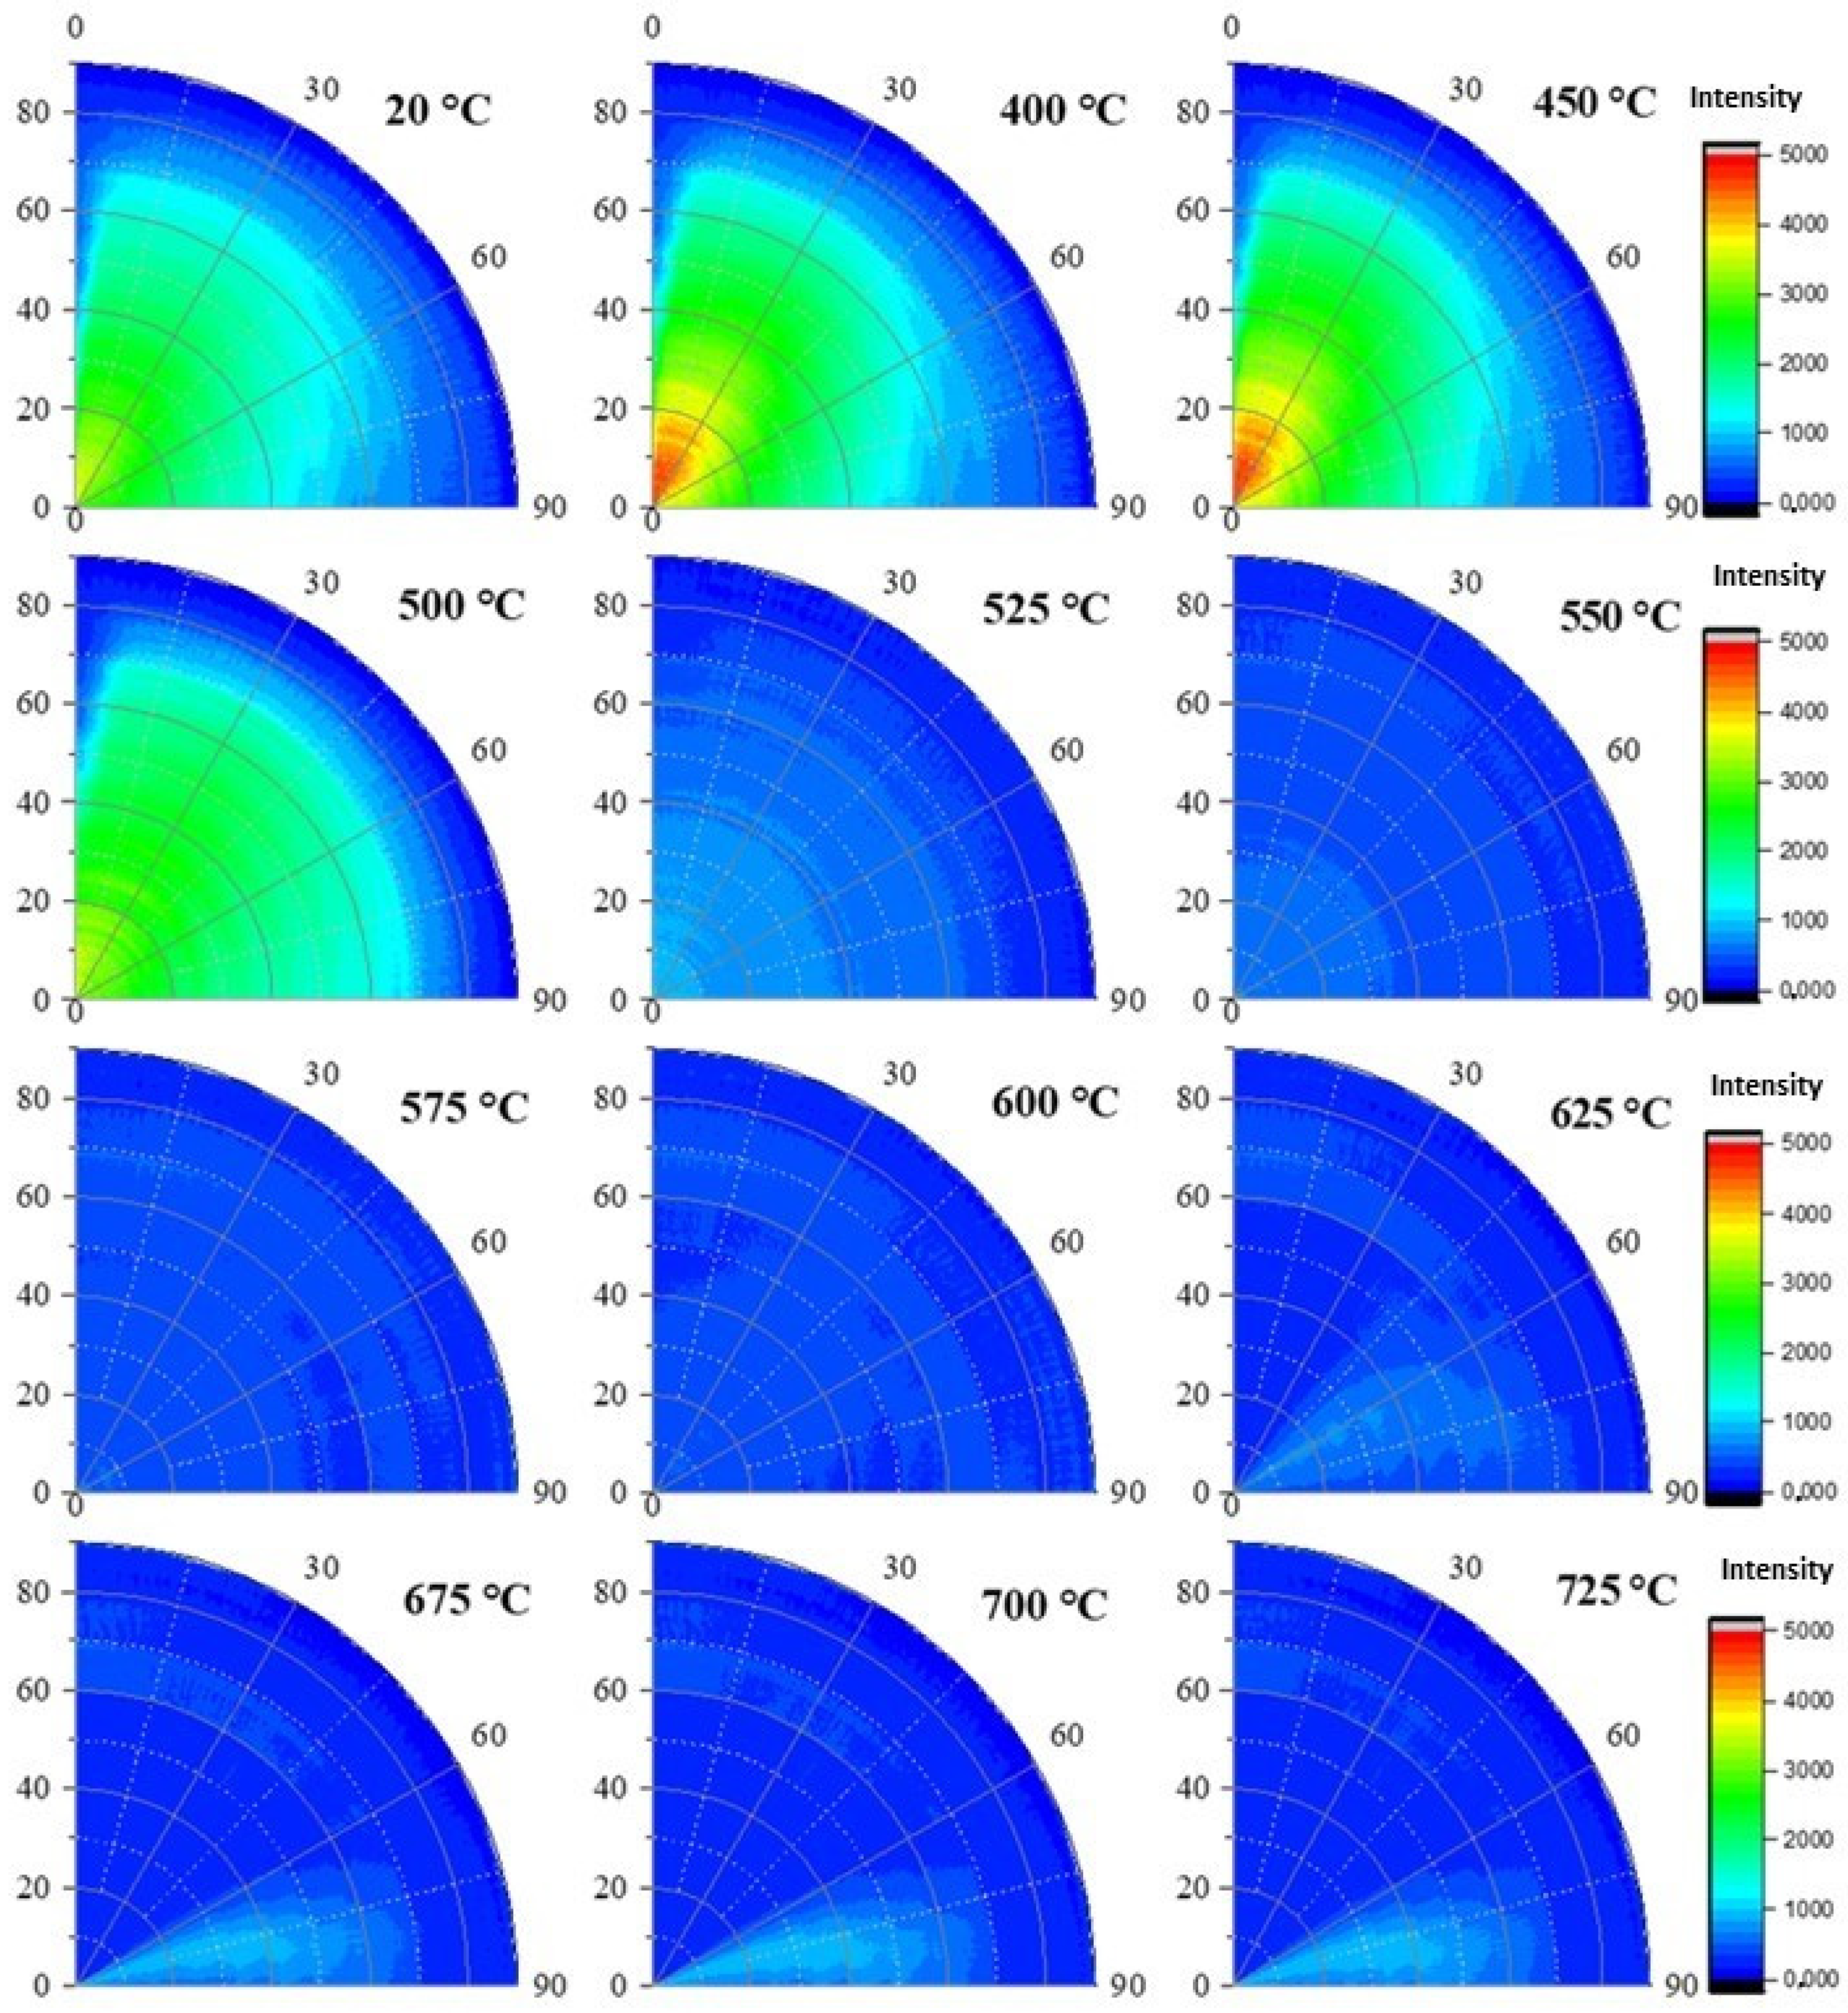
  • A transitory phase seemed to occur during the dehydroxylation, since a new intensity is detected in the center of the poles figure, meaning that this transitory phase had a lattice parameter corresponding to the (111) reflection. Indeed, it is oriented such that these crystalline planes are//surface, which makes intensity appear at chi = 0 and possibly perpendicular to the c-axis.
In our previous study performed on the D2AM beamline at the ESRF Grenoble [14], we noted that the dehydroxylation for the KRG sample occurred in the range 425 to 650 °C. Indeed, we considered the change in slope from the intensity ratio. While considering the FWHM change, we noted a good correlation with the change in texture regarding the results obtained using poles figures measurements. This trend is likely that before the effective detachment of the hydroxyl groups. Moreover, the delamination concept [14] could be assumed in this very early step. Since the shape index and the particle size values are higher for kaolin KRG compared to kaolin KCS, a higher and larger dehydroxylation temperature range is expected for KRG100 samples.

KCS100

In the case of sample KCS100, the distribution of (002) and (111) diffracted intensities with respect to tilt angle χ during the in situ heat treatment is presented in Figure 8. It appears that the intensities of both reflections are constant up to 525 °C. Above this temperature, the (111) reflection disappeared, while the (002) reflection intensity tended to decrease progressively before disappearing at 625 °C. The intensity profile seemed unchanged until total dehydroxylation of the kaolinite within the KCS100 sample. Consequently, it can be concluded that the KCS100 sample exhibited a strong texture along the c-axis as for sample KRG100. Moreover, in both samples, the crystals orientation is not modified during the dehydroxylation process. It was noted that the effect of dehydroxylation on the texture occurred at a higher temperature for CS kaolin regarding the dehydroxylation range determined during former experiments at the ESRF. The same comment regarding the occurrence of several mechanisms could explain this trend. Indeed, the FWHM of the kaolinite reflection (002) in KCS samples clearly indicate a change in slope around 525 °C. This may lead to the conclusion that, as in the case of KRG100 samples, a relaxation seemed to predominate prior to the effective detachment of the first hydroxyl groups. Since the particle size and the shape index values for kaolin KCS are lower compared to those of kaolin KRG, the determined dehydroxylation temperature range for the KCS100 sample is lower.
Figure 9 and Figure 10 present the (002) and (111) poles figures obtained for sample KCS100 at different temperatures. The same trend observed for KRG100 is observed since the (002) diffraction intensity is located close to the center, while the (111) diffraction signal appeared as a ring portion located at χ = 50° onto the poles figures. The sample KCS100 exhibited a fiber-type texture along the c- axis. Furthermore, the disappearance of the (111) diffraction signal at 550 °C led to the occurrence of a transitory phase during the kaolinite dehydroxylation (same situation as for KRG100) related to a centered point on the corresponding poles figures. According to our previous work on these samples, we have demonstrated that the dehydroxylation mechanisms involved a delamination stage [14] in the range 475–525 °C. Consequently, the observed transitory phase could be related to this phenomenon, leading to a partial modification of the initial kaolinite structure while maintaining the (00l) reflections unchanged. Indeed, some authors [26,27,28] assumed that during this dehydroxylation, the XRD peaks of kaolinite disappeared abruptly at 550 °C, and this is much in agreement with the behavior that we observed for the (111) reflection.

H100

Since the particles of the H100 sample are tubular, they may show a different trend compared to samples KRG100 and KCS100. Figure 11 illustrates the in situ evolution of the intensities of (002) reflections of halloysite regarding the tilt angle χ. Due to the rolling of the TO layers, the diffracted intensity of the (111) reflection is quasi-independent of the χ angle and it is not provided. It means that no texture effect is observed with respect to this reflection. The diffracted intensity of the (002) reflection of halloysite (Figure 11) tended to increase in the temperature range [20–450 °C], and then it decreased and disappeared at 550 °C. The preferred alignment is less significant within the H100 sample compared to the KRG1000 and KCS100 samples. In addition, the heat treatment up to 450 °C tended to increase the texture within the H100 sample, due to the roll out of some halloysite tubes [29]. Above 450 °C, no significant texture is noted.
The (002) halloysite reflection poles figures presented in Figure 12 confirm the lack of preferential orientation at room temperature, followed by a slight texture occurrence when temperature is increased up to 450 °C for the H100 sample. The observed texture disappeared before the complete dehydroxylation of halloysite. The (111) halloysite reflection poles figures were not of great importance since it was already clearly assessed that no texture was associated with this reflection (Figure 11. Due to the polydispersity particle size distribution of halloysite powder, the dehydroxylation of sample H100 tended to start 100 °C lower than in the case of the studied kaolins. Therefore, an overlapping may occur between the staking defects relaxation and the submicron-sized halloysite particles dehydroxylation. The current measurement mode allowed the accurate detection of these concomitant mechanisms within sample H100.

3.1.2. Texture Behavior for the Kaolin-Halloysite Mixtures

The mixtures containing 50 mass% of kaolin and 50 mass% of halloysite in each case were submitted to in situ analyses. The diffracted intensity of (002) and (111) reflections of kaolinite are presented in Figure 13, as a function of the tilt angle χ for different temperatures for samples KRG50H50 and KCS50H50. A very significant texture is noted for both samples despite the presence of a great amount of halloysite. The (002) kaolinite reflection, which is much closed to the (002) reflection of halloysite, undergoes a slight intensity increase while the temperature increases from 20 to 400 °C. This trend is in agreement with the roll out of halloysite tubes, which interfered with the neighboring kaolinites crystallites signal. The intensity of the (002) reflection was stable in the temperature range 400–525 °C, then progressively decreased and disappeared around 675 °C. The (111) reflection exhibited a constant intensity in the range 25–550 °C for the KCS50H50 sample, and then it disappeared above 550 °C. For the KCS50H50 sample, the (111) reflection exhibited a constant intensity in the range 25–575 °C, but a shift of the maximum of the intensity distribution is observed (5° in χ) before its disappearance after 575 °C. This specific trend suggested a significant change in the crystals orientation with respect to the sample surface (supplemental tilting). The (111) reflection vanished when the diffracted intensity of the (002) reflection started to decrease in both samples, which confirmed the onset of dehydroxylation of kaolinite and halloysite, as already indicated in the case of the KCS100 and KRG100 samples. The (002) and (111) poles figures were determined (not shown here) and were in agreement with the major trends described above. It arises that each TO mineral undergoes decomposition with less interaction with other phases.

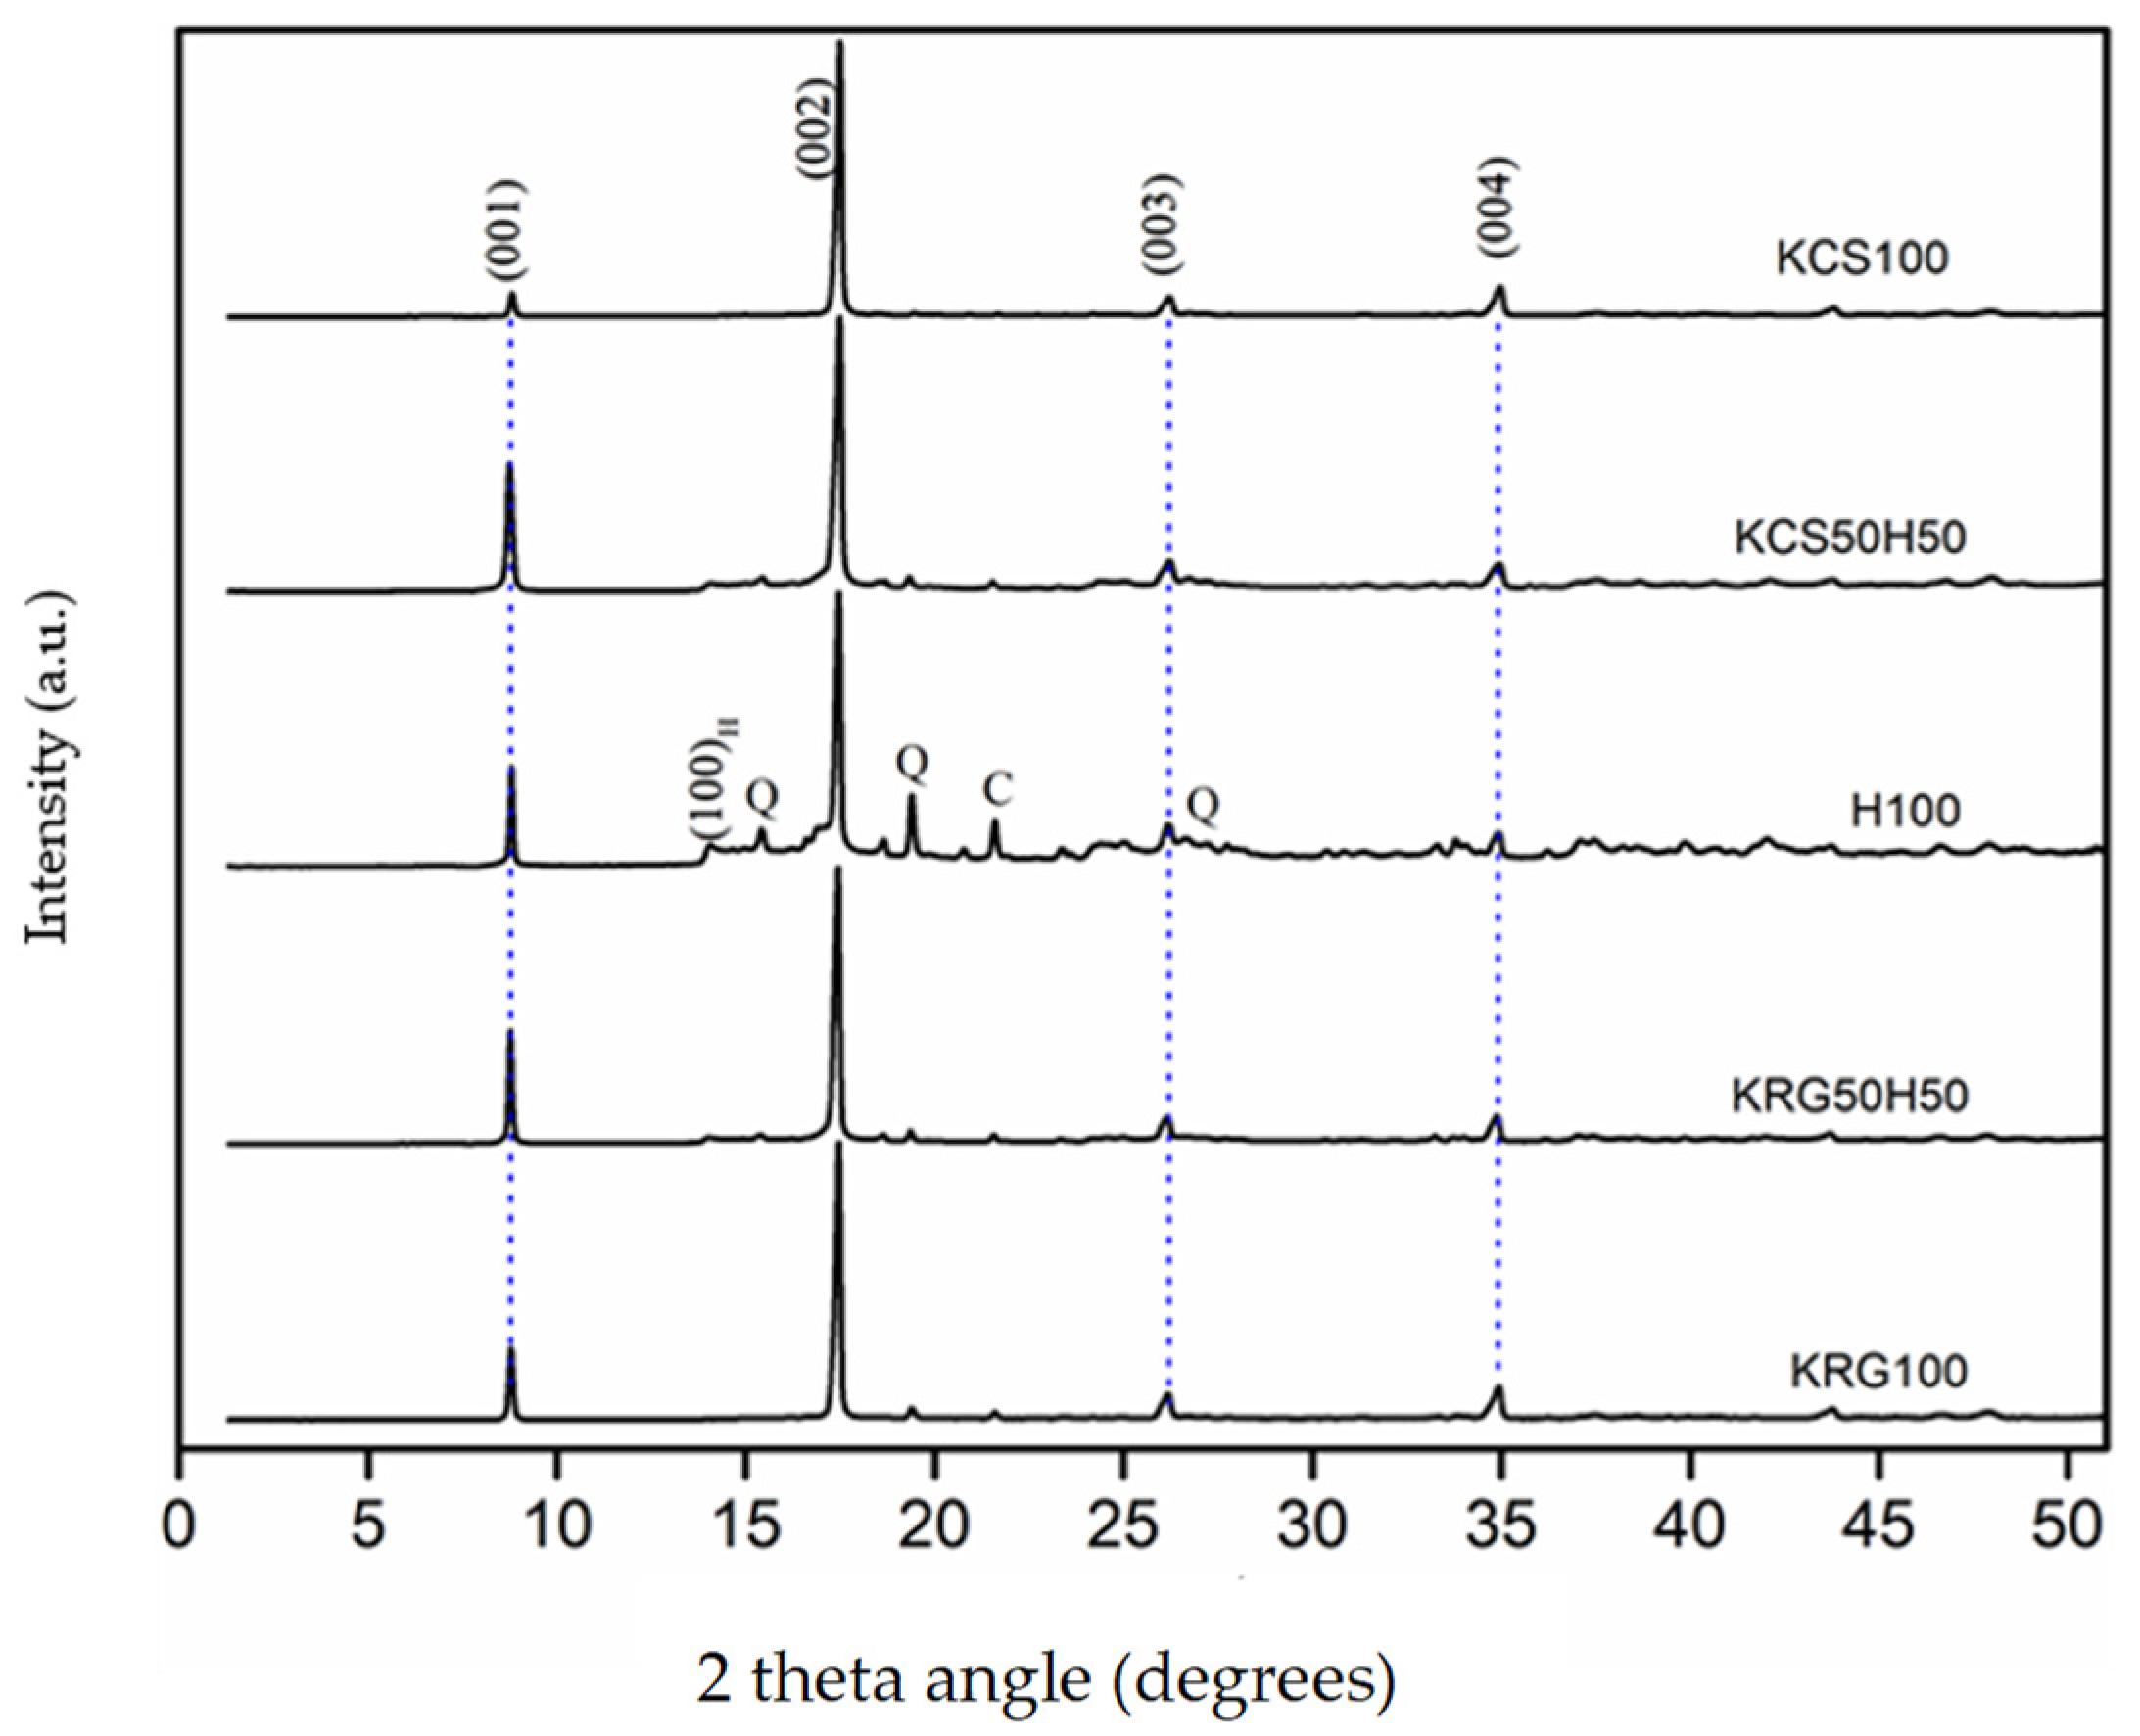
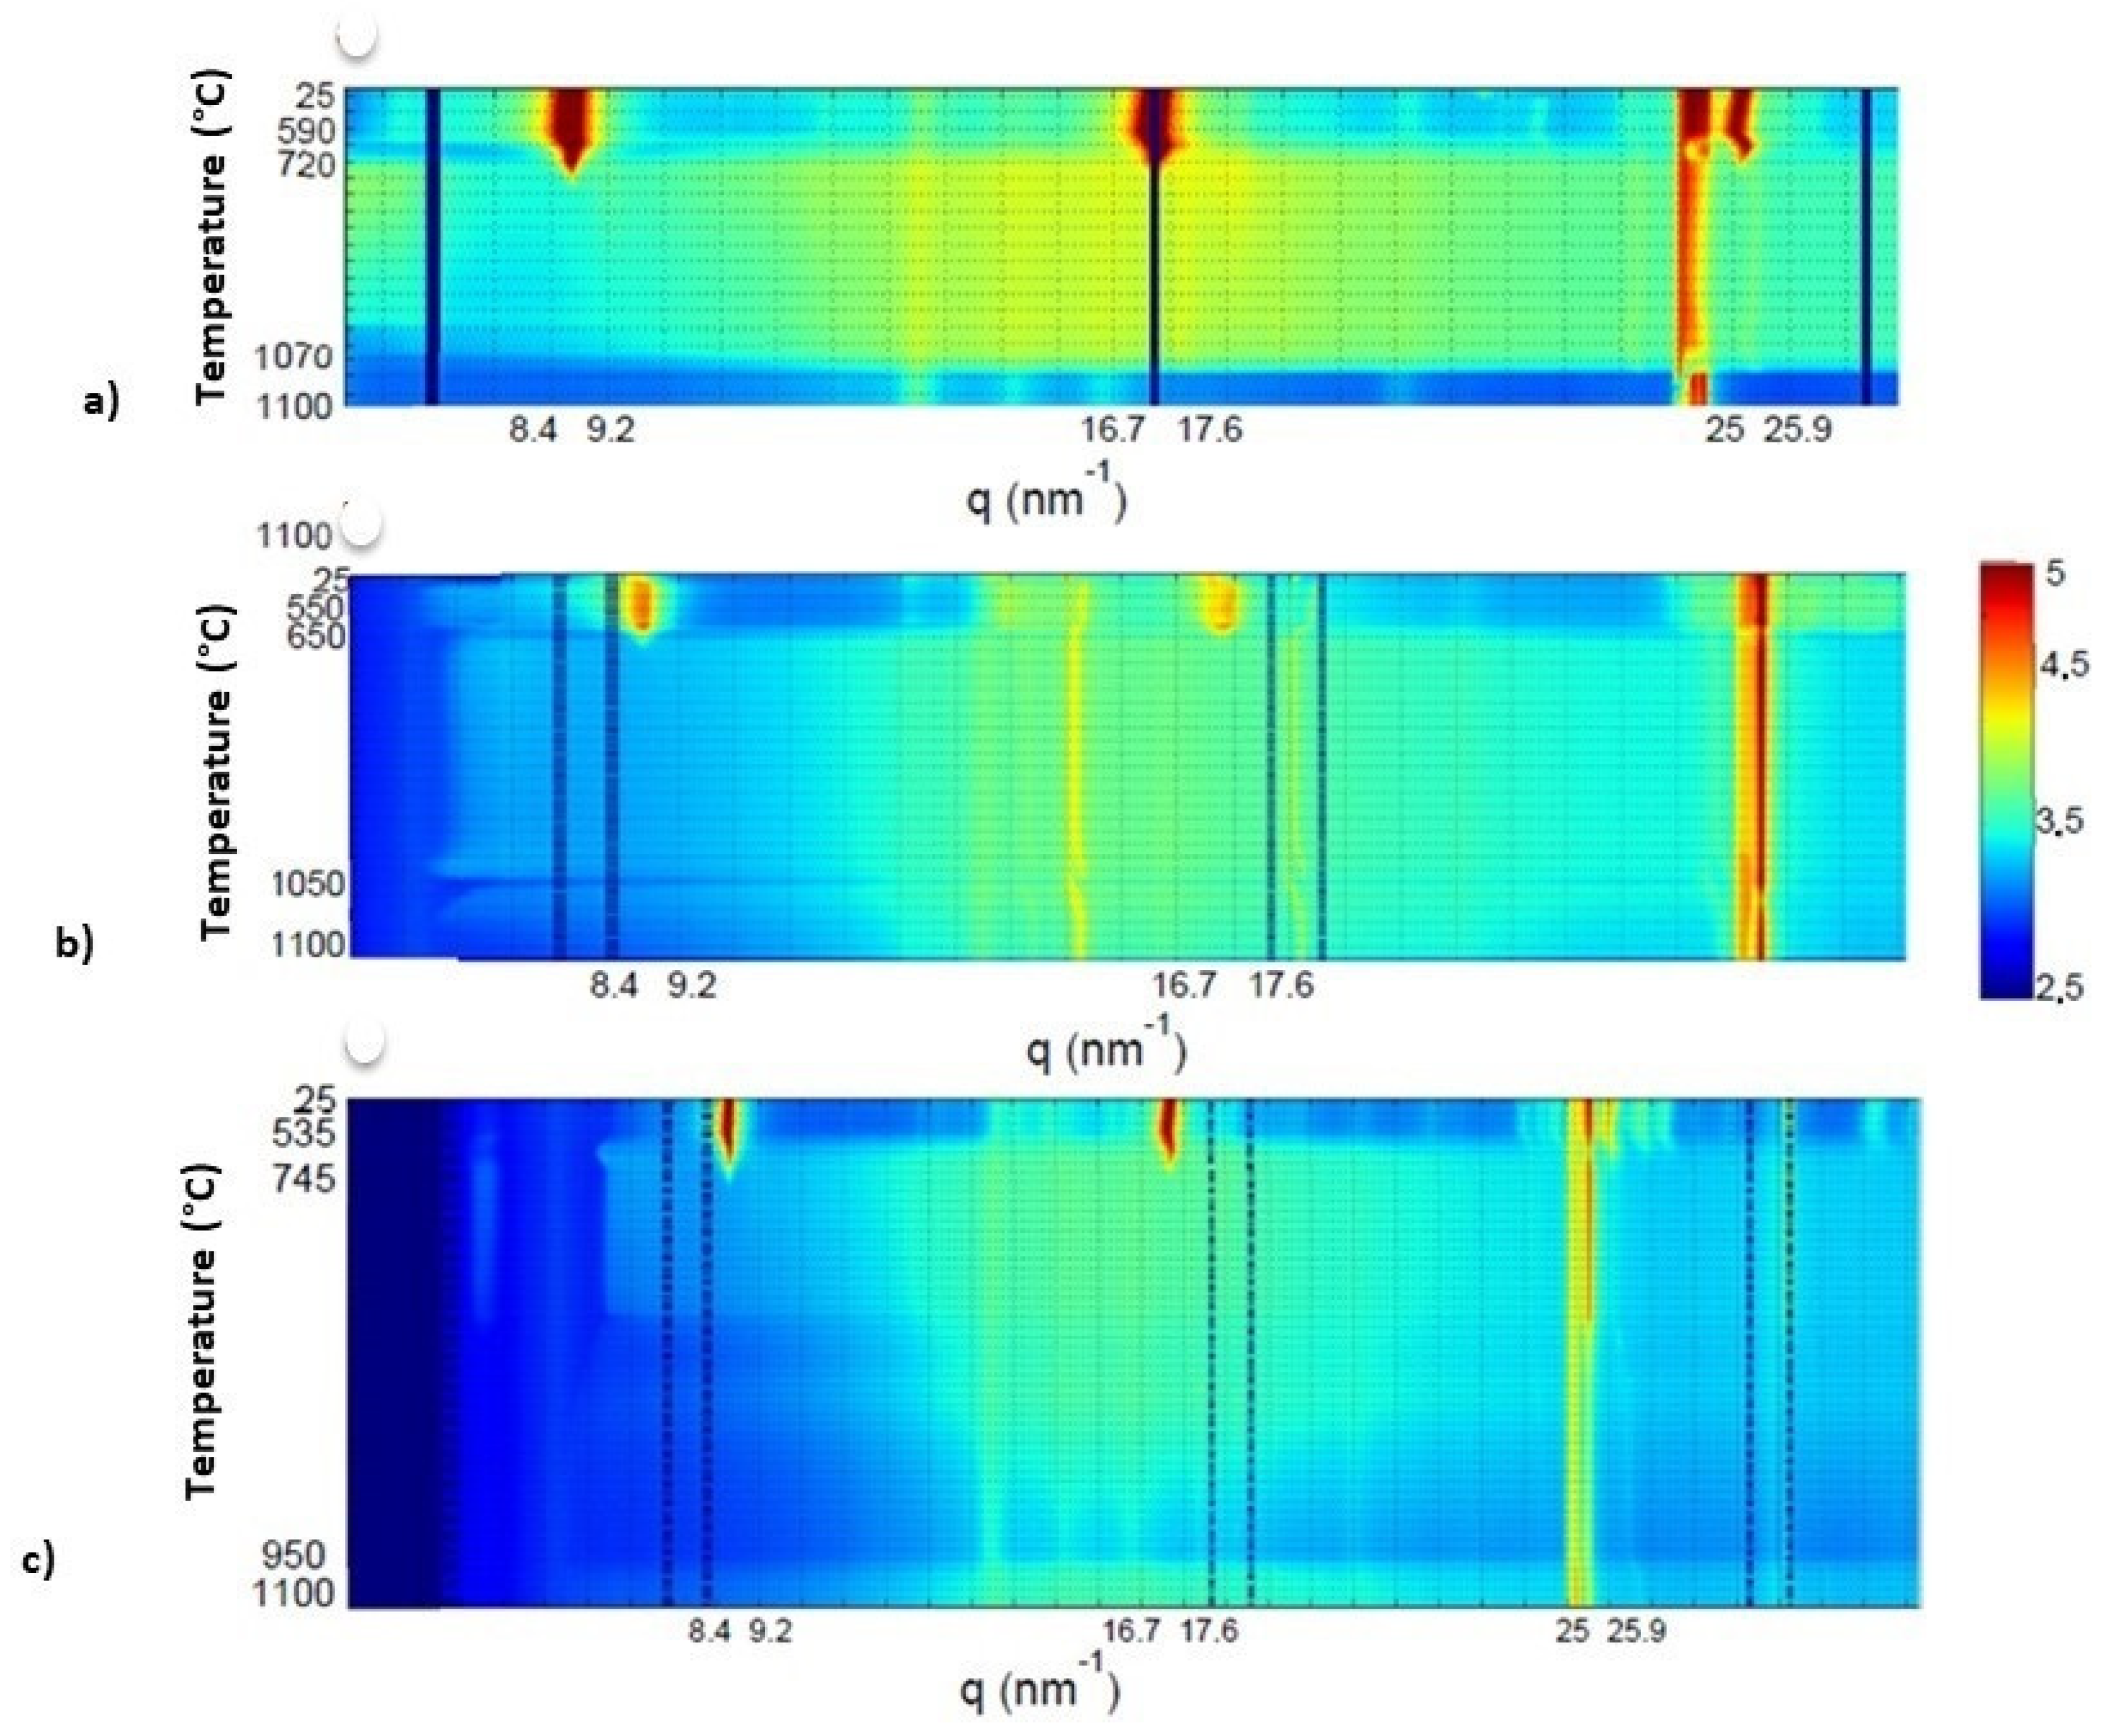
3.2. Exploring the Dehydroxylation end Point Using X-ray Scattering for Samples KRG100, KCS100 and H100

During the dehydroxylation of kaolinite-based samples, we were able to clearly achieve the temperature range of kaolinite dehydroxylation and the changes in texture. Nevertheless, it was quite difficult to achieve such analysis with the halloysite-based sample due to its weak texture. In addition, the presence of the scattering signal coming from the PEEK dome did not allow obtaining interesting responses on the occurrence of a transitory spinel-like phase upon dehydroxylation during the in situ X-ray diffraction experiments. Furthermore, we intended to clarify the end-temperature of dehydroxylation without focusing on the classical (002) reflection. Therefore, we performed the in situ wide angle X-ray scattering measurements, using the curved two-dimensional detector CirPAD (angular span in 2θ~135°) [24]. The operating conditions consisted in a heating rate of 20 °C/min from room temperature to 1100 °C, with data recording every 10 s.
Figure 14 shows the evolution of the X-ray scattering patterns collected for the studied samples (KCS100, KRG100 and H100) in the temperature range [25–1100 °C]. The patterns are plotted as a function of the norm of the Q-vector, i.e., Q = 4 π sin θ / λ . Three main temperature ranges with specific behaviors were identified:
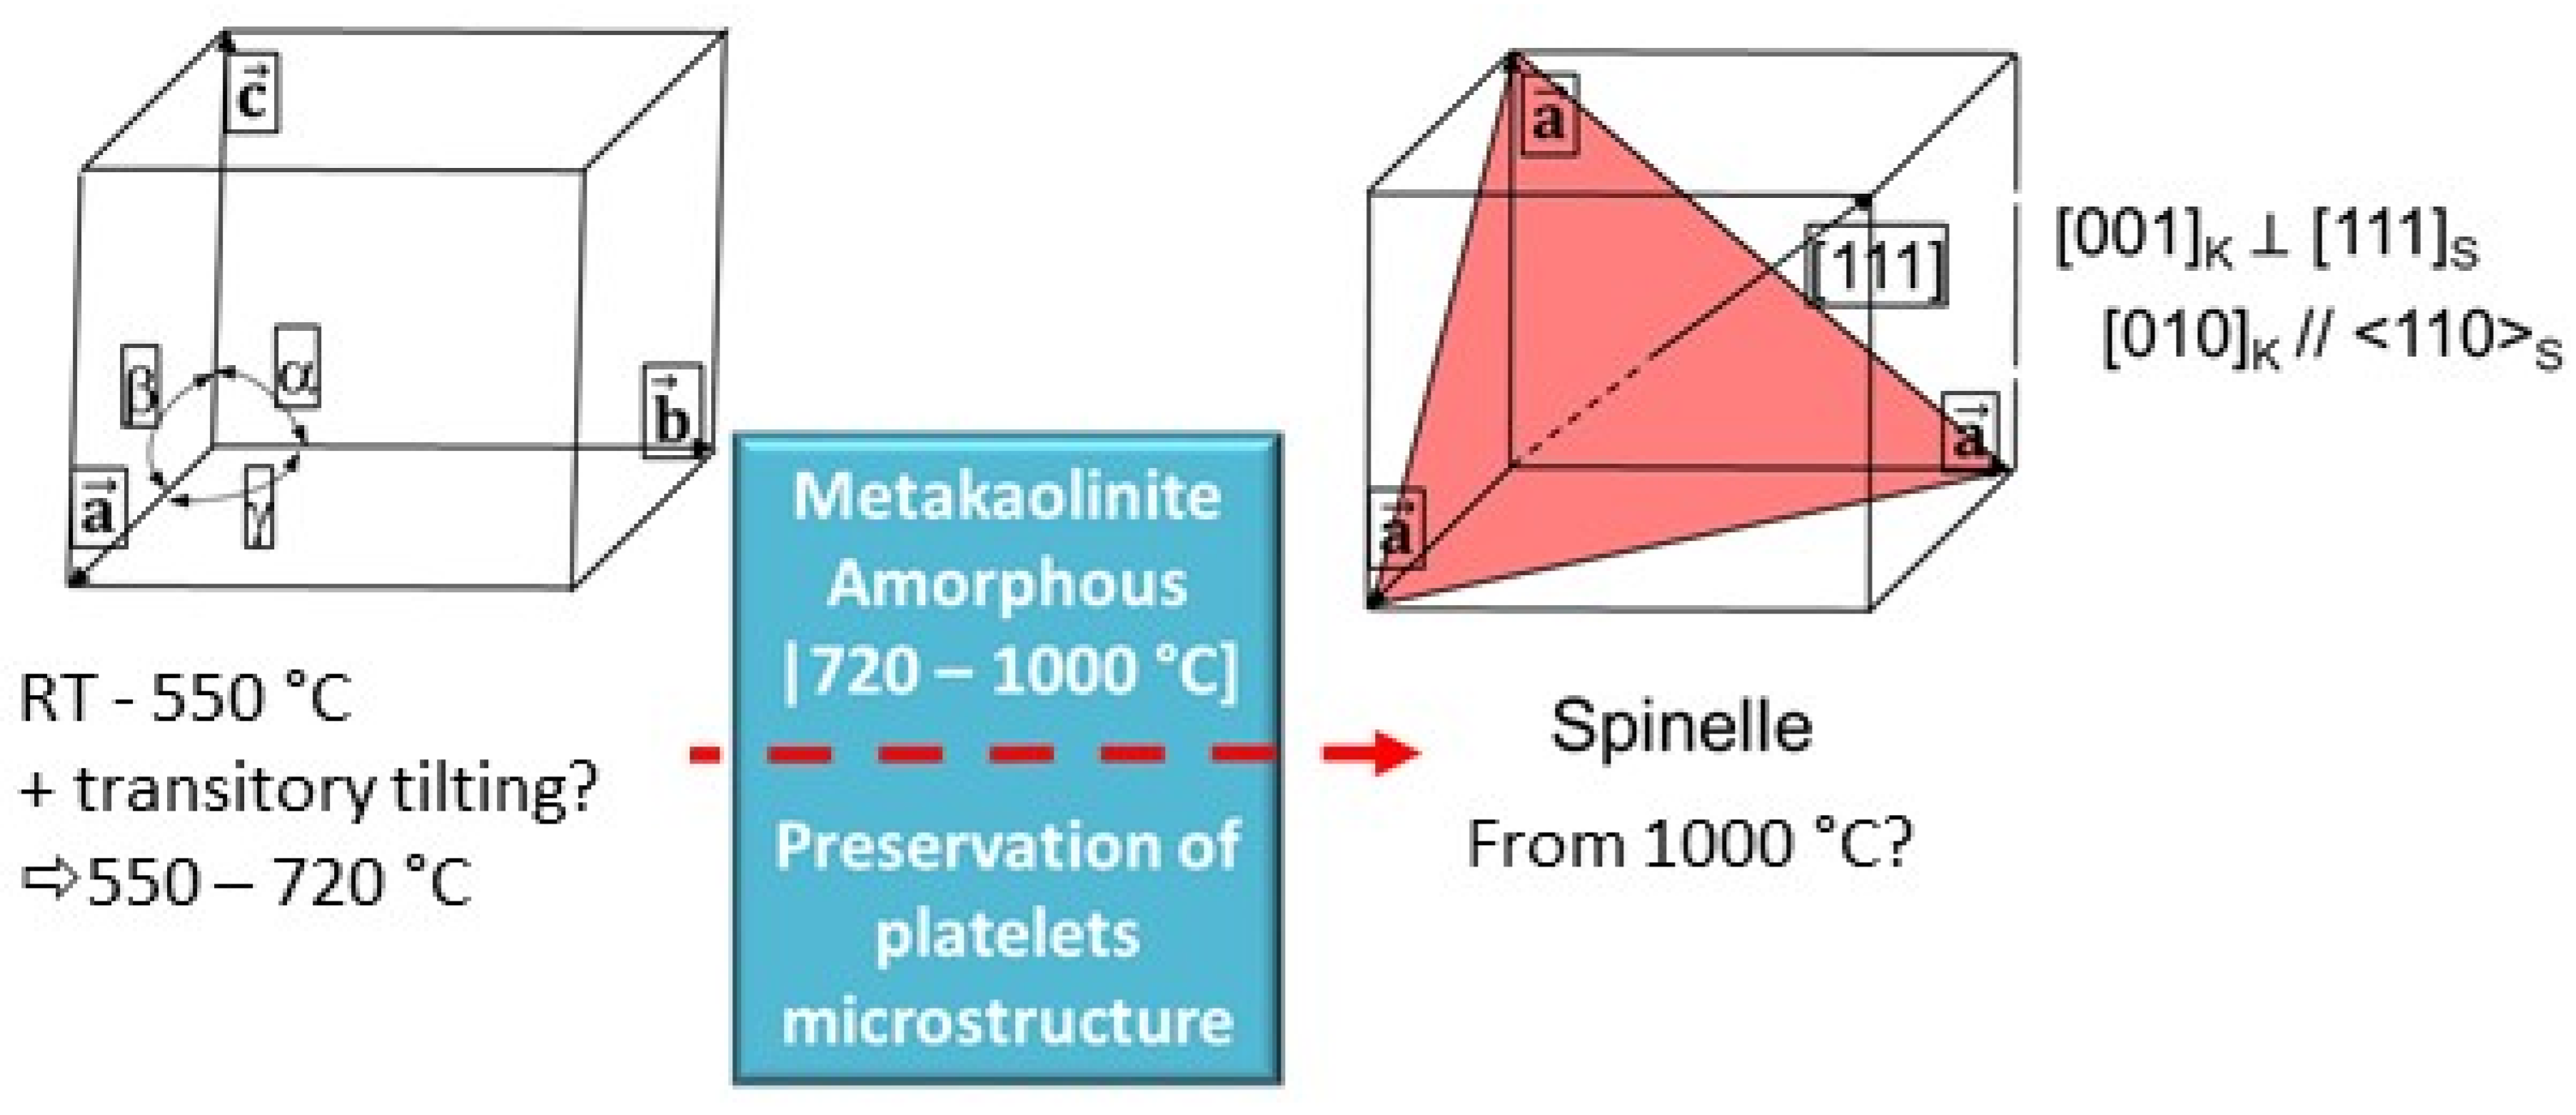
  • 25–725 °C, where the characteristic peaks of kaolinite are observed, namely: (001), (002) and (003) located at 9 nm−1, 17.5 9 nm−1 and 25.5 9 nm−1 in Q, respectively. These reflections disappeared around 720 °C, indicating the end of kaolinite dehydroxylation (complete transformation into amorphous metakaolinite);
  • 725–1000 °C, with a homogeneous intensity within the whole angular range, and no significant peak. This may be considered as the stability domain of metakaolinite, the amorphous phase;
  • 1000–1100 °C, where the background intensity undergoes a significant change. This trend seems consistent with a specific structural change in the studied samples.
From the literature, the kaolinite or halloysite transformation into metakaolinite, called dehydroxylation, consisted in the removal of hydroxyl groups located in the octahedral sheets, which combined and released as water vapor. Due to these reactions, the octahedral sheets exhibit a significant deformation that lead to the distortion of the global kaolinite or halloysite structure. Cheng et al. [30] pointed out the existence of three types of hydroxyl groups in kaolinites during the flash calcination of kaolins at 800–1300 °C, E-type (~50%, easy), D-type (~40%, difficult) and U-type (~10%, unable), which were identified according to the removal difficulty. They suggested that the removal of E-type hydroxyl groups resulted in the conversion of a part of VI-coordinated Al in kaolinite to V-coordinated Al and the production of meta-kaolinite. When the temperature rose up to 1200 °C, mullite was produced and a part of V-coordinated Al converted to IV-coordinated Al and VI-coordinated Al. In the present study, the heating rate is significant and the removal of hydroxyl groups is achieved at lower temperatures. At the end of the process, the long-range order is lost and the amorphous phase obtained; metakaolinite [31] will then gradually transform above a specific temperature (between 950 and 1100 °C) to a new crystalline phase (Al-Si spinel or mullite) [26,29,30,31,32,33].
Accordingly, to our results, the new crystalline phase occurred at 1000 °C. Nevertheless, we are not able to provide the effective nature of this phase yet. We can summarize a simplified representation of the sequence based on the kaolinite samples, as illustrated in Figure 15.

4. Conclusions

The present study aimed at understanding the texture changes in kaolinite and halloysite materials shaped by tape casting. The evolution of the texture as a function of the temperature was followed by in situ high temperature X-ray diffraction measurements and determination of the poles figure evolutions. In kaolinite-based samples KCS100 and KRG100, a strong texture was observed with respect to the kaolinite c-axis (which is preferentially oriented along the sample surface normal). This was maintained until the total dehydroxylation of kaolinite, which transforms to metakaolinite. In the case of the halloysite-based sample H100, a weak texture along the c-axis was developed upon heating from room temperature to 400 °C, thanks to the opening of some halloysite tubes. Nevertheless, this texture disappeared before the complete dehydroxylation of halloysite.
The dehydroxylation temperature range was determined for all the materials of interest: 575–725 °C for KRG100; 525 and 625 °C for KCS100. Therefore, the onset point of dehydroxylation is 550 °C ± 25 °C for these kaolinites. The main differences observed for these kaolins may be related to the variation of the stacking faults density, the higher shape index (25 for KCS100 and 40 for KRG100) and the grain size distribution of kaolinite platelets in the KRG100 sample in comparison to the KCS100 sample. It was also noted that during the dehydroxylation of kaolinite, the characteristic portion of ring related to the diffracted intensity of its (111) reflection located at χ = 45° tended to disappear above 550 °C and led to the formation of a new transitory phase with the appearance of a central peak (chi = 0) for the (111) poles figures. Indeed, this reflection is parallel to the sample flat surface (a direction perpendicular to the kaolinite c-axis). For the H100 sample, the dehydroxylation starts at the lower temperature 475 °C, but it was difficult to assess the end of dehydroxylation due to the loss of texture.
When considering the kaolinite-halloysite mixtures, samples KRG50H50 and KCS50H50, a significant texture was observed along the c-axis. Indeed, the presence of kaolinite platelets predominated onto the alignment of halloysites tubes. Furthermore, it was noted that the halloysite influenced the (002) diffracted intensity into the temperature range 20 °C to 400 °C. Above 400 °C, the behavior obtained for the (002) reflection in samples KRG50H50 and KCS50H50 was similar to the behavior noticed for pure kaolins KRG100 and KCS100, respectively. Again, the onset dehydroxylation temperature is identified as 550 °C ± 25 °C. The same trend observed for the (111) kaolinite reflection for samples KRG100 and KCS100 was noted in the samples KRG50H50 and KCS50H50. This transitory phase required further analysis to highlight its structural characteristics.
Further X-ray scattering experiments allowed highlighting the effective offset temperature of the dehydroxylation, which was identified as close to 720 °C. The metakaolinite obtained underwent structural transformation to another transitory phase at 1000 °C. The latter phase identification through pair distribution functions analysis may bring new clues for the understanding of the metakaolinite to mullite transition sequence, which is out of the scope of the present study.

Author Contributions

Conceptualization, G.L.L.-N., I.D. and R.G.; Methodology, G.L.L.-N. and R.G. and I.D.; Software, C.M., R.G. and I.D.; Validation, C.M., G.L.L.-N. and R.G.; Formal Analysis, I.D., C.M., G.L.L.-N. and R.G.; Investigation, C.M., I.D., G.L.L.-N., R.G. and N.T.-D.; Resources, C.P., I.D., G.L.L.-N., C.M., R.G., N.T.-D. and D.T.; Data Curation, C.M., I.D., G.L.L.-N. and R.G.; C.M.: data acq, data curation + xpad/cispad data conversion, generate poles figs. Writing—Original Draft Preparation G.L.L.-N. and I.D.; Writing—Review and Editing, G.L.L.-N., C.M. and R.G.; Visualization, G.L.L.-N., C.M. and R.G.; Supervision, G.L.L.-N., C.M., N.T.-D., R.G., D.T. and C.P.; Project Administration, G.L.L.-N., N.T.-D., C.P. and R.G.; Funding Acquisition, G.L.L.-N., C.M., D.T., N.T.-D., C.P. and R.G. All authors have read and agreed to the published version of the manuscript.

Funding

This research received no external funding.

Data Availability Statement

Not applicable.

Acknowledgments

The authors are grateful to SOLEIL Synchrotron for providing the access to the DiffAbs beamline and they thank the respective staff for support during experiments.

Conflicts of Interest

The authors declare no conflict of interest.

References

  1. Corni, I.; Ryan, M.P.; Boccaccini, A.R. Electrophoretic deposition: From traditional ceramics to nanotechnology. J. Eur. Ceram. Soc. 2008, 28, 1353–1367. [Google Scholar] [CrossRef]
  2. Manfredini, T.; Hanuskova, M. Natural raw materials in “Traditional” ceramic manufacturing. J. Univ. Chem. Technol. Metall. 2012, 47, 465–470. [Google Scholar]
  3. Bergaya, F.; Lagaly, G. General introduction: Clays, clay minerals, and clay science. Dev. Clay Sci. 2006, 1, 1–18. [Google Scholar]
  4. Lao, X.; Xu, X.; Jiang, W.; Liang, J.; Miao, L.; Wu, Q. Influences of impurities and mineralogical structure of different kaolin minerals on thermal properties of cordierite ceramics for high-temperature thermal storage. Appl. Clay Sci. 2020, 187, 10548. [Google Scholar] [CrossRef]
  5. Lecomte, G.L.; Bonnet, J.P.; Blanchart, P. A study of the influence of muscovite on the thermal transformations of kaolinite from room temperature up to 1100 °C. J. Mater. Sci. 2007, 42, 8745–8875. [Google Scholar] [CrossRef]
  6. Lecomte-Nana, G.; Bonnet, J.P.; Soro, N. Influence of iron onto the structural reorganization process during the sintering of kaolins. J. Eur. Ceram. Soc. 2013, 33, 661–668. [Google Scholar] [CrossRef]
  7. Mitra, G.B. Spiral Structure of 7 Å Halloysite: Mathematical Models. Clays Clay Miner. 2013, 61, 499–507. [Google Scholar] [CrossRef]
  8. Bailey, S.W. Halloysite—A critical assessment. In Volume II: Surface Chemistry. Structure and Mixed Layering of Clays, Proceedings of the 9th international Clay Conference, Strasbourg, France, 28 August–2 September 1989; Institut de Géologie—Université Louis-Pasteur: Strasbourg, France, 1990; pp. 89–98. [Google Scholar]
  9. Johnson, S.L. Thermal Stability of Halloysite byHigh-Pressure Differential Thermal Analysis. Clays Clay Miner. 1990, 38, 477–484. [Google Scholar] [CrossRef]
  10. Duran, C.; Kemal Tür, Y. Templated grain growth of textured mullite/zirconia composites. Mater. Lett. 2005, 59, 245–249. [Google Scholar] [CrossRef]
  11. Štubna, I.; Trník, A.; Vozár, L. Thermomechanical and thermodilatometric analysis of green alumina porcelain. Ceram. Int. 2009, 35, 1181–1185. [Google Scholar] [CrossRef]
  12. Boussois, K.; Deniel, S.; Tessier-Doyen, N.; Chateigner, D.; Dublanche-Tixier, C.; Blanchart, P. Characterization of textured ceramics containing mullite from phyllosilicates. Ceram. Int. 2013, 39, 5327–5333. [Google Scholar] [CrossRef]
  13. Deniel, S.; Tessier-Doyen, N.; Dublanche-Tixier, C.; Chateigner, D.; Blanchart, P. Processing and characterization of textured mullite ceramics from phyllosilicates. J. Eur. Ceram. Soc. 2010, 30, 2427–2434. [Google Scholar] [CrossRef]
  14. Lecomte-Nana, G.; Mokrani, A.; Tessier-Doyen, N.; Boussois, K.; Goure-Doubi, H. Texturation of model clay materials using tape casting and freezing. Ceram. Int. 2013, 39, 9047–9053. [Google Scholar] [CrossRef]
  15. Castelein, O.; Guinebretière, R.; Bonnet, J.P.; Blanchart, P. Shape, size and composition of mullite nanocrystals from a rapidly sintered kaolin. J. Eur. Ceram. Soc. 2001, 21, 2369–2376. [Google Scholar] [CrossRef]
  16. Maqueda, C.; Partal, P.; Villaverde, J.; Perez-Rodriguez, J.L. Characterization of sepiolite-gel-based formulations for controlled release of pesticides. Appl. Clay Sci. 2009, 46, 289–295. [Google Scholar] [CrossRef]
  17. Houta, N.; Lecomte-Nana, G.-L.; Tessier-Doyen, N.; Peyratout, C. Dispersion of phyllosilicates in aqueous suspensions: Role of the nature and amount of surfactant. J. Colloid Interface Sci. 2014, 425, 67–74. [Google Scholar] [CrossRef] [PubMed]
  18. Chartier, T.; Streicher, E.; Boch, P. Preparation and characterization of tape cast aluminum nitride substrates. J. Eur. Ceram. Soc. 1992, 9, 231–242. [Google Scholar] [CrossRef]
  19. Chartier, T.; Badev, A.; Abouliatim, Y.; Lebaudy, P.; Lecamp, L. Stereolithography process: Influence of the rheology of silica suspensions and of the medium on polymerization kinetics—Cured depth and width. J. Eur. Ceram. Soc. 2012, 32, 1625–1634. [Google Scholar] [CrossRef]
  20. Daou, I.; Lecomte-Nana, G.L.; Tessier-Doyen, N.; Peyratout, C.; Gonon, M.F.; Guinebretiere, R. Probing the dehydroxylation of kaolinite and halloysite by in situ high temperature X-ray diffraction. Minerals 2020, 10, 480. [Google Scholar] [CrossRef]
  21. Joussein, E.; Petit, S.; Decarreau, A. Une nouvelle méthode de dosage des minéraux argileux en mélange par spectroscopie IR. Comptes Rendus De L’académie Des Sci. Ser. IIA-Earth Planet. Sci. 2001, 332, 83–89. [Google Scholar] [CrossRef]
  22. Aparicio, P. Mineralogical Interference on Kaolinite Crystallinity Index Measurements. Clays Clay Miner. 1999, 47, 12–27. [Google Scholar] [CrossRef]
  23. Soro, N.S. Influence des Ions fer sur les Transformations Thermiques de la Kaolinite; Université de Limoges: Limoges, France, 2003. [Google Scholar]
  24. Desjardins, K.; Mocuta, C.; Dawiec, A.; Réguer, S.; Joly, P.; Dubuisson, J.-M.; Alves, F.; Noureddine, A.; Bompard, F.; Thiaudière, D. The CirPAD, a circular 1.4 M hybrid pixel detector dedicated to X-ray diffraction measurements at Synchrotron SOLEIL. J. Synchr. Rad. 2022, 29, 180–193. [Google Scholar] [CrossRef] [PubMed]
  25. Mocuta, C.; Richard, M.-I.; Fouet, J.; Stanescu, S.; Barbier, A.; Guichet, C.; Thomas, O.; Hustache, S.; Zozulya, A.V.; Thiaudière, D. Fast pole figure acquisition using area detectors at the DiffAbs beamline—Synchrotron SOLEIL. J. Appl. Crystallogr. 2013, 46, 1842–1853. [Google Scholar] [CrossRef]
  26. Brindley, G.W.; Nakahira, M. The Kaolinite-Mullite Reaction Series: II, Metakaolin. J. Am. Ceram. Soc. 1959, 42, 314–318. [Google Scholar] [CrossRef]
  27. Chen, Y.-F.; Wang, M.-C.; Hon, M.-H. Phase transformation and growth of mullite in kaolin ceramics. J. Eur. Ceram. Soc. 2004, 24, 2389–2397. [Google Scholar] [CrossRef]
  28. Ptácek, P.; Frajkorová, F.; Šoukal, F.; Opravil, T. Kinetics and mechanism of three stages of thermal transformation of kaolinite to metakaolinite. Powder Technol. 2014, 264, 439–445. [Google Scholar] [CrossRef]
  29. Joussein, E.; Petit, S.; Churchman, J.; Theng, B.; Righi, D.; Delvaux, B. Halloysite clay minerals—A review. Clay Miner. 2005, 40, 383–426. [Google Scholar] [CrossRef]
  30. Cheng, Y.; Xing, J.; Bu, C.; Zhang, J.; Piao, G.; Huang, Y.; Xie, H.; Wang, X. Dehydroxylation and Structural Distortion of Kaolinite as a High-Temperature Sorbent in the Furnace. Minerals 2019, 9, 587. [Google Scholar] [CrossRef]
  31. Pampuch, R. Le mécanisme de la déshydratation des hydroxydes et des silicates phylliteux. Bull. Groupe Fr. Argiles 1971, 23, 107–118. [Google Scholar] [CrossRef]
  32. Lecomte-Nana, G.-L. Transformations Thermiques, Organisation Structurale et Frittage des Composés Kaolinite-Muscovite; Université de Limoges: Limoges, France, 2004. [Google Scholar]
  33. Roy, R.; Roy, D.M.; Francis, E.E. New Data on Thermal Decomposition of Kaolinite and Halloysite. J. Am. Ceram. Soc. 2006, 38, 198–205. [Google Scholar] [CrossRef]
Figure 1. SEM images of surface and cross-sections of the kaolinite and halloysite-based samples.
Minerals 13 01418 g001
Figure 2. XRD patterns of the studied samples after shaping by tape casting and drying. The main reflections correspond to kaolinite (JCPDS 00-005-0143) and/or halloysite (JCPDS 29-1487); while Q and C are, respectively, for quartz (JCPDS 00-046-1045) and cristobalite ((JCPDS 04-008-7642)).
Minerals 13 01418 g002
Figure 3. Evolution of the diffracted intensity of the kaolinite (002) reflection with respect to the χ tilt angle and the temperature.
Minerals 13 01418 g003
Figure 4. Illustration of hydrogen bonding and localization of hydroxyl groups within the structure of kaolinite.
Minerals 13 01418 g004
Figure 5. Variation of the diffracted intensity regarding the temperature and the tilt angle χ for sample KRG100; (a) (002) and (b) (111) reflections.
Minerals 13 01418 g005
Figure 6. Evolution of in situ poles figures for the (002) reflection of kaolinite within sample KRG100 for different temperatures.
Minerals 13 01418 g006
Figure 7. Evolution of in situ poles figures for the (111) reflection of kaolinite within sample KRG100 for different temperatures.
Minerals 13 01418 g007
Figure 8. Variation of the diffracted intensity regarding the temperature and the tilt angle χ for sample KCS100; (a) (002) and (b) (111) reflections.
Minerals 13 01418 g008
Figure 9. Evolution of in situ poles figures for the (002) reflection of kaolinite within sample KCS100 for different temperatures.
Minerals 13 01418 g009
Figure 10. Evolution of in situ poles figures for the (111) reflection of kaolinite within sample KCS100 for different temperatures.
Minerals 13 01418 g010
Figure 11. Variation of the diffracted intensity regarding the temperature and the tilt angle χ for sample H100; (002) reflections.
Minerals 13 01418 g011
Figure 12. Evolution of in situ poles figures for the (002) reflection of halloysite within sample H100 for different temperatures.
Minerals 13 01418 g012
Figure 13. Variation of the diffracted intensity regarding the temperature and the tilt angle χ for: (a,b) (002) and (111) reflections of KRG50H50 sample; (c,d) (002) and (111) reflections of KCS50H50 samples.
Minerals 13 01418 g013
Figure 14. Results of in situ X-ray diffusion analyses for samples (a) KCS100, (b) H100 and (c) KRG100.
Minerals 13 01418 g014
Figure 15. Simplified illustration of the transformation sequence of kaolinite up to 1000 °C.
Minerals 13 01418 g015
Table 1. Chemical and physical characteristics of raw materials halloysite H, kaolins KCS and KRG (Tr.: <0.2 mass %) [20].
HKCSKRG
Oxides (mass %)Al2O337.1539.5439.98
SiO247.4744.0644.77
P2O50.150.050.03
SO30.040.110.06
Fe2O30.390.630.62
ZrO20.020.020.03
K2O 0.040.05
TiO2 0.580.41
Na2O 0.18
SiO2/Al2O3 (mass ratio)1.281.111.12
Loss on ignition at 1050 °C (mass %)14.7614.7814
Table 2. Density, particle size distribution and specific surface area of starting clay powders [20].
HKCSKRG
Density (g/cm3)2.542.612.59
Grain size (µm)D100.302.365.66
D502.004.738.57
D9012.548.0912.80
Type of distributiontrimodalbimodalmonomodal
Specific BET surface area (m2/g)26.289.296.61
Table 3. Crystallinity indexes HI, R2 (±0.1) and L of kaolins KCS and KRG compared to reference kaolins [20,21,22,23].
KGa-1b [21,22,23]KGa-2 [21,22,23]KCSKRG
HI1.030.371.281.22
R21.000.501.091.13
L127407073
Disclaimer/Publisher’s Note: The statements, opinions and data contained in all publications are solely those of the individual author(s) and contributor(s) and not of MDPI and/or the editor(s). MDPI and/or the editor(s) disclaim responsibility for any injury to people or property resulting from any ideas, methods, instructions or products referred to in the content.

