

New Approach for Direct Determination of Manganese Valence State in Ferromanganese Nodules by X-ray Fluorescence Spectrometry

Vinogradov Institute of Geochemistry, Siberian Branch of the Russian Academy of Sciences, Favorsky St. 1A, 664033 Irkutsk, Russia
Minerals 2023, 13(10), 1329; https://doi.org/10.3390/min13101329
Submission received: 8 September 2023
/
Revised: 5 October 2023
/
Accepted: 11 October 2023
/
Published: 14 October 2023
(This article belongs to the Special Issue Mineralogical and Geochemical Characteristics of Ferromanganese Nodules & Crusts: Implications for the Reconstruction of the Paleo-Ocean Environment)
Abstract
:A new X-ray fluorescence technique is proposed as an alternative to the labor-consuming volumetric method for the estimation of manganese valence state in ferromanganese nodules. The approach is based on the measurement of the relative intensities of some X-ray fluorescence spectrum characteristic spectral lines and satellites (MnKβ5 and MnKβ′) preconditioned by electron transfer from the valence shell. Calibration curves were created using manganese oxide samples (MnO, Mn2O3, MnO2) and 12 certified reference materials of ferromanganese nodules, cobalt-bearing ferromanganese crusts, and manganese ores with certified (or determined by approved methods) total and tetravalent manganese content. The presence of high iron content was taken into account. A set of oceanic ferromanganese nodules samples collected in the Magellan Seamounts (Pacific Ocean) were analyzed. Differences between the results of the X-ray fluorescence method and volumetric techniques for tetravalent manganese content were 4.9 rel.%, which is comparable with the accuracy of the volumetric technique (3.6 rel.%).
1. Introduction
In geological studies, the determination of the valence state of transition elements is the basis for assessing the redox conditions of rock formation [1] and, from a practical point of view, it is important for assessing the prospects for mining ores. Of all transition metals, there is only a routine method for determining the valence state of iron in geological objects. In mineral objects, iron has two main valence states, except metallic iron. Having information about at least one of them (divalent iron FeII or trivalent iron FeIII) and about total iron (Fetotal) content, it is possible to characterize iron valence state, for example as a ratio of ferrous (or ferric) and total iron. The determination of ferrous iron is widespread for the analysis of rocks using volumetric or spectrophotometric techniques [2,3,4,5].
In contrast to iron determination, the estimation of manganese valence state can be difficult. Manganese has three valence states in mineral objects (divalent manganese MnII, trivalent manganese MnIII, and tetravalent manganese MnIV), and for the full characterization of the valence state besides total manganese (Mntotal) content, data on two of them are required. Determination of Mntotal is a routine procedure. However, techniques for the diversification of manganese by valence states are rarely used [5,6,7,8]. These techniques are not as common as ones for ferrous iron and are used only in the analysis of manganese ores, since the rocks contain relatively low manganese. One of the types of specific manganese ores are ferromanganese nodules and crusts, which are a promising source of valuable metals (in addition to Mn and Fe, also Co, Ni, Cu, Zn, Pb, and rare earth and precious metals), despite the relatively difficult mining conditions [9,10]. When studying nodules and crusts, the valence state of ore elements is important for fundamental and application research and for assessing the ability of nodules to absorb valuable trace elements [11]. Despite the dominance of oxidized MnIV (as asbolane, vernadite, todorokite, birnessite, buserite) and Fe3+ (as oxides and hydroxides: goethite, limonite, ferroxigite, ferrihydrite, etc.), nodules can also contain other valence states of iron (FeII as ilmenite or impurities in amphibole or pyroxene) and manganese (MnII as impurities in todorokite and buserite and sometimes MnIII as impurities in birnessite) [12,13,14].
The X-ray fluorescence (XRF) method is widely used for the analysis of geological objects, including ferromanganese nodules and crusts [15,16,17]. Currently, the XRF method allows us not only to determine the total content of an element, but also to evaluate the forms of transition elements, including iron and manganese, based on the dependence of spectral lines intensities on the valence state of an element [18,19,20]. Parameters such as energy, intensity, and shape of lines preconditioned by the transitions of electrons from valence levels are the most affected by chemical bonding. There are Kβ5 line and the most intense satellite Kβ′ for iron and manganese [21,22,23,24,25,26,27,28,29,30,31,32].
Despite our rather successful experience in the development of methods for the XRF determination of FeII in different types of igneous rocks [32], this approach seems to be not applicable to ferromanganese nodules. There is no information on the content of ferrous iron (FeO) in certified reference materials (CRMs) of ferromanganese nodules. Besides, routine volumetric determination of ferrous iron in samples of ferromanganese nodules (as well as of ferromanganese ores) is impossible due to interference caused by high manganese content. Thus, the valence state of iron in ferromanganese nodules can only be assessed qualitatively as “close to FeIII” [31]. However, in the case of manganese, the XRF method looks more promising, despite the relatively small (compared to rocks) number of CRMs of ferromanganese nodules [33]. The content of MnO2 was certified (according to the certificate, by single visual titrimetry) in some CRMs of the SDO series [34]; moreover, the determination of MnO2 in ferromanganese nodules can easily be carried out by reverse titration. In this work, the possibility to use the relative intensities of the MnKβ5 line and MnKβ′ satellite of the XRF spectrum to determine manganese valence state in oceanic ferromanganese nodules is considered.
2. Materials and Methods
2.1. Equipment
The investigation was carried out using the equipment of the Center for Isotopic and Geochemical Research (Vinogradov Institute of Geochemistry, Siberian Branch of the Russian Academy of Sciences, Irkutsk, Russian Federation) [35]. XRF spectra were studied using a S4 Pioneer wavelength-dispersive spectrometer (Bruker AXS, Karlsruhe, Germany) equipped with a Soller optical system, scintillation counter, and an X-ray tube with an Rh anode. All measurements were performed in vacuum mode using a lithium fluoride (LiF (220), 2d = 2.848 Å) crystal combined with a 0.23° collimator. A voltage of 50 kV and an X-ray tube current of 40 mA ensured a sufficient intensity of radiation. For spectra measurements, the step size was 0.024°, and the measurement time for each point was 4 s.
2.2. Samples
To obtain the calibration, a set of CRMs was used. CRMs of ferromanganese nodules and cobalt-bearing ferromanganese crusts provided by the N. Fedorovsky All-Russian Scientific Research Institute of Mineral Raw Materials (CRM 408-10: GMK-1 and GMK-2, CRM 409-10: KMK-1 and KMK-2); the Research Institute of Applied Physics of Irkutsk State University together with the P.P. Shirshov Institute of Oceanology of the Russian Academy of Sciences OOPE601 (SDO-4), OOPE602 (SDO-5), OOPE603 (SDO-6) and OOPE604 (SDO-7) [34], sample certified during GeoPT proficiency testing program (FeMn-1 (GeoPT 23a)) [36]; and the Central Laboratory of Mongolia as a part of interlaboratory testing for certification (MnN) [37]; as well as three pure-grade manganese oxides (MnO, Mn2O3, MnO2). Despite the large number of certified elements, only certificates for four CRMs of the SDO series [34] as well as a certificate for CRM MnN contained semi-quantitative data on the mineral composition (Table 1). For CRM 408-10 (GMK-1 and GMK-2), vernadite, todorokite and birnessite were noted as the main Mn-containing minerals; aluminosilicates, plagioclase, and quartz were noted as the rock-forming minerals. For CRM 409-10 (KMK-1, and KMK-2), vernadite and apatite were noted as the main minerals; silicates, zeolite, quartz, and calcite were noted as the rock-forming minerals. For CRM FeMn-1, no data on mineral composition were found.
Certificates of only four of the listed ten CRMs contain data allowing us to estimate manganese valence state (MnO2 iscertified in CRMs of SDO series); therefore, the other 8 samples were analyzed by volumetry (the technique will be described below). The calibration set was expanded using CRMs of manganese ores 5404-90 and 5407-90 with certified content of MnO2 that contained predominantly MnII- and MnIV-containing minerals, including pyrolusite and psylomelane, as well as oxide and silicate manganese minerals (jacobsite, rhodonite, rhodochrosite, coronadite). CRMs of manganese ores were provided by Tsentrgeolanalit LLP (Karaganda, Kazakhstan). Other available CRMs of manganese ores contained a lot of MnIII as hausmanite, manganite, and braunite, and were not included in the calibration set.
For validation, a set of 15 samples of oceanic Co-bearing ferromanganese crusts collected on the Govorov and Kotzebue Guyots (Magellan Seamounts, Pacific Ocean) [38,39] were used.
Since the material of nodules and crusts is highly hygroscopic, all studied samples were dried at 120 °C for 48 h to constant weight to obtain air-dry samples. The content of hygroscopic moisture in the studied samples reached 15 wt.%. After drying, samples were pressed on a boric acid substrate and kept in a desiccator.
2.3. X-ray Fluorescence Kβ Spectra of Manganese
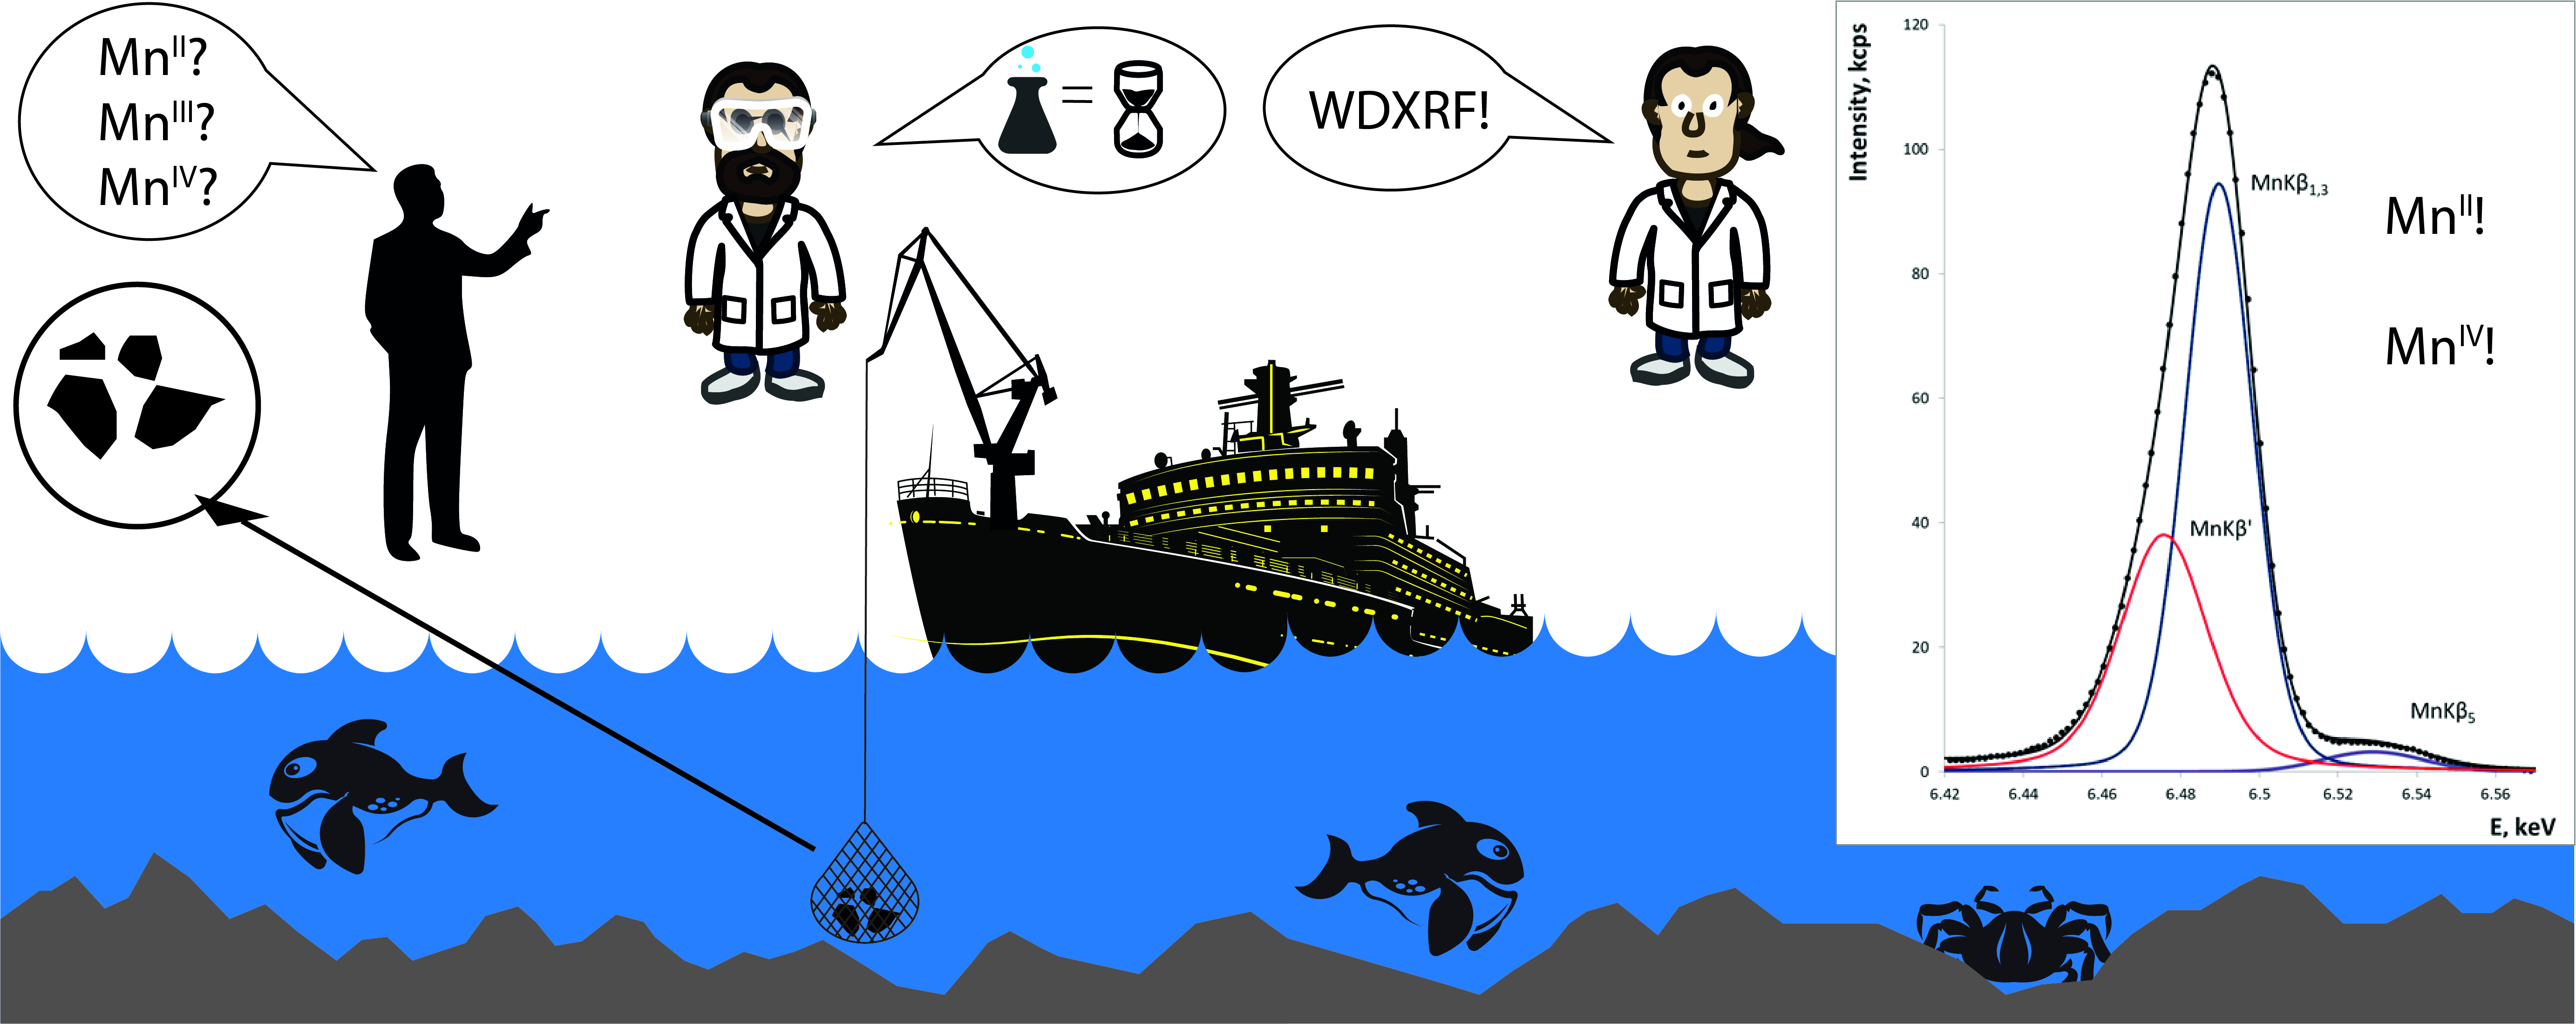
According to its mineral composition, tetravalent manganese MnIV, as a compound of asbolane, vernadite, and todorokite, is the main compound of ferromanganese nodules. Figure 1 shows an XRF spectrum of a MnIV oxide (MnO2) sample in the energy range 6.42–6.57 keV. The most intense peak corresponds to the doublet MnKβ1,3 line (theoretical energy is 6490 eV here and below, according to the NIST database [40]) preconditioned by transitions K-M2,3. This line has visual asymmetry in a low energy area that is related to the presence of relatively intense MnKβ′ satellite interpreted as transitions K-M2,3 (main MnKβ1,3 line) with a simultaneous ejection of an electron from level M4,5. The relatively intense peak in the energy range 6.52–6.54 keV is the MnKβ5 line (theoretical value is 6535 eV) preconditioned by transitions K-M4,5. According to [21], there are some satellites near the MnKβ5 line: MnKβ″ (~6520 eV) and MnKβ‴ (~6550 eV). Therefore, in fact, the peak in 6.52–6.54 keV energy range is a superposition of several lines. However, some of these lines do not appear for some compounds, and the resolution of the spectrometer is insufficient to split these peaks visually. Hence, for further study, the peak in the energy range 6.52–6.54 keV was considered as the MnKβ5 line. To find a position for intensity measurement, a decomposition procedure was performed for the MnO2 sample using the pseudo-Voigt function as a fitting function [41]:
where G(E) = exp(−((E − Ep)/σg)2) is Gaussian; L(E) = 1/(1 + (((E − Ep)/σL)2)) is Lorentzian; A is the amplitude of the distribution centered at energy Ep; σg and σL are parameters defining the widths of the Gaussian and Lorentzian functions; Cg determines the portion of Gaussian and Lorentzian and varies in the interval (0-1).
According to decomposition, energy positions for analytical lines measurement were found as 6529 eV (MnKβ5) and 6469 eV (MnKβ′). Because the intensity of any line of the manganese XRF spectrum depends on the gross manganese content, the ratios of selected lines to the intensity of line MnKβ1,3 were used as analytical parameters. To provide count rate statistic error at a level less than 1 rel.%, the exposition of measurement was defined as 10 s for the MnKβ1,3 line, 50 s for the MnKβ′ line, and 100 s for the MnKβ5 line. Background intensity was measured in the 6590 eV energy position, where intense analytical lines of elements contained in ferromanganese nodules and crusts are absent.
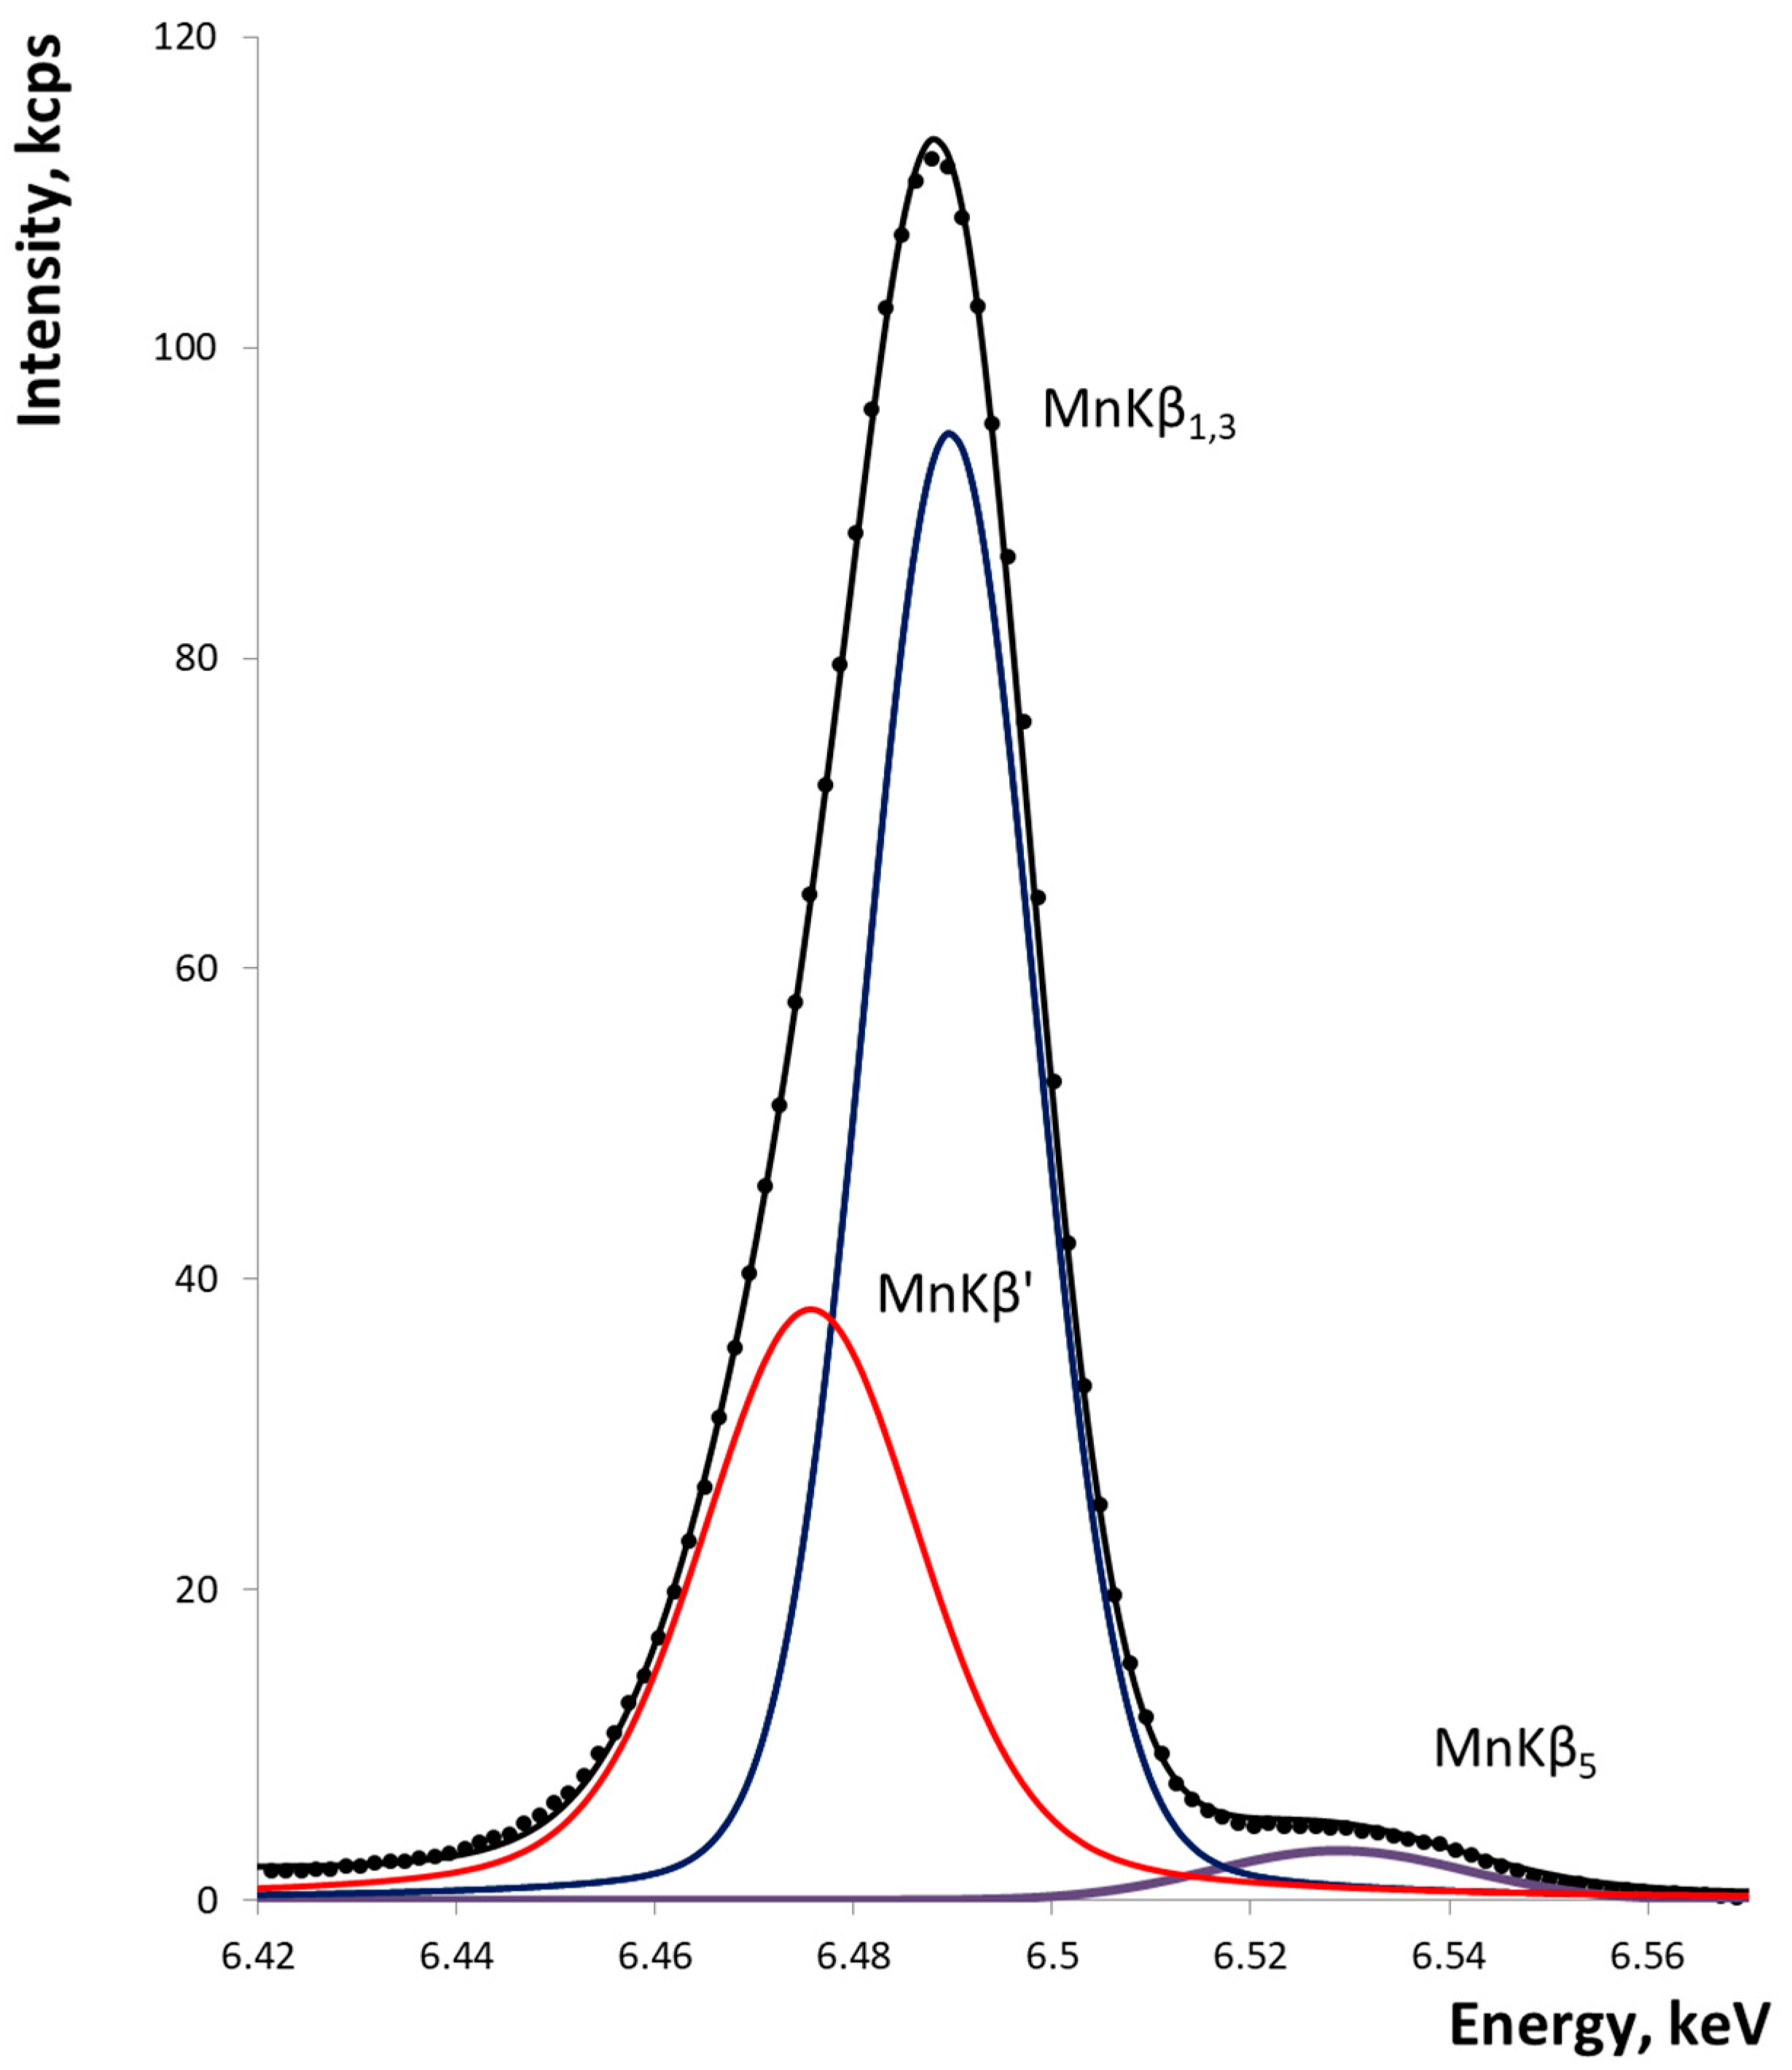
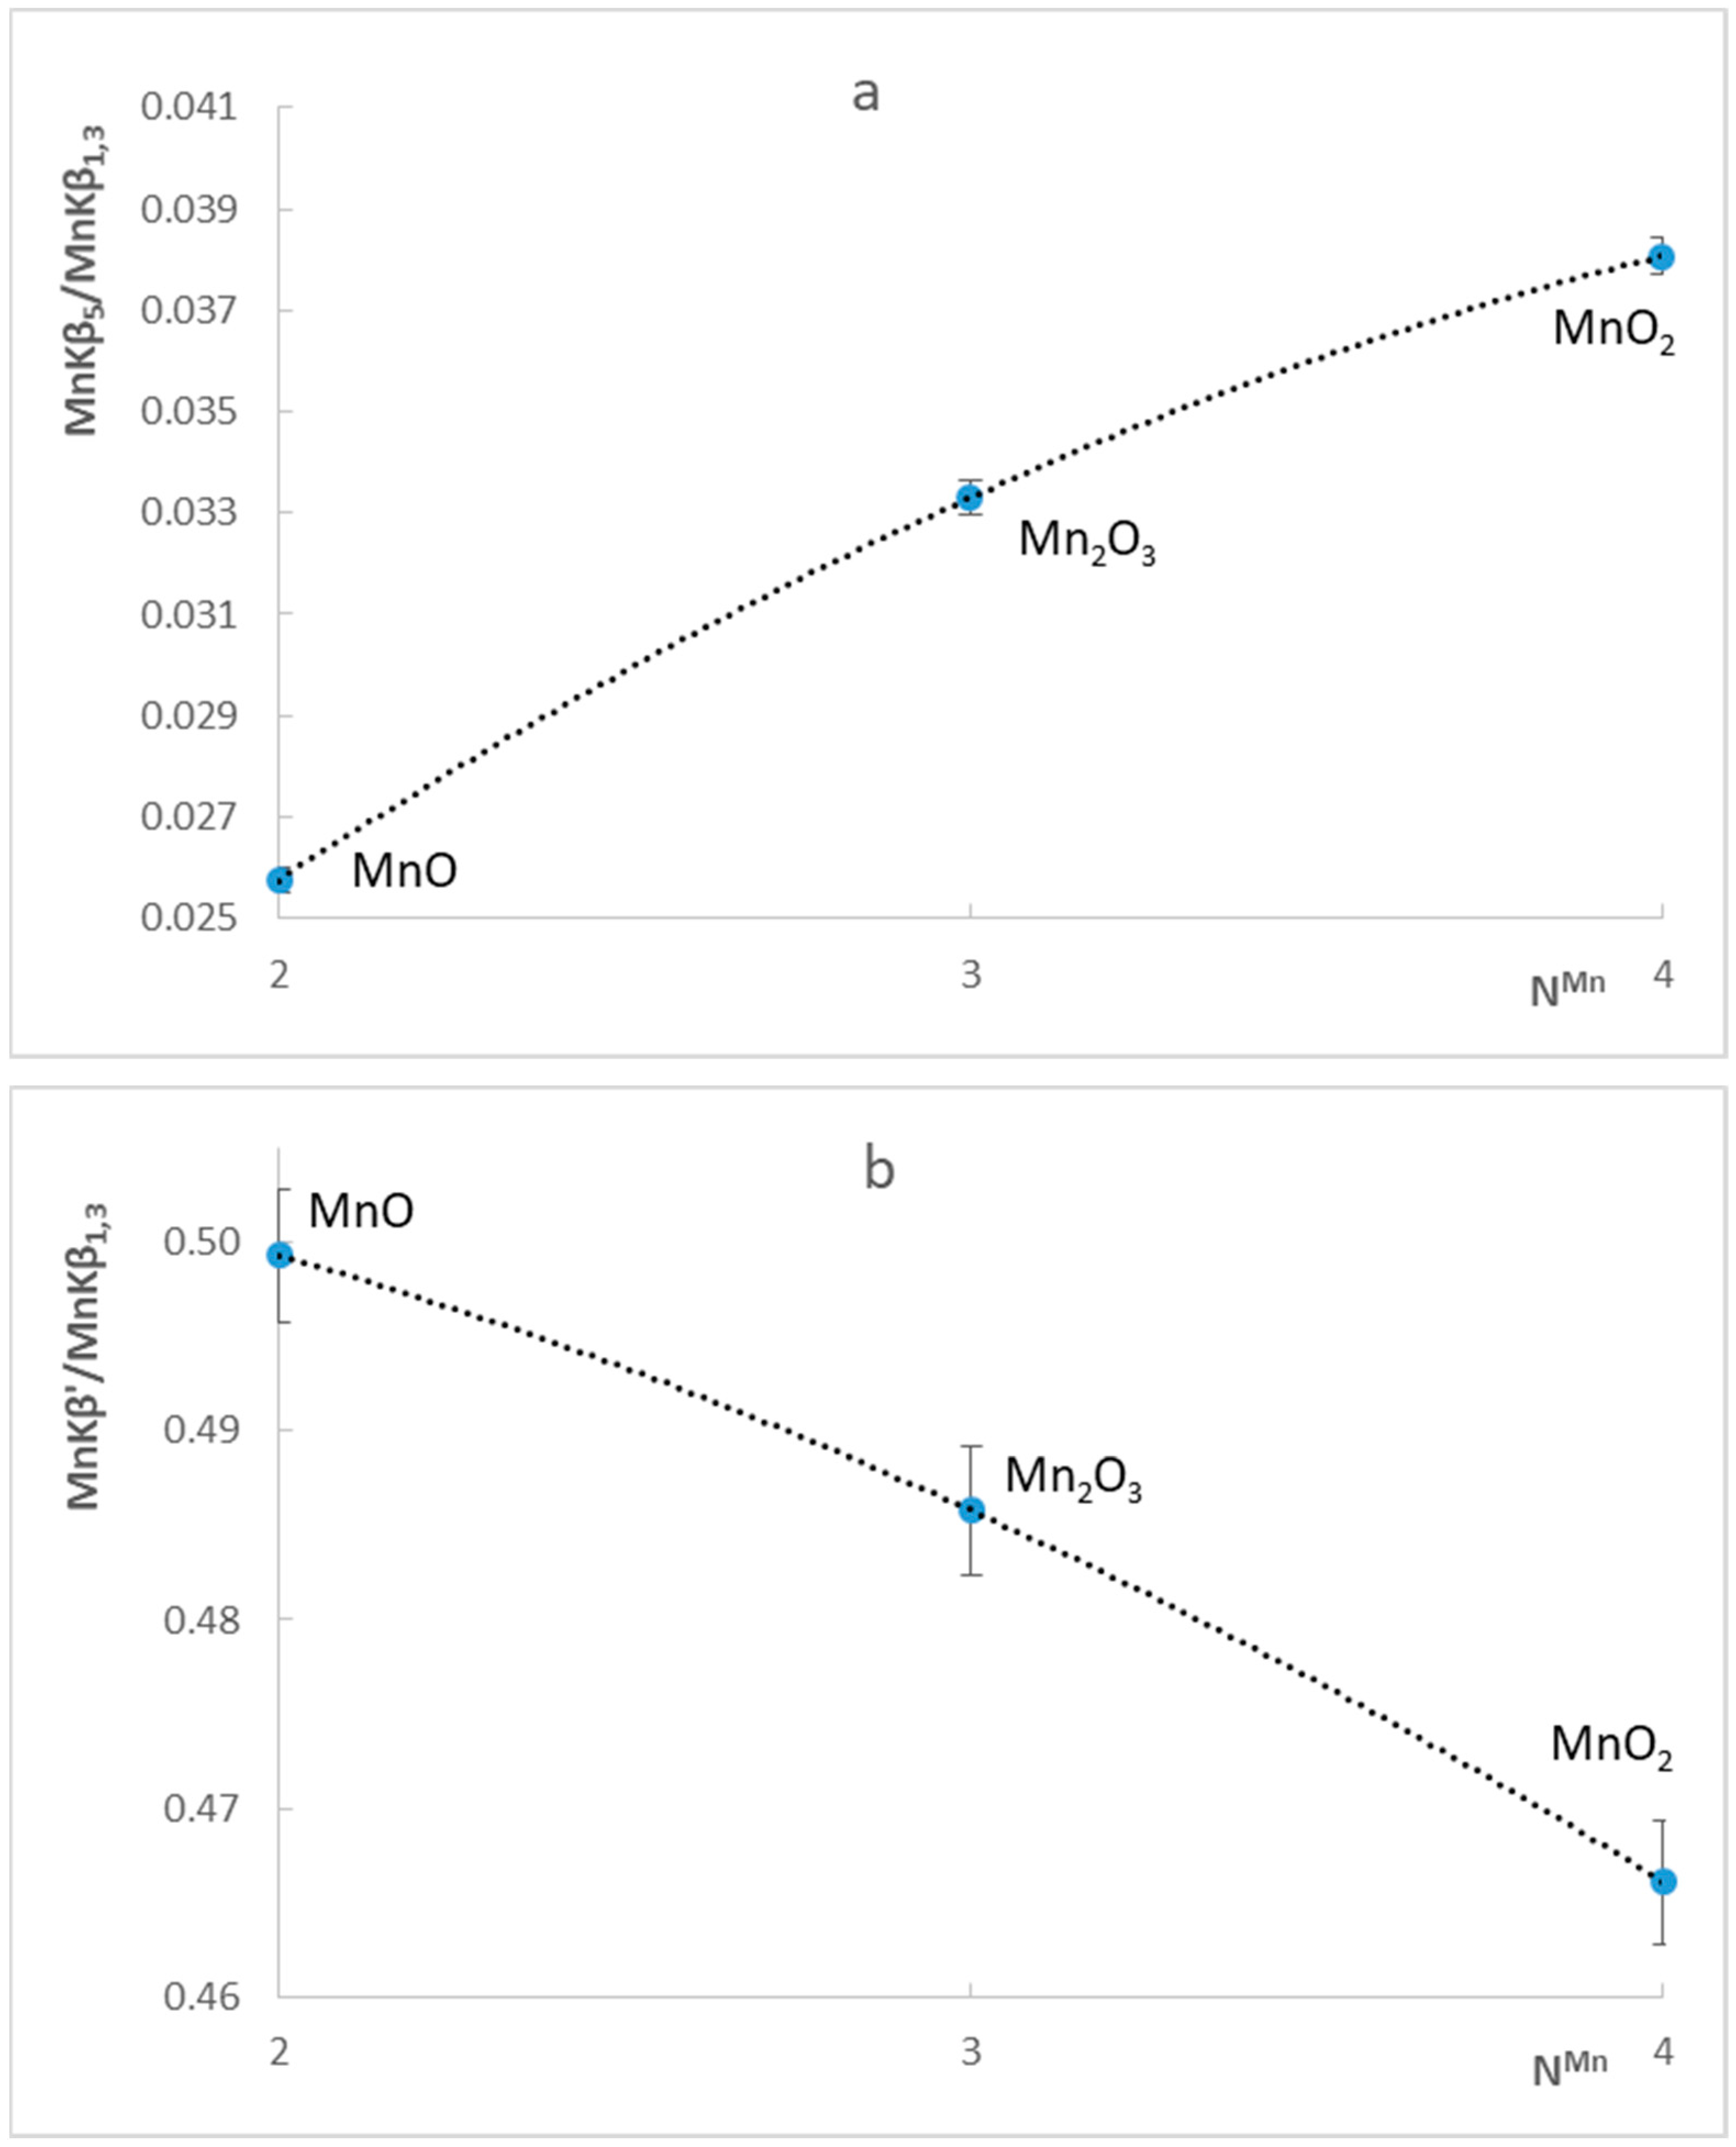
Figure 2 shows the dependence and good convergence of the ratios of the MnKβ5/MnKβ1,3 and MnKβ′/MnKβ1,3 line intensities on the manganese valence state (NMn) for manganese oxides. A polynomial equation was used for approximation.
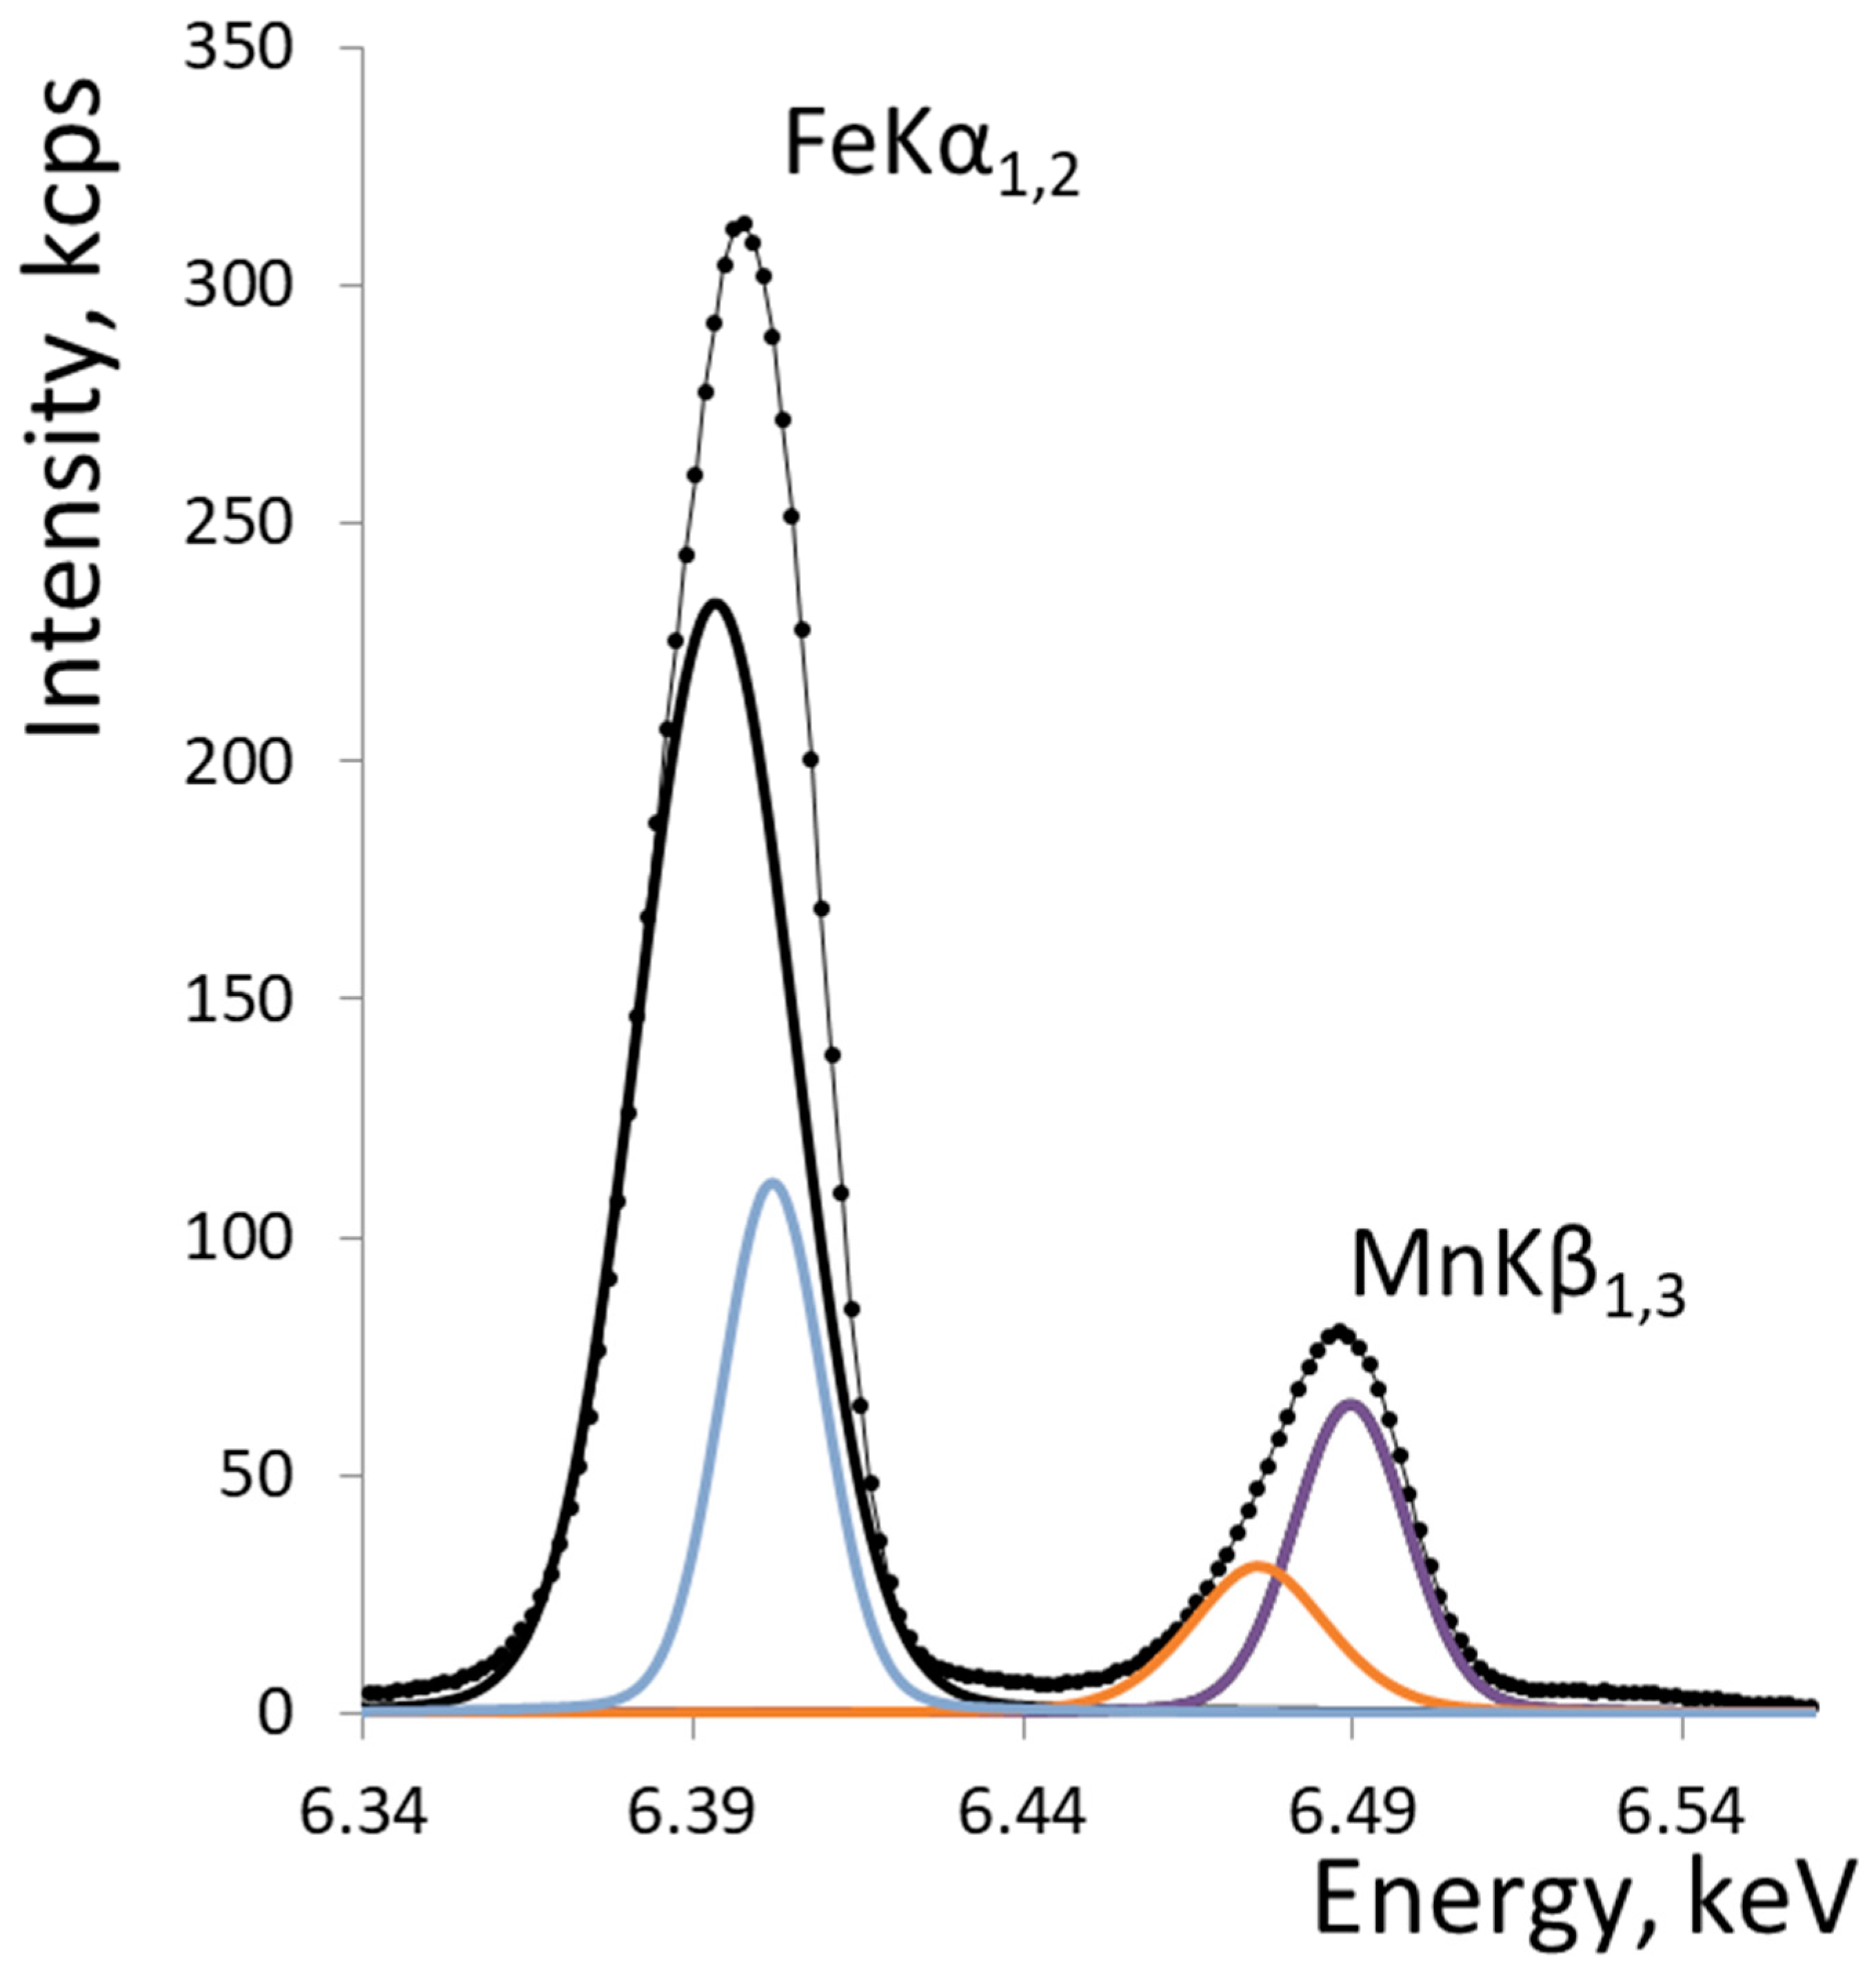
Unlike oxide, silicate, and carbonate ores, ferromanganese nodules have a specific phase and elemental composition; in particular, they contain high amounts of iron (in some cases exceeding the manganese content), which can significantly affect manganese line intensity due to possible spectral overlap with FeKα1,2 line. Figure 3 shows the XRF spectrum of the CRM of ferromanganese nodule SDO-4 with a total iron content of 12.05 wt.% and a total manganese content of 23.17 wt.%.
The spectral overlap between the FeKα1,2 line (theoretical energies are 6.391 keV and 6.404 keV) and manganese spectrum lines under consideration seems insignificant. But in cases where iron content is comparable to or exceeding manganese content (for example, in the CRM of ferromanganese nodule SDO-7, total iron and total manganese content is quite the same: 15.49 wt.% and 15.38 wt.%, respectively), the high intensity of FeKα1,2 lines can distort the measured intensities of selected manganese spectrum analytical lines. Moreover, the FeKβ line (7058 eV) excites the secondary fluorescence of manganese (energy of manganese K edge is 6538 eV). There is a reason why, unlike silicate and carbonate manganese ores [30], the investigation of manganese valence state in ferromanganese nodules requires taking into account iron presence. The exposition of measurement of FeKα1,2 line was 10 s.
2.4. Manganese Valence State
Because quantitative data on different valence state of manganese content in nodules are difficult to obtain, the only source for manganese valence state estimation is mineral composition, usually obtained by X-ray powder diffractometry. However, it is hard to find quantitative data on the mineral composition of nodules: the results of X-ray powder diffractometry analysis are often only qualitative, in particular due to the impossibility to identify amorphous iron and manganese minerals. Even CRMs often contain only semi-quantitative data (Table 1).
Taking into account the simultaneous presence of three main manganese valence states (MnII, MnIII, and MnIV), the average manganese valence state of manganese can be calculated as:
where C(MnII), C(MnIII), and C(MnIV)—content of divalent, trivalent, and tetravalent manganese, accordingly; 2, 3, and 4—manganese valence states.
According to data in the literature, nodules contain mainly MnIV-containing minerals with low quantities of MnII-containing minerals, usually in a mixture with MnIV [12,13,14]; therefore, NMn can be calculated only from the content of MnIV and MnII (as the difference between the content of Mntotal and MnIV), accepting that content of MnIII is negligible.
Nonetheless, some minerals contain MnIII combined with MnII and MnIV. For example, CRMs SDO-5 and SDO-6 contained up to 8% of buserite and up to 5% of birnessite (which together can contain up to 12% of MnIII). This fact may have affected the accuracy of NMn value calculation in Equation (2) if only MnII and MnIV content were used. For these two CRMs, NMn values were calculated using Equation (2), assuming that both CRMs samples contained the maximal possible (taking into account phase composition, Mntotal, and MnIV content) or no content of MnIII. Due to the fact that the CRM SDO-5 has certified MnO2 (31.01 ± 0.4 wt.%) and MnOtotal (25.16 ± 0.28 wt.%) content, recalculating to Mntotal and MnIV (due to the relatively wide confidence interval for MnO2) leads to the conclusion that its content of MnIV exceeds its content of Mntotal (which is obviously impossible). Therefore, for the calculation, the highest and the lowest values in the confidence interval for Mntotal and MnIV content, respectively, were used. The calculated NMn values were 3.95 and 3.90 (relative deviation is 1.3%) for CRM SDO-5 and 3.98 and 3.97 (relative deviation is 0.4%) for CRM SDO-6. These discrepancies will be discussed further.
To use all listed CRMs of ferromanganese nodules and crusts as a calibration set (and to analyze real samples of Co-bearing ferromanganese crusts), a certified volumetric technique was applied for the determination of MnO2 content. The technique used is based on the reduction of MnO2 by ammonium iron (II) sulfate Fe(NH4)2(SO4)2 and further titrating by potassium dichromate K2Cr2O7 with sodium diphenylamine-4-sulfonate as the redox indicator.
To validate the volumetric technique, four CRMs of the SDO series (SDO-4, SDO-5, SDO-6, and SDO-7) with certified MnO2 content were analyzed (Table 2). Repeatability was estimated by two independent measurements of CRMs SDO-4 and SDO-5; the deviations between results were 0.06 and 0.13 wt.%, respectively (less than 0.5 rel.%).
A systematical underestimation from −0.7 to −1.6 wt.% (from 2.5 to 4.8 rel.%) of MnO2 results obtained by the volumetric technique is observed; the standard deviation value for analyzed CRMs is 1.2 wt.% (3.6 rel.%), whereas the confidence interval of certified values is 0.4–0.5 wt.% (1.1–1.7 rel.%). Table 2 also contains the NMn value calculated using Equation (2) from MnO2 content obtained by volumetry or certified MnO2 content, assuming that the content of trivalent manganese C(MnIII) is insignificant. The relative standard deviation (RSD) for NMn determination is 1.7%. In comparison with the case where NMn values were calculated for CRMs SDO-5 and SDO-6, taking into account the possible presence of trivalent manganese MnIII (1.3 and 0.4 rel.%), errors in volumetric analysis were significantly higher (1.9 and 2.0 rel.%). Therefore, for further studies, it was accepted that ferromanganese nodules contain only divalent and tetravalent manganese (MnII and MnIV), which corresponds to previous studies [12,13,14]. Table 3 shows the results of MnO2 determination in 6 CRMs of ferromanganese nodules and Co-bearing ferromanganese crusts.
3. Results and Discussion
3.1. Calibration
To build calibration curves, 12 CRMs of ferromanganese nodules, Co-bearing ferromanganese crusts, and ores as well as three samples of manganese oxides were used. Ratios of MnKβ5/MnKβ1,3 and MnKβ′/MnKβ1,3 line intensities were used as analytical parameters. The dependence of manganese valence state NMn on analytical parameter RI was approximated by different variants of the equation:
where NMn—average manganese valence state, RI—analytical parameter (ratio of analytical lines intensities), I(FeKα1,2)—the intensity of the FeKα1,2 line included to take into account the presence of high iron content, a0, a1, a2—coefficients of regression.
To discover the necessity of taking into account the presence of high iron content (as a possible spectral overlap of the FeKα1,2 line and the exciting of secondary fluorescence of manganese by the FeKβ line), Equation (3) with and without including the intensity of the FeKα1,2 line was also considered. The parameters of calibration curves (standard deviation (SD) and correlation coefficient (rxy)) are shown in Table 4. Despite the fact that dependencies for three manganese oxides were approximated by a polynomial equation (Figure 2) for both the MnKβ5/Mnβ1,3 and MnKβ′/Mnβ1,3 analytical parameters, for CRMs, polynomial equations did not lead to a significant decrease in SD value or significant increase in rxy value.
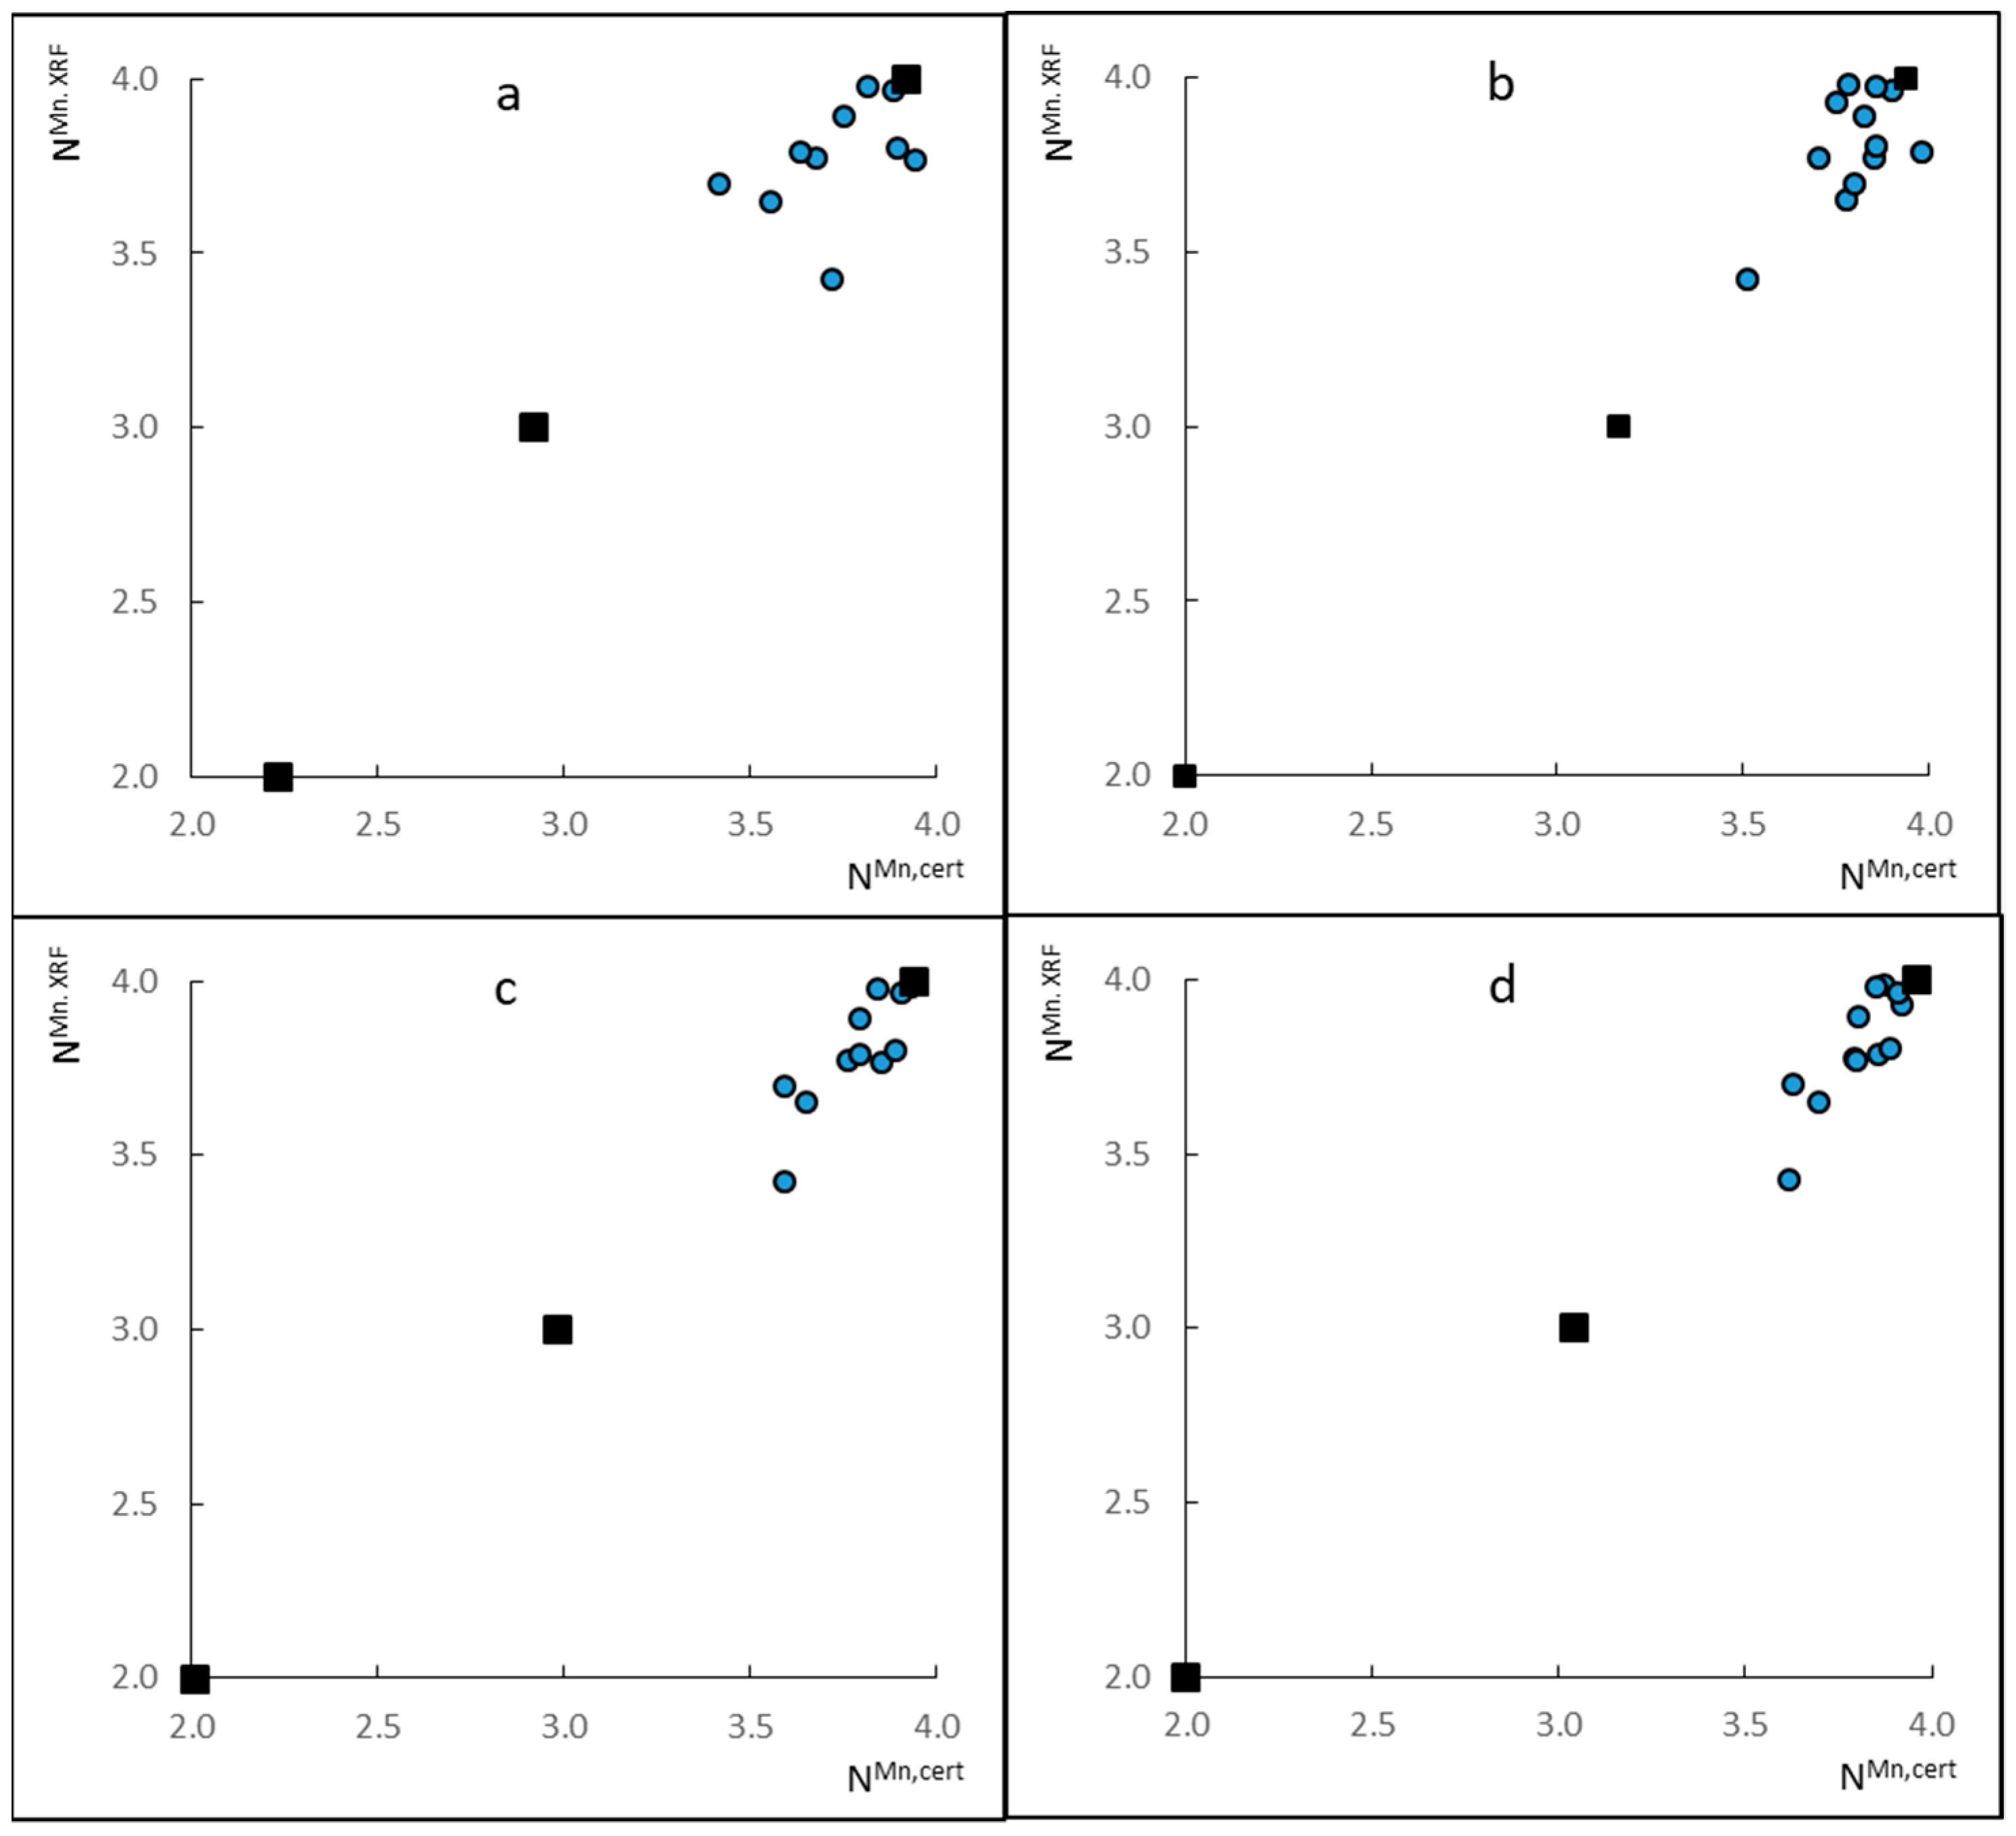
As can be seen in Table 4, without taking into account the influence of iron presence, both MnKβ5/Mnβ1,3 and MnKβ′/Mnβ1,3 provide the same poor accuracy (SD > 0.3, rxy < 0.70), whereas taking into account iron presence allows us to reduce SD value up to 2.5 times (Equations (3.2) and (3.4)). The minimal SD value (and sufficient rxy value more than 0.96) is observed when both analytical parameters are used (Equations (3.5) and (3.6)). However, in this case, the added intensity of the FeKα1,2 line as an additional member to Equation (3) does not allow us to significantly reduce SD value (Equation (3.6)). Probably, it is the close influence of iron presence for both the MnKβ5 and MnKβ′ lines that compensates for this influence. Thus, four analytical parameters providing minimal SD values were used for further validation: ratios of MnKβ5/Mnβ1,3 and MnKβ′/Mnβ1,3 line intensities with the intensity of the FeKα1,2 line as additional member (Equations (3.2) and (3.4), respectively), and the combination of these ratios (Equations (3.5) and (3.6)). Coefficients of these four equations are shown in Supplementary Table S1. All selected equations have the same degrees of freedom (12). Figure 4 shows the correlations between NMn values obtained from XRF analysis using different analytical parameters and ones calculated using Equation (2) for the calibration set.
3.2. Validation
For the validation of the proposed XRF technique, 15 samples of oceanic Co-bearing ferromanganese crusts collected on the Govorov and Kotzebue Guyots (Magellan Seamounts, Pacific Ocean) were studied. The content of Mntotal was determined by the XRF method [17] and varied from 16.5 to 26.0 wt.%. Average manganese valence state was calculated from the volumetric results of MnO2 determination and XRF results of Mntotal determination using Equation (2), as well as directly determined by the proposed XRF technique using selected analytical parameters. Results are shown in Supplementary Table S2. rxy values between the obtained NMn values were not more than 0.47, but this result is not informative for such a thin range of values (3.61–4.00). It can be concluded that most samples contained predominantly MnIV; however, in sample 3, NMn was minimal in both XRF (3.61 using MnKβ5/Mnβ1,3 as an analytical parameter) and volumetric (3.59) results.
Table 5 shows a comparison of average valence state (NMn) values and recalculated MnO2 content obtained by volumetric and proposed XRF techniques.
As was concluded for manganese ores [41], the ratio of MnKβ′/Mnβ1,3 line intensities is influenced by manganese speciation, but for samples with relatively close mineral composition, this parameter is optimal. The RSD value between NMn results was 2.3%, which is comparable with the volumetry error (1.7 rel.%). When recalculating to MnO2 content, SD was 0.8 wt.% (4.9 rel.%), which is comparable with a confidential interval of certified values (0.4–0.5 wt.%, or 1.3 rel.%).
4. Conclusions
The XRF method has been presented as a fast and cost-efficient method for estimating the valence state of manganese in ferromanganese nodules, where manganese occurs mainly as MnII and MnIV. The accuracy of the proposed method was 4.9 rel.%, which is comparable with the accuracy of volumetric analysis (3.6 rel.%). The XRF method can be used to determine the valence state of manganese (simultaneously with the elemental XRF analysis of nodules) as an alternative to the labor- and time-consuming volumetric method.
Supplementary Materials
The following supporting information can be downloaded at: https://www.mdpi.com/article/10.3390/min13101329/s1, Table S1: Calibration curves; Table S2: Results of volumetric (vt) and XRF determination of average manganese valence state (NMn) and recalculation to MnO2 content.
Funding
This research was funded by a grant from the Russian Science Foundation, grant number 23-23-00449, https://rscf.ru/project/23-23-00449/.
Data Availability Statement
Data are contained within the article or supplementary material.
Acknowledgments
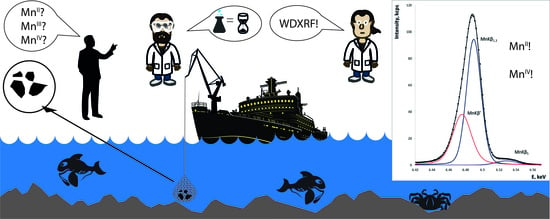
This research was performed using the equipment of the Center for Isotopic and Geochemical Research (Vinogradov Institute of Geochemistry, Siberian Branch of the Russian Academy of Sciences, Irkutsk, Russian Federation). The author thanks Tatyana Ozhogina for the volumetric analysis, Roman Smely for the X-ray powder diffraction investigations, and Igor Peretjazhko for providing ferromanganese crust samples. Images for graphical abstract were taken from https://publicdomainvectors.org/, accessed on 1 July 2023.
Conflicts of Interest
The author declares no conflict of interest. The funders had no role in the design of the study; in the collection, analyses, or interpretation of data; in the writing of the manuscript; or in the decision to publish the results.
References
- Gaillard, F.; Pichavant, M.; Scaillet, B. Experimental determination of activities of FeO and Fe2O3 components in hydrous silicic melts under oxidizing conditions. Geochim. Cosmochim. Acta 2003, 67, 4389–4409. [Google Scholar] [CrossRef]
- Andrade, S.; Hypolito, R.; Ulbrich, H.H.G.J.; Silva, M.L. Iron(II) oxide determination in rocks and minerals. Chem. Geol. 2002, 182, 85–89. [Google Scholar] [CrossRef]
- Goldich, S.S. Determination of ferrous iron in silicate rocks. Chem. Geol. 1984, 42, 343–347. [Google Scholar] [CrossRef]
- Whipple, E.R. A study of Wilson’s determination of ferrous iron in silicates. Chem. Geol. 1974, 14, 223–238. [Google Scholar] [CrossRef]
- Yokoyama, T.; Nakamura, E. Precise determination of ferrous iron in silicate rocks. Geochim. Cosmochim. Acta 2002, 66, 1085–1093. [Google Scholar] [CrossRef]
- Zhou, H.; Mitamura, S. The Spectrophotometry Determination of Mn(III) in the Presence of Mn(IV). Anal. Lett. 1992, 25, 911–918. [Google Scholar] [CrossRef]
- Zhu, Y.; Liang, X.; Zhao, H.; Yin, H.; Liu, M.; Liu, F.; Feng, X. Rapid determination of the Mn average oxidation state of Mn oxides with a novel two-step colorimetric method. Anal. Methods 2017, 9, 103–109. [Google Scholar] [CrossRef]
- Song, Y.; Jiang, J.; Qin, W.; Zhu, J.; Gu, J.; Ma, J. Simultaneous photometric determination of oxidation kinetics and average manganese valence in manganese products in situ formed in the reactions of aqueous permanganate with model organic compounds and natural organic matters. Sep. Purif. Technol. 2021, 256, 117774. [Google Scholar] [CrossRef]
- Halbach, P.E.; Jahn, A.; Cherkashov, G. Marine Co-Rich Ferromanganese Crust Deposits: Description and Formation, Occurrences and Distribution, Estimated World-wide Resources. In Deep-Sea Mining: Resource Potential, Technical and Environmental Considerations; Sharma, R., Ed.; Springer: Cham, Switzerland, 2017; pp. 65–141. [Google Scholar] [CrossRef]
- Hein, J.R.; Koschinsky, A.; Kuhn, T. Deep-ocean polymetallic nodules as a resource for critical materials. Nat. Rev. Earth Environ. 2020, 1, 158–169. [Google Scholar] [CrossRef]
- Brusnitsyn, A.I. Associations of Mn-bearing minerals as indicators of oxygen fugacity during the metamorphism of metalliferous deposits. Geochem. Int. 2007, 45, 345–363. [Google Scholar] [CrossRef]
- Murray, J.W.; Balistrieri, L.S.; Paul, B. The oxidation state of manganese in marine sediments and ferromanganese nodules. Geochim. Cosmochim. Acta 1984, 48, 1237–1247. [Google Scholar] [CrossRef]
- Pattan, J.N.; Mudholkar, A.V. The oxidation state of manganese in ferromanganese nodules and deep-sea sediments from the Central Indian Ocean. Chem. Geol. 1990, 85, 171–181. [Google Scholar] [CrossRef]
- Kalhorn, S.; Emerson, S. The oxidation state of manganese in surface sediments of the deep sea. Geochim. Cosmochim. Acta 1984, 48, 897–902. [Google Scholar] [CrossRef]
- Calvert, S.E.; Cousens, B.L.; Soon, M.Y.S. An X-ray fluorescence spectrometric method for the determination of major and minor elements in ferromanganese nodules. Chem. Geol. 1985, 51, 9–18. [Google Scholar] [CrossRef]
- Cai, S.; Guo, Y.; Li, J. Comprehensive major, minor and trace element analysis of a submarine polymetallic nodule by wavelength-dispersive X-ray fluorescence spectrometry. X-ray Spectrom. 1992, 21, 17–20. [Google Scholar] [CrossRef]
- Chubarov, V.; Amosova, A.; Finkelshtein, A. X-ray fluorescence determination of major elements in ferromanganese nodules. X-ray Spectrom. 2020, 49, 615–621. [Google Scholar] [CrossRef]
- Kawai, J. X-ray Spectroscopy for Chemical State Analysis; Springer: Singapore, 2023. [Google Scholar] [CrossRef]
- Mazalov, L.N.; Treiger, B.A. Chemical bonding effects in X-ray spectral analysis. J. Struct. Chem. 1983, 24, 276–305. [Google Scholar] [CrossRef]
- Urch, D.S. Chemical Bonding Effects in X-ray Emission Spectra–A Molecular Orbital Model. Adv. X-ray Anal. 1970, 14, 250–267. [Google Scholar] [CrossRef]
- Sakurai, K.; Eba, H. Chemical characterization using relative intensity of manganese Kβ′ and Kβ5 X-ray fluorescence. Nucl. Instrum. Methods B 2003, 199, 391–395. [Google Scholar] [CrossRef]
- Eba, H.; Sakurai, K. Site occupancy determination for manganese in some spinel-type oxides by Kβ X-ray fluorescence spectra. J. Solid State Chem. 2005, 178, 370–375. [Google Scholar] [CrossRef]
- Tsutsumi, K.; Nakamori, H.; Ichikawa, K. X-ray Mn Kβ emission spectra of manganese oxides and manganates. Phys. Rev. B 1976, 13, 929. [Google Scholar] [CrossRef]
- Tsutsumi, K. The X-ray Non-diagram Lines Kβ’ of Some Compounds of the Iron Group. J. Phys. Soc. Jpn. 1959, 14, 1696–1706. [Google Scholar] [CrossRef]
- Asada, E.; Takiguchi, T.; Suzuki, Y. The effect of oxidation state on the intensities of Kβ5 and Kβ″ of 3d-transition elements. X-ray Spectrom. 1975, 4, 186–189. [Google Scholar] [CrossRef]
- Tamaki, Y. Chemical effect on intensity ratios of K-series X-rays in vanadium, chromium and manganese compounds. X-ray Spectrom. 1995, 24, 235–240. [Google Scholar] [CrossRef]
- Fazinić, S.; Mandić, L.; Kavčič, M.; Božičevića, I. Parametrization of Kβ′′ and Kβ2,5 X-ray contributions in Kβ spectra of 3d transition metal compounds. J. Anal. At. Spectrom. 2011, 26, 2467–2476. [Google Scholar] [CrossRef]
- Limandri, S.; Ceppi, S.; Tirao, G.; Stutz, G.; Sánchez, C.G.; Riveros, J.A. High resolution study of Kβ′ and Kβ1,3 X-ray emission lines from Mn-compounds. Chem. Phys. 2010, 367, 93–98. [Google Scholar] [CrossRef]
- Volkov, A.I.; Ossipov, K.B.; Seregin, A.N.; Zhdanov, P.A.; Seregina, I.F.; Bolshov, M.A. Determination of degree of oxidation and forms of manganese compounds in the Ulu-Telyak oxidized ore. Inorg. Mater. 2015, 51, 1394–1403. [Google Scholar] [CrossRef]
- Chubarov, V.; Suvorova, D.; Mukhetdinova, A.; Finkelshtein, A. X-ray fluorescence determination of the manganese valence state and speciation in manganese ores. X-ray Spectrom. 2015, 44, 436–441. [Google Scholar] [CrossRef]
- Chubarov, V.M.; Finkelshtein, A.L.; Granina, L.Z. Determination of content and valence state of iron and Manganese in nodules using K-series emission lines of X-ray fluorescence spectrum. Anal. Control 2010, 14, 65–72. (In Russian) [Google Scholar]
- Chubarov, V.M.; Finkelshtein, A.L. Determination of divalent iron content in igneous rocks of ultrabasic, basic and intermediate compositions by a wavelength-dispersive X-ray fluorescence spectrometric method. Spectrochim. Acta B 2015, 107, 110–114. [Google Scholar] [CrossRef]
- Wang, Y.; Song, H.; Wang, X. Ocean manganese nodule and sediment reference materials. Mar. Georesour. Geotechnol. 2008, 16, 321–334. [Google Scholar] [CrossRef]
- Berkovits, L.A.; Obolyaninova, V.G.; Parshin, A.P.; Romanovskaya, A.R. A system of sediment reference samples: OO. Geostand. Newsl. 1991, 15, 85–109. [Google Scholar] [CrossRef]
- Skuzovatov, S.Y.; Belozerova, O.Y.; Vasil’eva, I.E.; Zarubina, O.V.; Kaneva, E.V.; Sokolnikova, Y.V.; Chubarov, V.M.; Shabanova, E.V. Centre of Isotopic and Geochemical Research (IGC SB RAS): Current State of Micro- and Macroanalysis. Geodyn. Tectonophys. 2022, 13, 0585. [Google Scholar] [CrossRef]
- Kriete, C. An Evaluation of the Inter-Method Discrepancies in Ferromanganese Nodule Proficiency Test GeoPT 23A. Geostand. Geoanal. Res. 2011, 35, 319–340. [Google Scholar] [CrossRef]
- Batjargal, B.; Davaasuren, B.; Erdenetsetseg, D. Producing Certified Reference Materials at the Central Geological Laboratory of Mongolia. Geostand. Geoanal. Res. 2010, 34, 231–236. [Google Scholar] [CrossRef]
- Novikov, G.V.; Sedysheva, T.E.; Lobkovsky, L.I.; Lobus, N.V.; Bogdanova, O.Y. Ore Content of Cobalt-Rich Ferromanganese Crusts of the Govorov Guyot of the Magellanic Mountains of the Pacific Ocean. Dokl. Earth Sci. 2021, 499, 675–682. [Google Scholar] [CrossRef]
- Novikov, G.V.; Sedysheva, T.E.; Bogdanova, O.Y.; Lobus, N.V. Cobalt-rich ferromanganese crusts of the Kotzebue Guyot of the Magellan Seamounts of the pacific ocean: Conditions of occurrence, mineralogy, and geochemistry. Oceanology 2022, 62, 879–889. [Google Scholar] [CrossRef]
- Deslattes, R.D.; Kessler, E.G., Jr.; Indelicato, P.; de Billy, L.; Lindroth, E.; Anton, J.; Coursey, J.S.; Schwab, D.J.; Chang, J.; Sukumar, R.; et al. X-ray Transition Energies Database; NIST Standard Reference Database 128; NIST: Gaithersburg, MD, USA, 2003. [CrossRef]
- Remond, G.; Myklebust, R.; Fialin, M.; Nockolds, C.; Phillips, M.; Roques-Carmes, C. Decomposition of wavelength dispersive X-ray spectra. J. Res. Natl. Inst. Stand. Technol. 2002, 107, 509–529. [Google Scholar] [CrossRef] [PubMed]
Figure 1.
X-ray fluorescence spectrum in the field of MnKβ1,3 line for manganese (IV) oxide sample (MnO2). Dots are measured spectrum; lines are results of decomposition using the pseudo-Voigt function.
Figure 1.
X-ray fluorescence spectrum in the field of MnKβ1,3 line for manganese (IV) oxide sample (MnO2). Dots are measured spectrum; lines are results of decomposition using the pseudo-Voigt function.

Figure 2.
Dependence of ratios of line intensities of MnKβ5/MnKβ1,3 (a) and MnKβ′/MnKβ1,3 (b) on the average manganese valence state (NMn) for three manganese oxide samples (MnO, Mn2O3, and MnO2).
Figure 2.
Dependence of ratios of line intensities of MnKβ5/MnKβ1,3 (a) and MnKβ′/MnKβ1,3 (b) on the average manganese valence state (NMn) for three manganese oxide samples (MnO, Mn2O3, and MnO2).

Figure 3.
X-fluorescence spectrum in the field of MnKβ1,3 and FeKα1,2 lines of the CRM of ferromanganese nodule SDO-4. Dots are measured spectrum; lines are results of decomposition using the pseudo-Voigt function.
Figure 3.
X-fluorescence spectrum in the field of MnKβ1,3 and FeKα1,2 lines of the CRM of ferromanganese nodule SDO-4. Dots are measured spectrum; lines are results of decomposition using the pseudo-Voigt function.

Figure 4.
Correlations between NMn values obtained from XRF analysis using different variants of Equation (3), see Table 4 and Table S2: Equation (3.2) (a), Equation (3.4) (b), Equation (3.5) (c), Equation (3.6) (d) and calculated using Equation (2) for the calibration set. Black squares are manganese oxides, blue dots are CRMs of ferromanganese nodules, Co-bearing ferromanganese crusts, and manganese ores.


Table 1.
Mineral composition of certified reference materials of ferromanganese nodules, %.
| Mineral | SDO-4 | SDO-5 | SDO-6 | SDO-7 | MnN |
|---|---|---|---|---|---|
| Asbolane | 35–40 | 15–20 | 8–12 | 6–10 | - |
| Vernadite | 4–6 | 3–5 | 5–7 | 20–25 | 80–85 |
| Todorokite | 3–5 | 15–20 | 10–15 | - | |
| Ferroxigite | 2–4 | 2–4 | 4–7 | 3–6 | - |
| Buzerite | - | 2–6 | 5–8 | - | - |
| Birnessite | - | 1–3 | 3–5 | - | - |
| Iron minerals a | 4–9 | 2–4 | 4–8 | 6–10 | 3–5 |
| Amorphous Fe and Mn phases | - | - | 5–8 | 2–4 | - |
| Silicate minerals b | 17–35 | 33–57 | 19–36 | 30–53 | 10–15 |
| Other minerals c | 8–13 | 6–11 | 3–6 | 7–13 | - |
a iron minerals are magnetite, ilmenite, and hematite; b silicate minerals are montmorillonite, hydrous micas, chlorite, pyroxene, amphibole, plagioclase, and feldspar; c other minerals are quartz, halite, and volcanic glass.
Table 2.
Results of MnO2 determination by volumetric technique (MnO2vt) in comparison with certified values (MnO2cert).
Table 2.
Results of MnO2 determination by volumetric technique (MnO2vt) in comparison with certified values (MnO2cert).
| CRM | MnO2cert ± Δ, wt.% | MnO2vt, wt.% | NMn,cert | NMn,vt |
|---|---|---|---|---|
| SDO-4 | 35.8 ± 0.4 | 34.9 | 3.95 | 3.90 |
| SDO-5 | 41.7 ± 0.5 | 40.1 | 3.94 | 3.87 |
| SDO-6 | 31.1 ± 0.4 | 29.6 | 4.00 | 3.92 |
| SDO-7 | 24.2 ± 0.4 | 23.5 | 3.99 | 3.93 |
Table 3.
MnO2 content and average manganese valence state (NMn) determined by volumetric technique for CRMs of ferromanganese nodules.
Table 3.
MnO2 content and average manganese valence state (NMn) determined by volumetric technique for CRMs of ferromanganese nodules.
| CRM | MnO2vt, wt.% | NMn,vt |
|---|---|---|
| GMK-1 | 40.9 | 3.97 |
| GMK-2 | 43.6 | 3.98 |
| KMK-1 | 31.1 | 3.77 |
| KMK-2 | 20.3 | 3.79 |
| FeMn-1 | 47.5 | 3.65 |
| MnN | 41.9 | 3.77 |
Table 4.
Parameters of calibration curves.
| Equation Number | Analytical Parameter | Influence | rxy | SD |
|---|---|---|---|---|
| Equation (3.1) | MnKβ5/Mnβ1,3 | - | 0.63 | 0.32 |
| Equation (3.2) | Fe | 0.94 | 0.13 | |
| Equation (3.3) | MnKβ′/Mnβ1,3 | - | 0.45 | 0.41 |
| Equation (3.4) | Fe | 0.87 | 0.20 | |
| Equation (3.5) | MnKβ5/Mnβ1,3, MnKβ′/Mnβ1,3 | - | 0.96 | 0.11 |
| Equation (3.6) | Fe | 0.97 | 0.09 |
Table 5.
The relative standard deviation for average manganese valence state determination (RSD (NMn)), relative standard deviation (SD (MnO2)) and relative standard deviation (RSD (MnO2)) for MnO2 determination using different analytical parameters.
Table 5.
The relative standard deviation for average manganese valence state determination (RSD (NMn)), relative standard deviation (SD (MnO2)) and relative standard deviation (RSD (MnO2)) for MnO2 determination using different analytical parameters.
| Analytical Parameter | Influence | RSD (NMn), rel.% | SD (MnO2), wt.% | RSD (MnO2), rel.% |
|---|---|---|---|---|
| MnKβ5/Mnβ1,3 | Fe | 4.0 | 1.1 | 8.2 |
| MnKβ′/Mnβ1,3 | Fe | 2.3 | 0.8 | 4.9 |
| MnKβ5/Mnβ1,3, MnKβ′/Mnβ1,3 | - | 2.5 | 0.8 | 5.1 |
| Fe | 3.1 | 1.0 | 6.2 |
Disclaimer/Publisher’s Note: The statements, opinions and data contained in all publications are solely those of the individual author(s) and contributor(s) and not of MDPI and/or the editor(s). MDPI and/or the editor(s) disclaim responsibility for any injury to people or property resulting from any ideas, methods, instructions or products referred to in the content. |
© 2023 by the author. Licensee MDPI, Basel, Switzerland. This article is an open access article distributed under the terms and conditions of the Creative Commons Attribution (CC BY) license (https://creativecommons.org/licenses/by/4.0/).
Share and Cite
MDPI and ACS Style
Chubarov, V.M. New Approach for Direct Determination of Manganese Valence State in Ferromanganese Nodules by X-ray Fluorescence Spectrometry. Minerals 2023, 13, 1329. https://doi.org/10.3390/min13101329
AMA Style
Chubarov VM. New Approach for Direct Determination of Manganese Valence State in Ferromanganese Nodules by X-ray Fluorescence Spectrometry. Minerals. 2023; 13(10):1329. https://doi.org/10.3390/min13101329
Chicago/Turabian StyleChubarov, Victor M. 2023. "New Approach for Direct Determination of Manganese Valence State in Ferromanganese Nodules by X-ray Fluorescence Spectrometry" Minerals 13, no. 10: 1329. https://doi.org/10.3390/min13101329
Note that from the first issue of 2016, this journal uses article numbers instead of page numbers. See further details here.