

New Insights into the Genesis of Dibrova U-Th-REE Mineral Deposit (West Azov Megablock, Ukraine) Using Monazite Chemistry

Abstract
:1. Introduction
- Deep-fluidized mineralization—polygenic, polychronous mineralization with participation of transcrustal mantle fluids [14];
- Tectono-metamorphic remobilization, formed in the process of multistage tectono-metamorphic transformation of the Archean-Paleoproterozoic crystalline substrate in the shear dislocation system and localized in places of lower pressure—“pressure shadows” [15].
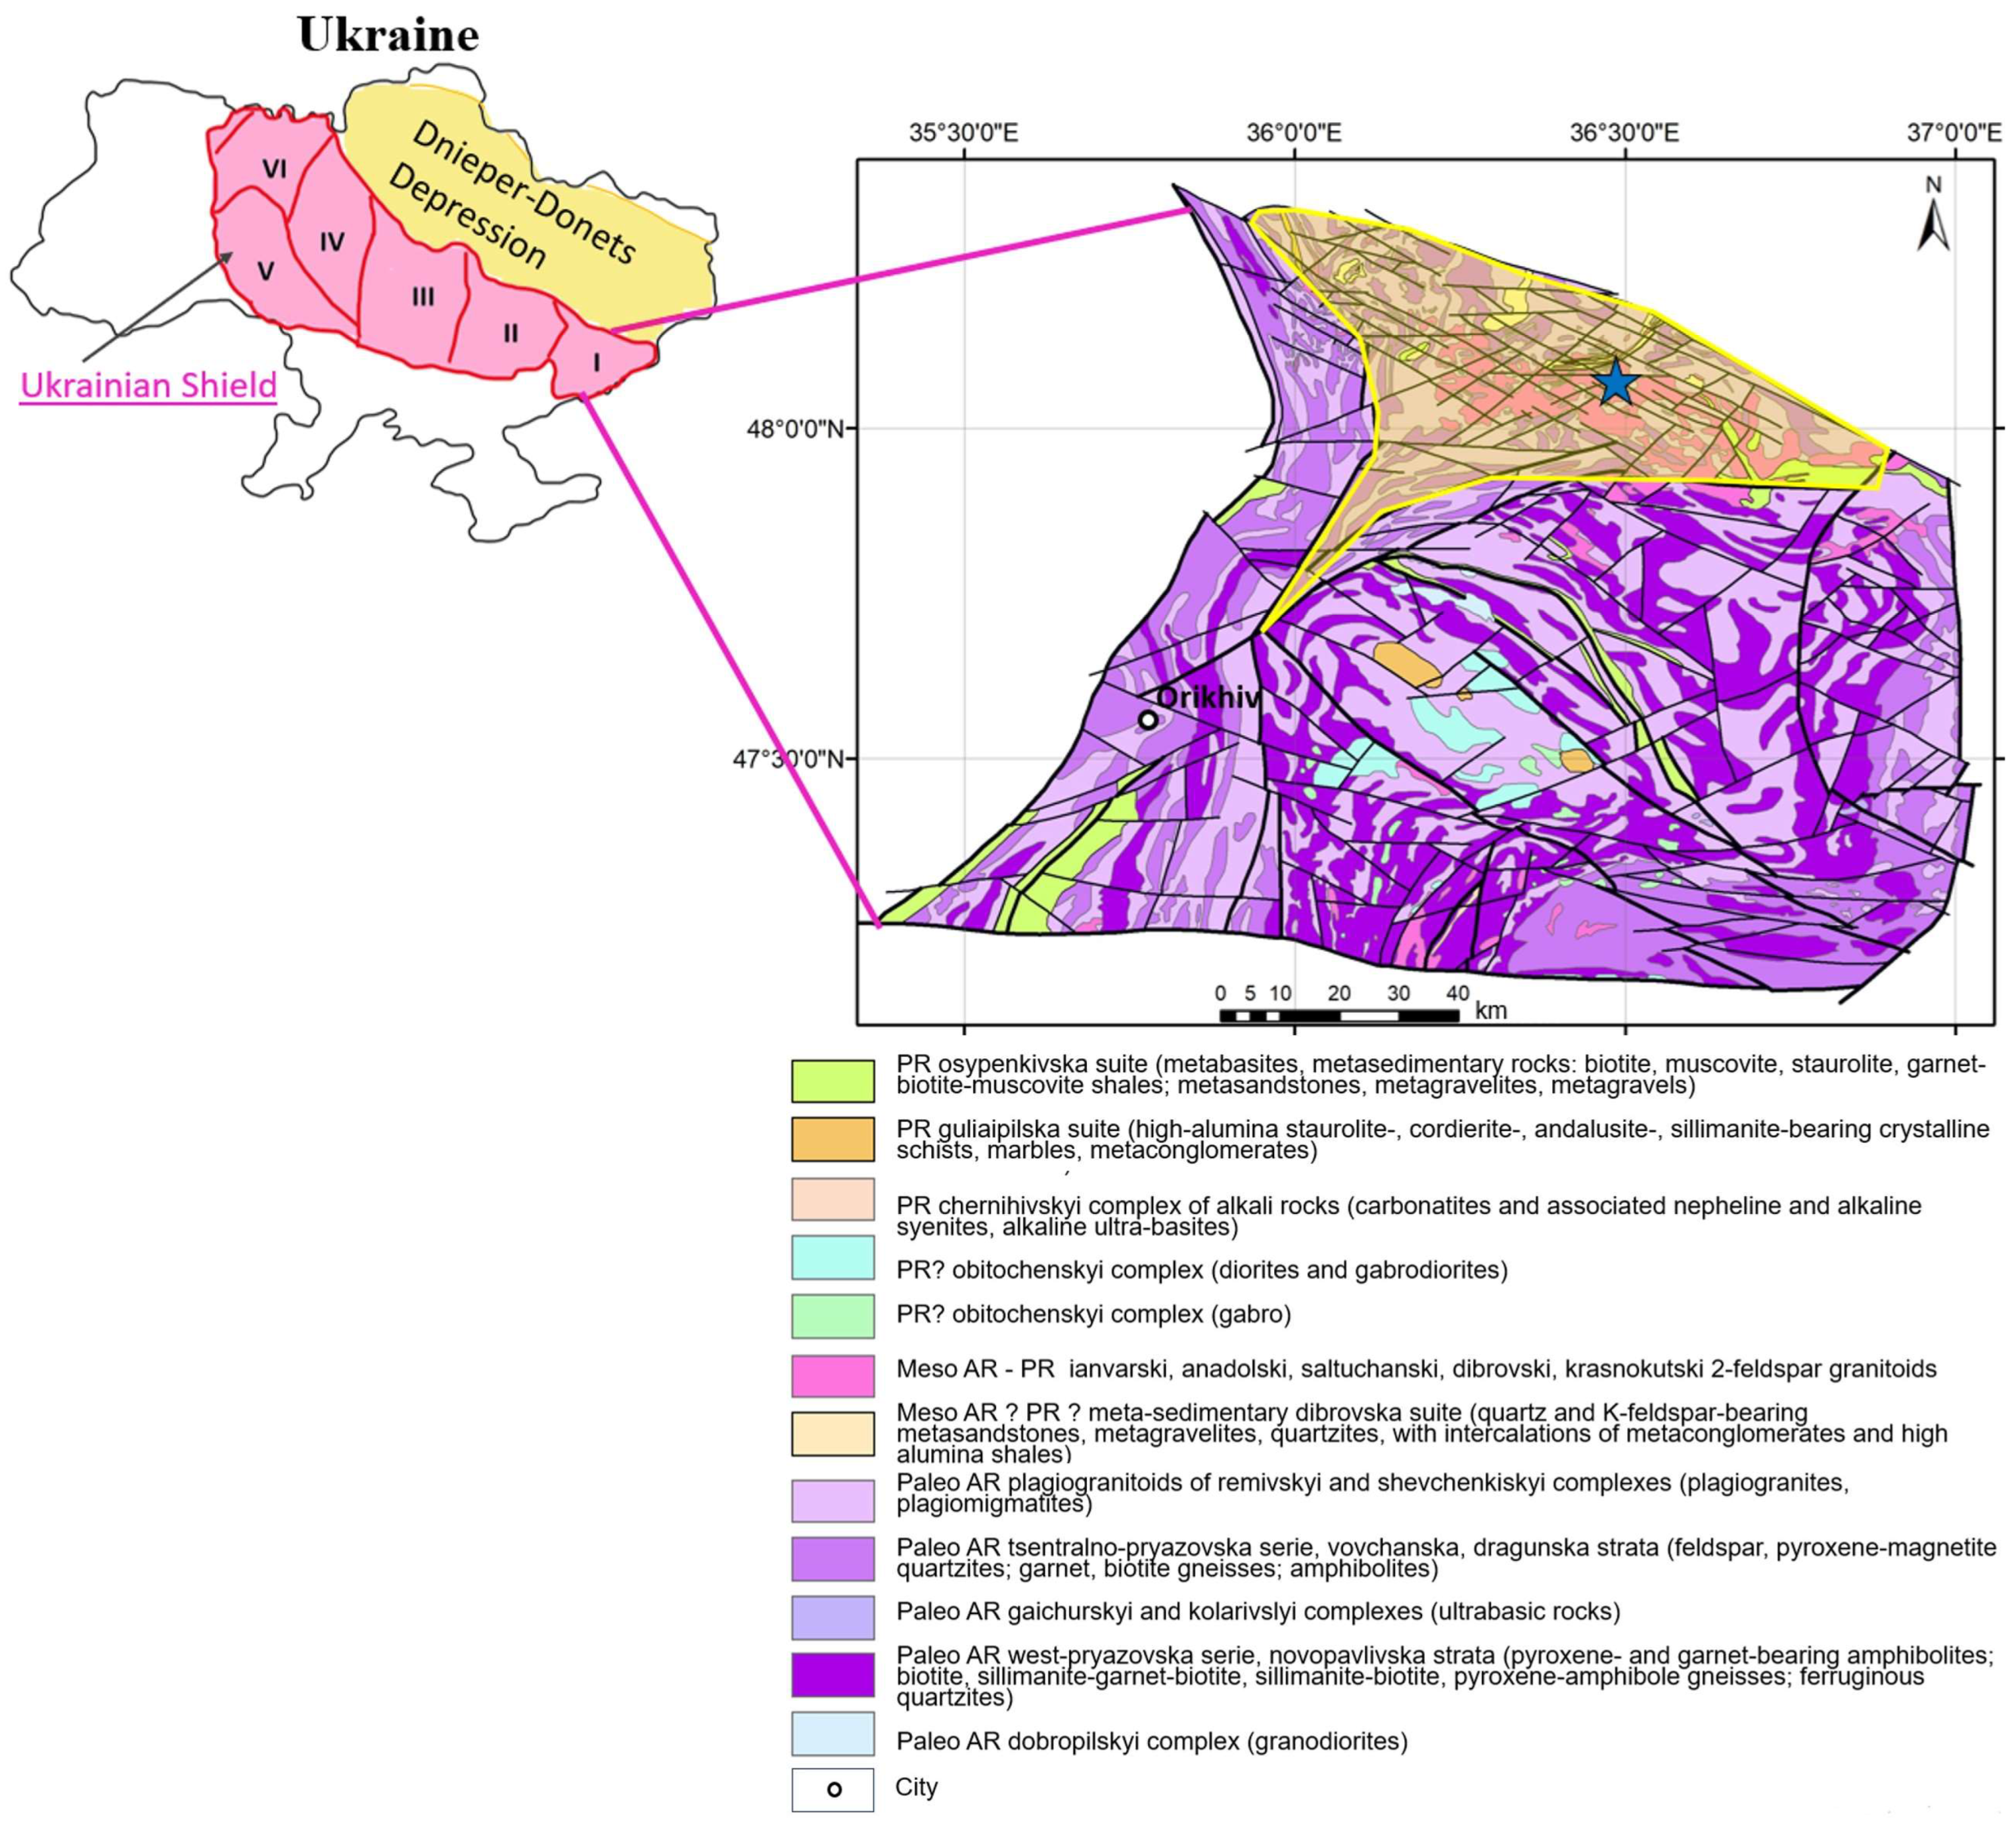
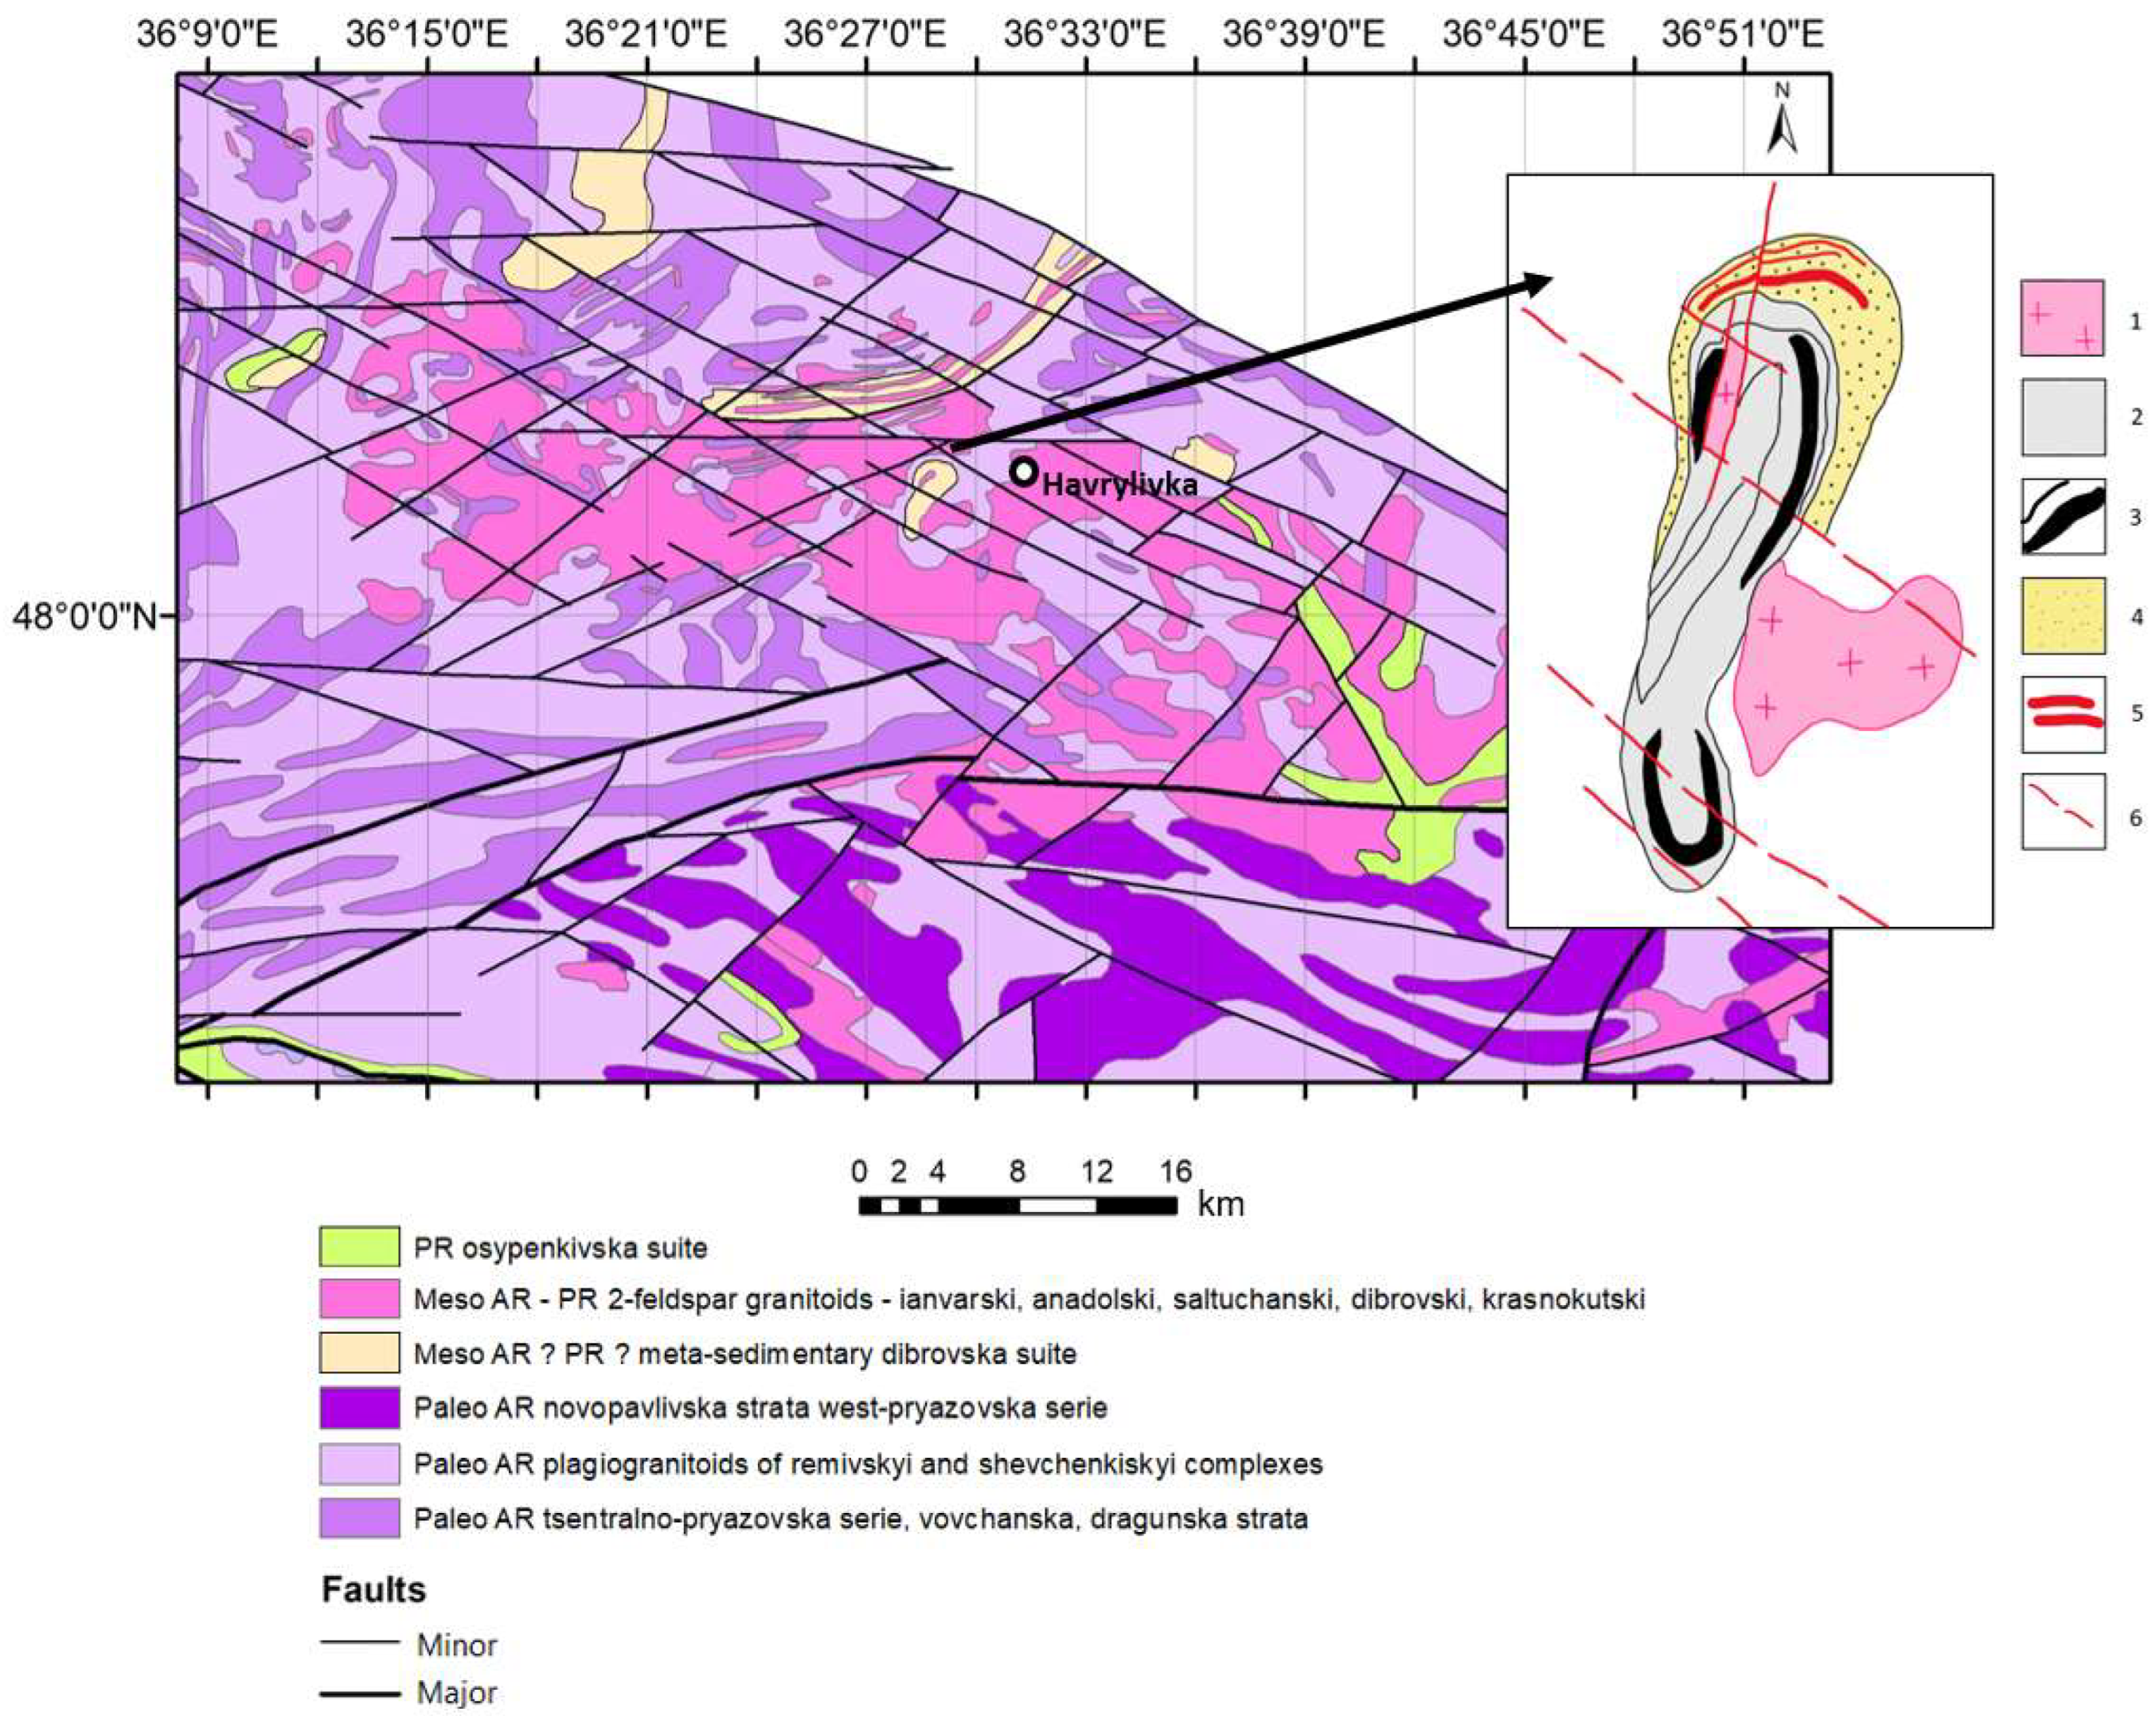
2. Regional Geological Setting
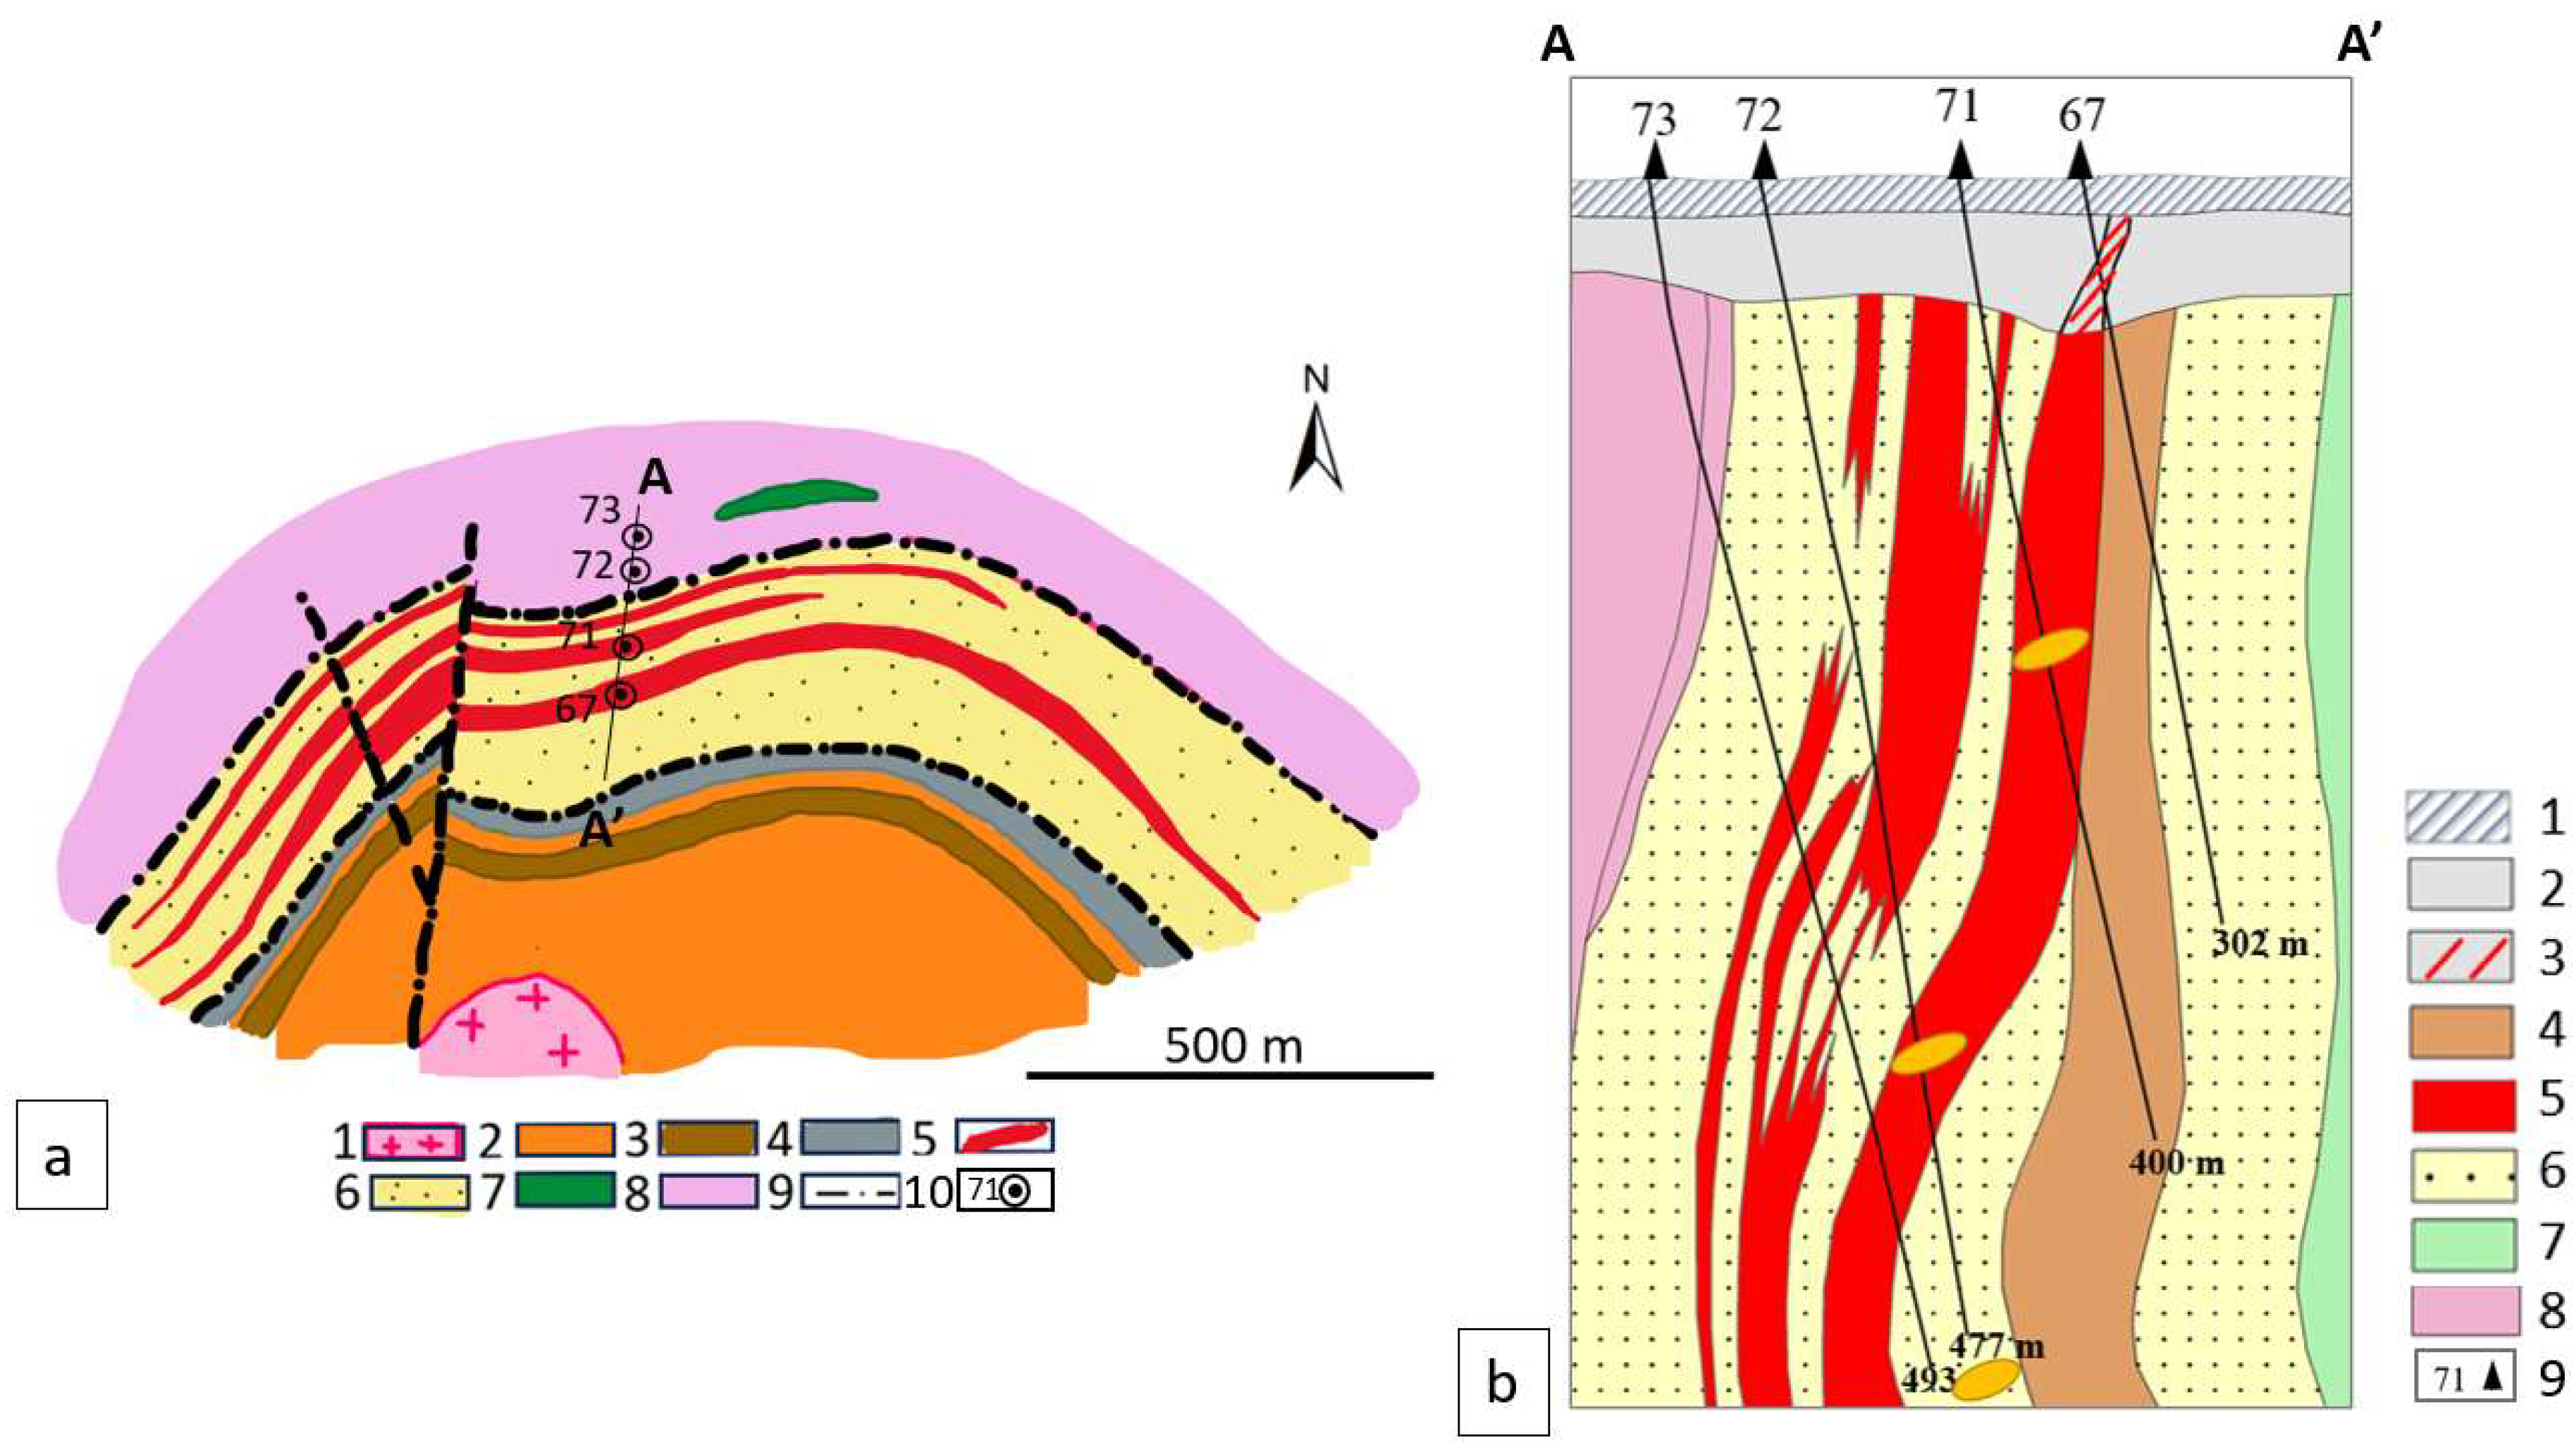
3. Deposit Geology
4. Methods
5. Results
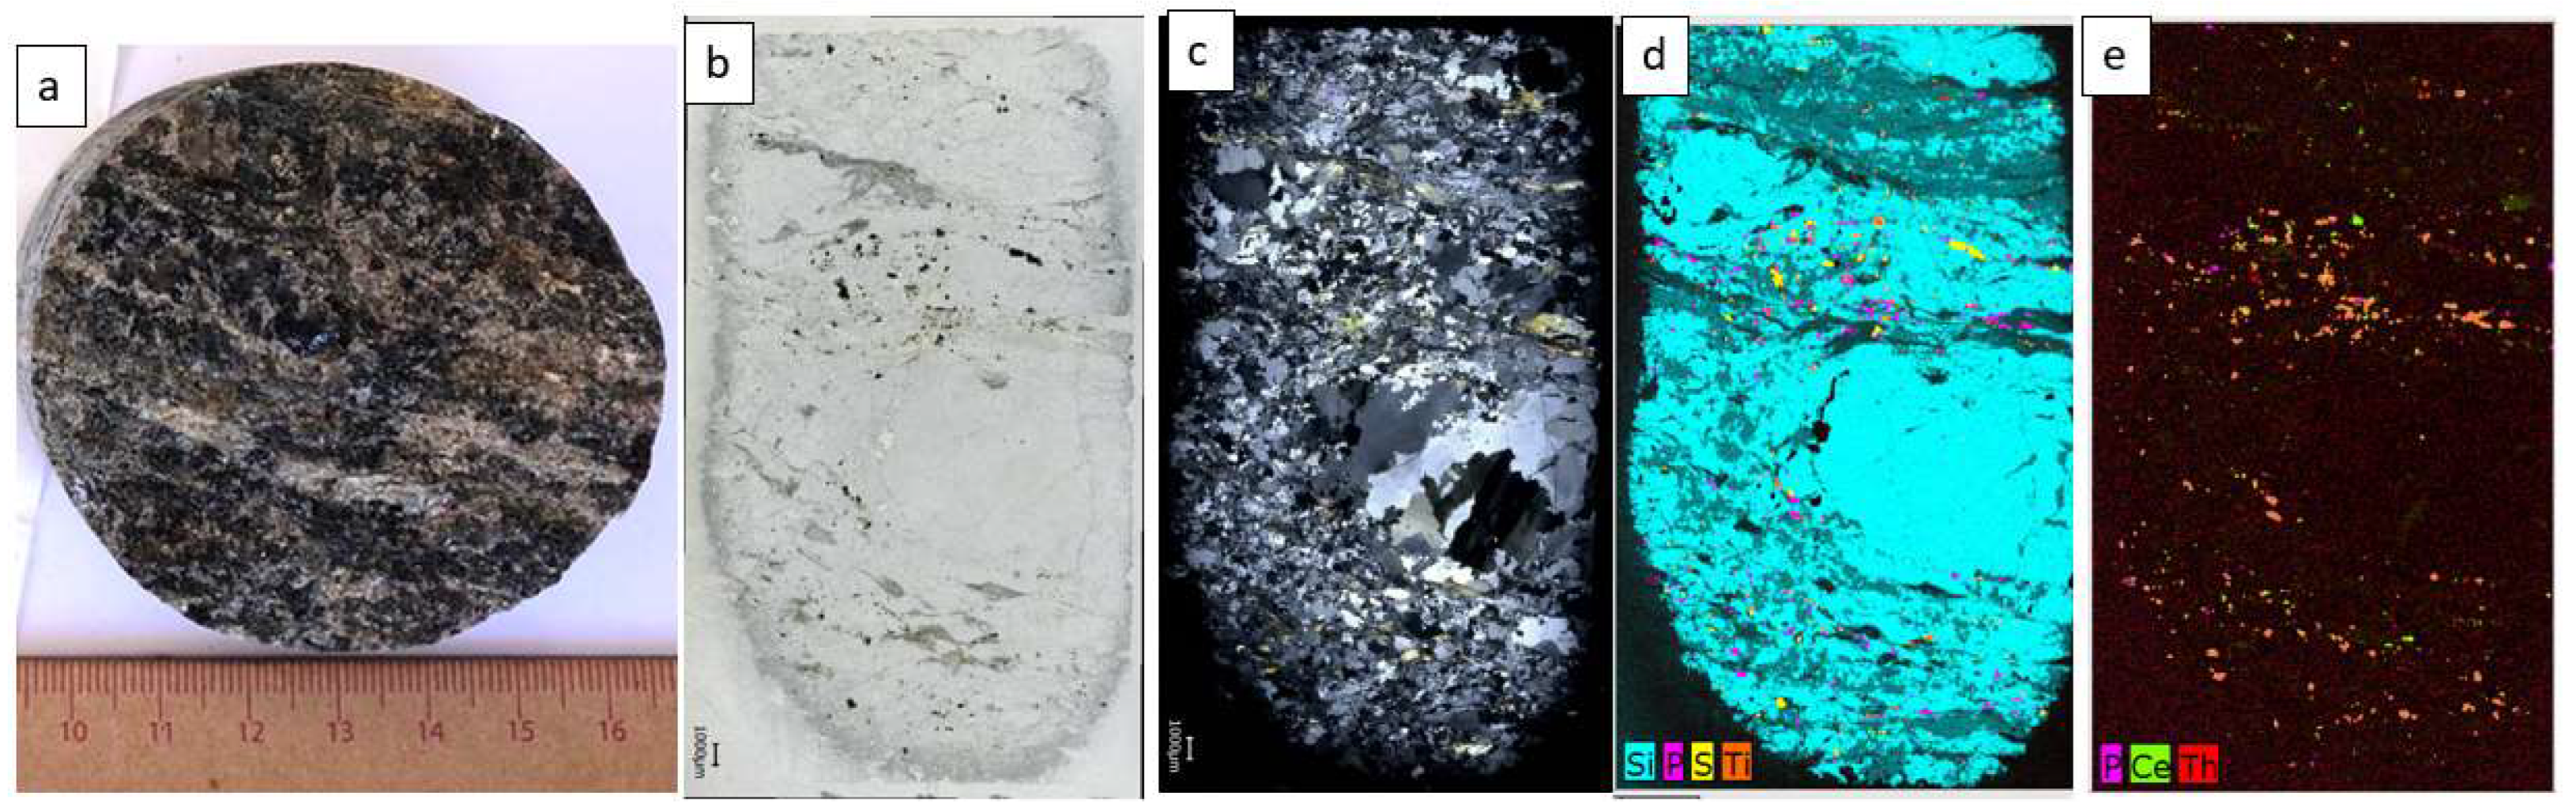
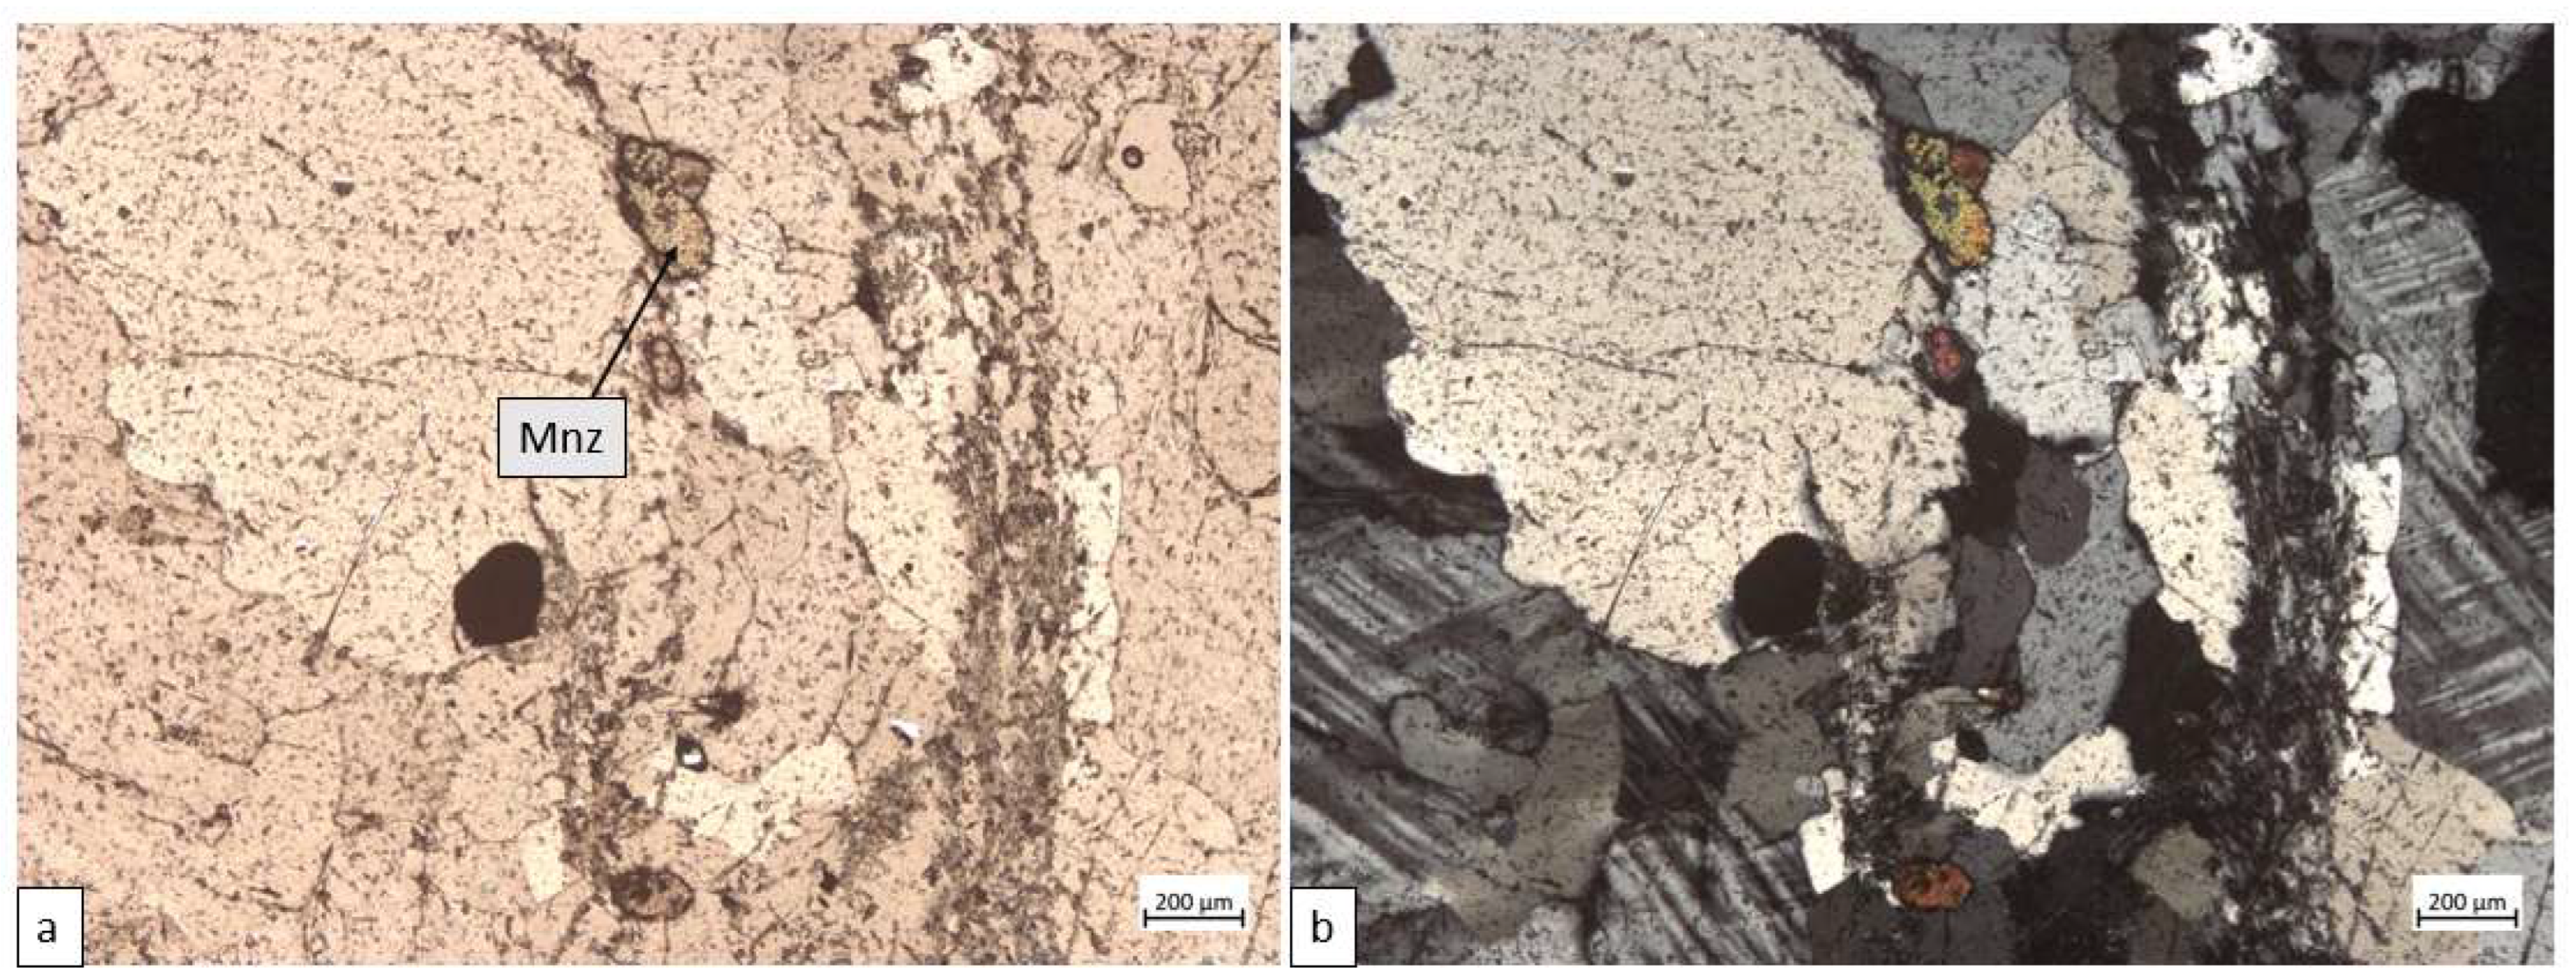
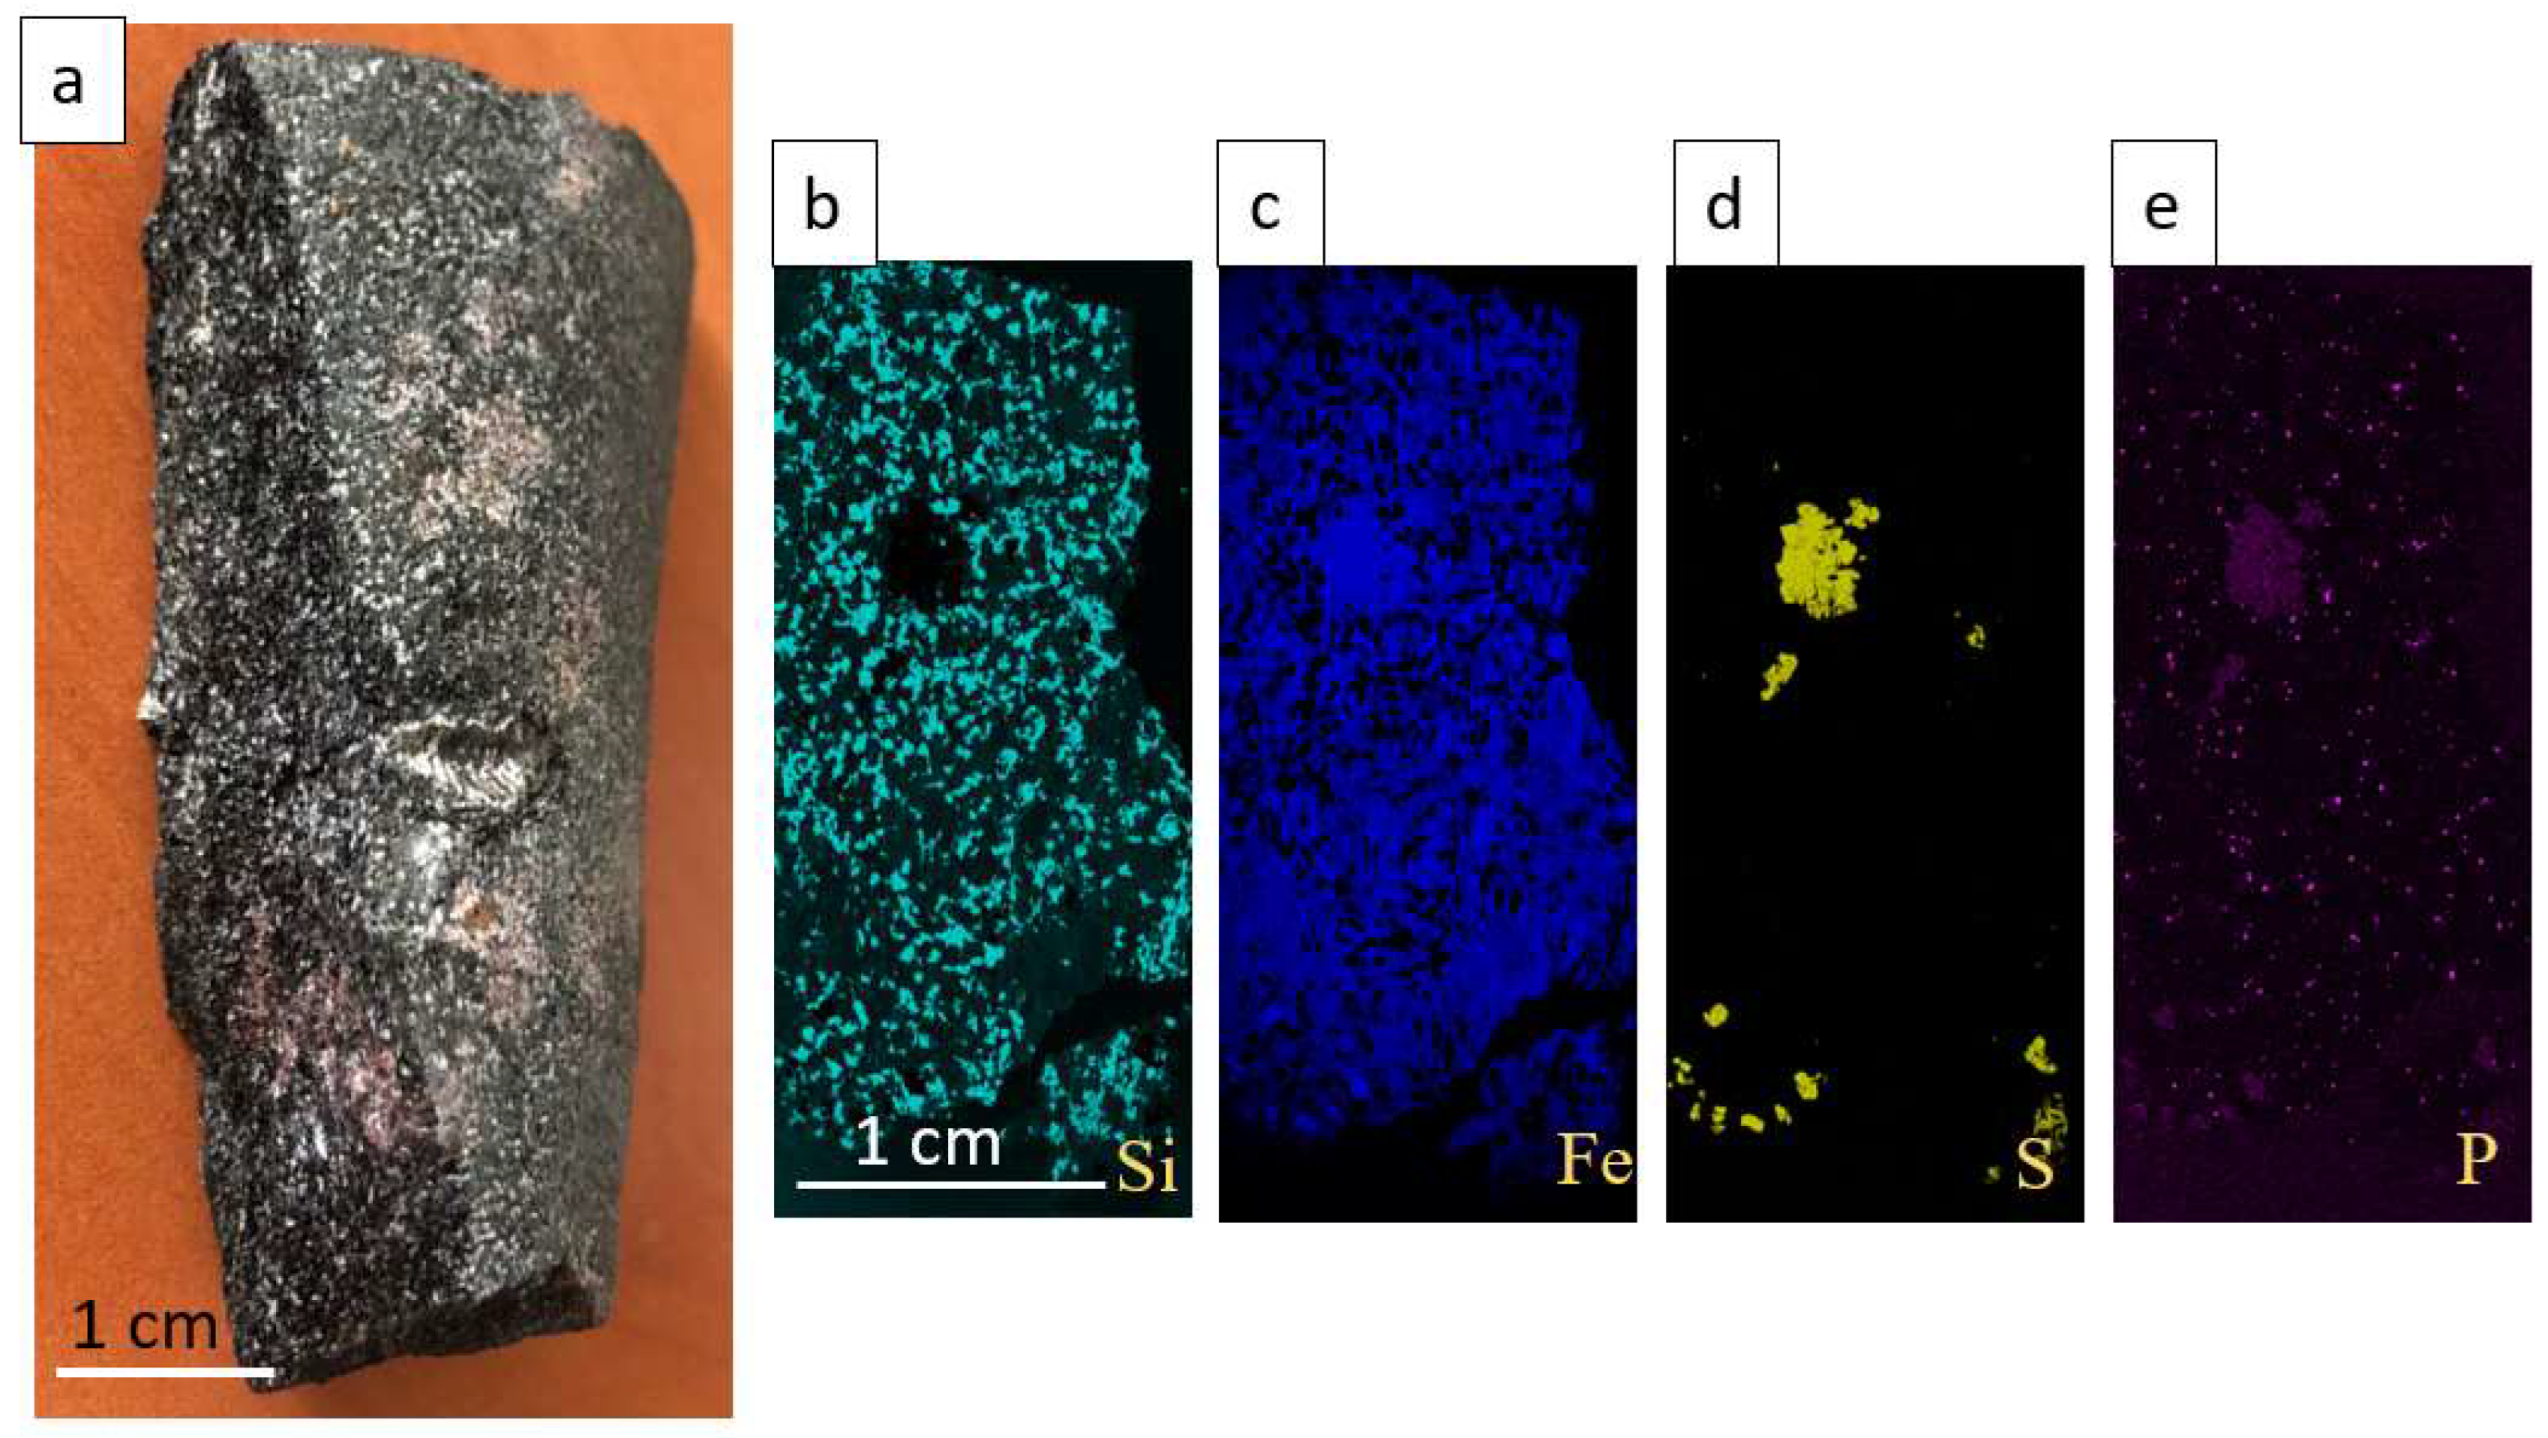
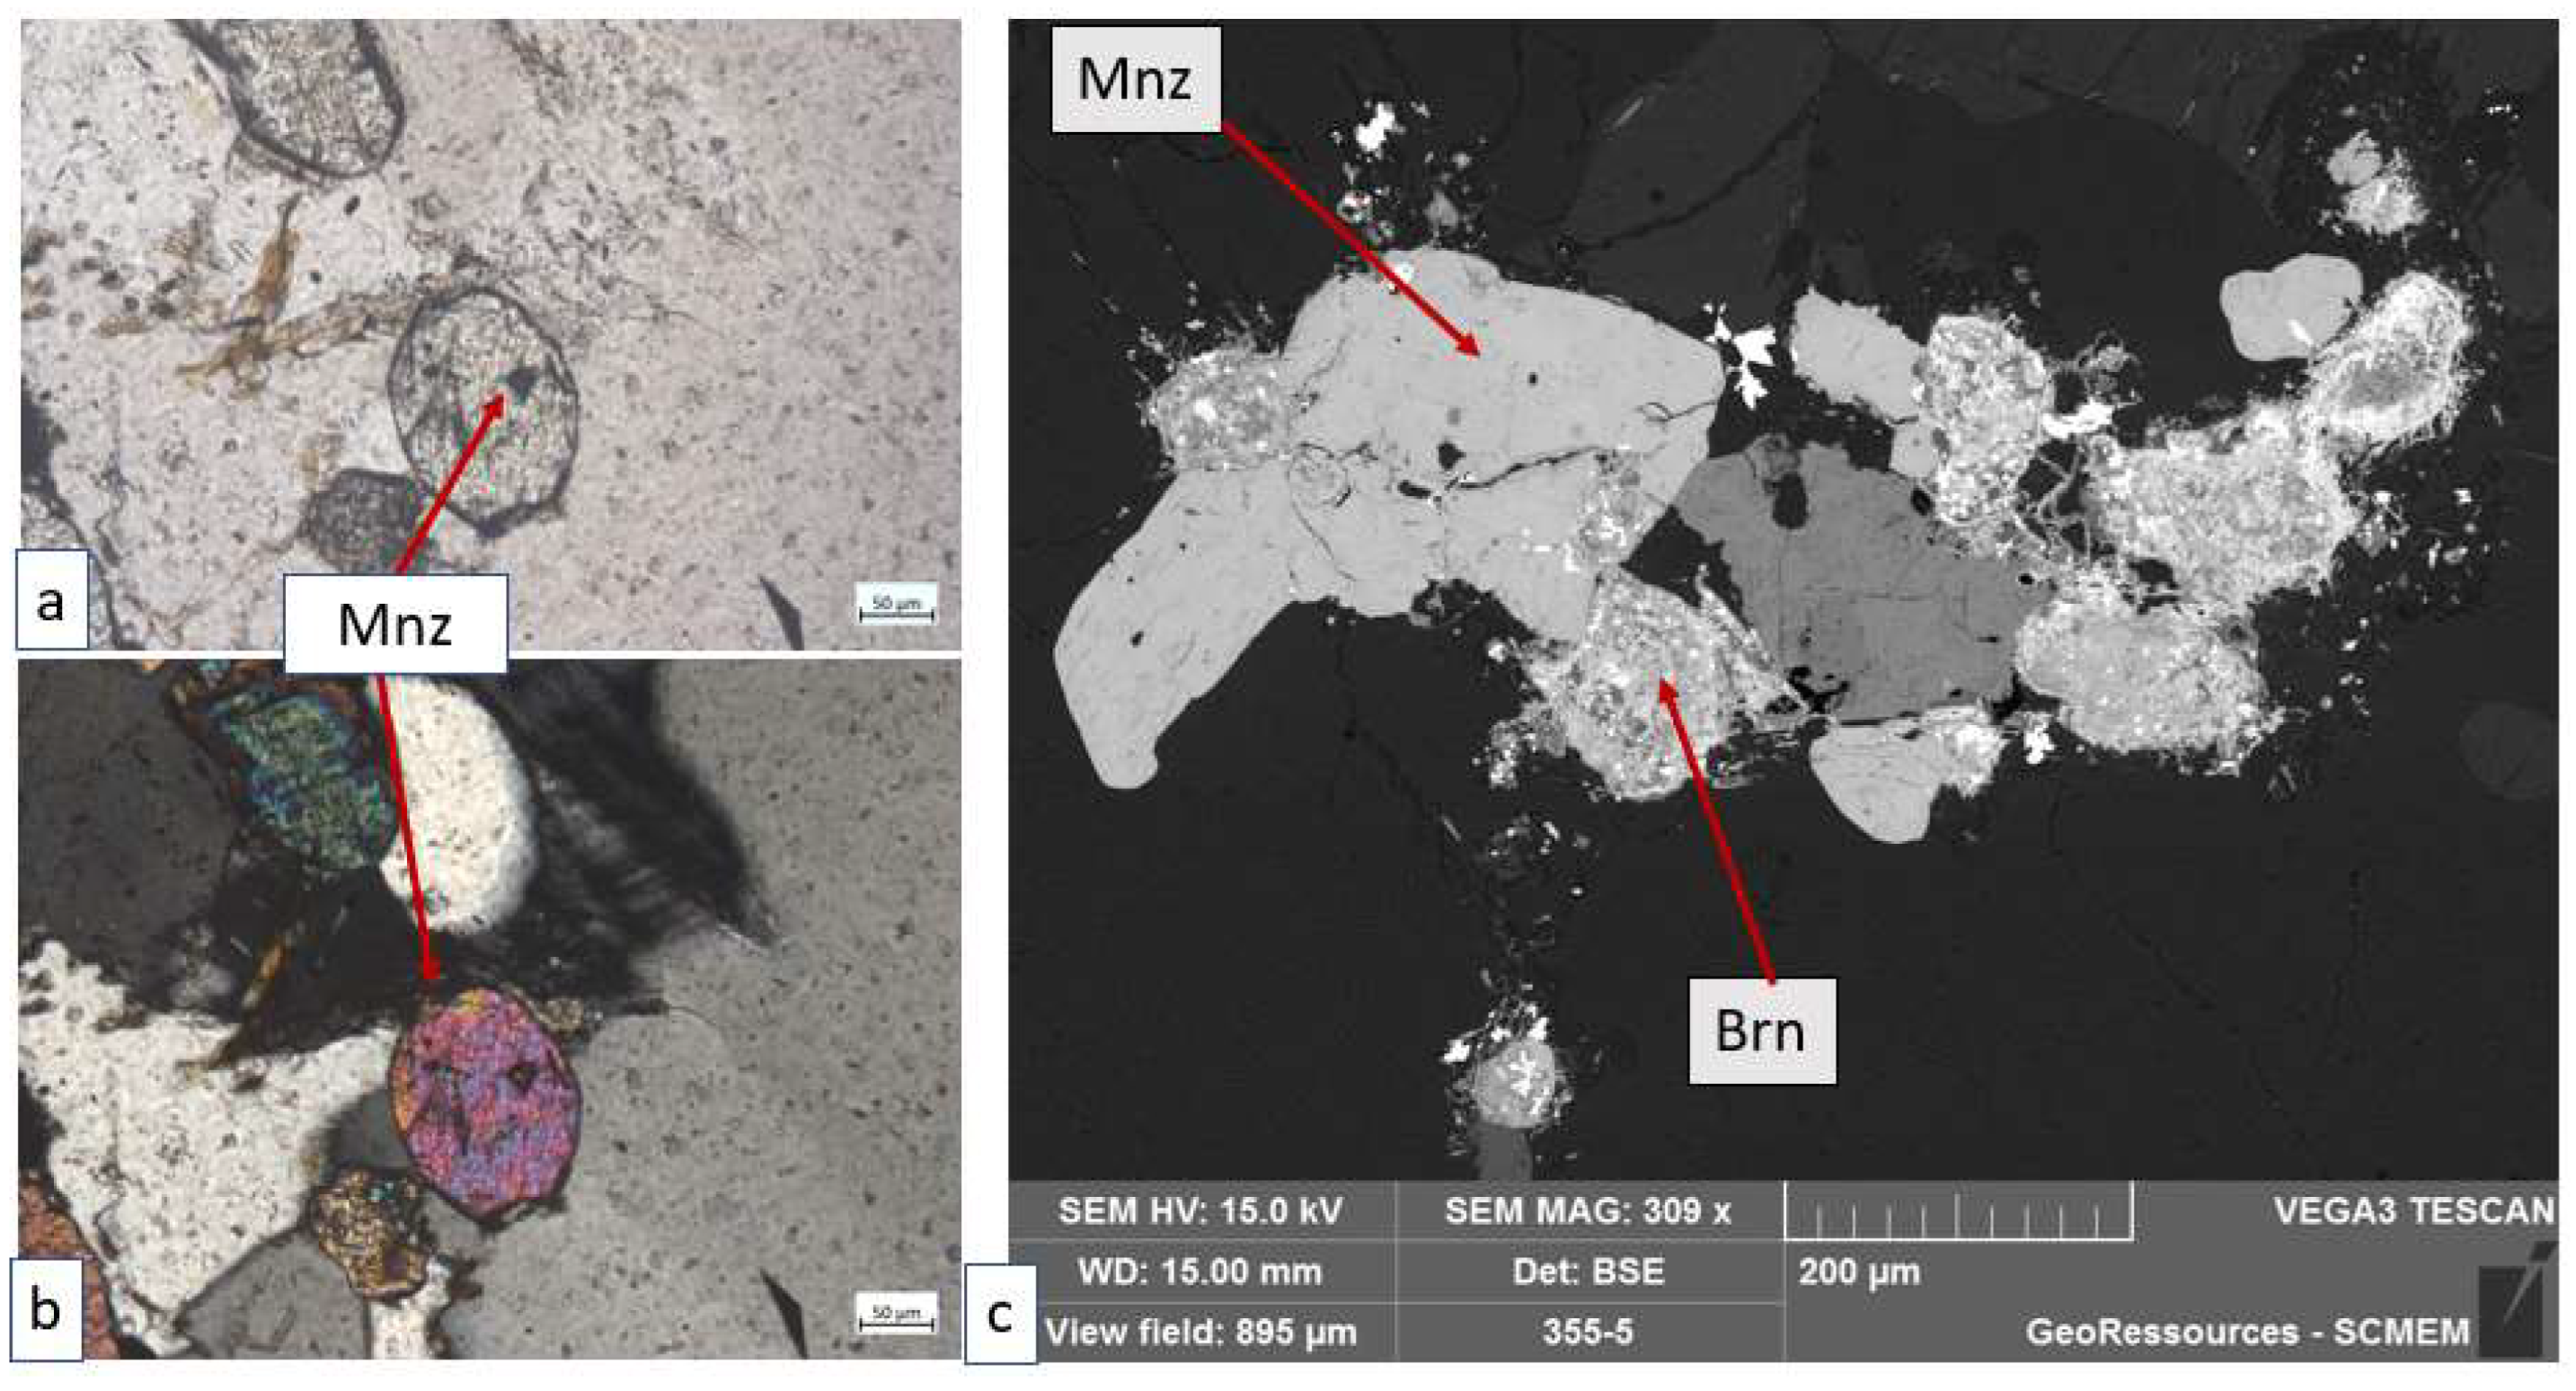
5.1. Petrography
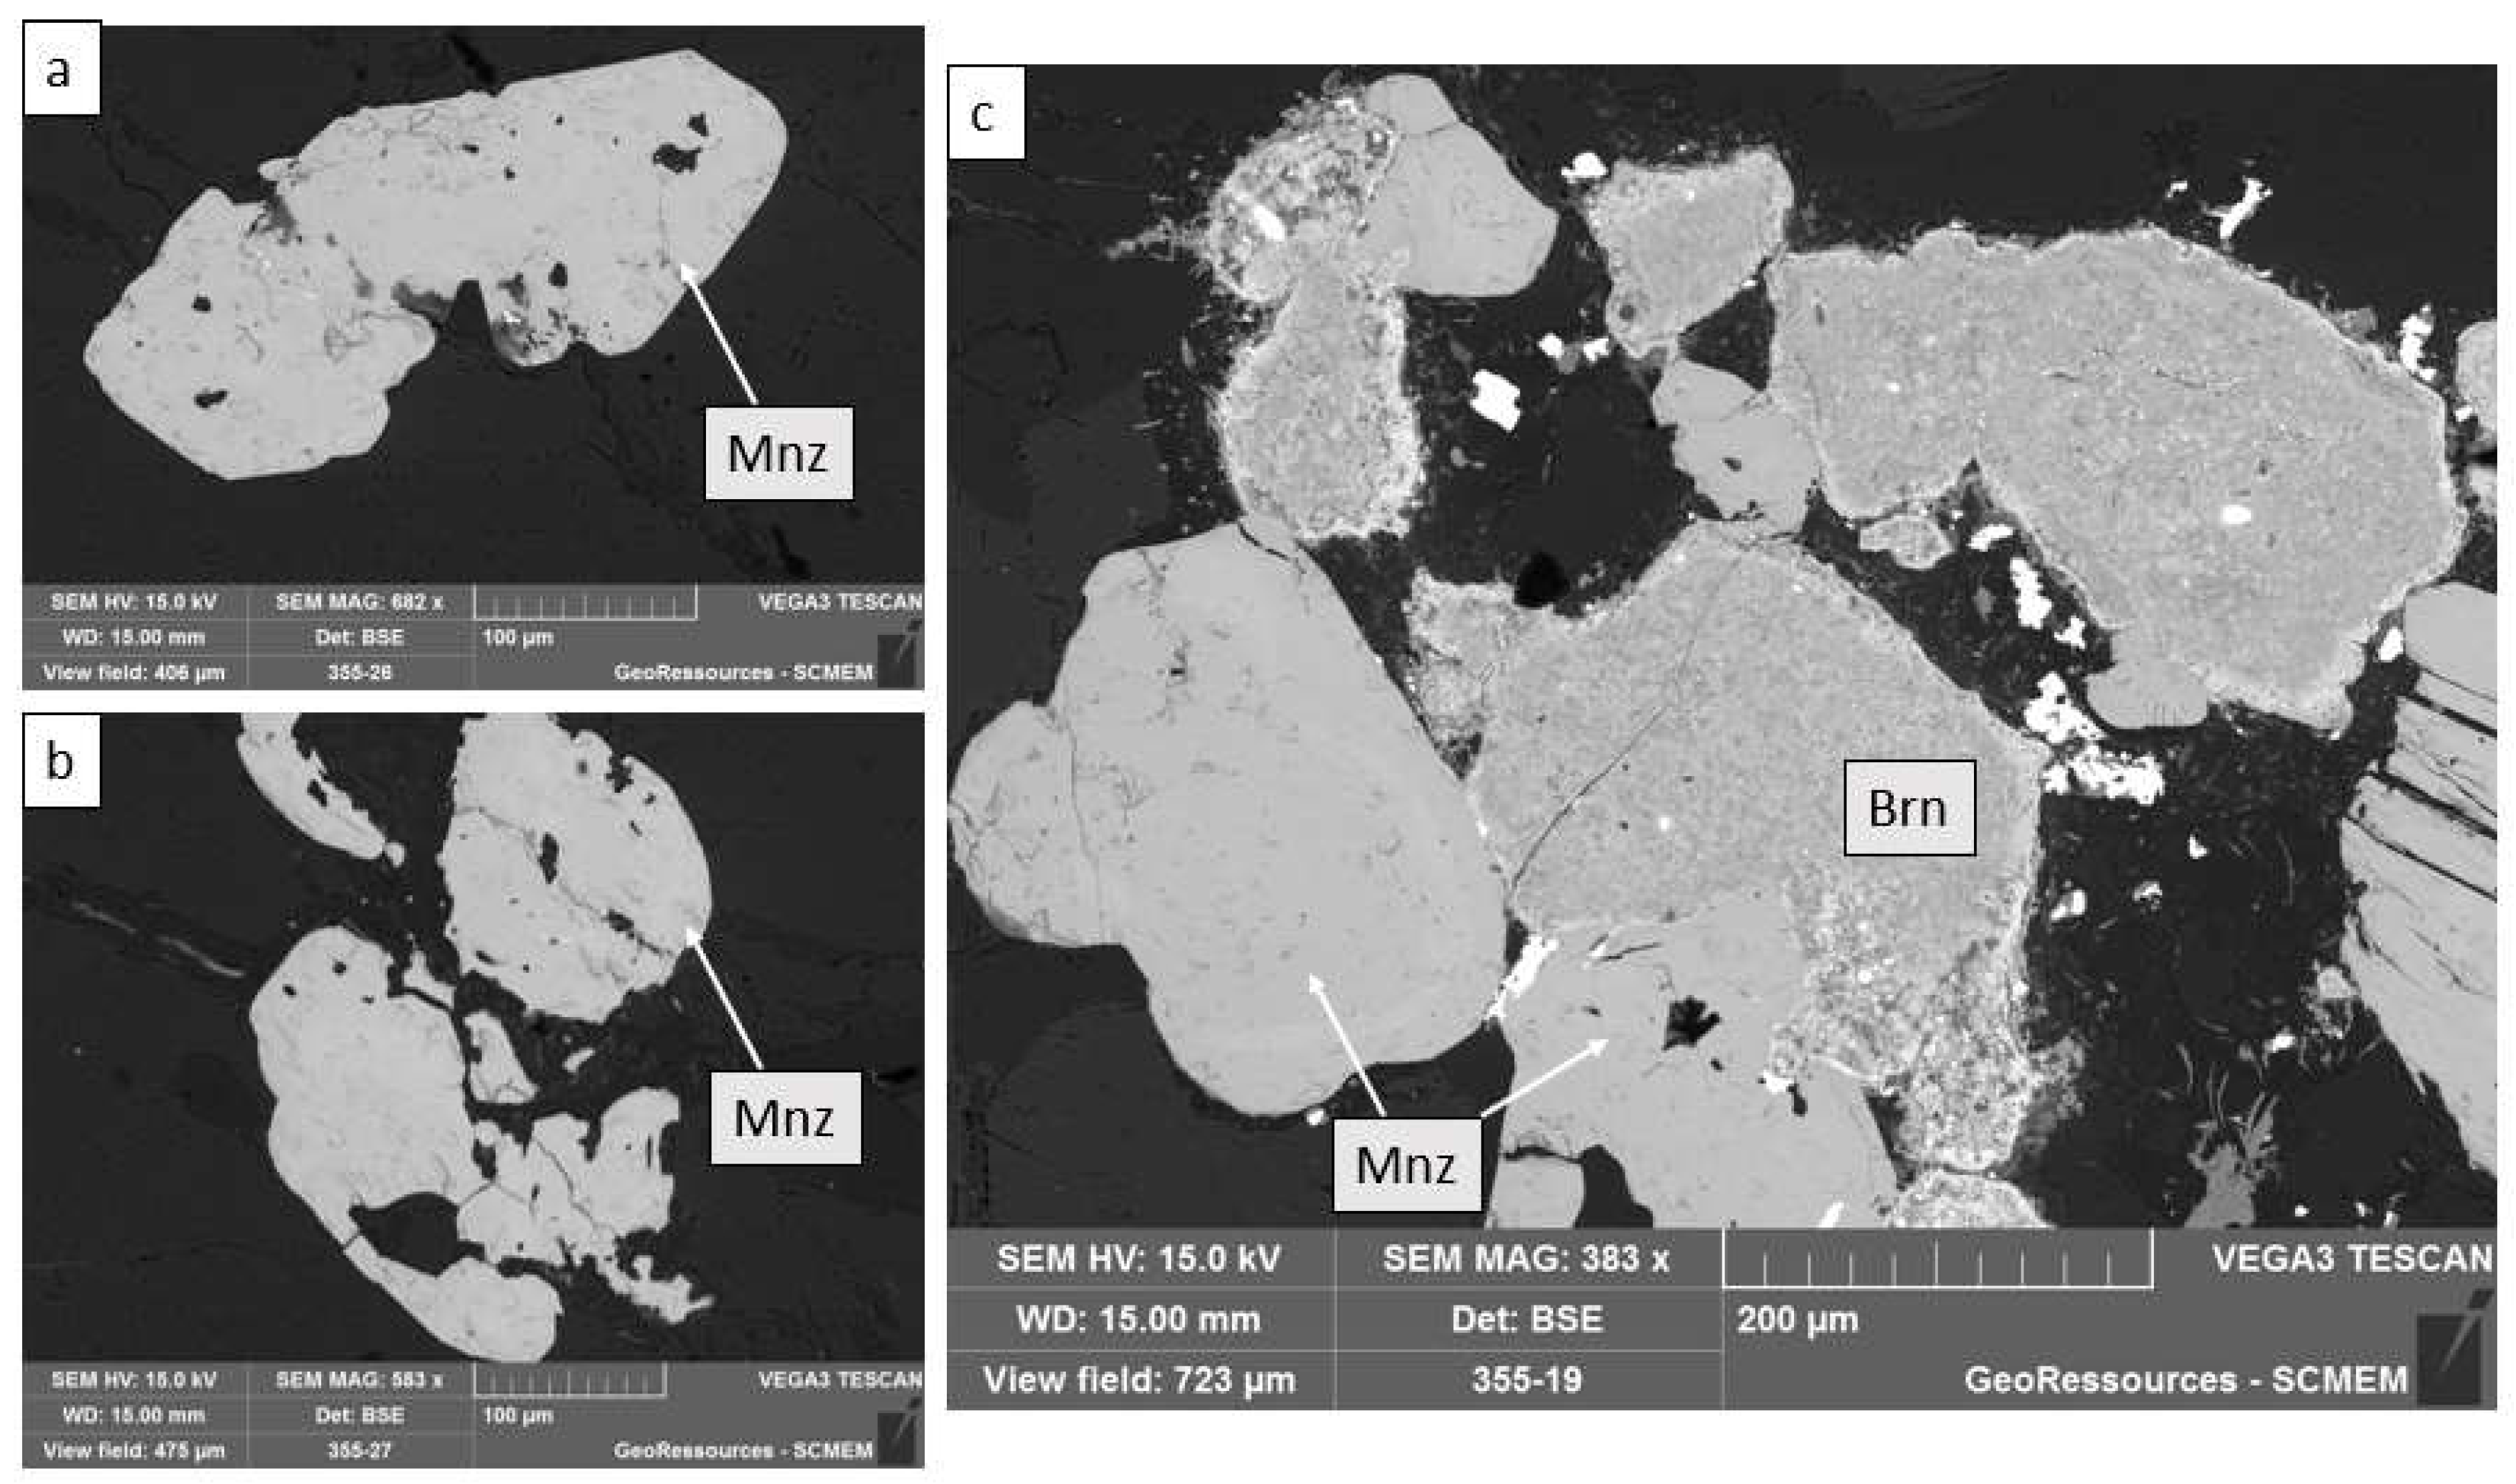
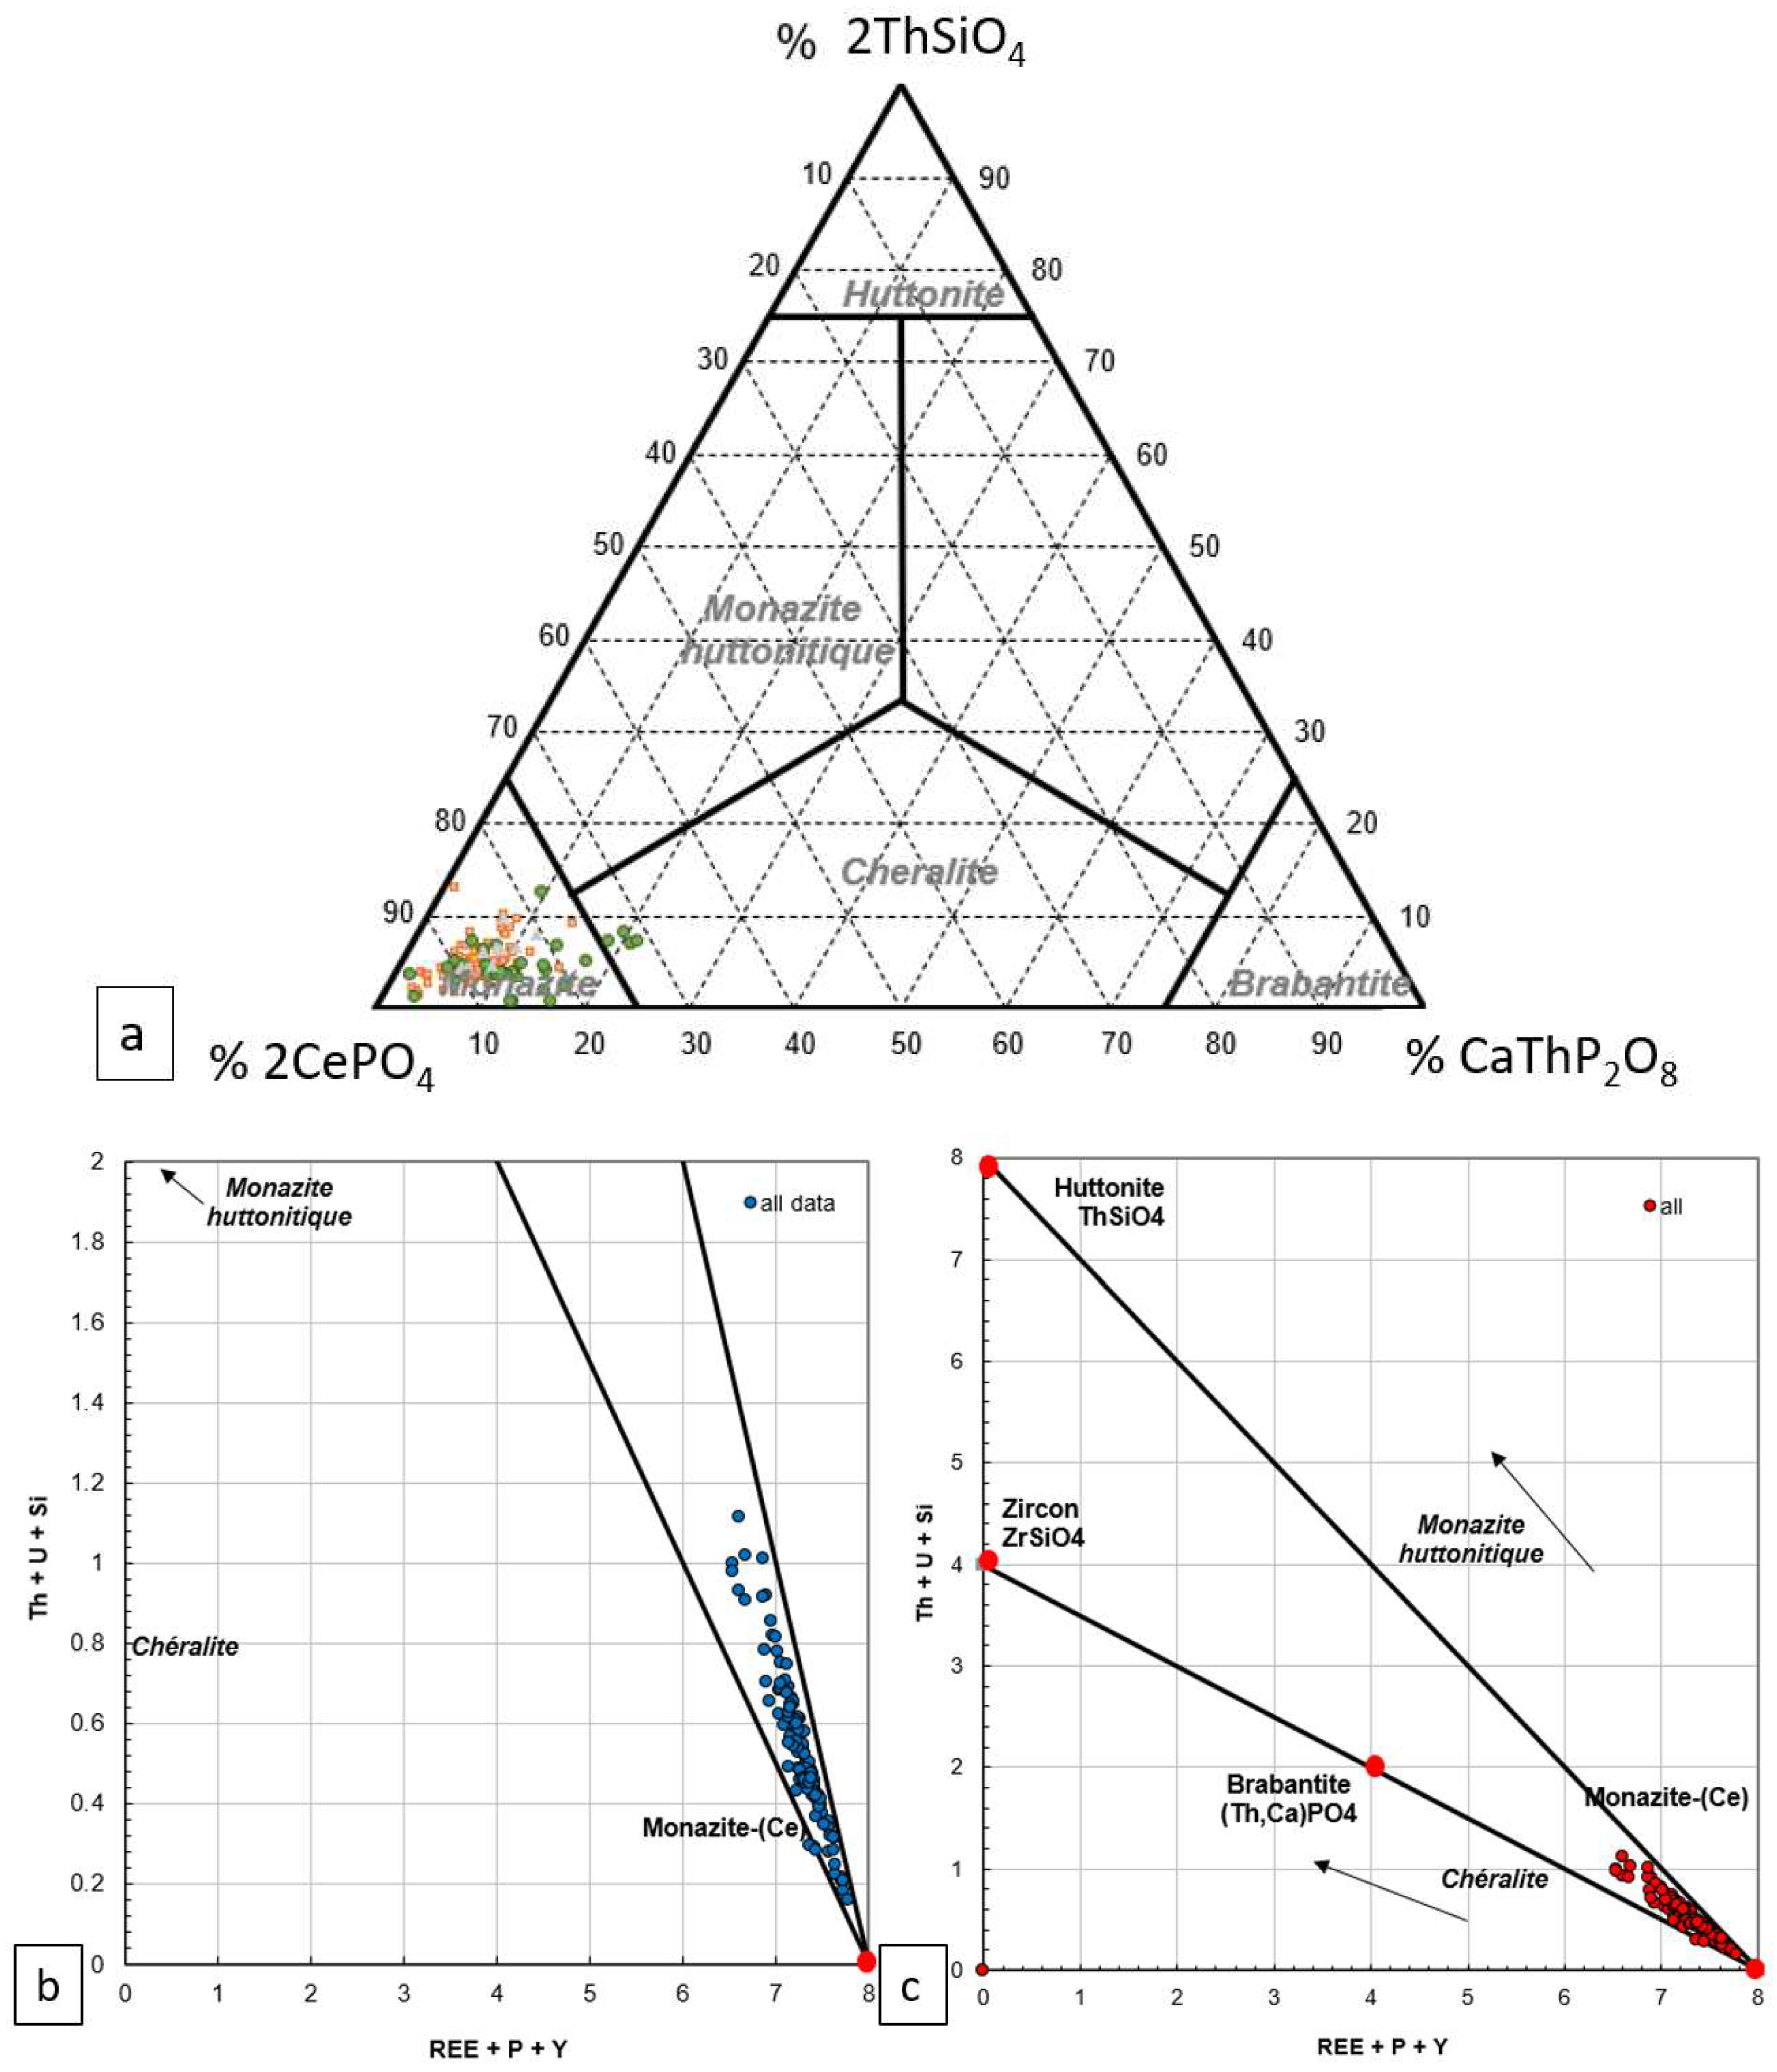
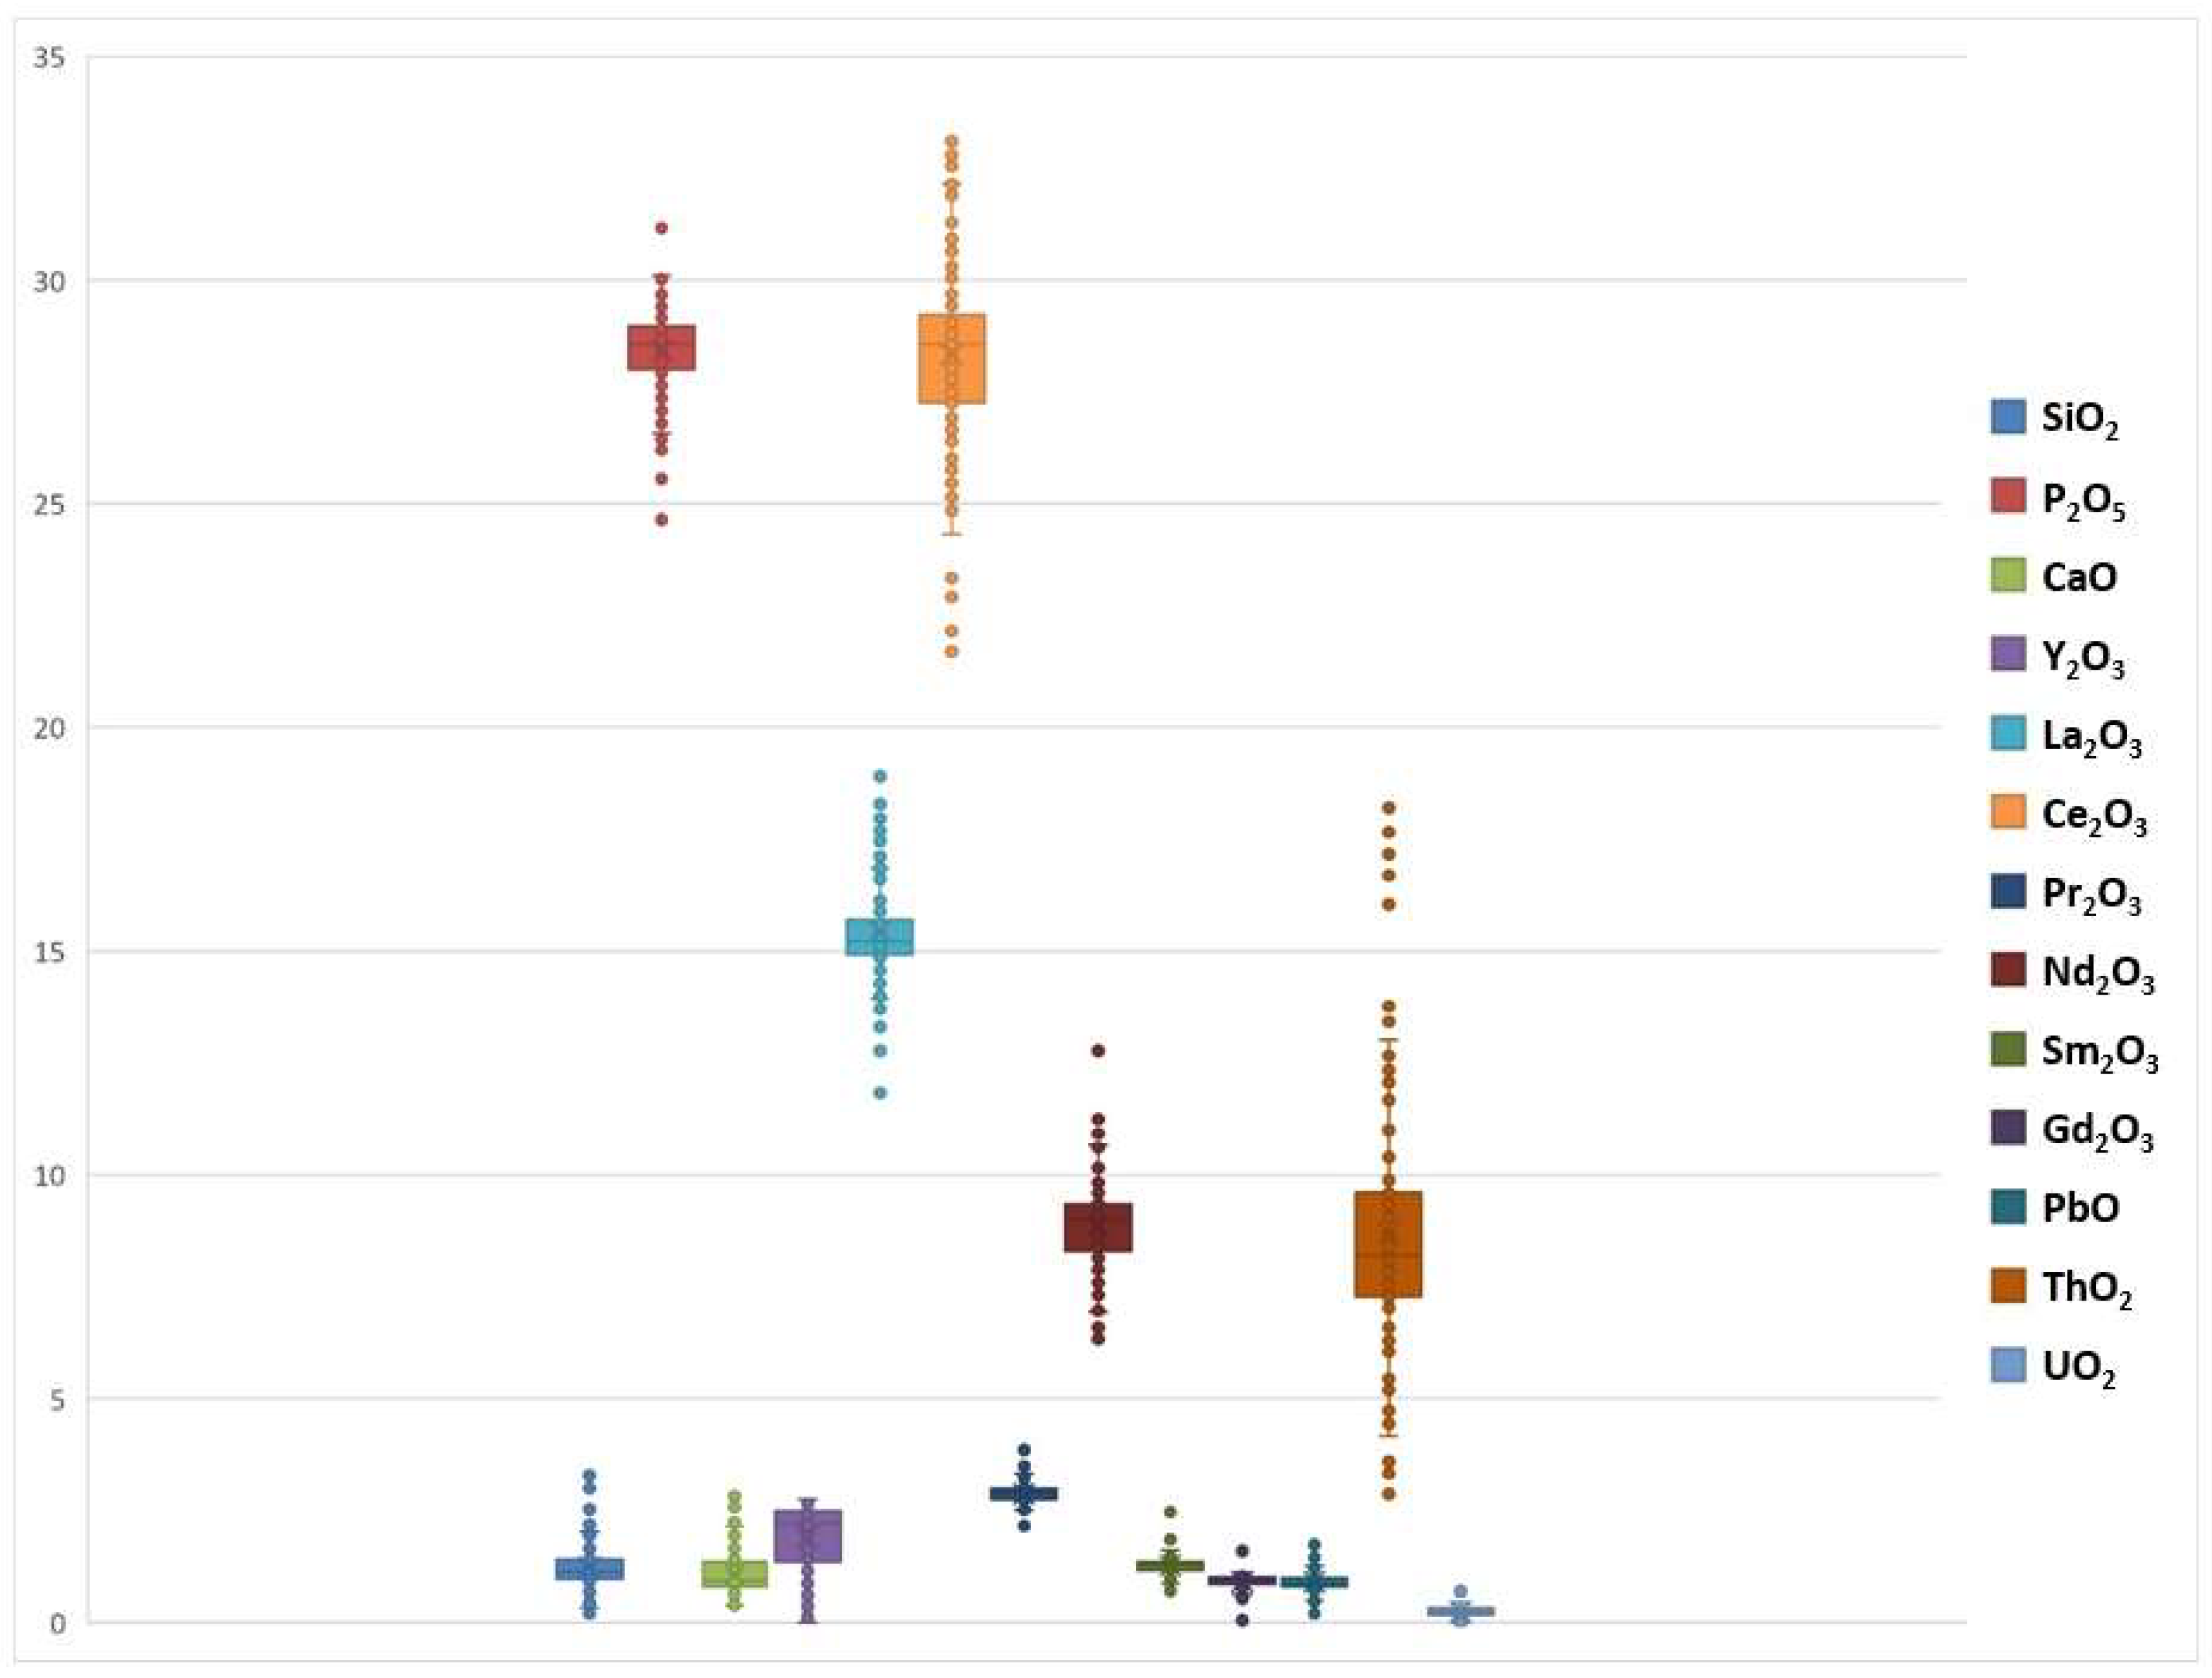
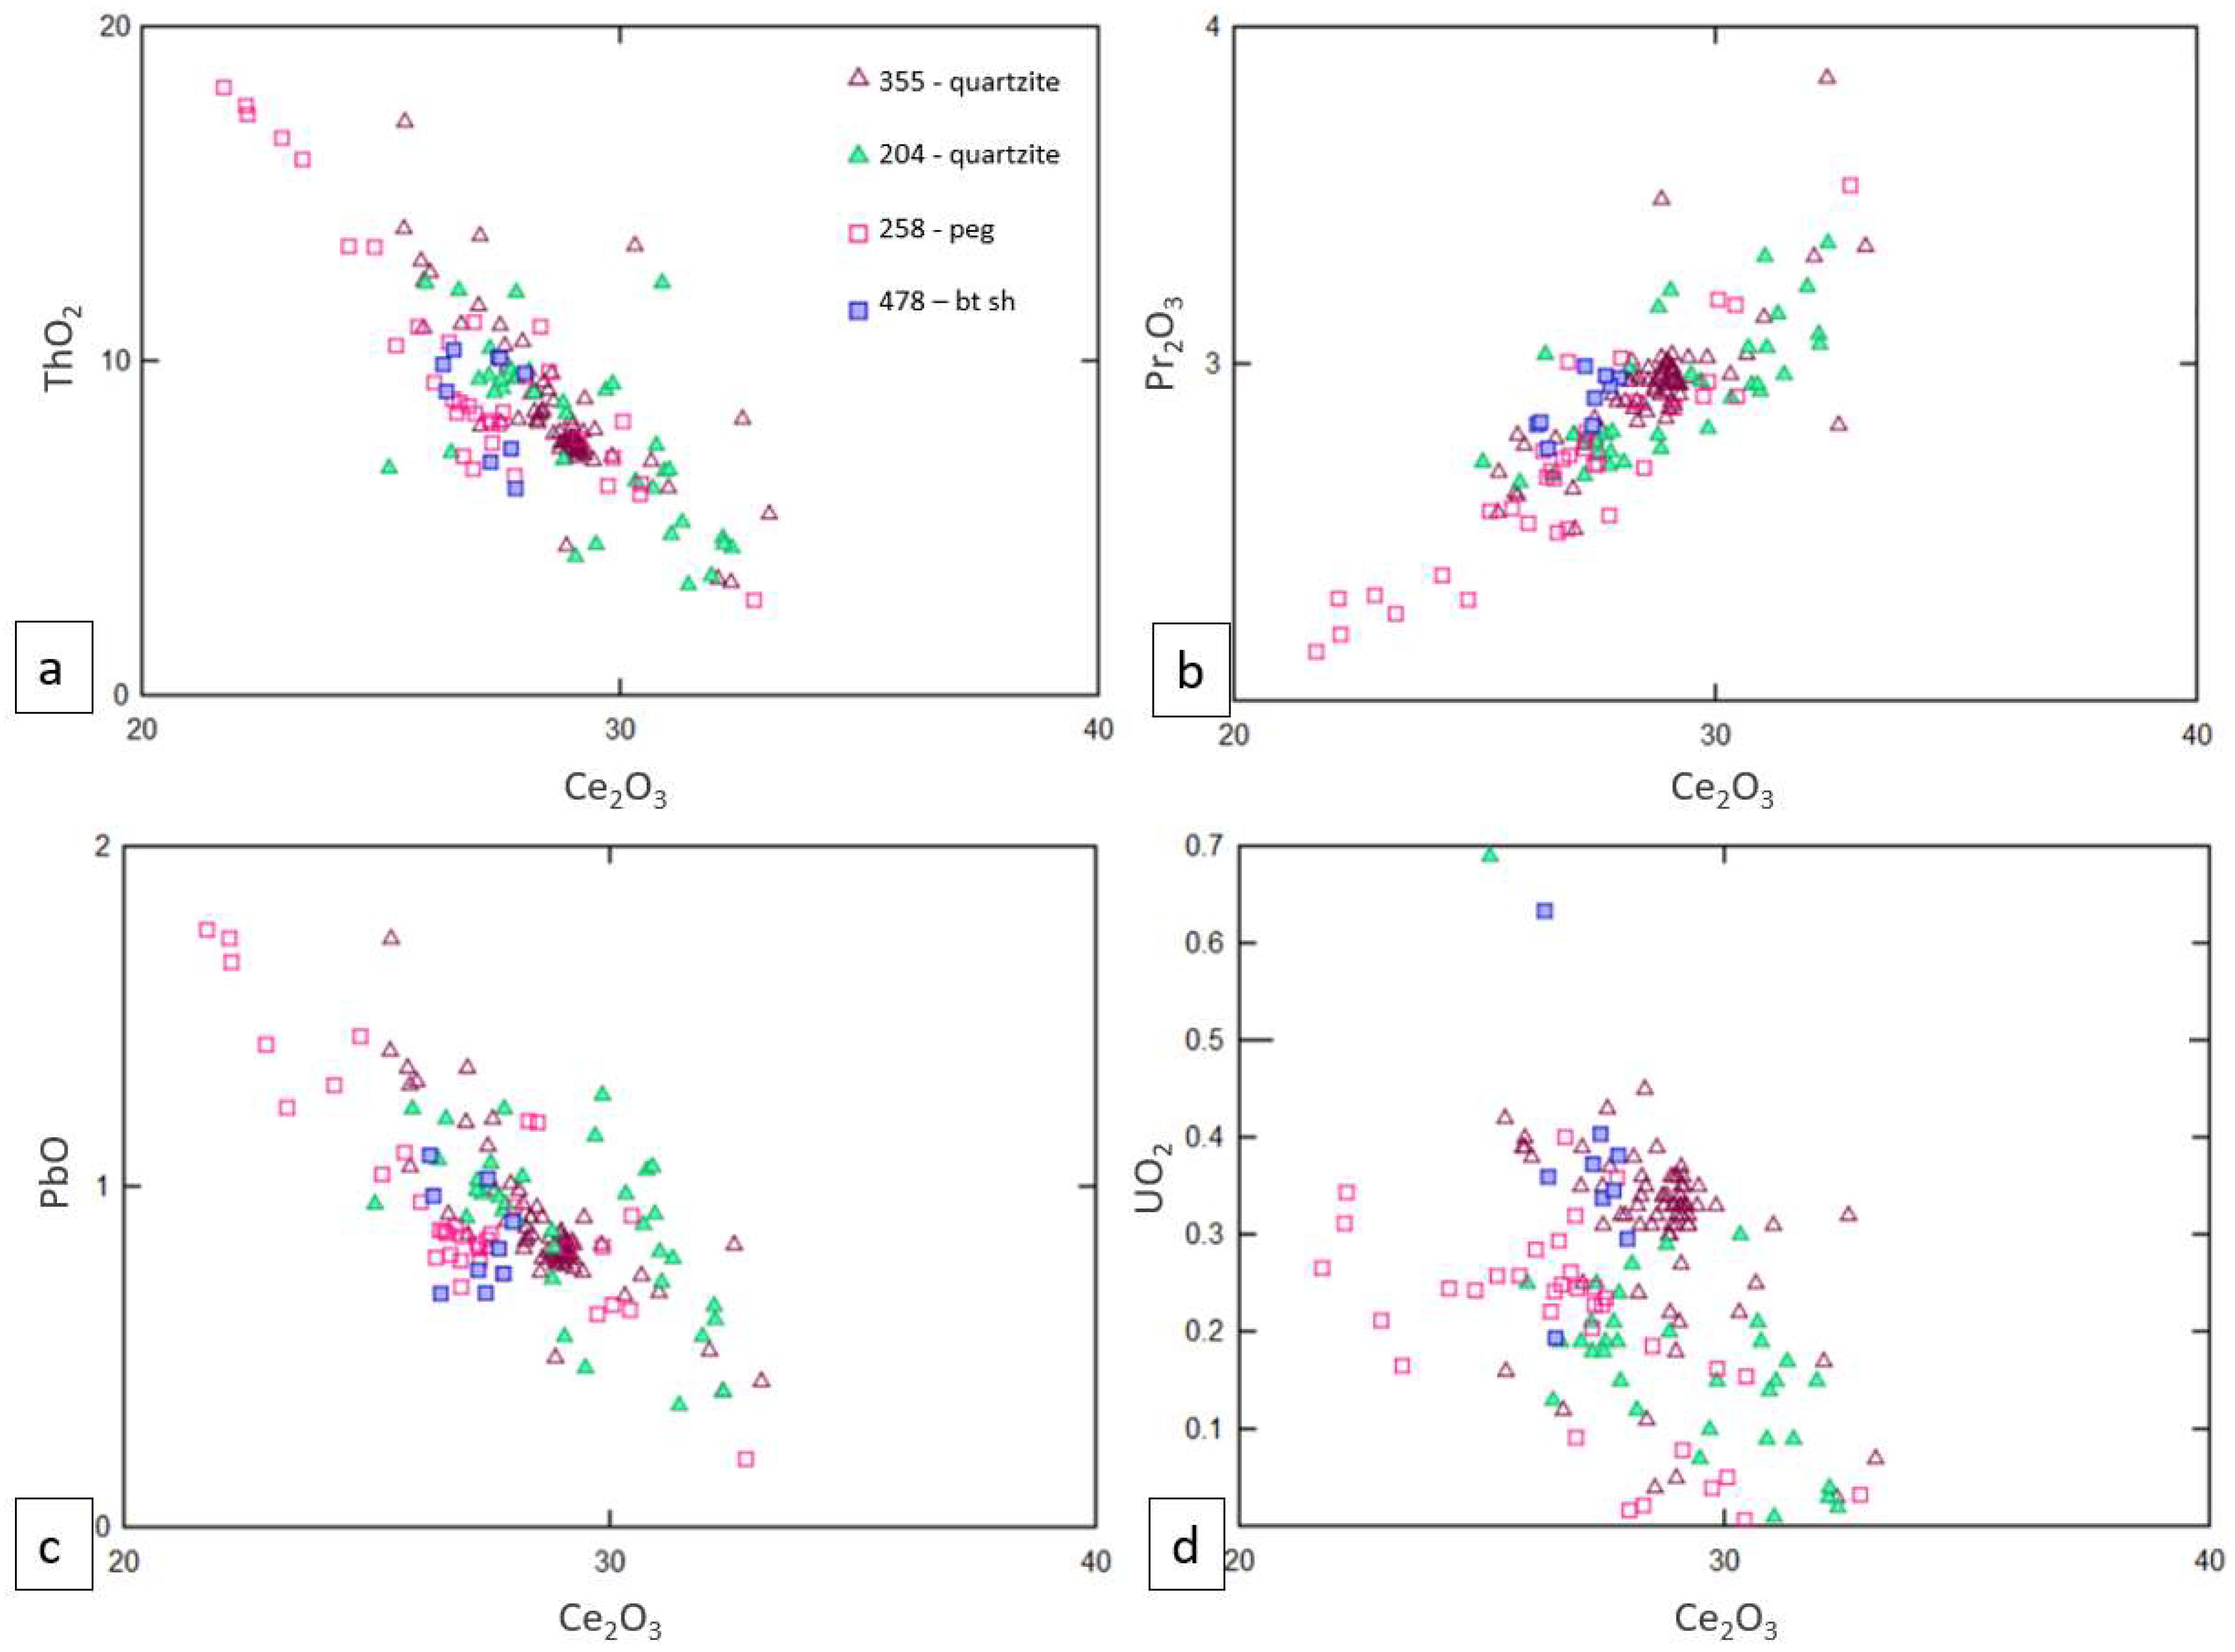
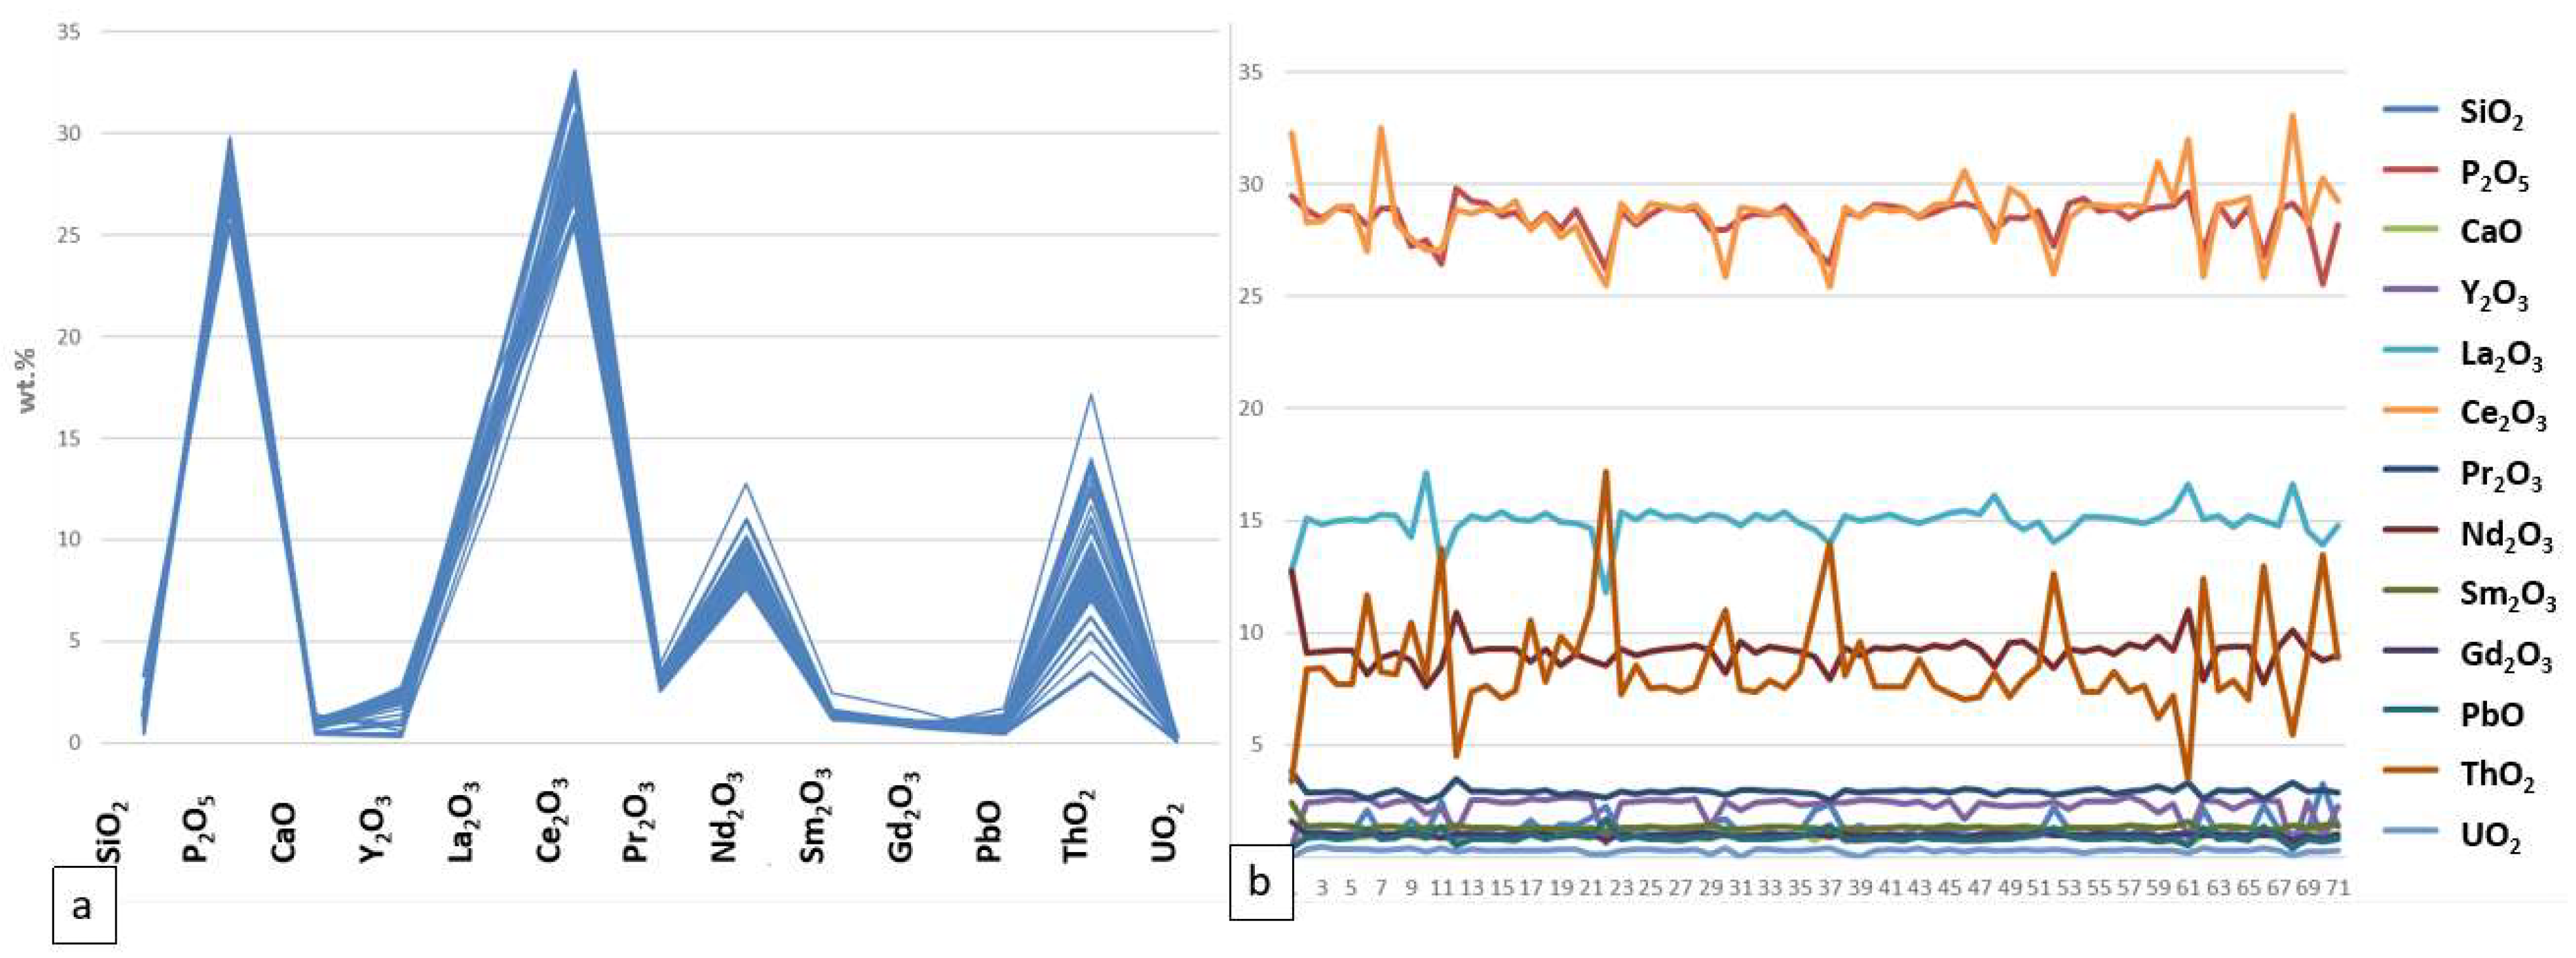
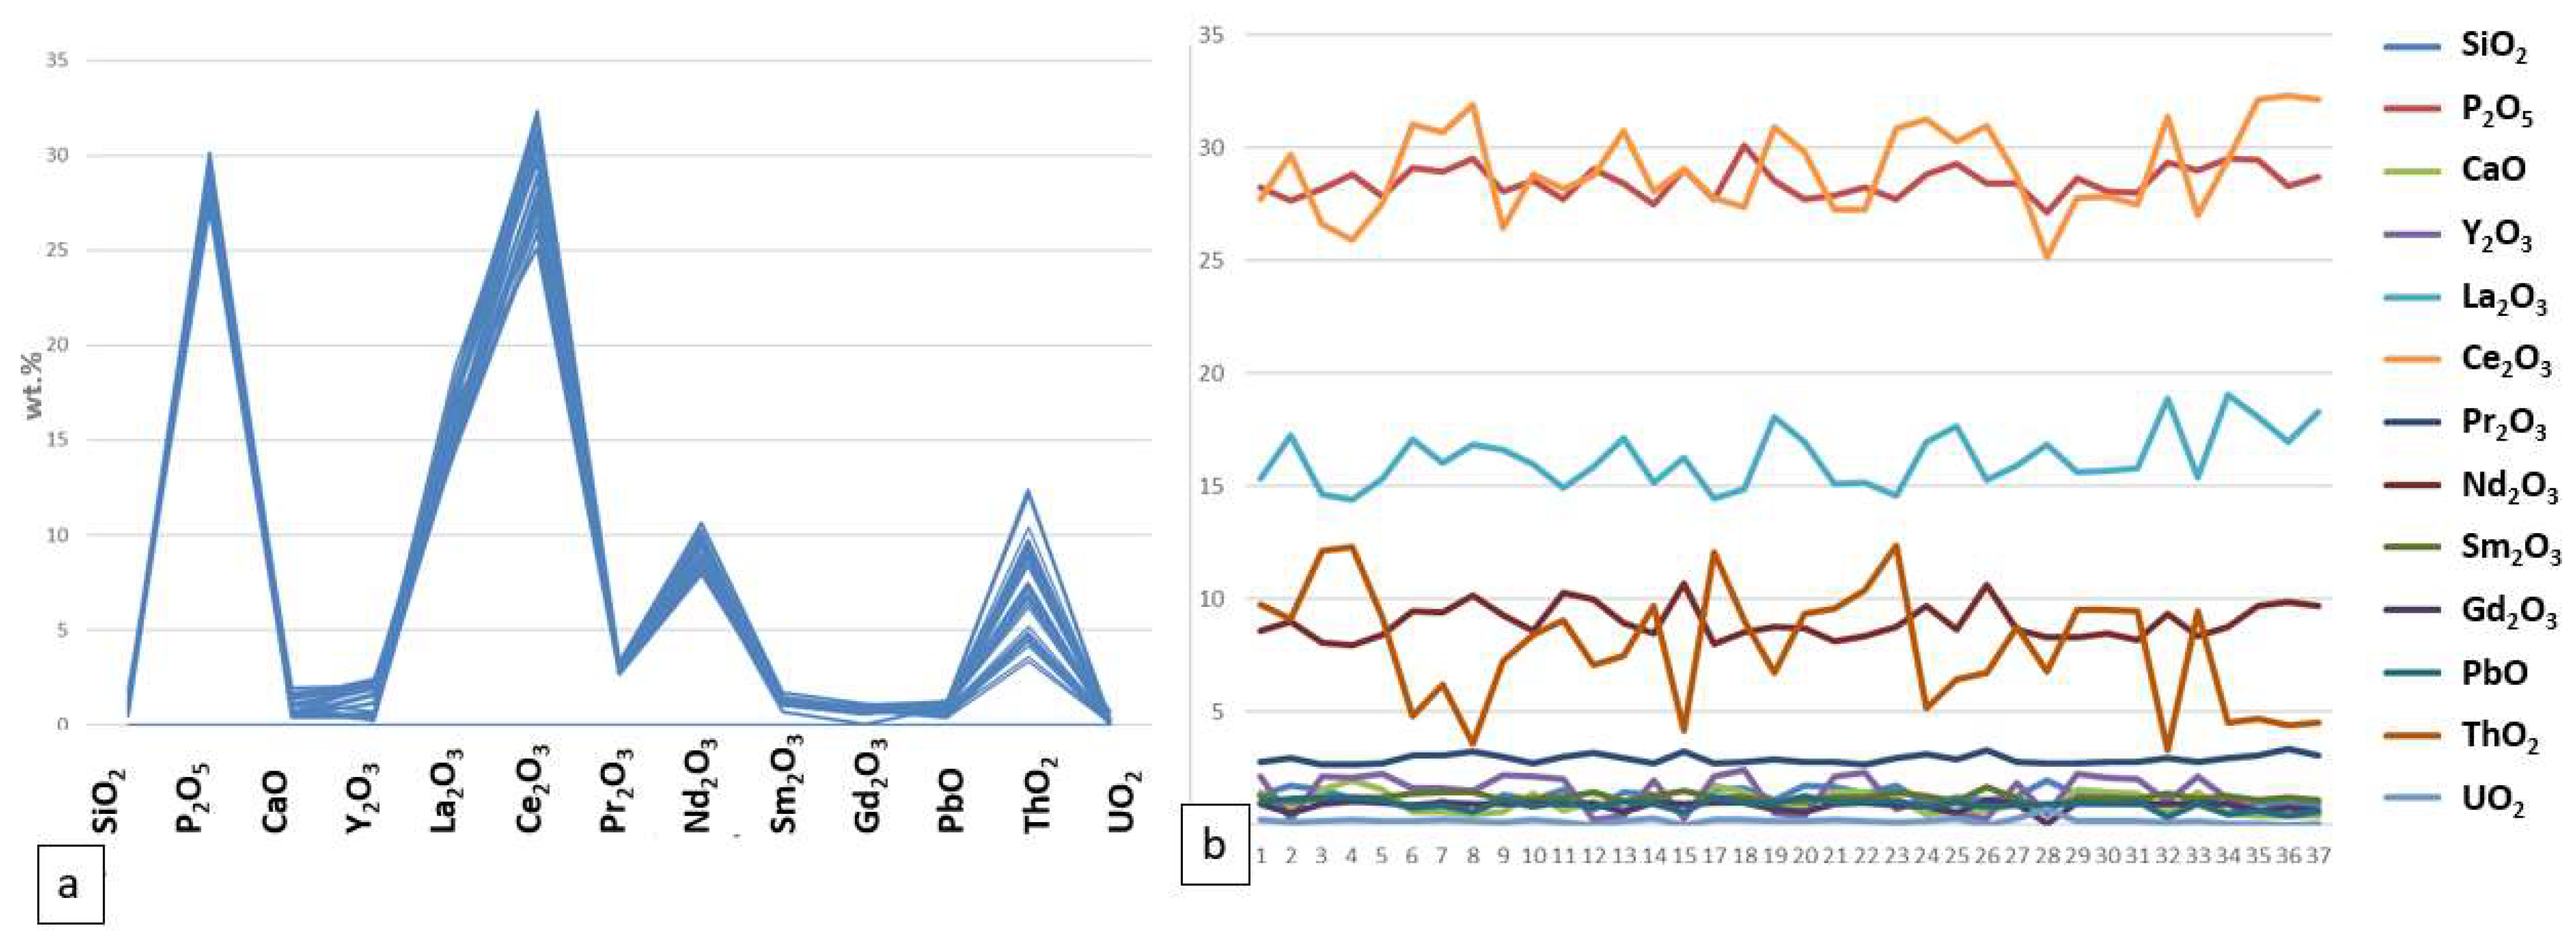
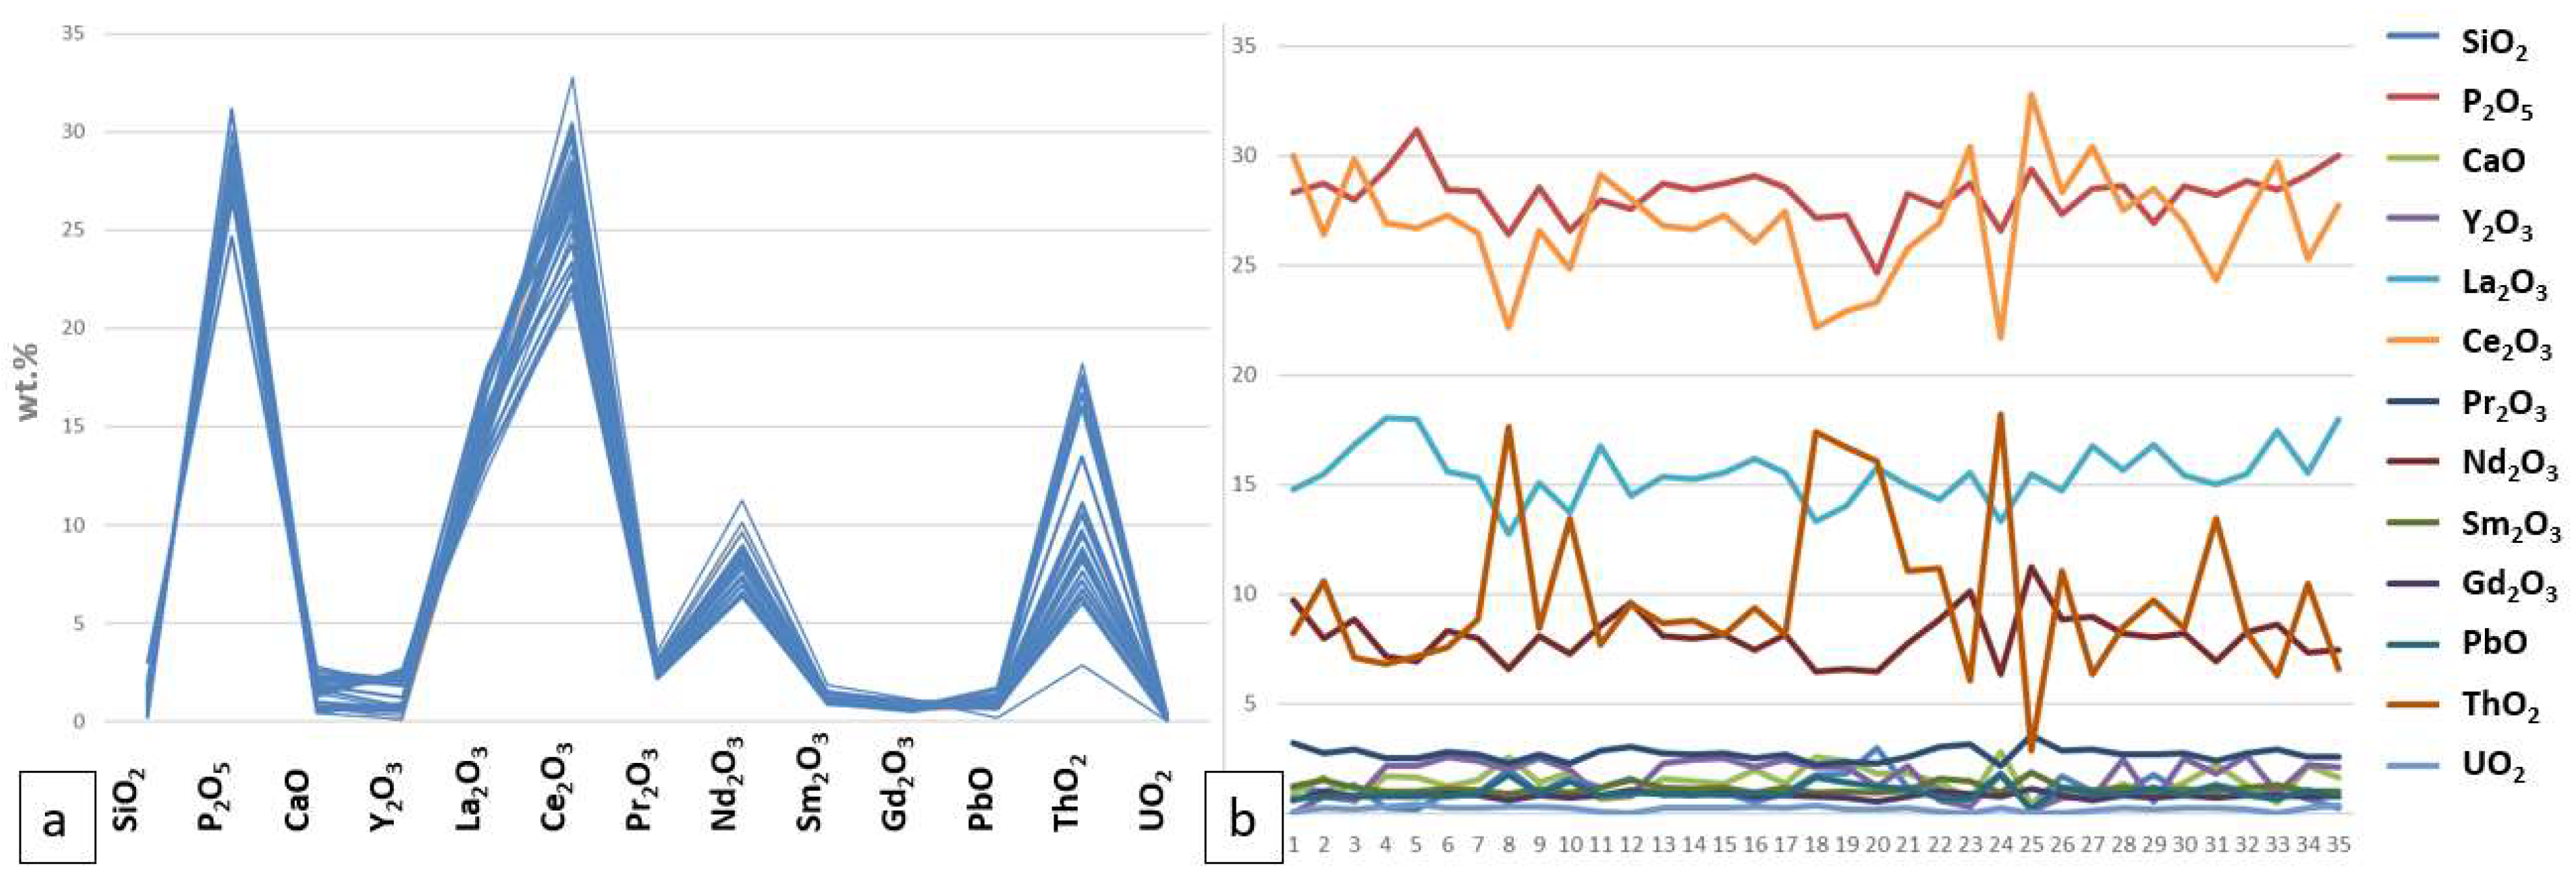
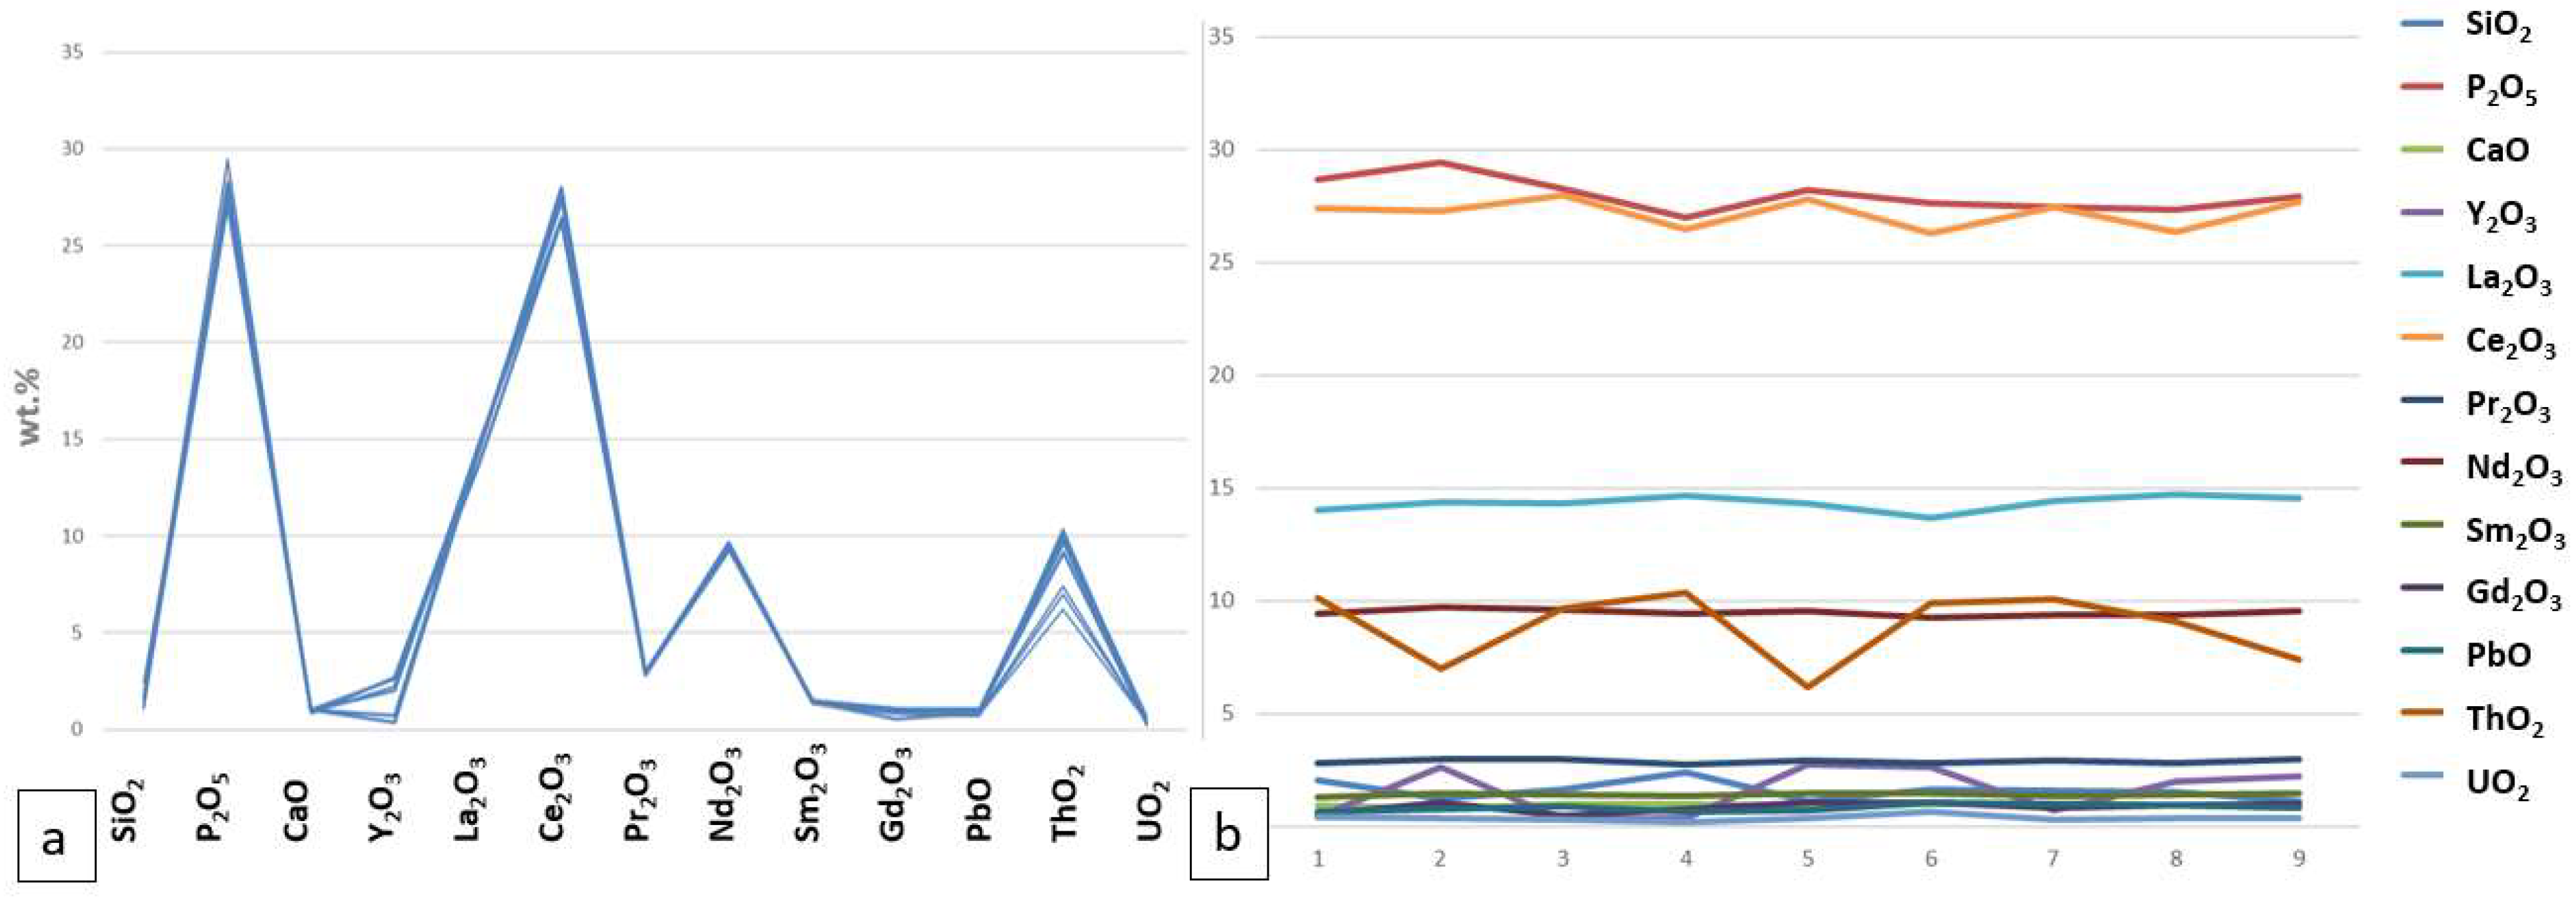
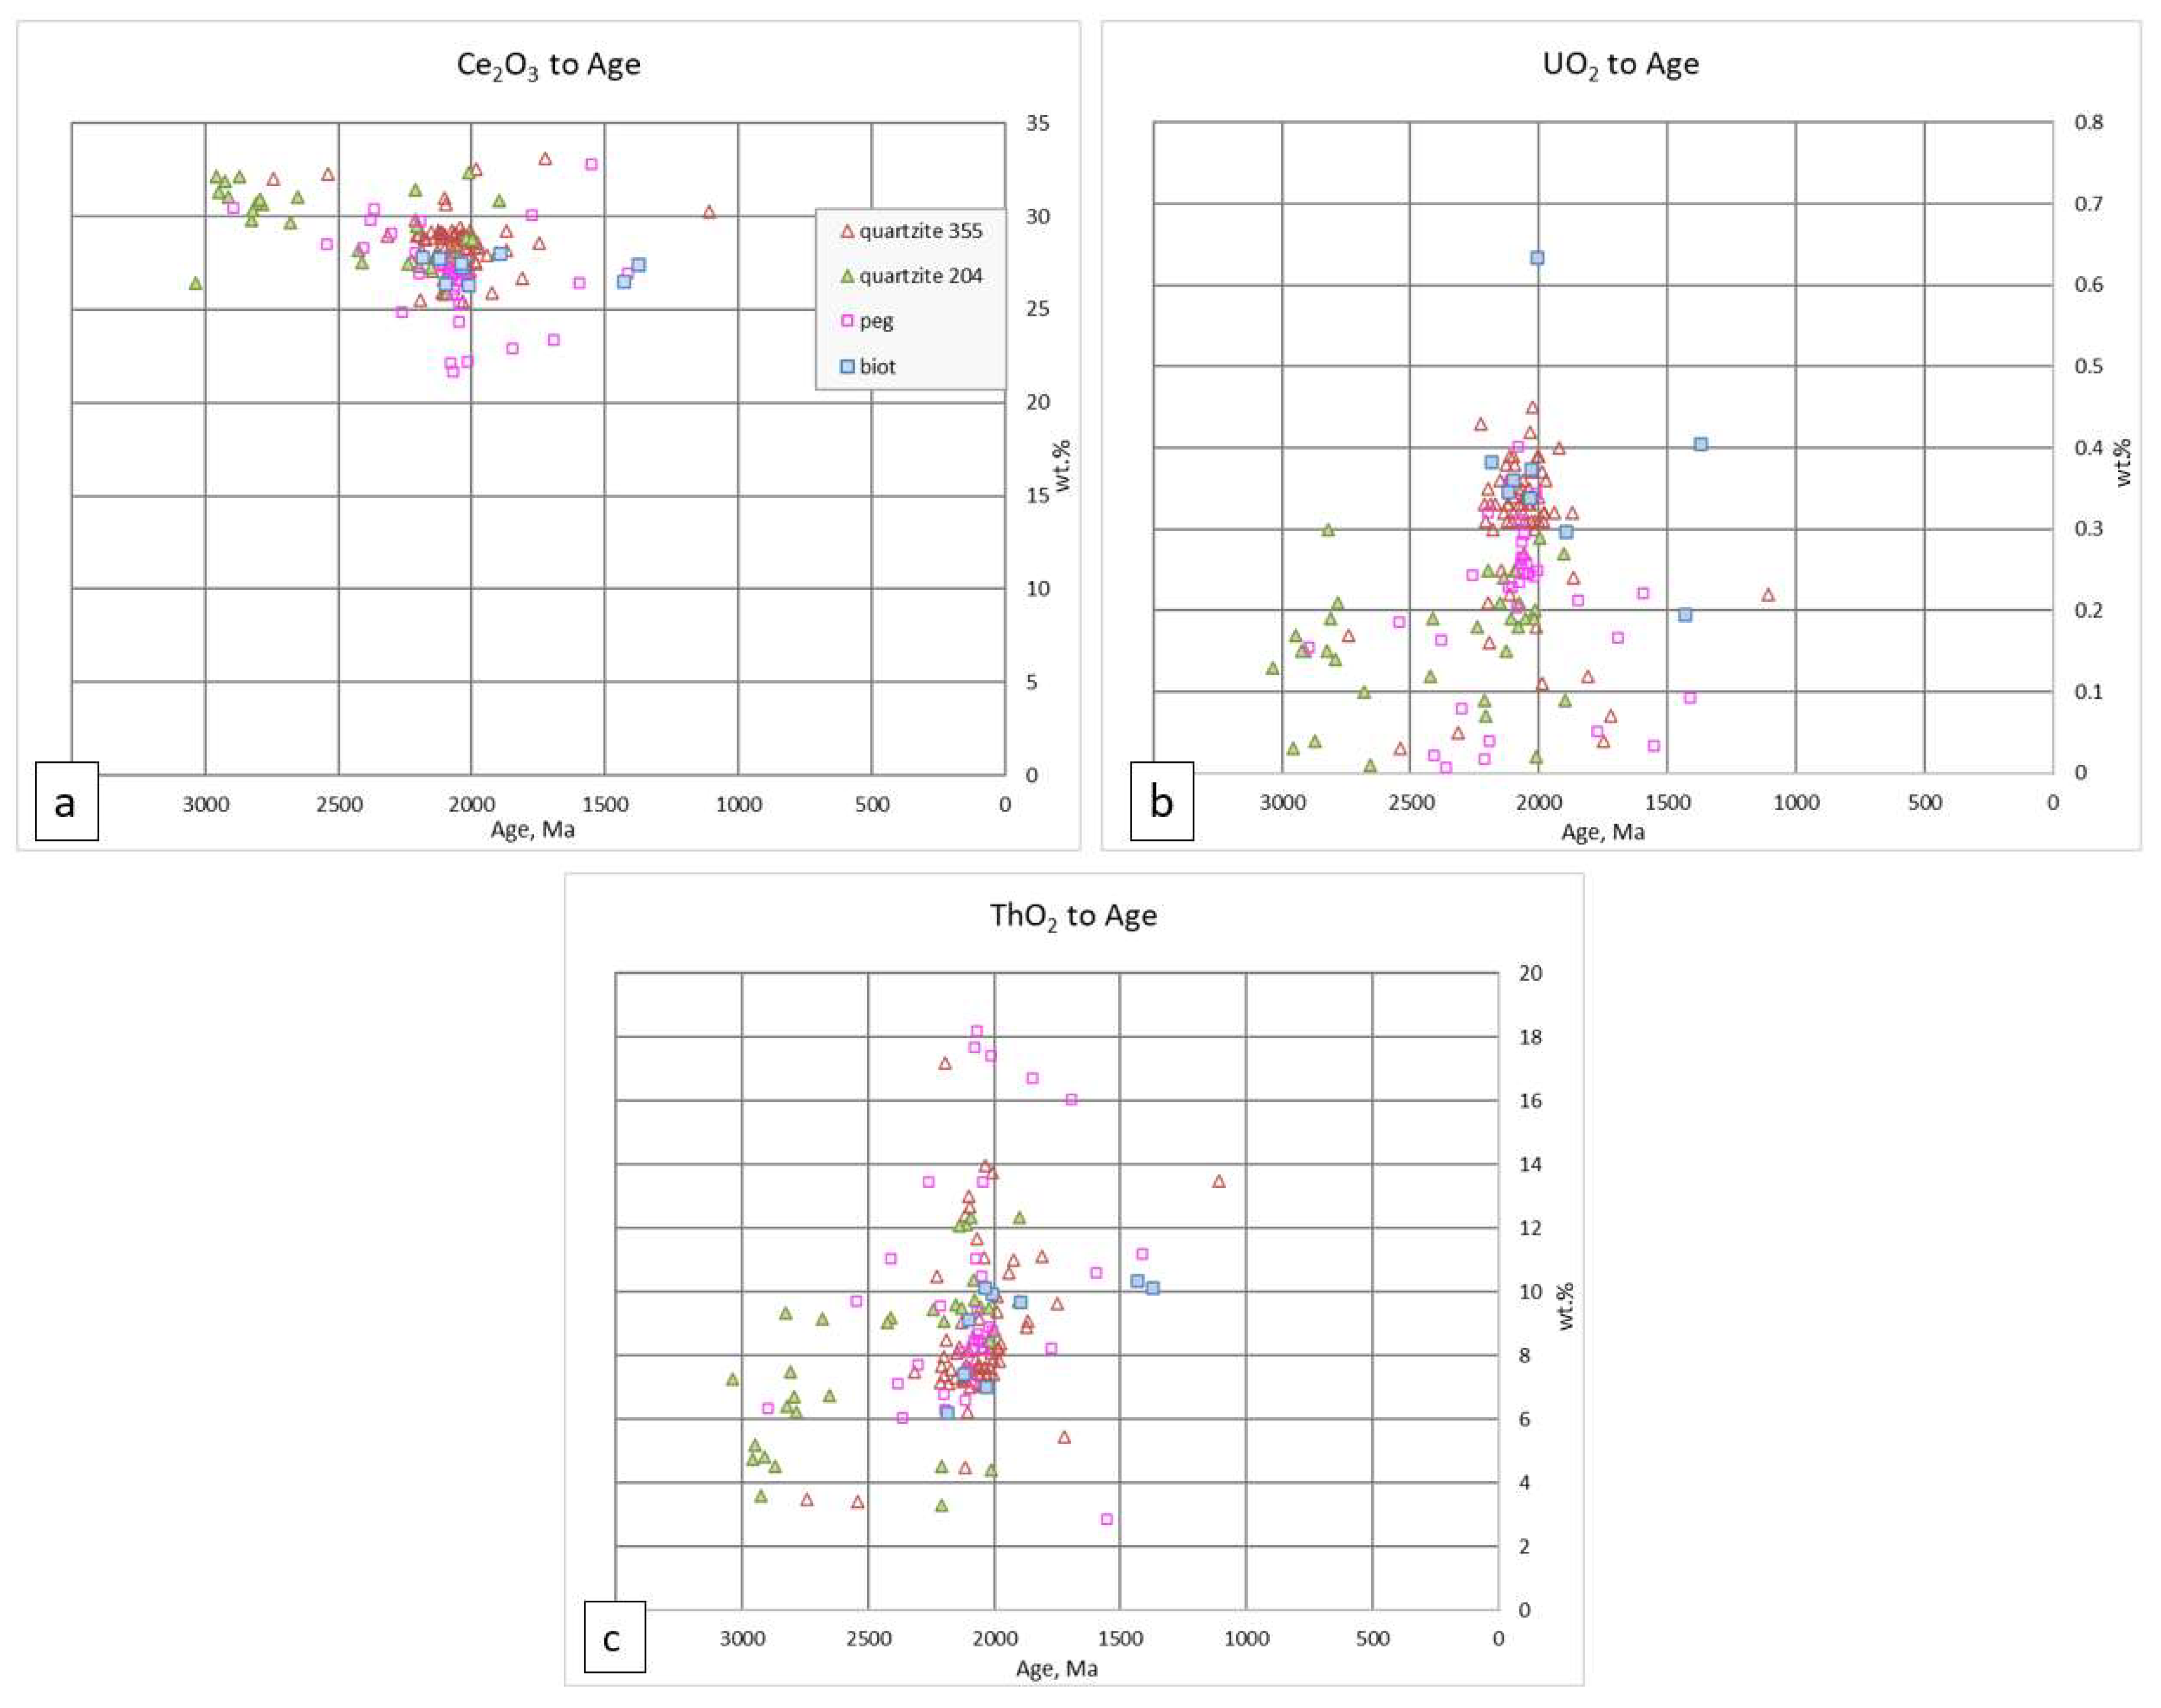
5.2. Monazite Chemistry and Characterization
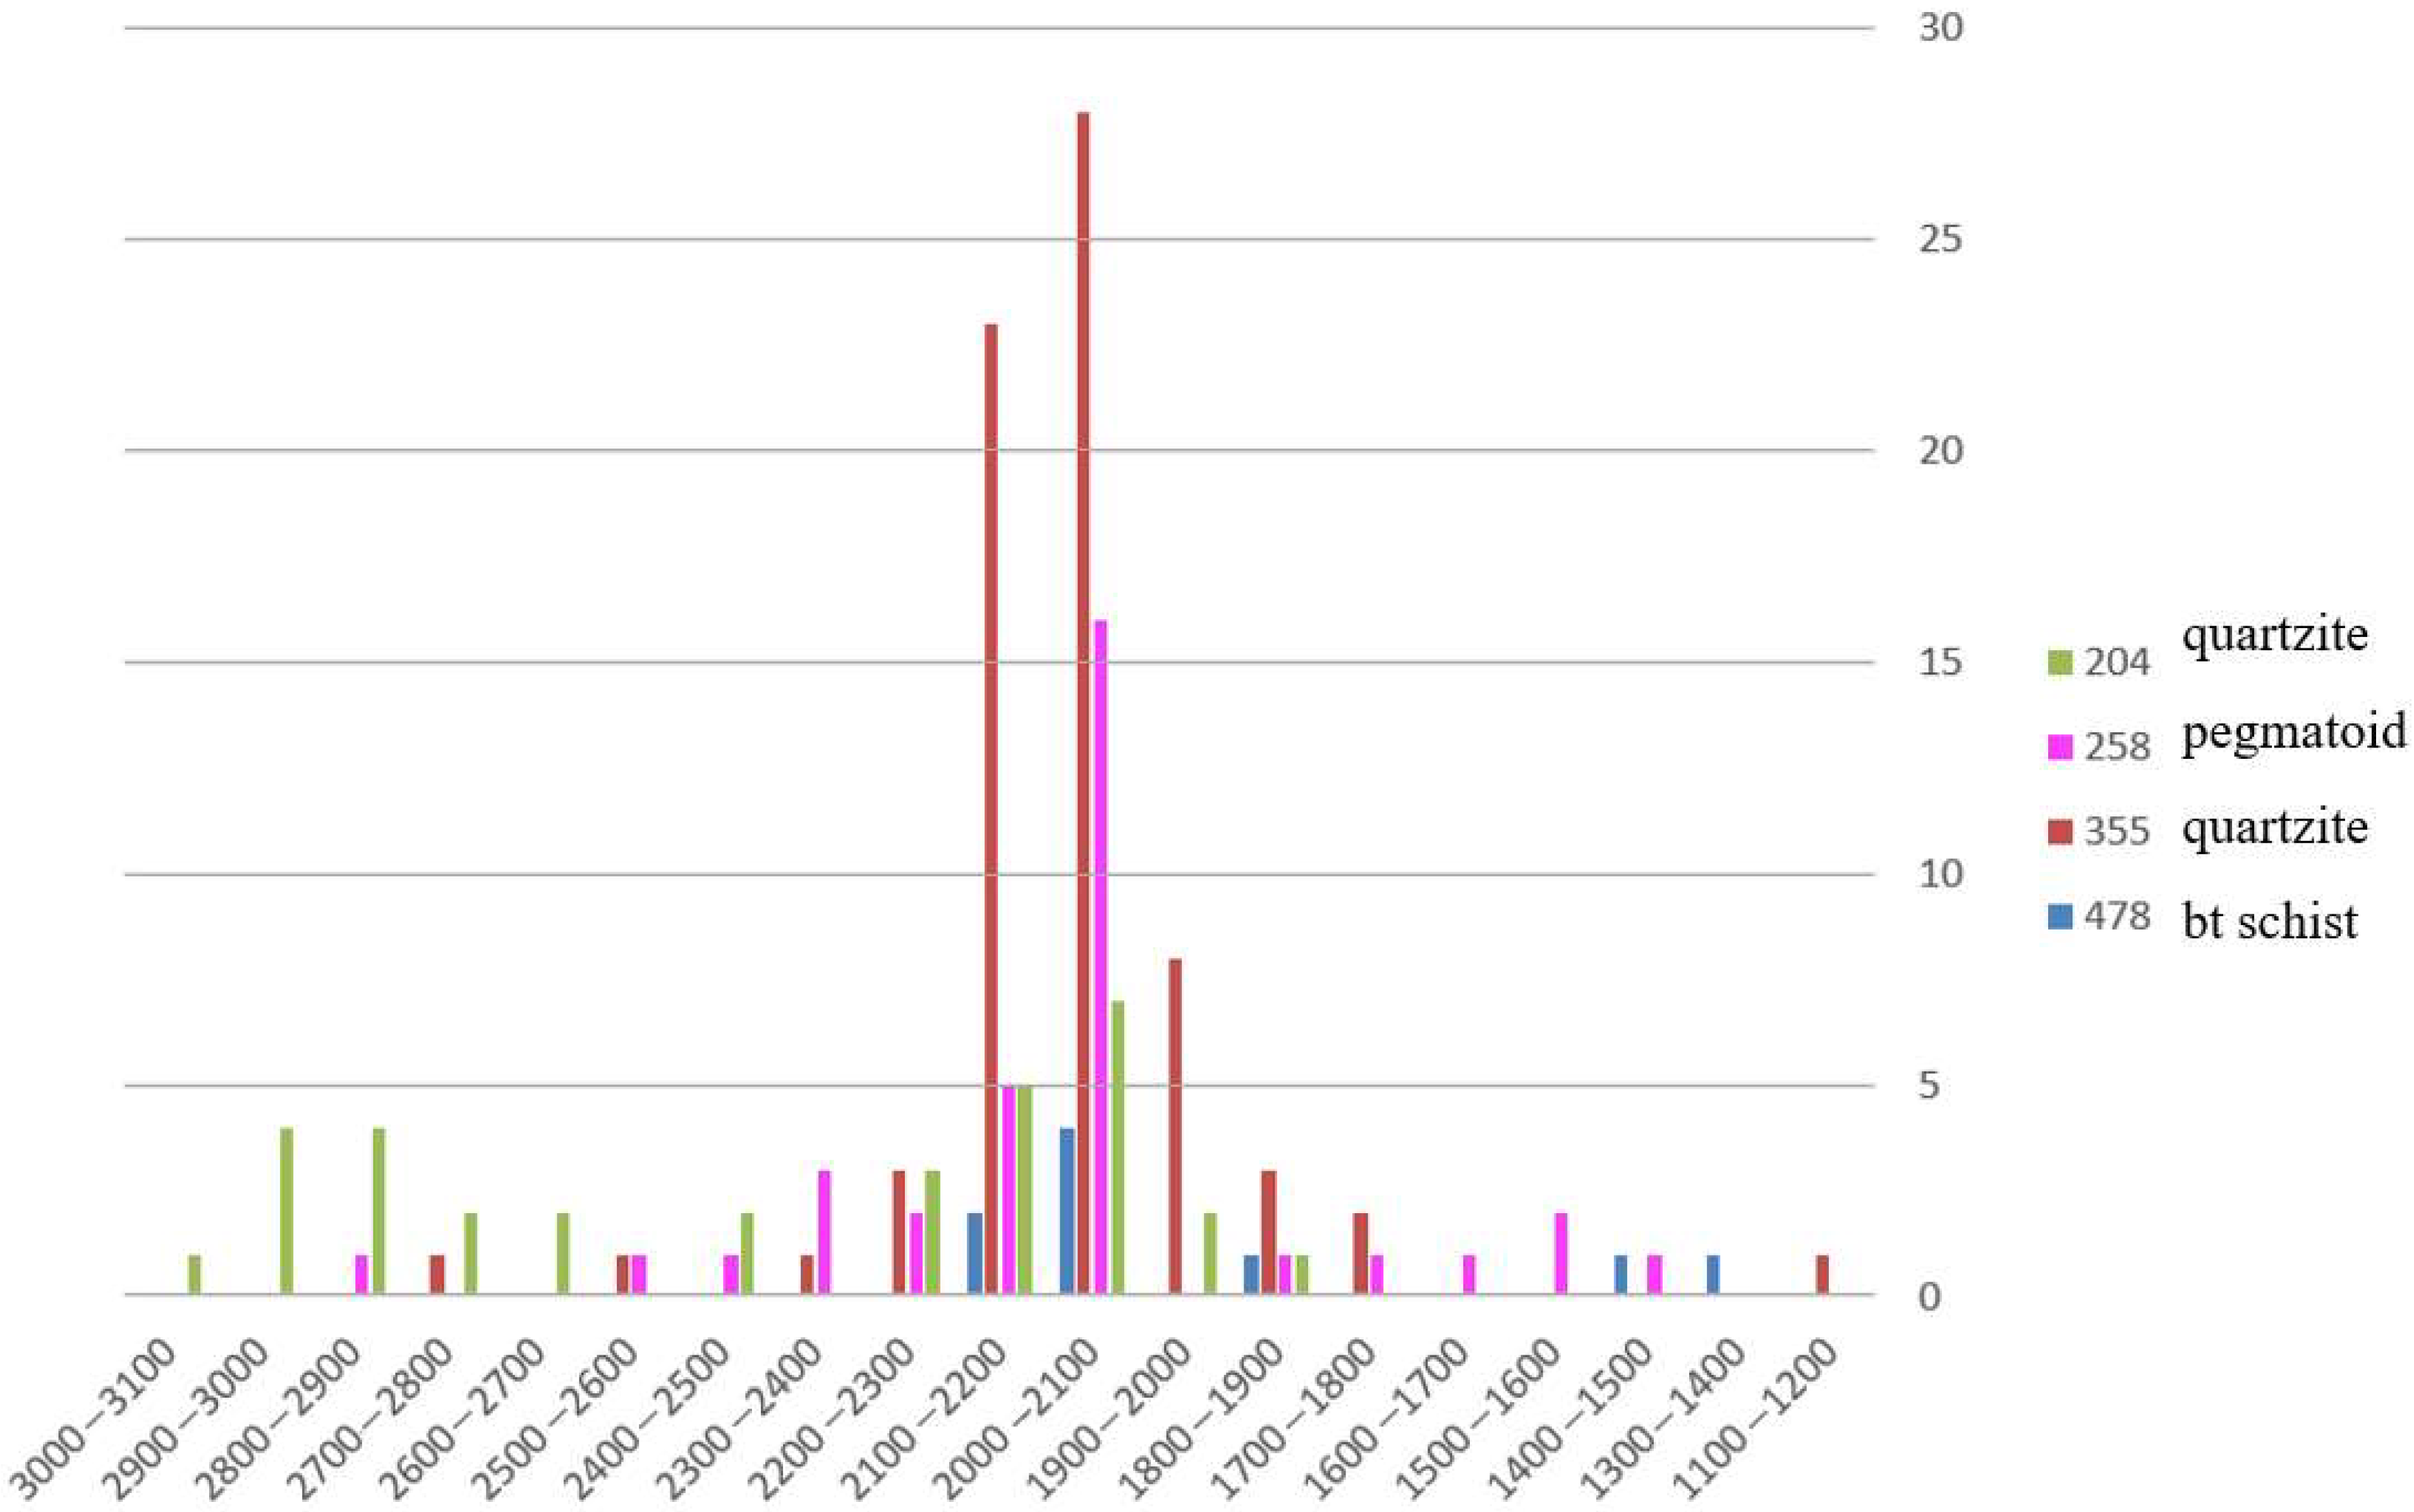
5.3. U-Th-Pb Chemical Dating
6. Discussion
6.1. The Complex Genesis of the Dibrova Mineralized Area and Hypotheses Regarding the Formation of Primary Mineralization
6.2. The Role of the Devladivska Deep Mantle-Crustal Fault Zone and Paleoproterozoic Tectonomagmatic Activation in the Formation of Mineralization
6.3. Dating of Monazite Grains to Decipher the History of Mineralization Formation
7. Conclusions
- (1)
- Two main age groups were identified for the monazite: 3.0–2.8 Ga and 2.2–2.0 Ga. An age of 3.0–2.8 Ga is proposed as the time of formation of Archean granites with the formation of primary U-Th-REE mineralization (related to erosion of granites and sediment accumulation); an age of 2.2–2.0 Ga is proposed for the remobilization and subsequent enrichment of U-Th-REE mineralization (related to tectono-magmatic activation during the Paleoproterozoic).
- (2)
- Ancient monazite cores can provide evidence of Archaean granites as a source of ore components during the formation of primary mineralization.
- (3)
- The metapsepho-psammitic structures of quartzites that we discovered may indicate their primary meta-sedimentary genesis.
- (4)
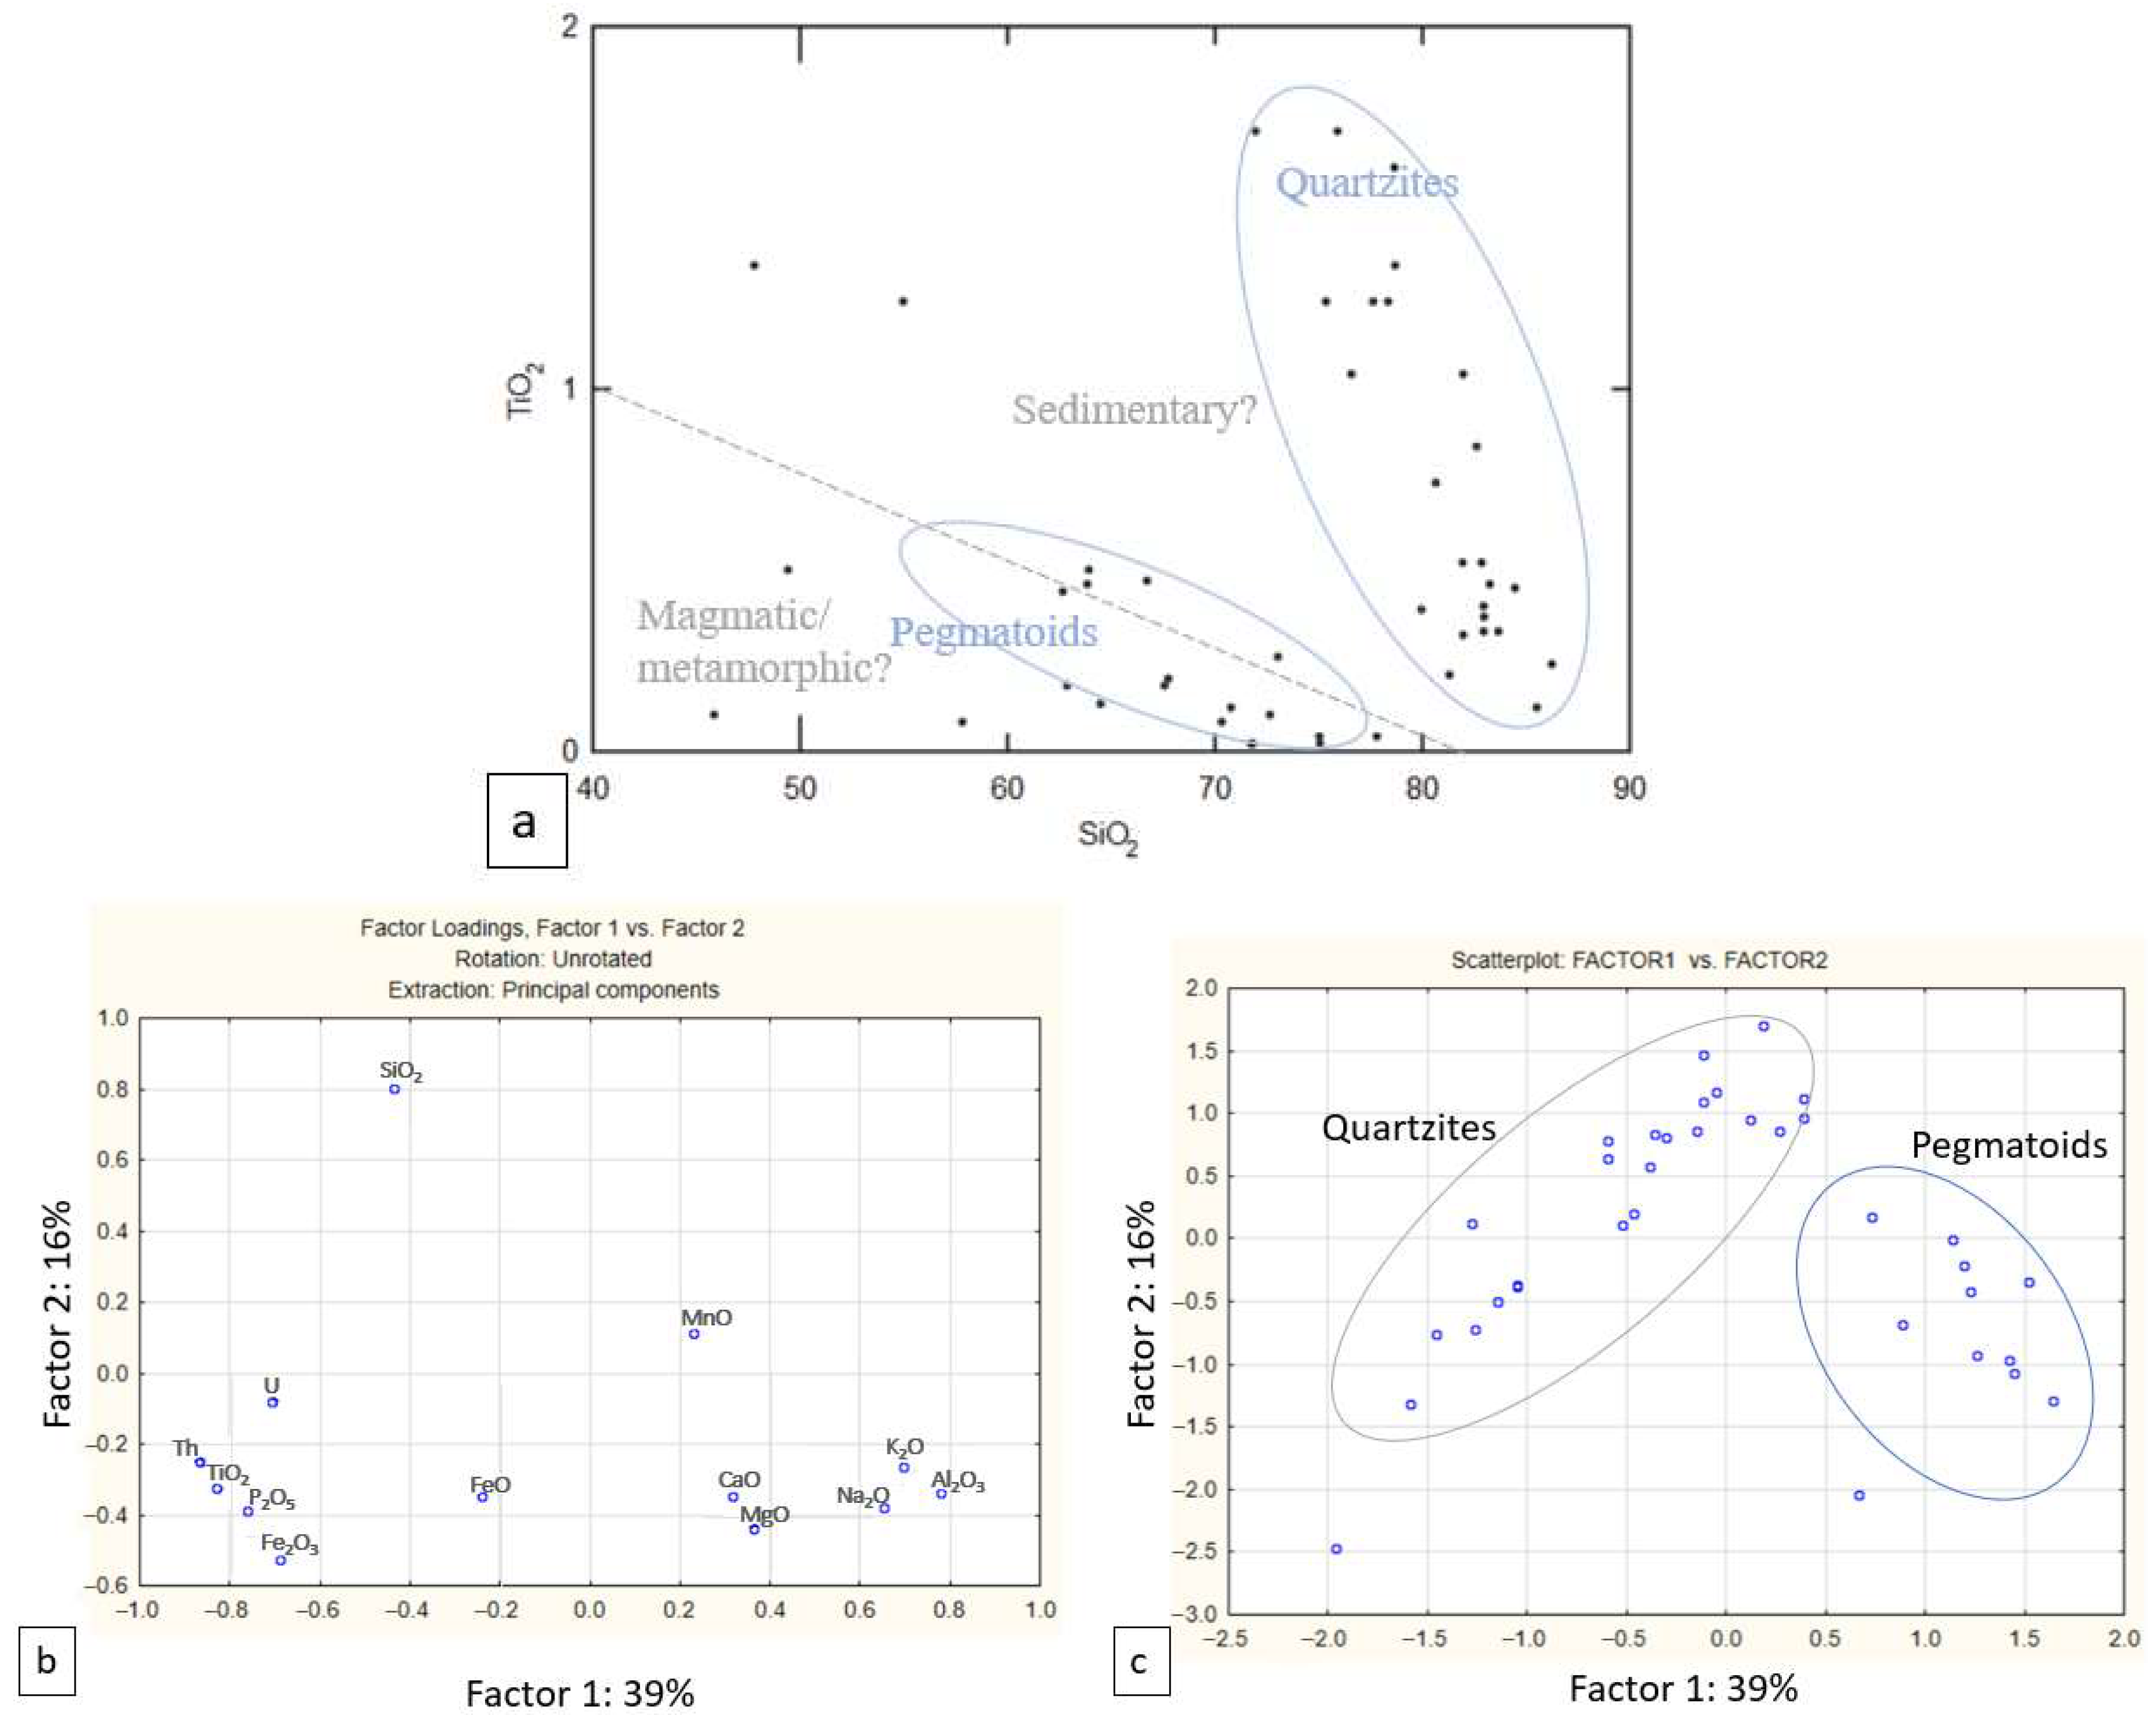
- Whole-rock geochemistry revealed two main trends in the distribution of major oxides within pegmatoid and quartzite samples, which clearly indicates a different genesis for quartzites (meta-sedimentary) and pegmatoids (magmatic/metamorphic).
- (5)
- Further research is recommended to provide a better understanding of the processes that led to the formation of the Dibrova complex mineral deposit and related analogous ones.
Supplementary Materials
Author Contributions
Funding
Data Availability Statement
Acknowledgments
Conflicts of Interest
Appendix A
Appendix A.1. Whole-Rock Geochemistry

References
- Mikhailov, V. Rare Earth Ores of the World: Geology, Resources, Economics; Kyiv University: Kyiv, Ukraine, 2010; ISBN 978-966-439-336-9. (In Russian) [Google Scholar]
- Zagnitko, V.; Mykhailov, V.; Kryvdic, S.; Sydorchuk, V. Genetic features and resources of rare metal deposits of the Ukrainian Shield. Visnyk Geol. 2017, 1, 58–65. (In Ukrainian) [Google Scholar]
- Balaram, V. Rare earth elements: A review of applications, occurrence, exploration, analysis, recycling, and environmental impact. Geosci. Front. 2019, 10, 1285–1303. [Google Scholar] [CrossRef]
- Witherly, K. Geophysical expressions of ore systems—Our current understanding. Soc. Econ. Geol. Inc. Spec. Publ. 2014, 18, 177–208. [Google Scholar]
- Goodenough, K.M.; Schilling, J.; Jonsson, E.; Kalvig, P.; Charles, N.; Tuduri, J. Europe’s rare earth element resource potential: An overview of REE metallogenetic provinces and their geodynamic setting. Ore Geol. Rev 2016, 72, 838–856. [Google Scholar] [CrossRef]
- Seamam, J. Rare Earths and China: A Review of Changing Criticality in the New Economy. Notes De L’ifri Ifri, French Institute of International Relations, January 2019. ISSN 978-2-36567-969-5. Available online: https://www.ifri.org/en/publications/notes-de-lifri/rare-earths-and-china-review-changing-criticality-new-economy (accessed on 18 July 2023).
- Kichurchak, V.M.; Bojko, A.Z.; Berzenin, B.Z. About the section of Sachkinska suite of Central-Azov series in the Northern marging of Dibrova structure (Western Azov region). Geol. J. 1991, 4, 101–107. (In Russian) [Google Scholar]
- Sukach, V.; Shpylchak, V.; Hrinchenko, O.; Bondarenko, S.; Isakov, L.; Semka, V. Dibrovske deposit - a typical representative of the complex REE-U-Th mineralization in the Azov metallogenic region of the Ukrainian Shield. Miner. Resour. Ukr. 2021, 1, 18–31. (In Ukrainian) [Google Scholar]
- Pokalyuk, V.; Verkhovtsev, V.; Mikhaylichenko, A.; Mikhaylichenko, I.; Zhylyak, E. Dibrovskoe Uranium-Thorium-Rare Earth Ore Occurrence of the Ukrainian Shield (Lithostratigraphic Criteria for the Genesis and Localization of Ore Bodies). Geochem. Technog. 2019, 1, 57–72. (In Russian) [Google Scholar] [CrossRef]
- Kramar, O.; Wozniak, D.; Nozhenko, O. Peculiarity of the formation and localization rare-earth and uranium-thorium Dibrovske deposit of the Ukrainian Shield. In Prospects for the Development of Uranium Resource Base of Nuclear Power of Ukraine; Naukova Dumka: Kyiv, Ukraine, 2014; pp. 126–148. (In Ukrainian) [Google Scholar]
- Lysenko, A.; Zykov, E.; Falkovich, A.; Kulbachnyi, A. Dibrovskoe rare-earth-thorium-uranium deposit within the Ukrainian Shield. In Proceedings of the Features of the Development of Uranium Mineral Resources of Ukraine, Its Mining and Enrichment Conference, Kiev, Ukraine, 15–17 September 2009; pp. 83–86. (In Russian). [Google Scholar]
- Kramar, O. New genetic types of uranium and uranium-thorium mineralization within the Ingul and Azov Megablocks of the Ukrainian Shield. In Strategic Mineral Resources of Ukraine for Nuclear Energy; Kulish, E., Ed.; Logos: Kyiv, Ukraine, 2010; pp. 232–267. ISBN 978-966-171-403-7. (In Russian) [Google Scholar]
- Semka, V.; Ponomarenko, A.; Bondarenko, S.; Donskoy, N.; Shumlyansky, L.; Melnikova, E.; Semka, L. The Dibrova rare earth-uranium-thorium deposit in the Azov megablock of the Ukrainian Shield. Geochem. Ore Form. 2010, 28, 48–76. (In Russian) [Google Scholar]
- Kalashnik, A.A.; Kuzmin, A.V. Geologicval and structural features of TR-U-Th Dibrovske occurrence of the Ukrainian Shield. Sci. Pap. Sci. Cent. Min. Geol. Geoecol. Infrastructure Dev. Natl. Acad. Sci. Ukr. 2012, 10, 173–185. (In Russian) [Google Scholar]
- Osmachko, L. Tectonic conditions of the formation of ore-bearing structures of the Azov Megablock of the Ukrainian Shield (with the example of Dibrovska structure). Geophys. J. 2016, 38, 113–122. (In Ukrainian) [Google Scholar]
- Kramar, O.O.; Kulibaba, V.M. Dibrova Uranium deposit in Azov megablock. Structure, petrology, localization, and genesis. Collect. Sci. Pap. Inst. Environ. Geochem. Natl. Acad. Sci. Ukr. 2008, 16, 37–50. (In Ukrainian) [Google Scholar]
- Vozniak, D.K.; Kramar, O.O.; Bielskyi, V.M. New features of the U-Th-REE genesis of Dibrovske deposit in the Pre-Azov megablock. Collect. Sci. Pap. Inst. Environ. Geochem. Natl. Acad. Sci. Ukr. 2012, 20, 125–129. (In Ukrainian) [Google Scholar]
- Shumlyanskyy, V.O. Thorium mineral resources in Ukraine. In Institute of Fundamental Research. Scientific Works of the Institute of Fundamental Research; Shumlyanskyy, L.V., Ed.; Logos: Kyiv, Ukraine, 2007; ISBN 978-966-581-959-2. (In Russian) [Google Scholar]
- Pigulevskyi, P.; Kostenko, N.; Shabatura, O. The Azov Megablock of the Ukrainian Shield: Tectonics and Substance-Petrophysical Characteristics of Granitoids; Kyiv University: Kyiv, Ukraine, 2021. (In Ukainian) [Google Scholar]
- Semka, V.; Bondarenko, S.; Stepanyk, L.; Grinchenko, O. Mineralogical -geochemical features and age of thorium-uranium mineralization in Precambrian of the Ukrainian Shield. Visnyk Taras Shevchenko Natl. Univ. Kyiv Geol. 2011, 55, 24–26. (In Ukrainian) [Google Scholar]
- Verkhovtsev, V.; Yuskiv, Y.; Krason, E. Neotectonics of the territory of Dibrovske uranium-rare earth-thorium deposit. Collect. Sci. Pap. Inst. Environ. Geochem. Natl. Acad. Sci.Ukr. 2016, 26, 156–163. (In Ukrainian) [Google Scholar]
- Schulz, B. Monazite Microstructures and Their Interpretation in Petrochronology. Front. Earth Sci. 2021, 9, 668566:1–668566:22. [Google Scholar] [CrossRef]
- Suzuki, K.; Adachi, M. Precambrian provenance and Silurian metamorphism of the Tsubonosawa paragneiss in the South Kitakami terrane, Northeast Japan, revealed by the chemical Th-U-total Pb isochron ages of monazite, zircon and xenotime. Geochem. J. 1991, 25, 357–376. [Google Scholar] [CrossRef]
- Montel, J.-M.; Foret, S.; Veschambre, M.; Nicoll, C.; Provost, A. Electron microprobe dating of monazite. Chem. Geol. 1996, 131, 37–53. [Google Scholar]
- Konečný, P.; Kusiak, M.A.; Dunkley, D.J. Improving U-Th-Pb electron microprobe dating using monazite age references. Chem. Geol. 2018, 484, 22–35. [Google Scholar] [CrossRef]
- Williams, M.L.; Jercinovic, M.J.; Terry, M.P. Age mapping and dating of monazite on the electron microprobe: Deconvoluting multistage tectonic histories. Geology 1999, 27, 1023–1026. [Google Scholar] [CrossRef]
- Williams, M.L.; Jercinovic, M.J.; Mahan, K.H.; Dumond, G. Electron Microprobe Petrochronology. Rev. Mineral. Geochem. 2017, 83, 153–182. [Google Scholar] [CrossRef]
- McKechnie, C.L.; Annesley, I.R.; Ansdell, K.M. Radioactive abyssal granitic pegmatites and leucogranites in the Wollaston domain, Northern Saskatchewan, Canada: Mineral compositions and conditions of emplacement in the Fraser Lake area. Can. Mineral 2012, 50, 1637–1667. [Google Scholar] [CrossRef]
- Suzuki, K.; Kato, T. CHIME dating of monazite, xenotime, zircon and polycrase: Protocol, pitfalls and chemical criterion of possibly discordant age data. Gondwana Res. 2008, 14, 569–586. [Google Scholar] [CrossRef]
- Săbău, G. Chemical U-Th-Pb geochronology: A precise explicit approximation of the age equation and associated errors. Geochronometria 2012, 39, 167–179. [Google Scholar] [CrossRef]
- Steele, D.A. Mineral dating using the EPMA: Trials and tribulations. In Proceedings of the Seventh Biennial Symposium. Extended Abstracts, Melbourne, Australia, 18–20 February 2003; p. 78. [Google Scholar]
- Bowles, J.F. Age Dating from Electron Microprobe Analyses of U, Th, and Pb: Geological Advantages and Analytical Difficulties. Micsc Microanal 2015, 21, 1114–1122. [Google Scholar] [CrossRef] [PubMed]
- Li, Z.; Chiro, G.; Bethune, K.M.; Eldursi, K.; Quirt, D.; Ledru, P.; Gudmundson, G. Numerical simulation of strain localization and its relationship to formation of the Sue unconformity-related uranium deposits, eastern Athabasca Basin, Canada. Ore Geol. Rev. 2018, 101, 17–31. [Google Scholar] [CrossRef]
- Kalashnik, G. The Role of Juvenile Sources of Ore Components in Uranium Ore Genesis of Pryazovye. Visnyk Taras Shevchenko Natl. Univ. Kyiv Geol. 2011, 55, 53–56. Available online: http://nbuv.gov.ua/UJRN/VKNU_geol_2011_55_18 (accessed on 22 September 2023). (In Ukrainian).
- Werner, C.D. Saxonian granulites: A contribution to the geochemical diagnosis of original rocks in high-metamorphic complexes. Gerlands Beitraege zur Geophys. 1987, 96, 271–290. [Google Scholar]


| Age | Complex/ Structure | Represented by | Thickness | Mineralization |
|---|---|---|---|---|
| AR | Plagiomigmatites and plagiogranite-gneiss | Shevchenkivskyi, Remivskyi granitoid complexes | ||
| PR? | Dibrova structure | Lower tier: metapsepho-psammitic quartzites, metaconglomerates | 90–320 m | U-Th-REE Dibrova mineralization |
| Middle tier: ferruginous quartzites | 150–210 m | |||
| Upper tier: gneissic rocks | 150–500 m |
| Oxide, wt.% | Min | Max | Average 355 (Quartzite) N = 71 | Average 204 (Quartzite) N = 36 | Average 258 (Pegmatoid) N = 35 | Average 478 (Biotite Schist) N = 9 |
|---|---|---|---|---|---|---|
| SiO2 | 0.20 | 3.28 | 1.28 | 1.21 | 1.14 | 1.59 |
| P2O5 | 24.64 | 31.16 | 28.46 | 28.48 | 28.22 | 28.00 |
| CaO | 0.39 | 2.82 | 0.92 | 0.97 | 1.46 | 0.94 |
| Y2O3 | 0.00 | 2.74 | 2.27 | 1.41 | 1.65 | 1.56 |
| La2O3 | 11.83 | 19.05 | 14.99 | 16.22 | 15.49 | 14.35 |
| Ce2O3 | 14.31 | 33.10 | 28.67 | 28.67 | 26.88 | 27.20 |
| Pr2O3 | 2.15 | 3.85 | 2.93 | 2.91 | 2.69 | 2.89 |
| Nd2O3 | 6.33 | 12.77 | 9.19 | 8.97 | 8.04 | 9.49 |
| Sm2O3 | 0.71 | 2.46 | 1.34 | 1.22 | 1.14 | 1.42 |
| Gd2O3 | 0.06 | 1.59 | 1.00 | 0.85 | 0.80 | 0.87 |
| PbO | 0.20 | 1.76 | 0.88 | 0.90 | 0.97 | 0.85 |
| ThO2 | 2.86 | 18.20 | 8.53 | 7.91 | 9.85 | 8.88 |
| UO2 | 0.00 | 0.69 | 0.30 | 0.17 | 0.20 | 0.37 |
| Age Range, Ma | Quartzite 204, Count | Pegmatoid 258, Count | Quartzite 355, Count | Biotite Schist 478, Count | Grand Total |
|---|---|---|---|---|---|
| 1100–1200 | 1 | 1 | |||
| 1200–1300 | 0 | ||||
| 1300–1400 | 1 | 1 | |||
| 1400–1500 | 1 | 1 | 2 | ||
| 1500–1600 | 2 | 2 | |||
| 1600–1700 | 1 | 1 | |||
| 1700–1800 | 1 | 2 | 3 | ||
| 1800–1900 | 1 | 1 | 3 | 1 | 6 |
| 1900–2000 | 2 | 8 | 10 | ||
| 2000–2100 | 7 | 16 | 28 | 4 | 55 |
| 2100–2200 | 5 | 5 | 23 | 2 | 35 |
| 2200–2300 | 3 | 2 | 3 | 8 | |
| 2300–2400 | 3 | 1 | 4 | ||
| 2400–2500 | 2 | 1 | 3 | ||
| 2500–2600 | 1 | 1 | 2 | ||
| 2600–2700 | 2 | 2 | |||
| 2700–2800 | 2 | 1 | 3 | ||
| 2800–2900 | 4 | 1 | 5 | ||
| 2900–3000 | 4 | 4 | |||
| 3000–3100 | 1 | 1 | |||
| Total | 33 | 35 | 71 | 9 | 148 |
Disclaimer/Publisher’s Note: The statements, opinions and data contained in all publications are solely those of the individual author(s) and contributor(s) and not of MDPI and/or the editor(s). MDPI and/or the editor(s) disclaim responsibility for any injury to people or property resulting from any ideas, methods, instructions or products referred to in the content. |
© 2023 by the authors. Licensee MDPI, Basel, Switzerland. This article is an open access article distributed under the terms and conditions of the Creative Commons Attribution (CC BY) license (https://creativecommons.org/licenses/by/4.0/).
Share and Cite
Poliakovska, K.; Pokalyuk, V.; Annesley, I.R.; Ivanik, O. New Insights into the Genesis of Dibrova U-Th-REE Mineral Deposit (West Azov Megablock, Ukraine) Using Monazite Chemistry. Minerals 2023, 13, 1241. https://doi.org/10.3390/min13101241
Poliakovska K, Pokalyuk V, Annesley IR, Ivanik O. New Insights into the Genesis of Dibrova U-Th-REE Mineral Deposit (West Azov Megablock, Ukraine) Using Monazite Chemistry. Minerals. 2023; 13(10):1241. https://doi.org/10.3390/min13101241
Chicago/Turabian StylePoliakovska, Kateryna, Volodymyr Pokalyuk, Irvine R. Annesley, and Olena Ivanik. 2023. "New Insights into the Genesis of Dibrova U-Th-REE Mineral Deposit (West Azov Megablock, Ukraine) Using Monazite Chemistry" Minerals 13, no. 10: 1241. https://doi.org/10.3390/min13101241