

Age, Fluid Inclusion, and H–O–S–Pb Isotope Geochemistry of the Superlarge Huaaobaote Ag–Pb–Zn Deposit in the Southern Great Xing’an Range, NE China
Abstract
:1. Introduction
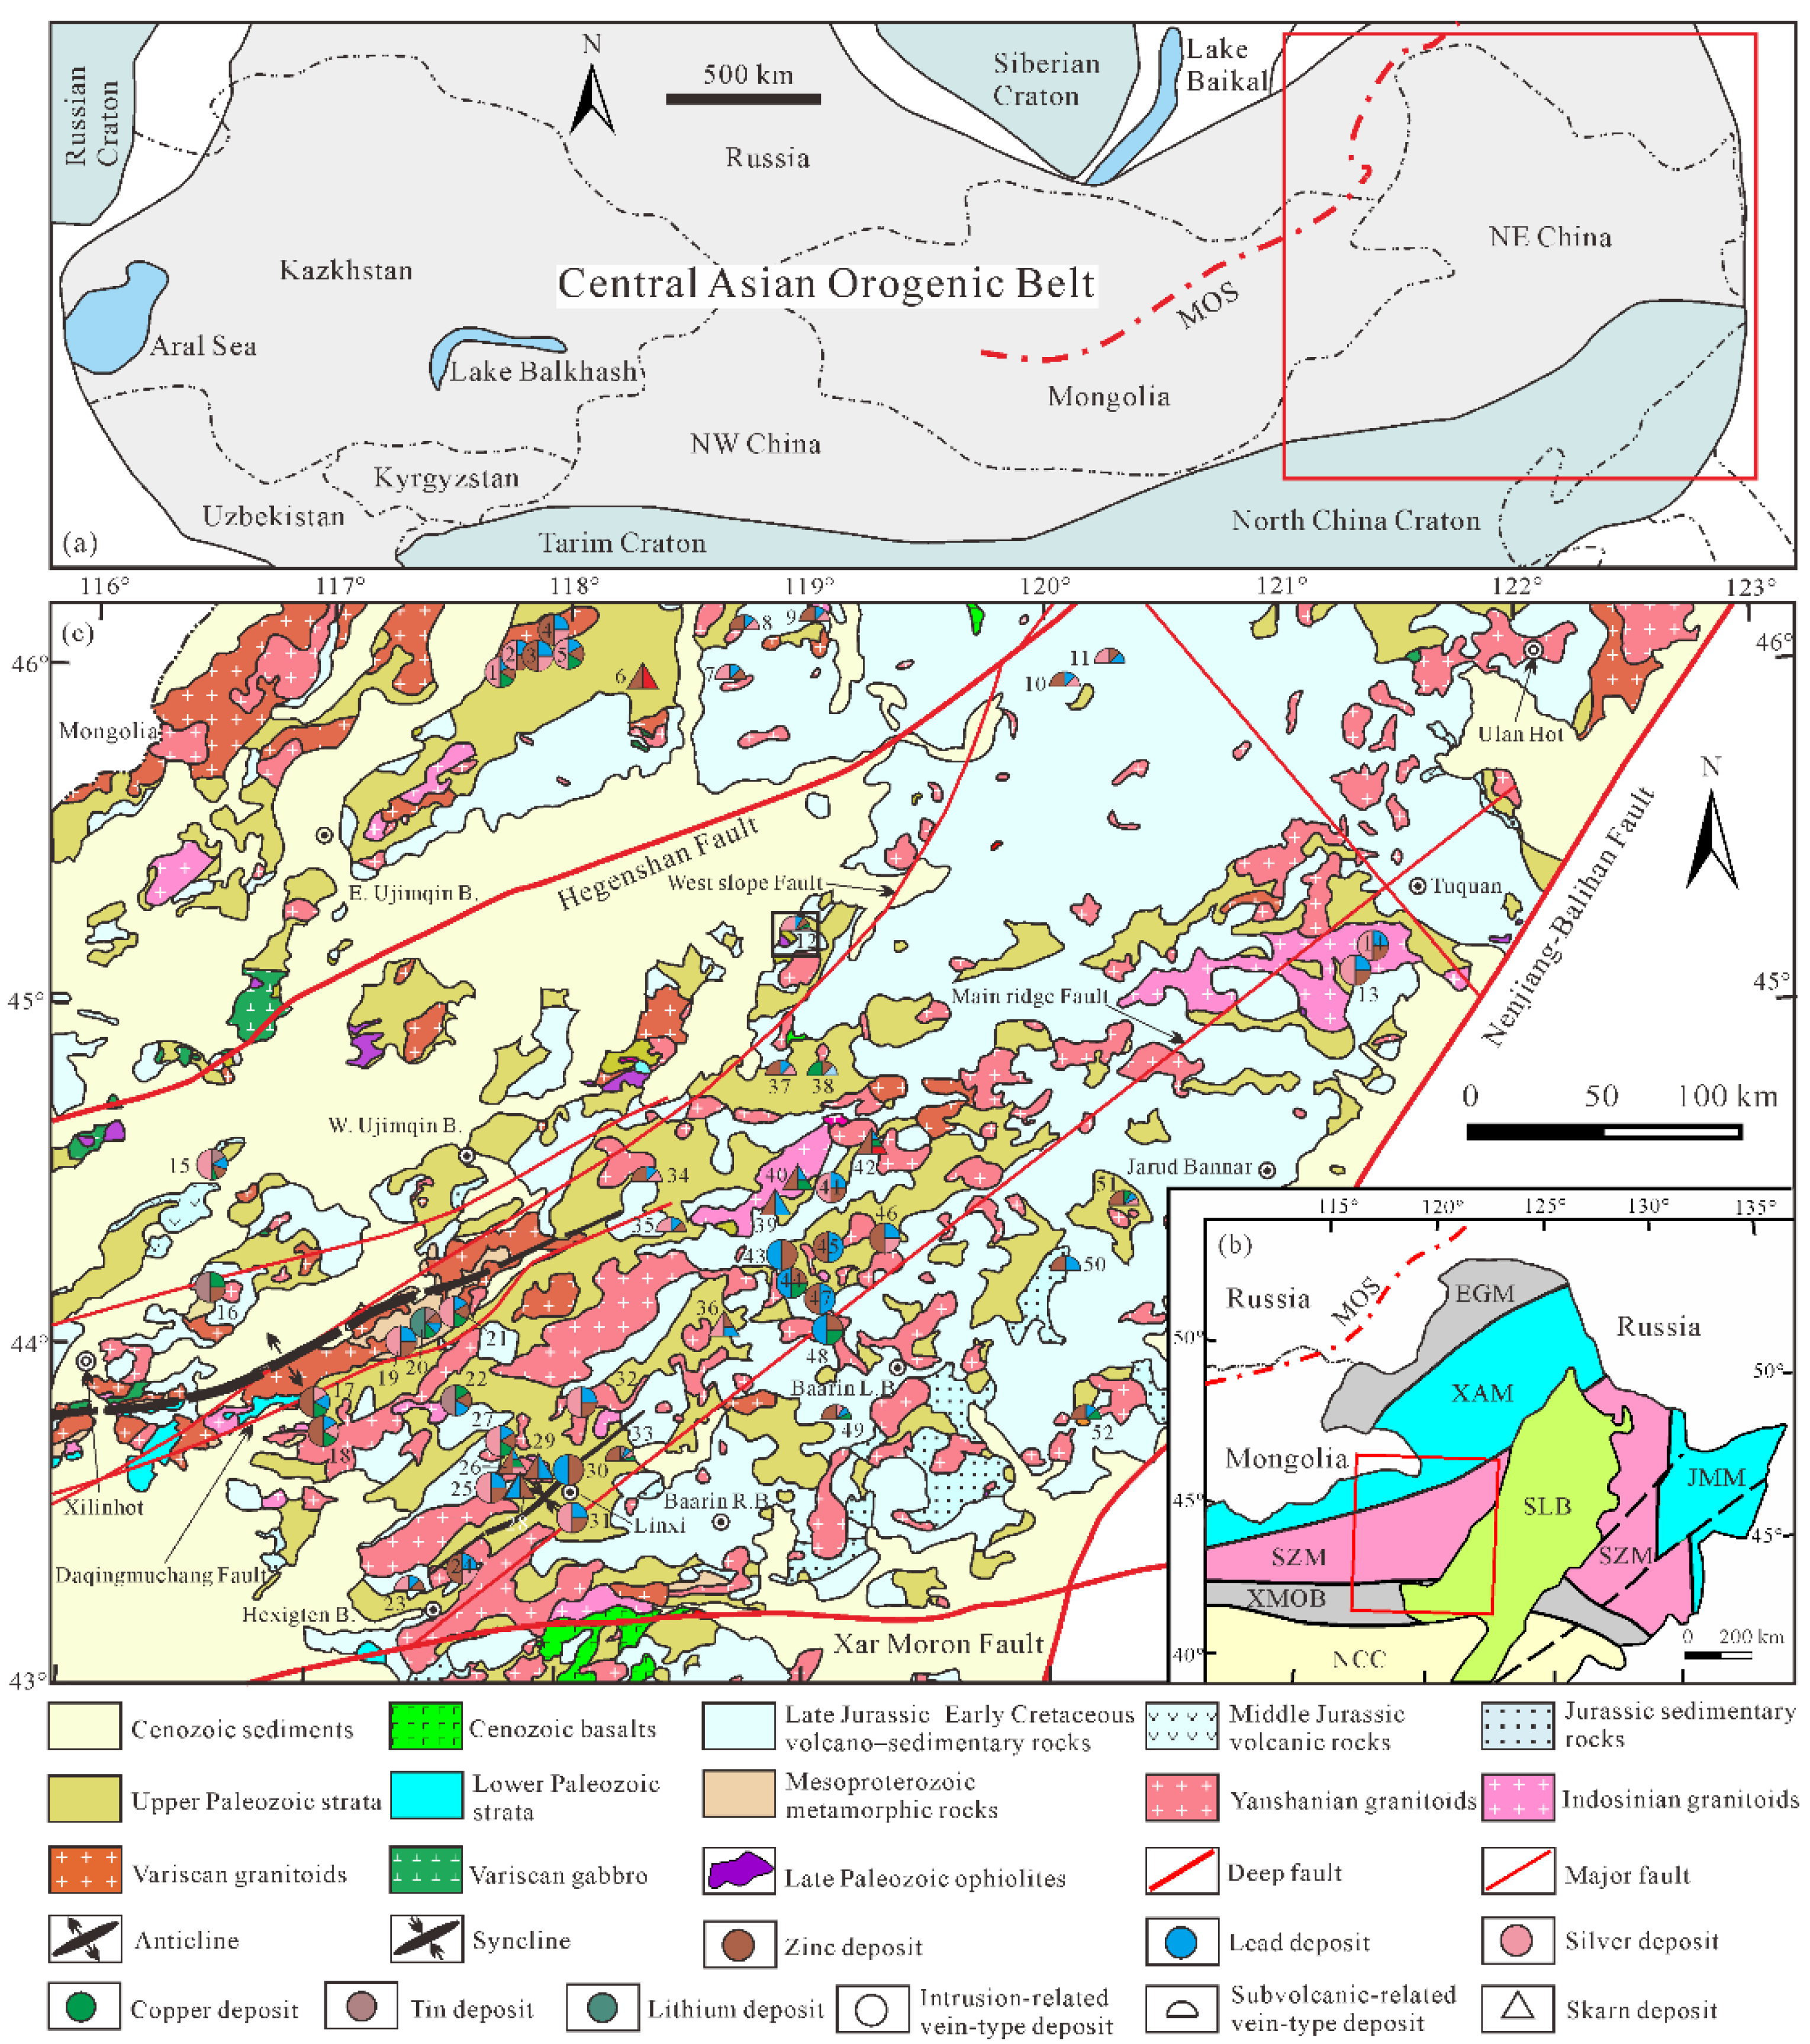
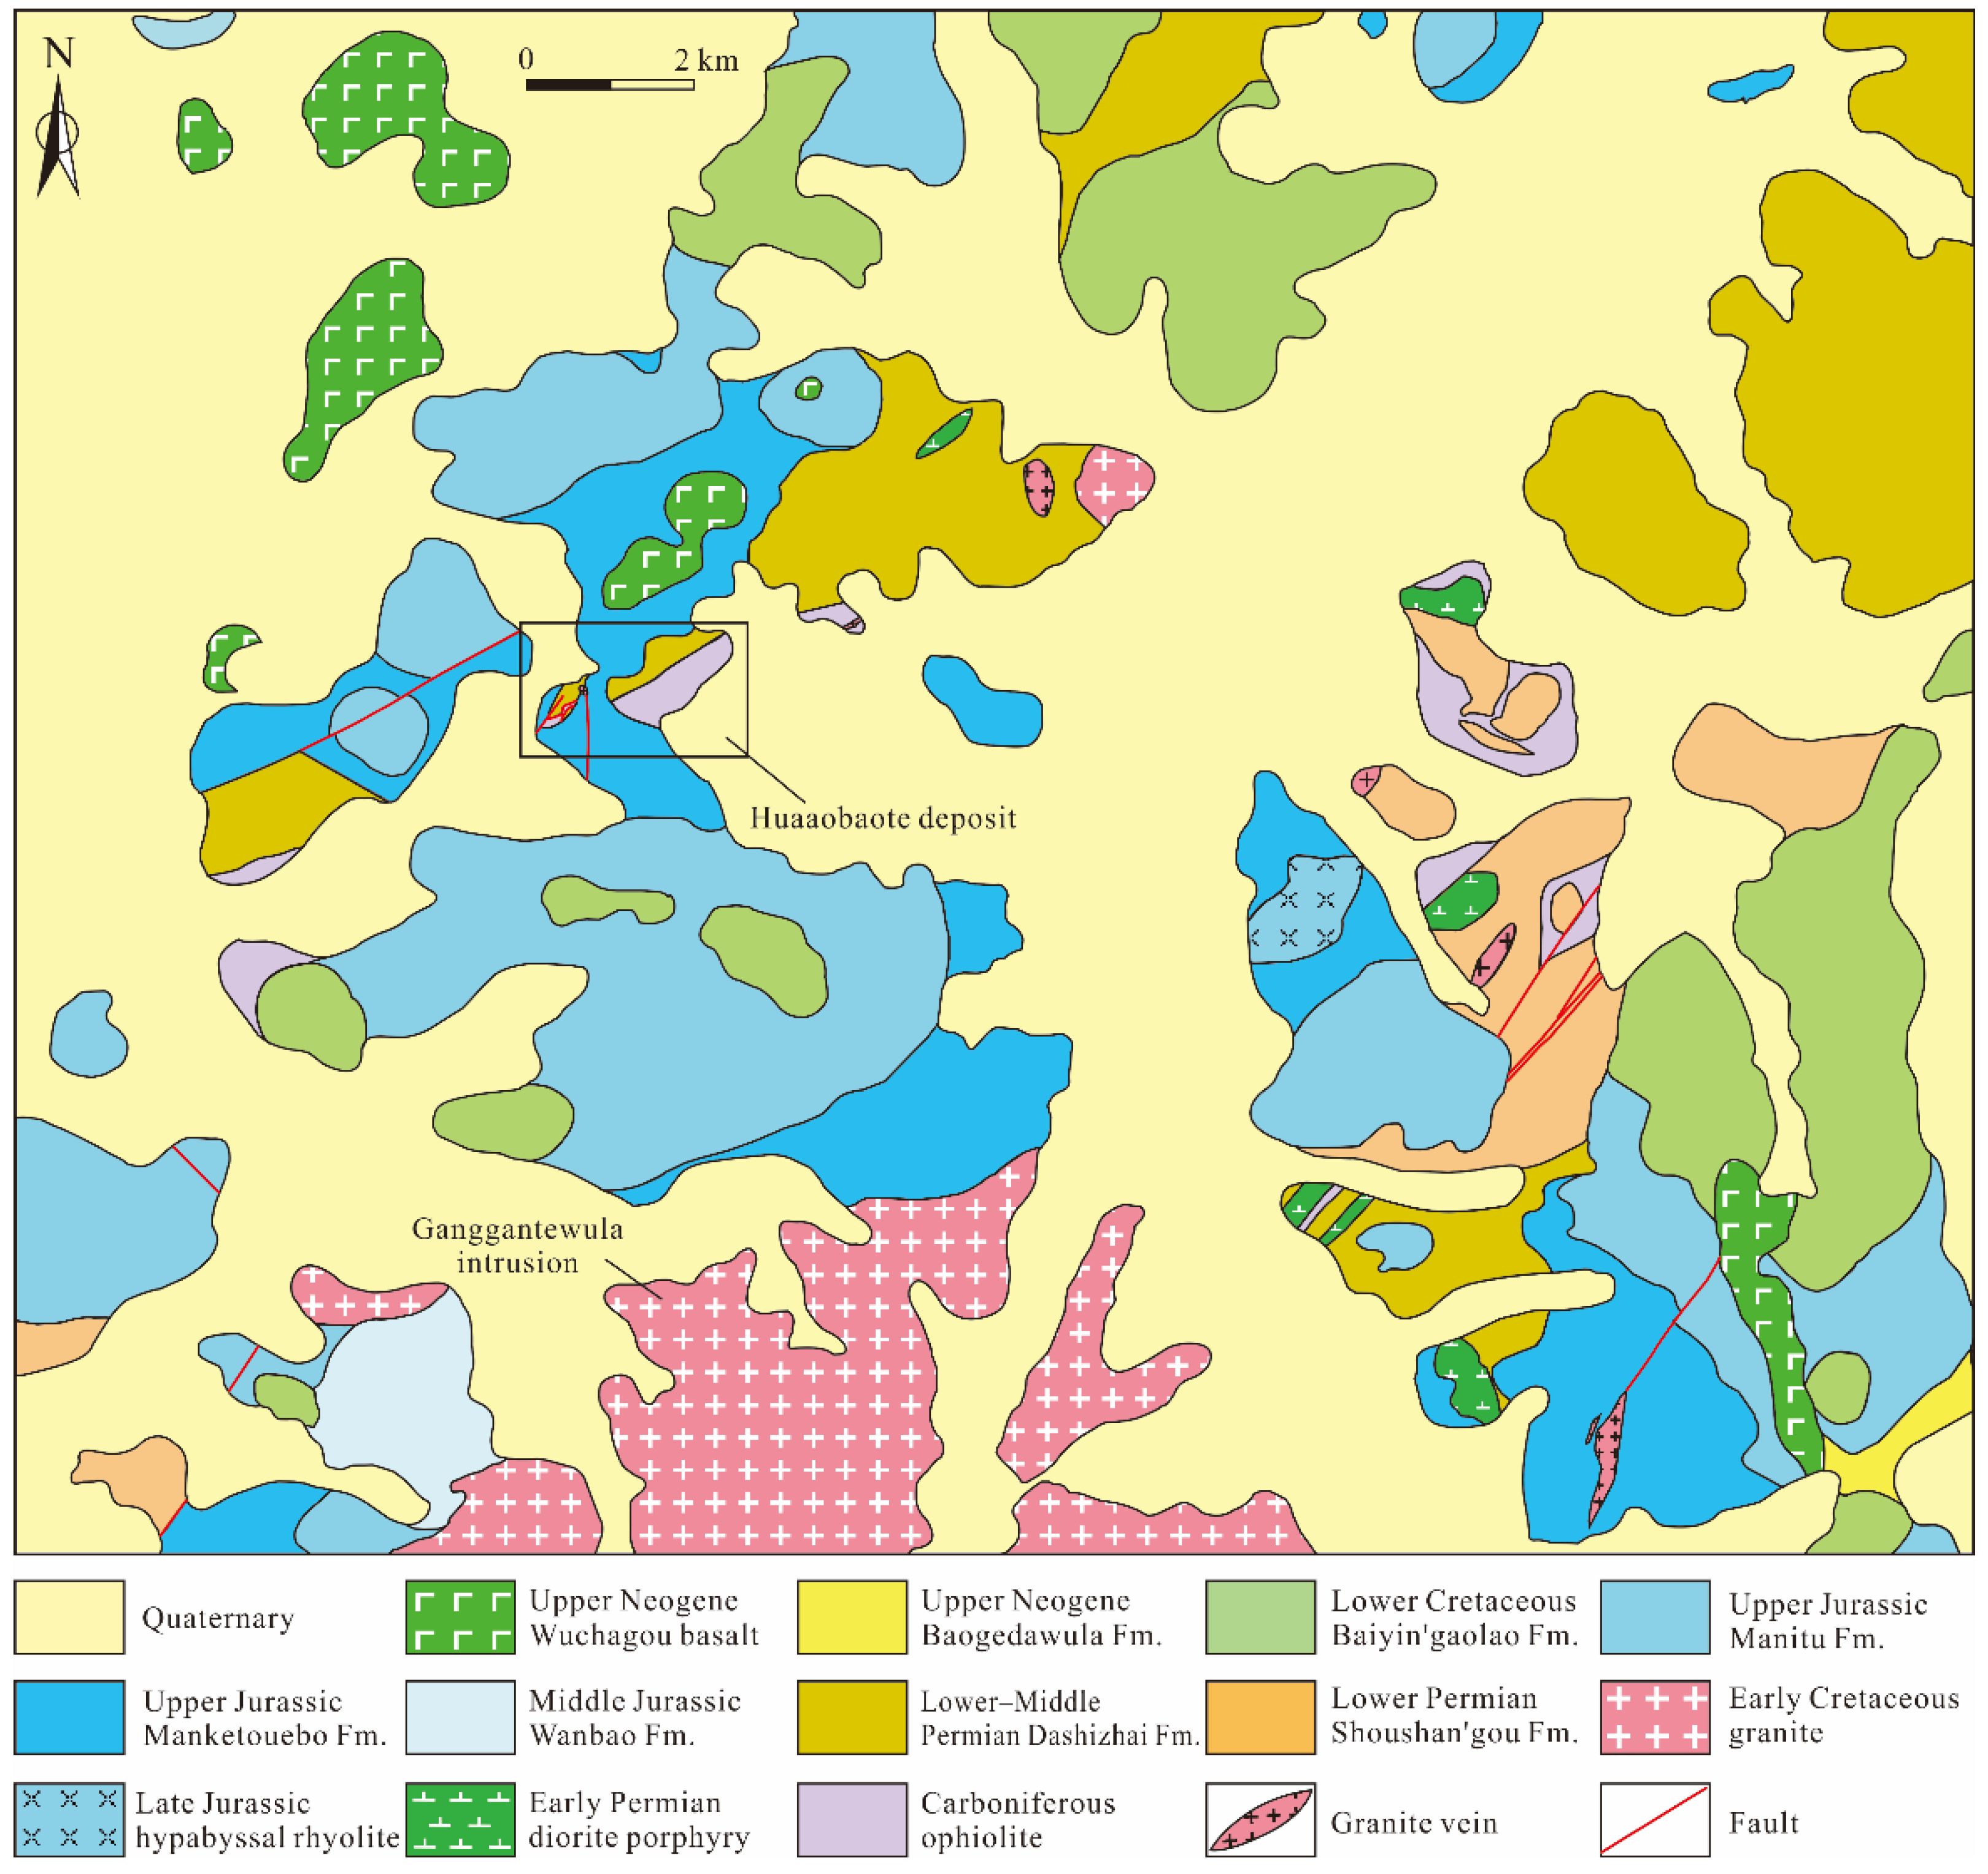
2. Regional Geology
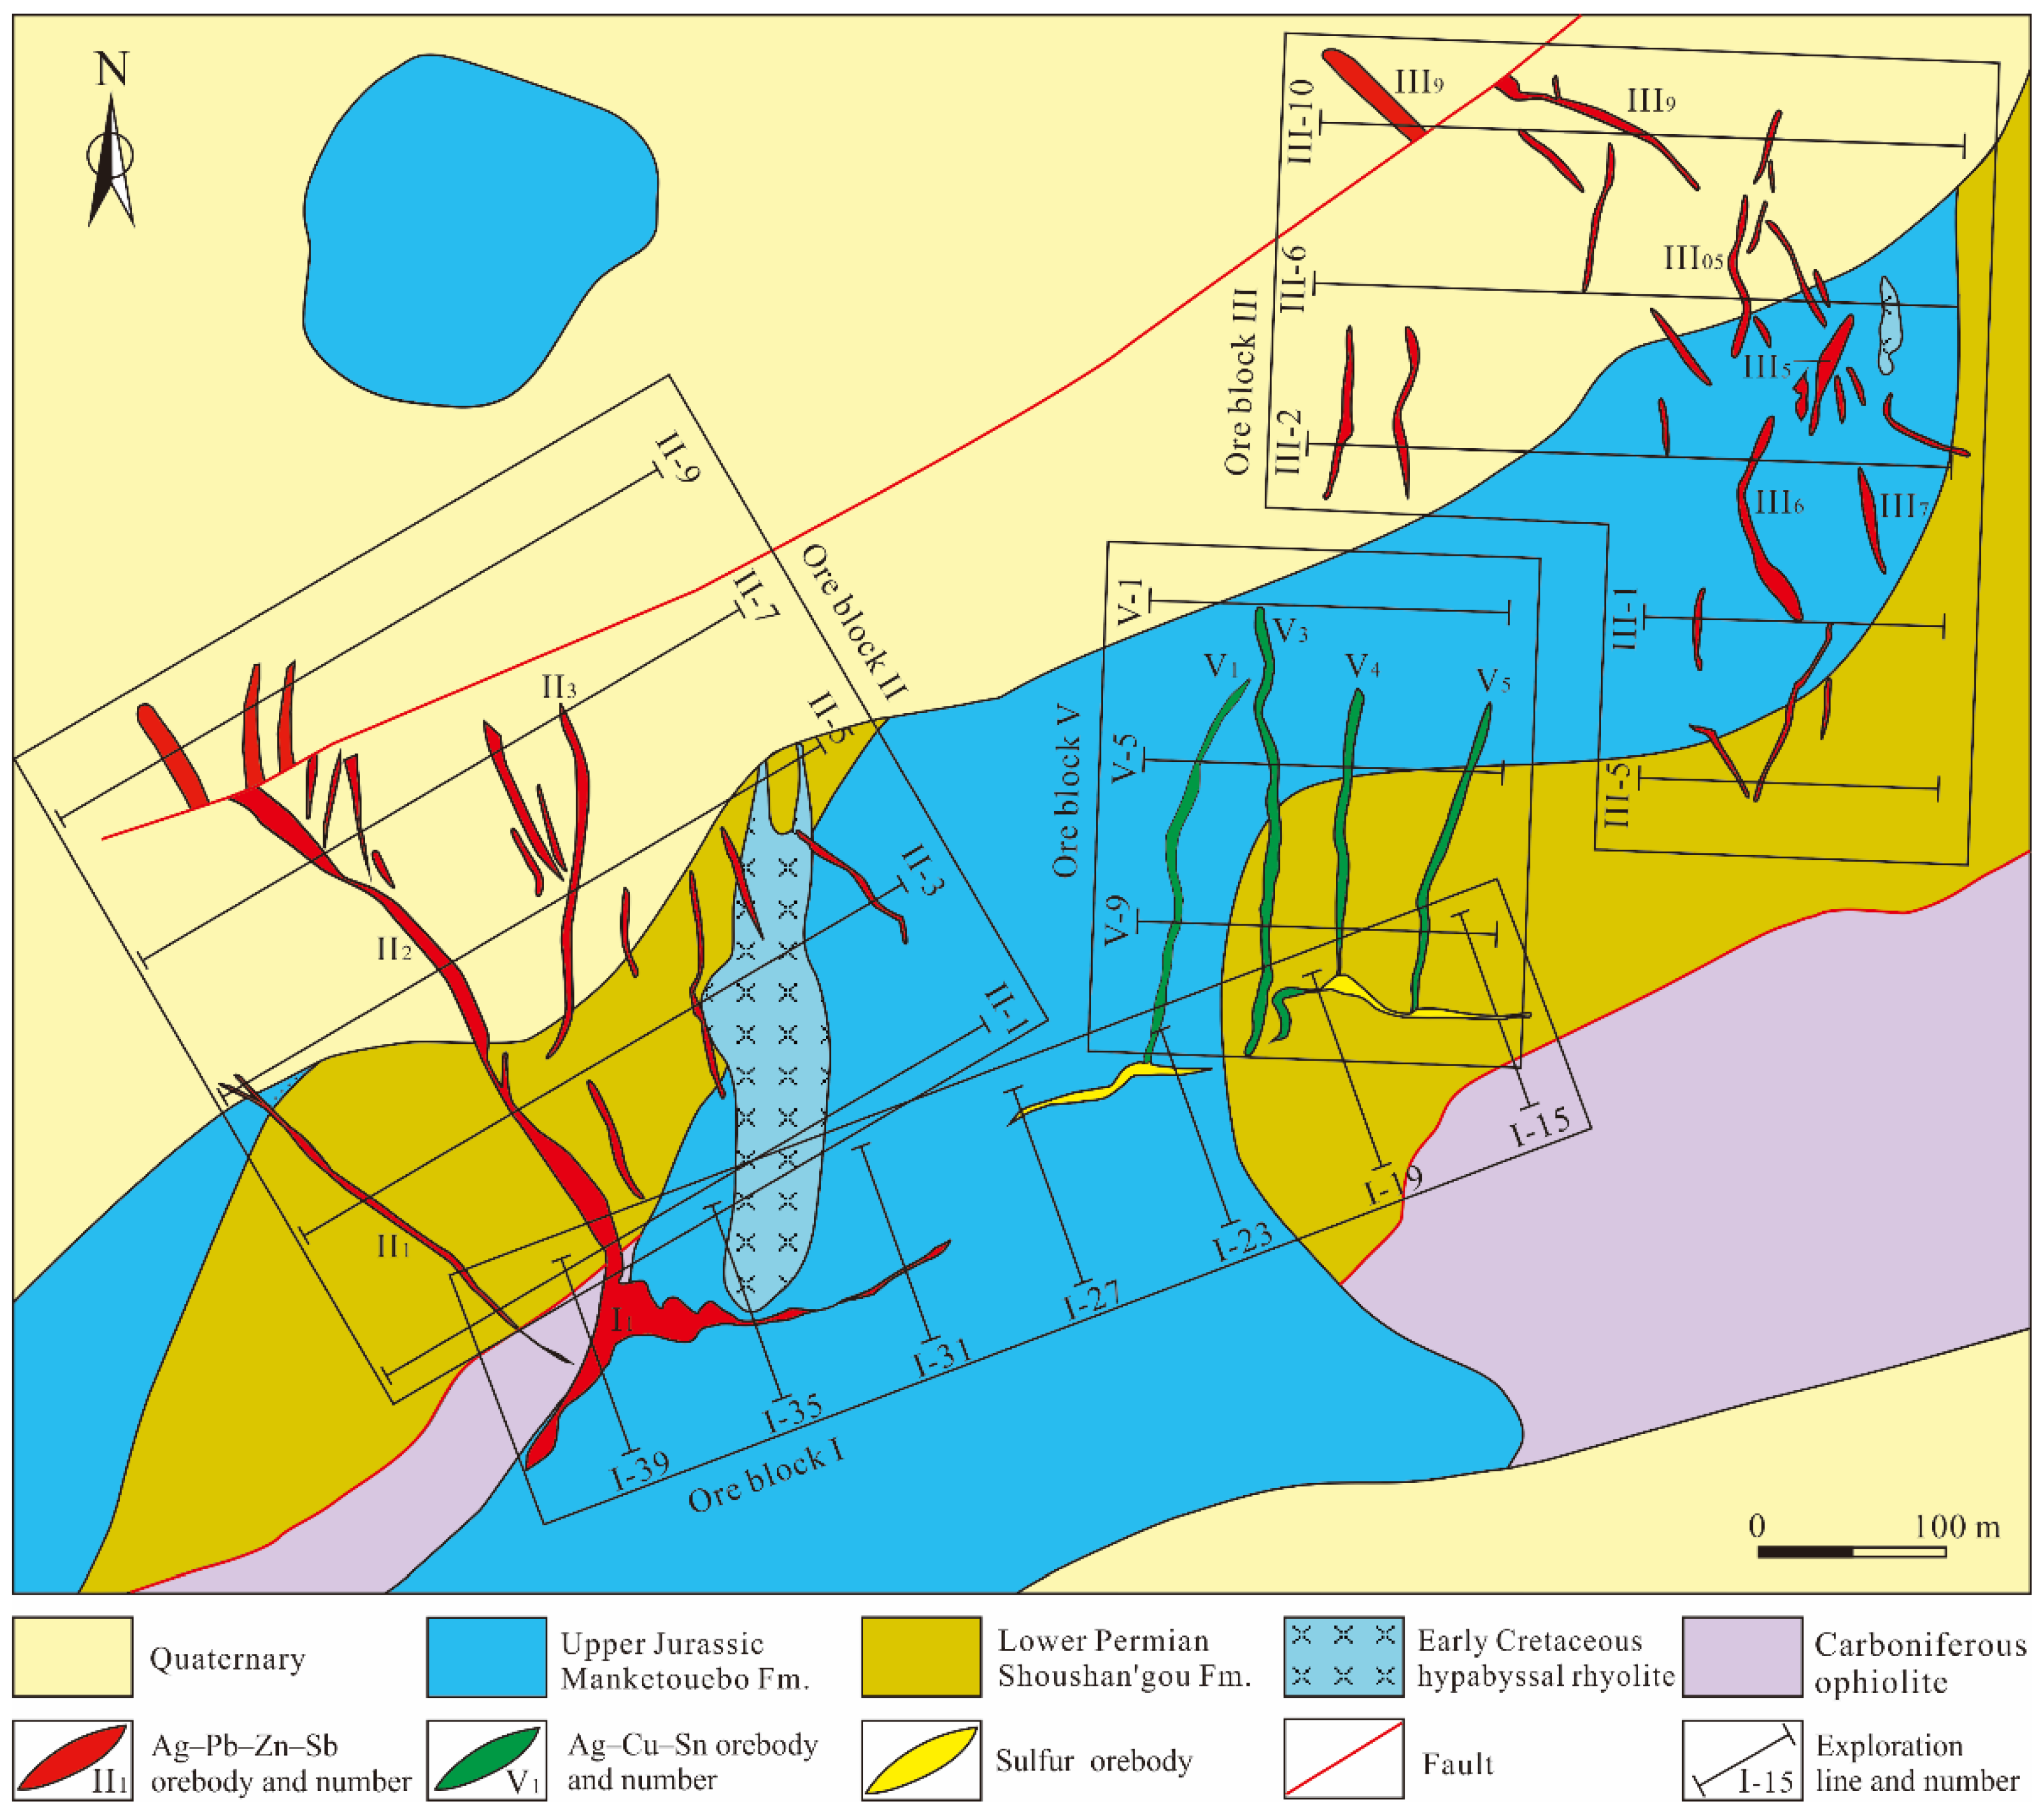
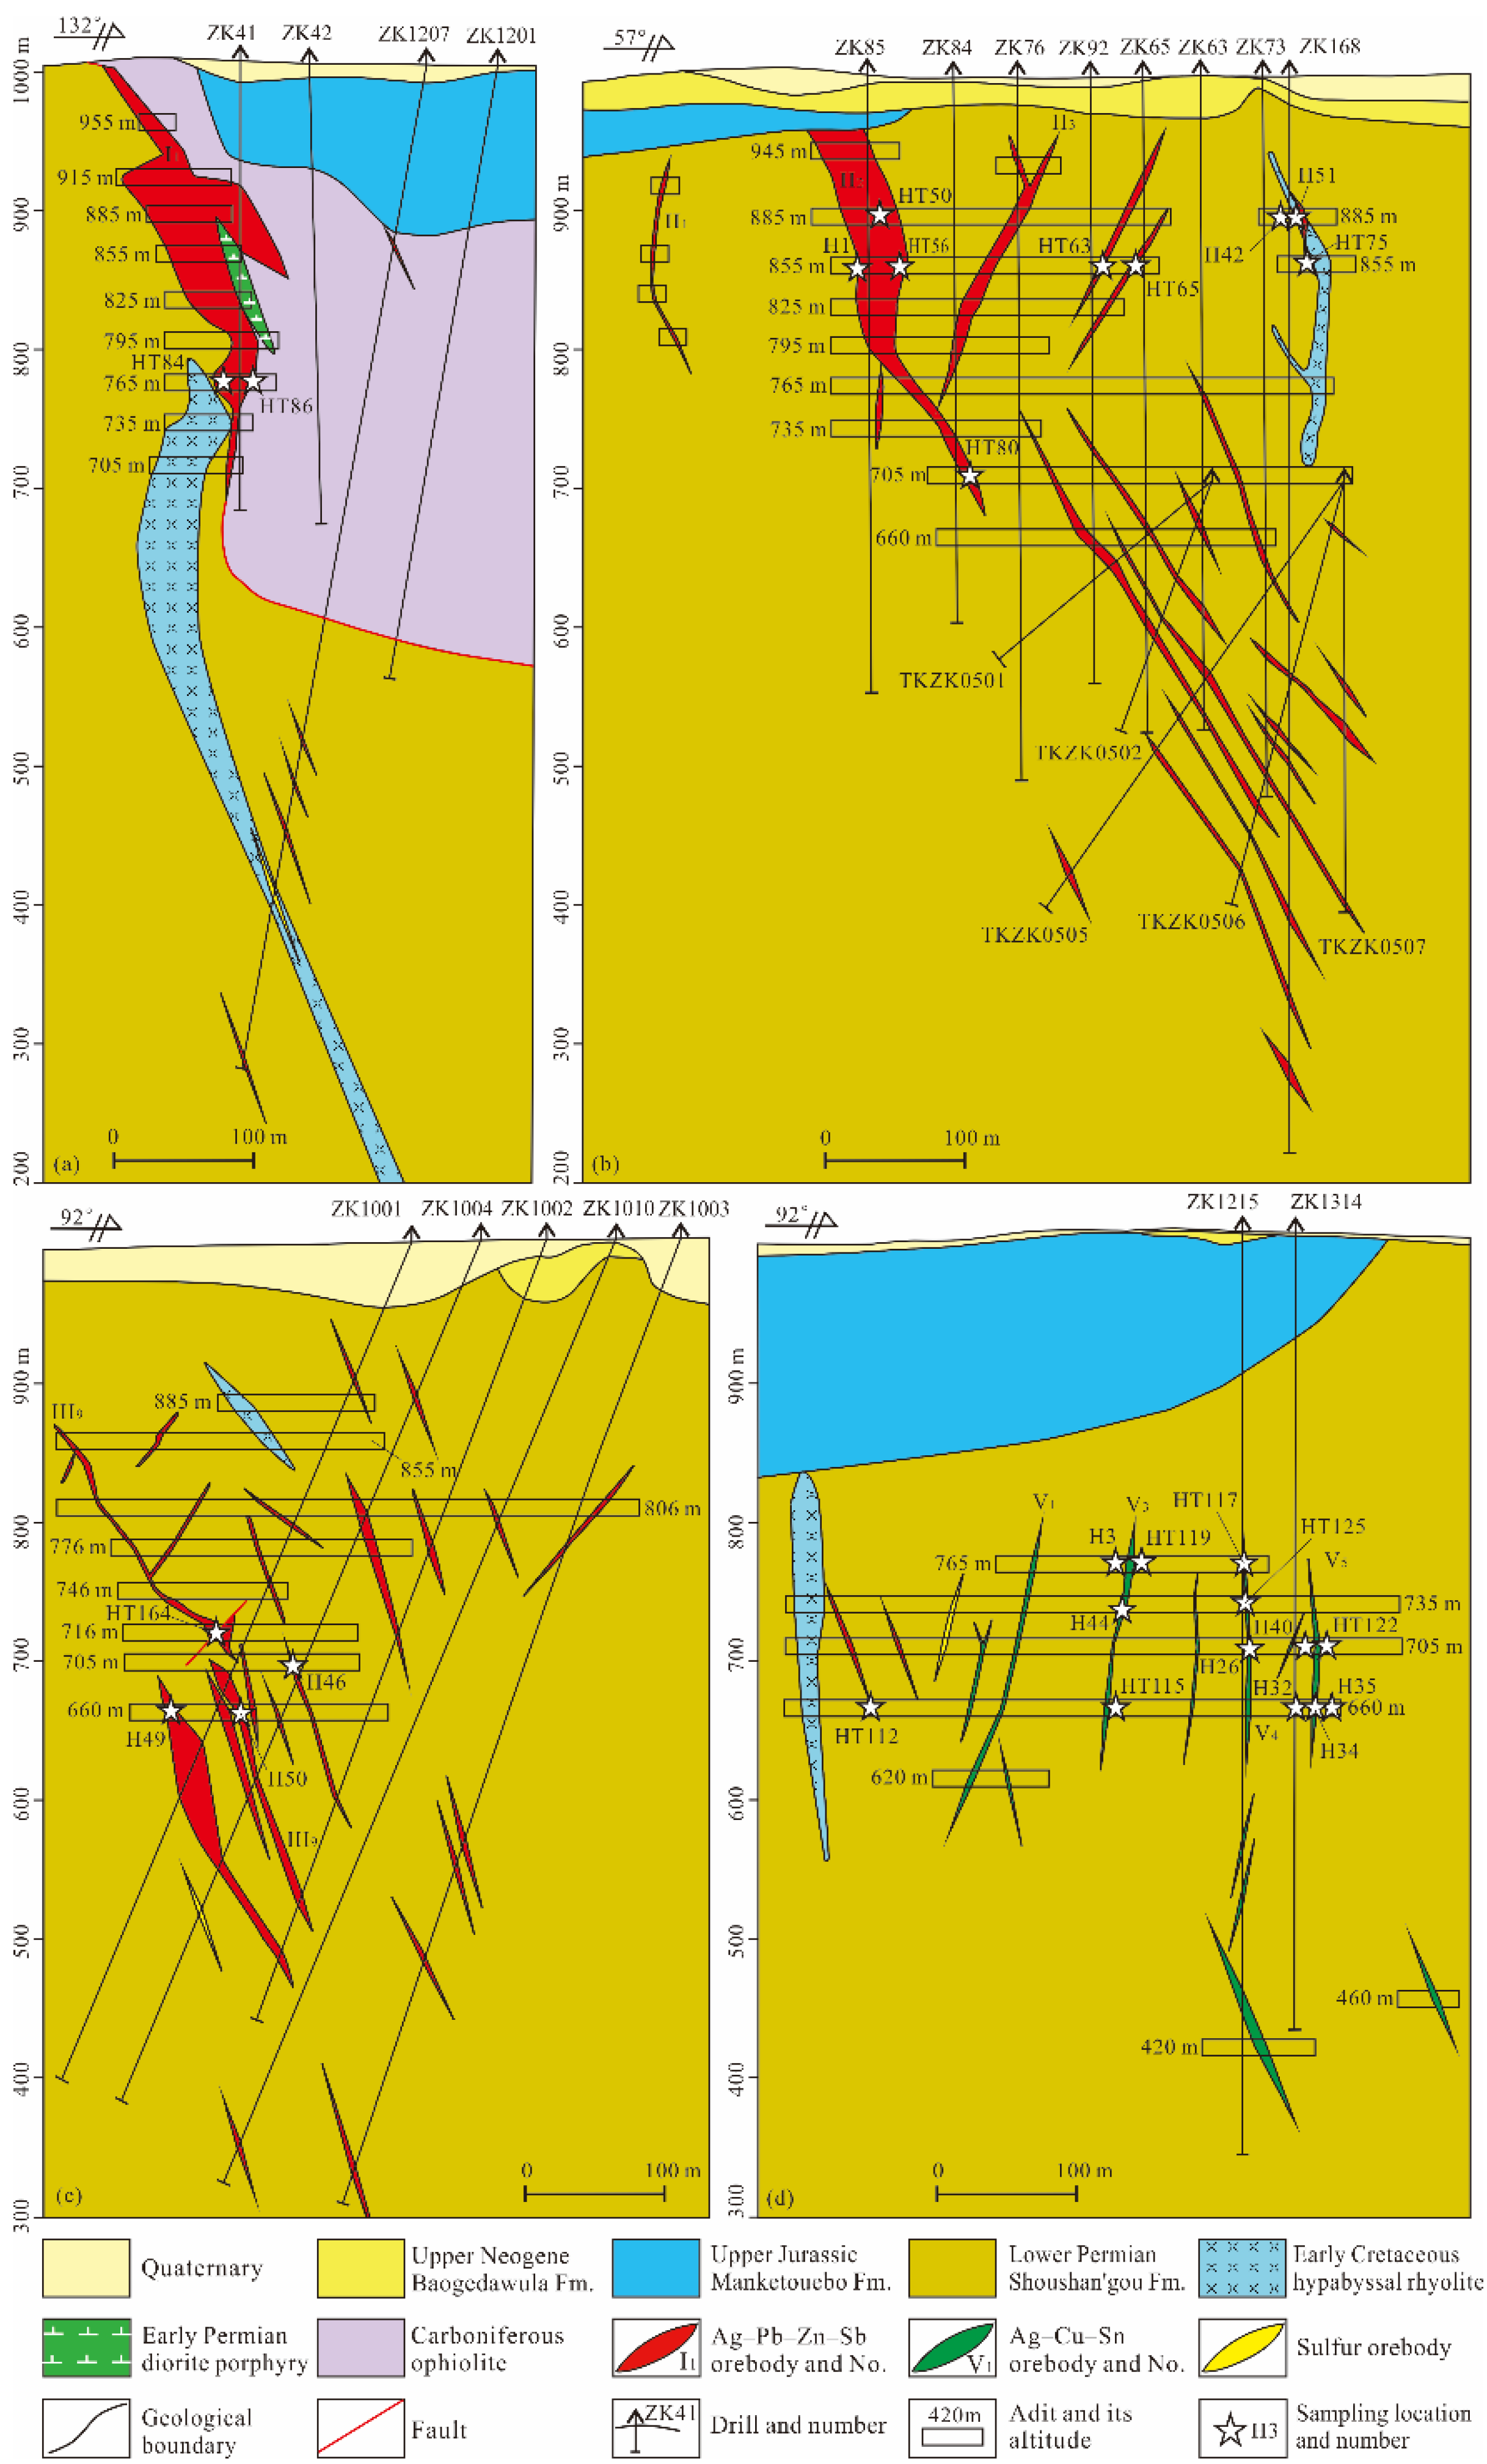
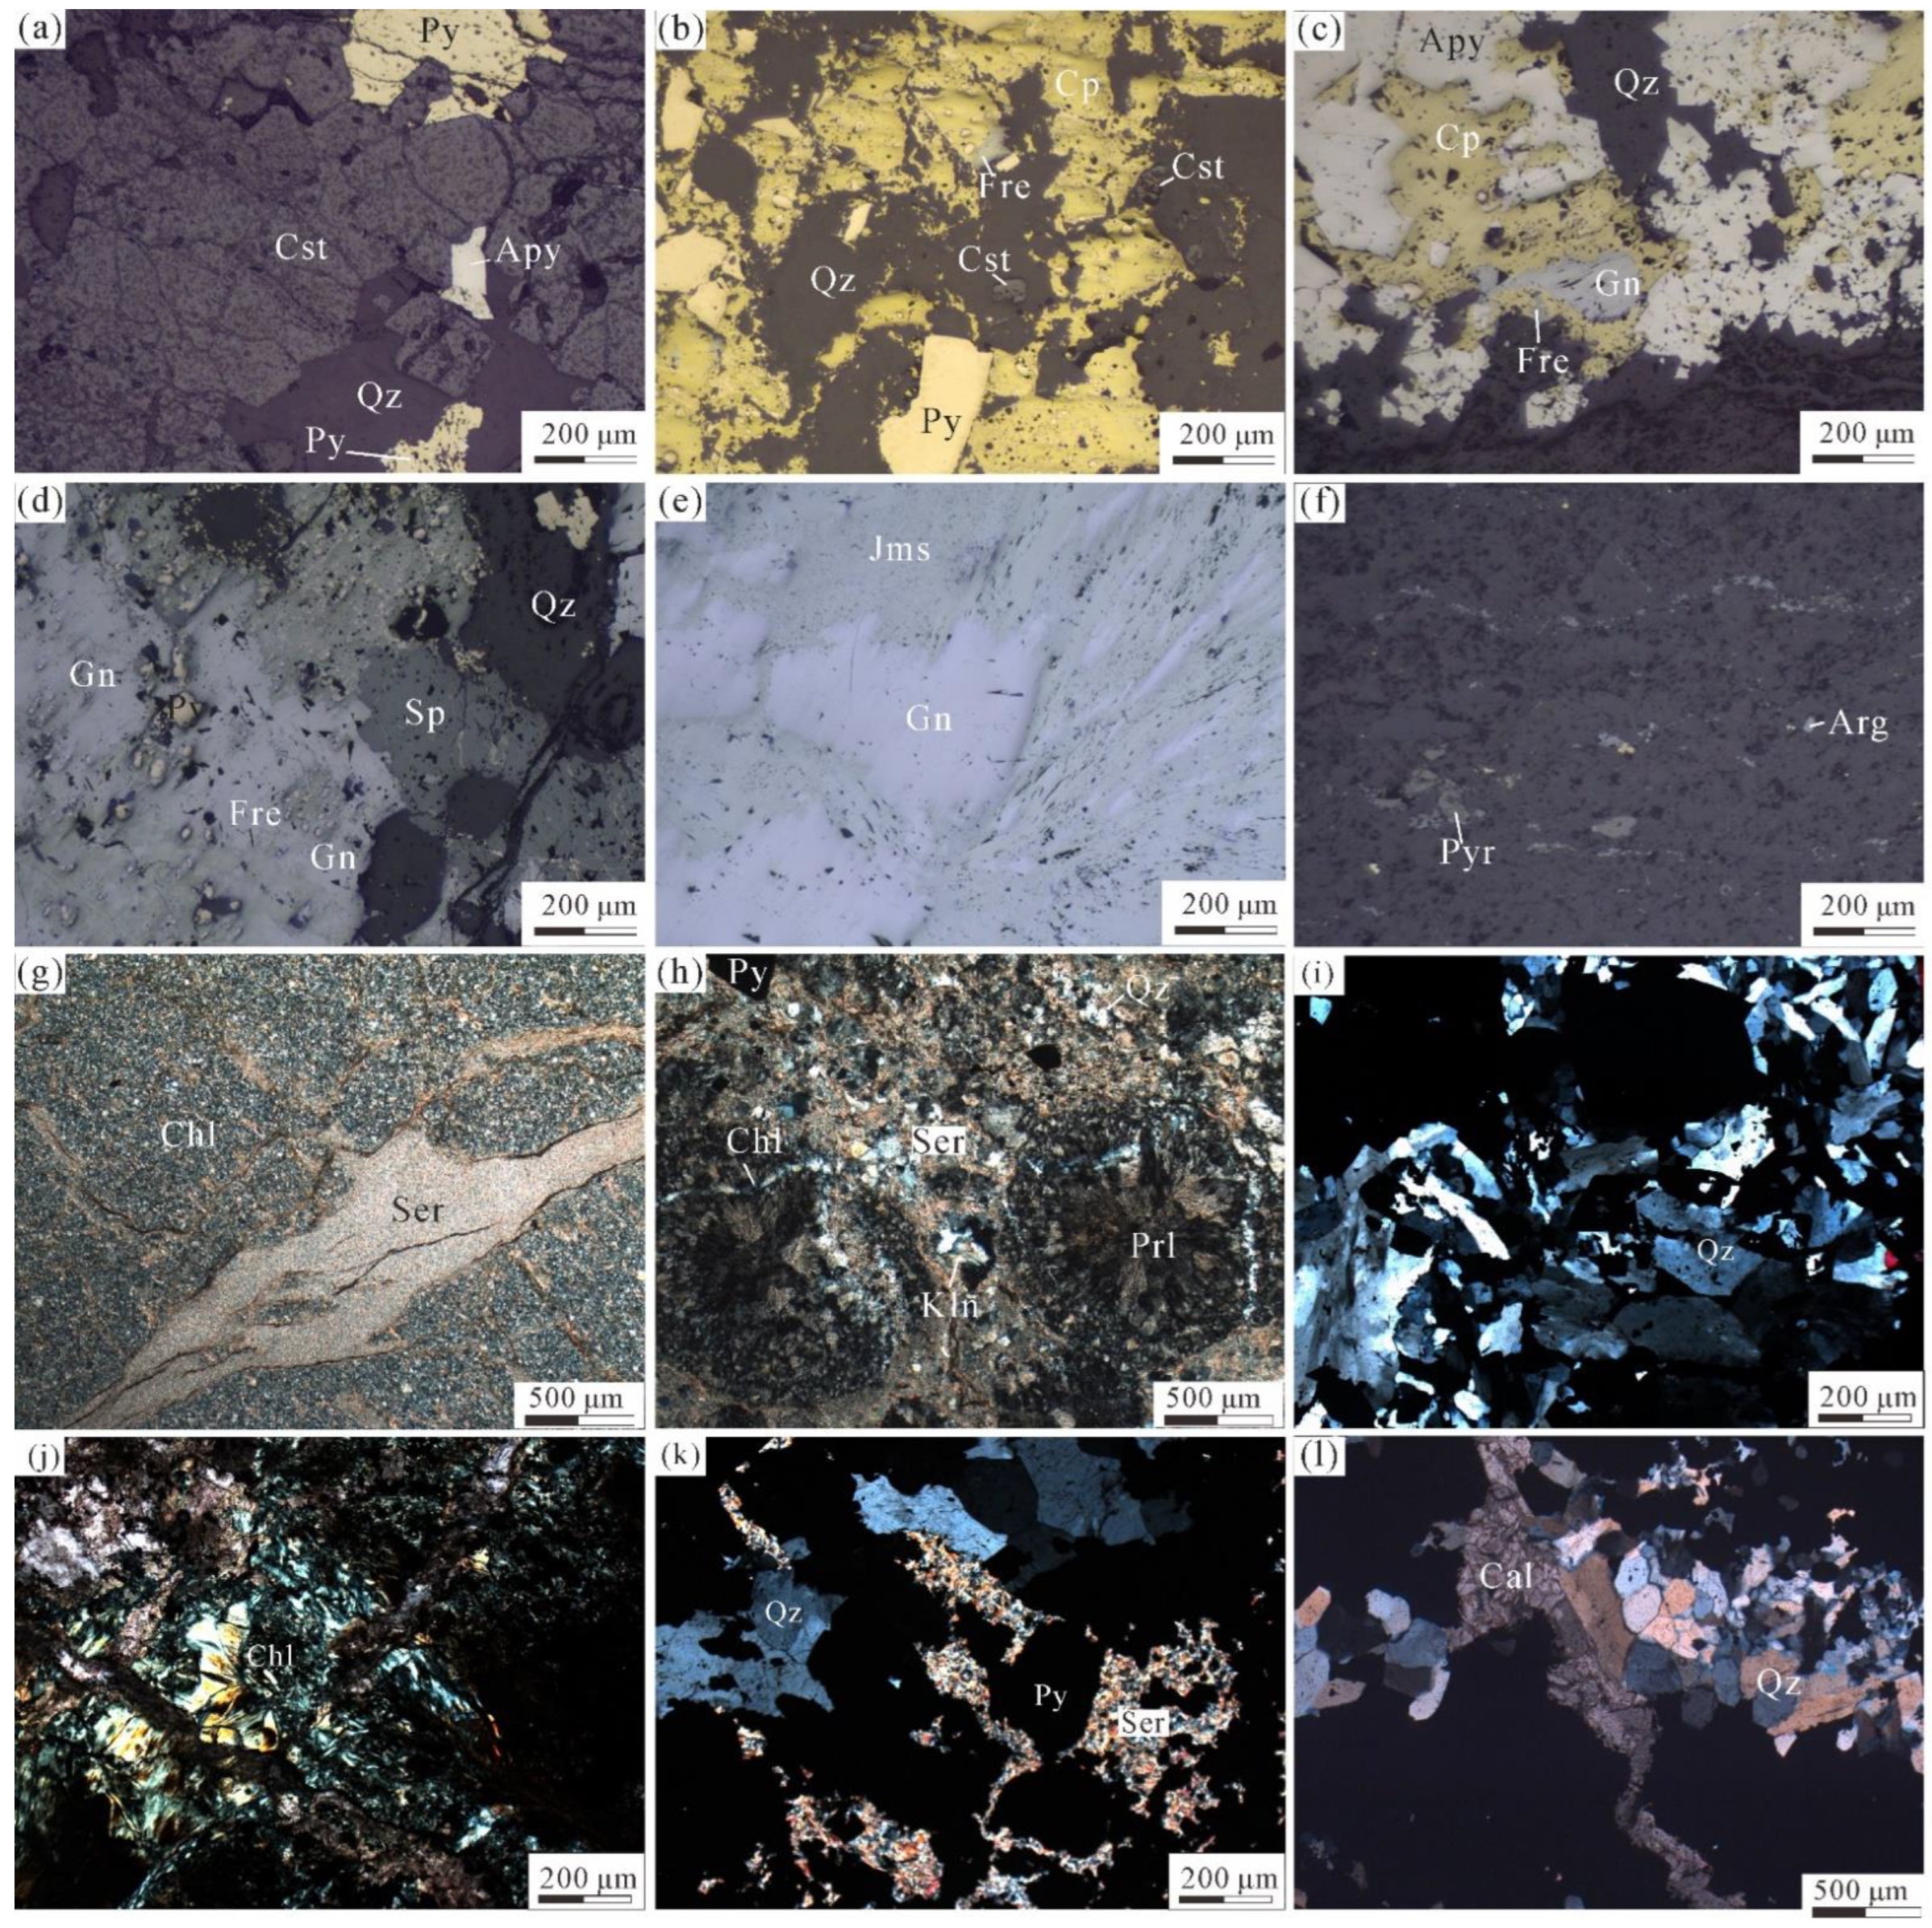
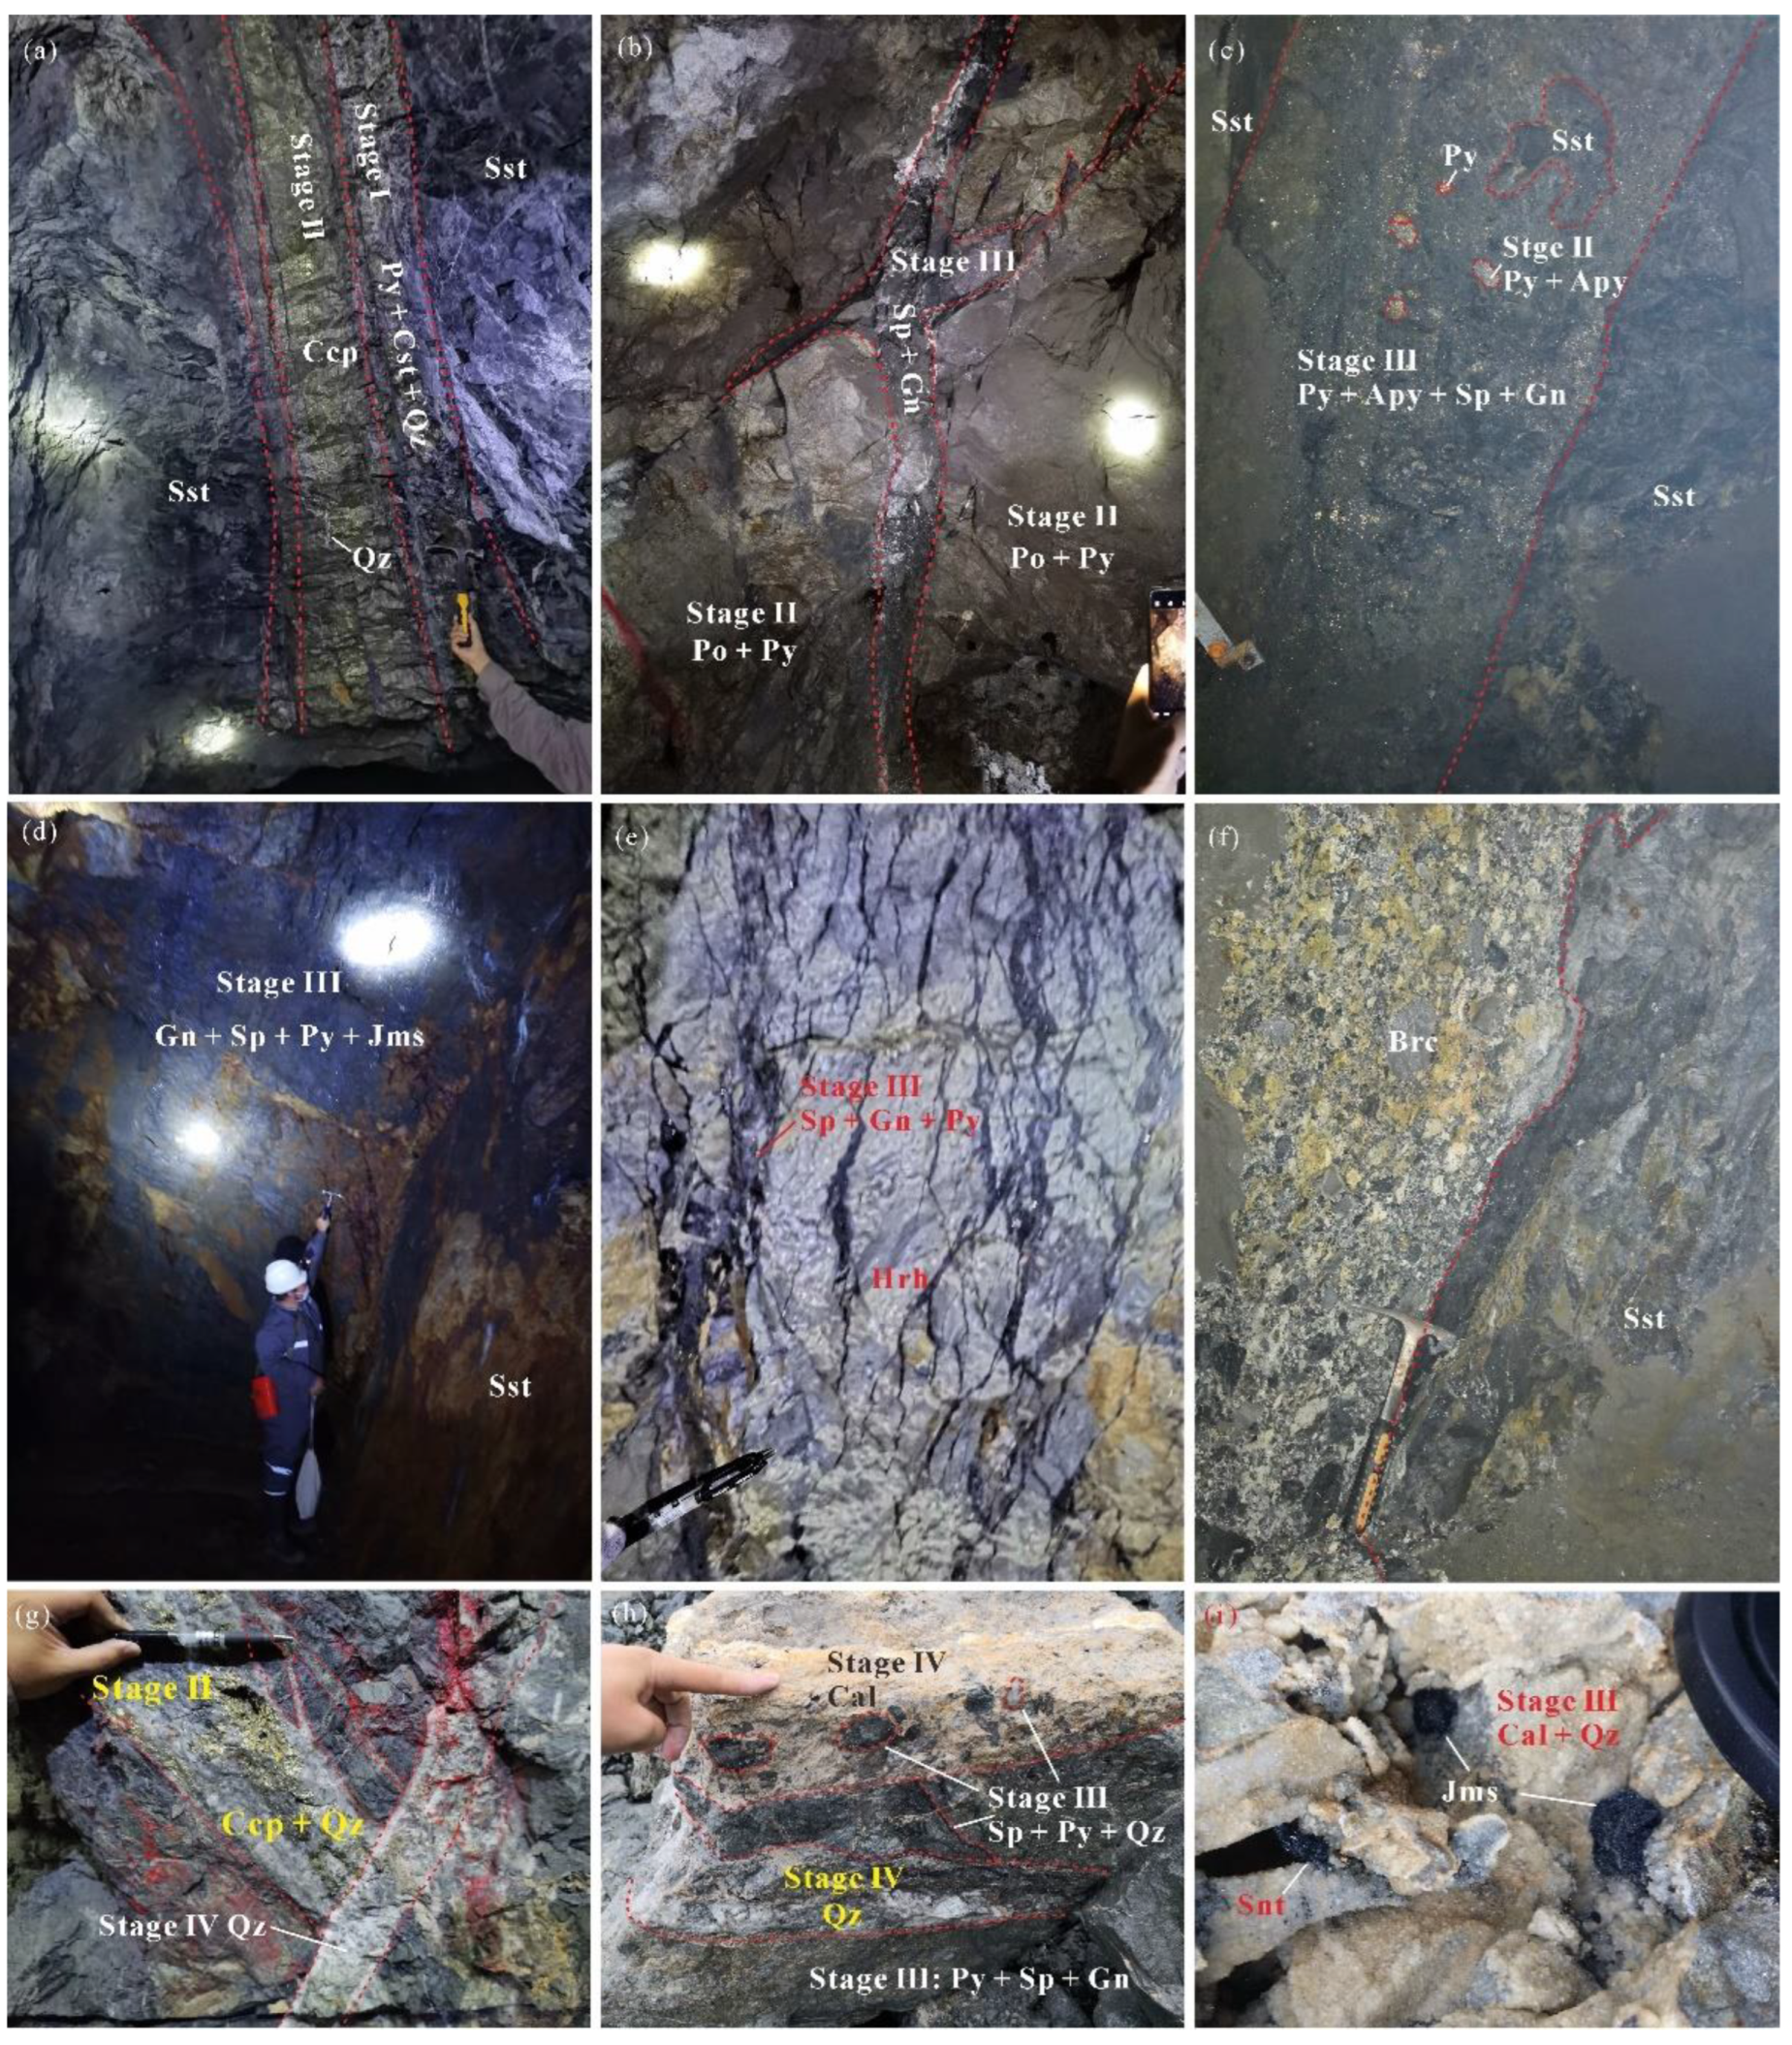
3. Ore Geology
4. Sampling and Analytical Methods
4.1. Sampling
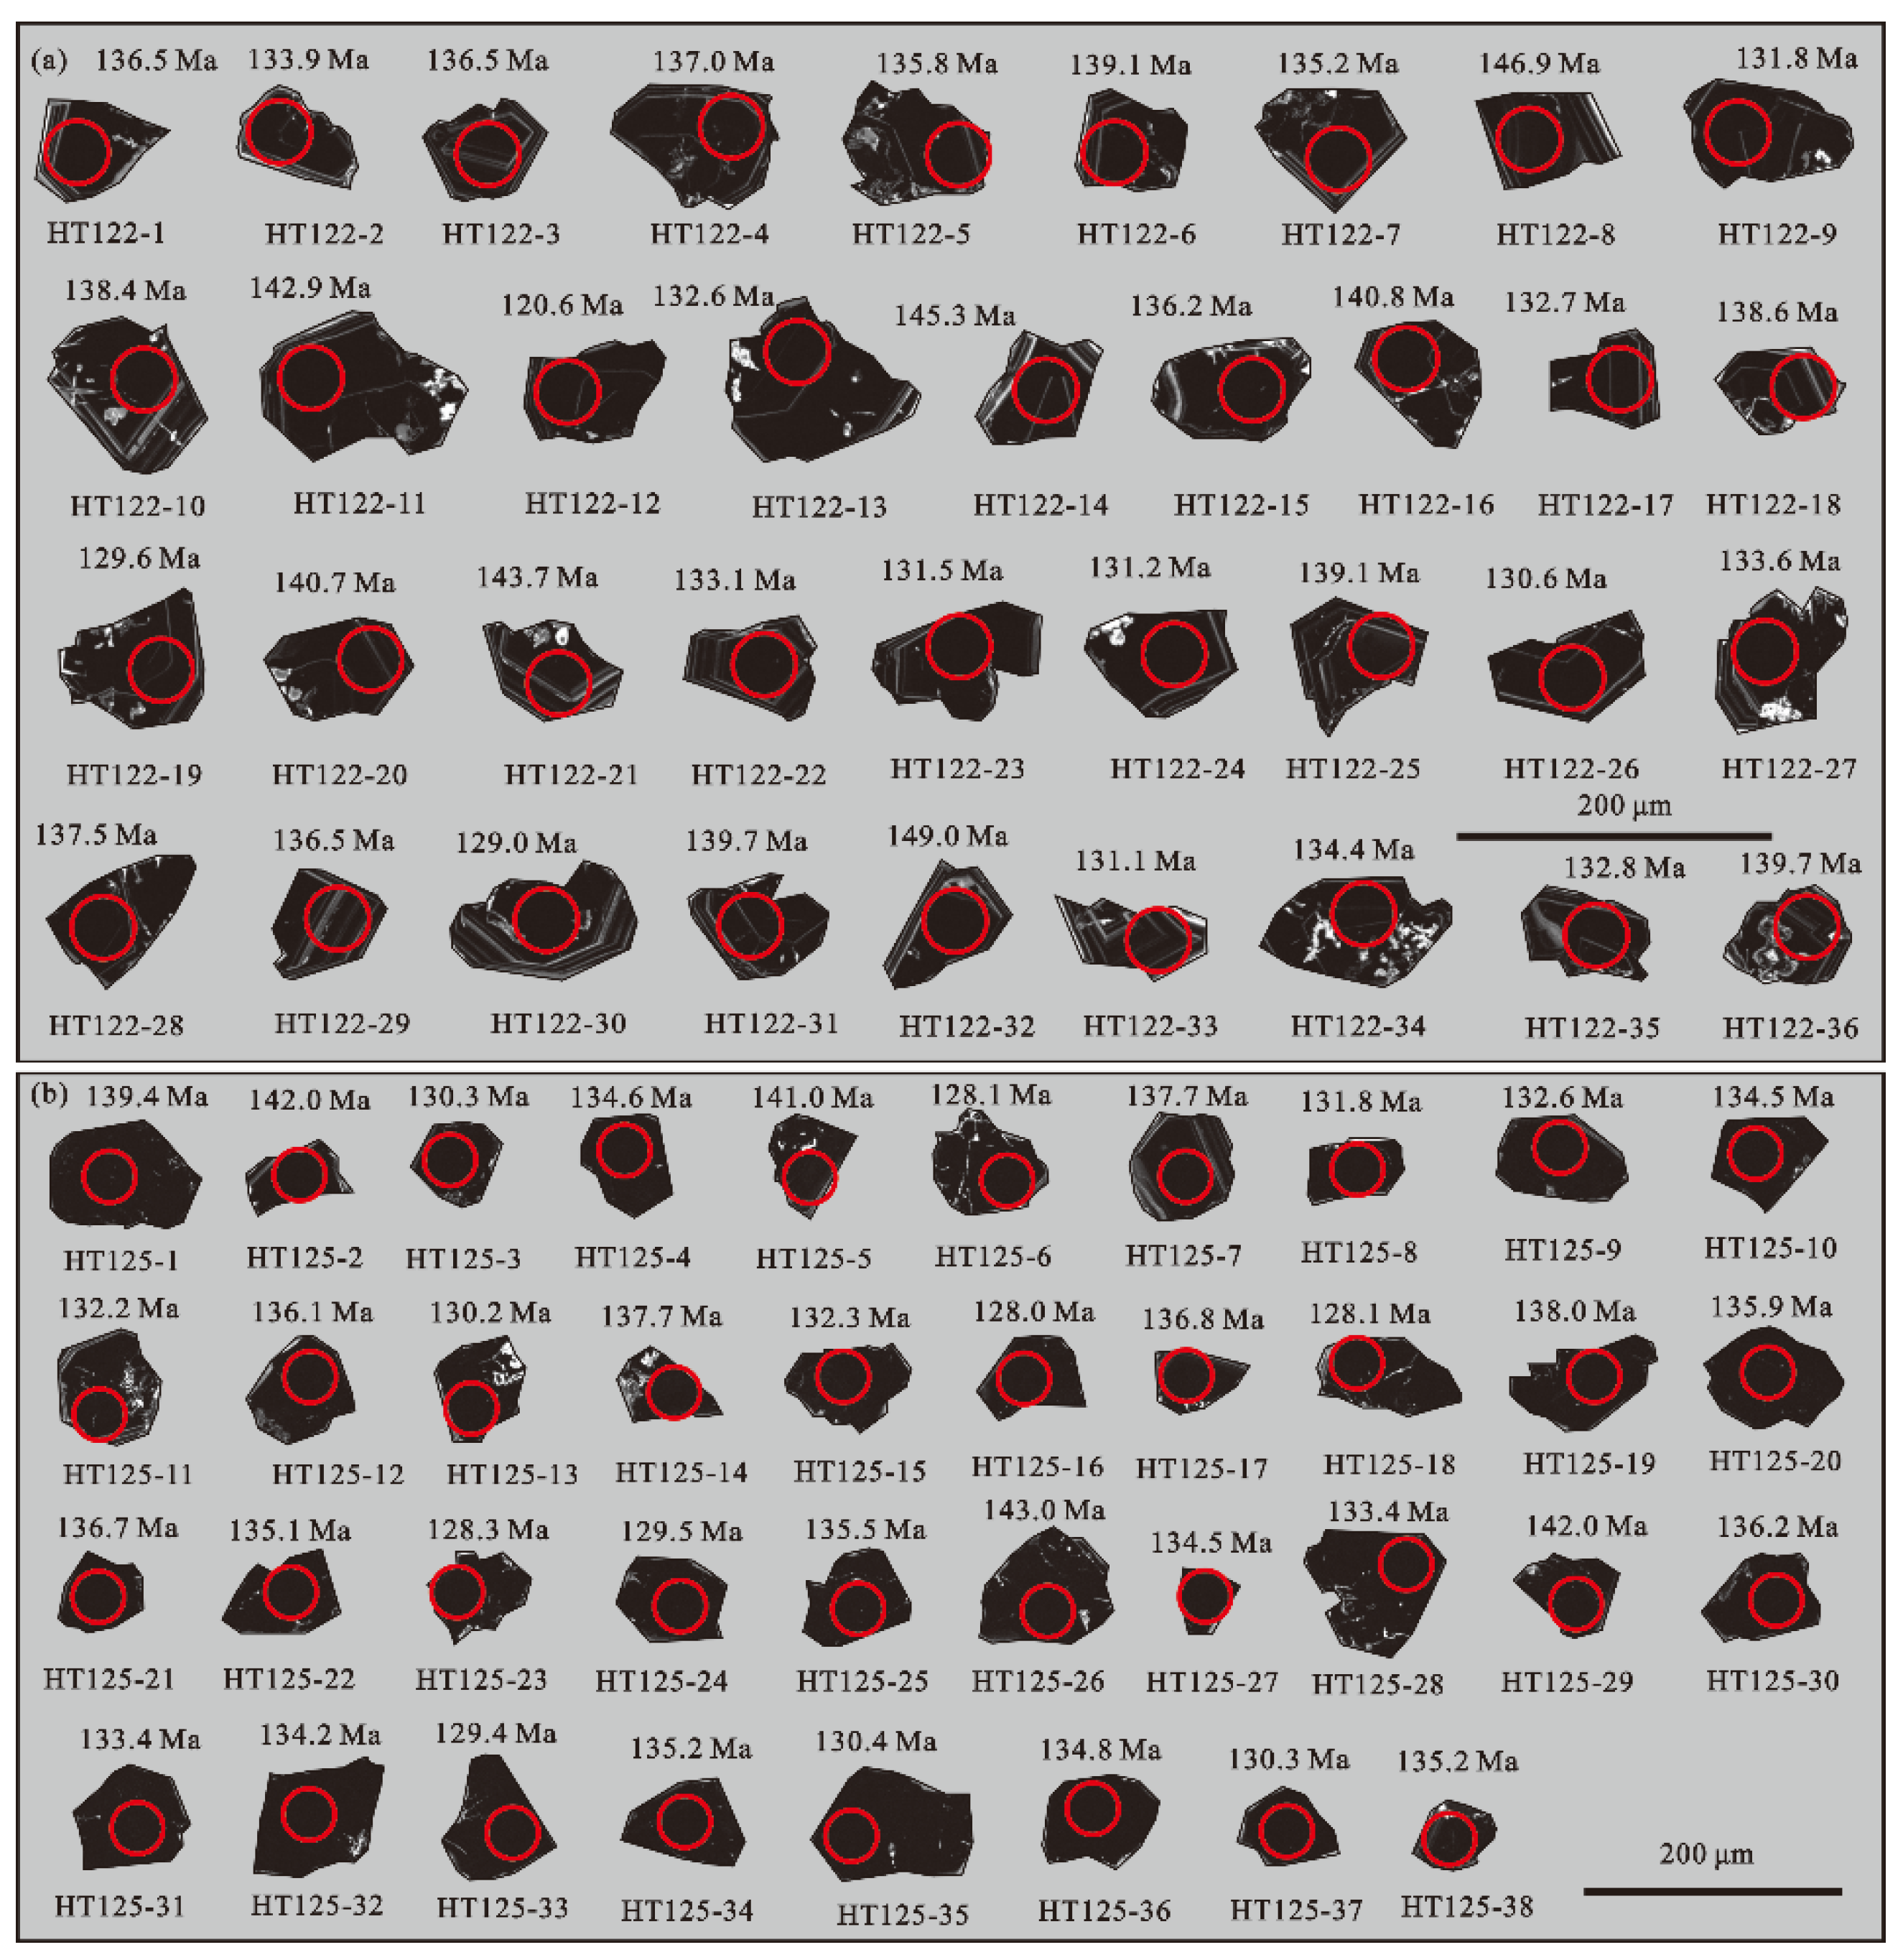
4.2. Cassiterite U–Pb Dating
4.3. Fluid Inclusion Microthermometry and Laser Raman Spectroscopy
4.4. H–O–S–Pb Isotope Analyses
4.4.1. H–O Isotope Analyses
4.4.2. S–Pb Isotope Analyses
5. Results
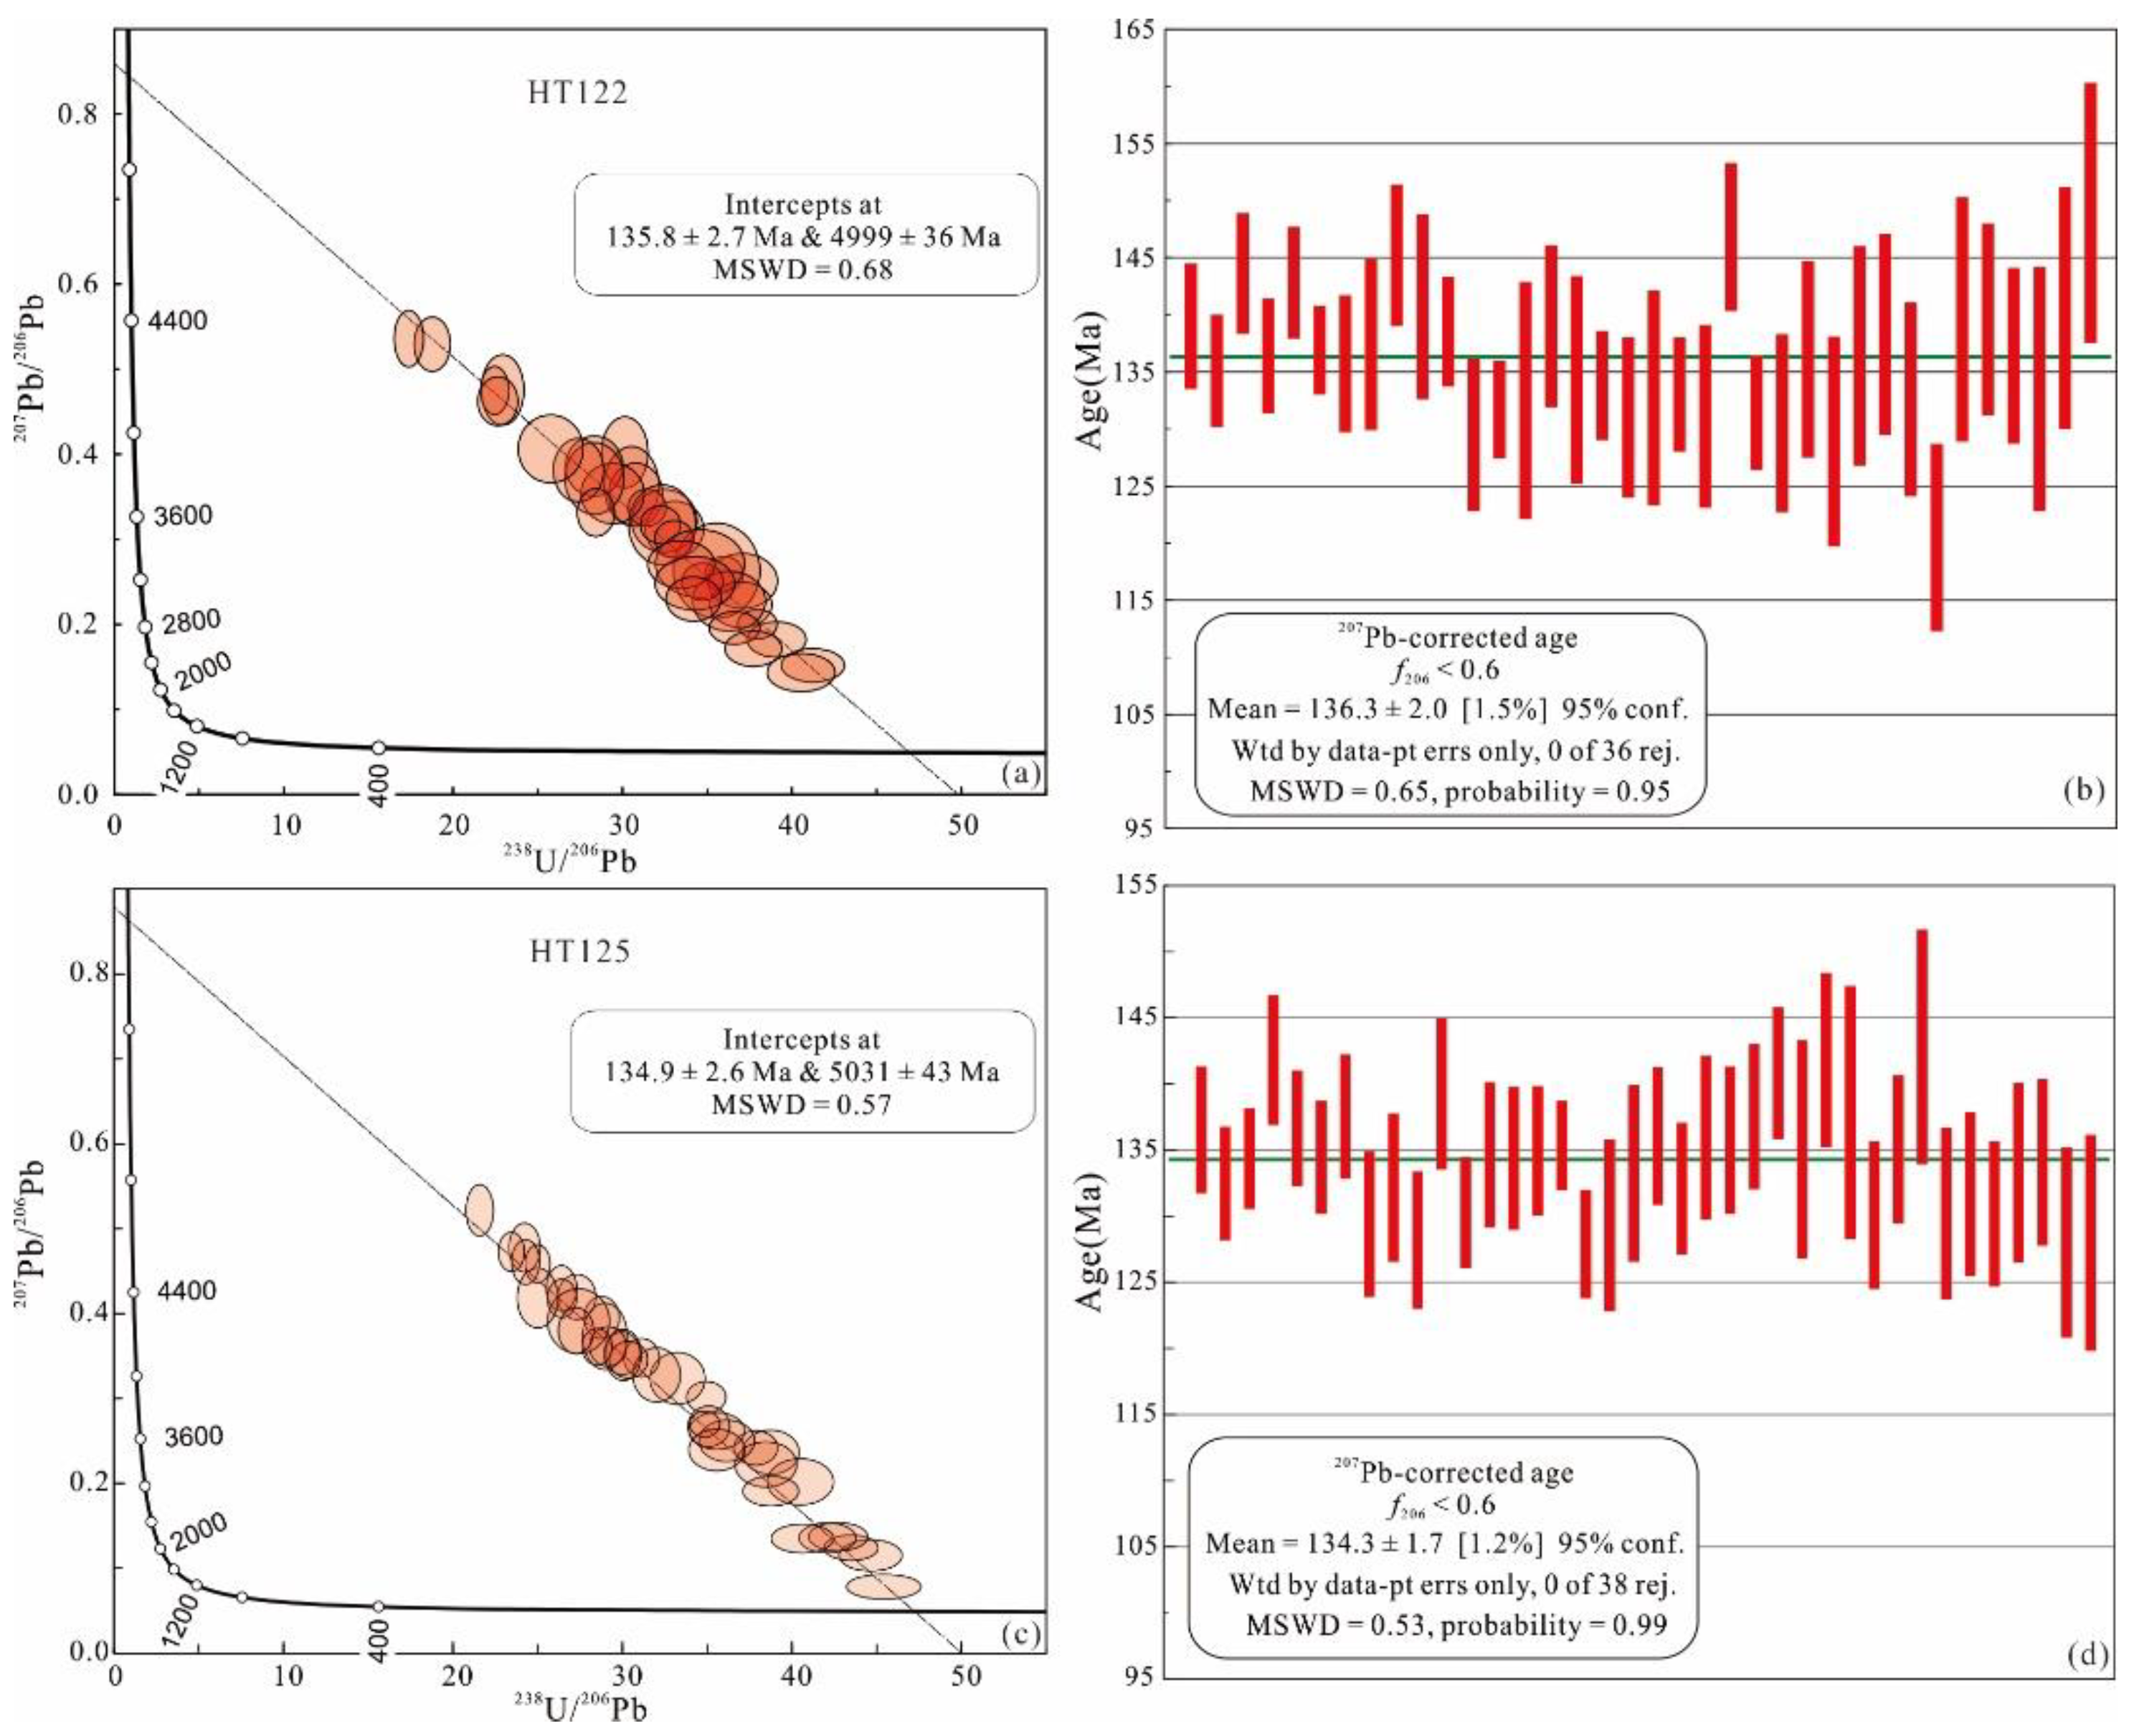
5.1. Cassiterite U–Pb Age
5.2. Fluid Inclusion Study
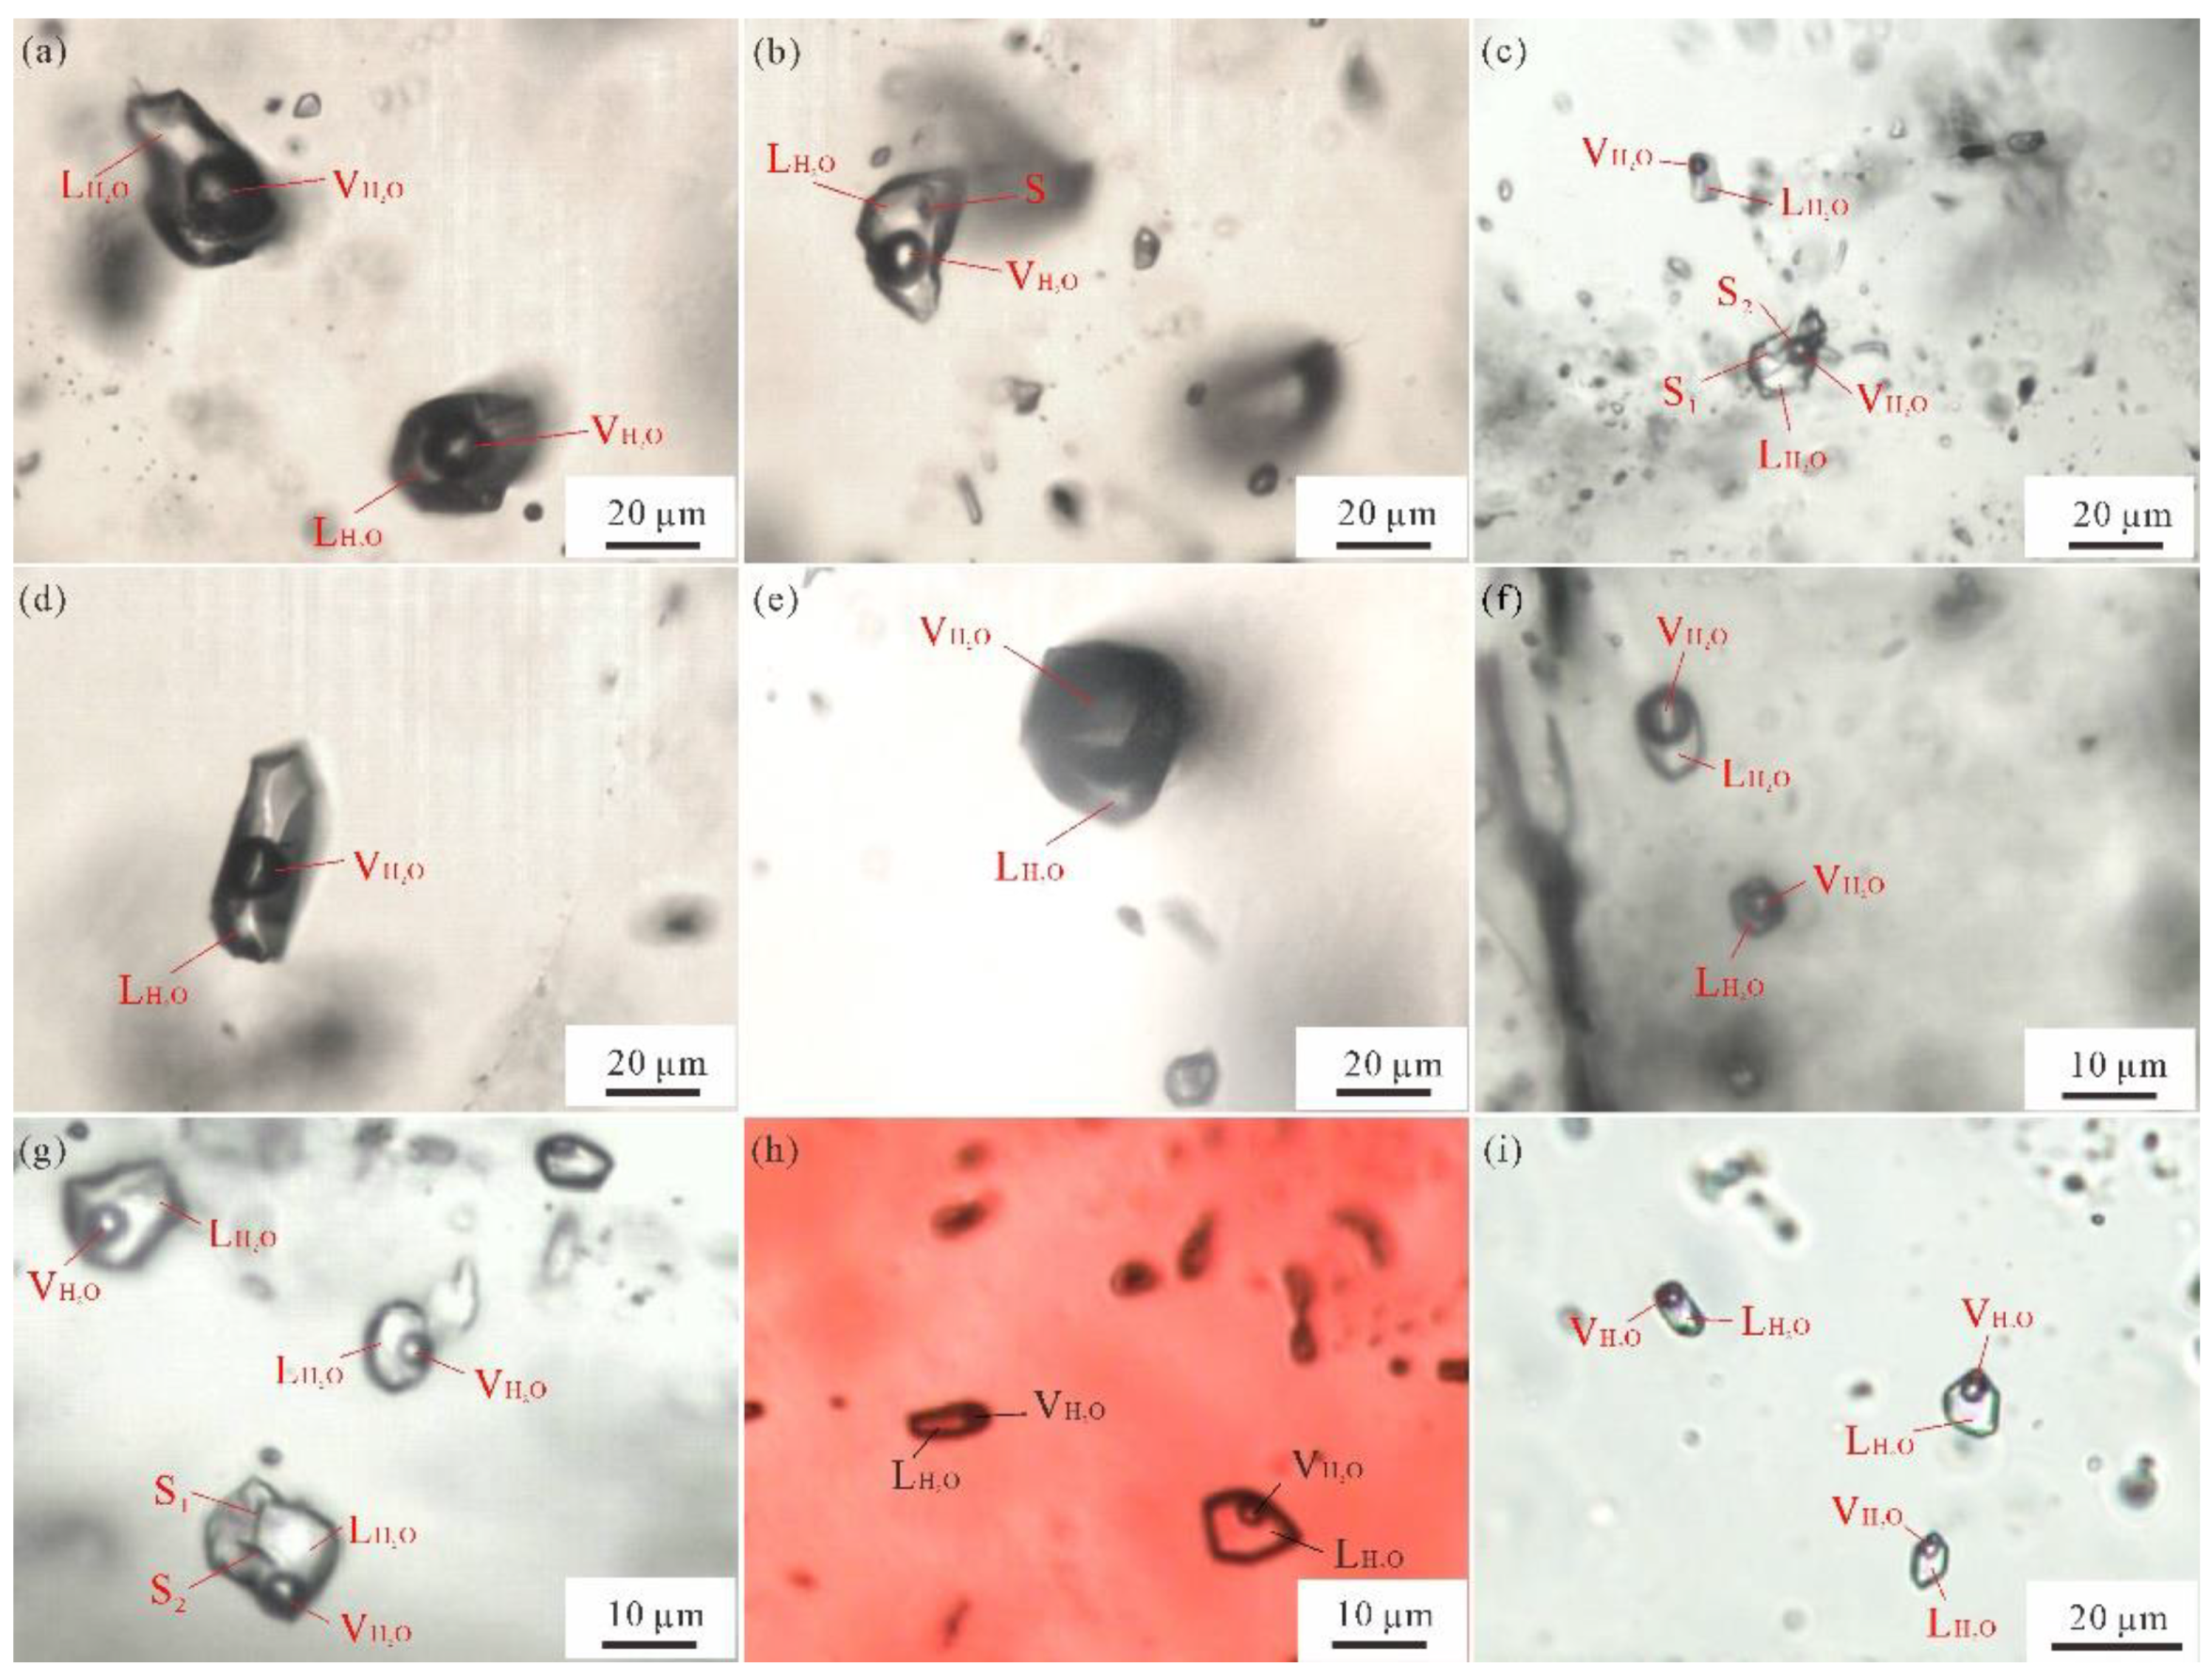
5.2.1. Petrography
- (1)
- Liquid-rich inclusions (WL type): These FIs are extensively hosted in the tested quartz of all the stages and sphalerite of stage III, accounting for approximately 88% of the total number of FIs. They are polygonal, elliptical, long columnar, and irregular in shape, with diameters of 5–20 μm. The bubbles account for 5%–40% of the total volume at room temperature (Figure 9a,c,d,g–i). These FIs were homogenized to liquid when heated. In addition, in this type of FIs, some FIs contain needle-like opaque minerals that did not dissolve when heated (Figure 9b,c,g), implying that they are not daughter minerals. According to the morphology of opaque minerals, we speculate that they may be stibnite and/or jamesonite.
- (2)
- Gas-rich inclusions (WG type): These are exclusively developed in the quartz veins of stages II and III, accounting for about 5% of the total number of FIs, with diameters of 5–40 μm. The WG-type FIs are mostly oval and negative crystal shapes, with bubbles accounting for 52%–85% of the total volume (Figure 9e,f). These FIs were homogenized to vapor when heated.
- (3)
- Pure liquid inclusions (L type): These inclusions are mostly found in stages III and IV, have an irregular or polygonal shape with a size of 4–9 μm, accounting for about 4% of the total number of FIs. They are in a liquid phase at room temperature; when heated, these L-type FIs have no phase change.
- (4)
- Pure gas inclusions (G type): These inclusions predominantly occur in stages II and III. They are 5–8 μm in size and irregular or round in shape, accounting for 3% of the total number of FIs. They are in a gas phase at room temperature and have no phase change when heated.

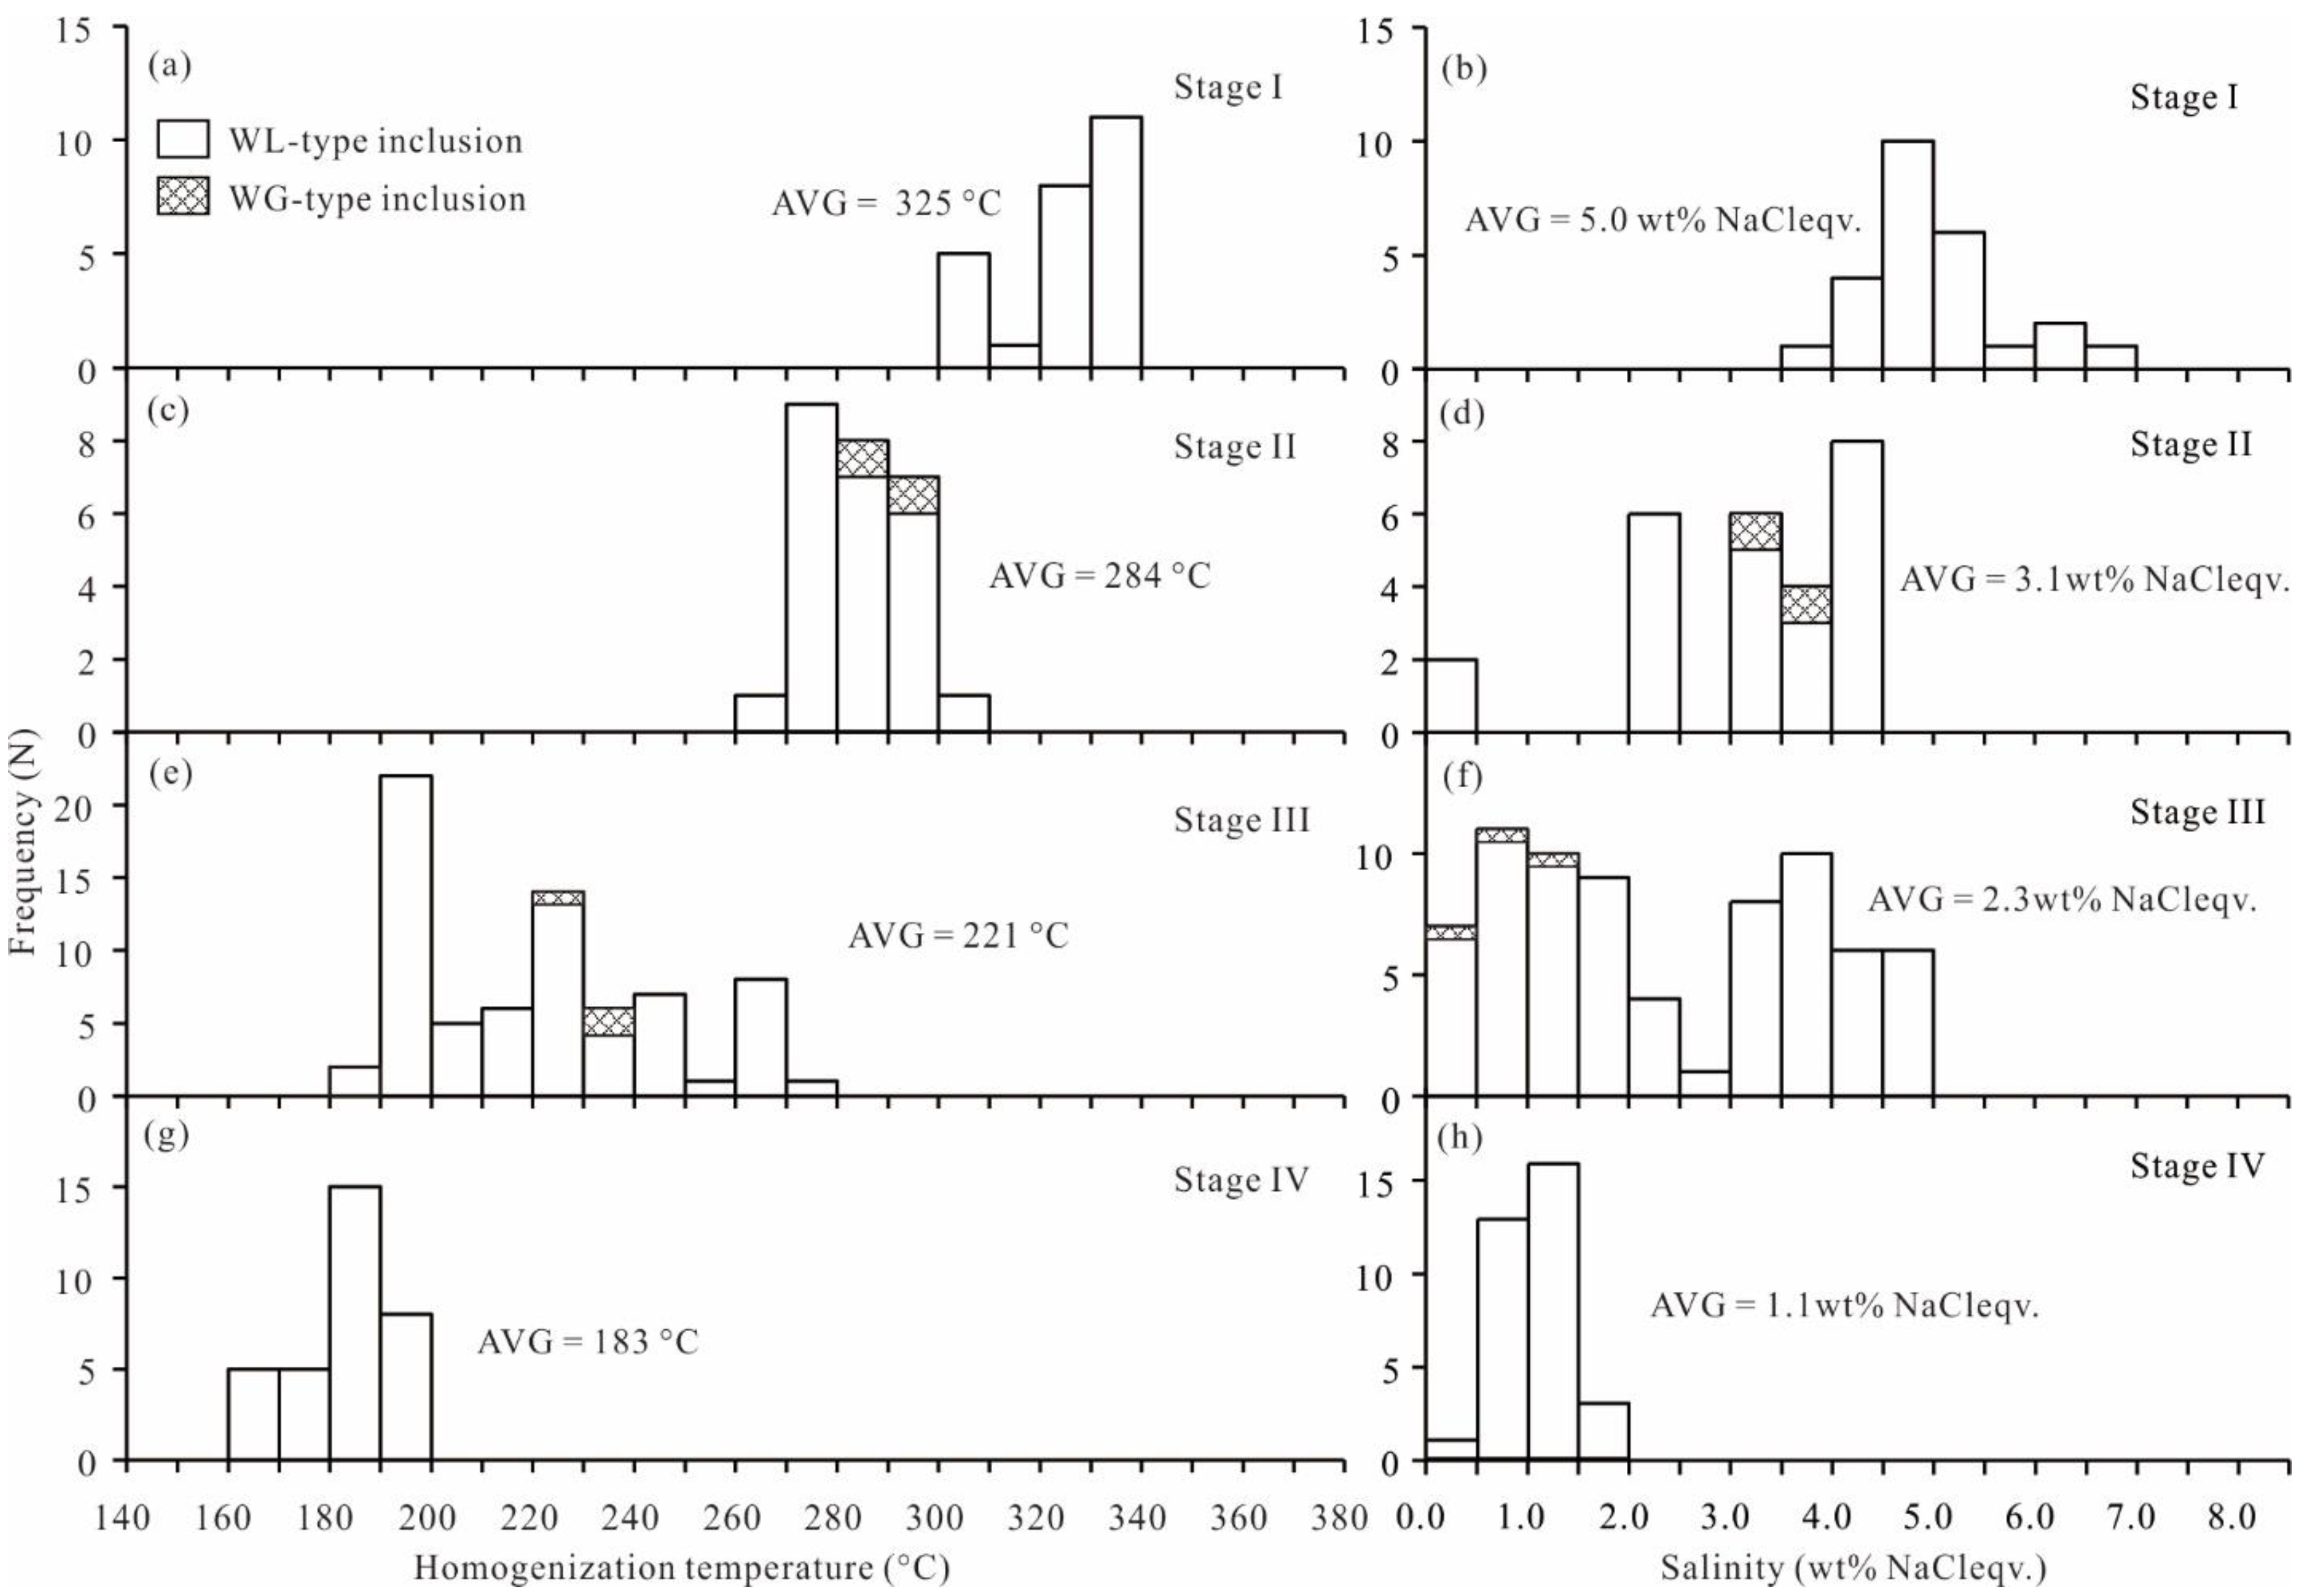
5.2.2. Microthermometry
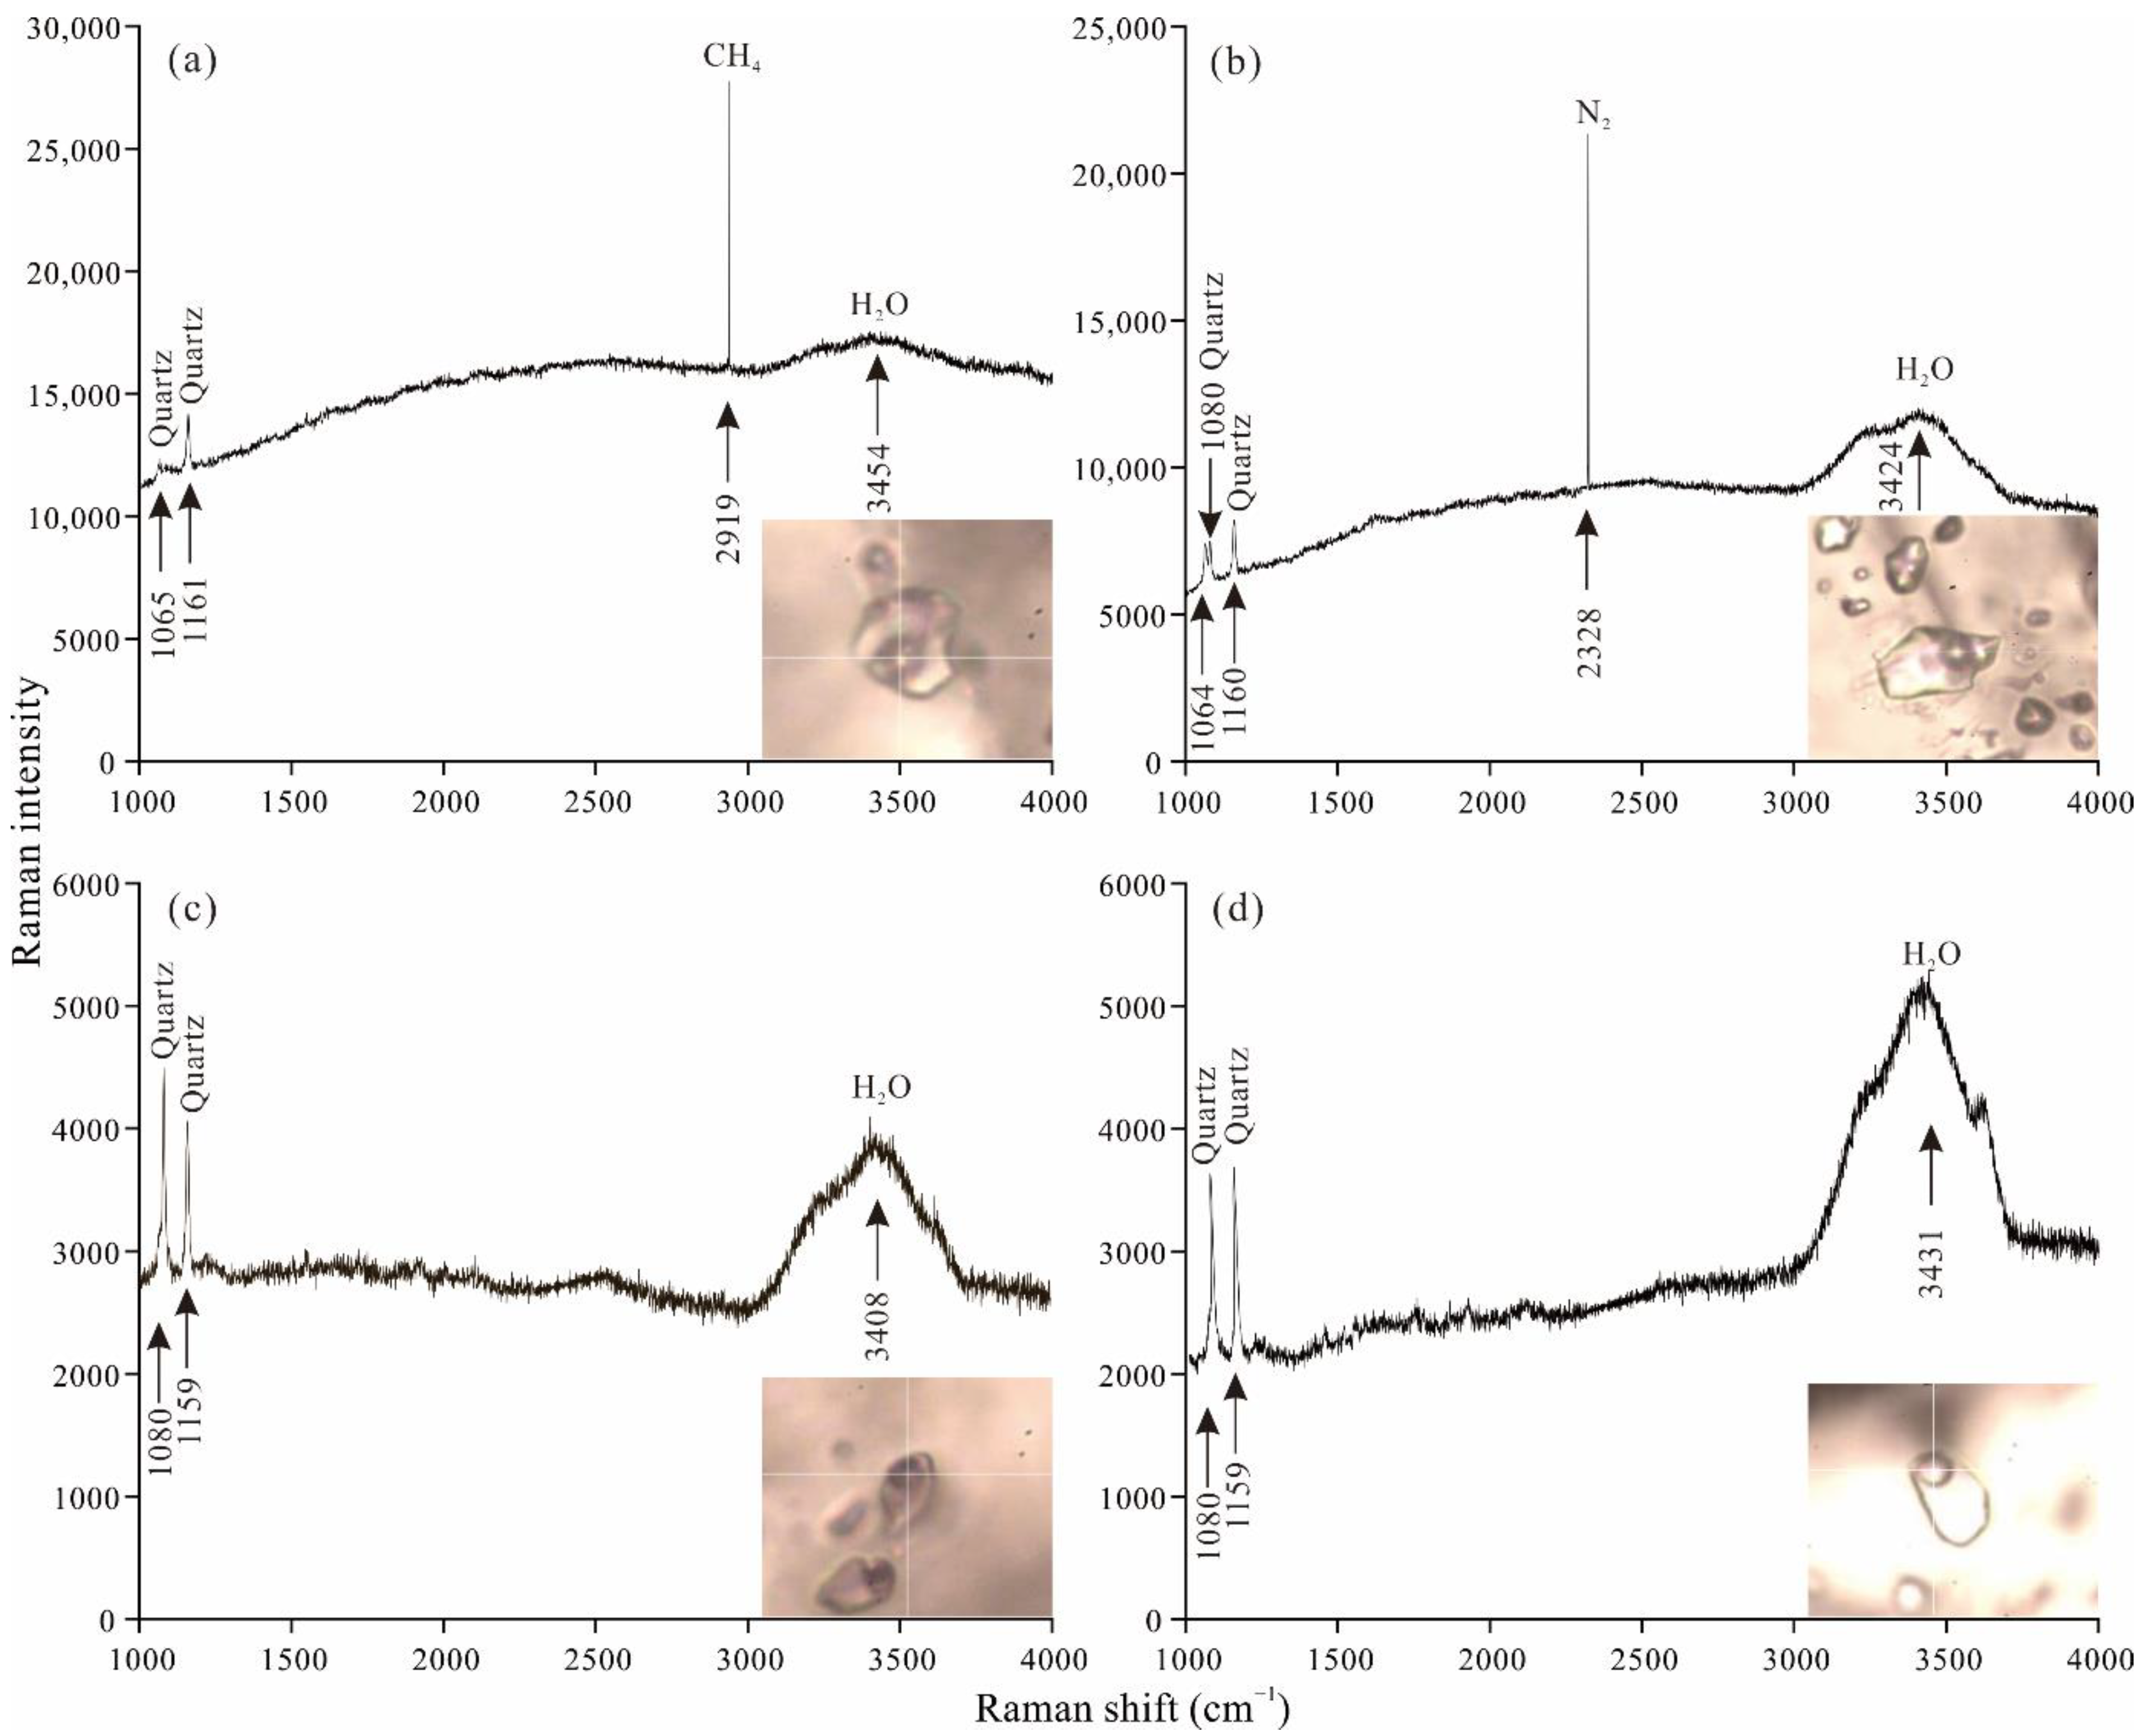
5.2.3. Laser Raman Spectra
5.3. Isotope Data
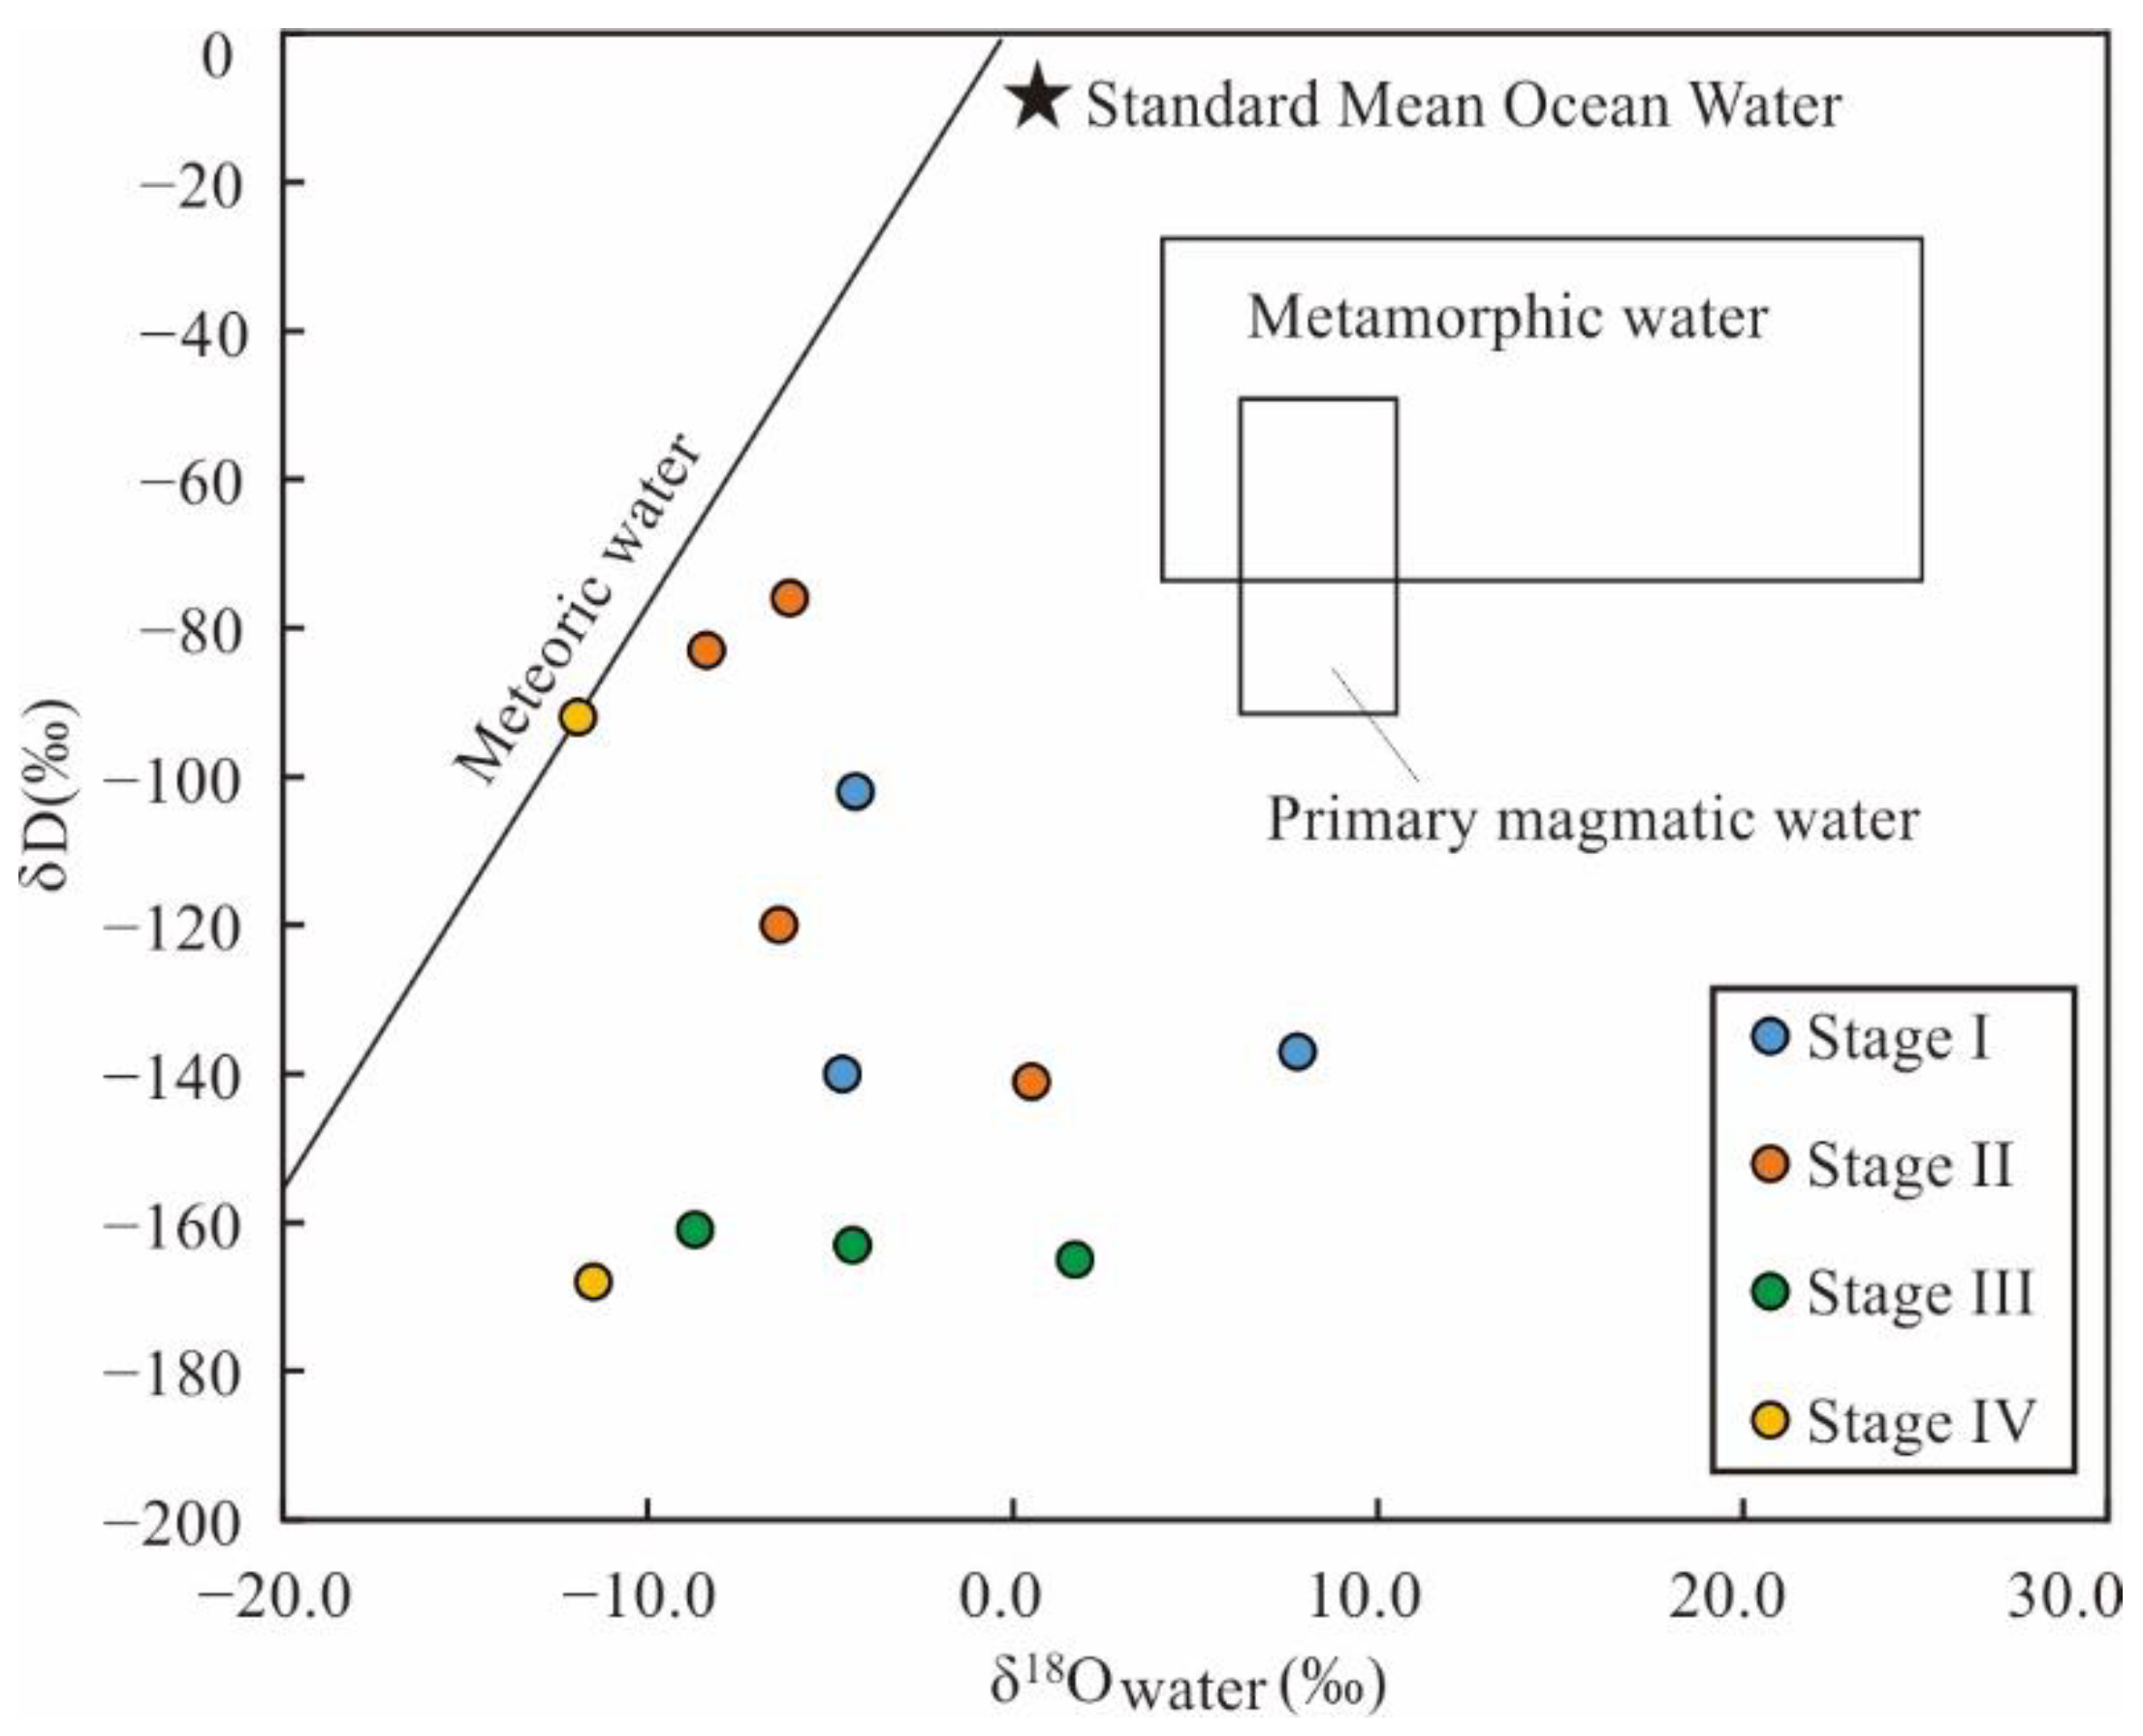
5.3.1. Hydrogen and Oxygen Isotopes
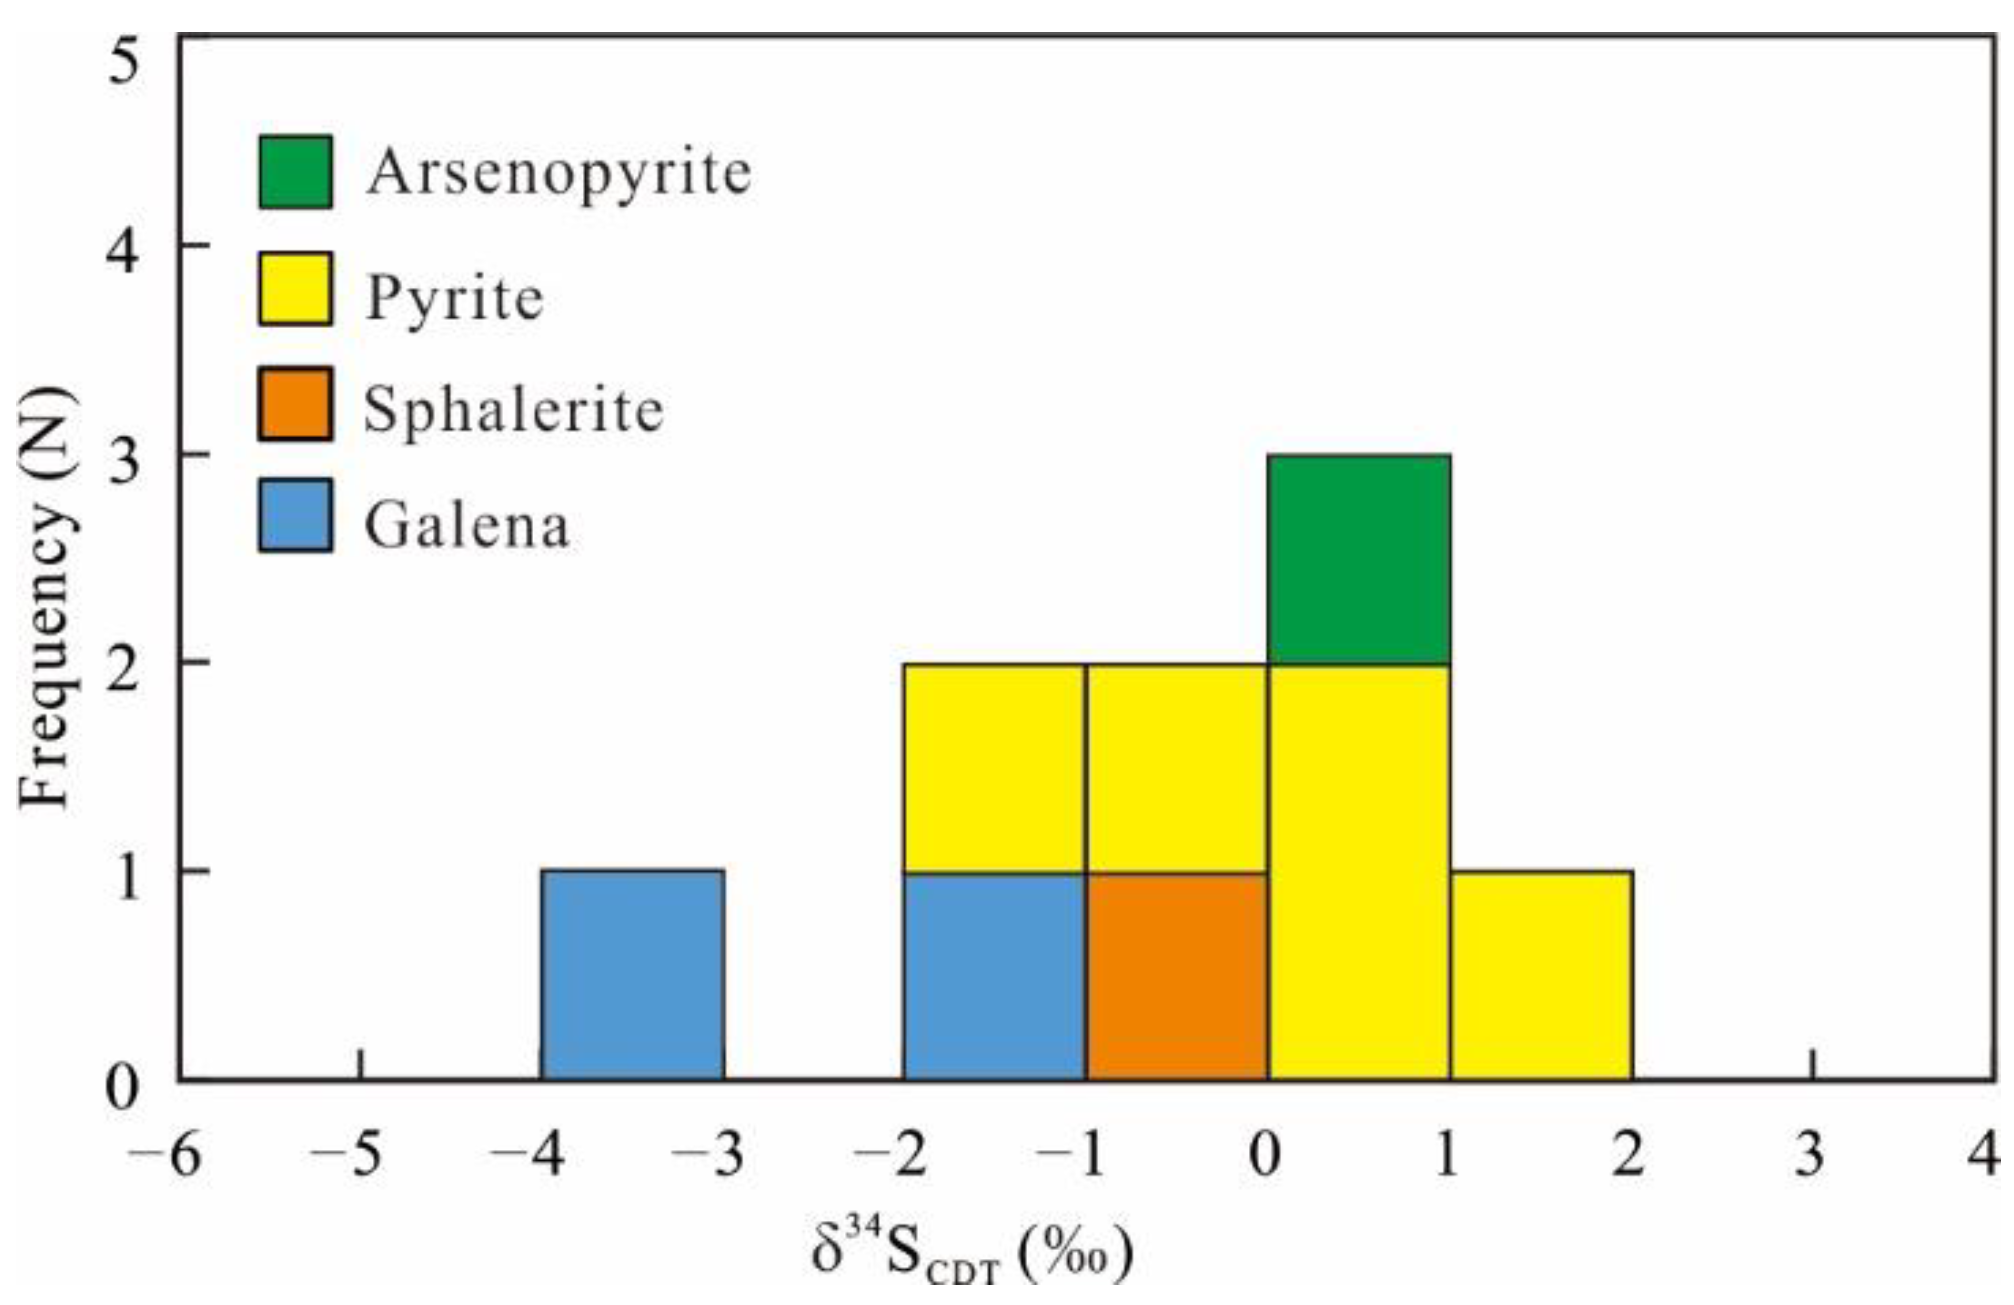
5.3.2. Sulfur Isotope
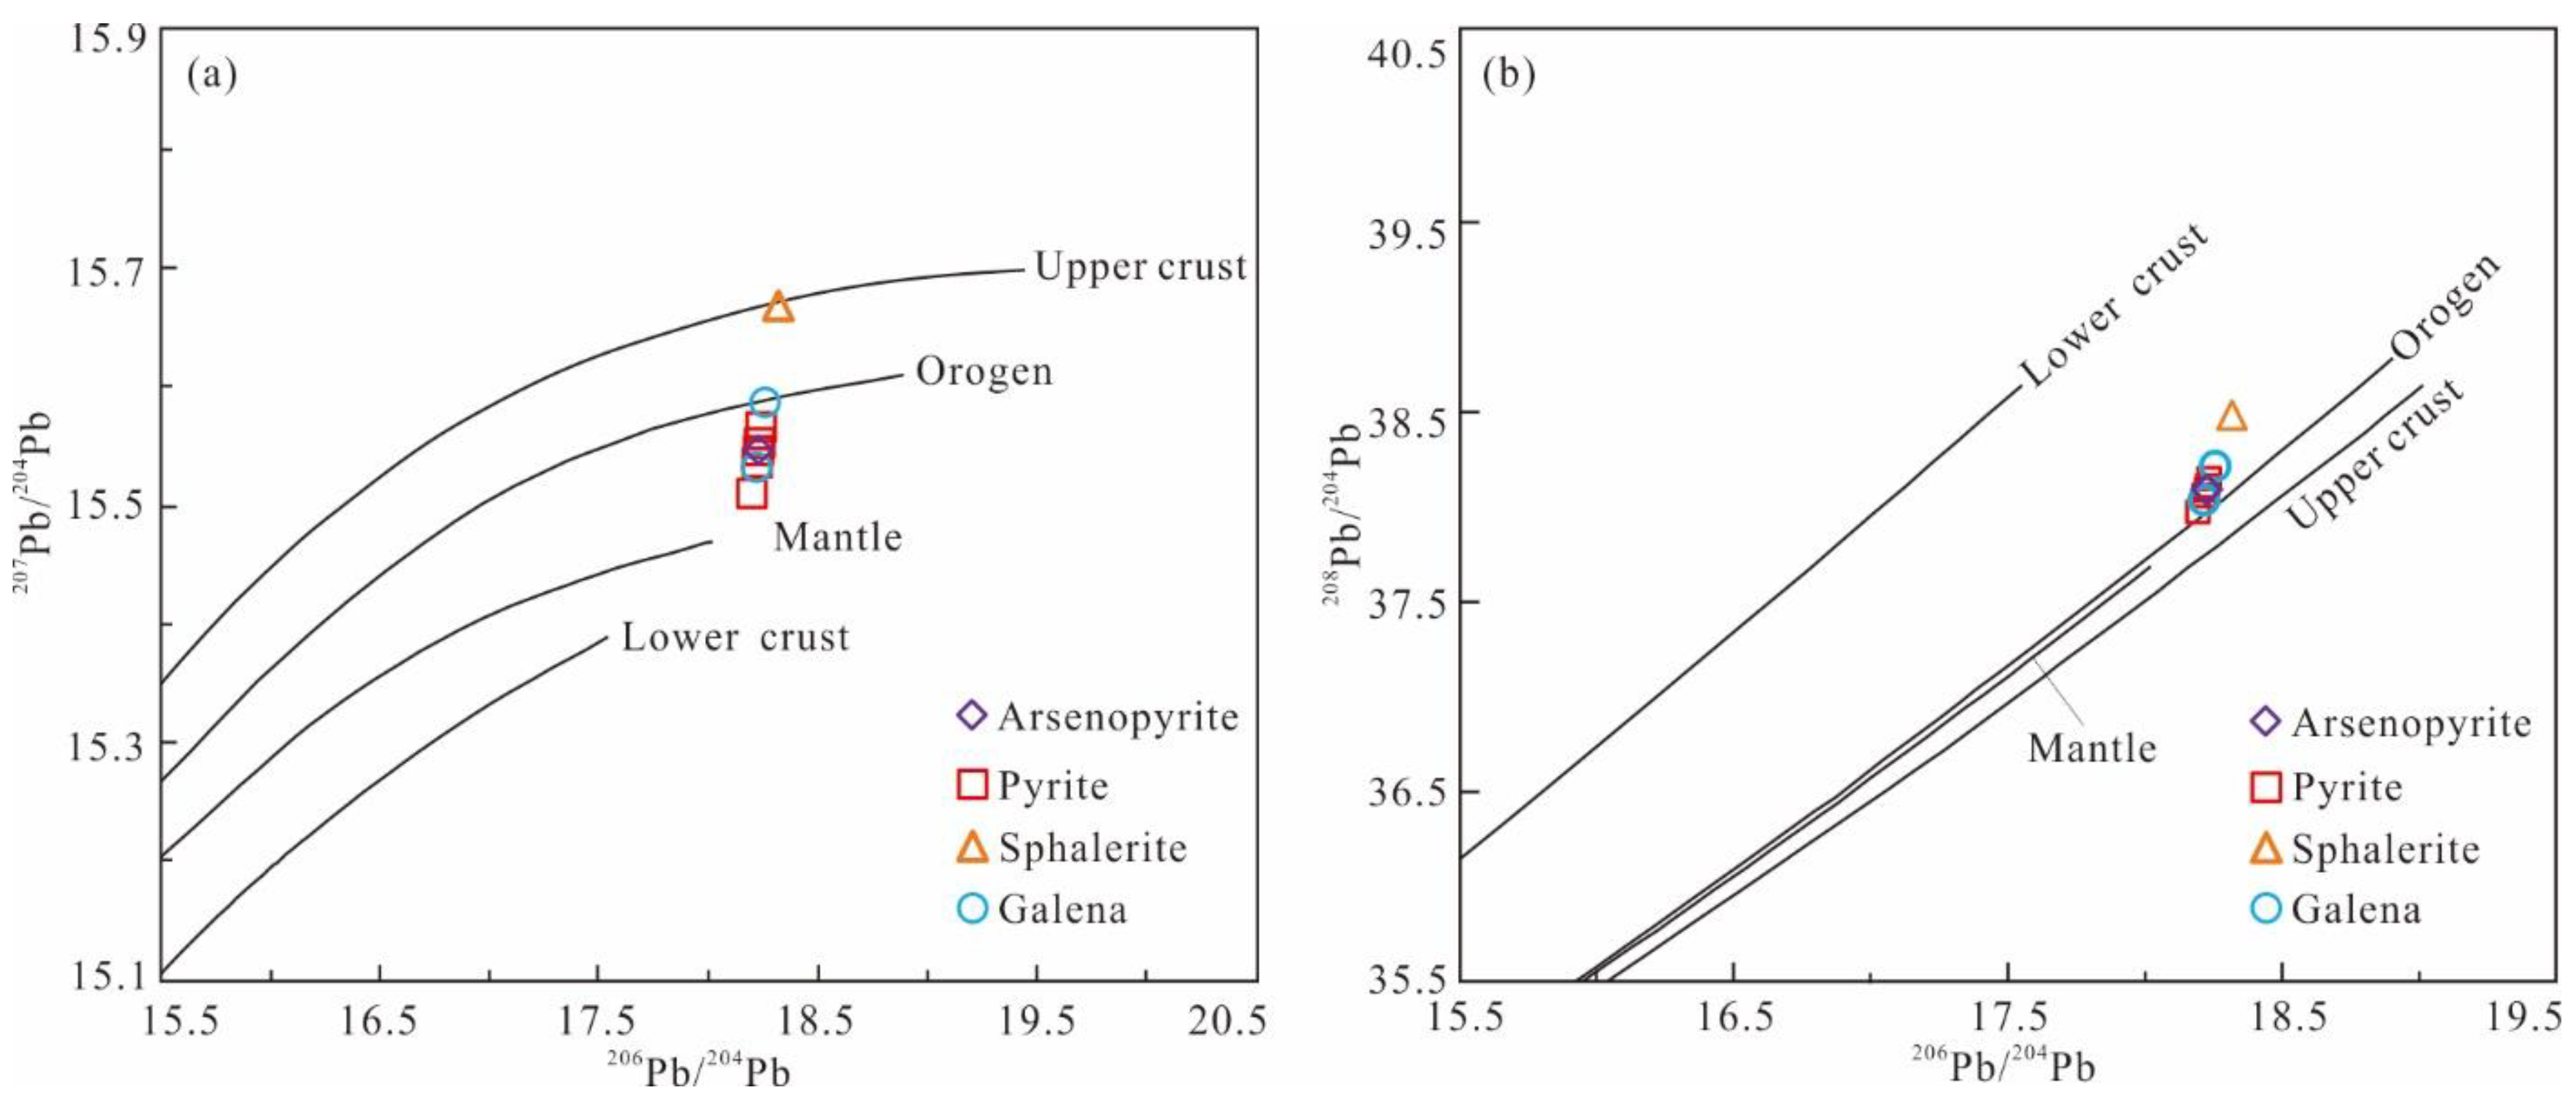
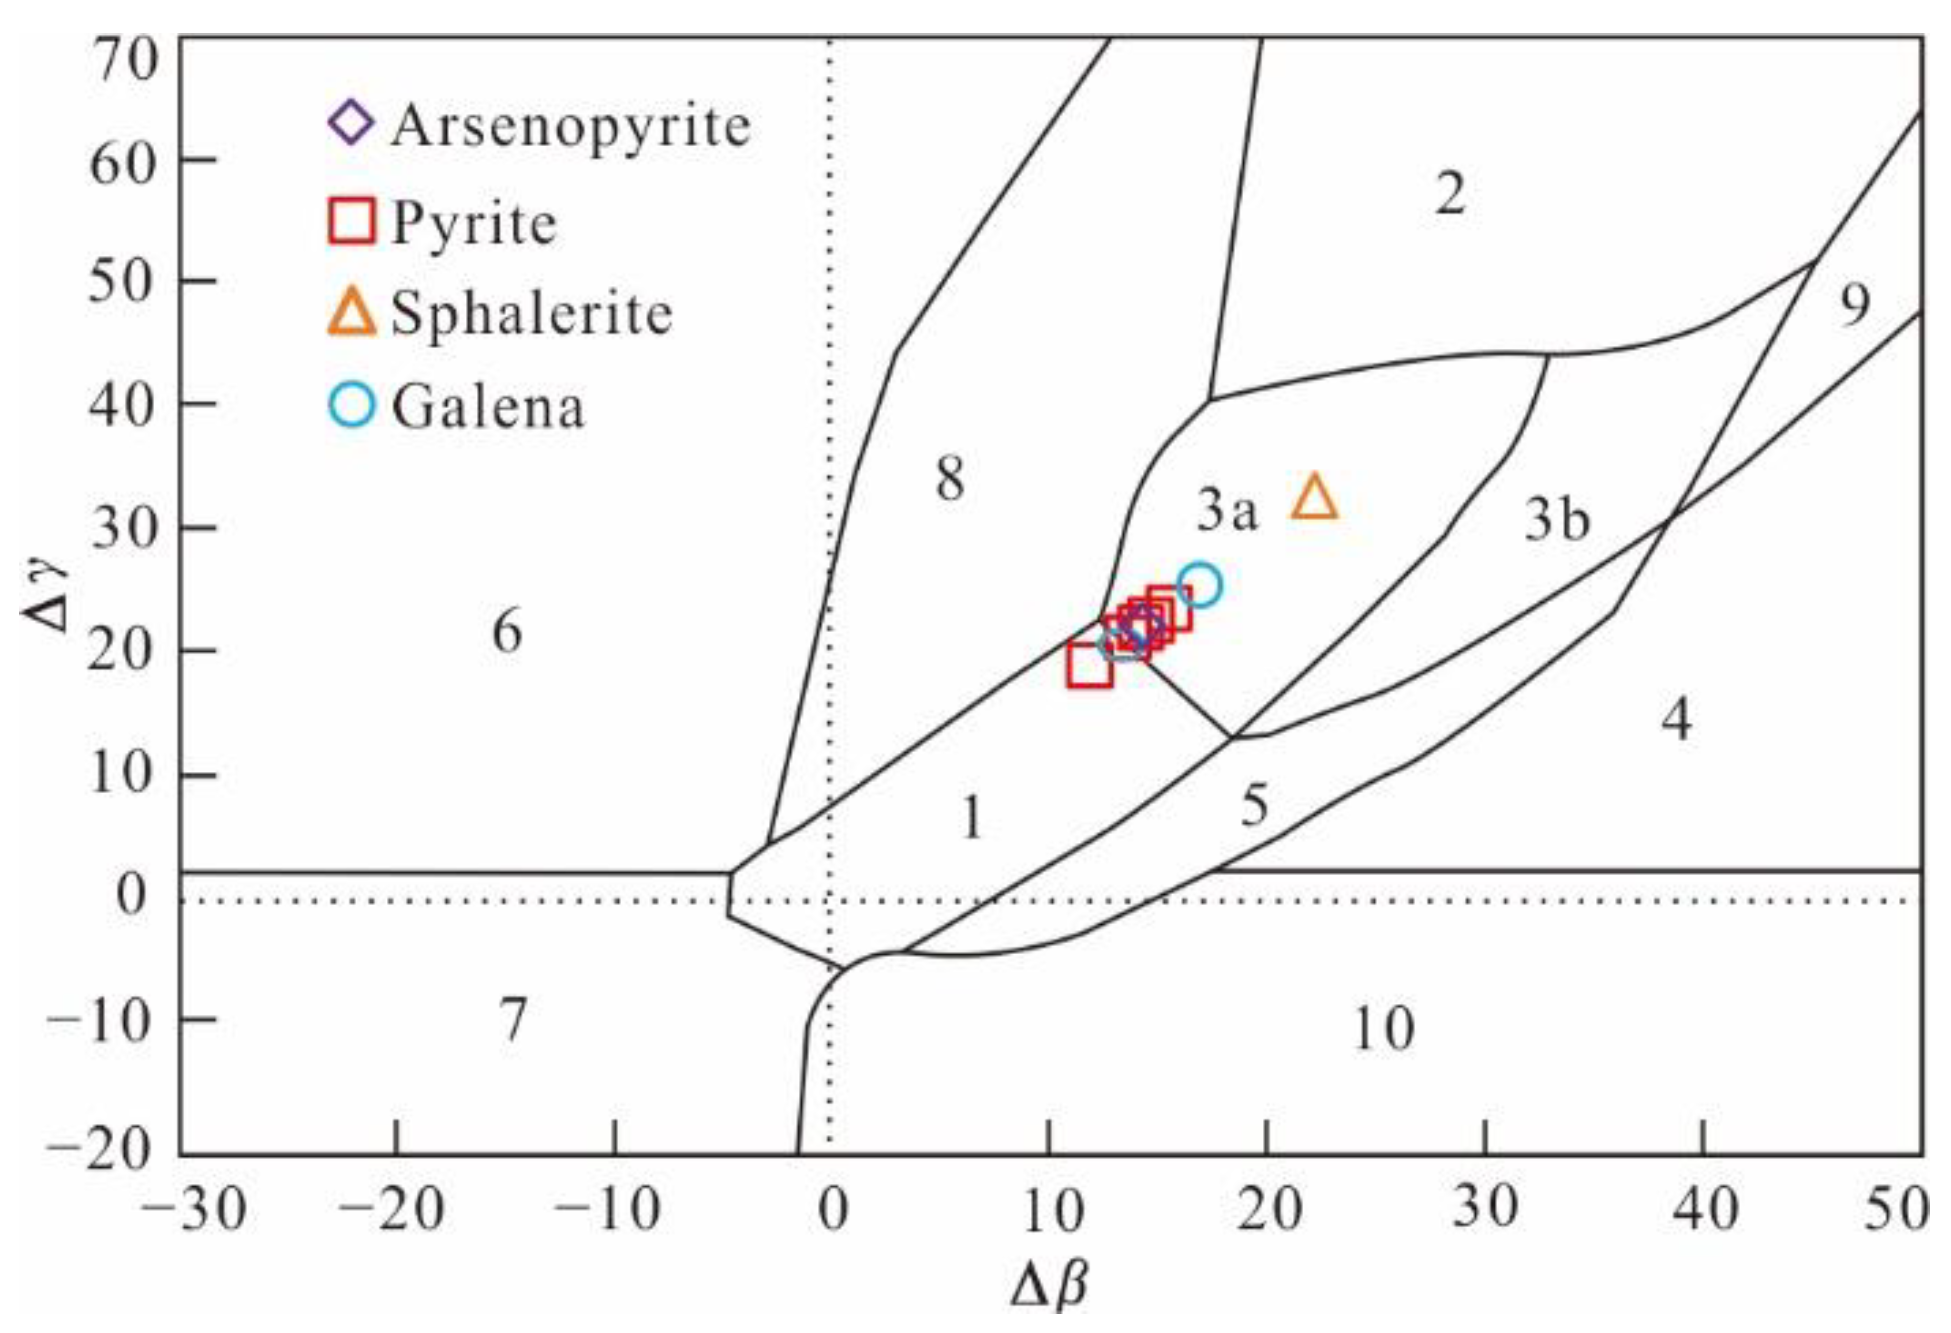
5.3.3. Lead Isotope
6. Discussion
6.1. Mineralization Age
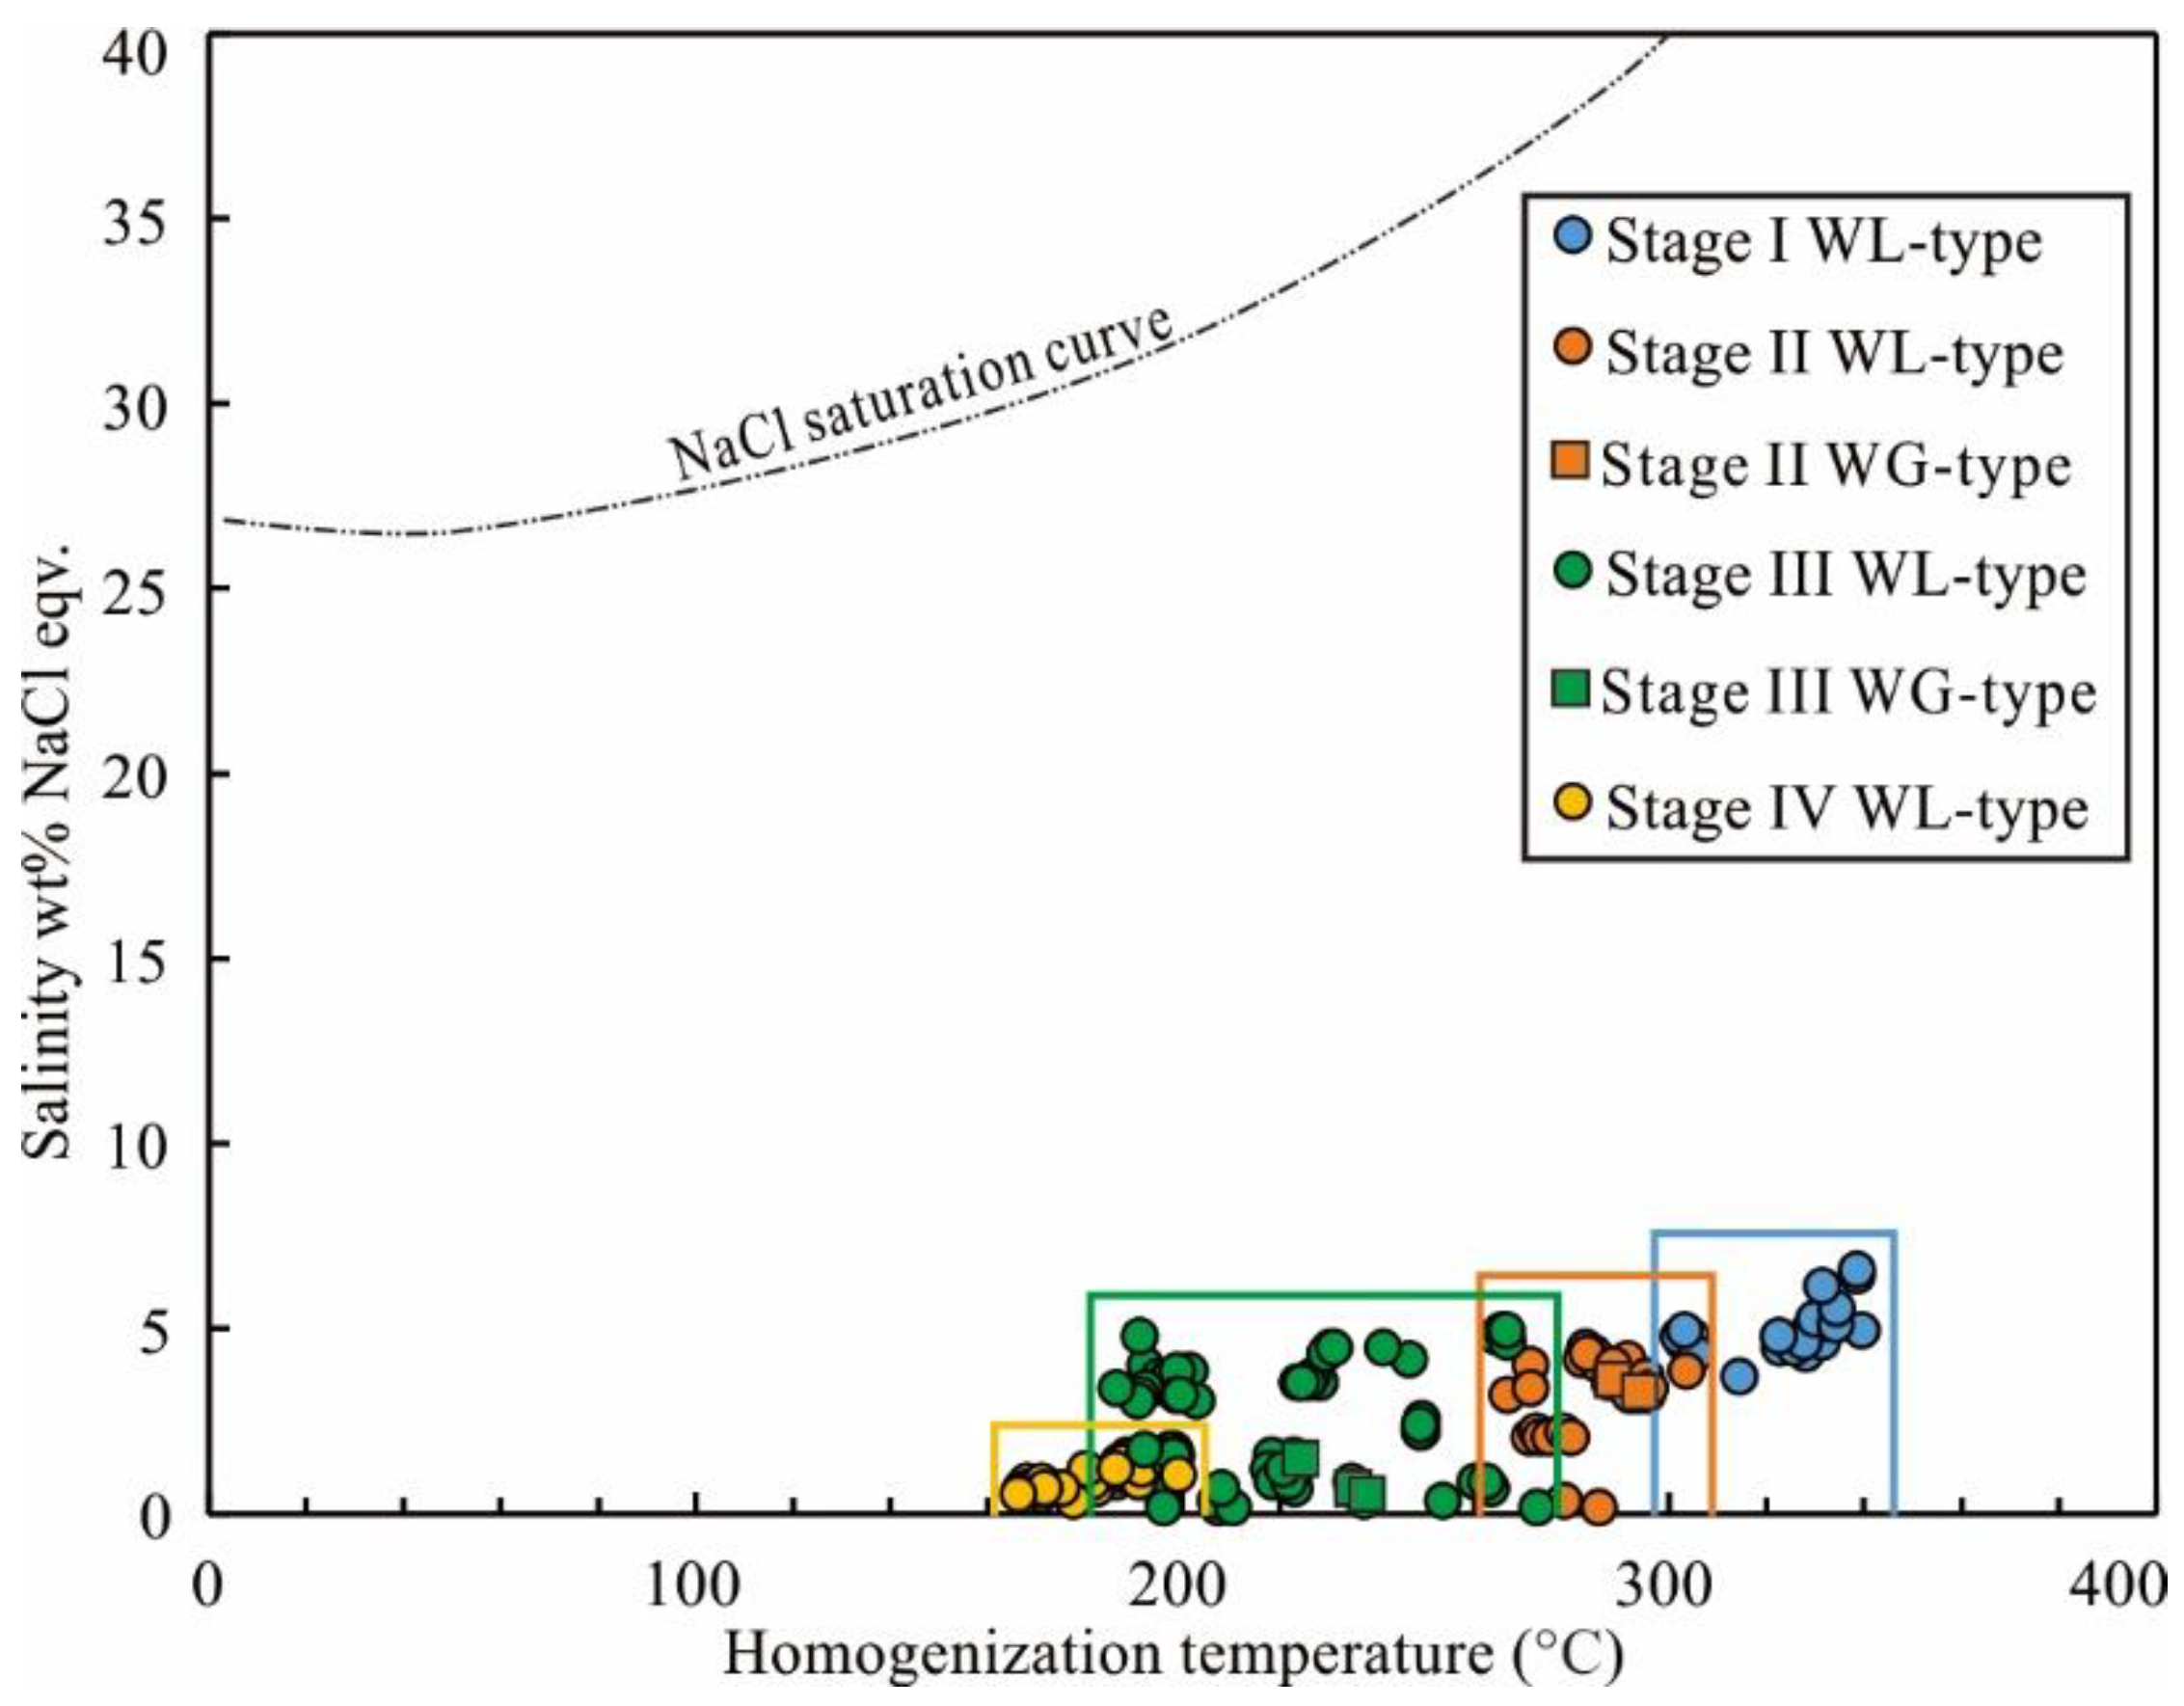
6.2. Nature and Evolution of Ore-Forming Fluids
6.3. Sources of Ore-Forming Fluid and Materials
6.3.1. Origin of Ore-Forming Fluids
6.3.2. Source of Ore-Forming Materials
6.4. Mechanism of Mineral Deposition
7. Conclusions
- (1)
- Cassiterite U–Pb dating indicates that the Huaaobaote deposit formed in the Early Cretaceous (136.3–134.3 Ma).
- (2)
- The ore-forming fluid is characterized by low salinity and has an affinity of H2O–NaCl ± CH4 ± N2 in composition. From early to late periods, the ore-forming fluid underwent an evolution from the high temperature of stage I, through the medium temperature of stages II and III, to the low temperature of stage IV.
- (3)
- The ore-forming fluid of the Huaobaote deposit originated from a mixture of magmatic and meteoric water. With the evolution of ore-forming fluid, the amount of meteoric water increased gradually. The ore-forming materials were dominantly derived from the Early Cretaceous felsic magma.
- (4)
- Fluid mixing, cooling, and immiscibility were the three major mechanisms for the deposition of ore-forming materials. Of these, phase separation caused by fluid immiscibility was important for the precipitation of the Ag–Cu–Sn of stage II and the Ag–Pb–Zn–Sb of stage III, while fluid cooling was main mechanism for the Ag mineral precipitation of stage IV.
Author Contributions
Funding
Data Availability Statement
Acknowledgments
Conflicts of Interest
References
- Wang, J.B.; Wang, Y.W.; Wang, L.J.; Uemoto, T. Tin–polymetallic mineralization in the southern part of the Da Hinggan Mountains, China. Resour. Geol. 2001, 51, 283–291. [Google Scholar] [CrossRef]
- Ouyang, H.G.; Mao, J.W.; Zhou, Z.H.; Su, H.M. Late Mesozoic metallogeny and intracontinental magmatism, southern Great Xing’an Range, northeastern China. Gondwana Res. 2015, 27, 1153–1172. [Google Scholar] [CrossRef]
- Zeng, Q.D.; Liu, J.M.; Chu, S.X.; Guo, Y.P.; Gao, S.; Guo, L.X.; Zhai, Y.Y. Poly-metal mineralization and exploration potential in southern segment of Da Hinggan Mountains. J. Jilin Univ. Earth Sci. Ed. 2016, 46, 1100–1123. (In Chinese) [Google Scholar]
- Jiang, S.H.; Zhang, L.L.; Liu, Y.F.; Liu, C.H.; Kang, H.; Wang, F.X. Metallogeny of Xing–Meng Orogenic Belt and some related problems. Miner. Depos. 2018, 37, 671–711. (In Chinese) [Google Scholar]
- Zhou, Z.H.; Mao, J.W. Metallogenic patterns and ore deposit model of the tin–polymetallic deposits in the southern segment of Great Xing’an Range. Earth Sci. Front. 2022, 29, 176–199. (In Chinese) [Google Scholar]
- Zhao, Y.M. Metallogenic Regularity and Evaluation of Copper Polymetallic Deposits in the Great Xing’an Range and Its Adjacent Areas; Seismological Press: Beijing, China, 1997; pp. 1–318. (In Chinese) [Google Scholar]
- Liu, J.M.; Zhang, R.; Zhang, Q.Z. The regional metallogeny of Da Hinggan Ling, China. Earth Sci. Front. 2004, 11, 269–277. (In Chinese) [Google Scholar]
- Shao, J.D.; Wang, S.G.; Zhao, W.T.; Jia, H.Y.; Wang, X.L.; Zhang, M.; Ren, Y.P. Geological characteristics and prospecting potential in the Daxing’anling region. Geol. Resour. 2007, 16, 252–262. (In Chinese) [Google Scholar]
- Xu, Z.G.; Chen, Y.C.; Wang, D.H.; Chen, Z.H.; Li, H.M. Scheme of the Classification of the Minerogenetic Units in China; Geological Publishing House: Beijing, China, 2008; pp. 1–128. (In Chinese) [Google Scholar]
- Mao, J.W.; Zhou, Z.H.; Wu, G.; Jiang, S.H.; Liu, C.L.; Li, H.M.; Ouyang, H.G.; Liu, J. Metallogenic regularity and minerogenetic series of ore deposits in Inner Mongolia and adjacent areas. Miner. Depos. 2013, 32, 715–729. (In Chinese) [Google Scholar]
- Wang, C.N.; Wang, Q.M.; Yu, X.F.; Han, Z.Z. Metallogenetic characteristics of tin and ore-search prospect in the southern part of Da Hinggan Mountains. Geol. Explor. 2016, 52, 220–227. (In Chinese) [Google Scholar]
- Yao, L.; Lü, Z.C.; Ye, T.Z.; Pang, Z.S.; Jia, H.X.; Zhang, Z.H.; Jia, R.Y.; Wu, Y.F. Geological and Sr–Nd–S–Pb isotopic constraints on the genesis of the Baiyinchagan tin–polymetallic deposit, southern Great Xing’an Range. Acta Petrol. Sin. 2021, 37, 1731–1748. (In Chinese) [Google Scholar]
- Wu, G.; Liu, R.L.; Chen, G.Z.; Li, T.G.; Li, R.H.; Li, Y.L.; Yang, F.; Zhang, T. Mineralization of the Weilasituo rare metal–tin–polymetallic ore deposit in Inner Mongolia: Insights from fractional crystallization of granitic magmas. Acta Petrol. Sin. 2021, 37, 637–664. (In Chinese) [Google Scholar]
- Li, Z.X.; Xie, Z.Y.; Liu, Z.; Li, S.G. Geology and genesis of the Huaaobaote lead–zinc deposit in Inner Mongolia. Geol. Resour. 2008, 17, 278–281. (In Chinese) [Google Scholar]
- Liao, Z.; Wang, Y.W.; Wang, J.B.; Li, H.M.; Long, L.L. LA-MC-ICP-MS cassiterite U–Pb ages of Dajing tin–polymetallic deposit in Inner Mongolia and their geological significance. Miner. Depos. 2014, 33, 421–422. (In Chinese) [Google Scholar]
- Jiang, S.H.; Nie, F.J.; Bai, D.M.; Liu, Y.F.; Liu, Y. Geochronology evidence for Indosinian mineralization in Baiyinnuoer Pb–Zn deposit of Inner Mongolia. Miner. Depos. 2011, 30, 787–798. (In Chinese) [Google Scholar]
- Liu, Y.F.; Jiang, S.H.; Bagas, L.; Han, N.; Chen, C.L.; Kang, H. Isotopic (C–O–S) geochemistry and Re–Os geochronology of the Haobugao Zn–Fe deposit in Inner Mongolia, NE China. Ore Geol. Rev. 2017, 82, 130–147. [Google Scholar] [CrossRef]
- Zhou, Z.H.; Mao, J.W.; Lyckberg, P. Geochronology and isotopic geochemistry of the A-type granites from the Huanggang Sn–Fe deposit, southern Great Hinggan Range, NE China: Implication for their origin and tectonic setting. J. Asian Earth Sci. 2012, 49, 272–286. [Google Scholar] [CrossRef]
- Wang, C.G.; Sun, F.Y.; Sun, G.S.; Sun, J.D.; Li, Y.; Feng, H.D. Geochronology, geochemical and isotopic constraints on petrogenesis of intrusive complex associated with Bianjiadayuan polymetallic deposit on the southern margin of the Greater Khingan, China. Arab. J. Geosci. 2016, 9, 334–350. [Google Scholar] [CrossRef]
- Wang, F.X.; Bagas, L.; Jiang, S.H.; Liu, Y.F. Geological, geochemical, and geochronological characteristics of Weilasituo Sn–polymetal deposit, Inner Mongolia, China. Ore Geol. Rev. 2017, 80, 1206–1229. [Google Scholar] [CrossRef]
- Liu, R.L.; Wu, G.; Li, T.G.; Chen, G.Z.; Wu, L.W.; Zhang, P.C.; Zhang, T.; Jiang, B.; Liu, W.Y. LA-ICP-MS cassiterite and zircon U–Pb ages of the Weilasituo tin–polymetallic deposit in the southern Great Xing’an Range and their geological significance. Earth Sci. Front. 2018, 25, 183–201. (In Chinese) [Google Scholar]
- Chen, G.Z.; Wu, G.; Li, T.G.; Liu, R.L.; Li, R.H.; Li, Y.L.; Yang, F. Mineralization of the Daolundaba Cu–Sn–W–Ag deposit in the southern Great Xing’an Range, China: Constraints from geochronology, geochemistry, and Hf isotope. Ore Geol. Rev. 2021, 133, 104117. [Google Scholar] [CrossRef]
- Yang, F.; Wu, G.; Li, R.H.; Zhang, T.; Chen, G.Z.; Xu, Y.M.; Li, Y.L.; Li, T.G.; Liu, R.L.; Chen, Y.J. Age, fluid inclusion, and H–O–S–Pb isotope geochemistry of the Baiyinchagan Sn–Ag–polymetallic deposit in the southern Great Xing’an Range, NE China. Ore Geol. Rev. 2022, 150, 105194. [Google Scholar] [CrossRef]
- Shen, P.; Shen, Y.C.; Pan, H.D.; Wang, J.B.; Zhang, R.; Zhang, Y.X. Baogutu porphyry Cu–Mo–Au deposit, west Junnggar, northwest China: Petrology, alteration, and mineralization. Econ. Geol. 2010, 105, 947–970. [Google Scholar] [CrossRef]
- Ge, W.C.; Wu, F.Y.; Zhou, C.Y.; Zhang, J.H. Porphyry Cu–Mo deposits in the eastern Xing’an–Mongolian Orogenic Belt: Mineralization ages and their geodynamic implications. Chin. Sci. Bull. 2007, 52, 3416–3427. [Google Scholar] [CrossRef]
- Chen, W.; Li, Y.X.; Wang, S.; Li, Z.; Xue, H.M.; Tong, Y. Geological and mineralizing fluid’s characters of Hua’aobaote silver–polymetallic ore deposit. Nonferrous Met. (Min. Sect.) 2008, 60, 32–50. (In Chinese) [Google Scholar]
- Chen, Y.Q.; Zhou, D.; Guo, L.F. Genetic study on the Huaaobaote Pb–Zn–Ag polymetallic deposit in Inner Mongolia: Evidence from fluid inclusions and S, Pb, H, O isotopes. J. Jilin Univ. Earth Sci. Ed. 2014, 44, 1478–1491. (In Chinese) [Google Scholar]
- Zhao, S.J.; Piao, L.L.; Mi, K.F.; Yi, H.N.; Zhang, X.Q.; Yan, Y.H. Characteristics of the cryptoblastic breccia and subrhyolite at the Huaaobaote silver–lead–zinc deposit. Mod. Min. 2015, 31, 137–143. (In Chinese) [Google Scholar]
- Zhou, G.W. The characteristics and formation mechanism discussion of Huaaobaote ophiolite belt. Geol. Fujian 2016, 35, 266–276. (In Chinese) [Google Scholar]
- Shang, Z.; Chen, Y.Q.; Guo, X.G. Felsic igneous rocks in the Hua’aobaote Pb–Zn–Ag polymetallic orefield, Southern Great Xing’an Range: Genesis, metallogenetic and tectonic significance. Acta Geol. Sin. 2022, 96, 221–239. [Google Scholar] [CrossRef]
- Mao, J.W.; Xie, G.Q.; Zhang, Z.H.; Li, X.F.; Wang, Y.T.; Zhang, C.Q.; Li, Y.F. Mesozoic large–scale metallogenic pulses in North China and corresponding geodynamic settings. Acta Petrol. Sin. 2005, 21, 169–188. (In Chinese) [Google Scholar]
- Wang, T.; Guo, L.; Zheng, Y.D.; Donskaya, T.; Gladkochub, D.; Zeng, L.S.; Li, J.B.; Wang, Y.B.; Mazukabzov, A. Timing and processes of late Mesozoic mid-lower-crustal extension in continental NE Asia and implications for the tectonic setting of the destruction of the North China Craton: Mainly constrained by zircon U–Pb ages from metamorphic core complexes. Lithos 2012, 154, 315–345. [Google Scholar] [CrossRef]
- Inner Mongolian Autonomous Region Bureau of Geology and Mineral Resources. People’s Republic of China Ministry of Geology and Mineral Resources Geological Memoirs; Geological Publishing House: Beijing, China, 1991; pp. 1–498. (In Chinese) [Google Scholar]
- Chen, B.; Jahn, B.M.; Tian, W. Evolution of the Solonker suture zone: Constraints from zircon U–Pb ages, Hf isotopic ratios and whole-rock Sr–Nd isotope compositions of subduction- and collision-related magmas and forearc sediments. J. Asian Earth Sci. 2009, 34, 245–257. [Google Scholar] [CrossRef]
- Lu, L.; Qin, Y.; Zhang, K.J.; Han, C.Y.; Wei, T.; Li, F.Z.; Qu, Z.H. Provenance and tectonic settings of the late Paleozoic sandstones in central Inner Mongolia, NE China: Constraints on the evolution of the southeastern Central Asian Orogenic Belt. Gondwana Res. 2019, 77, 111–135. [Google Scholar] [CrossRef]
- Xu, W.L.; Pei, F.P.; Wang, F.; Meng, E.; Ji, W.Q.; Yang, D.B.; Wang, W. Spatialtemporal relationships of Mesozoic volcanic rocks in NE China: Constraints on tectonic overprinting and transformations between multiple tectonic regimes. J. Asian Earth Sci. 2013, 74, 167–193. [Google Scholar] [CrossRef]
- Zhou, J.B.; Li, L. The Mesozoic accretionary complex in Northeast China: Evidence for the accretion history of Paleo-Pacific subduction. J. Asian Earth Sci. 2017, 145, 91–100. [Google Scholar] [CrossRef]
- Chen, G.Z.; Wu, G.; Yang, F.; Zhang, T.; Li, T.G.; Liu, R.L.; Li, R.H.; Li, Y.L.; Wu, L.W.; Zhang, P.C. Ages, H–O–C–S–Pb isotopes, and fluid inclusion study of the Daolundaba Cu–Sn–W–Ag deposit in Inner Mongolia, NE China. Ore Geol. Rev. 2022, 150, 105171. [Google Scholar] [CrossRef]
- Yang, F.; Wu, G.; Li, R.H.; Zhang, T.; Chen, G.Z.; Chen, Y.J. Petrogenesis of the Alubaogeshan intrusion in the Maodeng–Xiaogushan area, southern Great Xing’an Range, NE China: Implications for magma evolution and tin–polymetallic mineralization. J. Asian Earth Sci. 2022, 238, 105395. [Google Scholar] [CrossRef]
- Liu, J.F.; Chi, X.G.; Zhang, X.Z.; Ma, Z.H.; Zhao, Z.; Wang, T.F.; Hu, Z.C.; Zhao, X.Y. Geochemical characteristic of Carboniferous quartz–diorite in the southern Xiwuqi area, Inner Mongolia and its tectonic significance. Acta Geol. Sin. 2009, 83, 365–376. (In Chinese) [Google Scholar]
- Xue, H.M.; Guo, L.J.; Hou, Z.Q.; Tong, Y.; Pan, X.F.; Zhou, X.W. SHRIMP zircon U–Pb ages of the middle Neopaleozoic unmetamorphosed magmatic rocks in the southwestern slope of the Da Hinggan Mountains, Inner Mongolia. Acta Petrol. Mineral. 2010, 29, 811–823. (In Chinese) [Google Scholar]
- Jian, P.; Kröner, A.; Windley, B.F.; Shi, Y.R.; Zhang, W.; Zhang, L.Q.; Yang, W.R. Carboniferous and Cretaceous mafic–ultramafic massifs in Inner Mongolia (China): A SHRIMP zircon and geochemical study of the previously presumed integral “Hegenshan ophiolite”. Lithos 2012, 142–143, 48–66. [Google Scholar] [CrossRef]
- Dong, J.Y. Charateristics and Geological Significance of Ophiolite on the Area Daqingmuchang in Xiwuqi, Inner Mongolia. Master’s Thesis, China University of Geosciences (Beijing), Beijing, China, 2014. (In Chinese). [Google Scholar]
- Song, S.G.; Wang, M.J.; Wang, C.; Niu, Y.L. Magmatism during continental collision, subduction, exhumation and mountain collapse in collisional orogenic belts and continental net growth: A perspective. Sci. China Earth Sci. 2015, 58, 1284–1304. [Google Scholar] [CrossRef]
- Zhang, Z.C.; Li, K.; Li, J.F.; Tang, W.H.; Chen, Y.; Luo, Z.W. Geochronology and geochemistry of the eastern Erenhot ophiolitic complex: Implications for the tectonic evolution of the Inner Mongolia–Daxinganling Orogenic Belt. J. Asian Earth Sci. 2015, 97, 279–293. [Google Scholar] [CrossRef]
- Ge, W.C.; Wu, F.Y.; Zhou, C.Y.; Zhang, J.H. Zircon U–Pb ages and its significance of the Mesozoic granites in the Wulanhaote region, central Da Hinggan Mountain. Acta Petrol. Sin. 2005, 21, 749–762. (In Chinese) [Google Scholar]
- Wu, F.Y.; Sun, D.Y.; Ge, W.C.; Zhang, Y.B.; Grant, M.L.; Wilde, S.A.; Jahn, B.M. Geochronology of the Phanerozoic granitoids in Northeastern China. J. Asian Earth Sci. 2011, 41, 1–30. [Google Scholar] [CrossRef] [Green Version]
- Zhou, Z.H.; Lü, L.S.; Feng, J.R.; Li, C.; Li, T. Molybdenite Re–Os ages of Huanggang skarn Sn–Fe deposit and their geological significance, Inner Mongolia. Acta Petrol. Sin. 2010, 26, 667–679. (In Chinese) [Google Scholar]
- Chen, G.Z.; Wu, G.; Wu, W.H.; Zhang, T.; Li, T.G.; Liu, R.L.; Wu, L.W.; Zhang, P.C.; Jiang, B.; Wang, Z.L. Fluid inclusion study and isotope characteristics of the Daolundaba copper–polymetallic deposit in the southern Great Xing’an Range. Earth Sci. Front. 2018, 25, 202–221. (In Chinese) [Google Scholar]
- Guo, S.; He, P.; Zhang, X.B.; Cui, Y.R.; Zhang, T.F.; Zhang, K.; Lai, L.; Liu, C.B. Geochronology and geochemistry of Maodeng–Xiaogushan tin–polymetallic ore field in Southern Da Hinggan Mountains and their geological significances. Miner. Depos. 2019, 38, 509–525. (In Chinese) [Google Scholar]
- Li, R.H. Metallogenesis of Tin–Copper–Polymetallic Ore Deposits in the Xilinhot Area, the Southern Great Xing’an Range. Ph.D. Thesis, Peking University, Beijing, China, 2019; pp. 1–238. (In Chinese). [Google Scholar]
- Fujian Institute of Geological Survey. 1/50,000 Geological Map Specification (Huaaobaote Frame); Geological Survey of China Geological Survey: Beijing, China, 2013. (In Chinese) [Google Scholar]
- Inner Mongolia Autonomous Region No. 10 Institute of Geological and Mineral Exploration and Development. Exploration Report of Silver-Lead-Zinc Deposit in Huaaobao Mining Area, West Ujimqin Banner, Inner Mongolia Autonomous Region; Inner Mongolia Yulong Mining Co., Ltd.: Xilinhot, China, 2009. (In Chinese) [Google Scholar]
- Carr, P.A.; Zink, S.; Bennett, V.C.; Norman, M.D.; Amelin, Y.; Blevin, P.L. A new method for U–Pb geochronology of cassiterite by ID-TIMS applied to the Mole Granite polymetallic system, eastern Australia. Chem. Geol. 2020, 539, 11953. [Google Scholar] [CrossRef]
- Chew, D.M.; Petrus, J.A.; Kamber, B.S. U–Pb LA-ICPMS dating using accessory mineral standards with variable common Pb. Chem. Geol. 2014, 363, 185–199. [Google Scholar] [CrossRef]
- Ludwig, K.R. Isoplot: Isoplot 4.15: A Geochronological Toolkit for Microsoft Excel; Berkeley Geochronology Center: Berkeley, CA, USA, 2008. [Google Scholar]
- Bodnar, R.J. Revised equation and table for determining the freezing-point depression of H2O–NaCl solutions. Geochim. Cosmochim. Acta 1993, 57, 683–684. [Google Scholar] [CrossRef]
- Brown, P.E. FLINCOR: A microcomputer program for the reduction and investigation of fluid-inclusion data. Am. Mineral. 1989, 74, 1390–1393. [Google Scholar]
- Coleman, B.D.; Mares, M.A.; Willig, M.R.; Hsieh, Y.H. Randomness, area, and species richness. Ecology 1982, 63, 1121–1133. [Google Scholar] [CrossRef]
- Clayton, R.N.; Mayeda, T.K. The use of bromine pentafluoride in the extraction of oxygen from oxides and silicates for isotopic analysis. Geochim. Cosmochim. Acta 1963, 27, 43–52. [Google Scholar] [CrossRef]
- Cao, H.W.; Li, G.M.; Zhang, R.Q.; Zhang, Y.H.; Zhang, L.K.; Dai, Z.W.; Zhang, Z.; Liang, W.; Dong, S.L.; Xia, X.B. Genesis of the Cuonadong tin polymetallic deposit in the Tethyan Himalaya: Evidence from geology, geochronology, fluid inclusions and multiple isotopes. Gondwana Res. 2021, 92, 72–101. [Google Scholar] [CrossRef]
- Clayton, R.N.; Mayeda, T.K.; Oneil, J.R. Oxygen isotope: Exchange between quartz and water. J. Geophys. Res. 1972, 77, 3057–3067. [Google Scholar] [CrossRef]
- Robinson, B.W.; Kusakabe, M. Quantitative preparation of sulfur dioxide, for 34S/32S analyses, from sulfides by combustion with cuprous oxide. Anal. Chem. 1975, 47, 1179–1181. [Google Scholar] [CrossRef]
- Todt, W.; Cliff, R.A.; Hanser, A.; Hofmann, A.W. Re-calibration of NBS lead standards using a 202Pb–205Pb double spike. Terra Abstract 1993, 5, 1–396. [Google Scholar]
- Sheppard, S.M.F. Characterization and isotopic variations in natural-waters. Rev. Mineral. Geochem. 1986, 16, 165–183. [Google Scholar]
- Chen, Y.W.; Mao, C.X.; Zhu, B.Q. Lead isotopic composition and genesis of Phanerozoic metal deposit in China. Geochemistry 1982, 1, 137–158. [Google Scholar] [CrossRef]
- Zartman, R.E.; Doe, B.R. Plumbotectonics: The model. Tectonophysics 1981, 75, 135–162. [Google Scholar] [CrossRef]
- Gulson, B.L.; Jones, M.T. Cassiterite: Potential for direct dating of mineral deposits and a precise age for the Bushveld complex granites. Geology 1992, 20, 355–358. [Google Scholar] [CrossRef]
- Yuan, S.D.; Peng, J.T.; Hu, R.Z.; Li, H.M.; Shen, N.P.; Zhang, D.L. A precise U–Pb age on cassiterite from the Xianghualing tin–polymetallic deposit (Hunan, south China). Miner. Depos. 2008, 43, 375–382. (In Chinese) [Google Scholar] [CrossRef]
- Yuan, S.D.; Peng, J.T.; Hao, S.; Li, H.M.; Geng, J.Z.; Zhang, D.L. In situ LA-MC-ICP-MS and ID-TIMS U–Pb geochronology of cassiterite in the giant Furong tin deposit, Hunan Province, South China: New constraints on the timing of tin–polymetallic mineralization. Ore Geol. Rev. 2011, 43, 235–242. [Google Scholar] [CrossRef]
- Pan, X.F.; Guo, L.J.; Wang, S.; Xue, H.M.; Hou, Z.Q.; Tong, Y.; Li, Z.M. Laser microprobe Ar–Ar dating of biotite from the Weilasituo Cu–Zn polymetallic deposit in Inner Mongolia. Acta Petrol. Mineral. 2009, 28, 473–479. (In Chinese) [Google Scholar]
- Zhai, D.G.; Liu, J.J.; Zhang, H.Y.; Yao, M.J.; Wang, J.P.; Yang, Y.Q. S–Pb isotopic geochemistry, U–Pb and Re–Os geochronology of the Huanggangliang Fe–Sn deposit, Inner Mongolia, NE China. Ore Geol. Rev. 2014, 59, 109–122. [Google Scholar] [CrossRef]
- Chang, Y.; Lai, Y. Study on characteristics of ore-forming fluid and chronology in the Yindu Ag–Pb–Zn polymetallic ore deposit, Inner Mongolia. Acta Sci. Nat. Univ. Pekinensis. 2010, 46, 581–593. (In Chinese) [Google Scholar]
- Zhai, D.G.; Liu, J.J.; Zhang, A.L.; Sun, Y.Q. U–Pb, Re–Os, and 40Ar/39Ar geochronology of porphyry Sn ± Cu ± Mo and polymetallic (Ag–Pb–Zn–Cu) vein mineralization at Bianjiadayuan, Inner Mongolia, northeast China: Implications for discrete mineralization events. Econ. Geol. 2017, 112, 2041–2059. [Google Scholar] [CrossRef] [Green Version]
- Wang, C.Y.; Li, J.F.; Wang, K.Y. Fluid inclusions, stable isotopes, and geochronology of the Haobugao lead–zinc deposit, Inner Mongolia, China. Resour. Geol. 2019, 69, 65–84. [Google Scholar] [CrossRef]
- Wang, M.Y.; He, L. Re–Os dating of molybdenites from Chamuhan W–Mo deposit, Inner Mongolia and its geological implications. Geotecton. Metallog. 2013, 37, 49–56. (In Chinese) [Google Scholar]
- Zhang, L.L.; Jiang, S.H.; Bagas, L.; Han, N.; Liu, Y.; Liu, Y.F. Element behavior during interaction of magma and fluid: A case study of Chamuhan granite, and implications on the genesis of W–Mo mineralization. Lithos 2019, 342–343, 31–44. [Google Scholar] [CrossRef]
- Zhang, X.B.; Wang, K.Y.; Wang, C.Y.; Li, W.; Yu, Q.; Wang, Y.; Li, J.F.; Wan, D.; Huang, G.H. Age, genesis, and tectonic setting of the Mo–W mineralized Dongshanwan granite porphyry from the Xilamulun metallogenic belt, NE China. J. Earth Sci. 2017, 28, 433–446. [Google Scholar] [CrossRef]
- Rye, R.O.; Ohmoto, H. Sulfur and carbon isotopes and ore genesis: A review. Econ. Geol. 1974, 69, 826–842. [Google Scholar] [CrossRef]
- Wilkinson, J.J.; Jenkin, G.R.T.; Fallick, A.E.; Foster, R.P. Oxygen and hydrogen isotopic evolution of Variscan crustal fluids, south Cornwall, UK. Chem. Geol. 1995, 123, 239–254. [Google Scholar] [CrossRef]
- Ohmoto, H. Systematics of sulfur and carbon isotopes in hydrothermal ore deposits. Econ. Geol. 1972, 67, 551–578. [Google Scholar] [CrossRef]
- Ohmoto, H.; Rye, R.O. Isotopes of sulphur and carbon. In Geochemistry of Hydrothermal Ore Deposits, 2nd ed.; Bames, H.L., Ed.; John Wiley & Sons: New York, NY, USA, 1979; pp. 509–567. [Google Scholar]
- Sakai, H. Isotopic properties of sulfur compounds in hydrothermal processes. Geochem. J. 1968, 2, 29–49. [Google Scholar] [CrossRef]
- Bachinski, D.J. Bond strength and sulfur isotope fractionation in coexisting sulfides. Econ. Geol. 1969, 64, 56–65. [Google Scholar] [CrossRef]
- Hoefs, J. Isotope Fractionation Processes of Selected Elements. In Stable Isotope Geochemistry, 9th ed.; Springer Nature: Cham, Switzerland, 2021; pp. 1–528. [Google Scholar]
- Xu, J.H.; He, Z.L.; Shen, S.L.; Yang, Z.L.; Du, J.F. Stable isotope geology of the Dongchuang and the Wenyu gold deposits and the source of ore-forming fluids and materials. Contri. Geol. Miner. Resour. Res. 1993, 8, 87–100. (In Chinese) [Google Scholar]
- Townley, B.K.; Godwin, C.I. Isotope characterization of lead in galena from ore deposits of the Aysen Region, southern Chile. Miner. Depos. 2001, 36, 45–57. [Google Scholar] [CrossRef]
- Kamenov, G.; Macfarlane, A.W.; Riciputi, L. Sources of lead in the San Cristobal, Pulacayo, and Potosi mining districts, Bolivia, and a reevaluation of regional ore lead isotope provinces. Econ. Geol. 2002, 97, 573–592. [Google Scholar] [CrossRef]
- Chiaradia, M.; Fontbote, L.; Paladines, A. Metal sources in mineral deposits and crustal rocks of Ecuador (1° N–4° S): A lead isotope synthesis. Econ. Geol. 2004, 99, 1085–1106. [Google Scholar]
- Zhu, B.Q. Tri-dimension spacial topological diagrams of ore lead isotopes and their application to the division of geochemical provinces and mineralizations. Geochimica 1993, 21, 209–216. (In Chinese) [Google Scholar]
- Williams-Jones, A.E.; Migdisov, A.A. Experimental constraints on the transport and deposition of metals in ore-forming hydrothermal Systems. In Building Exploration Capability for the 21st Century; Kelley, K.D., Golden, H.C., Eds.; Society of Economic Geologists, Inc.: Littleton, CO, USA, 2014; pp. 77–95. [Google Scholar]
- Barnes, H.L. Solubilities of ore minerals. In Geochemistry of Hydrothermal Ore Deposits, 2nd ed.; Barnes, H.L., Ed.; J Wiley & Sons: New York, NY, USA, 1979; pp. 404–410. [Google Scholar]
- Pirajno, F. Hydrothermal Processes and Mineral Systems; Springer Science & Business Media B.V.: Perth, Australia, 2009; pp. 1–1250. [Google Scholar]
- Seward, T.M.; Williams-Jones, A.E.; Migdisov, A.A. The chemistry of metal transport and deposition by ore-forming hydrothermal fluids. In Treatise on Geochemistry; Heinrich Holland, H., Turekian, K., Eds.; Elsevier Ltd.: Amsterdam, The Netherlands, 2014; pp. 29–57. [Google Scholar]
- Pearson, R.G. Hard and soft acids and their bases. J. Am. Chem. Soc. 1963, 85, 3533–3539. [Google Scholar] [CrossRef]
- Yuan, S.D.; Williams-Jones, A.E.; Romer, R.L.; Zhao, P.L.; Mao, J.W. Protolith-related thermal controls on the decoupling of Sn and W in Sn–W metallogenic provinces: Insights from the Nanling region, China. Econ. Geol. 2019, 114, 1005–1012. [Google Scholar] [CrossRef]
- Lehmann, B. Formation of tin ore deposits: A reassessment. Lithos 2021, 402–403, 105756. [Google Scholar] [CrossRef]
- Heinrich, C.A. The chemistry of hydrothermal tin(–tungsten) ore deposition. Econ. Geol. 1990, 85, 457–481. [Google Scholar] [CrossRef]
- Zhong, R.C.; Brugger, J.; Chen, Y.J.; Li, W.B. Contrasting regimes of Cu, Zn and Pb transport in ore-forming hydrothermal fluids. Chem. Geol. 2015, 395, 154–164. [Google Scholar] [CrossRef]
- Stefansson, A.; Seward, T.M. Experimental determination of the stability and stoichiometry of sulphide complexes of silver (I) in hydrothermal solutions to 400 °C at 500 bar. Geochim. Cosmochim. Acta 2003, 67, 1395–1413. [Google Scholar] [CrossRef]
- Wood, S.A.; Samson, I.M. The hydrothermal geochemistry of tungsten in granitoid environments: I. Relative solubilities of ferberite and scheelite as a function of T, P, pH, and m (NaCl). Econ. Geol. 2000, 95, 143–182. [Google Scholar] [CrossRef] [Green Version]
- Korges, M.; Weis, P.; Lüders, V.; Laurent, O. Depressurization and boiling of a single magmatic fluid as a mechanism for tin–tungsten deposit formation. Geology 2017, 46, 75–78. [Google Scholar] [CrossRef] [Green Version]


| Sample | Orebody No. | Level (m) | Metal Assemblage | Stage | Mineral | Analysis |
|---|---|---|---|---|---|---|
| HT122 | V5 | 705 | Sn | I | Cassiterite | U–Pb dating |
| HT125 | V4 | 735 | Ag–Cu–Sn | II | Cassiterite | U–Pb dating |
| HT117 | V4 | 765 | Sn | I | Quartz | FIs study |
| HT119 | V3 | 765 | Sn | I | Quartz | FIs study |
| H44 | V3 | 735 | Ag–Cu–Sn | II | Quartz | FIs study |
| HT115 | V3 | 660 | Ag–Cu–Sn | II | Quartz | FIs study |
| HT50 | II2 | 885 | Ag–Pb–Zn–Sb | III | Quartz | FIs study |
| HT56 | II2 | 855 | Ag–Pb–Zn–Sb | III | Quartz | FIs study |
| HT80 | II2 | 705 | Ag–Pb–Zn–Sb | III | Quartz | FIs study |
| HT84 | I1 | 765 | Ag–Pb–Zn–Sb | III | Quartz | FIs study |
| HT86 | I1 | 765 | Ag–Pb–Zn–Sb | III | Quartz | FIs study |
| HT112 | Ore block V | 660 | Ag–Pb–Zn–Sb | III | Quartz | FIs study |
| HT164 | III9 | 716 | Ag–Pb–Zn–Sb | III | Sphalerite | FIs study |
| HT63 | Ore block II | 855 | Ag | IV | Quartz | FIs study |
| HT65 | Ore block II | 855 | Ag | IV | Quartz | FIs study |
| HT75 | Ore block II | 855 | Ag | IV | Quartz | FIs study |
| H32 | V5 | 660 | Sn | I | Quartz | H–O isotope analysis |
| H34 | V5 | 660 | Sn | I | Quartz | H–O isotope analysis |
| H40 | V5 | 705 | Sn | I | Quartz | H–O isotope analysis |
| H3-5 | V3 | 765 | Ag–Cu–Sn | II | Quartz | H–O isotope analysis |
| H3-7 | V3 | 765 | Ag–Cu–Sn | II | Quartz | H–O isotope analysis |
| H3-8 | V3 | 765 | Ag–Cu–Sn | II | Quartz | H–O isotope analysis |
| H3-9 | V3 | 765 | Ag–Cu–Sn | II | Quartz | H–O isotope analysis |
| H46 | III9 | 705 | Ag–Pb–Zn–Sb | III | Quartz | H–O isotope analysis |
| H49 | III9 | 660 | Ag–Pb–Zn–Sb | III | Quartz | H–O isotope analysis |
| H50 | III9 | 660 | Ag–Pb–Zn–Sb | III | Quartz | H–O isotope analysis |
| H42 | Ore block II | 885 | Ag–Pb–Zn–Sb | IV | Quartz | H–O isotope analysis |
| H51 | Ore block II | 885 | Ag–Pb–Zn–Sb | IV | Quartz | H–O isotope analysis |
| H32 | V5 | 660 | Sn | I | Pyrite | S–Pb isotope analysis |
| H34 | V5 | 660 | Sn | I | Pyrite | S–Pb isotope analysis |
| H35 | V5 | 660 | Sn | I | Pyrite | S–Pb isotope analysis |
| H3-1 | V3 | 765 | Ag–Cu–Sn | II | Arsenopyrite | S–Pb isotope analysis |
| H26 | V3 | 765 | Ag–Cu–Sn | II | Pyrite | S–Pb isotope analysis |
| H1-4 | II2 | 855 | Ag–Pb–Zn–Sb | III | Galena, Sphalerite | S–Pb isotope analysis |
| H1-5 | II2 | 855 | Ag–Pb–Zn–Sb | III | Galena | S–Pb isotope analysis |
| H46 | III9 | 705 | Ag–Pb–Zn–Sb | III | Pyrite | S–Pb isotope analysis |
| Spot No. | Isotopic Ratios | Age (Ma) | ||||||||
|---|---|---|---|---|---|---|---|---|---|---|
| 207Pb/206Pb | 1σ | 207Pb/235U | 1σ | 206Pb/238U | 1σ | 238U/206Pb | 1σ | 206Pb/238U | 1σ | |
| Sample HT122 | ||||||||||
| HT122-1 | 0.18218 | 0.01383 | 0.60982 | 0.04370 | 0.02556 | 0.00075 | 39.117 | 1.14860 | 136.5 | 4.8 |
| HT122-2 | 0.30034 | 0.01448 | 1.17095 | 0.04923 | 0.03026 | 0.00069 | 33.052 | 0.75895 | 133.9 | 4.6 |
| HT122-3 | 0.37176 | 0.02786 | 1.71566 | 0.11972 | 0.03528 | 0.00143 | 28.342 | 1.14960 | 136.5 | 9.4 |
| HT122-4 | 0.20013 | 0.01145 | 0.70995 | 0.03903 | 0.02634 | 0.00054 | 37.967 | 0.77523 | 137.0 | 3.7 |
| HT122-5 | 0.22319 | 0.01769 | 0.81919 | 0.06489 | 0.02703 | 0.00088 | 36.997 | 1.20590 | 135.8 | 5.8 |
| HT122-6 | 0.27049 | 0.01844 | 1.06468 | 0.06628 | 0.02987 | 0.00116 | 33.482 | 1.30380 | 139.1 | 6.9 |
| HT122-7 | 0.15183 | 0.01308 | 0.48058 | 0.03878 | 0.02424 | 0.00072 | 41.249 | 1.22980 | 135.2 | 4.7 |
| HT122-8 | 0.33183 | 0.01858 | 1.54452 | 0.08127 | 0.03517 | 0.00090 | 28.436 | 0.72889 | 146.9 | 6.3 |
| HT122-9 | 0.25919 | 0.01373 | 0.96060 | 0.04462 | 0.02778 | 0.00058 | 36.004 | 0.75039 | 131.8 | 4.1 |
| HT122-10 | 0.38154 | 0.02464 | 1.98932 | 0.15360 | 0.03649 | 0.00131 | 27.407 | 0.98350 | 138.4 | 8.6 |
| HT122-11 | 0.19588 | 0.01269 | 0.69459 | 0.03995 | 0.02731 | 0.00073 | 36.618 | 0.98444 | 142.9 | 4.7 |
| HT122-12 | 0.40236 | 0.02763 | 1.80693 | 0.12910 | 0.03317 | 0.00100 | 30.148 | 0.90554 | 120.6 | 8.0 |
| HT122-13 | 0.26315 | 0.03690 | 0.84534 | 0.08896 | 0.02812 | 0.00134 | 35.562 | 1.69210 | 132.6 | 10.2 |
| HT122-14 | 0.22995 | 0.01729 | 0.88285 | 0.06680 | 0.02924 | 0.00092 | 34.199 | 1.07760 | 145.3 | 6.0 |
| HT122-15 | 0.35397 | 0.02345 | 1.59832 | 0.10045 | 0.03399 | 0.00142 | 29.421 | 1.22970 | 136.2 | 8.4 |
| HT122-16 | 0.24847 | 0.02076 | 0.95929 | 0.07770 | 0.02917 | 0.00132 | 34.278 | 1.55160 | 140.8 | 7.9 |
| HT122-17 | 0.38626 | 0.02350 | 1.85798 | 0.13570 | 0.03530 | 0.00139 | 28.332 | 1.11580 | 132.7 | 8.3 |
| HT122-18 | 0.25020 | 0.01460 | 0.95098 | 0.04669 | 0.02880 | 0.00066 | 34.727 | 0.79707 | 138.6 | 4.6 |
| HT122-19 | 0.25124 | 0.02134 | 0.81666 | 0.05903 | 0.02696 | 0.00100 | 37.089 | 1.36970 | 129.6 | 6.5 |
| HT122-20 | 0.52991 | 0.02117 | 3.88042 | 0.22128 | 0.05329 | 0.00200 | 18.764 | 0.70451 | 140.7 | 10.4 |
| HT122-21 | 0.17166 | 0.01381 | 0.60705 | 0.04775 | 0.02651 | 0.00078 | 37.726 | 1.11050 | 143.7 | 5.1 |
| HT122-22 | 0.31733 | 0.01468 | 1.32790 | 0.05656 | 0.03101 | 0.00075 | 32.248 | 0.78457 | 133.1 | 4.8 |
| HT122-23 | 0.33752 | 0.01440 | 1.42328 | 0.05381 | 0.03179 | 0.00075 | 31.453 | 0.74608 | 131.5 | 4.8 |
| HT122-24 | 0.32182 | 0.02448 | 1.26495 | 0.07958 | 0.03080 | 0.00121 | 32.470 | 1.27580 | 131.2 | 7.8 |
| HT122-25 | 0.14340 | 0.01481 | 0.44976 | 0.04233 | 0.02466 | 0.00080 | 40.556 | 1.32290 | 139.1 | 5.3 |
| HT122-26 | 0.35254 | 0.02453 | 1.45846 | 0.08065 | 0.03248 | 0.00111 | 30.791 | 1.05120 | 130.6 | 7.6 |
| HT122-27 | 0.47591 | 0.02731 | 2.77106 | 0.16801 | 0.04363 | 0.00159 | 22.919 | 0.83258 | 133.6 | 10.5 |
| HT122-28 | 0.22748 | 0.02325 | 0.81743 | 0.07506 | 0.02755 | 0.00108 | 36.295 | 1.42880 | 137.5 | 7.3 |
| HT122-29 | 0.47537 | 0.01878 | 2.80595 | 0.09893 | 0.04453 | 0.00110 | 22.457 | 0.55362 | 136.5 | 7.5 |
| HT122.30 | 0.36279 | 0.03071 | 1.55365 | 0.12622 | 0.03274 | 0.00115 | 30.541 | 1.06940 | 129.0 | 9.0 |
| HT122-31 | 0.40657 | 0.02633 | 2.15246 | 0.16348 | 0.03881 | 0.00191 | 25.769 | 1.26830 | 139.7 | 10.5 |
| HT122-32 | 0.53636 | 0.02193 | 4.22953 | 0.20672 | 0.05753 | 0.00189 | 17.383 | 0.57147 | 149.0 | 11.2 |
| HT122-33 | 0.31196 | 0.02183 | 1.22766 | 0.07475 | 0.03023 | 0.00104 | 33.076 | 1.13850 | 131.1 | 6.8 |
| HT122-34 | 0.27147 | 0.02640 | 1.05910 | 0.10508 | 0.02891 | 0.00145 | 34.589 | 1.73390 | 134.4 | 8.9 |
| HT122-35 | 0.31703 | 0.03105 | 1.26983 | 0.10187 | 0.03091 | 0.00125 | 32.351 | 1.30510 | 132.8 | 9.2 |
| HT122-36 | 0.46278 | 0.01903 | 2.86966 | 0.16269 | 0.04417 | 0.00152 | 22.641 | 0.77716 | 139.7 | 8.2 |
| Sample HT125 | ||||||||||
| HT125-1 | 0.23209 | 0.01648 | 0.82036 | 0.04439 | 0.02815 | 0.00088 | 35.524 | 1.10990 | 139.4 | 5.6 |
| HT125-2 | 0.12594 | 0.01146 | 0.41757 | 0.03330 | 0.02458 | 0.00075 | 40.681 | 1.24430 | 142.0 | 4.8 |
| HT125-3 | 0.45501 | 0.01522 | 2.45790 | 0.07407 | 0.04040 | 0.00081 | 24.752 | 0.49765 | 130.3 | 5.4 |
| HT125-4 | 0.12802 | 0.01112 | 0.38123 | 0.02755 | 0.02335 | 0.00064 | 42.821 | 1.17780 | 134.6 | 4.2 |
| HT125-5 | 0.35582 | 0.01448 | 1.71781 | 0.06462 | 0.03531 | 0.00074 | 28.324 | 0.59438 | 141.0 | 4.9 |
| HT125-6 | 0.47452 | 0.01936 | 2.59055 | 0.08873 | 0.04170 | 0.00109 | 23.979 | 0.62429 | 128.1 | 7.1 |
| HT125-7 | 0.18274 | 0.01192 | 0.60364 | 0.03338 | 0.02579 | 0.00074 | 38.779 | 1.10750 | 137.7 | 4.6 |
| HT125-8 | 0.42584 | 0.01803 | 2.11959 | 0.07174 | 0.03819 | 0.00089 | 26.188 | 0.60867 | 131.8 | 6.1 |
| HT125-9 | 0.10556 | 0.01240 | 0.31141 | 0.03164 | 0.02233 | 0.00062 | 44.777 | 1.25130 | 132.6 | 4.2 |
| HT125-10 | 0.25480 | 0.01468 | 0.93686 | 0.05344 | 0.02814 | 0.00088 | 35.531 | 1.10590 | 134.5 | 5.3 |
| HT125-11 | 0.34228 | 0.01540 | 1.52473 | 0.07484 | 0.03224 | 0.00073 | 31.013 | 0.70531 | 132.2 | 4.9 |
| HT125-12 | 0.34589 | 0.02015 | 1.51632 | 0.06840 | 0.03343 | 0.00080 | 29.912 | 0.71313 | 136.1 | 6.1 |
| HT125-13 | 0.39094 | 0.01662 | 1.84290 | 0.08269 | 0.03497 | 0.00086 | 28.597 | 0.70575 | 130.2 | 5.5 |
| HT125-14 | 0.35610 | 0.01571 | 1.63173 | 0.06322 | 0.03450 | 0.00087 | 28.986 | 0.73147 | 137.7 | 5.4 |
| HT125-15 | 0.21478 | 0.01789 | 0.72135 | 0.05500 | 0.02599 | 0.00083 | 38.479 | 1.22450 | 132.3 | 5.5 |
| HT125-16 | 0.29524 | 0.01245 | 1.15921 | 0.05036 | 0.02865 | 0.00064 | 34.898 | 0.77847 | 128.0 | 4.0 |
| HT125-17 | 0.12691 | 0.01183 | 0.38632 | 0.03342 | 0.02371 | 0.00064 | 42.181 | 1.13200 | 136.8 | 4.3 |
| HT125-18 | 0.51924 | 0.02029 | 3.26313 | 0.11403 | 0.04700 | 0.00122 | 21.275 | 0.55083 | 128.1 | 8.1 |
| HT125-19 | 0.38652 | 0.02564 | 1.91581 | 0.14534 | 0.03675 | 0.00166 | 27.211 | 1.22990 | 138.0 | 9.5 |
| HT125-20 | 0.34791 | 0.01688 | 1.56082 | 0.07380 | 0.03352 | 0.00080 | 29.831 | 0.71228 | 135.9 | 5.5 |
| HT125-21 | 0.06820 | 0.00984 | 0.20369 | 0.03092 | 0.02195 | 0.00071 | 45.566 | 1.47830 | 136.7 | 4.7 |
| HT125-22 | 0.26047 | 0.01596 | 0.96227 | 0.04704 | 0.02853 | 0.00068 | 35.048 | 0.82956 | 135.1 | 4.8 |
| HT125-23 | 0.22954 | 0.01747 | 0.73737 | 0.05215 | 0.02579 | 0.00075 | 38.768 | 1.12700 | 128.3 | 5.1 |
| HT125-24 | 0.19399 | 0.01821 | 0.59303 | 0.04814 | 0.02466 | 0.00080 | 40.551 | 1.31720 | 129.5 | 5.4 |
| HT125-25 | 0.26297 | 0.01022 | 1.03694 | 0.04228 | 0.02873 | 0.00049 | 34.811 | 0.59889 | 135.5 | 3.3 |
| HT125-26 | 0.41415 | 0.02364 | 2.29300 | 0.14495 | 0.04040 | 0.00132 | 24.754 | 0.81013 | 143.0 | 8.8 |
| HT125-27 | 0.11492 | 0.01005 | 0.35371 | 0.02850 | 0.02294 | 0.00056 | 43.600 | 1.07270 | 134.5 | 3.7 |
| HT125-28 | 0.32207 | 0.02154 | 1.31142 | 0.07402 | 0.03134 | 0.00093 | 31.909 | 0.94627 | 133.4 | 6.6 |
| HT125-29 | 0.37509 | 0.01823 | 1.84603 | 0.08242 | 0.03695 | 0.00096 | 27.064 | 0.70453 | 142.0 | 6.5 |
| HT125-30 | 0.34016 | 0.01459 | 1.52785 | 0.07061 | 0.03310 | 0.00084 | 30.212 | 0.76785 | 136.2 | 5.1 |
| HT125-31 | 0.45724 | 0.01781 | 2.55851 | 0.09571 | 0.04161 | 0.00097 | 24.032 | 0.55766 | 133.4 | 6.7 |
| HT125-32 | 0.46947 | 0.01560 | 2.67440 | 0.06923 | 0.04314 | 0.00096 | 23.180 | 0.51849 | 134.2 | 6.2 |
| HT125-33 | 0.31778 | 0.02045 | 1.29124 | 0.08431 | 0.03015 | 0.00100 | 33.163 | 1.09710 | 129.4 | 6.4 |
| HT125-34 | 0.41380 | 0.01523 | 2.11095 | 0.06994 | 0.03815 | 0.00085 | 26.210 | 0.58120 | 135.2 | 5.5 |
| HT125-35 | 0.23452 | 0.01357 | 0.79918 | 0.03912 | 0.02641 | 0.00060 | 37.870 | 0.86509 | 130.4 | 4.1 |
| HT125-36 | 0.24305 | 0.01643 | 0.90284 | 0.06345 | 0.02768 | 0.00084 | 36.131 | 1.10260 | 134.8 | 5.4 |
| HT125-37 | 0.41542 | 0.01787 | 2.07215 | 0.09657 | 0.03688 | 0.00103 | 27.114 | 0.76006 | 130.3 | 6.4 |
| HT125-38 | 0.36834 | 0.02640 | 1.66470 | 0.11191 | 0.03471 | 0.00106 | 28.812 | 0.88334 | 135.2 | 8.2 |
| Type | Host Mineral | FIA No. | No. | Size (μm) | V (vol.%) | Tm (ice) (°C) | Th (°C) | Salinity (wt% NaCl eqv.) | Density (g/cm3) | |||
|---|---|---|---|---|---|---|---|---|---|---|---|---|
| Range | Mean | Range | Mean | Range | Mean | |||||||
| Stage I: cassiterite–arsenopyrite–pyrite–quartz stage (samples HT117 and HT119) | ||||||||||||
| WL | Quartz | 1 | 7 | 6–22 | 20–35 | −3.0 to −2.2 | −2.7 | 315–340 | 327 | 3.7–5.0 | 4.5 | 0.69–0.72 |
| WL | Quartz | 2 | 13 | 7–28 | 20–35 | −4.1 to −2.8 | −3.3 | 323–339 | 332 | 4.6–6.6 | 5.4 | 0.70–0.72 |
| WL | Quartz | 3 | 5 | 8–15 | 15–20 | −3.0 to −2.6 | −2.8 | 302–306 | 304 | 4.3–5.0 | 4.7 | 0.74–0.76 |
| Stage II: cassiterite–chalcopyrite–pyrite–freibergite–arsenopyrite–pyrrhotite–quartz stage (samples H44 and HT115) | ||||||||||||
| WL | Quartz | 1 | 8 | 8–14 | 15–20 | −2.7 to −2.3 | −2.5 | 282–291 | 286 | 3.9–4.5 | 4.2 | 0.77–0.79 |
| WL | Quartz | 2 | 8 | 13–60 | 10–40 | −2.4 to −1.9 | −2.1 | 267–304 | 286 | 3.2–4.0 | 3.5 | 0.74–0.80 |
| WG | Quartz | 3 | 2 | 15–40 | 68–85 | −2.1 to −1.9 | −2.0 | 288–293 | 291 | 3.2–3.5 | 3.4 | 0.75–0.77 |
| WL | Quartz | 4 | 8 | 3–17 | 10–30 | −1.3 to −0.1 | −1.0 | 271–286 | 277 | 0.2–2.2 | 1.7 | 0.73–0.78 |
| Stage III: sphalerite–galena–jamesonite–stibnite–freibergite–silver mineral–quartz–calcite–chlorite stage (samples HT50, HT56, HT80, HT84, HT86, HT112, and HT164) | ||||||||||||
| WL | Quartz | 1 | 5 | 4–11 | 15–30 | −0.4 to −0.1 | −0.2 | 196–210 | 206 | 0.2–0.7 | 0.4 | 0.85–0.88 |
| WL | Quartz | 2 | 14 | 4–12 | 10–25 | −3.0 to −0.9 | −2.0 | 189–267 | 242 | 1.6–5.0 | 3.4 | 0.81–0.91 |
| WL | Quartz | 3 | 10 | 5–24 | 8–30 | −2.3 to −2.0 | −2.2 | 194–228 | 209 | 3.4–3.9 | 3.6 | 0.86–0.90 |
| WL | Quartz | 4 | 2 | 7–18 | 15–20 | −2.1 to −0.1 | −1.1 | 196–225 | 211 | 0.2–3.5 | 1.9 | 0.86–0.87 |
| WL | Quartz | 5 | 1 | 16 | 18 | −0.7 | −0.7 | 222 | 222 | 1.2 | 1.2 | 0.85 |
| WL | Quartz | 6 | 4 | 8–12 | 15–35 | −0.5 to −0.1 | −0.3 | 235–273 | 249 | 0.2–0.9 | 0.5 | 0.76–0.83 |
| WG | Quartz | 7 | 2 | 5–9 | 52–65 | −0.3 to −0.2 | −0.3 | 236–237 | 237 | 0.4–0.5 | 0.5 | 0.81–0.82 |
| WL | Quartz | 8 | 14 | 3–20 | 10–35 | −2.7 to −0.4 | −1.3 | 196–263 | 227 | 0.7–4.5 | 2.2 | 0.78–0.88 |
| WG | Quartz | 9 | 1 | 8 | 73 | −0.8 | −0.8 | 224 | 224 | 1.4 | 1.4 | 0.85 |
| WL | Sphalerite | 10 | 16 | 4–16 | 5–35 | −2.9 to −0.4 | −1.3 | 186–223 | 207 | 0.7–4.8 | 2.3 | 0.84–0.91 |
| WL | Quartz | 11 | 3 | 3–13 | 10–15 | −0.9 to −0.8 | −0.8 | 197–198 | 198 | 1.4–1.6 | 1.5 | 0.88 |
| Stage IV: argentite–pyrargyrite–pyrite–quartz–calcite stage (samples HT63, HT65, and HT75) | ||||||||||||
| WL | Quartz | 1 | 5 | 4–13 | 5–10 | −0.9 to −0.6 | −0.8 | 188–199 | 193 | 1.1–1.6 | 1.4 | 0.88–0.89 |
| WL | Quartz | 2 | 4 | 4–9 | 10–15 | −0.9 to −0.6 | −0.8 | 187–194 | 190 | 1.1–1.6 | 1.4 | 0.88–0.89 |
| WL | Quartz | 3 | 24 | 5–10 | 10–20 | −0.8 to −0.2 | −0.5 | 166–192 | 180 | 0.4–1.4 | 0.9 | 0.88–0.91 |
| Sample No. | Stage | Mineral | Th (°C) | δ18Oquartz (V-SMOW) | δ18Owater (V-SMOW) | δDV-SMOW |
|---|---|---|---|---|---|---|
| H32 | I | Quartz | 325 | 1.5 | −4.5 | −102 |
| H34 | I | Quartz | 325 | 1.4 | −4.6 | −140 |
| H40 | I | Quartz | 325 | 13.9 | 7.9 | −137 |
| H3-5 | II | Quartz | 284 | 1.4 | −6.1 | −76 |
| H3-7 | II | Quartz | 284 | 8.0 | 0.5 | −141 |
| H3-8 | II | Quartz | 284 | −0.9 | −8.4 | −83 |
| H3-9 | II | Quartz | 284 | 1.1 | −6.4 | −120 |
| H46 | III | Quartz | 221 | 12.1 | 1.7 | −165 |
| H49 | III | Quartz | 221 | 1.7 | −8.7 | −161 |
| H50 | III | Quartz | 221 | 6.0 | −4.4 | −163 |
| H42 | IV | Quartz | 183 | 1.3 | −11.5 | −168 |
| H51 | IV | Quartz | 183 | 0.9 | −11.9 | −92 |
| Sample No. | Mineral | Stage | δ34SV-CDT (‰) | δ34SH2S (‰) | 206Pb/204Pb | 207Pb/204Pb | 208Pb/204Pb | t (Ma) | μ | ω | κ | Δα | Δβ | Δγ |
|---|---|---|---|---|---|---|---|---|---|---|---|---|---|---|
| H32 | Pyrite | I | −0.2 | −1.3 | 18.219 | 15.535 | 38.048 | 135 | 9.4 | 35.4 | 3.7 | 59.9 | 13.7 | 21.2 |
| H34 | Pyrite | I | 0.3 | −0.8 | 18.232 | 15.552 | 38.100 | 135 | 9.4 | 35.7 | 3.7 | 60.6 | 14.8 | 22.6 |
| H35 | Pyrite | I | 0.1 | −1.0 | 18.225 | 15.545 | 38.080 | 135 | 9.4 | 35.6 | 3.7 | 60.2 | 14.3 | 22.0 |
| H3-1 | Arsenopyrite | II | 0.6 | −0.7 | 18.225 | 15.546 | 38.084 | 135 | 9.4 | 35.6 | 3.7 | 60.2 | 14.4 | 22.1 |
| H26 | Pyrite | II | 1.1 | −0.2 | 18.237 | 15.565 | 38.137 | 135 | 9.4 | 35.9 | 3.7 | 60.9 | 15.6 | 23.6 |
| H1-4 | Galena | III | −3.4 | −0.8 | 18.216 | 15.531 | 38.027 | 135 | 9.4 | 35.3 | 3.7 | 59.7 | 13.4 | 20.6 |
| H1-4 | Sphalerite | III | −0.9 | −1.3 | 18.317 | 15.667 | 38.475 | 135 | 9.6 | 37.8 | 3.8 | 65.6 | 22.3 | 32.6 |
| H1-5 | Galena | III | −1.4 | 1.2 | 18.257 | 15.586 | 38.207 | 135 | 9.5 | 36.3 | 3.7 | 62.1 | 17.0 | 25.4 |
| H46 | Pyrite | III | −2.0 | −3.6 | 18.195 | 15.509 | 37.965 | 135 | 9.3 | 34.9 | 3.6 | 58.5 | 12.0 | 18.9 |
| Deposit | Metal Assemblage | Analytical Method | Mineralization Age (Ma) | References |
|---|---|---|---|---|
| Baiyinchagandongshan | Ag–Sn–Pb–Zn–Cu | Cassiterite U–Pb | 140–134 | [23,51] |
| Daolundaba | Cu–Sn–W–Ag | Cassiterite U–Pb | 136.8–134.7 | [38] |
| Maodeng–Xiaogushan | Sn–Cu–Zn | Cassiterite U–Pb | 135–133 | [39,51] |
| Weilasituo | Li–Sn–Pb–Zn–Cu | Muscovite 40Ar–39Ar | 133.4 | [71] |
| Cassiterite U–Pb | 136 | [21] | ||
| Dajing | Sn–Cu–Pb–Zn–Ag | Cassiterite U–Pb | 144 | [15] |
| Huanggang | Fe–Sn–W | Molybdenite Re–Os | 135 | [48,72] |
| Bairendaba | Ag–Pb–Zn–Cu | Muscovite 40Ar–39Ar | 135 | [73] |
| Bianjiadayuan | Ag–Pb–Zn | Molybdenite Re–Os | 140 | [74] |
| Haobugao | Pb–Zn–Cu–Fe | Molybdenite Re–Os | 142 | [17,75] |
| Chamuhan | W–Mo | Molybdenite Re–Os | 139 | [76,77] |
| Dongshanwan | Mo–W | Molybdenite Re–Os | 140.5 | [78] |
Disclaimer/Publisher’s Note: The statements, opinions and data contained in all publications are solely those of the individual author(s) and contributor(s) and not of MDPI and/or the editor(s). MDPI and/or the editor(s) disclaim responsibility for any injury to people or property resulting from any ideas, methods, instructions or products referred to in the content. |
© 2023 by the authors. Licensee MDPI, Basel, Switzerland. This article is an open access article distributed under the terms and conditions of the Creative Commons Attribution (CC BY) license (https://creativecommons.org/licenses/by/4.0/).
Share and Cite
Li, S.; Li, Z.; Chen, G.; Yi, H.; Yang, F.; Lü, X.; Shi, J.; Dou, H.; Wu, G. Age, Fluid Inclusion, and H–O–S–Pb Isotope Geochemistry of the Superlarge Huaaobaote Ag–Pb–Zn Deposit in the Southern Great Xing’an Range, NE China. Minerals 2023, 13, 939. https://doi.org/10.3390/min13070939
Li S, Li Z, Chen G, Yi H, Yang F, Lü X, Shi J, Dou H, Wu G. Age, Fluid Inclusion, and H–O–S–Pb Isotope Geochemistry of the Superlarge Huaaobaote Ag–Pb–Zn Deposit in the Southern Great Xing’an Range, NE China. Minerals. 2023; 13(7):939. https://doi.org/10.3390/min13070939
Chicago/Turabian StyleLi, Shihui, Zhenxiang Li, Gongzheng Chen, Huineng Yi, Fei Yang, Xin Lü, Jiangpeng Shi, Haibo Dou, and Guang Wu. 2023. "Age, Fluid Inclusion, and H–O–S–Pb Isotope Geochemistry of the Superlarge Huaaobaote Ag–Pb–Zn Deposit in the Southern Great Xing’an Range, NE China" Minerals 13, no. 7: 939. https://doi.org/10.3390/min13070939