Article

Hydrothermal Alteration in the Nevados de Chillán Geothermal System, Southern Andes: Multidisciplinary Analysis of a Fractured Reservoir

1
Department of Geology, Facultad de Ciencias Físicas y Matemáticas, Universidad de Chile, Plaza Ercilla 803, Santiago 8370450, Chile
2
Andean Geothermal Center of Excellence (CEGA), Plaza Ercilla 803, Santiago 8370450, Chile
3
Department of Structural and Geotechnical Engineering, Pontificia Universidad Católica de Chile, Avenida Vicuña Mackenna 4860, Macul, Santiago 7820436, Chile
4
Research Center of Nanotechnology and Advanced Materials (CIEN-UC), Pontificia Universidad Católica de Chile, Santiago 7820436, Chile
5
Department of Geological Sciences, University of Alaska Anchorage, Anchorage, AK 99508, USA
*
Author to whom correspondence should be addressed.
Minerals 2023, 13(6), 722; https://doi.org/10.3390/min13060722
Submission received: 4 April 2023 / Revised: 22 May 2023 / Accepted: 23 May 2023 / Published: 25 May 2023

Abstract

:
The interplay between a heat source, primary plus secondary permeability, and hydrothermal fluids makes geothermal systems a highly dynamic environment where evolving physico-chemical conditions are recorded in alteration mineralogy. A comprehensive characterization of hydrothermal alteration is therefore essential to decipher the major processes associated with geothermal system development. In this study, we defined the hydrothermal mineralogical evolution of the Nevados de Chillán Geothermal System (NChGS), located in the Southern Volcanic Zone (SVZ) of the central Andes, where the regional framework of the system is formed by a direct association with a currently active volcanic complex, a favorable structural control, and vertically inhibited fluid circulation. To characterize the secondary mineralogy present in the NChGS, we integrated optical petrography, Scanning Electron Microscopy (SEM) observations, X-ray Diffraction (XRD) analysis, and microthermometric measurements along a drill core with a depth of 1000 m at the Nieblas-1 well. These mineralogical approaches were combined with a structural field analysis to highlight the relevance of multidisciplinary study in understanding active geothermal systems. The results indicated that the evolution of the system involved four paragenetic stages, with the main processes in each phase being the heating, boiling, and mixing of fluids and re-equilibration to new physico-chemical conditions. Additionally, three hydrothermal zones were recognized: an upper argillic section, an intermediate sub-propylitic zone, and a deep propylitic domain. Sampled thermal springs are characterized by pH values of 2.4–5.9 and high SO4= concentrations (>290 ppm). These acid-sulfate steam-heated waters suggest the contribution of primary magmatic volatiles to the hydrothermal system. Alunite recorded in the alteration halos of veinlets presents at depths of 170–230 m denote the circulation of acidic fluids at these levels which were favored by reverse faults. These findings indicate that, at this depth range, the condensation of magmatic volatiles into shallow aquifers controls the recharge area of the superficial thermal manifestations. Conversely, deep-seated hydrothermal fluids correspond to near-neutral chloride fluids, with salinities ranging from 0.1 to 6.9 wt.% NaCl eq. The distribution of illite/smectite and chlorite/smectite mixed-layered minerals outline the presence of a significant clay cap, which, in this system, separates the steam-heated domain from the deep hydrothermal realm and restricts fluid circulation to existing permeable channels. Our mineralogical and structural study provides critical data for the interpretation of heat–fluid–rock interaction processes in the NChGS. The interplay between hydrothermal fluids and active faults is also discussed in the context of the complex of geological processes in active geothermal systems along the Chilean Southern Volcanic Zone.

1. Introduction

The processes that control hydrothermal alteration have been shown to form in highly dynamic systems, and their evolution is framed by both regional and local factors. In geothermal systems, such factors include, at a regional scale, the tectonic and volcano-magmatic setting, and, at a local scale, the lithology of the host rocks, the physical and chemical features of hydrothermal fluids, the hydrogeological context and the presence of primary and secondary permeability [1,2].
Studies of hydrothermal alteration have proven to be essential in defining both the existing architecture of geothermal and epithermal systems and in unraveling the framework under which such systems developed (e.g., [3,4,5,6]). The sensitivity of minerals to changes in temperature and the chemical composition of hydrothermal fluids has enabled the evaluation of thermodynamic and compositional conditions in different stages in the evolution of hydrothermal systems [7]. Moreover, the direct analysis of paleo-hydrothermal fluids preserved in fluid inclusions (FIs) has allowed researchers to unravel changes in temperature profiles and fluid compositions and depict the fluid phases associated with the preceding conditions (e.g., [5,8,9]).
In addition to fluid–rock interactions, the heating, cooling, mixing, and boiling of fluids are also prevalent in geothermal systems [4,8,10]. These processes have been assessed through the petrological analysis of alteration mineralogy and the chemical analysis of hydrothermal fluids. The response of hydrothermal minerals to changes in the physico-chemical conditions has further clarified the link between magmatic and hydrothermal systems. In locations where the heating, cooling, mixing, and boiling of fluids occur, such as in volcano-hosted geothermal systems, changes brought about by the input of magmatic volatiles are in part mirrored by the presence of highly-acidic hydrothermal fluids [2,11] and steam-heated waters [12,13]. Environmental conditions leading to the development of intense hydrothermal alteration, such as in intrusion-related systems, are also related to the presence of highly effective cap rocks. The presence of hydrothermal minerals, especially clays, increases the enclosure capacity of cap rocks. Clay caps can effectively preserve the temperature, pressure, and enthalpy conditions of a hydrothermal system [5,14,15,16,17] and are thus critical features of hydrothermal system evolution.
There have been various attempts to formulate conceptual models of hydrothermal systems (e.g., [1,2]). These studies illustrate the key elements of the architecture of geothermal systems and reveal how these components interplay as the systems evolve. However, the complexity of the factors that contribute to the development of geothermal systems, and the unique geological context of each system, require each system to be characterized individually.
Along the Southern Volcanic Zone (SVZ) of the central Andes, hundreds of hot springs are closely associated with Quaternary volcanic activity, especially in areas where regional-scale structures are present within or close to volcanoes [18,19,20]. In areas hosting both volcanoes and fault zones, vertical permeability is promoted by the presence of intra-arc fault systems that are favorably oriented to allow the opening of fractures. Such structural control supports the emplacement of deep convective cells [19,21]. Conversely, some fault systems form along the volcanic arc but are severely misoriented to promote vertical permeability under the prevailing regional stress field. These fault zones are arc-oblique and long-lived and generate a network of transverse faults known collectively as the Andean Transverse Faults (ATFs). Since the strikes and dips of these faults are misoriented with respect to both the maximum and intermediate principal compressive stresses, they inhibit vertical permeability. The interaction of magma with ATFs can encourage the development of magma reservoirs, which later act as a source of heat and mass for hydrothermal systems [13,21,22]. These conditions provide a favorable environment for the formation of evolved, long-lived, and high-enthalpy geothermal systems (e.g., [21]). Despite the high geothermal potential of the SVZ, this area remains largely underdeveloped with respect to geothermal energy [20,23,24].
This study focuses on the hydrothermal evolution of the Nevados de Chillán Geothermal System (NChGS) (~37° S), a geothermal area in central Chile hosted in an active volcanic complex framed by the presence of an ATF structure, that traverses and controls the volcanic alignment of the craters that form the Nevados de Chillán volcanic complex (36°52′ S; 71°23′ W; 3212 m.a.s.l.). The geothermal reservoir seems to be hosted in fractured granitoid where secondary permeability generated by faults and fractures may favor the circulation of hydrothermal fluids. The NChGS is considered to be a highly promising candidate for geothermal exploitation and includes surface features such as extensive areas with intense hydrothermal alteration, thermal springs, bubbling pools, and fumaroles [22,25,26,27]. At the beginning of this century, one exploration well (Nieblas-1) was drilled, providing a continuous record of hydrothermal alteration up to a depth of ~1000 m. Our aim is to provide a detailed mineralogical analysis of the NChGS. To identify the paragenetic stages of the NChGS, we performed a systematic study of its alteration mineralogy along the 1000 m deep Nieblas-1 well using optical petrography and Scanning Electron Microscopy (SEM) analysis. These analyses were coupled with X-Ray Diffraction (XRD) data from clay minerals and microthermometry measurements in vein minerals to clarify secondary permeability and physico-chemical constraints of paleo-hydrothermal fluids. Additionally, chemical analyses of thermal springs were conducted to further characterize the chemical signature of the hydrothermal fluids. Finally, an analysis of major lineaments identified from satellite imagery and the field measurement of fractures and faults in representative outcrops were used to produce a conceptual model of the present-day configuration of the NChGS. The combination of these techniques highlights the key elements driving the evolution of this structurally controlled magmatic-geothermal system.

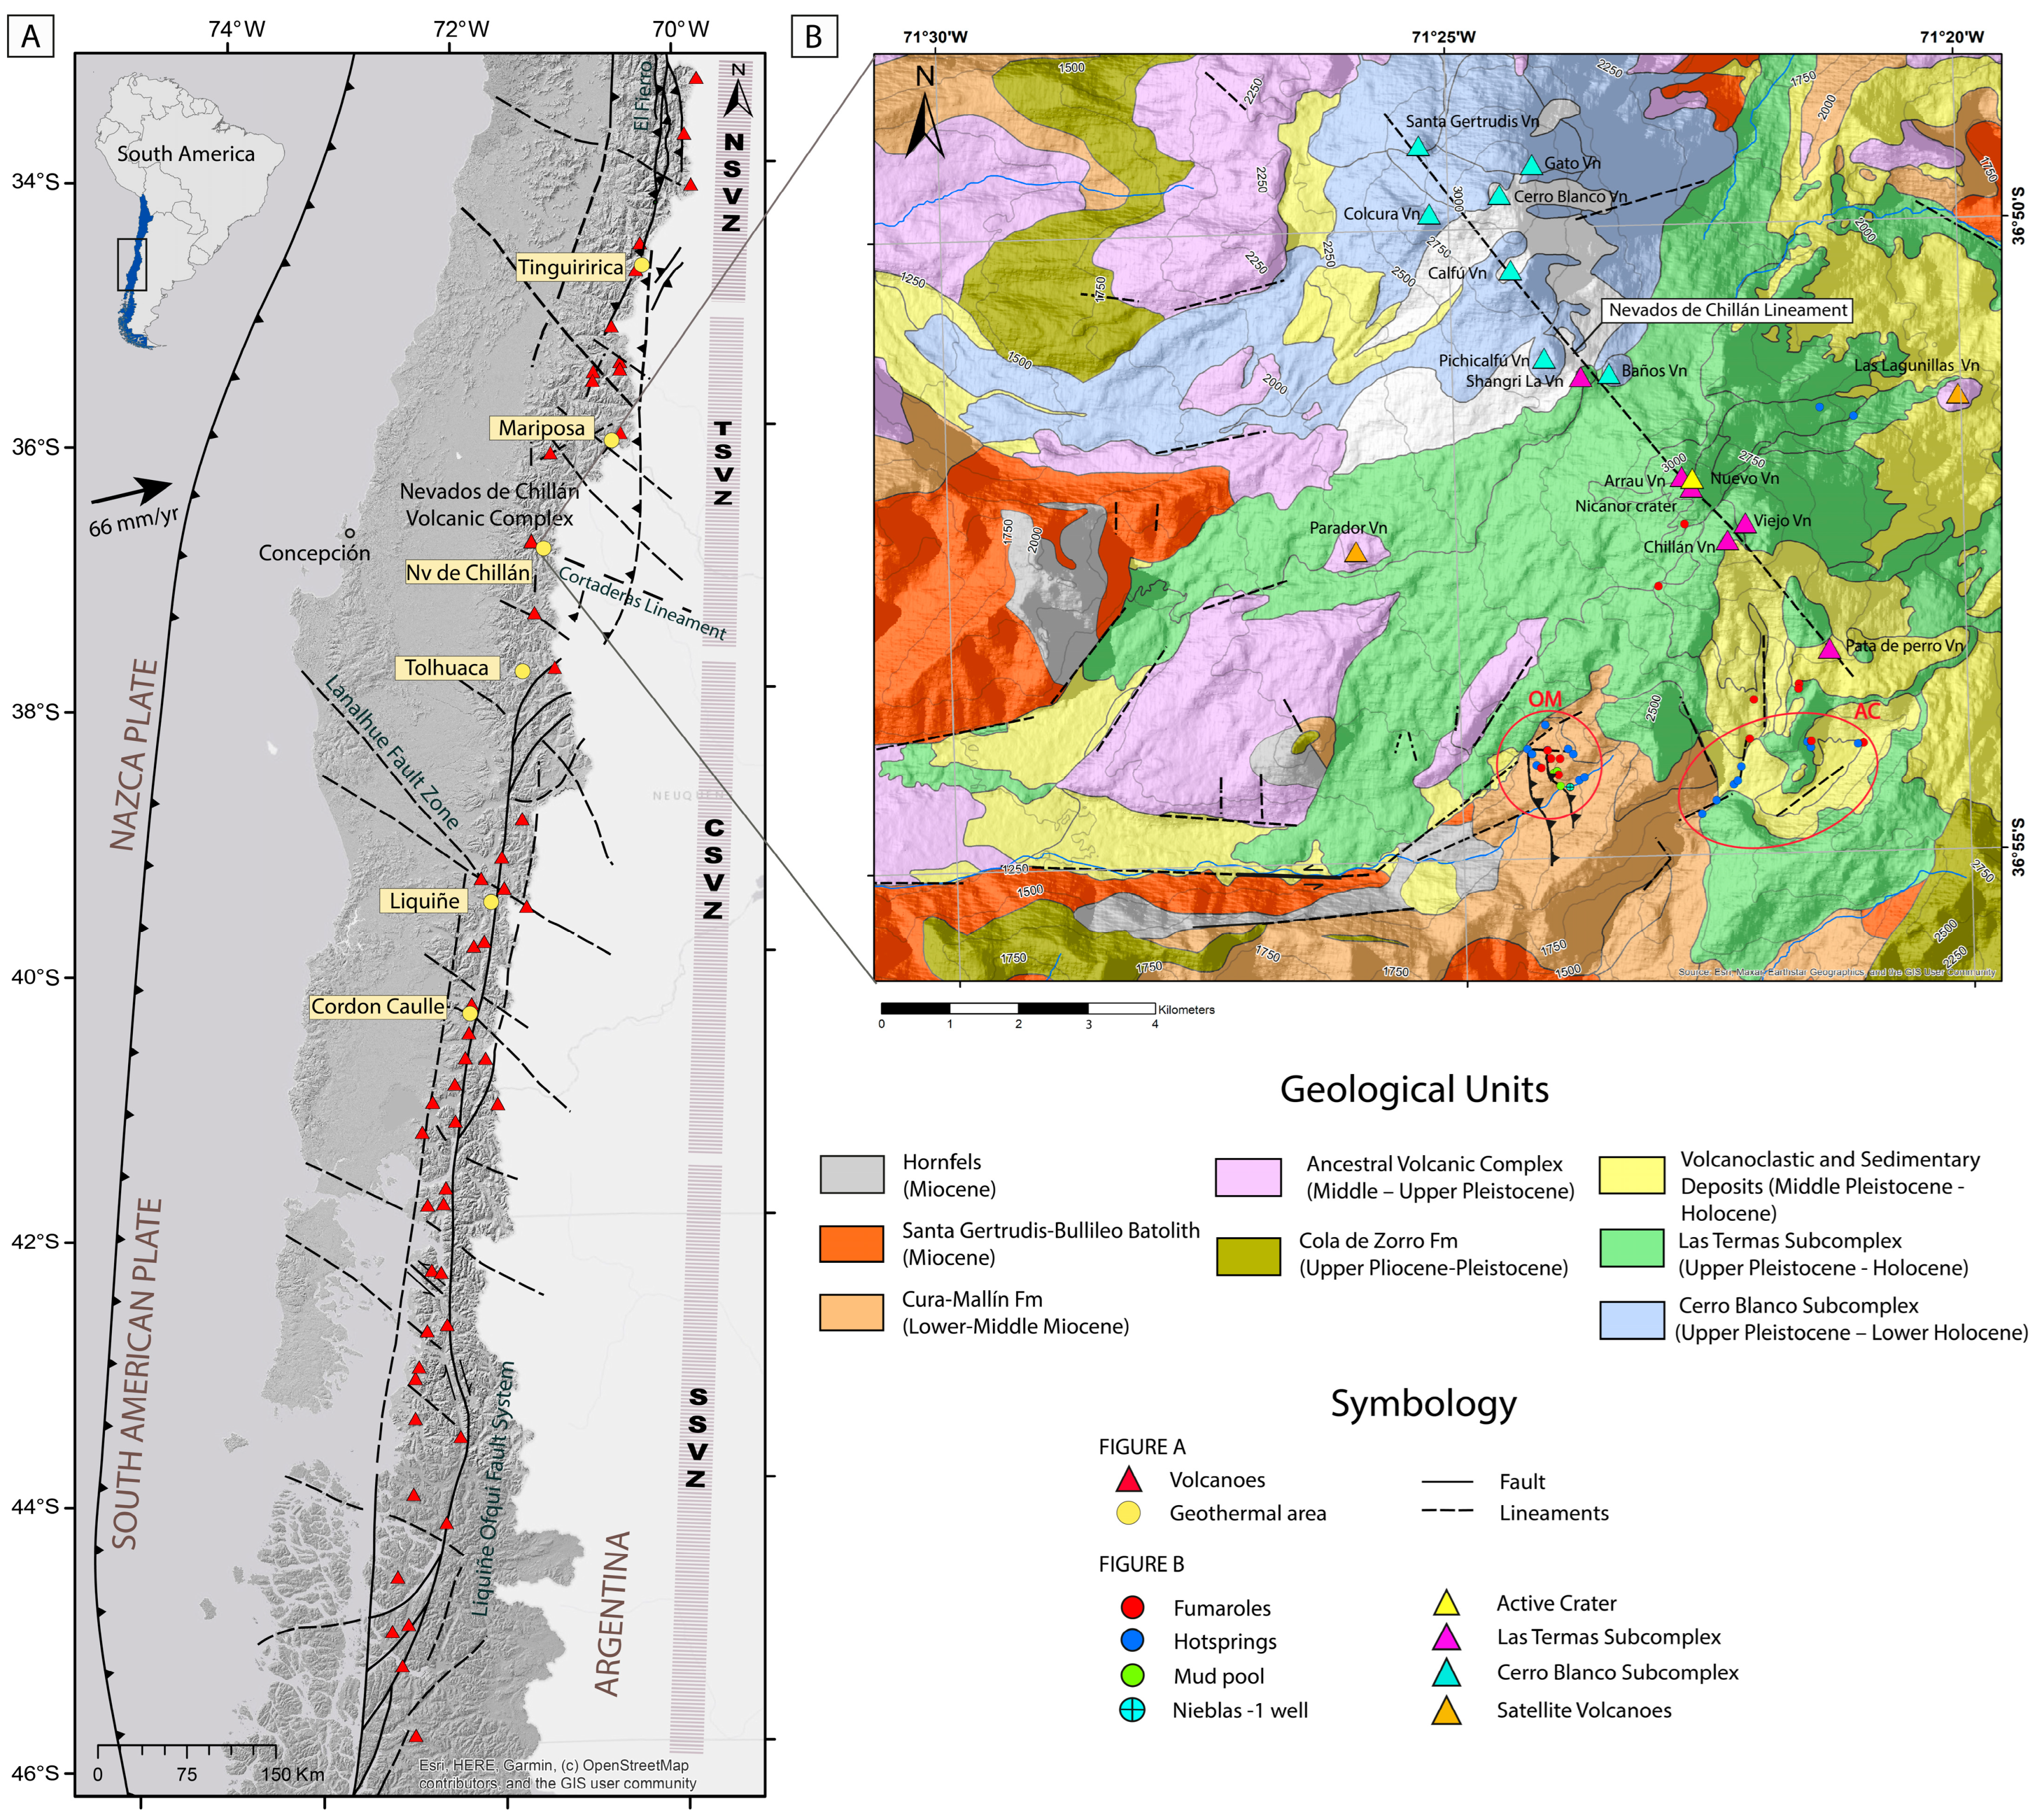
2. Geological Background

The SVZ, located between 33 and 46° S, has for the last 20 Ma been defined by a slightly oblique, dextral convergence between the Nazca and South American plates, with modern convergence rates of around 7–9 cm/year [28,29]. Accordingly, morphostructural units and magmatism have formed as north-south-oriented belts, parallel to the convergence margin (Figure 1A), with the magmatism related to an eastward migration of the volcanic arc to its current position atop the Main Cordillera of the Andes [30,31].
Deformation in the upper crust brought about by this convergent regime is accommodated by large-scale structures located in the modern volcanic arc (e.g., [32] and references therein). These structures comprise fold-and-thrust belts, intra-arc margin-parallel fault systems (e.g., Liquiñe-Ofqui Fault System, LOFS), and fault zones and alignments with a WNW orientation (e.g., ATF system [32,33,34,35], Figure 1A). Studies have proposed a first-order structural control of the NW-trending ATF and the NS-to-NE-trending LOFS, on the formation (and nature) of Holocene volcanoes [34] and on the nature and geochemistry of thermal springs in the SVZ [19]. In this sense, ATF structures are severely misoriented to open under the present (long-term) tectonic regime [36,37,38] and inhibit vertical fluid permeability in magmatic–hydrothermal systems [19,21], favoring longer residence times and episodic magma fractionation [32,34,39]. Despite the former, temporally variable stress regimes induced by megathrust events [40,41] alter ATF behavior to accommodate extensional normal slip that can promote the ascent of magma and geofluids [32,35].
Figure 1. (A) Location and geological setting of the Nevados de Chillán Geothermal System (NChGS). Main structures in the Andean Southern Volcanic Zone (SVZ), that is, the Liquiñe-Ofqui Fault System (LOFS) and the Andean Transverse Faults (ATFs), taken from [34,42,43]. The division of the Northern Southern Volcanic Zone (NSVZ), Transitional Southern Volcanic Zone (TSVZ), Central Southern Volcanic Zone (CSVZ), and South Southern Volcanic Zone (SSVZ) is taken from [32]. Major geothermal areas in the SVZ as depicted in [20]. (B) Local geology of the Nevados de Chillán Volcanic Complex (NChVC), modified after [44,45], showing the location of the Nieblas-1 exploration well and the two main areas with intense argillic alteration, thermal springs, and fumaroles: Las Termas-Olla de Mote (OM) and Aguas Calientes (AC).
Minerals 13 00722 g001
The Nevados de Chillán Geothermal System (NChGS) is located in the SW end of the Nevados de Chillán Volcanic Complex (NChVC, Figure 1A,B), an active stratovolcano located in Central Chile in the SVZ, located within the transition zone from a thick (>50 km) continental crust to the north, and a thin (<40 km) crust southward [46,47]. The NChVC comprises two adjacent main volcanic edifices (named the Cerro Blanco complex and the Las Termas complex [48]) that host several NW-aligned eruptive centers (Figure 1B). The eruptive history of this volcanic complex started around 640 ka [45] with the eruption of thick and extensive sub-glacial andesitic lava flows. This was followed by a caldera collapse in the Upper Pliocene [49] and from 640 to 50 ka, subglacial andesitic volcanism dominates until around 40 ka, when a major explosive event occurred, probably also related to a caldera collapse [48]. After this explosive event, the development of the present-day edifices began generating the Cerro Blanco and Las Termas subcomplex units (Figure 1B). During the last century, volcanic activity has been limited to the Las Termas edifice, erupting uniform dacitic lavas and having at least three major volcanic eruptions between 1906–1943 and 1973–1986, as well as a minor vulcanian episode in 2003 and a gently effusive eruption in 2008 [47,50]. A new eruptive cycle started in 2015, with dacitic magma extrusion occurring in January 2018 [50] and volcanic activity continuing until the present, based on monitoring by the Red Nacional de Vigilancia Volcánica, of the Chilean National Geological Survey. Regarding the differences in the geochemistry of lavas erupted from these two sub-complexes, the Cerro Blanco subcomplex, located at the northern end of the lineament, has been characterized by volcanic products mostly of basaltic andesitic to andesitic compositions with minor dacitic events erupted from the late Pleistocene to the lower Holocene. The Las Termas subcomplex, located at the southern end of the segment and hosting the NChGS, is associated with low-tohigh-Si dacitic volcanic products that erupted from the late Pleistocene to the present day [48,51,52]. The geochemical differences between these two volcanic subcomplexes have been interpreted as a consequence of the existence of two magma chambers with different evolutionary timings and depth emplacements [48]. Upper crustal processes would control the mechanism favoring the presence of these two magma chambers, allowing longer magmatic residence times in the Las Termas subcomplex, which is expressed in more silicic products.
The emplacement of the NChVC has been proposed to be controlled by an NW-SE-trending lineament (Figure 1B) that includes 24 emission centers located along this structure that have been active during the Holocene [50]. The NChVC formed an edifice over the, at least 2500-m thick, Cenozoic volcano-sedimentary formations of Cola de Zorro (Pliocene-to-Early Pleistocene subhorizontal layers of volcanic rocks) and Cura-Mallín (folded Oligocene-to-Miocene volcanic and volcaniclastics rocks) (Figure 1B). Oligocene-Miocene rocks were deposited in extensional basins that were tectonically inverted, which deformed and uplifted the previous extensional faults and sedimentary fill [53]. Probably related to this tectonic inversion, or at the end of the extensional regime, Miocene granitoid (Santa Gertrudis Bullileo batholith) intruded volcano-sedimentary units, generating local contact metamorphism in Cura-Mallín volcaniclastic rocks. A biotite K-Ar age of 5.8 ± 0.3 Ma [44] indicates that this intrusive body could have been emplaced during the inversion of these basins from an extensional to a compressional regime. After the folding and exhumation of the Cura-Mallín Formation, subhorizontal andesitic and basaltic andesites lavas of the Cola de Zorro Formation (40Ar/39Arwhole rock of 1.82 ± 0.64 Ma, [45]) were emplaced.
From a structural geology perspective, the orientation of the minor and major emission centers of the NChVC is an arc-oblique NW volcanic lineament, similar to other NW-elongated systems in the volcanic arc (e.g., Cordón Caulle volcano) or major NW-trending volcanic alignments (e.g., Villarrica-Quetrupillán-Lanin) in the southern Andes (e.g., [34], Figure 1A). These observations suggest that the NW-striking alignment of eruptive centers is related to the ATF structures (Figure 1A). However, the precise nature of this lineament has not been sufficiently characterized. Some authors (e.g., [50]) related the NW trend of the NChVC as the northwestern continuation of the ≈200-km long WNW-ESE-trending major Cortaderas Lineament, which would signify the presence of a structure extending from the Main Cordillera in Chile toward the foreland in Argentina [32]. Although [50] supported this hypothesis through observations of seismic activity at depth, surface evidence of WNW- and NW-trending faults is scarce, and the eventual role of the WNW-trending Cortaderas Lineament in the recent eruptions of the NChVC is not well understood. At a more regional scale, previous studies interpreted the Cortaderas Lineament to be a crustal discontinuity and emphasized its role in the long- and short-term tectonics and magmatism of the Andean arc and back-arc region since at least the Paleocene, including its ability to accommodate partitioned strain (e.g., [32,54,55,56]). Following [53], the WNW-ESE-trending Cortaderas Fault could be one of the accommodation zones between N-S-oriented Oligo-Miocene sedimentary basins, and, after basin inversion, these accommodation zones may have been weakness zones allowing volcanism extrusion. This suggests a complex link between the Cortaderas lineament and the building of the NChVC, which should be analyzed in more detail. Since it is beyond the scope of this work to further define the individual lineament extensions, we refer to the NW-trending lineament of the NChVC as the Nevados de Chillan lineament (Figure 1B).
Previous structural geological studies [40,57,58] and work in progress by our research group allow the identification of regional lineaments and families of faults and fractures at the outcrop scale. A further series of geomorphological features and geological contacts provide evidence of regional lineaments within the area; for example, the Las Trancas Valley (LT, Figure 2) follows an E-W trending lineament which is delimited in the north by the scarp of an ancestral complex Lava flow and in the south by the Santa Gertrudis Bullileo Batholith. Similarly, in the NE-trending Shangri-La Valley, N40E- and N70E-trending scarps delimitate the valley with the Santa Gertrudis Bullileo Batholith at the northwest and an ancestral complex lava flow to the southeast (SL, Figure 2). The Shangri-La and Las Trancas valleys are well-morphologically-preserved glacial valleys, where more recent lava flows from the active complex have flowed and partially filled the valleys. In the Hermoso Valley and the Las Termas-Olla de Mote area (HV and OM, respectively, Figure 2), NE-trending lineaments dominate; these lineaments are marked by geological contacts and are interpreted as subvertical N50E-striking faults. These features can be observed as narrow creeks with steep slopes.
At the outcrop scale, our work in progress with fracture and fault-slip data allows us to identify steeply dipping fractures with preferential orientations of N30-60E and N15-45W at Shangri-La Valley (SL); N10-35E and N20-N50W at Las Trancas Valley (LT); N40-60W, N60-80E, and N30-45E at Hermoso Valley (HV); and N20-50W and N70-90W at the Las Termas-Olla de Mote (OM) area. Moreover, in the LT area, fault families with dip angles greater than 60° are EW-striking with sinistral (normal) kinematics indicators; whereas, at the HV and OM sites, N50-70E striking faults with a normal component are also identified. Finally, N0-15E trending dextral (reverse) and N10-40W trending reverse (dextral) faults are observed in the LT and HV sites. These data are consistent with those previously reported by [40,57,58].
Additionally, a series of low-angle reverse faults with attitudes subparallel to the stratification of the Cura-Mallín Formation are found in the OM sector. The average attitude of the faults measured at the outcrop is N20W/30E. We inferred the presence of another fault with a strike of N40W, from a series of channel incisions on an uplifted terrace, which would be controlled by the uplift of the hanging wall, similar to that described by [59]. This reverse fault cut the NEE-trending lineaments corresponding to normal faults located east of the HV and west of the OM areas (Figure 2).
The main surface hydrothermal features of this active geothermal system are thermal springs, boiling pools, mud pools, and fumaroles (the latter of which having temperatures up to 95 °C) located on the eastern and south-eastern flanks of the NChVC (Figure 1B, Figure 2 and Figure 3) in the locally called Las Termas-Olla de Mote and Aguas Calientes sectors [22,25,26,27,60]. Surrounding these thermal manifestations, intense blankets of steam-heated alteration surfaces on the volcanic-hosted lithologies with patches showing intense acid-sulfate hydrothermal alteration are observed throughout the area with the abundant presence of clay minerals, silica products, and the precipitation of native sulfur. The first geochemical study of the NChGS was presented by [25], classifying thermal waters as acid-sulfate type, with measured surface temperatures ranging from 85 to 92 °C, inferred temperatures at depth of above 200 °C, and pH between 2.40 and 5.87. Based on these preliminary data, [25] proposed that these thermal springs are the result of hot water boiling in the subsoil. Mixing of hot steam with surface waters allowed the oxidation of H2S to H2SO4 and the leaching of hosted volcanic rocks. The subsurface hydrothermal activity of the system has been assessed by geophysical surveys focused on documenting the response of the NChVC to seismic activity. Numerous volcano-tectonic and tremor events registered within the volcanic edifice (mainly between depths of 1 and 2.5 km) have been linked to the deep circulation of hydrothermal fluids [41].
The first commercial geothermal exploration in the area was conducted in 1995 by the French Geothermal Company (CFG) in collaboration with the Chilean National Petroleum Company (Empresa Nacional de Petróleo, ENAP). As a result of this early exploration, a shallow (274 m depth) exploratory well was drilled (Nevados de Chillán 1, NC-1), and hot fluids (198 °C) were found at a depth of 240 m [61]. Based on their fluid chemistry, these thermal waters were interpreted as originating from source water with a mixed chloride-bicarbonate content of <1000 ppm. Moreover, geothermometers based on water chemistry from this exploratory well suggested a temperature of around 200 °C in a shallow Cl-HCO3 reservoir and of up to 265 °C in a deeper source. This well was abandoned for safety reasons in 1996. In April 2005, the Chilean National Geothermal Company (ENG) acquired the rights for the exploration of the Nevados de Chillán concession. Various geological, geophysical, and geochemical surveys were performed by ENG in the region. This survey period ended with the drilling, in March and April 2009, of a 1000.85 m deep exploratory well named Nieblas-1 (ENG, internal reports). The well was drilled in the area with the greatest presence of hydrothermal manifestations: the Olla de Mote sector (Figure 1B and Figure 2). This full-core exploratory well, together with geological, geochemical, and geophysical data acquired by ENG, confirmed the presence of a shallow reservoir with temperatures in the range of 160–174 °C and suggested the presence of a reservoir with measured temperatures of between 216 °C at 985 m depth and around 250 °C at 1200–1300 m depth. However, the deeper parts of the hotter reservoir were not reached by the exploratory well. An estimation for the NChGS potential was presented in [20] with obtained values on the order of 32 ± 24 MWe, which is in accordance with the geophysical data of ENG (2007). A detailed summary of the history of geothermal exploration in the NChGS and their surface geothermal manifestations can be found in [27].

3. Sampling and Analytical Methods

3.1. Characterization of Hydrothermal Minerals

A detailed core logging of the 1000.87-m deep exploration well Nieblas-1 was performed to document the main features of the lithology, permeability, and hydrothermal alteration associated with the NChGS. Thirty-eight representative samples were collected at ~30 m intervals for the different mineralogical studies.
SEM observations were carried out using a FEI Quanta 250 SEM equipped with backscattered electron (BSE), energy-dispersive X-ray spectrometry (EDS), and secondary electron (SE) detectors, at the Andean Geothermal Center of Excellence (CEGA), Universidad de Chile. The operating conditions were as follows: spot size of 4–5 μm, accelerating voltage of 20 kV, beam intensity of 1 nA, and working distance ~10–11 mm. Additionally, Field Emission Scanning Electron Microscopy (FE-SEM) observations were undertaken with an FEI Quanta FEG 250 FE-SEM equipped with BSE, EDS, and SE detectors, at the Research Center for Nanotechnology and Advanced Materials (CIEN-UC), Pontificia Universidad Católica de Chile. The analytical conditions were as follows: spot size 3 μm, accelerating voltage 20 kV, beam intensity 1 nA, and working distance ~9–12 mm.
XRD analysis was performed using a Bruker D8 Advanced diffractometer, using Cu-Kα radiation, a voltage of 40 kV, and an applied current of 30 mA, at the Department of Physics, Universidad de Chile. For whole-rock XRD studies, the samples were powdered with an agate mortar and analyzed at angular domains of 5–60 °2θ. Bulk-rock XRD diffraction patterns were treated and interpreted using the X’Pert Highscore software. For the preparation of clay separates, the samples were dispersed in distilled water and treated to discard organic matter and carbonates. Then, oriented aggregates of the fraction < 2 μm were mounted on glass slides and analyzed under the following operating conditions: angular domain of 3–40 °2θ, step size of 0.02 °2θ, and scanning time per step of 37.8 s. Air-dried (AD), ethylene-glycol solvated (EG), and heated (H) XRD patterns were considered for the identification of clay minerals. The diffraction patterns were manually reviewed and interpreted following the criteria in [62]. Furthermore, the recommendations in [63] were considered for the recognition of mixed-layered chlorite/smectite (C/S), corrensite (Co), and chlorite/corrensite (C/Co). In the presence of mixed-layered illite/smectite (I/S), the proportion of illite (Ilt) layers and the degree of ordering (R) were calculated according to the procedures in [62]. Representative samples of clay minerals were further studied to constrain the textural features of the <2 μm particles.

3.2. Fluid Inclusion Microthermometry

Petrographic observation of fluid inclusion assemblages (FIAs) hosted in anhydrite, calcite, and quartz veins was carried out to select FIAs of primary origin as defined in [64,65]. Heating and freezing measurements were undertaken at CEGA using a Linkam THMSG-600 heating–freezing stage. The stage was calibrated using synthetic FIs of pure H2O and CO2 (precision of measurement of ±0.1 °C at 0 °C and ±5 °C at 374 °C). FIAs were cooled down to –196 °C to test for the presence of dissolved CO2. Salinities, reported in wt.% NaCl equivalent (eq.), were calculated as suggested in [66].

3.3. Fluid Chemistry

Thermal waters were sampled from two springs located in the Olla de Mote sector, near the Nieblas-1 exploration well (Figure 1B and Figure 2). The springs, situated a few meters away from each other, occur in intensely altered terrain with abundant clay minerals, silica, and sulfur without nearby fumaroles. Temperature, electrical conductivity (EC), redox potential (Eh), and pH were measured in situ. Water samples were filtered with a 0.45 μm filter and stored in pre-cleaned high-density polyethylene bottles. Samples for the measurement of major cations were acidified with HNO3 (Suprapur®), 4N. Concentrations of major elements were measured at CEGA. Anion concentrations were determined by Ion Chromatography (IC, Thermo Scientific Dionex ICS-2100), and cation concentrations were measured by Inductively Coupled Plasma Optic Emission Spectrometry (ICP-OES, PerkinElmer Precisely Optima 7300 V). Silica contents were determined by a Portable Photometer (Hanna HI96705), and HCO3- concentrations were determined by volumetric titration following the procedures in [67].

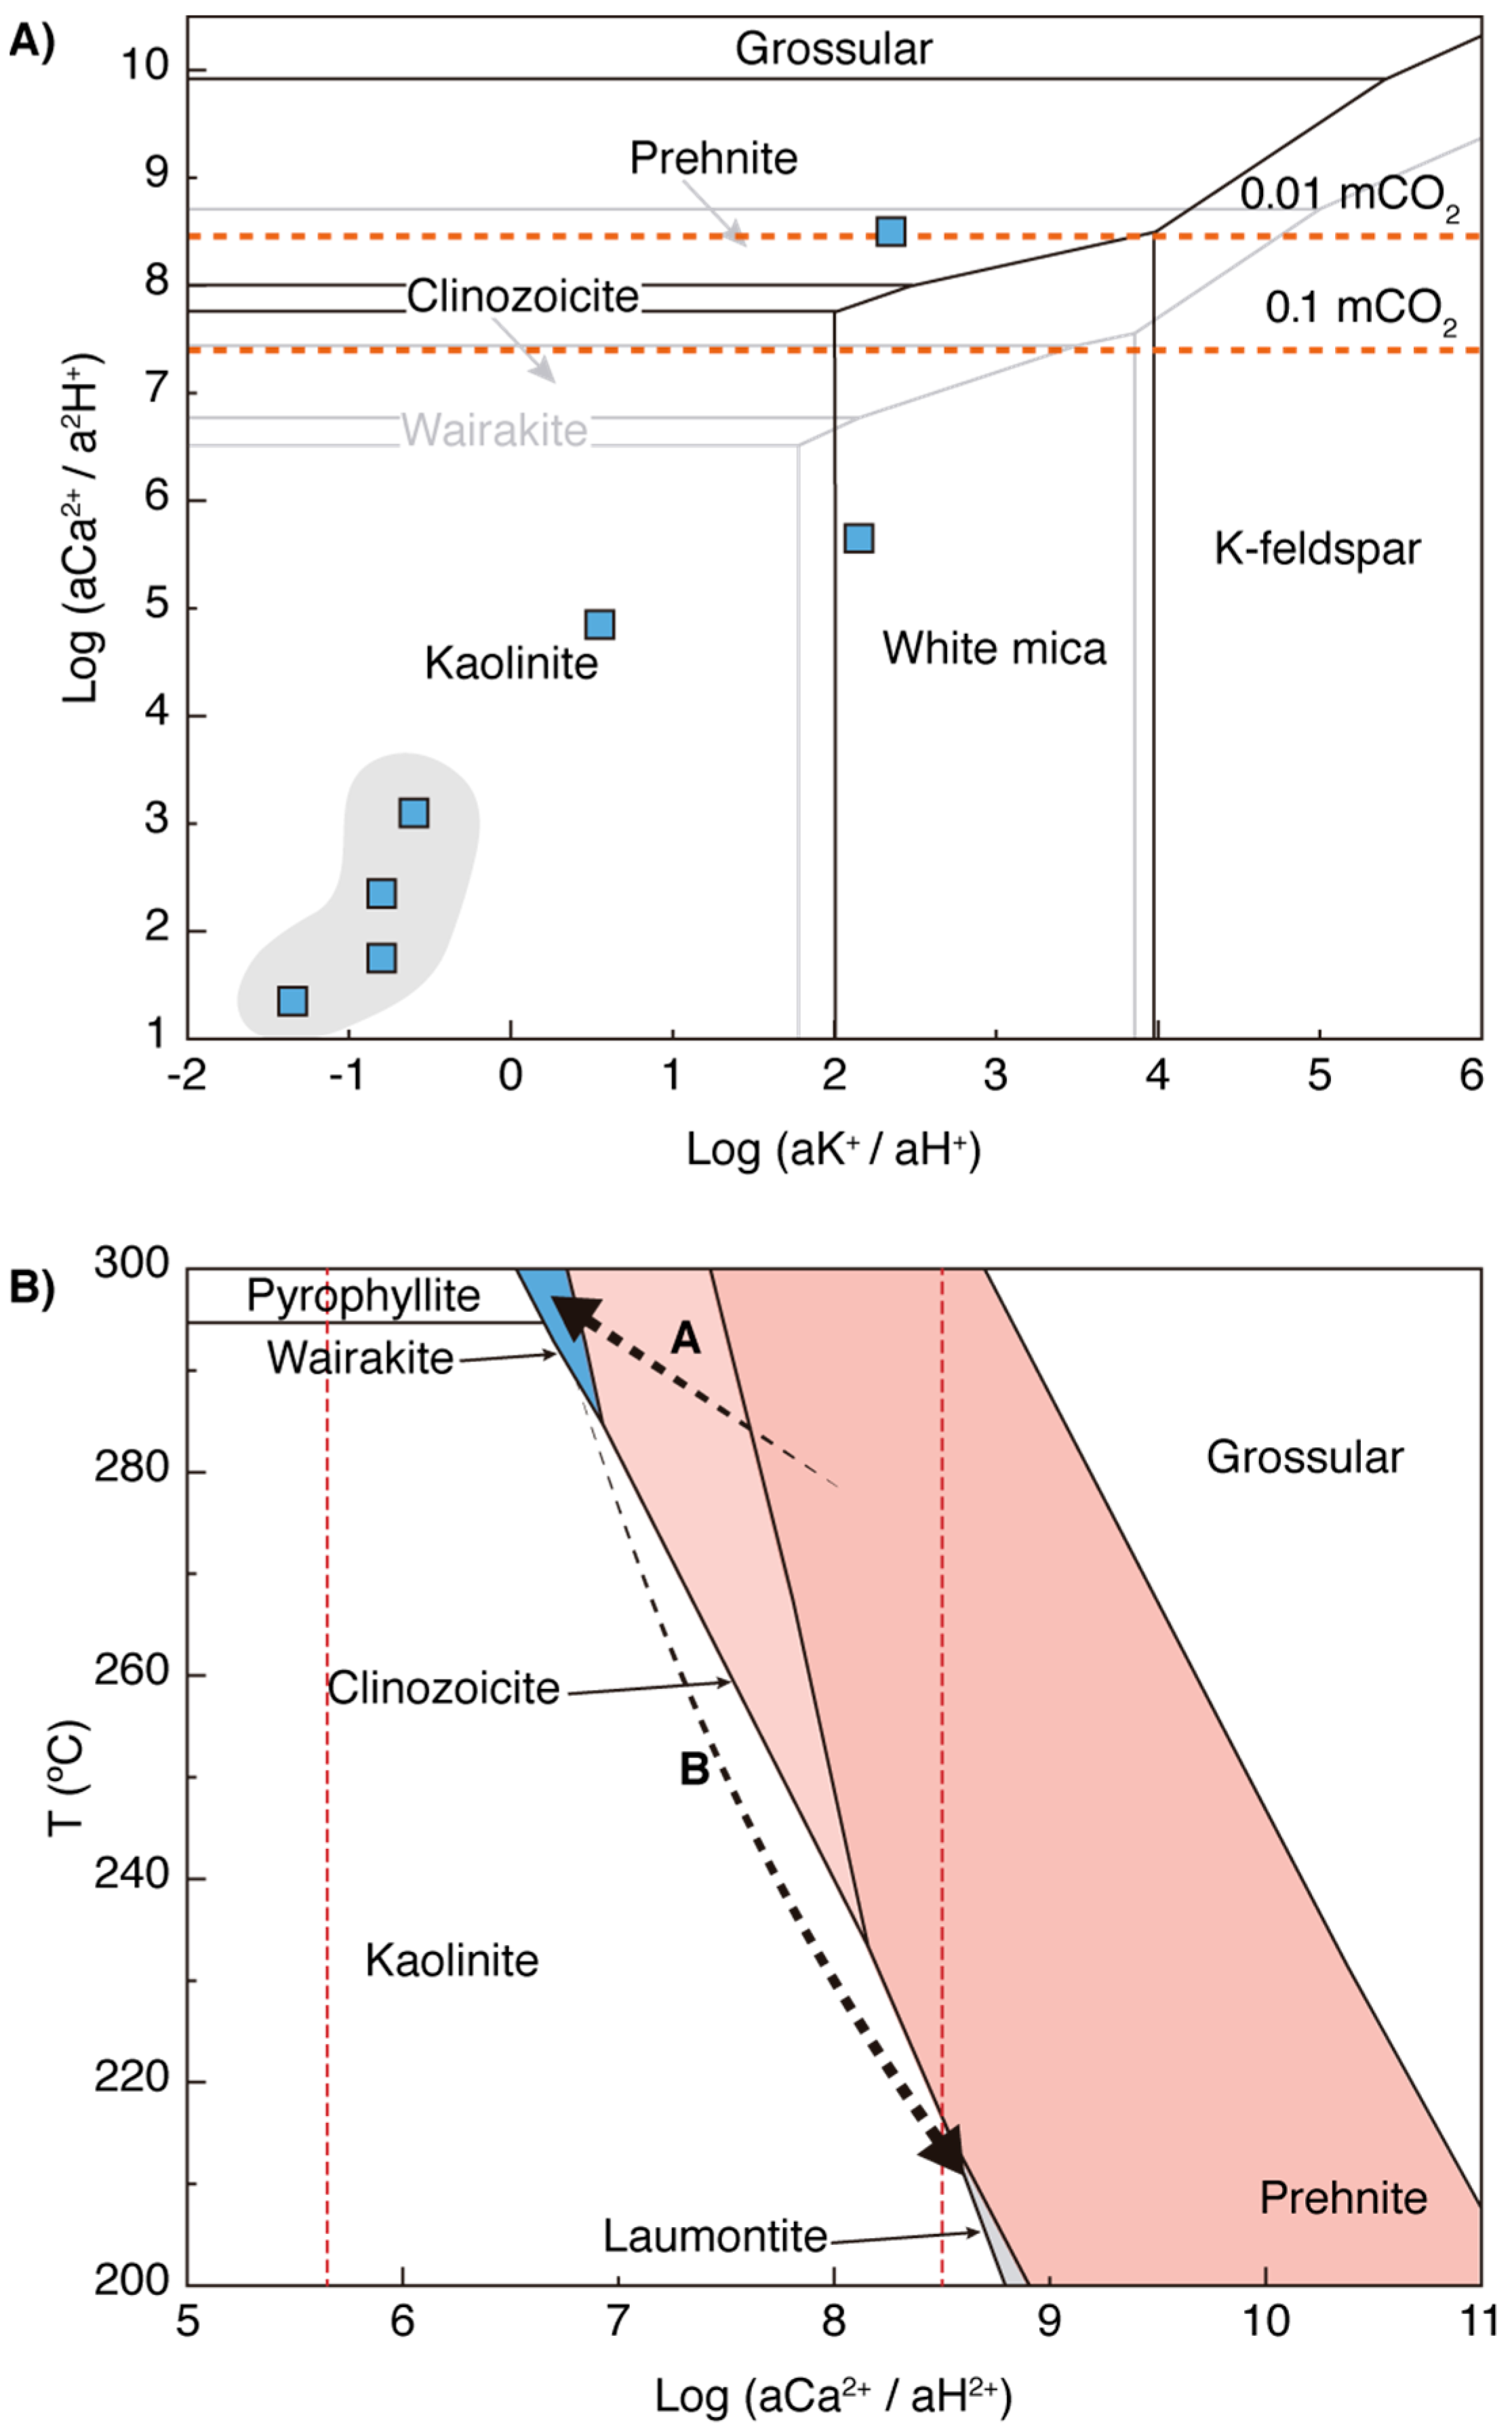
3.4. Geochemical Modeling

The charge balance and ion activity of the thermal waters presented in Table 1 were computed utilizing The Geochemist’s Workbench software and the thermodynamic data provided in the thermo.tdat database [68]. Thermal waters presenting charge-balance errors higher than ±15% were not considered in the geochemical modeling. Fluid–mineral equilibrium diagrams were generated with the Act and Tact programs included in the abovementioned software, considering mineral saturations and temperatures estimated based on the alteration mineralogy and microthermometric measurements.

4. Results

4.1. Mineral Paragenesis

A simplified lithological column of the Nieblas-1 drill core is presented in Figure 4. The first 400 m of the drill core (i.e., from 0–400 m depth) is andesitic lava with zones of thin alternations of tuff and breccia between 100–200 m depth. Between 400–550 m is a zone of intercalated andesitic lava and breccia cut by a ~10 m thick andesitic dike. The lower 450 m of the drill core is mainly composed of breccias and volcanoclastic rocks. Between 170–300 m and 610–700 m, two permeable levels (hereafter referred to as the upper and lower permeable zones, respectively) were recognized based on the presence of highly fractured rocks, more intense and pervasive alteration, and slickensides (Figure 4).
Besides the temporal distribution of the hydrothermal minerals, a vertical zonation of the alteration mineralogy was documented according to depth. Following the criteria in [2,69], three main alteration zones were defined based on petrographic, XRD, and SEM analyses: an upper argillic zone in the first 350 m of the core, an intermediate sub-propylitic alteration zone between 350 and 680 m, and a deep propylitic zone in the last 410 m (Figure 4).
The hydrothermal alteration displayed by the andesitic lavas was generally of low-to-moderate intensity, with the primary mineralogy being partially replaced. Secondary minerals in the andesitic lavas, mainly Fe oxyhydroxides, quartz, and clay minerals, were mostly present in vesicles and replaced primary amphibole and pyroxenes, while primary plagioclase phenocrysts were replaced by Na-rich plagioclase and clay minerals. Conversely, the volcaniclastic rocks showed intense and pervasive hydrothermal alteration, with secondary minerals replacing most of the primary mineralogy. Ferromagnesian phenocrysts were pseudomorphically replaced by Fe oxyhydroxides, quartz, and clay minerals, while plagioclase phenocrysts were less altered by clay minerals. The presence of other secondary minerals, such as calc-silicates, calcite, and calcium zeolites, namely wairakite and laumontite, was mainly developed in vesicles and veinlets throughout the Nieblas-1 core.
The overprinting sequences and cross-cutting relationships displayed by the alteration minerals in the Nieblas-1 well document a complex hydrothermal evolution. Four stages of alteration paragenesis can be identified (Figure 5). The first stage (STG 1) of mineral paragenesis consists of iron oxyhydroxides, microcrystalline quartz, and mafic phyllosilicates, identified throughout the core, with sporadic chalcedony at depths of ~190, 690, and 980 m (Figure 6A). Between 170 and 230 m, alunite developed in vein halos was also documented. The second stage (STG 2), observed from 200 m depth to the end of the core, consists of garnet, epidote, prehnite, calcite, quartz, and mixed-layer I/S, developed mainly in amygdales and veins (Figure 6B), and below 700 m also documented replacing primary plagioclase phenocrysts. Bladed calcite associated with this stage was observed at depths of ~193, 348–406, and 719 m (Figure 6B). The minerals of the third stage (STG 3), consisting of wairakite, anhydrite, calcite, and comb-texture quartz, were observed primarily in veins and amygdales, with wairakite overgrown by anhydrite and, in turn, anhydrite encapsulated by rhombic calcite crystals (Figure 6C). The fourth and last stage (STG 4) is characterized by the presence of laumontite throughout the drill core, being further developed between 700–800 m depth, where fine-grained epidote, quartz, and magnetite crystals are deposited in open veins rimmed by elongated laumontite crystals (Figure 6D–F).

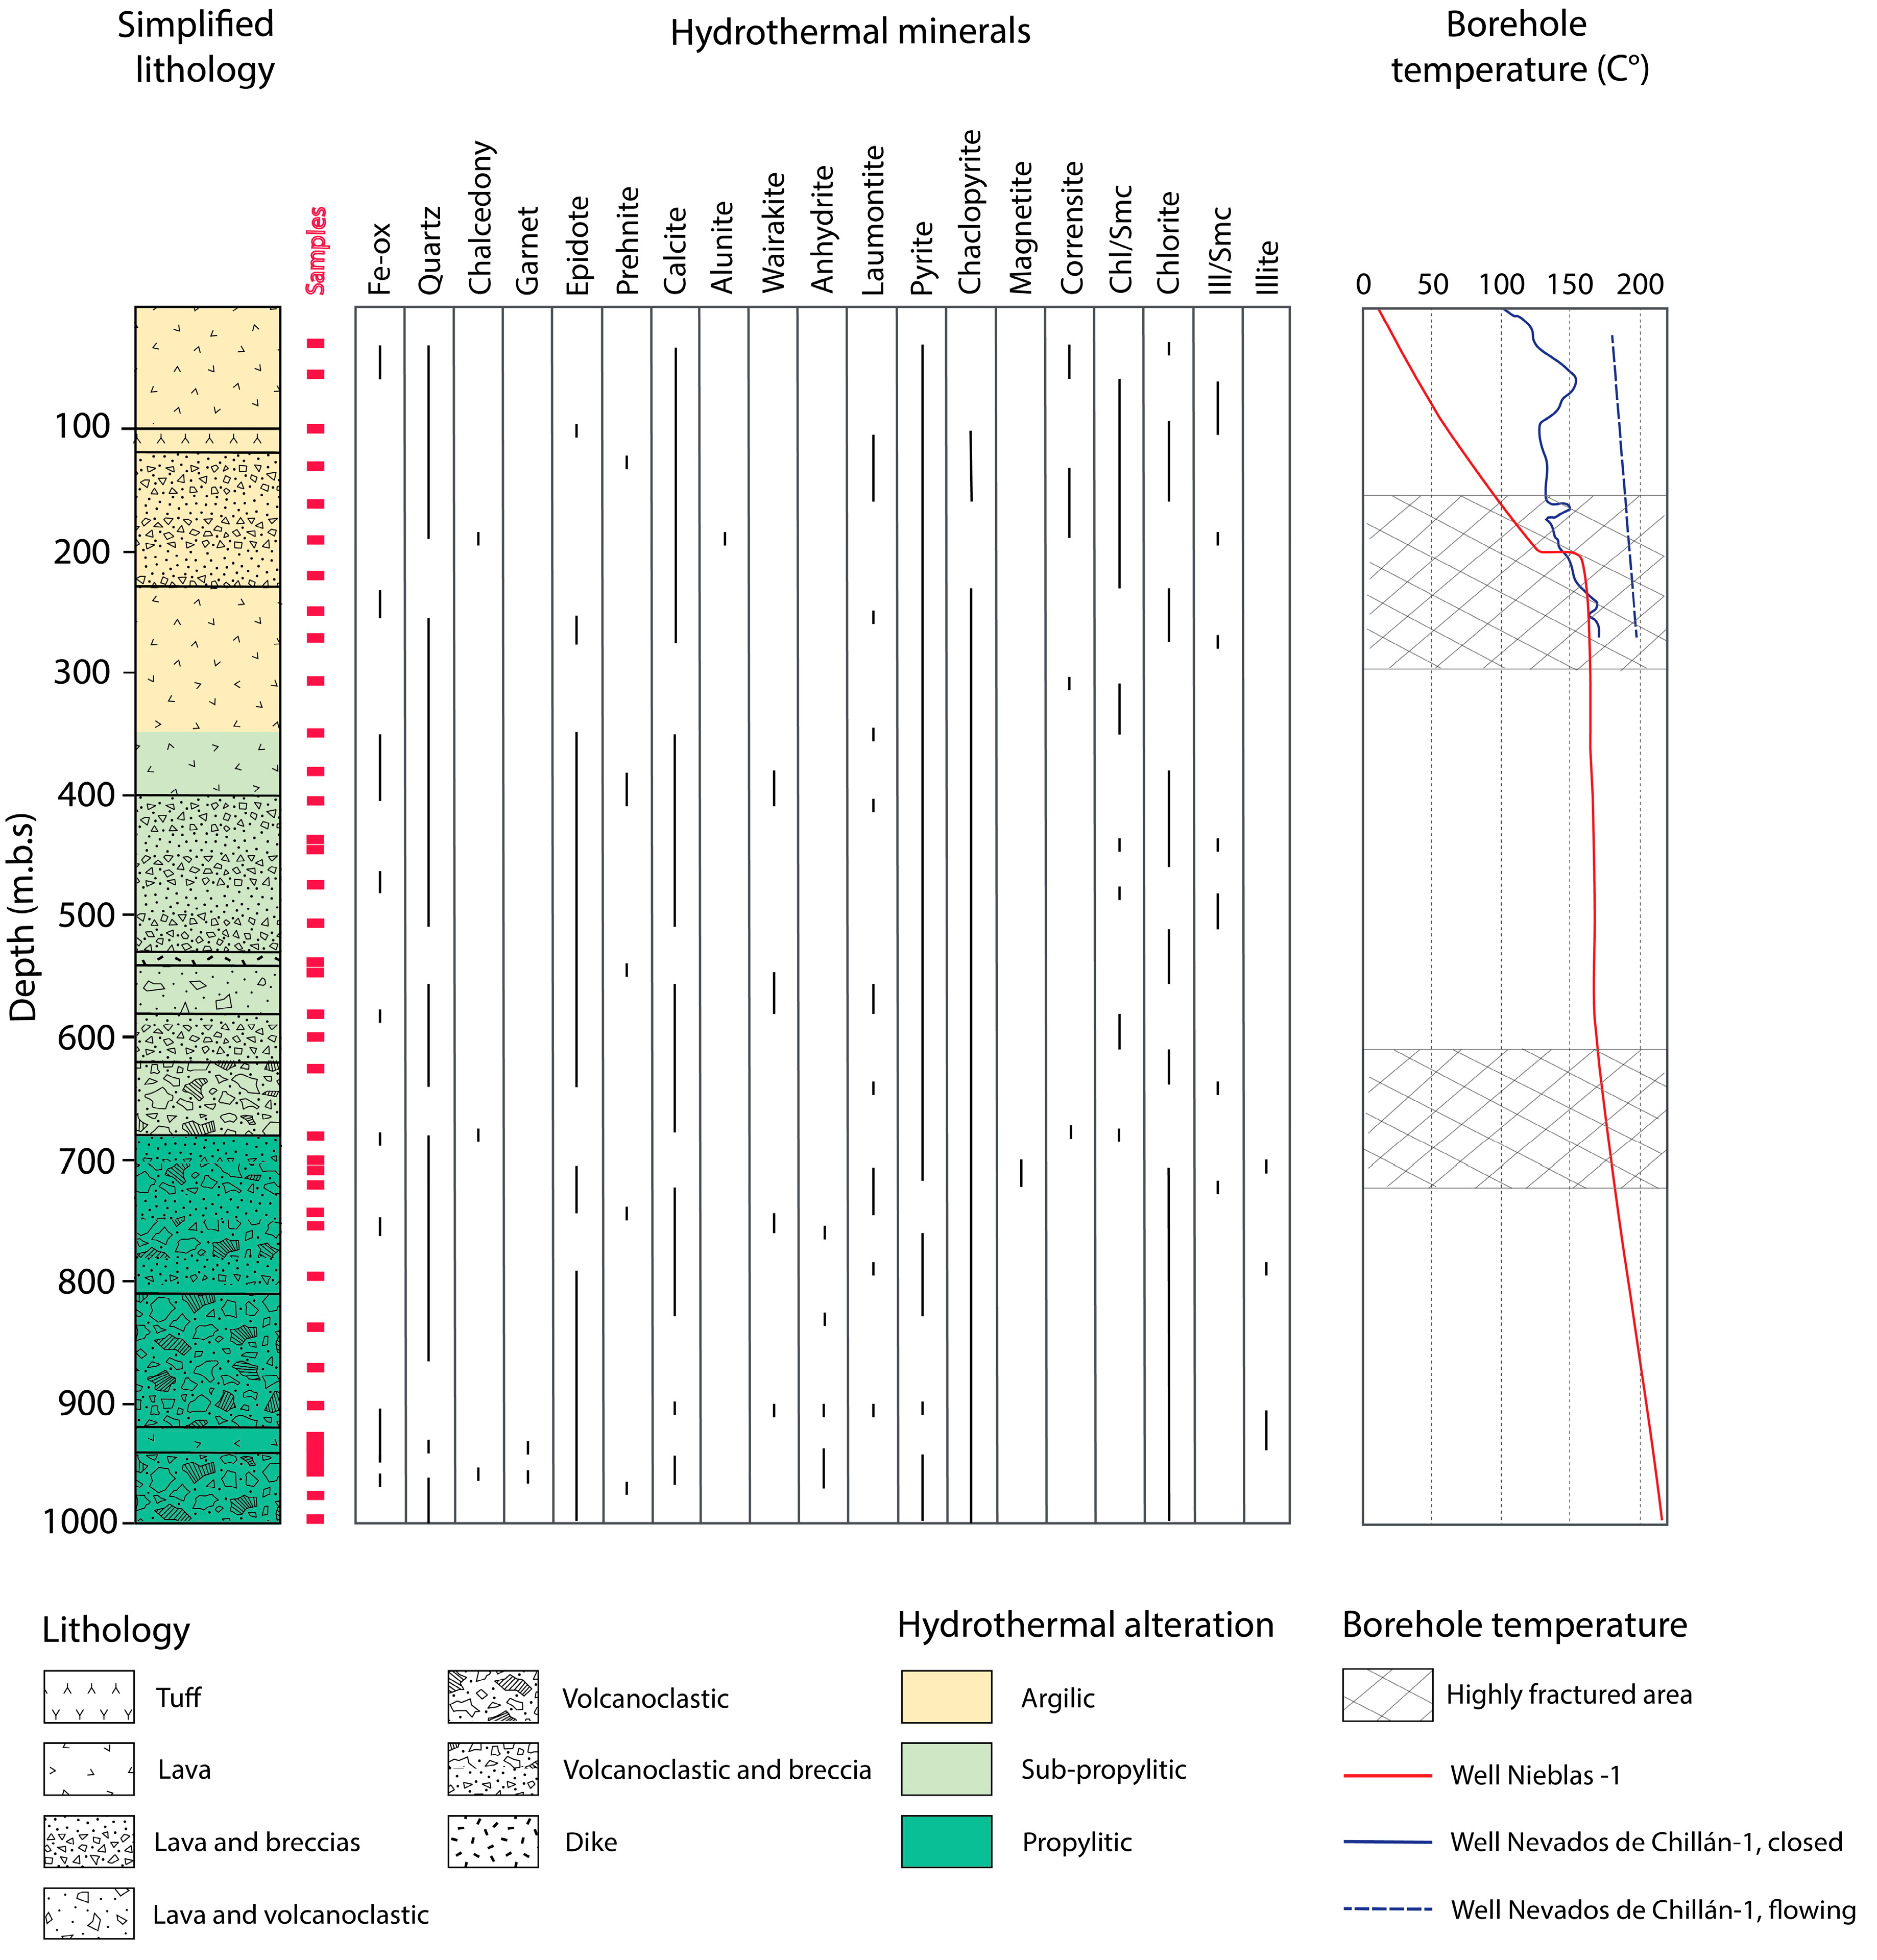
4.2. Vertical Distribution and Characterization of Clay Minerals

The clay minerals identified in the Nieblas-1 core include C/S, Co, chlorite (Chl), I/S, and Ilt (Figure 7). Figure 4 shows the different depths at which these minerals were documented. Co was observed from the shallowest core sample, at 30 m, up to ~194 m, with two isolated appearances at ~307 and ~680 m. Mixed-layer C/S was documented continuously from the shallower levels, at a depth of 60 m, and was last detected at ~680 m. Chl was recorded throughout the core. These minerals, related to the smectite-to-chlorite transition series, were documented replacing primary mafic phenocrysts and infilling amygdales and veins. In samples with both Co and C/S or Chl and C/S, Co, and Chl were identified in the outer margins of the abovementioned domains, with interstratified C/S being developed in the inner portions of the domains. Representative BSE images displaying the textural features of these minerals are shown in Figure 8. In the shallower levels, elongated Chl crystals fill amygdales and veins, and replace amphibole and pyroxene phenocrysts associated with Fe oxyhydroxides and microcrystalline quartz (Figure 8A). Moreover, at a depth of 276.05 m, Chl fills vesicles displaying a slightly curved plate-like morphology in unoriented packets (Figure 8B) and is associated with Fe oxyhydroxides, quartz, and latter rhombic calcite. Mixed-layer C/S, observed in the inner portions of the abovementioned domains, presents the same mineral associations as Chl but shows textural differences with the latter. Furthermore, at 476.48 m, interstratified C/S in quartz-rimmed vesicles and veins exhibited a curled flake-like morphology without preferred orientation (Figure 8C). Such textures suggest that these clay minerals are formed primarily through direct precipitation from hydrothermal fluids [70,71,72].
Regarding the smectite-to-illite transition series, the spatial distribution of mixed-layer I/S and Ilt is shown in Figure 4. Interstratified I/S was documented at depths of between 60 and ~720 m, while Ilt was only recognized in the deepest levels, appearing at ~700 m and being last recorded at ~948 m. Mixed-layer I/S was documented in quartz veins and also coating large epidote grains in quartz veins, in some cases associated with prehnite and minor sulfides. At 276.04 m, interstratified I/S showed a curved lens-shaped morphology with no preferred orientation (Figure 8D). Unlike the former minerals, the illitic phases were present mainly in veins. Only at depths below ~700 m was authigenic Ilt observed in plagioclase voids (Figure 8E). At the deepest levels, Ilt was present both in veins, associated with quartz, epidote and prehnite, and grew in plagioclase voids with quartz and minor sulfides. At 935.35 m, authigenic Ilt grew in plagioclase voids displaying a filamentous texture (Figure 8F). The textures described illustrate the crystallization of the illitic phases directly from hydrothermal fluids, without requiring precursor smectite and most likely following the dissolution of volcanic glass or feldspar [16,70,73,74,75,76].
The absence of samples containing pure smectite in the drill core is noteworthy. However, a common characteristic observed in both series was a general decrease in the percentage of expandable smectite layers with depth. Moreover, when considering the smectite-to-illite transition, I/S-R0 with 20% Ill was observed at a depth of 60 m, I/S-R0 with 10% Ill at 100 m, I/S-R1 with 55% Ill at 193.75 m and I/S-R3 with >75% Ill from 276 m to the end of the core. The distribution of the percentage of expandable layers in interstratified I/S minerals describes a sigmoidal curve when plotted against temperature, with the exception of samples NB 60.00 and NB 193.75, which fall outside of this trend, containing 20% and 55% Ill, respectively (Figure 9). However, in these samples, the I/S mixed-layered minerals are present only as vein minerals and are not recognized as replacing primary or secondary mineralogy. Therefore, neither of these samples were considered in the fitting of the curve described above.

4.3. Chemistry of Thermal Springs

The physico-chemical features and major element content of the sampled thermal waters are presented in Table 1 alongside published data from previous studies in the study sector [22,25]. The elevated charge-balance errors determined for two of the samples are likely linked to the highly acidic character of the thermal waters; for such waters, the shortage of data regarding Fe (II/III) and H+ speciation, and the absence of measurements concerning common ions in acid fluids (HS-, H2S), represent a source of error when calculating the charge-balance errors [77].
Measured temperatures of the spring waters vary between 68 and 92 °C, while pH values range from 2.4 to 5.9, thus revealing a large variation in the H+ concentration of thermal springs separated by less than 3 m. It cannot be ruled out that geological factors, such as local structural control, could have influenced the chemistry of the thermal waters and therefore the abovementioned variations in the H+ concentration of thermal springs. The chemical composition of the thermal waters is characterized by large variations in the concentrations of the main anions and cations (e.g., SO4= (206–882 ppm), Ca++ (29–140 ppm), Mg++ (6–65 ppm) and Cl (0.2–16.6 ppm)). Following the chemical classifications of [12,67], these waters are classified as acid-sulphate according to their major anion concentrations. The exploratory well drilled by CFG in 1995 intercepted a shallow reservoir at 240 m depth with measured temperatures up to 198 °C (ENG, internal unpublished reports). A relatively low Cl content for the only two available “deep water” chemical analyses obtained in that period (113.7 and 92.5 mg/l) suggests the dilution of deep geothermal waters with superficial meteoric ones (ENG, internal unpublished reports). Under the SO4=-Cl-HCO3= ternary diagram classification (Table 1), the spring fluids correspond to steam-heated waters [12,67], which are commonly documented in hydrothermal systems associated with volcanic systems. The application of some chemical geothermometers (e.g Na/K, [12]) for the two samples analyzed in this work (Table 1) suggests equilibrium temperatures at a depth of 266–297 °C, which are consistent with the directly measured temperatures in the Nieblas-1 well (Figure 4).

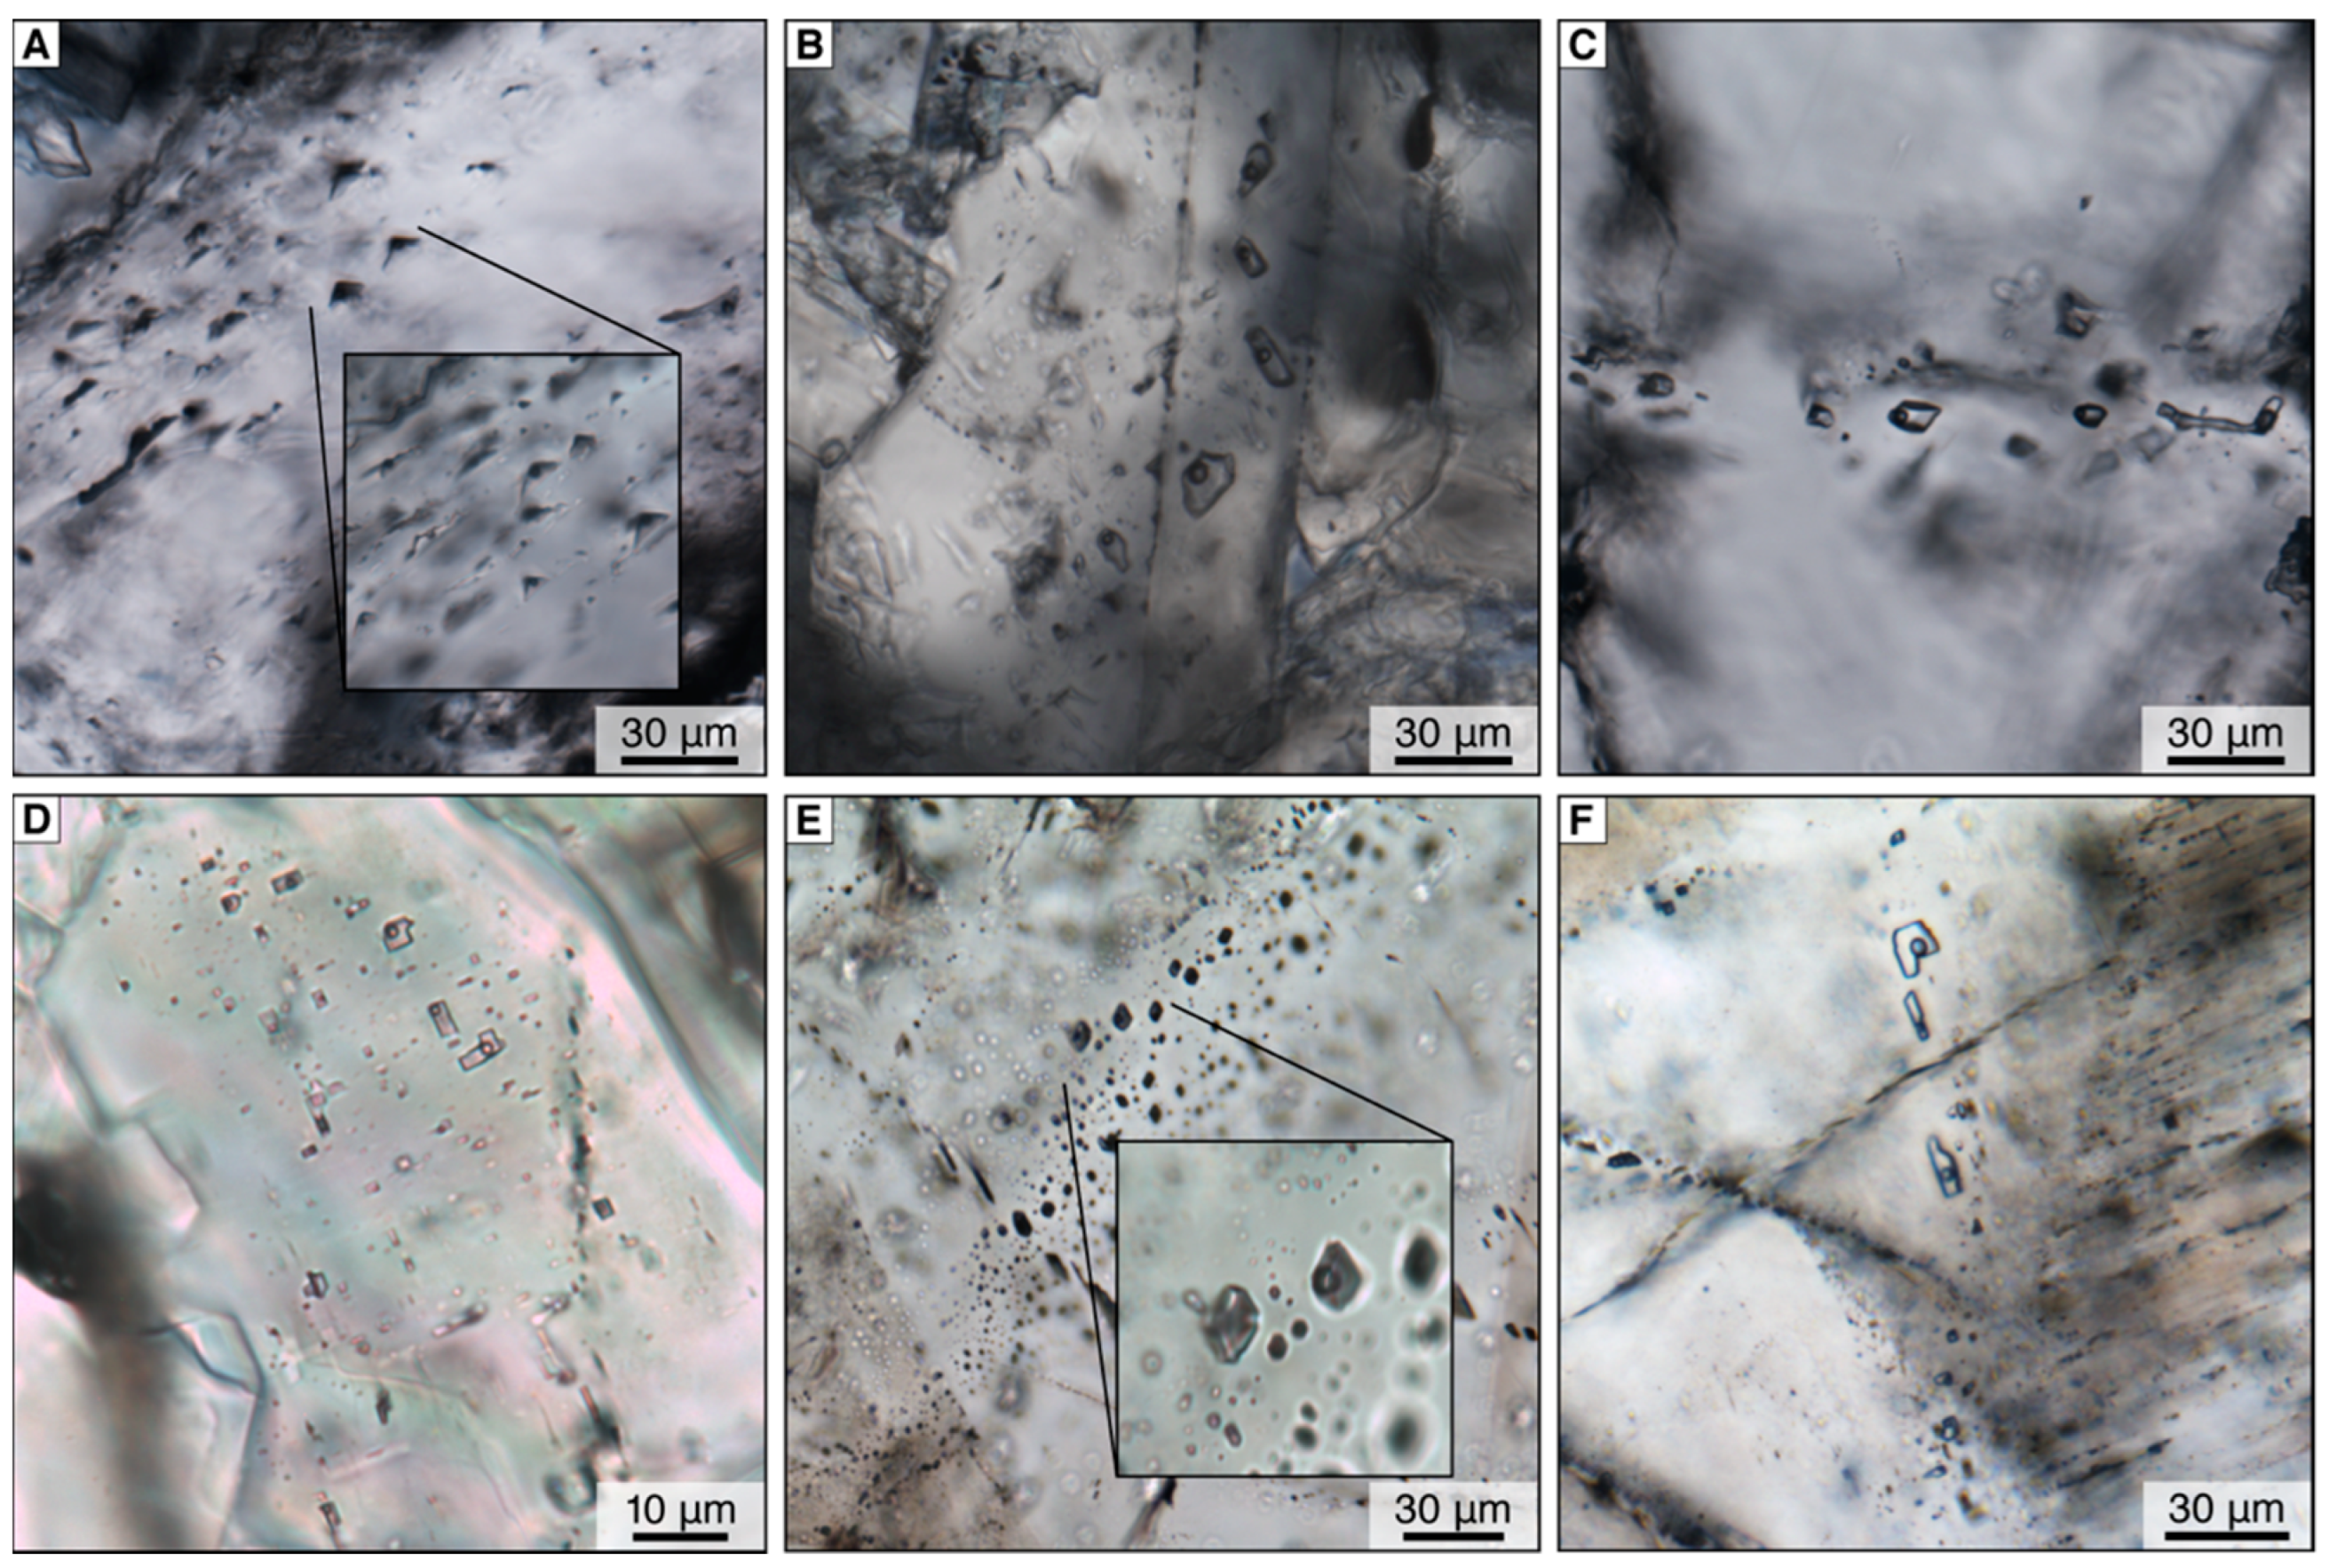
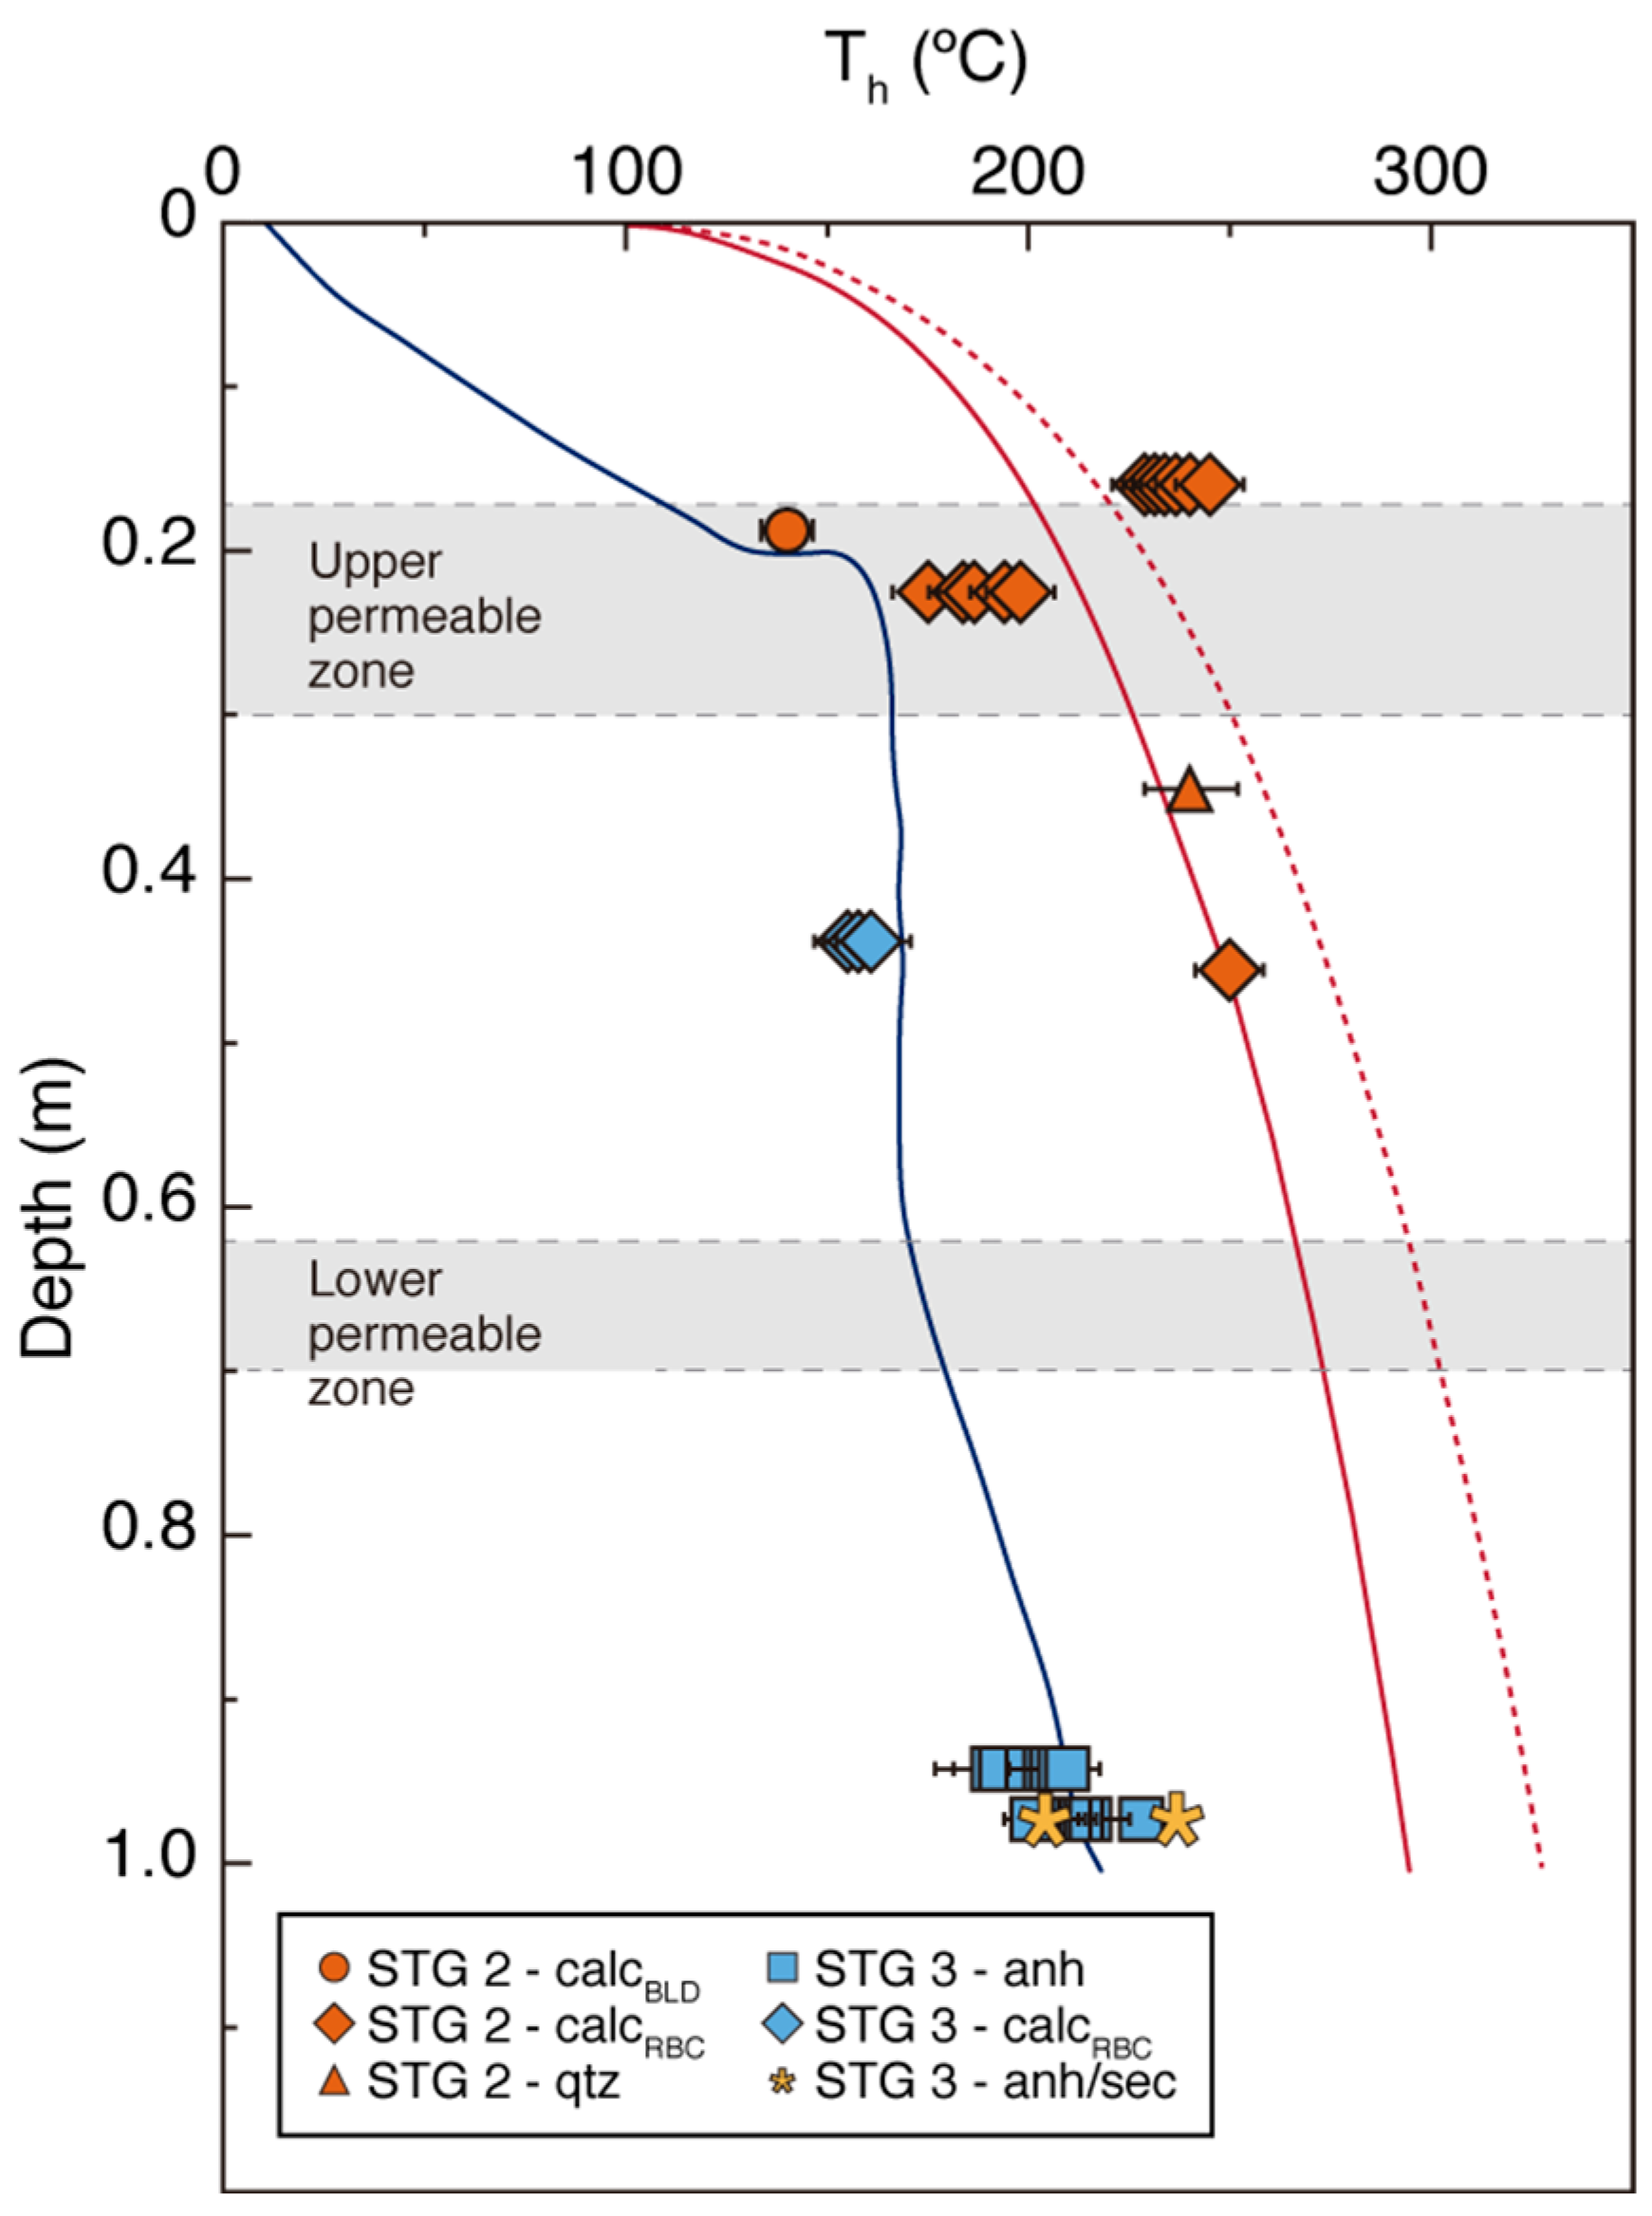
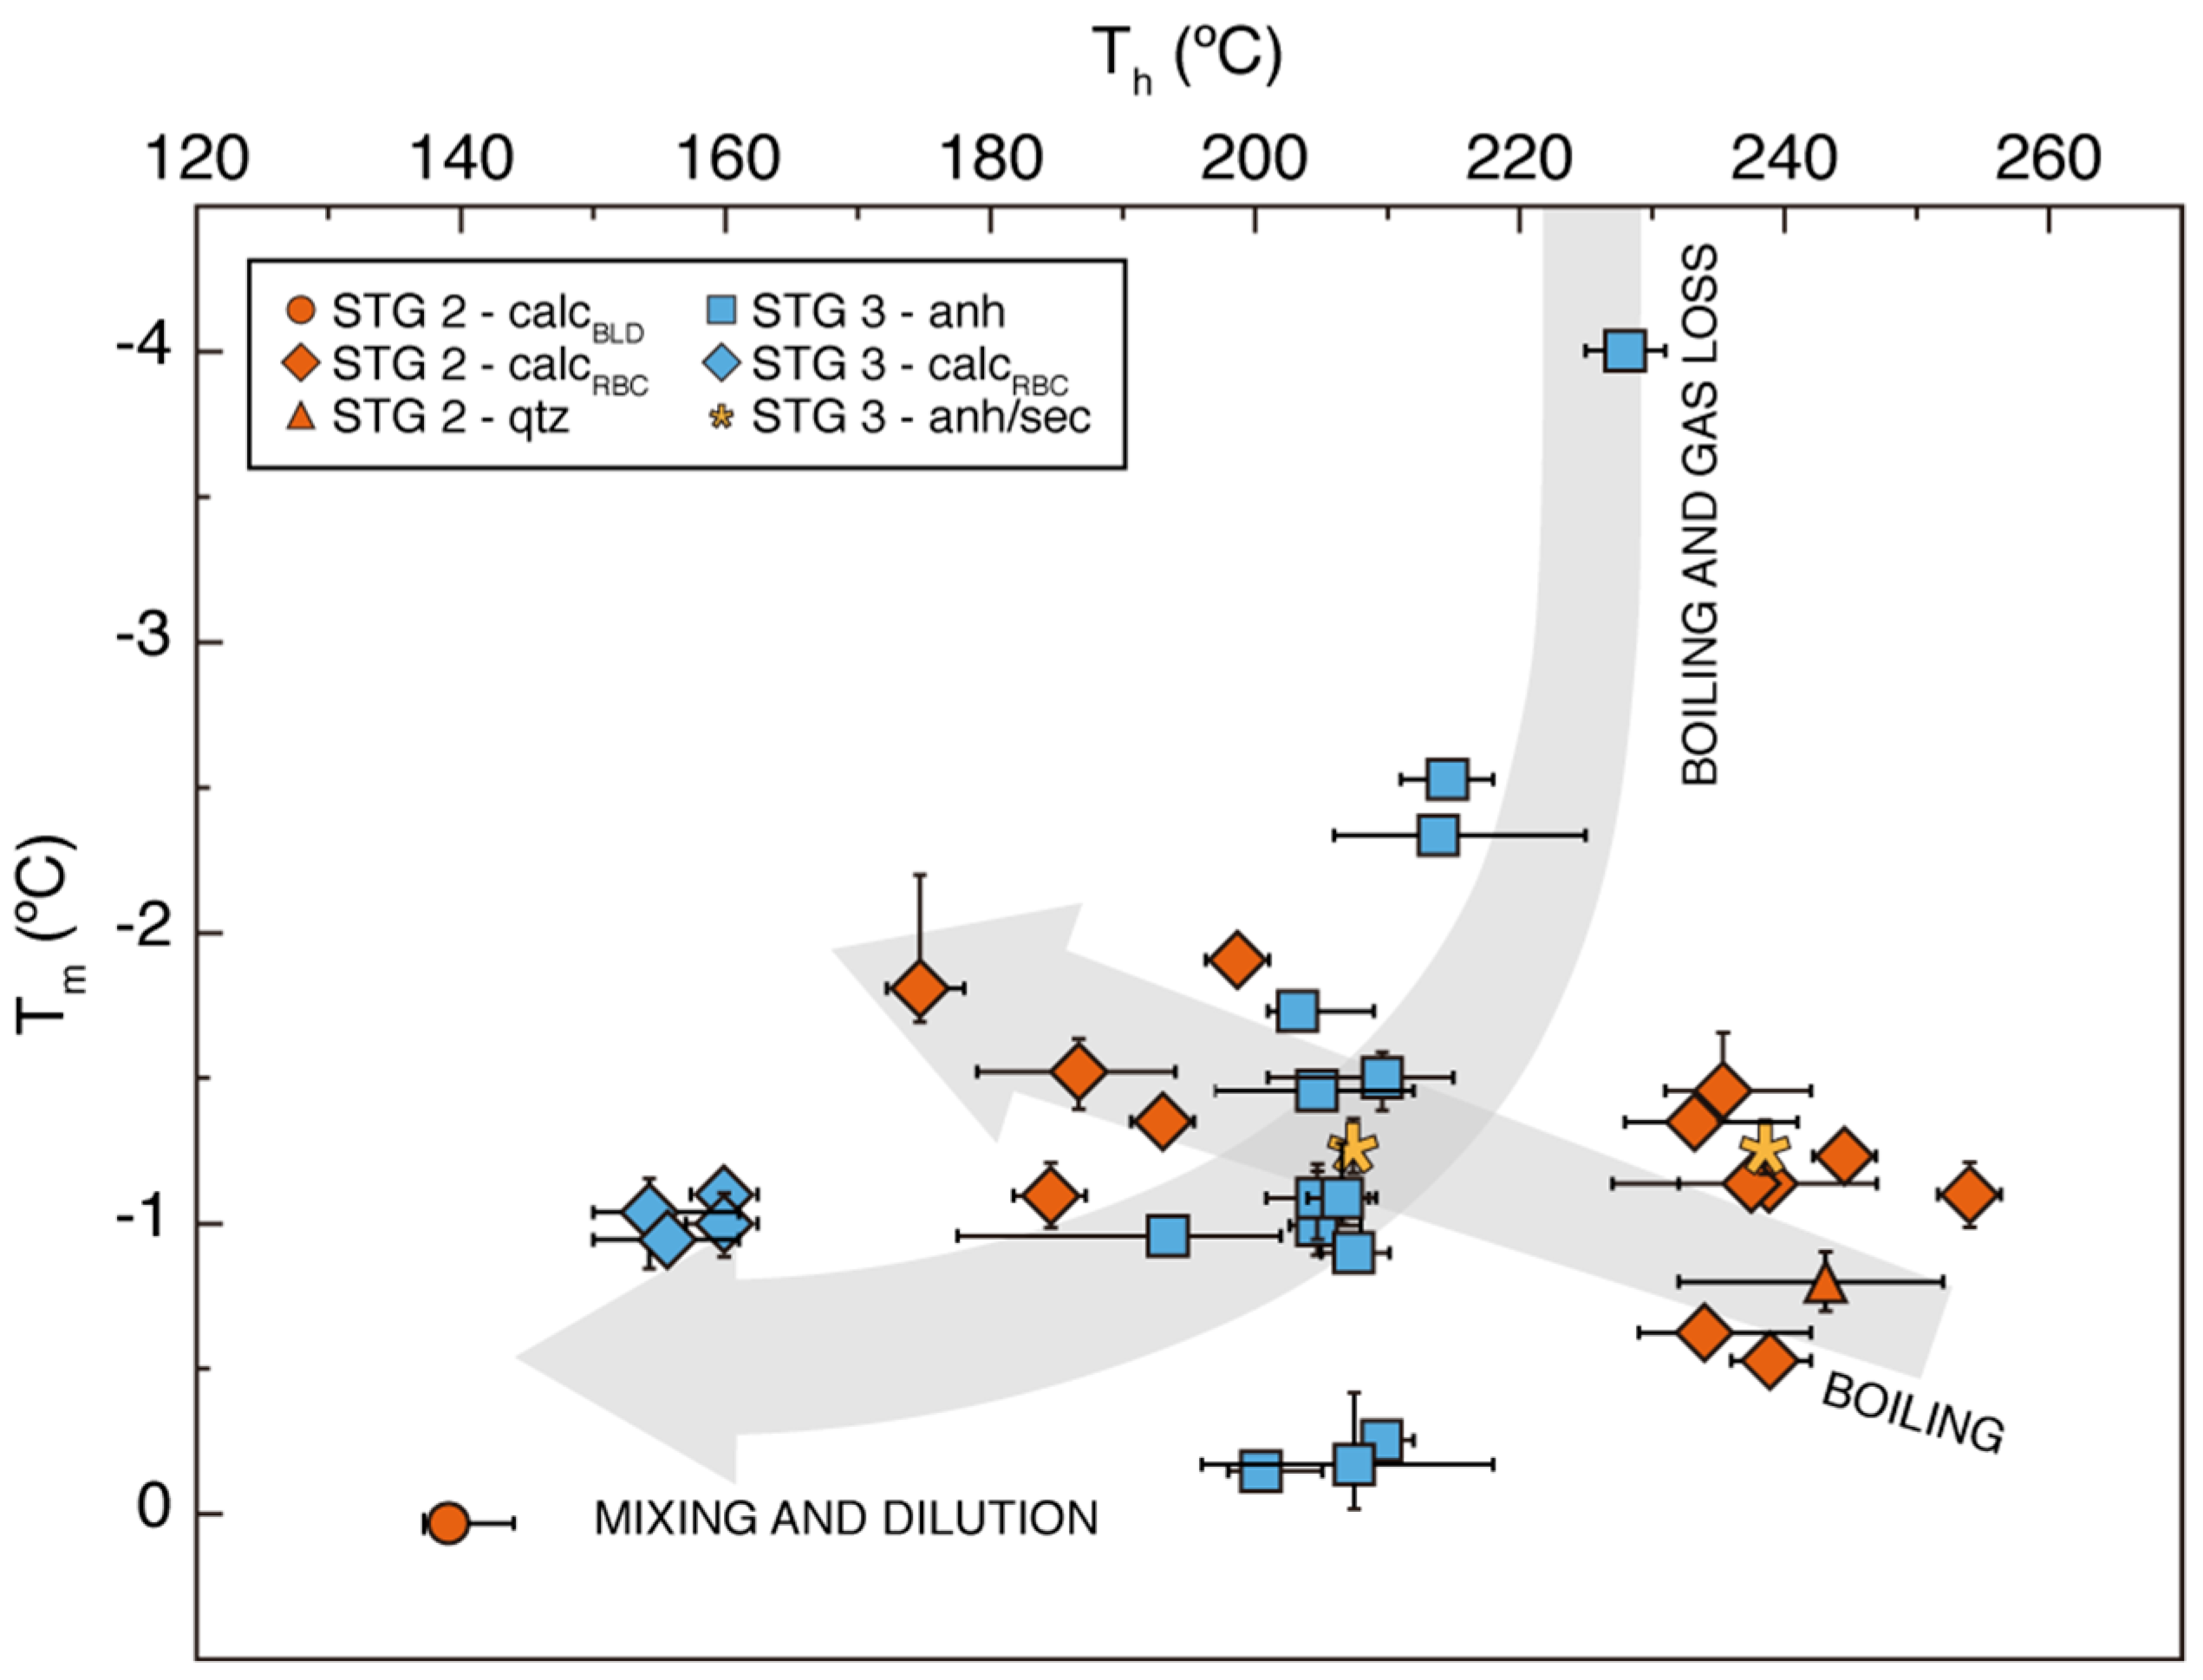
4.4. Fluid Inclusion Measurements

Fluid inclusions were analyzed in calcite, anhydrite, and quartz veins associated with the second and third stages of mineral paragenesis. Microthermometric measurements were performed in liquid-rich FIAs of primary origin with consistent liquid-to-vapor ratios, except in the case of STG 3 anhydrite, in which liquid-rich FIAs of pseudosecondary and secondary origin were analyzed to further constrain the physico-chemical conditions associated with STG 4 of the paragenetic sequence. The homogenization temperatures (Th) and final ice melting temperatures (Tm) are reported in Table 2. Only Th with a temperature range of <20 °C for 90% of the FI measured were considered for further analysis [78,79]. First ice melting temperatures ~–22 °C suggest the presence of mostly H2O-NaCl fluids, while the absence of halite daughter crystals in all of the examined FIAs limits salinities to <~23 wt.% NaCl eq. No clathrate formation was observed during the microthermometric runs, thus indicating dissolved CO2 concentrations of <3.7 wt.% [80]. Based on the aforementioned findings, the paleo-hydrothermal fluids were modeled for simplicity as pure H2O-NaCl in the subsequent analysis. However, as indicated by [80], the presence of CO2 in fluid inclusions, even in very low-concentrations, do not allow the exact determination of fluid salinity from Tm, since the dissolved CO2 in the aqueous phase contributes to ice melting depression up to 1.5 °C, overestimating the calculated salinities.
For the second stage of paragenesis, FIs hosted in calcite and quartz veins were analyzed. All FIs hosted in quartz crystals presented an irregular shape and were bi-phase and liquid-rich. Both lattice-bladed calcite and rhombic calcite were observed in veins associated with this stage. Fluid inclusions in bladed calcite presented a triangular shape, with coexisting liquid- and vapor-rich inclusions (Figure 10A). Fluid inclusions in rhombic calcite presented triangular, negative crystal and irregular shapes, with coexisting liquid- and vapor-rich inclusions. Pseudosecondary inclusions were irregular, monophase, and vapor-rich; secondary inclusions presented oval shapes and were bi-phase and liquid-rich (Figure 10B,C). Homogenization temperatures for this stage range between 140 and 254 °C (Table 2), plotting above the boiling curve for pure water. Th values associated with this stage, which fall outside of the trend mentioned, span from 160 to 230 m depth (Figure 11). Documented salinities range between 0.2 and 3.1 wt.% NaCl eq (Table 2, Figure 12).
Regarding the third stage of the paragenetic sequence, FI was analyzed in anhydrite and calcite veins. Only rhombic calcite was observed to be associated with this stage, presenting bi-phase liquid-rich primary FIAs of irregular shape. Secondary inclusions are rounded with coexisting liquid and vapor-rich inclusions and the additional presence of liquid-rich inclusions. Primary FIs hosted in anhydrite crystals show rectangular shapes and are bi-phase and both liquid-rich and liquid and vapor-rich (Figure 10D). Pseudosecondary inclusions display a squarelike shape and are bi-phase and vapor-rich (Figure 10E). Secondary inclusions are rectangular, bi-phase and liquid-rich (Figure 10F). Homogenization temperatures range from 155 to 228 °C (Table 2), showing an overall diminishment of the temperature compared to Stage 2, being closer to the present-day temperatures measured in the borehole (Figure 11). Secondary inclusions recorded in this stage showed a slight increase in temperature compared to Stage 2. Salinities ranged from 0.2 to 6.4 wt.% NaCl eq. (Table 2, Figure 12). However, as indicated by [81] the possibility of fluid inclusions stretching during heating run must be considered in the interpretation of Th obtained.
Figure 11. Paleo-fluid temperatures in the NChGS were ascertained from fluid inclusion homogenization temperatures (Th). Boiling point with depth (BPD) curves are shown for pure water (red line) and for a 25 wt.% NaCl eq. fluid (dotted red line), after [82]. The temperature of the Nieblas-1 borehole (blue line) is shown for comparison. Additionally displayed are the upper and lower permeable zones (gray shaded areas), as defined by core logging of Nieblas-1.
Minerals 13 00722 g011
Figure 12. Paleo-fluid apparent salinities in the NChGS, established from fluid inclusion final ice melting temperatures (Tm). Additionally shown are the trends (light gray arrows) for boiling and gas loss and mixing and dilution of a gas-rich fluid and boiling for a gas-poor fluid system after [80].
Minerals 13 00722 g012

5. Discussion

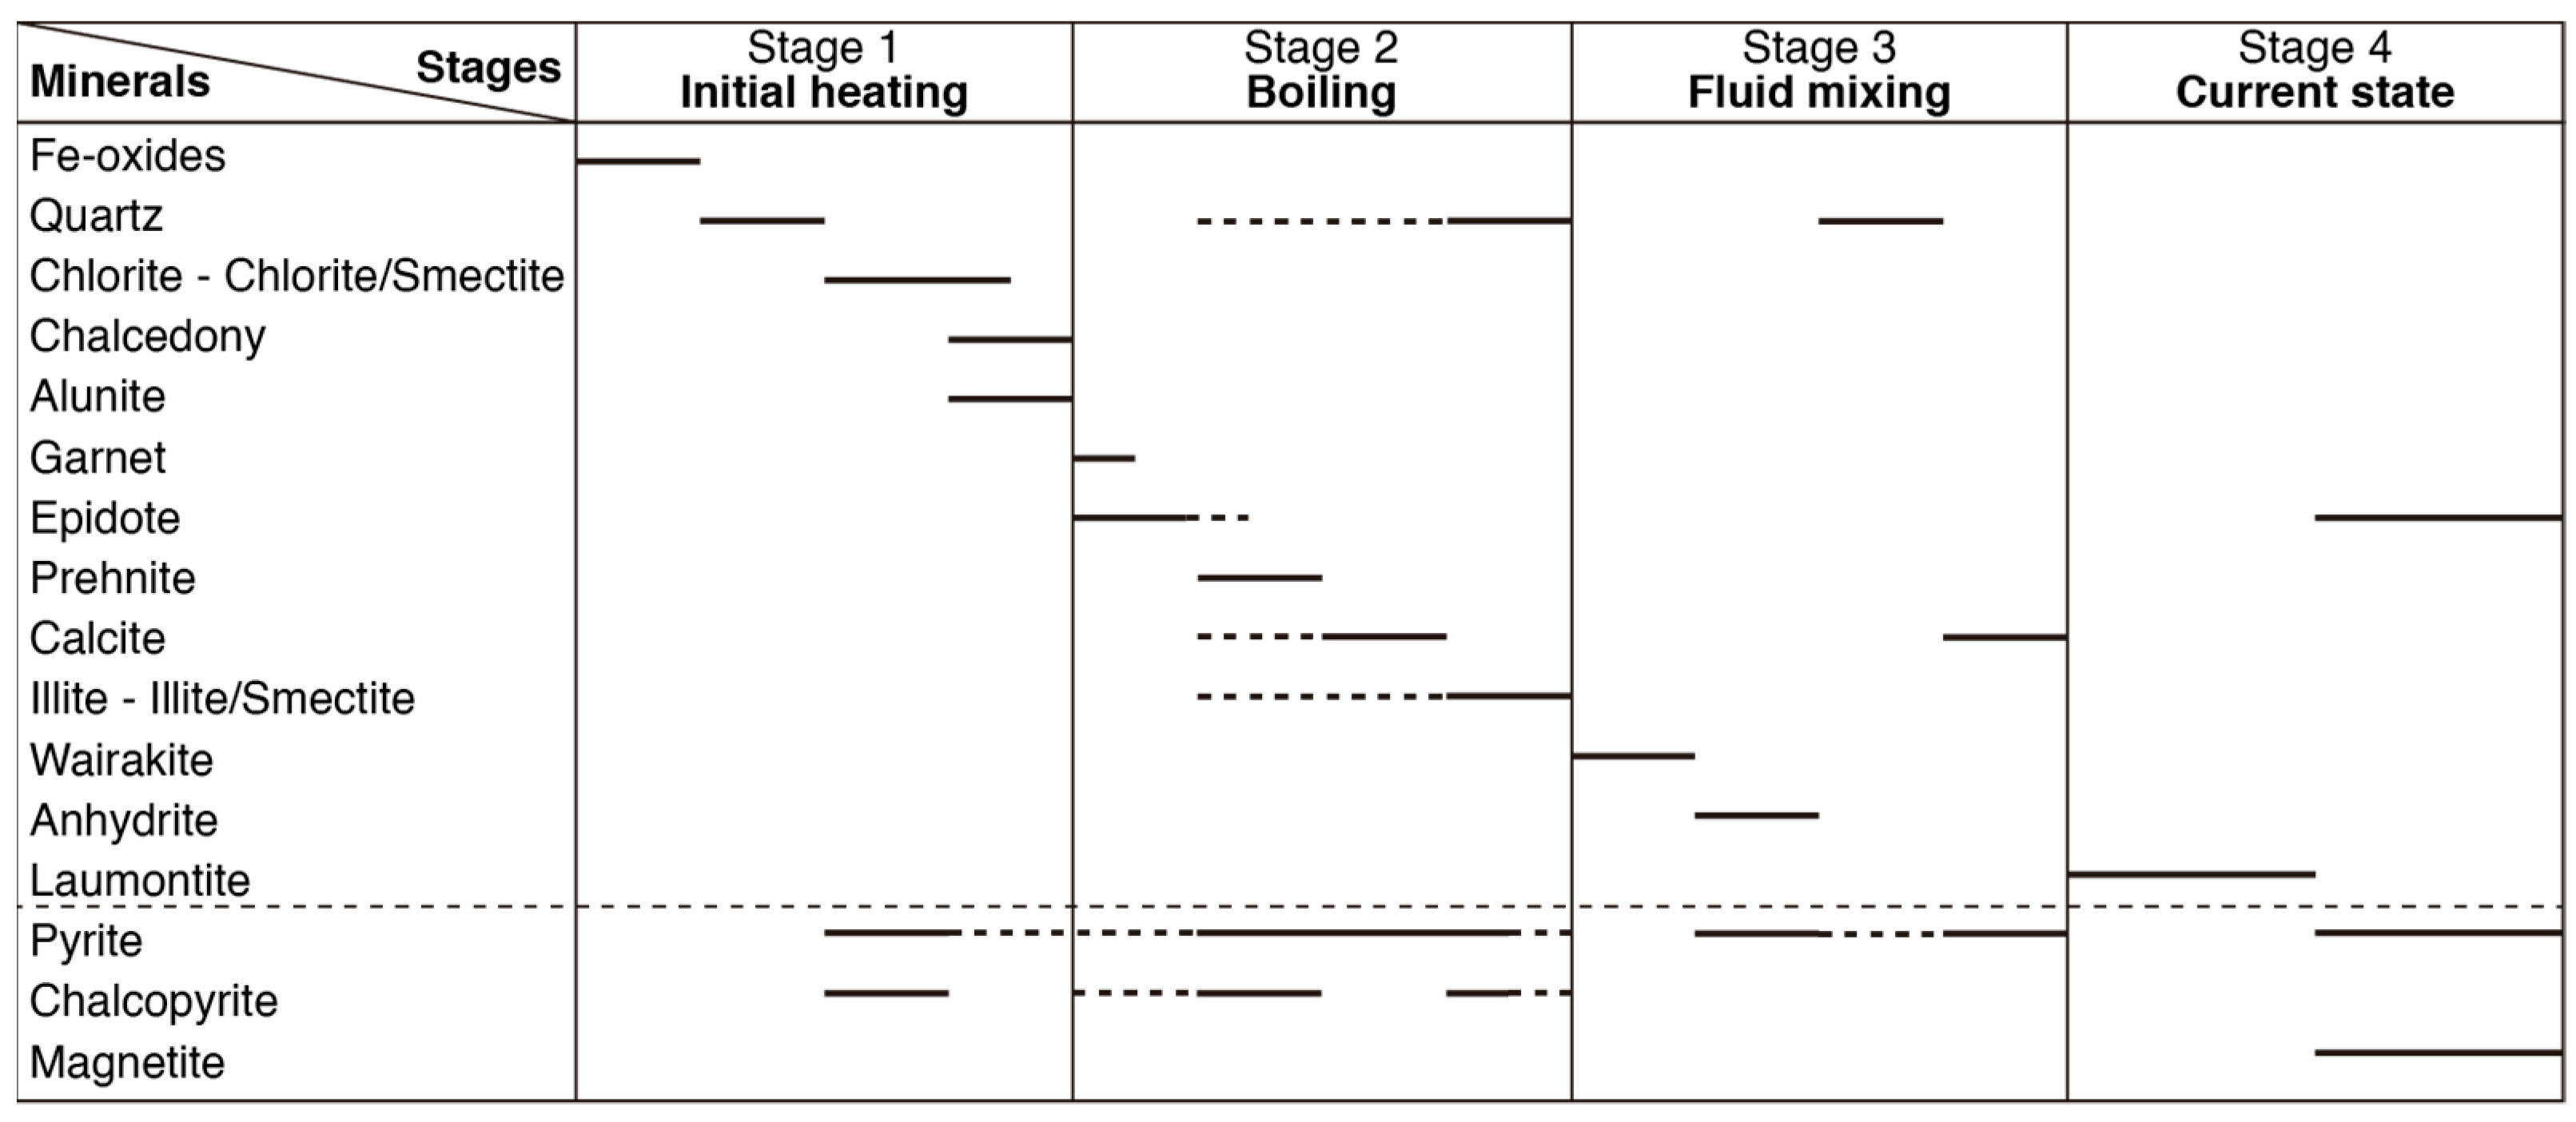
5.1. Mineral Paragenesis

Our mineralogical study of a drill core from the Nieblas-1 well revealed a complex hydrothermal evolution in the NChGS, with a paragenetic sequence comprised of four distinct mineral assemblages (Figure 5). Stage 1, defined by the presence of iron oxides, mafic phyllosilicates, microcrystalline quartz, and chalcedony, documents the initial heating of the hydrothermal system. The existence of breccias cemented by this mineral assemblage, alongside the presence of microcrystalline quartz and chalcedony in veins—with both of these silica phases entailing a high degree of silica supersaturation [83,84,85]—suggest an earlier brecciation event in the system accompanied by boiling due to the loss of confining pressure [9,83]. Decompression in hydrothermal systems has been interpreted as the result of glacier retrieval, volcano flank collapse, and/or hydraulic fracturing due to an increase in fluid pressure [86,87,88]. All of these scenarios are possible in our case. However, the lack of constraint regarding the timing of the hydrothermal alteration limits further examination of the processes associated with Stage 1. Towards the end of this stage, the presence of alunite in alteration halos denotes the circulation of highly acidic hydrothermal fluids [87,89,90]. The physico-chemical characteristics of such fluids in hydrothermal systems are related to the input of rising steam emanating from a boiling hydrothermal reservoir and/or the influx of primary magmatic volatiles [11] into shallow, relatively oxygenated aquifers. In the case of the NChGS, considering its geologic context of volcanic activity since the Pliocene, it is most likely that the role of the primary magmatic source involves both a rise in the geothermal gradient and a mass transfer when considering the chemical composition of the shallow aquifer.
The second stage of mineral paragenesis, characterized by the presence of calc-silicate minerals, mixed-layer I/S and illite clay minerals, and calcite (Figure 5), records the development of a high-temperature fluid-dominated system. This mineral assemblage is characteristic of near-neutral chloride waters whose composition is fixed by water–rock interactions close to full equilibrium in a deep reservoir [87,91,92,93]. After attaining such conditions, increasing fluid/rock ratios lead to the development of alteration assemblages that are mainly controlled by the chemistry of the hydrothermal fluid. Correspondingly, the presence of interstratified I/S is related to potassium metasomatism and Al availability [91,94]. The widespread presence of bladed calcite, indicative of boiling conditions [10], suggests that, during this stage, temperatures were limited by the boiling point with depth (BPD). Moreover, the presence of garnet in geothermal systems has been considered an indicator of temperatures on the order of 300 °C [2,95,96]. Hence, the presence of vesicles infilled by garnet crystals in the deeper end of the Nieblas-1 core suggests that high temperatures were attained during this stage, which is in accordance with the temperature range estimated by the BPD curve. However, care must be taken when inferring temperatures of ~300 °C due to the presence of garnet, as this mineral can form at lower temperatures in the presence of hydrothermal fluids with high Ca++ activity (Figure 13).
The third stage, established by the appearance of wairakite, anhydrite, quartz, and calcite (Figure 5), records the influx of steam-heated waters deep in the system [87,92,97]. The presence of calcic zeolites (e.g., wairakite) instead of epidote and prehnite denotes a change in the temperature and/or pH conditions in the system (Figure 13B). Furthermore, the presence of anhydrite and rhombic calcite, both of which have retrograde solubilities [10,98,99], indicates the input of shallower fluids with higher contents of SO42−, Ca2+, and CO2, as have been observed in steam-heated waters [2,22,100]. The presence of quartz crystals with comb textures rimming STG 3 calcite veins suggests that, toward the end of this stage, the system had equilibrated again and returned to mildly changing conditions [9,83,85].
The last stage, characterized by laumontite, epidote, quartz, and magnetite, suggests a new adjustment of the physico-chemical conditions in the NChGS—particularly near the base of the Nieblas-1 core, where this mineralogical assemblage is better developed. At this depth, a local brecciation event seems to have taken place between STG 3 and STG 4, as evidenced by the presence of laumontite as a cement in hydrothermal breccias (Figure 6E,F). This event could have caused the differences needed in the temperature and/or pH of the system [88] for the development of the STG 4 mineralogical assemblage (Figure 13B). However, other factors could also be responsible for an increase in temperature and/or changes in the chemical composition of the hydrothermal fluid, such as an increase in volcanic activity [101].

5.2. Clay Minerals and Permeability Constraints

The vertical distribution of the clay minerals in the drill core shows interstratified C/S and I/S at shallower levels than Chl and Ill. This depth zonation reflects an overall decrease in the percentage of expandable layers in response to increasing temperatures [102,103], as has been reported in numerous hydrothermal systems [6,16,76,93,104,105,106]. Regarding the smectite-to-chlorite transition series, commonly reported temperatures for Co, C/S, and Chl range between 20–110 °C, 40–175 °C, and 25–220 °C, respectively [104,107,108,109]. In the NChGS, the absence of samples with smectite at low temperatures (<80 °C) and the presence of Co, C/S, and Chl throughout the well core (Figure 2) differ from observations at other geothermal systems. Nonetheless, considering the temporal association of these minerals with the first stage of the paragenetic sequence, we maintain that this dissimilarity is due to the physico-chemical conditions present early in the development of the NChGS. Considering that the transformation from smectite to chlorite responds not only to the thermal gradient but also to the environmental permeability conditions, among other factors [110,111], we argue that an initially high fluid/rock ratio (probably related to an early regional alteration event) allowed the widespread distribution of Co and Chl in the system without the presence of mixed-layer C/S [112,113,114]. Later, a progressive decrease in the secondary permeability, and the consequently lower fluid/rock ratios, led to the development of mixed C/S [109,115], marking the onset of clay-cap development in the NChGS. This early regional alteration event, and the consequent development of smectite, could have reduced the matrix permeability of the volcanic and volcaniclastic rocks from the Cura–Mallin formation, as also documented in the experimental work of [17]. In turn, the lower permeability conditions may have allowed the preservation of these clay minerals throughout the remaining stages of the hydrothermal evolution, enabling their presence at different temperatures than they are documented to occur in other geothermal systems.
Similarly to the smectite-to-chlorite transformation, the smectite-to-illite mineral series has been proved to be conditioned by several parameters other than temperature, for example, the chemical composition of the hydrothermal fluids, the chemistry of the precursor minerals, the reaction time and the fluid/rock ratio [94,116,117,118,119]. In the NChGS, mixed-layer I/S and Ilt were reported at 50–180 °C and >170 °C, respectively (Figure 8). These temperatures are consistent with the temperature ranges commonly documented for these minerals in several hydrothermal systems [16,102,104,105,120,121]. Nevertheless, in the NChGS, the percentage of Ilt layers in interstratified I/S minerals shows a discontinuous decrease with depth, unlike what has been observed in other hydrothermal systems: studies have found that the amount of Ilt layers in I/S minerals increases with the fluid/rock ratio [122] and that as mixed-layer I/S becomes enriched in Ilt layers during the illitization process, the ordering of the interlayer structure changes from random (R0) to short-range ordered (R1) and lastly to long-range ordered (R3) [116]. The discontinuous character of this structural conversion in the NChGS, where I/S-R0 with 20%–40% Ilt layers were not documented (Figure 9), contrasts with the continuous smectite-to-illite transition series seen in diagenetic and hydrothermal environments where uniform thermal gradients and fluid circulation through pores prevail [106,121,123]. In particular, the sigmoidal variations observed in the percentage of Ilt layers in I/S minerals at 150–200 °C (Figure 9), and the transition from I/S-R0 to I/S-R1 at ~50% Ilt, suggests that the smectite-to-illite transition series developed abruptly under high thermal gradients, allowing high fluid/rock ratios. This is consistent with a dissolution-crystallization precipitation mechanism, where hydrothermal minerals precipitate directly from hydrothermal fluids [119,120]. Furthermore, the clay textures observed in BSE images prove that these minerals crystallized directly from a hydrothermal fluid, thus supporting the previous statement. The aforementioned indicates that, since the second stage of the paragenetic sequence, the circulation of hydrothermal fluids was restricted by the clay cap and mainly channeled through fractures.

5.3. Characterization of Hydrothermal Fluids

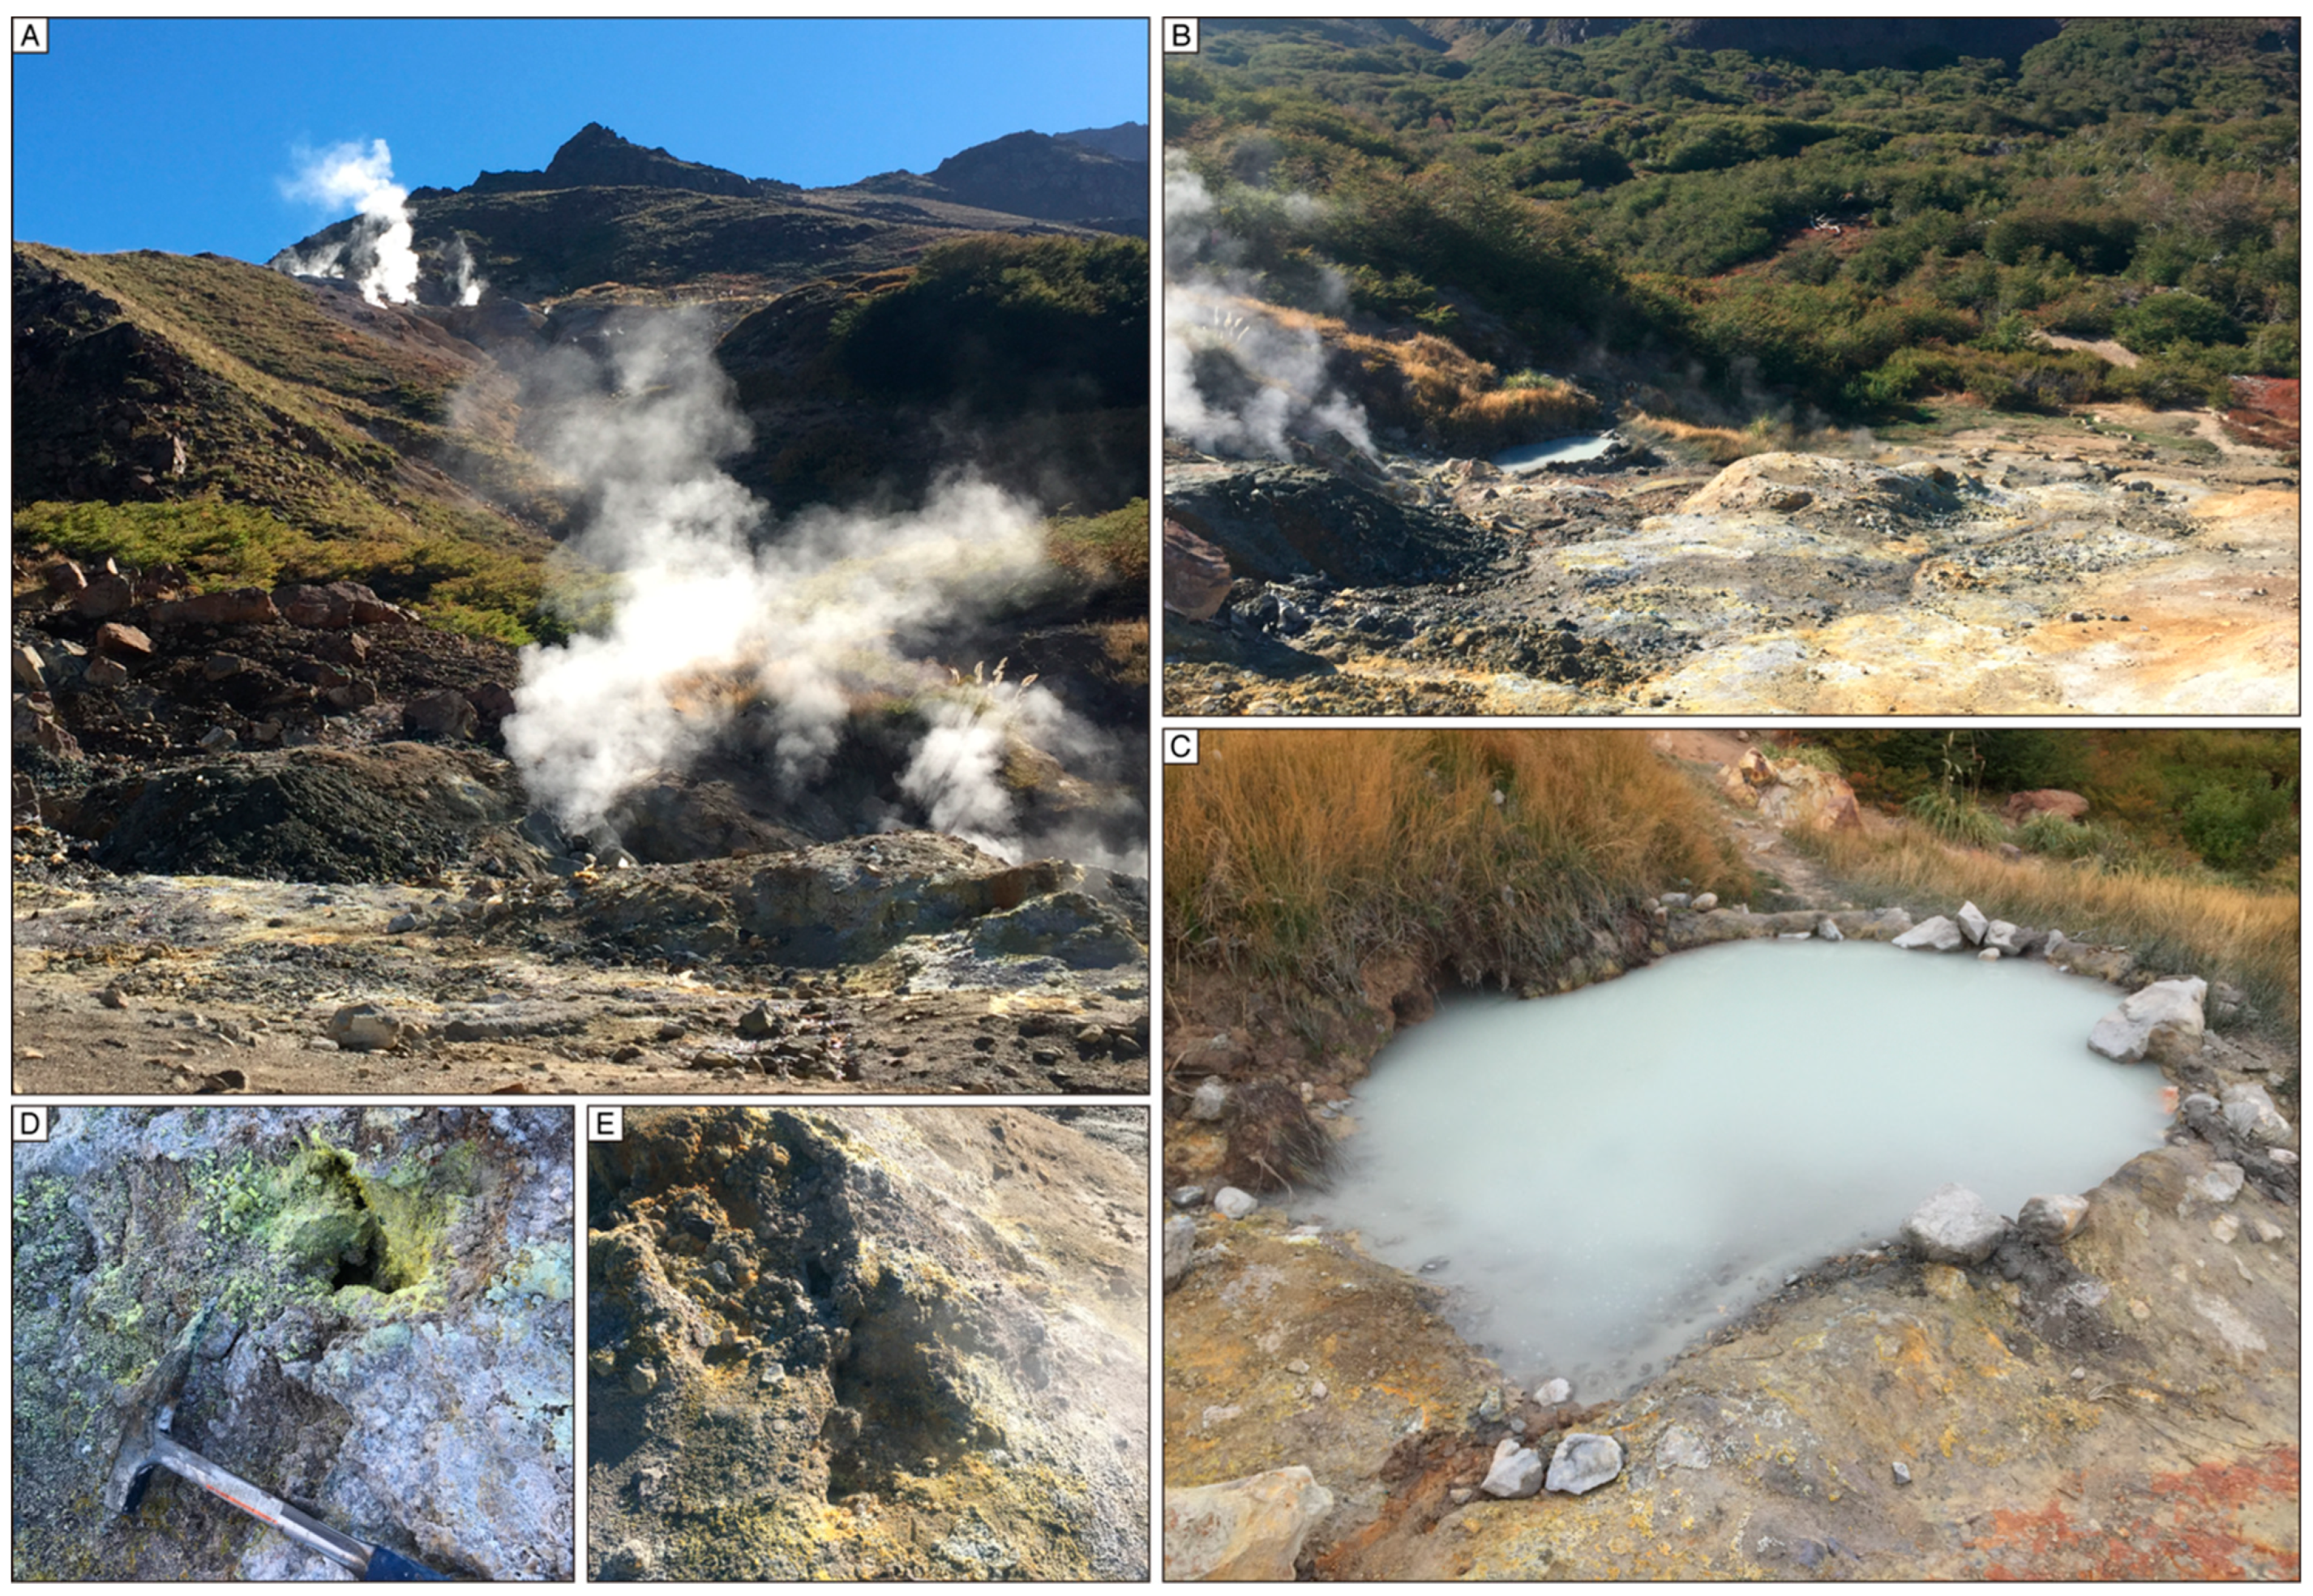
5.3.1. Surface Manifestations

The chemical compositions of the surface manifestations in the study area (Table 1) resemble those of thermal waters spatially associated with volcanic centers and/or hosted by active stratovolcanoes [92,100,124,125]. The thermal springs on the southeast flank of the (currently active) Nevados de Chillán Volcanic Complex are assessed as acid-sulfate steam-heated waters. Such waters originate from the condensation of rising steam and volatiles, emanating from a deeper boiling reservoir and/or magmatic source, into shallower, relatively oxygenated groundwaters [1,12]. In this scenario, the oxidation of H2S to H2SO4, and the later dissociation of this sulfuric acid, leads to the highly acidic character of the hydrothermal fluids, which in turn promotes the dissolution of the surrounding rocks and thus the addition of cations to the thermal waters. Previous studies of these waters have revealed δD and δ18O values in the range from –74.60 to –51.90, and –9.65 to –6.18, respectively, suggesting that fluids in the NChGS are predominantly of meteoric origin, with a slight deviation towards andesitic waters due to the input of magmatic volatiles and the intense water–rock interaction processes [22,27].
Common products of the interaction between the kind of fluids mentioned previously and andesitic rocks include sulfate minerals, clay minerals (e.g., smectites and chlorite), quartz, pyrite, and iron oxides, among others [27]. The presence of interstratified C/S, quartz, pyrite, iron oxides, and alunite observed between 170 and 250 m indicates the circulation of these types of fluids at depth, which is consistent with the existence of a shallow, steam-heated aquifer responsible for the recharge of the surface discharges.

5.3.2. Deep-Seated Hydrothermal Fluids

Notwithstanding the absence of direct measurements of water samples from the Nieblas-1 well, a general characterization of the hydrothermal fluids and conditions present in the deeper parts of the NChGS was attained, taking into account both the mineralogical constraints previously discussed and the petrography and microthermometry of STG 2 and STG 3 FIAs (Table 2, Figure 11 and Figure 12). The presence of primary, liquid-rich FIAs in quartz crystals associated with the early phases of the second paragenetic stage shows initial non-boiling conditions. However, the coexistence of primary liquid-rich and vapor-rich inclusions in calcite crystals illustrates the establishment of a later gentle boiling event during STG 2 [9,78,126]. This feature is in accordance with the presence of lattice-bladed calcite at several depth levels [10]. Furthermore, the homogenization temperatures recorded at this stage are restricted by the boiling point vs. depth curve for pure water (Figure 11), in line with the prior considerations, though samples between depths of 160–230 m deviate from this trend. For samples from 160 m, an exact fit with the BPD curve is attained when considering fluids with salinities higher than 20% wt. NaCl eq. (Figure 11). However, the absence of halite crystals in the FIs and the range of salinities documented for this stage, were between 0.2 and 3.1 wt.% NaCl eq. (Table 2, Figure 12), dismiss this option. One possible explanation for the high-Th data for these samples, regardless of the apparently primary character of the FIAs, could be in relation to changes in the paleo-water table due to erosion and deglaciation (?) processes. The aforementioned observations, together with those attained from the alteration mineralogy related to STG 2, indicate the presence of a near-neutral chloride fluid with low salinity and moderate-to-low concentrations of dissolved CO2 and which, during the development of STG 2, maintained temperatures resembling those of the BPD curve for pure water, being significantly higher than the present-day temperatures measured in the Nieblas-1 well. In this sense, fluid inclusions from this STG 2 follow a pattern of slight enrichment of salinity with cooling (Figure 12), consistent with the boiling of a low-gas system as proposed by [80]. However, as previously discussed, modest quantities of dissolved CO2 in the fluid could determine a significant deviation from the BPD of pure water [80]. Moreover, the absence of neoformed gypsum on the walls of fluid inclusions during low-temperature running experiments would not be a possible explanation for a lowering of Tm [81].
Regarding STG 3, two distinct contexts were identified. In the central part of the drill core, primary, liquid-rich inclusions were observed in calcite veins rimmed by comb quartz, with both features validating non-boiling conditions [9,78,83,85,126]. In contrast, at a depth of ~950 m, coexisting liquid-rich and vapor-rich inclusions in anhydrite veins indicate gentle boiling conditions. Moreover, pseudosecondary vapor-rich inclusions in anhydrite imply that flashing conditions were attained at these depths [9]. At this level, flashing was most likely the result of a minor brecciation event, as manifested by the local presence of later STG 4 laumontite as a cement in hydrothermal breccias (Figure 6e–f). The change of conditions with depth, and particularly the boiling and flashing of the hydrothermal fluids in the deeper levels, is consistent with the wider range of salinities recorded for this stage (Table 2, Figure 12). In a boiling scenario, the separation of a steam phase from the hydrothermal fluid is related to the fractionation of volatiles (e.g., CO2, H2S) and relative volumetric changes between the steam and fluid phases, therefore inducing changes in the physico-chemical characteristics of the residual hydrothermal fluids, such as a variation in their salinities [127,128,129]. Moreover, following [80], the combination of boiling a gas-rich fluid with subsequent dilution is characterized by a drop in Tm due to the loss of dissolved gas followed by a gentle Tm decrease with fluid inclusion homogenization temperatures (Th). Lower homogenization temperatures were recorded in STG 3 compared to STG 2, being consistent with the present-day temperatures and implying a widespread cooling of the NChGS during this stage. Such a variation in the thermal behavior of the system has been documented in numerous geothermal systems [3,4,86,130,131]. A falling water table, the waning and shifting of the heat source, and the incursion of cold waters have been interpreted as possible causes for the cooling of geothermal systems [8]. In the NChGS, in the absence of precise dating of the hydrothermal alteration process, we can not discard changes in the water table, and, although it is not possible to dismiss a waning and/or shift of the heat source, we argue that the most likely explanation for the cooling of the geothermal system that occurred during STG 3 involves the infiltration of cooler waters, as revealed by the alteration mineralogy coupled with changes in water table level that was lower than current conditions.
Homogenization temperatures of secondary FIs analyzed in STG 3 anhydrite suggest a possible increase in the temperature of the system during this stage, which is compatible with the transition from laumontite to epidote observed in STG 4 veins. However, further measurements need to be performed to confirm such observations. Moreover, even no visible changes in the FI morphologies during freezing and heating runs, possible stretching during the heating run could provide erroneous Th estimations as indicated by [81].

5.4. Structural Control on the NChGS

Our work in progress, together with previously published data [40,57,58], allow us to propose a first-order structural control on the origin, development, and location of the NChGS. The main lineaments described in the area (Figure 2) were studied at the outcrop scale, and it was possible to distinguish subvertical EW-oriented sinistral (normal component) transcurrent faults—which are clearly identified in the Las Trancas Valley (Figure 2)—as major geomorphological and structural feature. Secondary populations of N30-60E striking, high-angle faults with normal kinematics, are also identified in the Las Trancas and Hermoso valleys. Less abundant families of faults are NS to NNE-striking dextral-reverse faults and NW reverse-dextral faults, both observed in the Las Termas-Olle de Mote and Valle Hermoso sites. Additionally, a series of fractures can be observed at the structural sites, suggesting the existence of a highly fractured system in both crystalline (granitoid and hornfels) and stratified rocks (Cura-Mallin formation). The orientation of steeply dipping fractures is dominated by a larger NW-trending family, which is followed by NE- and EW-trending fractures with similar relative abundance. Fractures with NS-trending are significantly the least abundant group.
Furthermore, a series of low-angle thrust faults, subparallel to the Cura-Mallín Formation stratification, were identified in the Las Termas-Olla de Mote site. These faults would control the flow of fluids in the NChGS, allowing the circulation of meteoric water to deep reservoirs and enhancing the secondary permeability favoring fluid–rock interactions and developing the clay cap as observed in the Nieblas-1 well. Moreover, our study suggests the main control of the low-angle thrust faults in the surficial hydrothermal manifestations observed in the Las Termas-Olla de Mote sector (Figure 14), with our conceptual model suggesting a first-order control of faults and fractures on both the location of the geothermal system and on the enhancement of secondary permeability. An experimental study by [17] demonstrates that fractured silicified rocks can enhance secondary permeability via the development of a dense fracture network. Internal reports from ENG suggest a reservoir temperature of around 250 °C at 1200–1300 m depth. As the Nieblas-1 ~1km deep exploratory well did not reach the geothermal reservoir, we propose that the reservoir must be hosted within fractured rocks of the Santa Gertrudis-Bullileo granitoid and associated hornfels (Figure 14), which are located deeper than 1000 m. These crystalline rocks which could enhance their secondary permeability by silicification processes, will generate a fracture network transforming these rock units in a favorable for the geothermal reservoir configuration.

5.5. Hydrothermal Evolution and Conceptual Model of the NChGS

The detailed survey of hydrothermal alteration within the Nieblas-1 well, coupled with the physico-chemical characterization of the surface manifestations and our structural geological analysis, offers comprehensive insights into the hydrothermal evolution of the NChGS.
The initial heating, which was most likely accompanied by the over-pressurization of the system, triggered a brecciation event where the loss of confining pressure led to boiling and oversaturation of the hydrothermal fluids, with the latter in turn inducing the precipitation of secondary minerals whose chemistry was controlled by the chemical signature of the host rock. Fluctuations in secondary permeability during this phase are reflected in the shift from the initial precipitation of Co and Chl, correlated with high fluid/rock ratios, to the later progression of the C/S mineral series, which is associated with lower fluid/rock ratios, the latter marking the formation time of the clay cap. It is likely that, at the end of this stage, the separation and upward migration of a steam phase along with volatiles from a primary magmatic source condensed into shallow groundwaters and prompted the formation of an acid-sulfate steam-heated aquifer located above the developing clay cap.
Continuous interaction between the hydrothermal fluids and the primary host rocks caused the formation of a fluid-dominated environment in the deepest sector of the system, where moderate concentrations of dissolved CO2 favored the precipitation of calc-silicate minerals and, later, carbonates (Figure 13A), as the hydrothermal fluids migrated upwards to the steam-heated aquifer level. Subsequently, changes in the fluid/rock ratios endorsed potassium metasomatism and the subsequent inception of the I/S mineral series; accordingly, the development of the clay cap was further enhanced and the circulation of the hydrothermal fluids was further routed through fractures. The highest temperatures recorded in the NChGS were reached during this phase, leading to the boiling of the upward-migrating fluids. This last event entailed the loss of CO2, thus supporting the ensuing precipitation of Ca zeolites (Figure 13B).
The boiling episode and high temperatures were likely quenched by descending, steam-heated waters, which upon migration were mixed with deeper hydrothermal fluids and heated, precipitating Ca-zeolites, carbonates, and sulfate minerals along the fluid circulation pathways, effectively sealing the system. Presumably, the boiling of the mixed waters in the deepest levels reached by the Nieblas-1 well, along with the surrounding enclosed conditions due to the presence of the clay cap and the mineral precipitation in veins, over-pressurized the system, generating new localized fracturing of the host rock and the flashing of the hydrothermal fluids.
The temperatures recorded in the aforementioned phase are similar to the present thermal profile in the NChGS (Figure 3 and Figure 14), suggesting that relatively stable conditions have persisted since this phase. Nonetheless, the development of a modern hydrothermal alteration assemblage, with the direct precipitation of secondary minerals restricted to open veins seemingly formed during the last over-pressure fracturing event, and the high temperatures documented in secondary inclusions of STG 3 anhydrite (Table 2), reveal the onset of new conditions in the system, mostly developed at depths below ~ 700 m, that is, beneath the clay cap.
The long-term evolution outlined above frames the present architecture of the NChGS (Figure 14), with the key elements being the steam-heated aquifer, the clay cap, and deep, near-neutral chloride fluids in an area where secondary permeability (related to the presence of fault and fractures) allows fluid-flow-fracture processes. Faults and fractures allow the circulation of meteoric waters up to reservoir depths. Meanwhile, the strongly fractured Santa Gertrudis granitoid is the likely host of the reservoir unit, where temperatures could reach up to 250 °C at depths of 1200–1300 m. Finally, the development of the clay cap has been a determining factor in the geothermal evolution of the NChGS, not only acting as a seal for temperature and pressure conditions but also perching on the steam-heated aquifer domain, as well as isolating this domain from the deep reservoir realm and limiting the fluid circulation to permeable channels.

6. Concluding Remarks

Our mineralogical study of the NChGS was based on analysis from the c. 1000 m deep Nieblas-1 exploration well and was coupled with fieldwork and detailed structural analysis. This combined approach was used to design a conceptual model for the active geothermal system, as presented in Figure 14. A first-order structural control defines the location and evolution of the NChGS, and, as the system is located on the flank of the active NChVC, it can be defined as a non-classic geothermal system associated with active volcanism in a zone of high relief. Moreover, our study strongly supports the hypothesis that the geothermal reservoir is located within fractured crystalline rocks of the Santa Gertrudis Bullileo granitoid and their associated hornfels. Our model proposes the boiling of meteoric waters within a deep reservoir in the presence of volatiles derived from a primary magmatic source, which furthered the development of acid-sulfate steam-heated waters overlying the up-flow zone. The steep topography and the presence of permeable channels (faults and fractures) allow the descent of these waters, which quench the boiling process and mix with the deeper reservoir fluids along the vertical segment delimited by a clay cap.
An indispensable factor for comprehending the architecture of the NChGS was the recognition and delimitation of a clay cap, which is a major element in the system considering its role in both sealing the system (in regards to temperature and pressure) and restricting the circulation of hydrothermal fluids. This highlights the usefulness of the study of clay mineralogy, as such minerals allow the relative characterization of fluid/rock ratios and permeability conditions in hydrothermal systems. Finally, the analysis of surface faults and fractures allows us to propose a conceptual model of fluid flow along fractures and the development of a geothermal system in an active volcanic edifice with a reservoir hosted within a basement containing fractured crystalline rocks (hornfels and granitoid).

Author Contributions

Conceptualization, D.M., R.G., S.M. and G.A.; methodology, D.M., R.G.; S.M., G.A., C.L.-C., V.M., C.C. and M.R.; investigation, D.M., R.G., S.M., G.A., C.L.-C., V.M., C.C. and M.R.; resources, D.M. and G.A.; writing—original draft preparation, D.M., G.A. and R.G.; writing—review and editing, D.M.; funding acquisition, D.M. and G.A. All authors have read and agreed to the published version of the manuscript.

Funding

This research was funded by the Chilean ANID-FONDECYT Project #1220729 and ANID-FONDAP projects 15090013 and ACE210005 “Centro de Excelencia en Geotermia de los Andes, CEGA”.

Data Availability Statement

Not applicable.

Acknowledgments

The microthermometry analytical work was supported by ANID-FONDEQUIP instrumentation grant EQM140009 (Universidad de Chile), and FE-SEM analyses were supported by the ANID-FONDEQUIP EQM150101 (Pontificia Universidad Católica de Chile) grant. We sincerely thank Guido Cappetti, Gianni Volpi and Germain Rivera from Geotérmica del Norte (GDN) for granting access to sample the Nevados de Chillán drill core, Nieblas-1, and for providing additional borehole data. This work benefited from a field trip and discussion with John Browning and David Healy. Revisions, comments, and suggestions by two anonymous reviewers and also constructive reviews by the academic editor helped improve the clarity of this manuscript.

Conflicts of Interest

The authors declare no conflict of interest.

References

  1. Henley, R.W.; Ellis, A.J. Geothermal systems ancient and modern: A geochemical review. Earth-Sci. Rev. 1983, 19, 1–50. [Google Scholar] [CrossRef]
  2. Stimac, J.; Goff, F.; Goff, C.J. Intrusion-Related Geothermal Systems. In The Encyclopedia of Volcanoes, 2nd ed.; Sigurdsson, H., Ed.; Elsevier: Amsterdam, The Netherlands, 2015; pp. 799–822. [Google Scholar] [CrossRef]
  3. Moore, J.N.; Powell, T.S.; Heizler, M.T.; Norman, D.I. Mineralization and Hydrothermal History of the Tiwi Geothermal System, Philippines. Econ. Geol. 2000, 95, 1001–1023. [Google Scholar] [CrossRef]
  4. Moore, J.N.; Allis, R.G.; Nemčok, M.; Powell, T.S.; Bruton, C.J.; Wannamaker, P.E.; Raharjo, I.B.; Norman, D.I. The evolution of volcano-hosted geothermal systems based on deep wells from Karaha-Telaga Bodas, Indonesia. Am. J. Sci. 2008, 308, 1–48. [Google Scholar] [CrossRef]
  5. Sanchez-Alfaro, P.; Reich, M.; Arancibia, G.; Pérez-Flores, P.; Cembrano, J.; Driesner, T.; Lizama, M.; Rowland, J.; Morata, D.; Heinrich, C.A.; et al. Physical, chemical and mineralogical evolution of the Tolhuaca geothermal system, southern Andes, Chile: Insights into the interplay between hydrothermal alteration and brittle deformation. J. Volcanol. Geotherm. Res. 2016, 324, 88–104. [Google Scholar] [CrossRef]
  6. Simpson, M.P.; Mauk, J.L. Hydrothermal Alteration and Veins at the Epithermal Au-Ag Deposits and Prospects of the Waitekauri Area, Hauraki Goldfield, New Zealand. Econ. Geol. 2011, 106, 945–973. [Google Scholar] [CrossRef]
  7. Browne, P.R.L. Hydrothermal Alteration in Active Geothermal Fields. Annu. Rev. Earth Planet. Sci. 1978, 6, 229–250. [Google Scholar] [CrossRef]
  8. Hedenquist, J.; Reyes, A.G.; Simmons, S.F.; Taguchi, S. The thermal and geochemical structure of geothermal and epithermal systems: A framework for interpreting fluid inclusion data. Eur. J. Miner. 1992, 4, 989–1016. [Google Scholar] [CrossRef]
  9. Moncada, D.; Mutchler, S.; Nieto, A.; Reynolds, T.; Rimstidt, J.; Bodnar, R. Mineral textures and fluid inclusion petrography of the epithermal Ag–Au deposits at Guanajuato, Mexico: Application to exploration. J. Geochem. Explor. 2012, 114, 20–35. [Google Scholar] [CrossRef]
  10. Simmons, S.F.; Christenson, B.W. Origins of calcite in a boiling geothermal system. Am. J. Sci. 1994, 294, 361–400. [Google Scholar] [CrossRef]
  11. Rye, R.O. A review of the stable-isotope geochemistry of sulfate minerals in selected igneous environments and related hydrothermal systems. Chem. Geol. 2005, 215, 5–36. [Google Scholar] [CrossRef]
  12. Giggenbach, W.F. Chemical Techniques in Geothermal Exploration. In Application of Geochemistry in Geothermal Reservoir Development; D’Amore, F., Ed.; UNITAR/UNDP Centre on Small Energy Resources: New York, NY, USA, 1991; pp. 119–144. [Google Scholar]
  13. Giggenbach, W.; Minissale, A.; Scandiffio, G. Isotopic and chemical assessment of geothermal potential of the Colli Albani area, Latium region, Italy. Appl. Geochem. 1988, 3, 475–486. [Google Scholar] [CrossRef]
  14. Corrado, S.; Aldega, L.; Celano, A.S.; De Benedetti, A.A.; Giordano, G. Cap rock efficiency and fluid circulation of natural hydrothermal systems by means of XRD on clay minerals (Sutri, Northern Latium, Italy). Geothermics 2014, 50, 180–188. [Google Scholar] [CrossRef]
  15. Maffucci, R.; Corrado, S.; Aldega, L.; Bigi, S.; Chiodi, A.; Di Paolo, L.; Giordano, G.; Invernizzi, C. Cap rock efficiency of geothermal systems in fold-and-thrust belts: Evidence from paleo-thermal and structural analyses in Rosario de La Frontera geothermal area (NW Argentina). J. Volcanol. Geotherm. Res. 2016, 328, 84–95. [Google Scholar] [CrossRef]
  16. Maza, S.; Collo, G.; Morata, D.; Lizana, C.; Camus, E.; Taussi, M.; Renzulli, A.; Mattioli, M.; Godoy, B.; Alvear, B.; et al. Clay mineral associations in the clay cap from the Cerro Pabellón blind geothermal system, Andean Cordillera, Northern Chile. Clay Miner. 2018, 53, 117–141. [Google Scholar] [CrossRef]
  17. Heap, M.J.; Gravley, D.M.; Kennedy, B.M.; Gilg, H.A.; Bertolett, E.; Barker, S.L. Quantifying the role of hydrothermal alteration in creating geothermal and epithermal mineral resources: The Ohakuri ignimbrite (Taupō Volcanic Zone, New Zealand). J. Volcanol. Geotherm. Res. 2020, 390, 106703. [Google Scholar] [CrossRef]
  18. Hauser, A. Catastro y caracterización de las fuentes de aguas minerales y termales de Chile. Serv. Nac. Geol. y Mineria 1997, 50, 89. [Google Scholar]
  19. Sánchez, P.; Pérez-Flores, P.; Arancibia, G.; Cembrano, J.; Reich, M. Crustal deformation effects on the chemical evolution of geothermal systems: The intra-arc Liquiñe–Ofqui fault system, Southern Andes. Int. Geol. Rev. 2013, 55, 1384–1400. [Google Scholar] [CrossRef]
  20. Aravena, D.; Muñoz, M.; Morata, D.; Lahsen, A.; Parada, M.; Dobson, P. Assessment of high enthalpy geothermal resources and promising areas of Chile. Geothermics 2016, 59, 1–13. [Google Scholar] [CrossRef]
  21. Tardani, D.; Reich, M.; Roulleau, E.; Takahata, N.; Sano, Y.; Pérez-Flores, P.; Sánchez-Alfaro, P.; Cembrano, J.; Arancibia, G. Exploring the structural controls on helium, nitrogen and carbon isotope signatures in hydrothermal fluids along an intra-arc fault system. Geochim. Et Cosmochim. Acta 2016, 184, 193–211. [Google Scholar] [CrossRef]
  22. Wrage, J.; Tardani, D.; Reich, M.; Daniele, L.; Arancibia, G.; Cembrano, J.; Sánchez-Alfaro, P.; Morata, D.; Pérez-Moreno, R. Geochemistry of thermal waters in the Southern Volcanic Zone, Chile-Implications for structural controls on geothermal fluid composition. Chem. Geol. 2017, 466, 545–561. [Google Scholar] [CrossRef]
  23. Morata, D.; Aravena, D.; Lahsen, A.; Muñoz, M.; Valdenegro, P. Chile up-date: The first South American Geothermal Power Plant After One Century of Exploration. In Proceedings of the World Geothermal Congress 2020, Reykjavik, Iceland, 26 April–2 May 2020. [Google Scholar]
  24. Morata, D.; Alarcón, P.; Aravena, D.; Bravo, B.; García, K.; Hurtado, N.; Muñoz, M.; Pérez-Estay, N.; Valdenegro, P.; Vargas, S. The slow progress of geothermal development and future perspectives. In Proceedings of the World Geothermal Congress 2023, Beijing, China, 9–11 October 2023. [Google Scholar]
  25. Lahsen, A. Características geoquímicas y origen de las aguas de las termas de Chillán. Comunicaciones. Geol. Dep. Univ. Chile 1978, 24, 35–47. [Google Scholar]
  26. Lahsen, A.; Sepúlveda, F.; Rojas, J.; Palacios, C. Present Status of Geothermal Exploration in Chile. In Proceedings of the World Geothermal Congress 2005, Antalya, Turkey, 24–29 April 2005. [Google Scholar]
  27. Morata, D.; Maza, S.; López-Contreras, C.; Mura, V.; Robidoux, P.; Gallardo, R.; Arancibia, G. Surface Hydrothermal Alteration In the Nevados de Chillán Geothermal System (Andean Cordillera, Central Chile): Insights for A Better Understanding Fluid-Flow-Fracture Process. In Proceedings of the World Geothermal Congress 2023, Beijing, China, 9–11 October 2023. [Google Scholar]
  28. Somoza, R. Updated azca (Farallon)—South America relative motions during the last 40 My: Implications for mountain building in the central Andean region. J. South Am. Earth Sci. 1998, 11, 211–215. [Google Scholar] [CrossRef]
  29. Somoza, R.; Ghidella, M.E. Convergencia en el margen occidental de América del sur durante el Cenozoico: Subducción de las placas de Nazca, Farallón y Aluk. Rev. la Asoc. Geol. Argentina 2005, 60, 797–809. [Google Scholar]
  30. Charrier, R.; Pinto, L.; Rodríguez, M.P. Tectonostratigraphic evolution of the Andean Orogen in Chile. In The Geology of Chile; Moreno, T., Gibbons, W., Eds.; The Geological Society: London, UK, 2007; pp. 21–114. [Google Scholar]
  31. Farías, M.; Comte, D.; Charrier, R.; Martinod, J.; David, C.; Tassara, A.; Tapia, F.; Fock, A. Crustal-scale structural architecture in central Chile based on seismicity and surface geology: Implications for Andean mountain building. Tectonics 2010, 29, TC3006. [Google Scholar] [CrossRef]
  32. Stanton-Yonge, A.; Griffith, W.A.; Cembrano, J.; Julien, R.S.; Iturrieta, P. Tectonic role of margin-parallel and margin-transverse faults during oblique subduction in the Southern Volcanic Zone of the Andes: Insights from Boundary Element Modeling. Tectonics 2016, 35, 1990–2013. [Google Scholar] [CrossRef]
  33. Giambiagi, L.; Ramos, V.A. Structural evolution of the Andes between 33°30′ and 33°45′ S, above the transition zone between the flat and normal subduction segment, Argentina and Chile. J. South Am. Earth Sci. 2002, 15, 99–114. [Google Scholar] [CrossRef]
  34. Cembrano, J.; Lara, L. The link between volcanism and tectonics in the southern volcanic zone of the Chilean Andes: A review. Tectonophysics 2009, 471, 96–113. [Google Scholar] [CrossRef]
  35. Sielfeld, G.; Ruz, J.; Brogi, A.; Cembrano, J.; Stanton-Yonge, A.; Pérez-Flores, P.; Iturrieta, P. Oblique-slip tectonics in an active volcanic chain: A case study from the Southern Andes. Tectonophysics 2019, 770, 228221. [Google Scholar] [CrossRef]
  36. Jordan, T.E.; Burns, W.M.; Veiga, R.; Pángaro, F.; Copeland, P.; Kelley, S.; Mpodozis, C. Extension and basin formation in the southern Andes caused by increased convergence rate: A mid-Cenozoic trigger for the Andes. Tectonics 2001, 20, 308–324. [Google Scholar] [CrossRef]
  37. Lange, D.; Cembrano, J.; Rietbrock, A.; Haberland, C.; Dahm, T.; Bataille, K. First seismic record for intra-arc strike-slip tectonics along the Liquiñe-Ofqui fault zone at the obliquely convergent plate margin of the southern Andes. Tectonophysics 2008, 455, 14–24. [Google Scholar] [CrossRef]
  38. Melnick, D.; Charlet, F.; Echtler, H.P.; De Batist, M. Incipient axial collapse of the Main Cordillera and strain partitioning gradient between the central and Patagonian Andes, Lago Laja, Chile. Tectonics 2006, 25, TC5004. [Google Scholar] [CrossRef]
  39. López Escobar, Á.; Cembrano, J.; Moreno, H. Geochemistry and tectonics of the Chilean Southern Andes basaltic Quaternary volcanism (37–46° S). Rev. Geológica Chile 1995, 22, 219–234. [Google Scholar]
  40. Lupi, M.; Trippanera, D.; Gonzalez, D.; D’amico, S.; Acocella, V.; Cabello, C.; Stef, M.M.; Tassara, A. Transient tectonic regimes imposed by megathrust earthquakes and the growth of NW-trending volcanic systems in the Southern Andes. Tectonophysics 2020, 774, 228204. [Google Scholar] [CrossRef]
  41. Farías, C.; Lupi, M.; Fuchs, F.; Miller, S.A. Seismic activity of the Nevados de Chillán volcanic complex after the 2010 Mw8.8 Maule, Chile, earthquake. J. Volcanol. Geotherm. Res. 2014, 283, 116–126. [Google Scholar] [CrossRef]
  42. Pérez-Flores, P.; Veloso, E.; Cembrano, J.; Sánchez-Alfaro, P.; Lizama, M.; Arancibia, G. Fracture network, fluid pathways and paleostress at the Tolhuaca geothermal field. J. Struct. Geol. 2017, 96, 134–148. [Google Scholar] [CrossRef]
  43. Pérez-Flores, P.; Wang, G.; Mitchell, T.; Meredith, P.; Nara, Y.; Sarkar, V.; Cembrano, J. The effect of offset on fracture permeability of rocks from the Southern Andes Volcanic Zone, Chile. J. Struct. Geol. 2017, 104, 142–158. [Google Scholar] [CrossRef]
  44. Muñoz, J.; Niemeyer, H. Hoja Laguna del Maule: Regiones del Maule y del Bío Bío, escala 1:250,000. Serv. Nac. De Geol. Y Min. Carta Geológica 1984, 64, 98. [Google Scholar]
  45. Naranjo, J.A.; Gilbert, J.; Sparks, R.S. Geología del complejo volcánico Nevados de Chillán, Región del Biobío. Cart. Geológica Chile Ser. Geol. Básica 2008, 114, 32. [Google Scholar]
  46. Stern, C.R. Active Andean volcanism: Its geologic and tectonic setting. Rev. Geológica de Chile 2004, 31, 161–206. [Google Scholar] [CrossRef]
  47. Oyarzún, A.; Lara, L.E.; Tassara, A. Decoding the plumbing system of Nevados de Chillán Volcanic complex, Southern Andes. J. Volcanol. Geotherm. Res. 2022, 422, 107455. [Google Scholar] [CrossRef]
  48. Dixon, H.J.; Murphy, M.D.; Sparks, S.J.; Chávez, R.; Naranjo, J.A.; Dunkley, P.N.; Young, S.R.; Gilbert, J.; Pringle, M.R. The geology of Nevados de Chillán volcano, Chile. Rev. Geológica Chile 1999, 26, 227–253. [Google Scholar] [CrossRef]
  49. Déruelle, B.; López-Escobar, L. Basaltes, andésites, dacites et rhyolites des strato-volcans des Nevados de Chillán et de l’Antuco (Andes méridionales): La remarquable illustration d’une différenciation par cristallisation fractionnée. Comptes Rendus L’académie Sci. Paris Sci. Terre Planètes 1999, 329, 337–344. [Google Scholar]
  50. Cardona, C.; Gil-Cruz, F.; Franco-Marín, L.; Martín, J.S.; Valderrama, O.; Lazo, J.; Cartes, C.; Morales, S.; Hernández, E.; Quijada, J.; et al. Volcanic activity accompanying the emplacement of dacitic lava domes and effusion of lava flows at Nevados de Chillán Volcanic Complex—Chilean Andes (2012 to 2020). J. Volcanol. Geotherm. Res. 2021, 420, 107409. [Google Scholar] [CrossRef]
  51. Déruelle, B.; Deruelle, J. Géologie des volcans quaternaires des Nevados de Chillán (Chili). Bull. Volcanol. 1974, 38, 425–444. [Google Scholar] [CrossRef]
  52. Orozco, G.; Jara, G.; Bertin, D. Peligros del Complejo Volcánico Nevados de Chillán, Región del Biobío. Cart. Geológica Chile Ser. Geol. Ambient. 2016, 28, 34. [Google Scholar]
  53. Radic, J.P. Las cuencas cenozoicas y su control en el volcanismo de los Complejos Nevados de Chillan y Copahue-Callaqui (Andes del Sur, 36–39° S). Andean Geol. 2010, 37, 220–246. [Google Scholar] [CrossRef]
  54. Ramos, V.A.; Barbieri, M. El volcanismo Cenozoico de Huantraico: Edad y relaciones isotópicas iniciales, provincia del Neuquén. Rev. Asoc. Geol. Argentina 1989, 43, 210–223. [Google Scholar]
  55. Ramos, V.A.; Folguera, A. Tectonic evolution of the Andes of Neuquén: Constraints derived from the magmatic arc and foreland deformation. Geol. Soc. London, Spéc. Publ. 2005, 252, 15–35. [Google Scholar] [CrossRef]
  56. Ramos, V.A.; Kay, S.M. Overview of the tectonic evolution of the southern Central Andes of Mendoza and Neuquén (35°–39° S latitude). In Evolution of an Andean Margin: A Tectonic and Magmatic View from the Andes to the Neuquén Basin (35°–39° S lat); Geological Society of America: Boulder, CO, USA, 2006; Volume 407, pp. 1–18. [Google Scholar] [CrossRef]
  57. Radic, J.P. Anisotropías de Basamento como control estructural del volcanismo en el Complejo Volcánico Chillán (Andes del Sur, 36° S). In Proceedings of the XI Congreso Geológico Chile, Antofagasta, Chile, 7–11 August 2006; pp. 295–298. [Google Scholar]
  58. Meulle-Stef, M. Modelo Estructural y Régimen de Paleo-Esfuerzos para el Complejo Volcánico Nevados de Chillán, Región del Bio Bio, Chile Memoria de Título; Departamento de Geología Universidad de Concepción: Concepción, Chile, 2017; p. 105. [Google Scholar]
  59. Graveleau, F.; Strak, V.; Dominguez, S.; Malavieille, J.; Chatton, M.; Manighetti, I.; Petit, C. Experimental modelling of tectonics– erosion–sedimentation interactions in compressional, extensional, and strike–slip settings. Geomorphology 2015, 244, 146–168. [Google Scholar] [CrossRef]
  60. Sepúlveda, F.; Lahsen, A. Geothermal exploration in central southern Chile (33°–42° S). Geotherm. Resour. Counc. Trans. 2003, 27, 635–638. [Google Scholar]
  61. Salgado, G.; Raasch, G. Chile: Prospects, market, and regulation in the geothermal industry. In Proceedings of the 24th New Zealand Geothermal Workshop; University of Auckland: Auckland, New Zealand, 2002; pp. 23–28. [Google Scholar]
  62. Moore, D.M.; Reynolds, R.C. X-ray Diffraction and the Identification and Analysis of Clay Minerals, 2nd ed.; Oxford University Press: New York, NY, USA, 1997. [Google Scholar]
  63. Beaufort, D.; Baronnet, A.; Lanson, B.; Meunier, A. Corrensite; a single phase or a mixed-layer phyllosilicate in saponite-to-chlorite conversion series? A case study of Sancerre-Couy deep drill hole (France). Am. Miner. 1997, 82, 109–124. [Google Scholar] [CrossRef]
  64. Bodnar, R. Introduction to Fluid Inclusions. In Fluid Inclusions: Analysis and Interpretation; Samson, I., Anderson, A., Marshall, D., Eds.; Mineral Association of Canada: Quebec, QC, Canada, 2003; p. 374. [Google Scholar]
  65. Goldstein, R.H. Petrographic Analysis of Fluid Inclusions. In Fluid Inclusions: Analysis and Interpretation; Samson, I., Anderson, A., Marshall, D., Eds.; Mineral Association of Canada: Quebec, QC, Canada, 2003; pp. 9–53. [Google Scholar]
  66. Bodnar, R. Revised equation and table for determining the freezing point depression of H2O-Nacl solutions. Geochim. et Cosmochim. Acta 1993, 57, 683–684. [Google Scholar] [CrossRef]
  67. Giggenbach, W.F.; Goguel, R.L. Collection and analysis of geothermal and volcanic water and gas samples. Dep. Sci. Ind. Res. Chem. Div. 1989, 2401, 81. [Google Scholar]
  68. Bethke, C.M.; Brian, F.; Yeakel, S. The Geochemist’s Workbench, GWB Essentials Guide, 12th ed.; University of Illinois: Champaign-Urbana, IL, USA, 2019. [Google Scholar]
  69. Gifkins, C.; Herrmann, W.; Large, R. Altered volcanic rocks. In A Guide to Description and Interpretation; Centre for Ore Deposit Research, University of Tasmania: Tasmania, Australia, 2005. [Google Scholar]
  70. Giorgetti, G.; Mata, M.P.; Peacor, D.R. Evolution of mineral assemblages and textures from sediment through hornfels in the Salton Sea Geothermal Field: Direct crystallization of phyllosilicates in a hydrothermal-metamorphic system. Clay Miner. 2003, 38, 113–126. [Google Scholar] [CrossRef]
  71. Yau, Y.C.; Peacor, D.R.; Beane, R.E.; Essene, E.J.; McDowell, S.D. Microstructures, Formation Mechanisms, and Depth-Zoning of Phyllosilicates in Geothermally Altered Shales, Salton Sea, California1. Clays Clay Miner. 1988, 36, 1–10. [Google Scholar] [CrossRef]
  72. Yoneda, T.; Watanabe, T.; Sato, T. Mineralogical aspects of interstratified chlorite-smectite associated with epithermal ore veins: A case study of the Todoroki Au-Ag ore deposit, Japan. Clay Miner. 2016, 51, 653–674. [Google Scholar] [CrossRef]
  73. Bauluz, B.; Peacor, D.R.; Ylagan, R.F. Transmission Electron Microscopy Study of Smectite Illitization During Hydrothermal Alteration of a Rhyolitic Hyaloclastite from Ponza, Italy. Clays Clay Miner. 2002, 50, 157–173. [Google Scholar] [CrossRef]
  74. Giorgetti, G.; Mata, M.; Peacor, D.R. TEM study of the mechanism of transformation of detrital kaolinite and muscovite to illite/smectite in sediments of the Salton Sea Geothermal Field. Eur. J. Miner. 2000, 12, 923–934. [Google Scholar] [CrossRef]
  75. Pollastro, R.M. Mineralogical and Morphological Evidence for the Formation of Illite at the Expense of Illite/Smectite. Clays Clay Miner. 1985, 33, 265–274. [Google Scholar] [CrossRef]
  76. Vazquez, M.; Bauluz, B.; Nieto, F.; Morata, D. Illitization sequence controlled by temperature in volcanic geothermal systems: The Tinguiririca geothermal field, Andean Cordillera, Central Chile. Appl. Clay Sci. 2016, 134, 221–234. [Google Scholar] [CrossRef]
  77. Nordstrom, D.K.; McCleskey, R.B.; Ball, J.W. Challenges in the Analysis and Interpretation of Acidic Waters. In International Mine Water Association; Wolkersdorfer, C., Freund, A., Eds.; Cape Breton University Press: Sydney, NS, Canada, 2010; pp. 379–383. [Google Scholar]
  78. Berger, B.R.; Bethke, P.M.; Henley, R.W.; Brown, K.L.; Fournier, R.O.; Bodnar, R.J.; Reynolds, T.J.; Kuehn, C.A.; Field, C.W.; Fifarek, R.H.; et al. Fluid-Inclusion Systematics in Epithermal Systems. In Geology and Geochemistry of Epithermal Systems; Berger, B.R., Bethke, P.M., Eds.; Society of Economic Geologists: Littleton, CO, USA, 1985; pp. 73–97. [Google Scholar] [CrossRef]
  79. Goldstein, R.H.; Reynolds, T.J. Systematics of Fluid Inclusions in Diagenetic Minerals. In Society for Sedimentary Geology, 31st ed.; SEPM Society for Sedimentary Geology: Tulsa, OK, USA, 1994. [Google Scholar] [CrossRef]
  80. Hedenquist, J.; Henley, R.W. The importance of CO2 on freezing point measurements of fluid inclusions; evidence from active geothermal systems and implications for epithermal ore deposition. Econ. Geol. 1985, 80, 1379–1406. [Google Scholar] [CrossRef]
  81. Vanko, D.A.; Bach, W. Heating and freezing experiments on aqueous fluid inclusions in anhydrite: Recognition and effects of stretching and the low-temperature formation of gypsum. Chem. Geol. 2005, 223, 35–45. [Google Scholar] [CrossRef]
  82. Haas, J.L. The effect of salinity on the maximum thermal gradient of a hydrothermal system at hydrostatic pressure. Econ. Geol. 1971, 66, 940–946. [Google Scholar] [CrossRef]
  83. Dong, G.; Morrison, G.; Jaireth, S. Quartz textures in epithermal veins, Queensland; classification, origin and implication. Econ. Geol. 1995, 90, 1841–1856. [Google Scholar] [CrossRef]
  84. Fournier, R. The Behavior of Silica in Hydrothermal Solutions. In Geology and Geochemistry of Epithermal Systems; Berger, B.R., Bethke, P.M., Eds.; Society of Economic Geologists: Littleton, CO, USA, 1985; pp. 45–61. [Google Scholar] [CrossRef]
  85. Shimizu, T. Reinterpretation of Quartz Textures in Terms of Hydrothermal Fluid Evolution at the Koryu Au-Ag Deposit, Japan. Econ. Geol. 2014, 109, 2051–2065. [Google Scholar] [CrossRef]
  86. Marks, N.; Schiffman, P.; Zierenberg, R.A.; Franzson, H.; Fridleifsson, G. Hydrothermal alteration in the Reykjanes geothermal system: Insights from Iceland deep drilling program well RN-17. J. Volcanol. Geotherm. Res. 2010, 189, 172–190. [Google Scholar] [CrossRef]
  87. Moore, J.N.; Allis, R.; Renner, J.L.; Mildenhall, D.; McCulloch, J. Petrologic Evidence for Boiling To Dryness in the Karaha-Telaga Bodas Geothermal System, Indonesia. In Proceedings of the 27th Workshop on Geothermal Reservoir Engineering, Stanford University, Stanford, CA, USA, 28–30 January 2002; pp. 98–108. [Google Scholar]
  88. Ruggieri, G.; Gianelli, G. Multi-stage fluid circulation in a hydraulic fracture breccia of the Larderello geothermal field (Italy). J. Volcanol. Geotherm. Res. 1999, 90, 241–261. [Google Scholar] [CrossRef]
  89. Hemley, J.J.; Montoya, J.W.; Marinenko, J.W.; Luce, R.W. Equilibria in the system Al2O3-SiO2-H2O and some general implications for alteration/mineralization processes. Econ. Geol. 1980, 75, 210–228. [Google Scholar] [CrossRef]
  90. Rye, R.O.; Bethke, P.M.; Wasserman, M.D. The stable isotope geochemistry of acid sulfate alteration. Econ. Geol. 1992, 87, 225–262. [Google Scholar] [CrossRef]
  91. Giggenbach, W.F. Mass transfer in hydrothermal alteration systems—A conceptual approach. Geochim. Et Cosmochim. Acta 1984, 48, 2693–2711. [Google Scholar] [CrossRef]
  92. Reyes, A.G. Petrology of Philippine geothermal systems and the application of alteration mineralogy to their assessment. J. Volcanol. Geotherm. Res. 1990, 43, 279–309. [Google Scholar] [CrossRef]
  93. Simmons, S.F.; Browne, P.R.L. Hydrothermal Minerals and Precious Metals in the Broadlands-Ohaaki Geothermal System: Implications for Understanding Low-Sulfidation Epithermal Environments. Econ. Geol. 2000, 95, 971–999. [Google Scholar] [CrossRef]
  94. Kübler, B.; Goy-Eggenberger, D. La cristallinité de l’illite revisitée: Un bilan des connaissances acquises ces trente dernières années. Clay Miner. 2001, 36, 143–157. [Google Scholar] [CrossRef]
  95. Bird, D.K.; Schiffman, P.; Elders, W.A.; Williams, A.E.; McDowell, S.D. Calc-silicate mineralization in active geothermal systems. Econ. Geol. 1984, 79, 671–695. [Google Scholar] [CrossRef]
  96. Reyes, A.G.; Giggenbach, W.F.; Saleras, J.R.; Salonga, N.D.; Vergara, M.C. Petrology and geochemistry of alto peak, a vapor-cored hydrothermal system, Leyte province, Philippines. Geothermics 1993, 22, 479–519. [Google Scholar] [CrossRef]
  97. Akaku, K. Geochemical study on mineral precipitation from geothermal waters at the fushime field, Kyushu, Japan. Geothermics 1990, 19, 455–467. [Google Scholar] [CrossRef]
  98. Blounot, C.; Dickson, F. The solubility of anhydrite (CaSO4) in NaCl-H2O from 100 to 450 °C and 1 to 1000 bars. Geochim. et Cosmochim. Acta 1969, 33, 227–245. [Google Scholar] [CrossRef]
  99. Ellis, A.J. The solubility of calcite in carbon dioxide solutions. Am. J. Sci. 1959, 257, 354–365. [Google Scholar] [CrossRef]
  100. Gherardi, F.; Panichi, C.; Yock, A.; Gerardo-Abaya, J. Geochemistry of the surface and deep fluids of the Miravalles volcano geothermal system (Costa Rica). Geothermics 2002, 31, 91–128. [Google Scholar] [CrossRef]
  101. Caracausi, A.; Ditta, M.; Italiano, F.; Longo, M.; Nuccio, P.; Paonita, A.; Rizzo, A. Changes in fluid geochemistry and physico-chemical conditions of geothermal systems caused by magmatic input: The recent abrupt outgassing off the island of Panarea (Aeolian Islands, Italy). Geochim. et Cosmochim. Acta 2005, 69, 3045–3059. [Google Scholar] [CrossRef]
  102. Inoue, A. Formation of Clay Minerals in Hydrothermal Environments. In Origin and Mineralogy of Clays; Velde, B., Ed.; Springer: New York, NY, USA, 1995. [Google Scholar] [CrossRef]
  103. Meunier, A. Hydrothermal process-Thermal metamorphism. In Clays; Meunier, A., Ed.; Springer: New York, NY, USA, 2005; pp. 379–410. [Google Scholar]
  104. Inoue, A.; Utada, M. Smectite-to-chlorite transformation in thermally metamorphosed volcanoclastic rocks in the Kamikita area, northern Honshu, Japan. Am. Mineral. 1991, 76, 628–640. [Google Scholar]
  105. Inoue, A.; Utada, M.; Wakita, K. Smectite-to-illite conversion in natural hydrothermal systems. Appl. Clay Sci. 1992, 7, 131–145. [Google Scholar] [CrossRef]
  106. Mas, A.; Guisseau, D.; Mas, P.P.; Beaufort, D.; Genter, A.; Sanjuan, B.; Girard, J. Clay minerals related to the hydrothermal activity of the Bouillante geothermal field (Guadeloupe). J. Volcanol. Geotherm. Res. 2006, 158, 380–400. [Google Scholar] [CrossRef]
  107. Kristmannsdottir, H. Alteration of Basaltic Rocks by Hydrothermal-Activity at 100–300 °C. In Developments in Sedimentology; Mortland, M., Farmer, V., Eds.; Elsevier: Amsterdam, The Netherlands, 1979; pp. 359–367. [Google Scholar] [CrossRef]
  108. Robinson, D.; De Zamora, A.S. The smectite to chlorite transition in the Chipilapa geothermal system, El Salvador. Am. Miner. 1999, 84, 607–619. [Google Scholar] [CrossRef]
  109. Schiffman, P.; Fridleifsson, G.O. The smectite?chlorite transition in drillhole NJ-15, Nesjavellir geothermal field, Iceland: XRD, BSE and electron microprobe investigations. J. Metamorph. Geol. 1991, 9, 679–696. [Google Scholar] [CrossRef]
  110. Robinson, D.; Schmidt, S.T.; De Zamora, A.S. Reaction pathways and reaction progress for the smectite-to-chlorite transformation: Evidence from hydrothermally altered metabasites. J. Metamorph. Geol. 2002, 20, 167–174. [Google Scholar] [CrossRef]
  111. Schmidt, S.T.; Robinson, D. Metamorphic grade and porosity and permeability controls on mafic phyllosilicate distributions in a regional zeolite to greenschist facies transition of the North Shore Volcanic Group, Minnesota. Bull. Geol. Soc. Am. 1997, 109, 683–697. [Google Scholar] [CrossRef]
  112. Kristmannsdóttir, H. Alteration in the IRDP drill hole compared with other drill holes in Iceland. J. Geophys. Res. Solid Earth 1982, 87, 6525–6531. [Google Scholar] [CrossRef]
  113. LaVerne, C.; Vanko, D.; Tartarotti, P.; Alt, J. Chemistry and Geothermometry of Secondary Minerals from the Deep Sheeted Dike Complex, Hole 504B. Proc. Ocean. Drill. Program Sci. Results 1995, 137, 167–189. [Google Scholar] [CrossRef]
  114. Shau, Y.-H.; Peacor, D.R. Phyllosilicates in hydrothermally altered basalts from DSDP Hole 504B, Leg 83? A TEM and AEM study. Contrib. Miner. Pet. 1992, 112, 119–133. [Google Scholar] [CrossRef]
  115. Schiffman, P. Low grade metamorphism of mafic rocks. Rev. Geophys. 1995, 33, 81–86. [Google Scholar] [CrossRef]
  116. Altaner, S.P.; Ylagan, R.F. Comparison of structural models of mixed-layer illite/smectite and reaction mechanisms of smectite illitization. Clays Clay Miner. 1997, 45, 517–533. [Google Scholar] [CrossRef]
  117. Beaufort, D.; Patrier, P.; Meunier, A.; Ottaviani, M.M. Chemical variations in assemblages including epidote and/or chlorite in the fossil hydrothermal system of Saint Martin (Lesser Antilles). J. Volcanol. Geotherm. Res. 1992, 51, 95–114. [Google Scholar] [CrossRef]
  118. Essene, E.J. Clay Mineral Thermometry—A Critical Perspective1. Clays Clay Miner. 1995, 43, 540–553. [Google Scholar] [CrossRef]
  119. Ylagan, R.F.; Altaner, S.P.; Pozzuoli, A. Reaction mechanisms of smectite illitization associated with hydrothermal alteration from Ponza Island, Italy. Clays Clay Miner. 2000, 48, 610–631. [Google Scholar] [CrossRef]
  120. Inoue, A.; Meunier, A.; Beaufort, D. Illite-smectite Mixed-layer Minerals in Felsic Volcaniclastic Rocks from Drill Cores, Kakkonda, Japan. Clays Clay Miner. 2004, 52, 66–84. [Google Scholar] [CrossRef]
  121. Vázquez, M.; Nieto, F.; Morata, D.; Droguett, B.; Carrillo-Rosua, F.; Morales, S. Evolution of clay mineral assemblages in the Tinguiririca geothermal field, Andean Cordillera of central Chile: An XRD and HRTEM-AEM study. J. Volcanol. Geotherm. Res. 2014, 282, 43–59. [Google Scholar] [CrossRef]
  122. Whitney, G. Role of Water in the Smectite-to-Illite Reaction. Clays Clay Miner. 1990, 38, 343–350. [Google Scholar] [CrossRef]
  123. Inoue, A.; Utada, M. Further Investigations of a Conversion Series of Dioctahedral Mica/Smectites in the Shinzan Hydrothermal Alteration Area, Northeast Japan. Clays Clay Miner. 1983, 31, 401–412. [Google Scholar] [CrossRef]
  124. Minissale, A.; Magro, G.; Vaselli, O.; Verrucchi, C.; Perticone, I. Geochemistry of water and gas discharges from the Mt. Amiata silicic complex and surrounding areas (central Italy). J. Volcanol. Geotherm. Res. 1997, 79, 223–251. [Google Scholar] [CrossRef]
  125. Pope, J.; Brown, K. Geochemistry of discharge at Waiotapu geothermal area, New Zealand—Trace elements and temporal changes. Geothermics 2014, 51, 253–269. [Google Scholar] [CrossRef]
  126. Kerkhof, A.M.V.D.; Hein, U.F. Fluid inclusion petrography. Lithos 2001, 55, 27–47. [Google Scholar] [CrossRef]
  127. Cruz-Pérez, M.A.; Canet, C.; Franco, S.I.; Camprubí, A.; González-Partida, E.; Rajabi, A. Boiling and depth calculations in active and fossil hydrothermal systems: A comparative approach based on fluid inclusion case studies from Mexico. Ore Geol. Rev. 2016, 72, 603–611. [Google Scholar] [CrossRef]
  128. Drummond, S.E.; Ohmoto, H. Chemical evolution and mineral deposition in boiling hydrothermal systems. Econ. Geol. 1985, 80, 126–147. [Google Scholar] [CrossRef]
  129. Schmidt, K.; Garbe-Schönberg, D.; Hannington, M.D.; Anderson, M.O.; Bühring, B.; Haase, K.; Haruel, C.; Lupton, J.; Koschinsky, A. Boiling vapour-type fluids from the Nifonea vent field (New Hebrides Back-Arc, Vanuatu, SW Pacific): Geochemistry of an early-stage, post-eruptive hydrothermal system. Geochim. Et Cosmochim. Acta 2017, 207, 185–209. [Google Scholar] [CrossRef]
  130. Hedenquist, J.W. The thermal and geochemical structure of the broadlands-ohaaki geothermal system, New Zealand. Geothermics 1990, 19, 151–185. [Google Scholar] [CrossRef]
  131. Milicich, S.; Chambefort, I.; Wilson, C.; Charlier, B.; Tepley, F. The hydrothermal evolution of the Kawerau geothermal system, New Zealand. J. Volcanol. Geotherm. Res. 2018, 353, 114–131. [Google Scholar] [CrossRef]
Figure 2. Main lineaments identified and inferred in the NChGS, based on our work in progress and previous studies [40,57,58]. SL: Shangri-La Valley; LT: Las Trancas Valley; HV: Hermoso Valley; OM: Las Termas-Olla de Mote. Also shown are the locations of surface hydrothermal manifestations in the Las Termas subcomplex, and the Nieblas-1 exploration well. The red rectangle shows the area considered for the conceptual model.
Minerals 13 00722 g002
Figure 3. Surface thermal manifestations in the Las Termas-Olla de Mote sector of the NChGS (see location OM in Figure 2, the area with the highest temperature surface thermal manifestations of this geothermal system). (A) Fumarolic discharges, with temperatures reaching ~85–95 °C. (B) Fumaroles and thermal springs are accompanied by intense acid-sulfate hydrothermal alteration. (C) Acid-sulfate thermal spring. (D) Sulfur precipitation in fumarolic vents. (E) Hydrothermal alteration surrounding thermal springs, with clay, silica, and sulfur precipitation.
Minerals 13 00722 g003
Figure 4. Simplified lithological column of the Nieblas-1 drill core, location of the studied samples (red rectangle), and spatial distribution of hydrothermal minerals, as documented by optical petrography, X-ray Diffraction (XRD), and Scanning Electron Microscopy (SEM) analysis. Mineralogy between two continuously analyzed samples was extrapolated in the hydrothermal mineral profiles. The hatched areas represent two highly fractured zones. Borehole temperature profiles for the 274 m deep Nevados de Chillán-1 exploratory well (blue lines) were measured by the French Geothermal Company (CFG) and reported in an internal report of the Chilean National Geothermal Company (ENG). The temperature borehole profile for the 1000.85 m deep exploratory Nieblas-1 exploration well (red line) was measured by ENG (ENG, internal report). m.b.s: meters below the surface.
Minerals 13 00722 g004
Figure 5. The paragenetic sequence of hydrothermal minerals in the NChGS, consisting of four alteration stages. Dashed lines illustrate the estimated timing of mineral formation, with some uncertainty due to the lack of cross-cutting and/or overprinting relationships.
Minerals 13 00722 g005
Figure 6. Polarized light images of representative vein assemblages corresponding to four stages of mineral paragenesis. (A) A Stage-2 bladed calcite-pyrite vein crosscutting a Stage-1 microcrystalline quartz-chalcedony-chlorite/smectite vein (sample NB 193.75). (B) A Stage-2 vein, illustrating the complex relationships between secondary minerals during this stage, later overgrown by Stage-3 wairakite (sample NB 406.85). (C) A Stage-3 vein with rhombic calcite encapsulated by anhydrite and wairakite selvage (sample NB 906.35). (D) A Stage-4 vein with laumontite selvages and remaining void spaces with precipitation of fine-grained epidote-quartz-magnetite << pyrite (sample NB 719.00). (E) Highly altered angular clasts of hydrothermal breccia, cemented by Stage-4 laumontite (sample NB 906.35). (F) Cross-polarized image of the photomicrograph in (E) depicting laumontite as breccia cement. Anh = anhydrite, Calc = calcite, Calc BLD = bladed calcite, Chal = chalcedony, C/S = chlorite/smectite, Ep = epidote, Lau = laumontite, Mgt = magnetite, Prh = prehnite, Py = pyrite, Qtz = quartz, Wai = wairakite. The reference numbers of the various samples indicate their depths (e.g., NB 906.35 means the sample was obtained at a depth of 906.35 m in the borehole).
Minerals 13 00722 g006
Figure 7. Representative XRD patterns of clay minerals under air-dried (red line), ethylene-glycol solvated (blue line), and heated (green line) conditions. (A) Argillic alteration zone, sample NB 60.00. (B) Sub-propylitic alteration zone, sample NB 440.40. (C) Propylitic alteration zone, sample NB 719.00. Chl/Smc = chlorite/smectite, Chl = chlorite, Co = corrensite, I/S-R3 = illite/smectite with R = 3 ordering.
Minerals 13 00722 g007
Figure 8. Backscattered electron (BSE) SEM images depicting the distribution and textural features of clay minerals in the NChGS. (A) Quartz-rimmed amygdule infilled with chlorite and later rhombic calcite. Sample NB 276.05. (B) Detail of sample NB 276.05, showing clusters of chlorite crystals without preferred orientation. (C) Slightly curled, flake-like chlorite/smectite particles infilling quartz-rimmed amygdule. Sample NB 476.48. (D) Curved, lens-shaped illite/smectite mixed-layered minerals with no preferred orientation in quartz vein. Sample NB 276.05. (E) Plagioclase phenocryst with sulfide and illite precipitation in voids. Sample NB 935.35. (F) Detail of sample NB 935.35, depicting filamentous texture of unoriented illite crystals growing in plagioclase voids. I/S = illite/smectite, Ilt = illite, Plg = plagioclase.
Minerals 13 00722 g008
Figure 9. Variation of Illite percentage in mixed-layered I/S minerals as a function of the measured temperature and depth in the Nieblas-1 well. Sample NB 193.75, containing 55% illite, was excluded from the construction of the sigmoidal trend as it corresponds to an interstratified zone of I/S directly precipitating within veins. Dots with tie-lines indicate samples containing interstratified I/S minerals with different illite percentages.
Minerals 13 00722 g009
Figure 10. Types of fluid inclusion assemblages (FIAs) observed in the NChGS for Stage 2 (AC) and Stage 3 (DF) paragenesis. (A) Triangular primary inclusions in Stage-2 bladed calcite. Sample NB 193.75. (B) Irregular primary inclusions in Stage-2 rhombic calcite. Sample NB 227.40. (C) Irregular secondary inclusions in Stage-2 rhombic calcite. Sample NB 227.40. (D) Squared primary inclusions in Stage-3 anhydrite. Sample NB 961.00. (E) Blocky pseudosecondary inclusions in Stage-3 anhydrite. Sample NB 947.60. (F) Rectangular secondary inclusions in Stage-3 anhydrite. Sample NB 961.00.
Minerals 13 00722 g010
Figure 13. Activity diagrams of calcium and potassium aluminosilicate minerals were calculated using The Geochemist’s Workbench software and the thermodynamic data provided in the thermo.tdat database [68]. (A) Mineral stability at quartz saturation in the CaO-Al2O3-K2O-H2O system, as a function of log(aK+/aH+) vs. log(aCa2+/a2H+). Black and gray lines depict mineral stabilities at 250 and 300 °C, respectively. Dotted red lines depict calcite saturation at 0.01 mCO2 and 0.1 mCO2, following calculations in [89]. The two horizontal areas show the conditions under which calcite precipitation precedes the formation of aluminosilicates. The composition of the plotted thermal waters is presented in Table 1, with water of pH < 3.1 outlined by the shaded area. (B) Mineral stability at quartz saturation in the system CaO-Al2O3-SiO2-H2O, as a function of log(aCa2+/a2H+) vs. temperature. The dotted red lines show the composition of the thermal waters presented in Table 1. Arrows A and B depict the general transition trends from STG 2 to STG 3 and from STG 3 to STG 4, respectively.
Minerals 13 00722 g013
Figure 14. Conceptual model of the Nevados de Chillán Geothermal System (NChGS). See details in the text.
Minerals 13 00722 g014
Table 1. Chemical composition of thermal springs from the Nevados de Chillán Geothermal System (NChGS). Water classification following [12,67]. Numbers in parentheses under major elements are the detection limits (ppm). b.d.l.: below the detection limit.
SamplesT (°C)pHMajor Elements (ppm)Balance (%)Water Classification
Cl
(0.01)
SO42−
(0.01)
HCO3
(0.01)
Na+
(0.005)
K+
(0.001)
Ca2+
(0.005)
Mg2+
(0.0002)
SiO2
(0.01)
Major AnionsCl-SO42−-HCO3 Ternary Diagram
NCh-0389.43.70.5333.6b.d.l.88.913.2121.954.118042.6acid-sulfatesteam-heated
NCh-0488.35.90.6374.8b.d.l.39.68.168.529.5184–0.3acid-sulfatesteam-heated
RV δ68.03.90.3552.018.056.021.5105.433.1370–1.3acid-sulfatesteam-heated
CR δ82.02.616.6293.8b.d.l.20.04.410.06.2178–1.8acid-sulfatesteam-heated
OM δ91.02.411.8881.8-58.126.681.352.0290–13.5acid-sulfatesteam-heated
Ch.1 §92.02.43.0206.0058.019.0140.065.033978.3acid-sulfatesteam-heated
Ch.2 §85.02.91.3335.0040.08.329.06.3201–3.0acid-sulfatesteam-heated
Ch.3 §88.05.91.5450.0055.016.086.028.0215–0.1acid-sulfatesteam-heated
Ch.4 §89.03.11.1373.0031.08.468.018.01306.1acid-sulfatesteam-heated
δ [22]; § [25].
Table 2. Microthermometric measurements of fluid inclusion assemblages (FIAs) from stages 2 and 3 of the 4 stages of mineral paragenesis. Th: fluid inclusion homogenization temperature. Tm: Fluid inclusion final ice melting temperature. Anh: anhydrite; CalcBLD: bladed calcite; CalcRBC: rhombic calcite; Qtz: quartz.
SampleFIA IDN Host
Crystal
StageTh (°C)Tm (°C)Salinity/wt.% NaCl eq.Comments
RangeAverageRangeAverage
NB 160.00C2.A5CalcRBCSTG 2231.8 to 241.6235.4–1.5 to –1.3–1.42.5Crystal core
C2.B-28CalcRBCSTG 2232.9 to 246.9236.9–1.05–1.051.8Crystal rim
C2.B-13CalcRBCSTG 2227.1 to 246.6239–1.05–1.051.8Crystal rim
2AD6CalcRBCSTG 2229.9 to 241.4234.4–0.56–0.560.9
C33CalcRBCSTG 2236.5 to 241.2239.5–0.47–0.470.8
C43CalcRBCSTG 2243.7 to 245.1244.4–1.1–1.11.9
C57CalcRBCSTG 2228.5 to 240.4233.1–1.3–1.32.3
NB 193.75C45CalcBLDSTG 2138.5 to 143.2140.3-0.09-0.090.1
NB 227.40C72CalcRBCSTG 2193.0 to 193.2193.1–1.3–1.32.3
C8.E-12CalcRBCSTG 2182.6 to 186.7184.6–1.2 to –1.1–1.11.9
C203CalcRBCSTG 2197.8 to 199.2198.6–1.8–1.83.1Crystal core
C20.E15CalcRBCSTG 2173.8 to 178.0175.5–2.2 to –1.8–1.83.1Crystal rim
C28.I4CalcRBCSTG 2179.9 to 194.0186.9–1.5 to –1.4–1.52.6
C28.II6CalcRBCSTG 2131.7 to 195.4175.7–1.6–1.62.8Th not valid
NB 348.20C38QtzSTG 2232. to 251.5243.1–0.8 to –0.7–0.81.4
NB 440.45C3.I3CalcRBCSTG 3159.8159.8–1.1–1.12
C3.III3CalcRBCSTG 3157.3 to 161.9160.2–1.0 to –0.9–11.7
C3.E-13CalcRBCSTG 3151.4 to 160.7155.3–1.0 to –0.9–11.7
C3.E-25CalcRBCSTG 3150.1 to 160.1156.1–0.8–0.81.5
C3.E-33CalcRBCSTG 3159.5 to 160.0160–0.9–0.91.6
NB 456.60C15CalcRBCSTG 2253.5 to 254.5254–1.2 to –1.1–1.11.9
NB 947.60C25AnhSTG 3176.8 to 202.7193.8–0.9–0.91.5
C35AnhSTG 3198.3 to 204.1200.6–0.1–0.10.2
C7.54AnhSTG 3205.7 to 209.2207.7–0.9–0.91.5
C9-UP7AnhSTG 3196.0 to 218.0208.1–0.4 to –0.1–0.20.3
C9-DP8AnhSTG 3207.2 to 211.1209.9–0.2–0.20.4
C108AnhSTG 3203.2 to 207.6205.1–1.2 to –1.0–11.8
NB 961.00C37AnhSTG 3211.9 to 217.6215.3–2.5–2.54.2
C46AnhSTG 3206.8 to 224.2214.4–2.3–2.33.8
C5.A3AnhSTG 3197.8 to 212.4205.3–1.4–1.42.4
C5.B5AnhSTG 3201.5 to 208.2205.3–1.7–1.72.9
C66AnhSTG 3201.8 to 215.1210.2–1.6 to –1.5–1.52.5
C6.C3AnhSTG 3204.9 to 208.9206.6–1.2 to –1.1–1.11.9
C84AnhSTG 3225.5 to 230.5228.2–3.9–3.96.4
C103AnhSTG 3201.3 to 207.9204.7–1.2 to –0.9–1.11.9
C7-L3AnhSTG 3207.0 to 208.3208.2–1.2 to –1.1–1.22.1Secondary
C7-B6AnhSTG 3239.0 to 239.2239.1–1.2 to –1.1–1.22.1Pseudo sec
Disclaimer/Publisher’s Note: The statements, opinions and data contained in all publications are solely those of the individual author(s) and contributor(s) and not of MDPI and/or the editor(s). MDPI and/or the editor(s) disclaim responsibility for any injury to people or property resulting from any ideas, methods, instructions or products referred to in the content.

