
Rapid Analysis of Muscovites on a Lithium Pegmatite Prospect by Handheld LIBS
by
 , ,
, ,
Russell S. Harmon
1,*,
Michael A. Wise
2,
Adam C. Curry
1,
Joshua S. Mistele
1,
Michael S. Mason
3 and
Zach Grimac
3 
1
Department of Marine, Earth, & Atmospheric Sciences, North Carolina State University, Raleigh, NC 27695, USA
2
Department of Mineral Sciences, National Museum of Natural History, Smithsonian Institution, Washington, DC 20560, USA
3
Piedmont Lithium, Inc., 5706 Dallas Cherryville Highway, Bessemer City, NC 28016, USA
*
Author to whom correspondence should be addressed.
Minerals 2023, 13(5), 697; https://doi.org/10.3390/min13050697
Submission received: 26 April 2023
/
Revised: 15 May 2023
/
Accepted: 16 May 2023
/
Published: 19 May 2023
(This article belongs to the Special Issue Novel Methods and Applications for Mineral Exploration, Volume II)
Abstract
:Laser-induced breakdown spectroscopy (LIBS) is a technology for compositional analysis that is particularly effective for light elements, particularly Li, which is a critical commodity for emerging green technologies. This study undertook analysis by handheld LIBS of muscovite from the drill core, outcrop, and soil on the Carolina Lithium Prospect (CLP) in Gaston County, North Carolina (USA), which lies within the Carolina Tin-Spodumene Belt (CTSB). Abundances of the alkali elements Li, K, and Rb were determined for more than 130 muscovites from the Li-rich pegmatites to track the degree of pegmatite fractionation as a pathfinder for spodumene mineralization. Across the CTSB and including the CLP, muscovite Li contents vary over an order of magnitude, ranging from 0.04 to 0.74 wt. %, with their K/Rb ratios varying between 63 and 8, features that together document the highly evolved character of pegmatites within the CTSB district. On average, muscovite Li contents are greater in spodumene-bearing pegmatites at 0.21 ± 0.12 wt. % than for common quartz-feldspar pegmatites at 0.14 ± 0.08 wt. %. Although overlapping substantially in the middle portions of their distributions, muscovite K/Rb ratios are biased toward low values for spodumene-bearing pegmatites = 21 ± 6) compared to those for quartz-feldspar pegmatites = 33 ± 9). This study provides a framework for the use of LIBS analysis of muscovite in outcrop, drill core, and soil samples as an analytical tool for in-field and on-site geochemical analysis during Li pegmatite exploration and prospect evaluation.
1. Introduction
Lithium (Li) is a strategic metal with a wide variety of industrial uses that include batteries, electronic devices, ceramics and glass, lubricating greases, polymer production, continuous casting, and air treatment. Recently, the demand for Li for batteries has grown at a rapid pace because rechargeable lithium batteries are used extensively in portable electronic devices, electric tools, electric vehicles, and energy grid storage applications. As discussed by Kesler et al. [1] and Bowell et al. [2], continental brines from salar and geothermal fields are the primary Li resource being exploited at present, but volcanic-sedimentary clays and granite-related pegmatites are other important sources. Presently pegmatite mining operations in Australia, a tailings reclamation operation in Brazil, and both pegmatite and brine extraction operations in Argentina and Chile, and China account for more than 90% of global Li production [3].
Li is also a lynchpin metal for the transition to a green future based on renewable energy. In 2020, the manufacture of Li-ion batteries accounted for 71% of total lithium consumption across the globe [4]. Presently, the global Li resource, which has increased substantially as a consequence of recent exploration activity, is estimated to be about 98 million metric tons [3]. Particularly noteworthy is the 75% production increase in global lithium production between 2016 and 2017 and the further increase by 23% from 2017 to 2018 [5]. Even given this rapid pace of recent production, a recent World Bank report considers that global Li production will have to rise by 500% to meet mid-century climate targets [6]. Given the present low level of commercial production in the US from a brine extraction operation in Nevada [3], there is an ongoing need for the identification and development of new domestic Li resources, particularly granite pegmatite, given the limited spatial extent of brine and potential geothermal sources.
Understanding the extent of parental melt fractionation and chemical evolution in granite pegmatites can contribute to the evaluation of regional and individual pegmatite prospects. Tracking abundance variations of the alkali trace elements Li, Rb, and Cs in muscovite provides one means of assessing the extent of pegmatite melt fractionation [7,8,9,10]. Exclusion of these elements from the structure of felsic rock-forming minerals during granite magma crystallization leads to their accumulation and enrichment in residual pegmatite-forming melts [11].
Muscovite is one of the most common minerals in granitic pegmatites, with both the Li abundance and K/Rb ratio serving as exploration guides to assess the potential for Li-aluminosilicate mineralization [7,11,12,13,14,15,16]. Building directly on the previous work of Wise et al. [17], we first undertook on-site measurements of the Li content in the drill core at the Carolina Lithium Prospect in Gaston County, NC, USA (Figure 1) in December 2022. We then determined the abundance of Li, K, and Rb in muscovite from outcrops in the field and additional drill core and pegmatite hand samples on site at the Piedmont Lithium field facility in March 2023 to illustrate how in-field analysis by handheld laser-induced breakdown spectroscopy (LIBS) can be used as an analytical tool in granite pegmatite exploration and for rapid prospect evaluation.
2. Geological Setting
2.1. Carolina Tin-Spodumene Belt (CTSB)
The CTSB is a narrow domain of pegmatites of the Carboniferous age [18] located in the Inner Piedmont physiographic province [19] that host both cassiterite and spodumene. Concentrated in a belt across the Kings Mountain Shear Zone between Lincolnton, NC, and Gafney, SC (Figure 1), the CTSB was the most historically important Li pegmatite district in North America and is presently the focus of renewed exploration activity. This pegmatite mineralization lies just to the east of the Cherryville quartz monzonite, a complex intrusion of approximately the same age as both spodumene-bearing and common quartz-feldspar pegmatites across the CTSB, although existing age data are low-precision with the Cherryville and pegmatites overlapping within 10 Ma [20]. The ultimate source of CSTB pegmatites is not known. Some investigators have suggested that the CTSB pegmatites are associated with this peraluminous, 2-mica intrusion since spodumene-free pegmatite dikes extend eastward from the Cherryville granite with a strike that is sub-parallel to the northeast-trending Kings Mountain Shear Zone [21]. However, the biotite-bearing High Shoals granite east of the CTSB has also been suggested as a possible pegmatite source [22,23,24].
2.2. Previous Exploration and Mining Activity
The Li reserves for the CTSB are large, comprising more than 100 Mt at an average Li content of about 0.7% Li from Kesler’s 1976 estimate [25]. Active mining of spodumene was undertaken in the CTSB from the 1950s to 1990s at two large mines (Figure 1), the Hallman-Beam Mine operated by the Lithium Corporation of America and the Kings Mountain Mine operated by the Foote Mineral Company, where reserves were estimated at 62.3 Mt averaging 0.67% Li and 45.6 Mt averaging about 0.7% Li, respectively [26].
Recent industrial demand for Li has resulted in renewed exploration activity across the CTSB, with Piedmont Lithium’s Carolina Lithium Project (CLP) presently assessing a large prospect centered at UTM coordinates 473764 E, 3916209 N in Gaston County near Bessemer City (Figure 1). This area was of exploration interest in the past and trenched in places during the 1950s. The LIBS analyses reported here were undertaken on muscovite from drill core, outcrops, and soil on this prospect.
Li-pegmatite mineralization in the CTSB is of the albite-spodumene type defined by Černý [27], falling within the lithium-cesium-tantalum (LCT) family of Černý et al. [28] and the Group 1 type of Wise et al. [29]. Individual pegmatites across the CTSB are complex structures with surface dimensions of a few to a hundred meters in width and up to a kilometer in length that were intruded generally parallel to foliation in the surrounding country rocks [19,26]. Different types of pegmatites within the CTSB include (i) those comprised of K-feldspar, albite, quartz and beryl; (ii) those containing primarily K-feldspar, oligoclase, quartz, with muscovite, biotite, and garnet as accessory phases; and (iii) Li-bearing pegmatites composed of spodumene, K-feldspar, albite, quartz and beryl [30]. Pegmatites are texturally heterogeneous across the region, ranging from fine-grained aplite to very coarse-grained, but display little internal compositional zoning. Spodumene-bearing pegmatites typically have a modal composition of approximately 41% feldspar, 32% quartz, 20% spodumene, and 6% muscovite [26,31]. More than 50 accessory minerals occur in these pegmatites, including beryl, garnet, titanite, cassiterite, zircon, Mn-bearing fluorapatite, triphylite, and columbite-group minerals [19,31,32,33,34].
2.3. Pegmatites of the Carolina Lithium Prospect
Between 2017 and 2021, 542 drill holes comprising just over 80,000 m were completed on the CLP. The 511 assayed drill holes intersected >75 mineralized pegmatite bodies estimated to comprise the largest pegmatite resources in the United States at >44 Mt, having an average grade of 1.08 wt. % Li2O [35].
As illustrated in Figure 2, this drilling has shown that pegmatite dikes in the CLP are interconnected by flat to shallow-dipping sills and inclined sheets that are encountered over broad lateral extents that only rarely outcrop at the surface. This pegmatite dike network is hosted in a country rock of (1) a fine- to medium-grained foliated biotite, hornblende, quartz-feldspar gneiss that is commonly referred to as ‘amphibolite’ and (2) metasedimentary rocks that include schists and metamorphosed mudstones. Massive to weakly foliated diabase dikes of the Triassic age are also present to a limited extent.
CLP pegmatites are largely thin, sheet-like bodies [26] comprising composite structures of nearly uniform mineralogical character in which albite and quartz predominate over spodumene and K-feldspar. They vary from fine-grained to very coarse-grained in texture, with thin dikes of spodumene-bearing pegmatite cutting larger dikes of spodumene-free quartz-feldspar pegmatite or of aplite dikes cutting either spodumene-bearing or spodumene-free pegmatite [36]. The spodumene-free pegmatite dikes, which most commonly occur within and near the Cherryville intrusion [37], have variable orientations, with some having the same trend as the spodumene-bearing dikes, so they may represent either an early stage of weakly fractionated silicate melt or a later unmineralized pegmatite system.
The examination of surface outcrops and drill core has defined three varieties of pegmatite within the CLP—(i) common spodumene-free quartz-feldspar pegmatite, (ii) pegmatite in which spodumene is present but not dominant, and (iii) pegmatite having spodumene as the dominant constituent. Spodumene is the only Li-bearing ore mineral present in pegmatites on the CLP, with lath-shaped spodumene commonly oriented sub-normal to pegmatite contacts. Spodumene in the CLP pegmatites is dominated by white to light-green coarse-grain crystals, although medium- to fine-grained white spodumene is frequently present in subordinate proportions, and coarse-grained light-purple spodumene has been documented locally.
3. Methods
3.1. Laser-Induced Breakdown Spectroscopy (LIBS)
LIBS is an established form of atomic emission spectrometry with a capability for rapid and simultaneous multi-element analysis of geological materials. It is particularly suited to the analysis of the light elements (i.e., He, Li, Be, B, C, N, O, and Mg) that can be present in high abundance in geological materials but are difficult to determine by many other analytical techniques. LIBS has an attractive set of attributes that make it a suitable technology for geochemical analysis in the field. These include a simple analytical system architecture requiring only a laser, optics, detector/spectrograph, and computer that can be configured into a lightweight handheld device, rapid and simultaneous detection of most elements with a single laser pulse, minimal or no sample preparation, and a small sample size with only picograms (pg) and nanograms (ng) of material required for analysis.
In LIBS analysis, short-duration, pulsed laser light is tightly focused onto the sample to cause material ‘breakdown’, i.e., the conversion of a minute amount of sample by laser energy absorption into a vapor and particulate-bearing aerosol and generation of a high-temperature plasma [38]. Monitoring the wavelength and intensity of emission lines in the LIBS plasma provides information on both the chemical species present and their abundance because element abundances in the sample analyzed are reflected in the intensities of elemental emission lines measured in the LIBS emission spectrum. Simultaneous multi-element analysis by LIBS can be used for simple elemental detection or for quantitative analysis in real time through appropriate spectral preprocessing, careful selection of emission lines, and the creation of univariate or multivariate calibration curves using physically and compositionally similar matrix-matched reference samples.
The first handheld LIBS analyzer was introduced to the commercial market in 2015 and described in the literature shortly thereafter [39]. Utilizing recent advances in optics, compact laser sources, miniaturized high-resolution spectrometers, microelectronics, and computers, several manufacturers are presently producing lightweight battery-powered handheld LIBS analyzers that can be used by an individual in the field for several hours. These handheld instruments offer a real-time display of results, together with many features present in laboratory systems, including variable time gating, gas purging, rastering the laser beam across a sample, video targeting, and on-board data pre-processing and chemometric analysis.
3.1.1. Handheld LIBS Analysis
Lithium is an element effectively analyzed by LIBS because of its strong emissivity, which makes it readily detectable in geological materials, even when present at low concentrations. Previous quantitative LIBS analysis or compositional mapping related to Li-pegmatite mineralization has been undertaken using both laboratory LIBS systems [40,41,42], commercial LIBS drill core scanners [43,44], or handheld LIBS analyzers [17,45,46,47,48]. The work reported here utilized a SciAps Inc. (Woburn, MA, USA) Z-300 series handheld LIBS analyzer for the determination of Li, K, and Rb in muscovite either from outcrops in the field or drill core, pegmatite hand samples, and soil at the Piedmont Lithium field facility in the CLP.
This SciAps handheld LIBS analyzer employs an Android operating system with a graphic user interface and is powered by rechargeable Li-ion batteries that provide up to 8 h of operation. The instrument uses a proprietary pumped solid-state 1064 nm Nd-YAG pulsed laser that generates a 6 mJ laser pulse with a 50 μm beam size at a 1 nS pulse duration and has a built-in camera for beam targeting, a translational stage for 3-D beam rastering across the surface of a sample, and the capability to flow an inert gas across the sample surface for plasma confinement and signal enhancement. The 3-D translational stage is computer controlled for automatic adjustment of the laser focus at each sample location. Automated stage movement permits analysis over a 2 × 2 mm area, with the raster pattern, spacing, and number of laser shots at each location determined by the user. A 4 × 3 point grid pattern covering an area of approximately 1 mm × 0.7 mm was employed for this study. Following two laser shots for sample surface cleaning, four laser shots for data collection were taken at each point on five different raster grids on every sample and then averaged to produce a composite LIBS spectrum based on the 48 individual analyses. These five analyses were then averaged to generate the Li measurements and K/Rb ratios reported here.
The light signal from the plasma emission is collected, typically after a 650 ns delay over a 1 ms integration time, and passed by fiber optic cable into three spectrometers with time-gated, charge-coupled diode detectors having respective spectral ranges and resolutions of 190 to 365 nm with a full-width half maximum (FWHM) value of 0.18 nm, 365 to 620 nm with an FWHM value of 0.24 nm, and 620 to 950 nm with an FWHM value of 0.35 nm. This analysis produces composite LIBS spectra over the 23,432 channels of the spectrometer (Figure 3). A pre-loaded spectral library of element emission lines derived from the National Institute of Standards and Technology (NIST) Atomic Spectral Database (https://www.nist.gov/pml/atomic-spectra-database accessed on 14 May 2023) is used for element identification. Calibrations for quantitative analysis can be created on the Z-300 instrument for specific applications from the analysis of a set of matrix-matched reference samples of known composition.
3.1.2. Instrument Calibration
Quantitative analysis can be undertaken using the Geochem mode of the SciAps LIBS analyzers developed beforehand from the analysis of a set of matrix-matched reference materials using either single-element or multivariate calibration procedures using the Profile Builder PC-based software package. As described by Harmon et al. [47], this software utilizes a graphic user interface to facilitate the building of calibration curves via an established workflow that first selects the element suite of interest, next defines the element abundances in the reference samples, then acquires sets of reference spectra, and finally creates calibration models as concentration versus intensity ratio plots. These models can then be saved for subsequent quantitative testing to be performed by the handheld analyzer.
The creation of LIBS calibrations depends on two considerations—the number of spectral lines for an element of interest and the presence of distinct emission lines that are not affected by overlap with lines from other elements present in the sample. Any calibration curve will perform best when developed for a specific matrix of interest. Intensity values for elements are obtained after a background subtraction and integration of measured emission intensities across the defined spectral region of interest to obtain a summed area under the peak value. Intensity ratios are then calculated by combining one or more summed peak intensity or by normalizing to the full emission spectrum.
Two calibrations for the handheld LIBS analyzer were developed for this work (Figure 4), an initial one solely for Li in muscovite during the autumn of 2022 that was used for the analysis of CLP drill cores 21-BD-529 and 21-BD-531 in December 2022 and then a second expanded set of calibrations for Li, K, and, Rb prepared during February-March 2023 that was used in March 2023. LIBS analysis of mica in drill cores was undertaken at the Piedmont Lithium field facility, analysis of mica from pegmatite outcrops was carried out in the field at the site of collection, and soil muscovite was separated and analyzed at North Carolina State University.
To develop our LIBS calibration models, a minimum of 20 spectra were acquired after spectral wavelength calibration in the Profile Builder software (SciAps proprietary) for elemental emission line(s) in three spectral regions of interest: (i) from 670 to 672 nm for the Li line at 670.7 nm, from 765 to 768 nm for the K line at 766.49 nm, and from 779 to 781 nm and 793 to 796 nm for the Rb lines at 780.03 and 794.76 nm (Figure 3) from each reference sample (Appendix A). Intensity ratios for the calibration plots were determined by full-spectrum normalization.
As physical matrix effects produce differences in laser-material coupling and, consequently, shot-to-shot differences in the observed elemental emission intensity, the individual spectra of the calibration set were sorted into a range of results for which the total emission intensity variation was <15%. From this point of the calibration workflow, curves can be generated and fit to the data by selecting a number of options, including the normalization approach, zero forcing, and curve order. An equation for each calibration curve and its root mean square error (RMSE) is provided by the proprietary SciAps Profile Builder software.
3.2. Electron Probe Microanalysis (EPMA)
Major and minor element contents of muscovite were determined by electron probe microanalysis (EPMA) using (Peabody, MA, USA) at Virginia Polytechnic Institute and State University. The standard minerals quartz (Si), diopside (Ca), rutile (Ti), albite (Al, Na), olivine (Mg), pyrope (Fe), rhodonite (Mn), orthoclase (K), benitoite (Ba), and fluorite (F) were used for microprobe calibration and analyzed periodically during each session for quality assurance. The probe used an acceleration voltage of 15 kV, a 10 nA probe current, and a 5 µm beam diameter for mineral analysis.
4. Results
The focus of this study was to ascertain if LIBS analysis of muscovite could be used as a pathfinder for spodumene mineralization within the CLP, across the CTSB, and potentially in other LCT pegmatite districts. Muscovite occurs in the Qtz-Fsp pegmatites and Spd-bearing pegmatites of the CLP as small isolated grains, aggregates of crystals, and as large books a centimeter or greater in size, but has only rarely been observed in Spd-pegmatites.
Four types of muscovite have been observed from exploration fieldwork and the logging of more than 500 drill cores from across the CLP. These different types represent a progression from pristine to weathered mica as follows:
- (i)
- transparent to semi-transparent book of muscovite with a green hue;
- (ii)
- opaque muscovite with a silvery color occurring as books or individual grains;
- (iii)
- muscovite with weak to moderate oxidation rims and clear, unaltered interiors;
- (iv)
- muscovite exhibiting ragged edges, an inhomogeneous color with mottled textures, and strong oxidation deep into the mica.
Type (i) muscovites occur in only the most pristine rocks. Type (ii) muscovites that exhibit little to no rim alteration are the most common type in CLP pegmatites. Type (iii) muscovites are most frequently observed in pegmatite surface outcrops and in residual soils. Type (iv) muscovites, which may have a residual unaltered core, occur in highly weathered rocks. All of the muscovites analyzed in this study are of types (i) and (ii) except for a few type (iii) muscovites from surface samples and soils.
Major-element analysis for mica from both barren and spodumene-mineralized pegmatites across the district confirms that CLP muscovites are found near end-member compositions (Figure 5, Appendix B). The respective K2O and FeO contents range from 8.6 to 11.1 wt. % and 0.5 to 2.8 wt. %, the abundances of MgO, Na2O, and BaO are below 1.1 wt. %, and the F contents are low (<0.5 wt. %). The five muscovite analyses reported by Swanson [34] for CSTB pegmatites and aplites are comparable to our 26 analyses (Appendix B).
Our LIBS analysis of muscovites within the CLP and from across the CTSB is discussed in Section 4.1, Section 4.2 and Section 4.3 below. The 130 samples analyzed comprised 65 in situ analyses of pegmatite muscovite in drill core, 49 analyses of muscovite from pegmatite outcrops, hand samples, and soils, and 16 specimens whose lithological context is not certain. These data are presented in Appendix C. The calibration curves shown in Figure 4 are appropriate for the analysis of muscovite containing 0–3 wt. % Li, 0–12 wt. % K, and 0–1 wt. % Rb and enable the handheld LIBS analyzer to be used for the real-time quantitative analysis of muscovite in the field.
4.1. CLP Drill Core Analysis
One way in which handheld LIBS analysis can be used for pegmatite prospect evaluation is for the rapid assay of Li in drill cores at the time they are acquired and logged. Core drilling by Piedmont Lithium on the CLP [50] uses standard wireline core-drilling techniques. All drill holes are started and recovered from the surface as HQ-sized (96 mm) drill core. Once the drill has passed through the saprolite to bedrock transition, the core size is reduced to NQ (75.7 mm) until the end of the hole is reached. As drilling proceeds, the drill core is retrieved from the hole, boxed, and delivered to a secure core logging facility.
The two complete drill cores that were analyzed in this study were obtained from an area outside of the defined resource of the CLP. The first core, 21-BD-529 (UTM coordinates 472194 E, 3915918 N), is a 151 m core that penetrated an initial 42 m section of soil and saprolite before encountering multiple spodumene-free pegmatite sequences intruded into the amphibolite country rock. A 4 m-thick spodumene-bearing pegmatite is present between 86.3 and 90.5 m depth, with 13 spodumene-free pegmatite horizons present above and below this mineralized section. The second core, 21-BD-531 (UTM coordinates 472160 E, 3915999 N), is a 160 m core that penetrated an initial 60 m section of soil and saprolite before encountering amphibolite penetrated by two spodumene-bearing pegmatites between 70.7 and 79.7 m depth and then transitioned into a lower section of spodumene-free pegmatite and altered pegmatite. A representative illustration of the different lithologies encountered in the two cores is provided in Figure 6. Their description and muscovite Li contents are given in Figure 7, and the chemical character of the different core lithologies is compared in Figure 8. The LIBS analyses of the two cores were undertaken on-site at the Piedmont Lithium field facility in December 2022 using the Li calibration shown in panel (a) of Figure 4.
Our LIBS Li assay of the 310 m of the 21-BD-529 and 21-BD-531 drill cores was undertaken on-site at the Piedmont Lithium field and core handing facility in December 2022 over the course of two days, with 34 analyses of micas from core 21-BD-529 and 31 analyses from core 21-BD-531. Li contents of muscovite for the saprolite intervals in each core are generally lower than for muscovite from pegmatite intervals. The Li content of saprolite muscovite ranges from 0.02 to 0.10 wt. % versus 0.05 to 0.25 wt. % in pegmatite muscovite for core 21-BD-529, and 0.023 to 0.120 wt. % (saprolite) versus 0.038 to 0.228 wt. % (pegmatite) for core 21-DB-531. The highest Li contents in both cores, 0.25 wt. % in 21-BD-249 and 0.23 in 21-BD-251, are displayed by muscovite from the spodumene-bearing intervals.
The average major- and trace-element composition of lithologies of drill cores 21-BD-529 and 21-BD-531 are presented in Appendix D. Pegmatite and ‘granite’ horizons of both cores are similar in their major element compositions. They are both peraluminous with A/CNK (molar Al2O3/CaO+Na2O+K2O) ranging between 1.13 and 1.36 and are characterized by high average SiO2 (~72 to 75 wt. %) and Al2O3 (~14.3 to 15.4 wt. %) values. The average Na2O and K2O values are low regardless of the rock type, with Na2O typically being higher than K2O, likely reflecting a higher abundance of albite relative to microcline and muscovite. The bulk composition of the spodumene-bearing dikes compares favorably to spodumene-bearing pegmatites from other areas of the world (Table 1).
Spodumene-free pegmatite and ‘granite’ on the CLP are impoverished in Li, Be, Ga, Rb and Cs relative to the spodumene-bearing layers which are notably enriched in Li, Rb, Cs and Be. The degree of fractionation in the two CLP drill cores, as expressed by the K/Rb ratio, is generally low for the ‘granite’ (K/Rb = 183 to 105) and spodumene-free pegmatites (K/Rb = 94 to 84) whereas the highest level of chemical evolution occurs in the spodumene pegmatites (K/Rb = 43 to 42). The modest level of rare-element fractionation in the CLP drill cores is characterized by Li values that are comparable to other highly evolved Li-rich pegmatites (e.g., Tanco, Harding), which also host significant quantities of beryl, lepidolite, pollucite, columbite-tantalite, wodginite, cassiterite, or microlite. However, despite the elevated levels of Li, the CLP spodumene pegmatites lack similar levels of Rb and Cs enrichment as other Li-rich pegmatites and are noticeably poor in Be, Cs and Ta minerals.
Muscovite from highly mineralized portions of two other CLP drill cores was analyzed at the Piedmont Lithium field facility in March 2023. The multielement mica calibrations shown in Figure 4b–d were used for this analysis.
Drill core 18-SS-001 contains a significant interval of fine- to coarse-grained spodumene pegmatite from 62.5 to 83.4 m (20.9 m at 1.42% bulk Li2O). There are several distinct textures within this interval, including fine-grained spodumene + quartz aplite and typical medium- to very coarse-grained pegmatite. These textures are nearly ubiquitous within large (>10 m wide) spodumene pegmatites in the CLP. Within this large drill intercept, there is a smaller zone from approximately 67 to 69 m that is visually distinct from the rest of the intercept. It lacks K-feldspar and contains columbite, which is not seen in other portions of the interval. Two muscovite grains from the columbite-bearing interval have Li contents of 0.98 and 0.168 wt. % and low K/Rb ratios of 21.5 and 19.5.
Drill core 19-CT-014 contains a significant intercept of fine- to very coarse-grained spodumene pegmatite from 69.8 to 113.0 m (43.2 m at 1.73% bulk Li2O). The distinct fine- and medium-grained spodumene + quartz aplite plus medium- to very coarse-grained pegmatite textures in this intercept are characteristic of the strongly spodumene-bearing pegmatites of the CLP. Within this intercept, there is a smaller interval between 101 and 104 m (Figure 8) that is distinct from the rest of the intercept that contains (i) significantly more spodumene in larger, more equant crystals exhibiting a random orientation, (ii) far less albite and other feldspars than other portions of the intercept, and (iii) several infrequent yet distinct crystals of both columbite and apatite. Ten muscovite grains from the columbite-bearing core interval between a 71 and 111 m interval have high Li contents of 0.220 and 0.424 wt. % and the lowest K/Rb ratios of 18.0 and 7.7 observed in the CLP.
4.2. Analysis of Muscovite in CLP Outcrops
A second way in which handheld LIBS can be utilized in an exploration and prospect context is for the real-time analysis of outcrops in the field. During our field campaign in March 2023, we analyzed muscovite from multiple CLP outcrops in one area characterized by spodumene-free pegmatites and also from multiple outcrops in three areas containing mineralized, spodumene-bearing pegmatites. Single muscovite grains from 27 pegmatite outcrops were pried loose with a knife, affixed to black tape, and presented to the handheld LIBS instrument for real-time, in-field analysis. Five LIBS analyses were made on each individual muscovite grain. These analyses are summarized in Table 2. Although the ranges of Li and K/Rb variation and the average Li contents of the spodumene-free and spodumene-bearing outcrops overlap, there is a clear distinction in their average K/Rb ratios, with muscovite from the three spodumene-bearing groups being distinctly lower (23.5 ± 4.1, 21.4 ± 2.6, 23.6 ± 3.5) than for the spodumene-free group (30.7 ± 2.3).
4.3. Analysis of Soil Muscovite
A particular exploration challenge in granite pegmatite is prospect evaluation in the absence of an outcrop. The third way in which handheld LIBS can be utilized in an exploration context is for the analysis of soil in the field. In such a situation, the real-time analysis of soil muscovite in the field would be especially helpful. LIBS is ideally suited for this task.
The red clay soil ubiquitously present across the Piedmont region of North Carolina and encountered in all drill cores from the CLP belongs to the Cecil series, a fine-grained and moderately permeable kaolinitic soil typically occurring on ridges and side slopes of the Piedmont uplands that formed in residuum weathered from felsic igneous and high-grade metamorphic rocks [59]. Having formed from weathered residuum, the red clay soils across the CLP frequently contain muscovite. As part of a LIBS Li survey across an upland area of the CLP where a Cecil series soil is inferred to overlie multiple buried pegmatite dikes, we separated muscovite from four soil cores augered to about a 50 cm depth along a 430 m NW-SE trending traverse centered at UTM coordinates 474796 E, 3917083 N for handheld LIBS analysis, with five measurements taken for each muscovite grain. The average Li contents and K/Rb ratios for these muscovites range from 0.097 to 0.164 wt. % and 17.1 to 25.9, respectively (Table 3), indicating that the muscovites analyzed were derived from spodumene-bearing pegmatites and illustrating how LIBS analysis of soil muscovite can be used to infer the subsurface presence of mineralized pegmatite.
4.4. Li Abundances and K/Rb-Li Systematics
Li is a strongly incompatible element that becomes enriched in residual melts during the magmatic differentiation of granitic magmas. The K/Rb ratio is considered to be a reliable indicator of the extent of compositional fractionation of the melt from which muscovite crystallizes [11,13,60,61] and decreases with the progressive crystallization of a granitic magma due to the incompatible nature of Rb. Considered together, the K/Rb-Li systematics of muscovite reflects the extent of compositional evolution attained by a crystallizing magma, as the abundance of Li should increase in a fractionating melt as K/Rb decreases [60,61,62,63,64,65]. Thus, the binary plot of K/Rb versus Li can be used to gauge the degree of rare-element fractionation and geochemical evolution from poorly fractionated common pegmatites to extremely fractionated rare-element pegmatites. Consideration of K/Rb-Li has also been used as a tool for evaluating potential Li-mineralization in granitic pegmatites [66].
In general, common pegmatites, which lack rare-element mineralization such as beryl, columbite-group minerals, lithium phosphates, and lithium aluminosilicates, are impoverished in rare-alkalis (e.g., Be, Li, Rb, Cs), high-field strength elements (e.g., Nb, Ta, Sn) and volatile components (e.g., B, F). These pegmatites tend to have high K/Rb ratios and low concentrations of Li, Rb and Cs in their muscovite and K-feldspar. Specifically, muscovite from common pegmatites generally has K/Rb from roughly 650 to 40 with Li concentrations typically <200 ppm. Muscovite from Be-Nb-Ta-P-enriched pegmatites has a Li content that mostly varies between 20 and 1000 ppm with an associated K/Rb of 45 to 10. Highly fractionated pegmatites, enriched in Li and Cs, may host muscovite with K/Rb varying between 40 and 2 with Li contents ranging from 0.5 to nearly 2 wt. %.
Distributions of muscovite Li contents and K/Rb ratios from across the CTSB are displayed in Figure 9, with muscovite K/Rb-Li systematics illustrated in Figure 10. Overall, across the CTSB, the muscovite Li contents in pegmatites vary over an order of magnitude, extending from 0.04 to 0.74 wt. %, and K/Rb ratios vary between 63 to 8. Li contents for spodumene-bearing pegmatites, ranging from 0.0359 to 0.736 wt. % compared to 0.036 to 0.376 for common quartz-feldspar pegmatites (Figure 10). On average, Li contents are greater in spodumene-bearing pegmatites = 0.21 ± 0.12) than in the common quartz-feldspar pegmatites = 0.14 ± 0.08). Respective Li contents and K/Rb ratios for pegmatite muscovite range from 0.61 to 0.74 wt. % and 61.0 to 17.3 across the CTSB, excluding the CLP (Figure 10a), from 0.26 to 0.49 wt. % and 45.4 to 14.1 within the CLP (Figure 10b), and 0.04 to 0.42 and 62.6 to 7.7 for the CLP drill cores (Figure 10c). Although distributions overlap substantially, K/Rb ratios for common quartz-feldspar pegmatites = 33 ± 9) are biased toward high values compared to those for spodumene-bearing pegmatites = 21 ± 6).
It is notable that muscovite in the highly fractionated and strongly mineralized pegmatite of drill core 19-CT-014 exhibits the lowest K/Rb ratios determined for the CTSB (Figure 10c). These values are comparable to muscovite from Li-rich pegmatites from other worldwide localities and confirm the highly fractionated nature of the CTSB pegmatites. While the K/Rb and Li values of muscovite from the spodumene-bearing CTSB pegmatites are comparable to muscovite from spodumene-bearing pegmatites of the Bailonghan field, China [67], the Leinster pegmatite field, Ireland [68], and the Black Hills of South Dakota, USA [69], the CTSB pegmatites do not reach the level of extreme fractionation displayed by muscovite from the Tanco pegmatite in Manitoba, Canada [70], or the Bikita pegmatite in Zimbabwe [71], arguably two of the most evolved Li-rich pegmatites in the world. It is worth noting that the common quartz-feldspar pegmatites of the CTSB have significantly lower K/Rb ratios and higher Li values than many other common pegmatites found elsewhere, e.g., Cap de Creus, Spain [72]; Cross Lake, Manitoba, Canada [73]; and Yellowknife pegmatite field, Northwest Territories, Canada [74]. This could suggest that the CTSB pegmatites may carry hidden rare-element mineralization in other parts of the pegmatite domain that were not sampled and analyzed in this study.
5. Summary and Conclusions
Lithium is a key element for the transition from a carbon-based energy economy to a low-carbon energy economy of the future. Although Li brine deposits currently account for most of the mined Li in the world, the abundance of unmined Li-rich pegmatites in the world will be exploited in the coming years to meet the continually rising demand for Li. With this in mind, exploration for Li-rich, ore-grade pegmatite deposits is essential. The focus of this study is the analysis of muscovite in Li-rich pegmatites of the CTSB, particularly at the CLP in Gaston County, NC. Muscovite in CLP pegmatites has K2O and FeO contents ranging from 8.6 to 11.1 and 0.5 to 2.8 wt. %; MgO, Na2O, and BaO contents below 1.1 wt. %; and low F contents (<0.5 wt. %).
With its capability for real-time compositional analysis, handheld LIBS can be a valuable addition in the toolbox of the exploration geologist, particularly given its unique ability for the analysis of Li outside the conventional laboratory setting. By developing element-specific calibrations in the laboratory, handheld LIBS can be used in the field for quantitative element analysis of rocks, mineral, and soils during mineral exploration and prospect evaluation campaigns. Using a handheld LIBS analyzer calibrated for Li, K, and Rb in muscovite, this paper provides a framework for maximizing the efficiency during exploration for Li pegmatite ore bodies and the evaluation of identified pegmatite prospects. Because muscovite is a common constituent of Li-rich pegmatites, the determination of K/Rb ratios can provide a mineralization vector mineral for Li exploration.
LIBS analysis of drill core muscovites shows that the Li contents are highest and K/Rb ratios are lowest in the most fractionated, spodumene-bearing sections. The LIBS analyses of muscovite pegmatite outcrop yielded the same results, in agreement with the known presence or absence of spodumene in that outcrop. Based on these LIBS measurements in drill core and outcrop samples of a known spodumene character (i.e., present or absent) in this field area, we hypothesize that LIBS analyses of muscovite in soils can be a reliable predictor of spodumene-bearing pegmatites at depth because of the elevated Li contents and low K/Rb ratios of their detrital mica, respectively, 0.097 to 0.164 wt. % and 17.1 to 25.9 for the few soil micas analyzed.
Quantitative analysis of muscovites from the CTSB by handheld LIBS yields results that mimic geochemical characteristics of Li-rich pegmatites from around the world, showing high Li contents and low K/Rb ratios throughout the CTSB pegmatite belt. Within the CLP, and across the CTSB, muscovite Li contents vary over an order of magnitude, ranging from 0.04 to 0.74 wt. %, and their K/Rb ratios vary between 63 and 8. On average, mica Li contents are greater in spodumene-bearing pegmatites ( = 0.21 ± 0.12, than in quartz-feldspar pegmatites at ( = 0.14 ± 0.08). Although overlapping substantially in the middle portions of their distributions, muscovite K/Rb ratios for spodumene-bearing pegmatites ( = 21 ± 6) are biased toward low values compared to those for quartz-feldspar pegmatites ( = 33 ± 9), documenting the highly evolved character of the pegmatites within the CTSB district. Our results indicate that with a sufficient number of LIBS analyses, spodumene-bearing pegmatites can be successfully differentiated from spodumene-free pegmatites in the field in real-time using muscovites from the drill core, outcrop, and soil. This has important implications for Li exploration efforts, the most obvious being the reduction in time needed for quantitative geochemical analysis to vector towards ore bodies and subsequently to plan cost-effective drilling campaigns.
Author Contributions
R.S.H. defined and led the study. M.S.M. described the four drill cores analyzed. Z.G. planned and led the fieldwork. R.S.H. and J.S.M. undertook LIBS analysis of samples in the field. A.C.C. undertook the EPMA analyses. R.S.H., M.A.W. and A.C.C. prepared the paper with input and review from all co-authors. A.C.C. acquired the funding for the project. All authors have read and agreed to the published version of the manuscript.
Funding
Piedmont Lithium Funding for this research was provided by North Carolina Policy Collaboratory grant #207586-50004 and Piedmont Lithium contract #573984 to North Carolina State University.
Data Availability Statement
The data from this study, available on request, are provided in Appendix B, Appendix C and Appendix D.
Acknowledgments
Our appreciation is extended to Piedmont Lithium, Inc., particularly Chief Geologist Lamont Leatherman, for facilitating the fieldwork portion of the study and providing the lithological and geochemical data for the drill cores analyzed. We thank the U.S. National Museum of Natural History and the Peabody Museum of Yale University for providing the reference micas used for the development of the mica calibrations on the LIBS handheld analyzer. We also thank Lowell Moore at the Electron Microprobe Laboratory in the Department of Geosciences at Virginia Tech for his assistance with the microprobe analysis.
Conflicts of Interest
The authors declare no conflict of interest.
Appendix A
Mica specimens used in the development of mica calibration curves shown in Figure 4 (Lpd = lepidolite, Mrg = margarite, Ms = muscovite, Phl = plogopite); nd = not determined.
| Specimen ID | Type | Location | Li (wt. %) | K (wt. %) | Rb(wt. %) |
| BB #7-6 | Ms | BB #7 Pegmatite, Maine (USA) | 0.613 | 9.439 | 0.759 |
| Cole-13 | Ms | Cole Pegmatite, Maine (USA) | 0.153 | 9.489 | 0.247 |
| Heinrich-222 | Ms | Dike #3 | 0.745 | 10.376 | nd |
| GE3-9 | Ms | GE Pegmatite, Maine (USA) | 0.246 | 9.306 | 0.391 |
| Hayes-1 | Ms | Hayes Pegmatite, Maine (USA) | 0.195 | 9.331 | 0.503 |
| Hibbs-4 | Ms | Hibbs Pegmatite, Maine USA) | 0.060 | 9.514 | 0.169 |
| Mt. Marie-15 | Ms | Mount Marie Pegmatite, Maine (USA) | 0.044 | 9.431 | 0.090 |
| NMNH-48633 | Mrg | Laurel Creek, Maryland (USA) | nd | 0.002 | nd |
| NMNH-103041 | Lpd | Varuträsk, Vasterbotten (Sweden) | 2.537 | 2.539 | 1.900 |
| NMNH-105719 | Lpd | Brown Derby, Colorado (USA) | 2.091 | 8.388 | 1.712 |
| NMNH-115326 | Phl | Talcville, NC (USA) | nd | 7.445 | nd |
| NMNH-128243 | Lpd | Grosmont, Western Australia (Australia) | 2.592 | 8.752 | 1.055 |
| NMNH-128418 | Lpd | Hoydalen, Tordal (Norway) | 2.379 | 8.321 | 2.249 |
| NMNH-144860 | Lpd | Minas Gerias (Brazil) | 2.334 | 8.403 | 1.616 |
| NMNH-R4485 | Mrg | Unionville, Pennsylvania (USA) | nd | 0.025 | nd |
| NMNH-R11827 | Lpd | Vitaniemi, Eräjärvi (Finland) | 2.211 | 8.733 | 0.780 |
| Willis-2 | Ms | Willis Warren Pegmatite, Maine (USA) | 0.035 | 9.339 | 0.368 |
| Willis-7 | Ms | Willis Warren Pegmatite, Maine (USA) | 0.015 | 9.472 | 0.385 |
| YPM MIN-023948 | Mrg | Chester, Massachusetts (USA) | nd | 0.018 | nd |
Appendix B
Handheld LIBS Li and major element EMPA analyses of muscovite in drill cores 21-BD-529 (a) and 21-BD-531 (b).


Appendix C
Li, K, and Rb abundances (wt. %) and K/Rb ratios in muscovite from pegmatites and soils within the Carolina Lithium Prospect and Carolina Tin Spodumene Belt determined by handheld LIBS (measured values and uncertainties in wt. %, Spd = spodumene, Y = spodumene-bearing pegmatite, N = spodumene-free pegmatite, NK = not known, NA = not analyzed). Mineral abbreviations as follows: Qz = quartz, Fsp = feldspar.
| Carolina Lithium Prospect | |||||||||||
| Sample ID | Description | Spd | UTM N | UTM E | Li | ±2σ | K | ±2σ | Rb | ±2σ | K/Rb |
| 22-AC-00 | Pegmatite hand specimen | Y | NK | NK | 0.106 | 0.021 | 10.548 | 0.912 | 0.660 | 0.117 | 16.0 |
| 22-AC-01 | Pegmatite outcrop #1 | N | 472603 | 3916672 | 0.192 | 0.038 | 10.454 | 1.227 | 0.319 | 0.048 | 32.7 |
| 22-AC-02 | Pegmatite outcrop #2 | N | 472615 | 3916697 | 0.115 | 0.025 | 10.812 | 1.138 | 0.326 | 0.042 | 33.2 |
| 22-AC-23 | Pegmatite outcrop #3 | Y | 473502 | 3914841 | 0.282 | 0.055 | 9.082 | 1.183 | 0.572 | 0.123 | 15.9 |
| 22-AC-24 | Pegmatite outcrop #4 | Y | 473807 | 3915372 | 0.153 | 0.027 | 10.127 | 0.805 | 0.451 | 0.071 | 22.4 |
| 22-AC-06 | Pegmatite outcrop #5 | Y | 473429 | 3916466 | 0.074 | 0.010 | 9.846 | 1.009 | 0.511 | 0.086 | 19.3 |
| 22-AC-07 | Pegmatite outcrop #6 | Y | 473245 | 3916139 | 0.193 | 0.037 | 10.966 | 0.939 | 0.717 | 0.128 | 15.3 |
| 22-AC-10 | Pegmatite float boulder | Y | 472788 | 3915926 | 0.105 | 0.021 | 10.996 | 0.739 | 0.641 | 0.121 | 17.2 |
| 22-AC-11 | Pegmatite outcrop #7 | Y | 472704 | 3915929 | 0.109 | 0.019 | 10.620 | 0.723 | 0.266 | 0.039 | 39.9 |
| 22-AC-13 | Pegmatite outcrop #8 | Y | 472720 | 3915951 | 0.087 | 0.014 | 10.728 | 0.980 | 0.629 | 0.129 | 17.1 |
| 22-AC-14 | Pegmatite outcrop #9 | Y | 472852 | 3916157 | 0.090 | 0.013 | 10.329 | 0.901 | 0.328 | 0.049 | 31.5 |
| 22-AC-16 | Pegmatite dike | Y | 472346 | 3915109 | 0.153 | 0.027 | 11.494 | 0.706 | 0.814 | 0.120 | 14.1 |
| 22-AC-17 | Pegmatite outcrop #10 | N | 472350 | 3915056 | 0.122 | 0.020 | 11.288 | 1.043 | 0.318 | 0.048 | 35.6 |
| 22-AC-18 | Pegmatite outcrop #11 | N | 472350 | 3915056 | 0.109 | 0.036 | 11.175 | 1.284 | 0.309 | 0.048 | 36.2 |
| 22-AC-51 | Pegmatite outcrop #12 | Y | 473100 | 3915210 | 0.263 | 0.036 | 12.309 | 0.744 | 0.466 | 0.062 | 26.4 |
| 22-AC-52 | Mica Pit Road | NK | 470235 | 3908800 | 0.156 | 0.032 | 11.436 | 0.778 | 0.268 | 0.031 | 42.7 |
| 22-AC-53 | Mica Pit Road | NK | 470235 | 3908800 | 0.078 | 0.015 | 9.402 | 0.800 | 0.207 | 0.022 | 45.4 |
| 22-AC-130 | Mica Pit | NK | 470235 | 3908800 | 0.201 | 0.037 | 11.266 | 0.798 | 0.495 | 0.061 | 22.8 |
| 22-AC-133 | Soil traverse NCS-2, D00176585 | NK | 474860 | 3916990 | 0.097 | 0.017 | 11.453 | 0.595 | 0.511 | 0.033 | 22.5 |
| 22-AC-135 | Soil traverse NCS-4, D00176024 | NK | 474830 | 3917032 | 0.146 | 0.043 | 10.561 | 0.768 | 0.662 | 0.048 | 17.1 |
| 22-AC-142 | Soil traverse NCS-10, D00176581 | NK | 474885 | 3916951 | 0.145 | 0.015 | 10.794 | 0.680 | 0.547 | 0.022 | 19.7 |
| 22-AC-144 | Soil traverse NCS-10, D00176581 | NK | 474817 | 3917056 | 0.164 | 0.041 | 11.297 | 0.452 | 0.437 | 0.023 | 25.9 |
| 23-AC-21 | Pegmatite specimen (#751) | N | 473041 | 3915775 | 0.157 | 0.019 | 9.851 | 1.620 | 0.267 | 0.055 | 36.8 |
| 23-AC-66 | Pegmatite outcrop #13, grain #1 | Y | 471040 | 3911384 | 0.079 | 0.017 | 11.161 | 0.847 | 0.596 | 0.067 | 18.7 |
| 23-AC-66 | Pegmatite outcrop #113 grain #2 | Y | 471040 | 3911384 | 0.222 | 0.034 | 11.095 | 0.803 | 0.428 | 0.071 | 25.2 |
| 23-AC-67 | Pegmatite driveway outcrop #1 | Y | 472830 | 3916280 | 0.288 | 0.029 | 12.083 | 0.964 | 0.525 | 0.085 | 23.0 |
| 23-AC-68 | Pegmatite driveway outcrop #2 | Y | 472830 | 3916280 | 0.201 | 0.030 | 10.433 | 0.645 | 0.283 | 0.035 | 36.8 |
| 23-AC-69 | Pegmatite driveway outcrop #3 | Y | 472830 | 3916280 | 0.174 | 0.042 | 9.151 | 1.890 | 0.438 | 0.114 | 21.0 |
| 23-AC-70 | Pegmatite driveway outcrop #4 | Y | 472830 | 3916280 | 0.460 | 0.189 | 12.376 | 0.914 | 0.503 | 0.073 | 24.8 |
| 23-AC-71 | Pegmatite outcrop at core shed | N | 471070 | 3911410 | 0.178 | 0.022 | 10.133 | 0.463 | 0.302 | 0.033 | 33.5 |
| 22-AC-20 | Pegmatite #1, CLP Outcrop Area 1 | Y | 474086 | 3916608 | 0.115 | 0.020 | 11.086 | 1.098 | 0.699 | 0.143 | 15.9 |
| 23-AC-17 | Pegmatite #2, grain #1,CLP Outcrop Area 1 | Y | 474150 | 3916700 | 0.088 | 0.028 | 12.905 | 0.543 | 0.731 | 0.106 | 17.6 |
| 23-AC-17 | Pegmatite #2, grain #2, CLP Outcrop Area 1 | Y | 474150 | 3916700 | 0.092 | 0.025 | 12.701 | 1.322 | 0.673 | 0.106 | 18.9 |
| 23-AC-18 | Pegmatite #3 (0744), CLP Outcrop Area 1 | Y | 474086 | 3916608 | 0.114 | 0.049 | 11.059 | 0.396 | 0.424 | 0.052 | 26.0 |
| 23-AC-38 | Pegmatite #4, grain #1, CLP Outcrop Area 1 | Y | 474086 | 3916608 | 0.130 | 0.059 | 10.362 | 0.630 | 0.339 | 0.041 | 30.6 |
| 23-AC-38 | Pegmatite #4, grain #2, CLP Outcrop Area 1 | Y | 474086 | 3916608 | 0.151 | 0.041 | 10.243 | 0.698 | 0.367 | 0.037 | 27.9 |
| 23-AC-39 | Pegmatite boulder #1, CLP Outcrop Area 1 | Y | 474086 | 3916608 | 0.162 | 0.032 | 11.312 | 1.268 | 0.480 | 0.063 | 23.6 |
| 23-AC-40 | Pegmatite float boulder #2, CLP Outcrop Area 1 | Y | 474086 | 3916608 | 0.168 | 0.020 | 12.695 | 1.140 | 0.666 | 0.081 | 19.1 |
| 23-AC-41 | Pegmatite float boulder #2, CLP Outcrop Area 1 | Y | 474086 | 3916608 | 0.259 | 0.024 | 11.426 | 0.978 | 0.452 | 0.041 | 25.2 |
| 23-AC-42 | Pegmatite float boulder #3, CLP Outcrop Area 1 | Y | 474086 | 3916608 | 0.292 | 0.019 | 10.610 | 0.870 | 0.473 | 0.053 | 22.4 |
| 23-AC-43 | Pegmatite float boulder #4, CLP Outcrop Area 1 | Y | 474086 | 3916608 | 0.308 | 0.018 | 12.223 | 1.268 | 0.502 | 0.059 | 24.3 |
| 23-AC-44 | Pegmatite outcrop #1, CLP Outcrop Area 2 | N | 472729 | 3916866 | 0.178 | 0.013 | 12.027 | 1.123 | 0.396 | 0.038 | 30.4 |
| 23-AC-45 | Pegmatite outcrop #2, grain 1, CLP Outcrop Area 2 | N | 472718 | 3916908 | 0.111 | 0.012 | 12.401 | 0.428 | 0.398 | 0.033 | 33.2 |
| 23-AC-45 | Pegmatite outcrop #2, grain 2, CLP Outcrop Area 2 | N | 472719 | 3916981 | 0.175 | 0.034 | 12.079 | 1.342 | 0.365 | 0.058 | 33.0 |
| 23-AC-46 | Pegmatite outcrop #3, CLP Outcrop Area 2 | N | 472693 | 3917024 | 0.104 | 0.014 | 11.629 | 0.601 | 0.327 | 0.028 | 35.6 |
| 23-AC-47 | Pegmatite outcrop #4, CLP Outcrop Area 2 | N | 472664 | 3916978 | 0.376 | 0.065 | 11.728 | 0.888 | 0.416 | 0.051 | 28.2 |
| 23-AC-48 | Pegmatite outcrop #5, CLP Outcrop Area 2 | N | 472574 | 3916953 | 0.173 | 0.035 | 11.212 | 0.971 | 0.348 | 0.073 | 32.2 |
| 23-AC-49 | Pegmatite outcrop #6, CLP Outcrop Area 2 | N | 472659 | 3916769 | 0.304 | 0.040 | 11.615 | 0.826 | 0.340 | 0.033 | 34.1 |
| 23-AC-50 | Pegmatite outcrop #7, CLP Outcrop Area 2 | N | 470605 | 3908798 | 0.249 | 0.049 | 13.282 | 1.453 | 0.396 | 0.070 | 33.6 |
| 23-AC-51 | Pegmatite dike trending W-NW, CLP Outcrop Area 2 | Y | 470605 | 3908798 | 0.185 | 0.025 | 13.332 | 0.936 | 0.696 | 0.065 | 19.0 |
| 23-AC-52 | Pegmatite boulder, CLP Outcrop Area 3 | Y | 470605 | 3908798 | 0.405 | 0.078 | 11.880 | 0.741 | 0.571 | 0.054 | 20.8 |
| 23-AC-53 | Pegmatite outcrop #1 with large mica books, CLP Outcrop Area 3 | Y | 470630 | 3908799 | 0.260 | 0.077 | 12.723 | 0.676 | 0.519 | 0.047 | 24.5 |
| 23-AC-54 | Pegmatite outcrop #2, CLP Outcrop Area 3 | Y | 470630 | 3908799 | 0.131 | 0.010 | 13.674 | 0.966 | 0.577 | 0.091 | 23.7 |
| 23-AC-55 | Pegmatite outcrop #3, CLP Outcrop Area 3 | Y | NK | NK | 0.489 | 0.038 | 10.678 | 0.509 | 0.560 | 0.039 | 19.1 |
| 22-AC-123 | Pegmatite #1, Outcrop Area 4 | Y | NK | NK | 0.158 | 0.024 | 10.465 | 1.013 | 0.445 | 0.066 | 23.5 |
| 22-AC-124 | Pegmatite #2, Outcrop Area 4 | Y | NK | NK | 0.185 | 0.040 | 10.643 | 0.899 | 0.452 | 0.057 | 23.5 |
| 22-AC-125 | Pegmatite #3, Outcrop Area 4 | Y | NK | NK | 0.116 | 0.024 | 10.826 | 0.809 | 0.537 | 0.053 | 20.2 |
| 22-AC-126 | Pegmatite #4, Outcrop Area 4 | Y | NK | NK | 0.265 | 0.041 | 10.426 | 0.849 | 0.467 | 0.059 | 22.3 |
| 22-AC-127 | Pegmatite #6, Outcrop Area 4 | Y | NK | NK | 0.149 | 0.027 | 11.218 | 1.066 | 0.467 | 0.073 | 24.0 |
| 22-AC-128 | Pegmatite #6.5, Outcrop Area 4 | Y | NK | NK | 0.059 | 0.011 | 11.340 | 0.746 | 0.571 | 0.062 | 19.9 |
| 23-AC-22 | Pegmatite dike #1, Outcrop Area 4 | Y | NA | NA | 0.134 | 0.026 | 12.257 | 1.261 | 0.563 | 0.076 | 21.8 |
| 23-AC-23 | Pegmatite dike #2, Outcrop Area 4 | Y | NA | NA | 0.062 | 0.013 | 10.669 | 0.869 | 0.507 | 0.075 | 21.0 |
| 23-AC-31 | Pegmatite dike #3, Outcrop Area 4 | N | NA | NA | 0.094 | 0.020 | 10.724 | 0.597 | 0.366 | 0.039 | 29.3 |
| 23-AC-32 | Pegmatite dike #4, Outcrop Area 4 | N | NA | NA | 0.114 | 0.043 | 12.039 | 0.668 | 0.391 | 0.049 | 30.8 |
| 23-AC-33 | Pegmatite outcrop with large mica books, Outcrop Area 4 | Y | NA | NA | 0.182 | 0.060 | 12.319 | 1.889 | 0.535 | 0.093 | 23.0 |
Appendix D
Compositional comparison of CLP drill cores 21-BD-529 (top) and 21-BD-531 (bottom).
| Drill Core 21-BD-529 | |||||
| Qz-Fsp Pegmatite | Spd-Pegmatite | Altered Pegmatite | Granite | Amphibolite | |
| (wt. %) | n = 4 SiO2 = 69.1–73.8 | n = 6 SiO2 = 70.4–73.0 | n = 7 SiO2 = 69.1–73.8 | n = 4 SiO2 = 71.1–76.5 | n = 4 SiO2 = 70.7–73.5 |
| SiO2 | 72.47 ± 2.53 | 72.08 ± 0.84 | 73.51 ± 1.12 | 73.53 ± 1.32 | 72.73 ± 1.33 |
| Al2O3 | 15.04 ± 1.17 | 15.61 ± 0.59 | 15.06 ± 0.44 | 14.39 ± 0.47 | 15.13 ± 0.96 |
| Fe2O3 | 1.18 ± 0.20 | 0.81 ± 0.23 | 1.16 ± 0.24 | 1.58 ± 0.33 | 1.09 ± 0.41 |
| MgO | 0.12 ± 0.05 | 0.05 ± 0.02 | 0.12 ± 0.06 | 0.27 ± 0.14 | 0.17 ± 0.09 |
| CaO | 0.92 ± 0.53 | 1.37 ± 0.37 | 0.67 ± 0.27 | 1.08 ± 0.47 | 0.92 ± 0.39 |
| Na2O | 3.89 ± 1.86 | 2.51 ± 0.82 | 3.62 ± 1.51 | 3.80 ± 0.89 | 4.11 ± 1.38 |
| K2O | 4.38 ± 1.35 | 5.25 ± 0.87 | 4.50 ± 0.81 | 3.52 ± 0.33 | 4.22 ± 1.38 |
| MnO | 0.12 ± 0.03 | 0.11 ± 0.03 | 0.10 ± 0.06 | 0.03 ± 0.01 | 0.06 ± 0.03 |
| P2O5 | 0.32 ± 0.03 | 0.30 ± 0.19 | 0.28 ± 0.03 | 0.27 ± 0.05 | 0.27 ± 0.04 |
| Li (ppm) | 50 ± 16 | 990 ± 764 | 61 ± 24 | 87 ± 27 | nd |
| Be (ppm) | 39 ± 26 | 158 ± 81 | 18 ± 10 | 9 ± 4 | nd |
| Ga (ppm) | 19 ± 1 | 26 ± 2 | 18 ± 2 | 18 ± 1 | nd |
| Rb (ppm) | 343 ± 145 | 504 ± 173 | 234 ± 89 | 171 ± 30 | nd |
| Cs (ppm) | 16 ± 5 | 34 ± 16 | 10 ± 3 | 11 ± 2 | nd |
| K/Rb | 94 ± 30 | 42 ± 5 | 128 ± 21 | 183 ± 23 | nd |
| Drill Core 21-BD-531 | |||||
| Saprolite | Qz-Fsp Pegmatite | Spd-Pegmatite | Granite | Amphibolite | |
| (wt. %) | n = 3 SiO2 = 74.6–76.3 | n = 24 SiO2 = 66.7–89.9 | n = 5 SiO2 = 72.4–74.1 | n = 22 SiO2 = 71.0–84.5 | n = 2 SiO2 = 51.2–51.4 |
| SiO2 | 75.62 ± 0.92 | 74.49 ± 4.40 | 73.57 ± 0.71 | 75.01 ± 2.48 | 51.75 ± 0.92 |
| Al2O3 | 13.85 ± 0.59 | 14.67 ± 2.36 | 15.44 ± 0.56 | 14.27 ± 1.62 | 18.66 ± 0.11 |
| Fe2O3 | 1.34 ± 0.17 | 1.13 ± 0.61 | 1.06 ± 0.28 | 1.13 ± 0.25 | 10.49 ± 0.06 |
| MgO | 0.25 ± 0.01 | 0.18 ± 0.18 | 0.10 ± 0.05 | 0.19 ± 0.10 | 3.94 ± 0.62 |
| CaO | 0.30 ± 0.15 | 0.64 ± 0.49 | 0.67 ± 0.31 | 0.54 ± 0.28 | 6.14 ± 1.07 |
| Na2O | 2.27 ± 0.28 | 4.86 ± 1.00 | 4.23 ± 1.67 | 4.42 ± 0.90 | 2.06 ± 0.31 |
| K2O | 4.40 ± 0.23 | 2.86 ± 1.13 | 2.90 ± 1.82 | 3.36 ± 0.85 | 2.05 ± 0.54 |
| MnO | 0.02 ± 0.01 | 0.09 ± 0.06 | 0.14 ± 0.07 | 0.05 ± 0.04 | 0.24 ± 0.02 |
| P2O5 | 0.15 ± 0.09 | 0.32 ± 0.14 | 0.25 ± 0.06 | 0.30 ± 0.07 | 0.36 ± 0.03 |
| Li (ppm) | 87 ± 4 | 125 ± 68 | 3893 ± 2492 | 134 ± 77 | nd |
| Be (ppm) | 125 ± 68 | 24 ± 26 | 122 ± 54 | 13 ± 8 | nd |
| Ga (ppm) | 16 ± 0.3 | 19 ± 5 | 28 ± 3 | 25 ± 21 | nd |
| Rb (ppm) | 219 ± 9 | 302 ± 172 | 617 ± 235 | 276 ± 123 | nd |
| Cs | 10 ± 1 | 27 ± 16 | 69 ± 17 | 23 ± 16 | nd |
| K/Rb | 21 ± 2 | 84 ± 24 | 43 ± 6 | 105 ± 24 | nd |
References
- Kesler, S.E.; Gruber, P.W.; Medina, P.A.; Keoleian, G.A.; Everson, M.P.; Wallington, T.J. Global lithium resources: Relative importance of pegmatite, brine and other deposits. Ore Geol. Rev. 2012, 48, 55–69. [Google Scholar] [CrossRef]
- Bowell, R.J.; Lagos, L.; de los Hoyos, C.R.; Declercq, J. Classification and characteristics of natural lithium resources. Elements 2020, 16, 259–264. [Google Scholar] [CrossRef]
- USGS. Mineral Commodity Summaries 2023; US Geological Survey: Reston, VA, USA, 2023; p. 214.
- Geoscience Australia, Australian Critical Minerals Prospectus; Australian Trade and Investment Commission, Department of Industry, Science, Energy and Resources: Canberra, Australia, 2022; p. 82.
- Tabelin, C.B.; Dallas, J.; Casanova, S.; Pelech, T.; Bournival, G.; Saydam, S.; Canbulat, I. Towards a low-carbon society: A review of lithium resource availability, challenges and innovations in mining, extraction and recycling, and future perspectives. Miner. Eng. 2021, 163, 106743. [Google Scholar] [CrossRef]
- World Bank. Minerals for Climate Action: The Mineral Intensity of the Clean Energy Transition; World Bank Report: Washington, DC, USA, 2020; p. 110. [Google Scholar]
- Jolliff, B.; Papike, J.; Shearer, C. Fractionation trends in mica and tourmaline as indicators of pegmatite internal evolution: Bob Ingersoll pegmatite, Black Hills, South Dakota. Geochim. Et Cosmochim. Acta 1987, 51, 519–534. [Google Scholar] [CrossRef]
- Selway, J.; Breaks, F.; Tindle, A. A review of rare- element (Li-Cs-Ta) pegmatite exploration techniques for the Superior Province, Canada, and large worldwide tantalum deposits. Explor. Min. Geol. 2005, 14, 1–30. [Google Scholar] [CrossRef]
- Martins, T.; Roda-Robles, E.; Lima, A.; De Parseval, P. Geochemistry and evolution of micas in the Barroso-Alvaõ Pegmatite Field, Northern Portugal. Can. Mineral. 2012, 50, 1117–1129. [Google Scholar] [CrossRef]
- Hulsbosch, N.; Hertogen, J.; Dewaele, S.; André, L.; Muchez, P. Alkali metal and rare earth element evolution of rock-forming minerals from the Gatumba area pegmatites (Rwanda): Quantitative assessment of crystal-melt fractionation in the regional zonation of pegmatite groups. Geochim. Et Cosmochim. Acta 2014, 132, 349–374. [Google Scholar] [CrossRef]
- Černý, P.; Meintzer, R.E.; Anderson, A.J. Extreme fractionation in rare-element granitic pegmatites: Selected examples of data and mechanisms. Can. Mineral. 1985, 23, 381–421. [Google Scholar]
- Trueman, D.L.; Černý, P. Exploration for rare-element pegmatites. In Granitic Pegmatites in Science and Industry; Short Course Handbook; Černý, P., Ed.; Mineralogical Association of Canada: Winnipeg, Canada, 1982; Volume 8, pp. 463–493. [Google Scholar]
- Černý, P.; Burt, D. Paragenesis, crystallochemical characteristics, and geochemical evolution of the micas in granite pegmatites. Rev. Mineral. 1984, 13, 257–297. [Google Scholar]
- Smeds, S.-A. Trace elements in potassium-feldspar and muscovite as a guide in the prospecting for lithium- and tin-bearing pegmatites in Sweden. J. Geochem. Explor. 1992, 42, 351–369. [Google Scholar] [CrossRef]
- Beurlen, H.; Thomas, R.; da Silva, M.R.R.; Müller, A.; Rhede, D.; Soares, D.R. Perspectives for Li- and Ta-mineralization in the Borborema Pegmatite Province, NE-Brazil: A review. J. South Am. Earth Sci. 2014, 56, 110–127. [Google Scholar] [CrossRef]
- Maneta, V.; Baker, D.R. The potential of lithium in alkali feldspars, quartz, and muscovite as a geochemical indicator in the exploration for lithium-rich granitic pegmatites: A case study from the spodumene-rich Moblan pegmatite, Quebec, Canada. J. Geochem. Explor. 2019, 205, 106336. [Google Scholar] [CrossRef]
- Wise, M.A.; Harmon, R.S.; Curry, A.; Jennings, M.; Grimac, Z.; Khashchevskaya, D. Handheld LIBS for Li exploration: An example from the Carolina Tin-Spodumene Belt, USA. Minerals 2022, 12, 77. [Google Scholar] [CrossRef]
- Kish, S.A.; Fullagar, P.D. Age and magmatic association of rare metal pegmatites; spodumene pegmatites, Kings Mountain, NC and Sn–Ta pegmatites, Rockford, Ala. Geol. Soc. Am. Abstr. Programs 1996, 28, A475. [Google Scholar]
- Kesler, T.L. The Tin-Spodumene Belt of the Carolinas: A Preliminary Report; US Geological Survey Report 936; United States Goverment Printing Office: Washington, DC, USA, 1942; p. 269.
- Kish, S.A. Geochronology of plutonic activity in the Inner Piedmont and Kings Mountain belt in North Carolina. In Field Guides for Geological Society of America, Southeastern Section Meeting, Winston-Salem, North Carolina; Burt, E.R., Ed.; North Carolina Department of Natural and Economic Resources: Raleigh, NC, USA, 1977; pp. 144–149. [Google Scholar]
- Kesler, T.L. The Kings Mountain area. In Guides to Southeastern Geology; Field Trip Guidebook; Russell, R.J., Ed.; Geological Society of America: Boulder, CO, USA, 1955; pp. 374–387. [Google Scholar]
- Luster, G.R. Lithologic Variability of the Kings Mountain Pegmatite, North Carolina. Master’s Thesis, Pennsylvania State University, University Park, PA, USA, 1977. [Google Scholar]
- Horton, J.W. Shear zone between the Inner Piedmont and Kings Mountain belts in the Carolinas. Geology 1981, 9, 28–33. [Google Scholar] [CrossRef]
- Hodges, R.A. A Petrologic Study of the Lithium Corporation of America Mine in the Tin–Spodumene Belt of North Carolina. Master’s Thesis, University of North Carolina, Chapel Hill, NC, USA, 1983. [Google Scholar]
- Kesler, T.L. Raw lithium supplies. Min. Eng. 1978, 30, 283–285. [Google Scholar]
- Kesler, T.L. Occurrence, development, and long-range outlook of lithium-pegmatite ore in the Carolinas. In Lithium Resources and Requirements by the Year 2000; U.S. Geological Survey Professional Paper; Vine, J.D., Ed.; Superintendent of Documents; U.S. Government Printing Office: Washington, DC, USA, 1976; pp. 45–50. [Google Scholar]
- Černý, P.; London, D.; Novák, M. Granitic pegmatites as reflections of their sources. Elements 2012, 8, 289–294. [Google Scholar] [CrossRef]
- Černý, P. Geochemical and petrogenetic features of mineralization in rare-element granitic pegmatites in the light of current research. Appl. Geochem. 1992, 7, 93–416. [Google Scholar]
- Wise, M.A.; Müller, A.; Simmons, W.B. A proposed new mineralogical classification system for granitic pegmatites. Can. Mineral. 2022, 60, 229–248. [Google Scholar] [CrossRef]
- Griffitts, W.R.; Overstreet, W.C. Granitic rocks of the western Carolina Piedmont. Am. J. Sci. 1952, 250, 777–789. [Google Scholar] [CrossRef]
- White, J.S. Mineralogy of the Foote Mine, Kings Mountain, North Carolina. In Geological Investigations of the Kings Mountain Belt and Adjacent Areas in the Carolinas; Carolina Geological Society Field Trip Guidebook; Horton, J.W., Butler, J.R., Milton, D.M., Eds.; South Carolina Geological Survey: Columbia, SC, USA, 1981; pp. 39–48. [Google Scholar]
- Marble, L.; Hanahan, J. The Foote minerals the Foote Quarry in Kings Mountain, North Carolina is one of the premier micromount localities. Rocks Miner. 1978, 53, 158–173. [Google Scholar] [CrossRef]
- Hanahan, J. The Foote Quarry, King Mountain, North Carolina revisited 1984. Rocks Miner. 1984, 60, 76–82. [Google Scholar] [CrossRef]
- Swanson, S.E. Mineralogy of spodumene pegmatites and related rocks in the tin–spodumene belt of North Carolina and South Carolina, USA. Can. Mineral. 2012, 50, 1589–1608. [Google Scholar] [CrossRef]
- Piedmont Lithium. Technical Report Summary of a Definitive Feasibility Study of the Carolina Lithium Project in North Carolina, 18605-REP-GE-002; Piedmont Lithium Ltd.: Belmont, NC, USA, 2022; p. 232. [Google Scholar]
- Griffitts, W.R. Beryllium Resources of the Tin-Spodumene Belt of North Carolina; U.S. Geological Survey Circular: Washington, DC, USA, 1954; Volume 309, p. 12.
- Kesler, T.L. Exploration of the Kings Mountain pegmatites. Miner. Eng. 1961, 13, 1062–1068. [Google Scholar]
- Russo, R.E.; Mao, X.; Yoo, J.H.; Gonzalez, J. Laser ablation. In Laser-Induced Breakdown Spectroscopy; Singh, J.P., Thakur, S.N., Eds.; Elsevier: Amsterdam, The Netherlands, 2008; pp. 49–82. [Google Scholar]
- Connors, B.; Somers, A.; Day, D. Application of handheld laser-induced breakdown spectroscopy (LIBS) to geochemical analysis. Appl. Spectrosc. 2016, 70, 810–815. [Google Scholar] [CrossRef]
- Sweetapple, M.T.; Tassios, S. Laser-induced breakdown spectroscopy (LIBS) as a tool for in situ mapping and textural interpretation of lithium in pegmatite minerals. Am. Mineral. 2015, 100, 2141–2151. [Google Scholar] [CrossRef]
- Romppanen, S.; Pölönen, I.; Häkkänen, H.; Kaski, S. Optimization of spodumene identification by statistical approach for laser-induced breakdown spectroscopy data of lithium pegmatite ores. Appl. Spectrosc. Rev. 2021, 58, 297–317. [Google Scholar] [CrossRef]
- Ribeiro, R.; Capela, D.; Ferreira, M.; Martins, R.; Jorge, P.; Guimarães, D.; Lima, A. X-ray fluorescence and laser-induced breakdown spectroscopy analysis of Li-rich minerals in veins from Argemela Tin Mine, central Portugal. Minerals 2021, 11, 1169. [Google Scholar] [CrossRef]
- Müller, S.; Meima, J.A. Mineral classification of lithium-bearing pegmatites based on laser-induced breakdown spectroscopy: Application of semi-supervised learning to detect known minerals and unknown material. Spectrochim. Acta Part B At. Spectrosc. 2022, 189, 106370. [Google Scholar] [CrossRef]
- Rifai, K.; Constantin, M.; Yilmaz, A.; Özcan, L.Ç.; Doucet, F.R.; Azami, N. Quantification of lithium and mineralogical mapping in crushed ore samples using laser induced breakdown spectroscopy. Minerals 2022, 12, 253. [Google Scholar] [CrossRef]
- Fabre, C.; Ourti, N.E.; Mercadier, J.; Cardoso-Fernandes, J.; Dias, F.; Perrotta, M.; Koerting, F.; Lima, A.; Kaestner, F.; Koellner, N.; et al. Analyses of Li-rich minerals using handheld LIBS tool. Data 2021, 6, 68. [Google Scholar] [CrossRef]
- Fabre, C.; Ourti, N.E.; Ballouard, C.; Mercadier, J.; Cauzid, J. Handheld LIBS analysis for in situ quantification of Li and detection of the trace elements (Be, Rb and Cs). J. Geochem. Explor. 2022, 236, 106979. [Google Scholar] [CrossRef]
- Harmon, R.S.; Lawley, C.; Watts, J.; Harraden, C.L.; Somers, A.M.; Hark, R.R. Laser-induced breakdown spectroscopy—An emerging analytical tool for mineral exploration. Minerals 2019, 9, 718. [Google Scholar] [CrossRef]
- Dias, F.; Ribeiro, R.; Gonçalves, F.; Lima, A.; Roda-Robles, E.; Martins, T. Calibrating a Handheld LIBS for Li Exploration in the Barroso–Alvāo Aplite-Pegmatite Field, Northern Portugal: Textural Precautions and Procedures When Analyzing Spodumene and Petalite. Minerals 2023, 13, 470. [Google Scholar] [CrossRef]
- Tischendorf, G.; Forster, H.J.; Gottesmann, B.; Rieder, M. True and brittle micas: Composition and solid-solution series. Mineral. Mag. 2007, 71, 285–320. [Google Scholar] [CrossRef]
- Piedmont Lithium. Core logging procedures for Piedmont Lithium Beaverdam Project. In Core Logging Manual Internal Technical Report; Piedmont Lithium Ltd.: Belmont, NC, USA, 2017; p. 16. [Google Scholar]
- Černý, P.; Ercit, T.S. The classification of granitic pegmatites revisited. Can. Mineral. 2005, 43, 2005–2026. [Google Scholar] [CrossRef]
- Sundelius, H.W. The Peg claims spodumene pegmatites, Maine. Econ. Geol. 1963, 58, 84–106. [Google Scholar] [CrossRef]
- Chackowsky, L.E. Mineralogy, Geochemistry and Petrology of Pegmatitic Granites and Pegmatites at Red Sucker Lake, Northeastern Manitoba. Master’s Thesis, University of Manitoba, Winnipeg, MB, Canada, 1983. [Google Scholar]
- Burnham, C.W.; Jahns, R.H. A method for determining the solubility of water in silicate melts. Am. J. Sci. 1962, 260, 721–745. [Google Scholar] [CrossRef]
- Stilling, A.; Černý, P.; Vanstone, P.J. The Tanco pegmatite at Bernic Lake, Manitoba. XVI. Zonal and bulk compositions and their petrogenetic significance. Can. Mineral. 2006, 44, 599–623. [Google Scholar] [CrossRef]
- Ashworth, L.; Kinnaird, J.A.; Nex, P.A.M.; Harris, C.; Müller, A.B. Origin of rare-element-mineralized Damara Belt pegmatites: A geochemical and light stable isotope study. Lithos 2020, 372, 105655. [Google Scholar] [CrossRef]
- Simmons, W.; Falster, A.; Webber, K.; Roda-Robles, E.; Boudreaux, A.P.; Grassi, L.R.; Freeman, G. Bulk composition of Mt. Mica pegmatite, Maine, USA: Implications for the origin of an LCT type pegmatite by anatexis. Can. Mineral. 2016, 54, 1053–1070. [Google Scholar] [CrossRef]
- Antunes, I.M.H.R.; Neiva, A.M.R.; Ramos, J.M.F.; Silva, P.B.; Silva, M.M.V.G.; Corfu, F. Petrogenetic links between lepidolite-subtype aplite-pegmatite, aplite veins and associated granites at Segura (central Portugal). Geochemistry 2013, 73, 323–341. [Google Scholar] [CrossRef]
- Brewer, E.O. Soil Survey of Catawba County, North Carolina; US Department of Agriculture, Soil Conservation Service: Washington, DC, USA, 1975; p. 47. [Google Scholar]
- Roda Robles, E.; Pesquera Perez, A.; Velasco Roldán, F. Micas of the muscovite-lepidolite series from the Fregeneda pegmatites (Salamanca, Spain). Mineral. Petrol. 1995, 55, 145–157. [Google Scholar] [CrossRef]
- Pesquera, A.; Torres-Ruiz, J.; Gil-Crespo, P.P.; Velilla, N. Chemistry and genetic implications of tourmaline and Li-F-Cs micas from the Valdeflores area (Caceres, Spain). Am. Mineral. 1999, 84, 55–69. [Google Scholar] [CrossRef]
- Shaw, D.M. A review of K-Rb fractionation trends by covariance analysis. Geochim. Cosmochim. Acta 1968, 32, 573–601. [Google Scholar] [CrossRef]
- Foord, E.E.; Černý, P.; Jackson, L.L.; Sherman, D.M.; Eby, R.K. Mineralogical and geochemical evolution of micas from miarolitic pegmatites of the anorogenic Pikes Peak batholith, Colorado. Mineral. Petrol. 1995, 55, 1–26. [Google Scholar] [CrossRef]
- Wise, M.A. Trace element chemistry of lithium-rich micas from rare-element granitic pegmatites. Mineral. Petrol. 1995, 55, 203–215. [Google Scholar] [CrossRef]
- Roda, E.; Keller, P.; Pesquera, A.; Fontan, F. Micas of the muscovite–lepidolite series from Karibib pegmatites, Namibia. Mineral. Mag. 2007, 71, 41–62. [Google Scholar] [CrossRef]
- Steiner, B.M. Tools and workflows for grassroots Li–Cs–Ta (LCT) pegmatite exploration. Mineral 2019, 20, 499. [Google Scholar] [CrossRef]
- Xing, C.M.; Wang, C.Y.; Wang, H. Magmatic-hydrothermal processes recorded by muscovite and columbite-group minerals from the Bailongshan rare-element pegmatites in the West Kunlun-Karakorum orogenic belt, NW China. Lithos 2020, 364, 105507. [Google Scholar] [CrossRef]
- Barros, R.; Kaeter, D.; Menuge, J.F.; Škoda, R. Controls on chemical evolution and rare element enrichment in crystallising albite-spodumene pegmatite and wallrocks: Constraints from mineral chemistry. Lithos 2020, 352, 105289. [Google Scholar] [CrossRef]
- Jolliff, B.L.; Papike, J.J.; Shearer, C.K. Petrogenetic relationships between pegmatite and granite based on geochemistry of muscovite in pegmatite wall zones, Black Hills, South Dakota, USA. Geochim. Et Cosmochim. Acta 1992, 56, 1915–1939. [Google Scholar] [CrossRef]
- Van Lichtervelde, M.; Grégoire, M.; Linnen, R.L.; Béziat, D.; Salvi, S. Trace element geochemistry by laser ablation ICP-MS of micas associated with Ta mineralization in the Tanco pegmatite, Manitoba, Canada. Contrib. Mineral. Petrol. 2008, 155, 791–806. [Google Scholar] [CrossRef]
- Shaw, R.; British Geological Survey, Environmental Science Centre, Nicker Hill, Keyworth, Nottingham NG12 5GG, UK. Personal communication, 2023.
- Serrano, J. Origine des Pegmatites du Cap de Creus: Approche Intégrée de Terrain, Pétrologie et Géochimie. Ph.D. Thesis, Université Paul Sabatier-Toulouse III, Toulouse, France, 2019. [Google Scholar]
- Anderson, A. The Geochemistry, Mineralogy and Petrology of the Cross Lake Pegmatite Field, Central Manitoba. Master’s Thesis, University of Manitoba, Winnipeg, MB, Canada, 1984. [Google Scholar]
- Meintzer, R.E. The Mineralogy and Geochemistry of the Granitoid Rocks and Related Pegmatites of the Yellowknife Pegmatite Field, Northwest Territories. Ph.D. Thesis, University of Manitoba, Winnipeg, MB, Canada, 1987. [Google Scholar]
Figure 1.
Carolina Tin-Spodumene Belt (green) showing the Kings Mountain Shear Zone (orange) along with the locations of the Kings Mountain Mine, the Hallman Beam Min, and Piedmont Lithium’s Carolina Lithium Project (CLP) prospect, which has an estimated reserve of 44.2 Mt at 1.08 wt. % Li2O. The white star indicates the locations of the two drill cores that are a particular focus of this study.

Figure 2.
Idealized schematic geological section in the area of the CLP (after [35]).
Figure 2.
Idealized schematic geological section in the area of the CLP (after [35]).

Figure 3.
Representative LIBS spectra for a CLP muscovite sample showing emission lines for the elements of interest to this study (red arrows, brackets, and text), the Ar peaks in the infrared portion of the spectrum between 700 and 870 from the Ar purge gas used for the analysis (grey brackets and text), and other elements (black arrows and text).

Figure 4.
Handheld LIBS calibration curves developed for muscovite using the muscovite reference samples listed in Appendix A: (a) initial calibration curve for Li developed in the autumn of 2022, refined calibration curve for Li (b), and calibration curves for K (c) and Rb (d) developed in March 2023.

Figure 5.
Plot of Mg-Li versus (Fe+Mn+Ti)- AlVI according to Tischendorf et al. [49] for micas from the Carolina Tin-Spodumene Pegmatite Belt. Black squares represent ideal end-member compositions of annite (Ann), eastonite (Eas), muscovite (Mus), phengite (Phe), phlogopite (Phl), polylithionite (Pol), siderophyllite (Sid), trilithionite (Tri), and zinnwaldite (Zin). Respective compositional ranges for mica from the CTSB, CLP, and CLP drill cores 21-BD-529 and 21-BD-531 are shown by the red, blue, and green outlined fields.

Figure 6.
Photographs showing the textural character and mineralogy of selected portions of CLP cores 21-BD-529 and 21-BD-531. Bt = biotite, Fsp = feldspar, Grt = garnet, Ms = muscovite, Qz = quartz, Spd = spodumene.
Figure 6.
Photographs showing the textural character and mineralogy of selected portions of CLP cores 21-BD-529 and 21-BD-531. Bt = biotite, Fsp = feldspar, Grt = garnet, Ms = muscovite, Qz = quartz, Spd = spodumene.

Figure 7.
Depth profiles and logging descriptions of CLP drill cores 21-BD-529 (a) and 21-BD-531 (b). Abbreviations as follows: rocks—SAP = saprolite, PEG = pegmatite, SPEG = spodumene-bearing pegmatite, ALTSPEG = altered spodumene-bearing pegmatite, GRAN = granite, AMP = amphibolite; minerals—Qz = quartz, Fsp = feldspar (undifferentiated), Kfs = potassium feldspar, Bt = biotite, Grt = garnet, Ms = muscovite, Tur = tourmaline, Spd = spodumene; Texture—FG = fine grained, MG = medium grained, CG = coarse grained, VCG = very coarse grained.


Figure 8.
Photograph of a section of drill core 19-CT-014 that is representative of the highly fractionated and mineralized pegmatites of the CLP. This zone between 103 and 104 m depth contains columbite, apatite (not shown), tabular spodumene, and muscovite with 0.29 wt. % Li and a K/Rb ratio of 8.7.

Figure 9.
Distribution of Li abundances (a,b) and K/Rb ratios (c,d) in 65 muscovites from Spd-bearing pegmatites (Li = 0.059–0.739 wt. %, average = 0.210 ± 0.119 wt. %) and 64 muscovites from Qz-Fsp pegmatites (Li = 0.036–0.376 wt. %, average = 0.146 ± 0.095 wt. %) across the CTSB.
Figure 9.
Distribution of Li abundances (a,b) and K/Rb ratios (c,d) in 65 muscovites from Spd-bearing pegmatites (Li = 0.059–0.739 wt. %, average = 0.210 ± 0.119 wt. %) and 64 muscovites from Qz-Fsp pegmatites (Li = 0.036–0.376 wt. %, average = 0.146 ± 0.095 wt. %) across the CTSB.

Figure 10.
Plots of K/Rb versus Li for muscovite from pegmatites of the CTSB (a), CLP (b), and CLP drill cores (c) analyzed in this study by handheld LIBS. Symbols containing an ‘x’ denote spodumene-bearing pegmatites.
Figure 10.
Plots of K/Rb versus Li for muscovite from pegmatites of the CTSB (a), CLP (b), and CLP drill cores (c) analyzed in this study by handheld LIBS. Symbols containing an ‘x’ denote spodumene-bearing pegmatites.


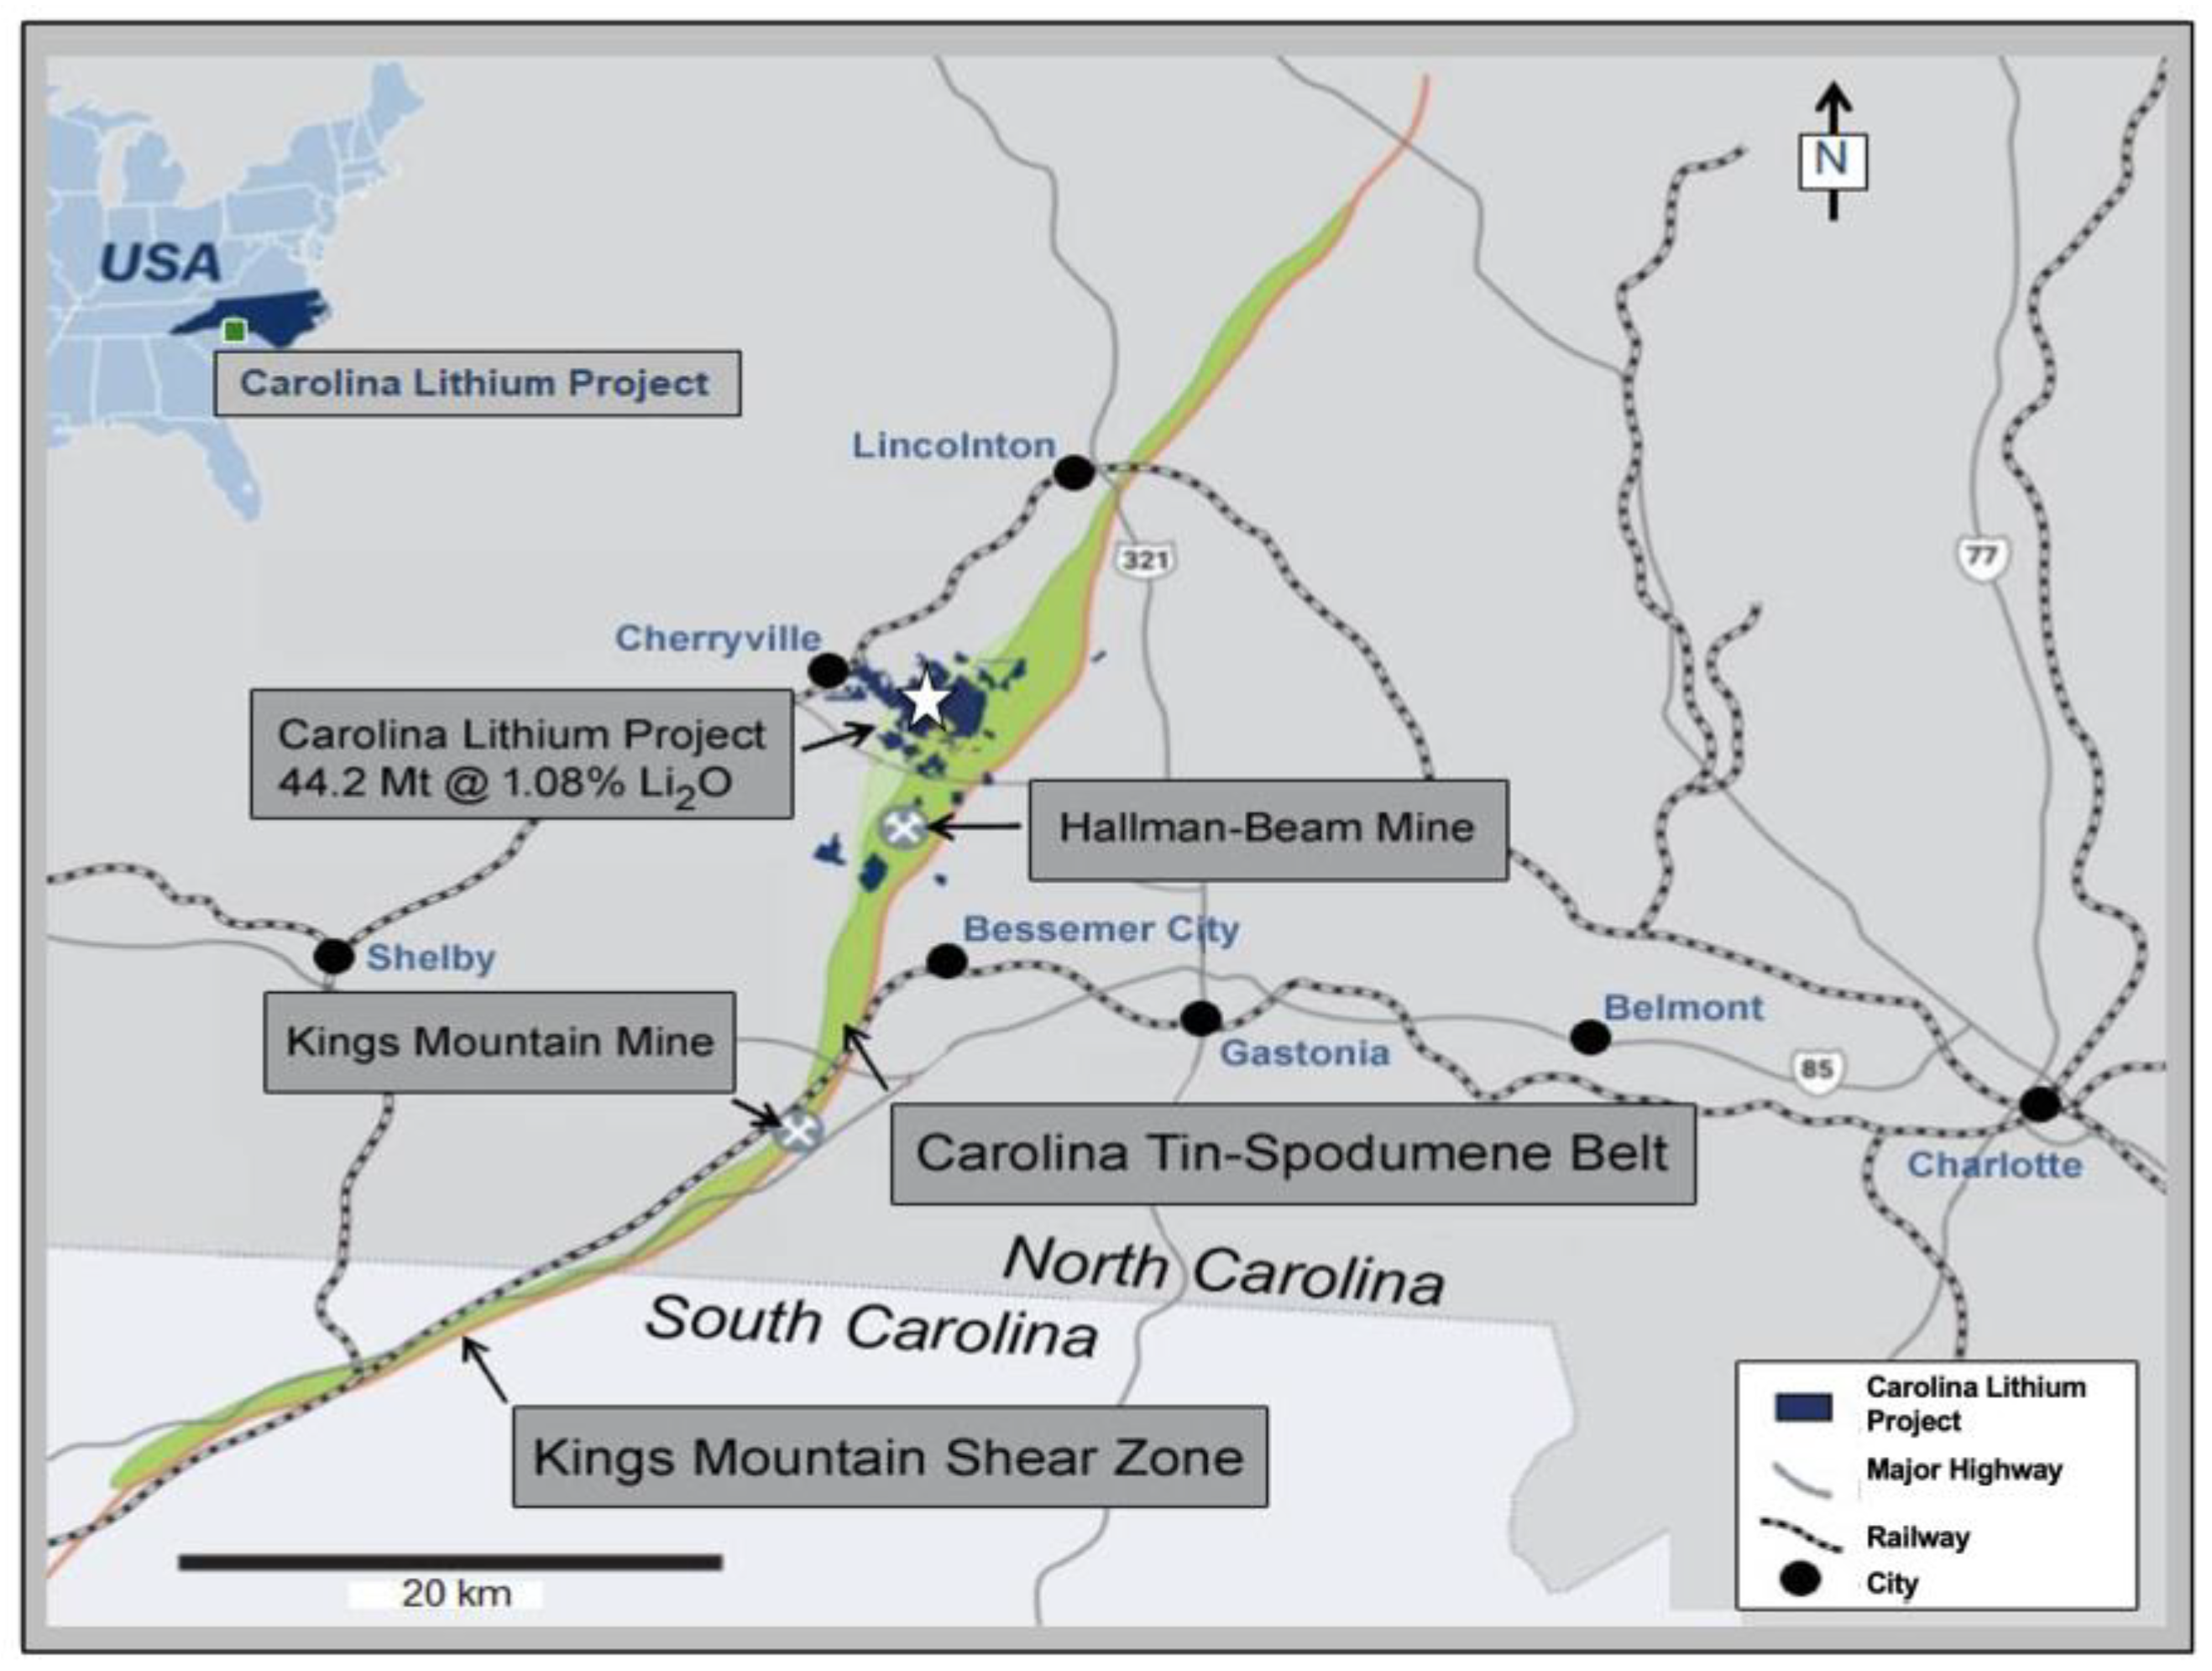
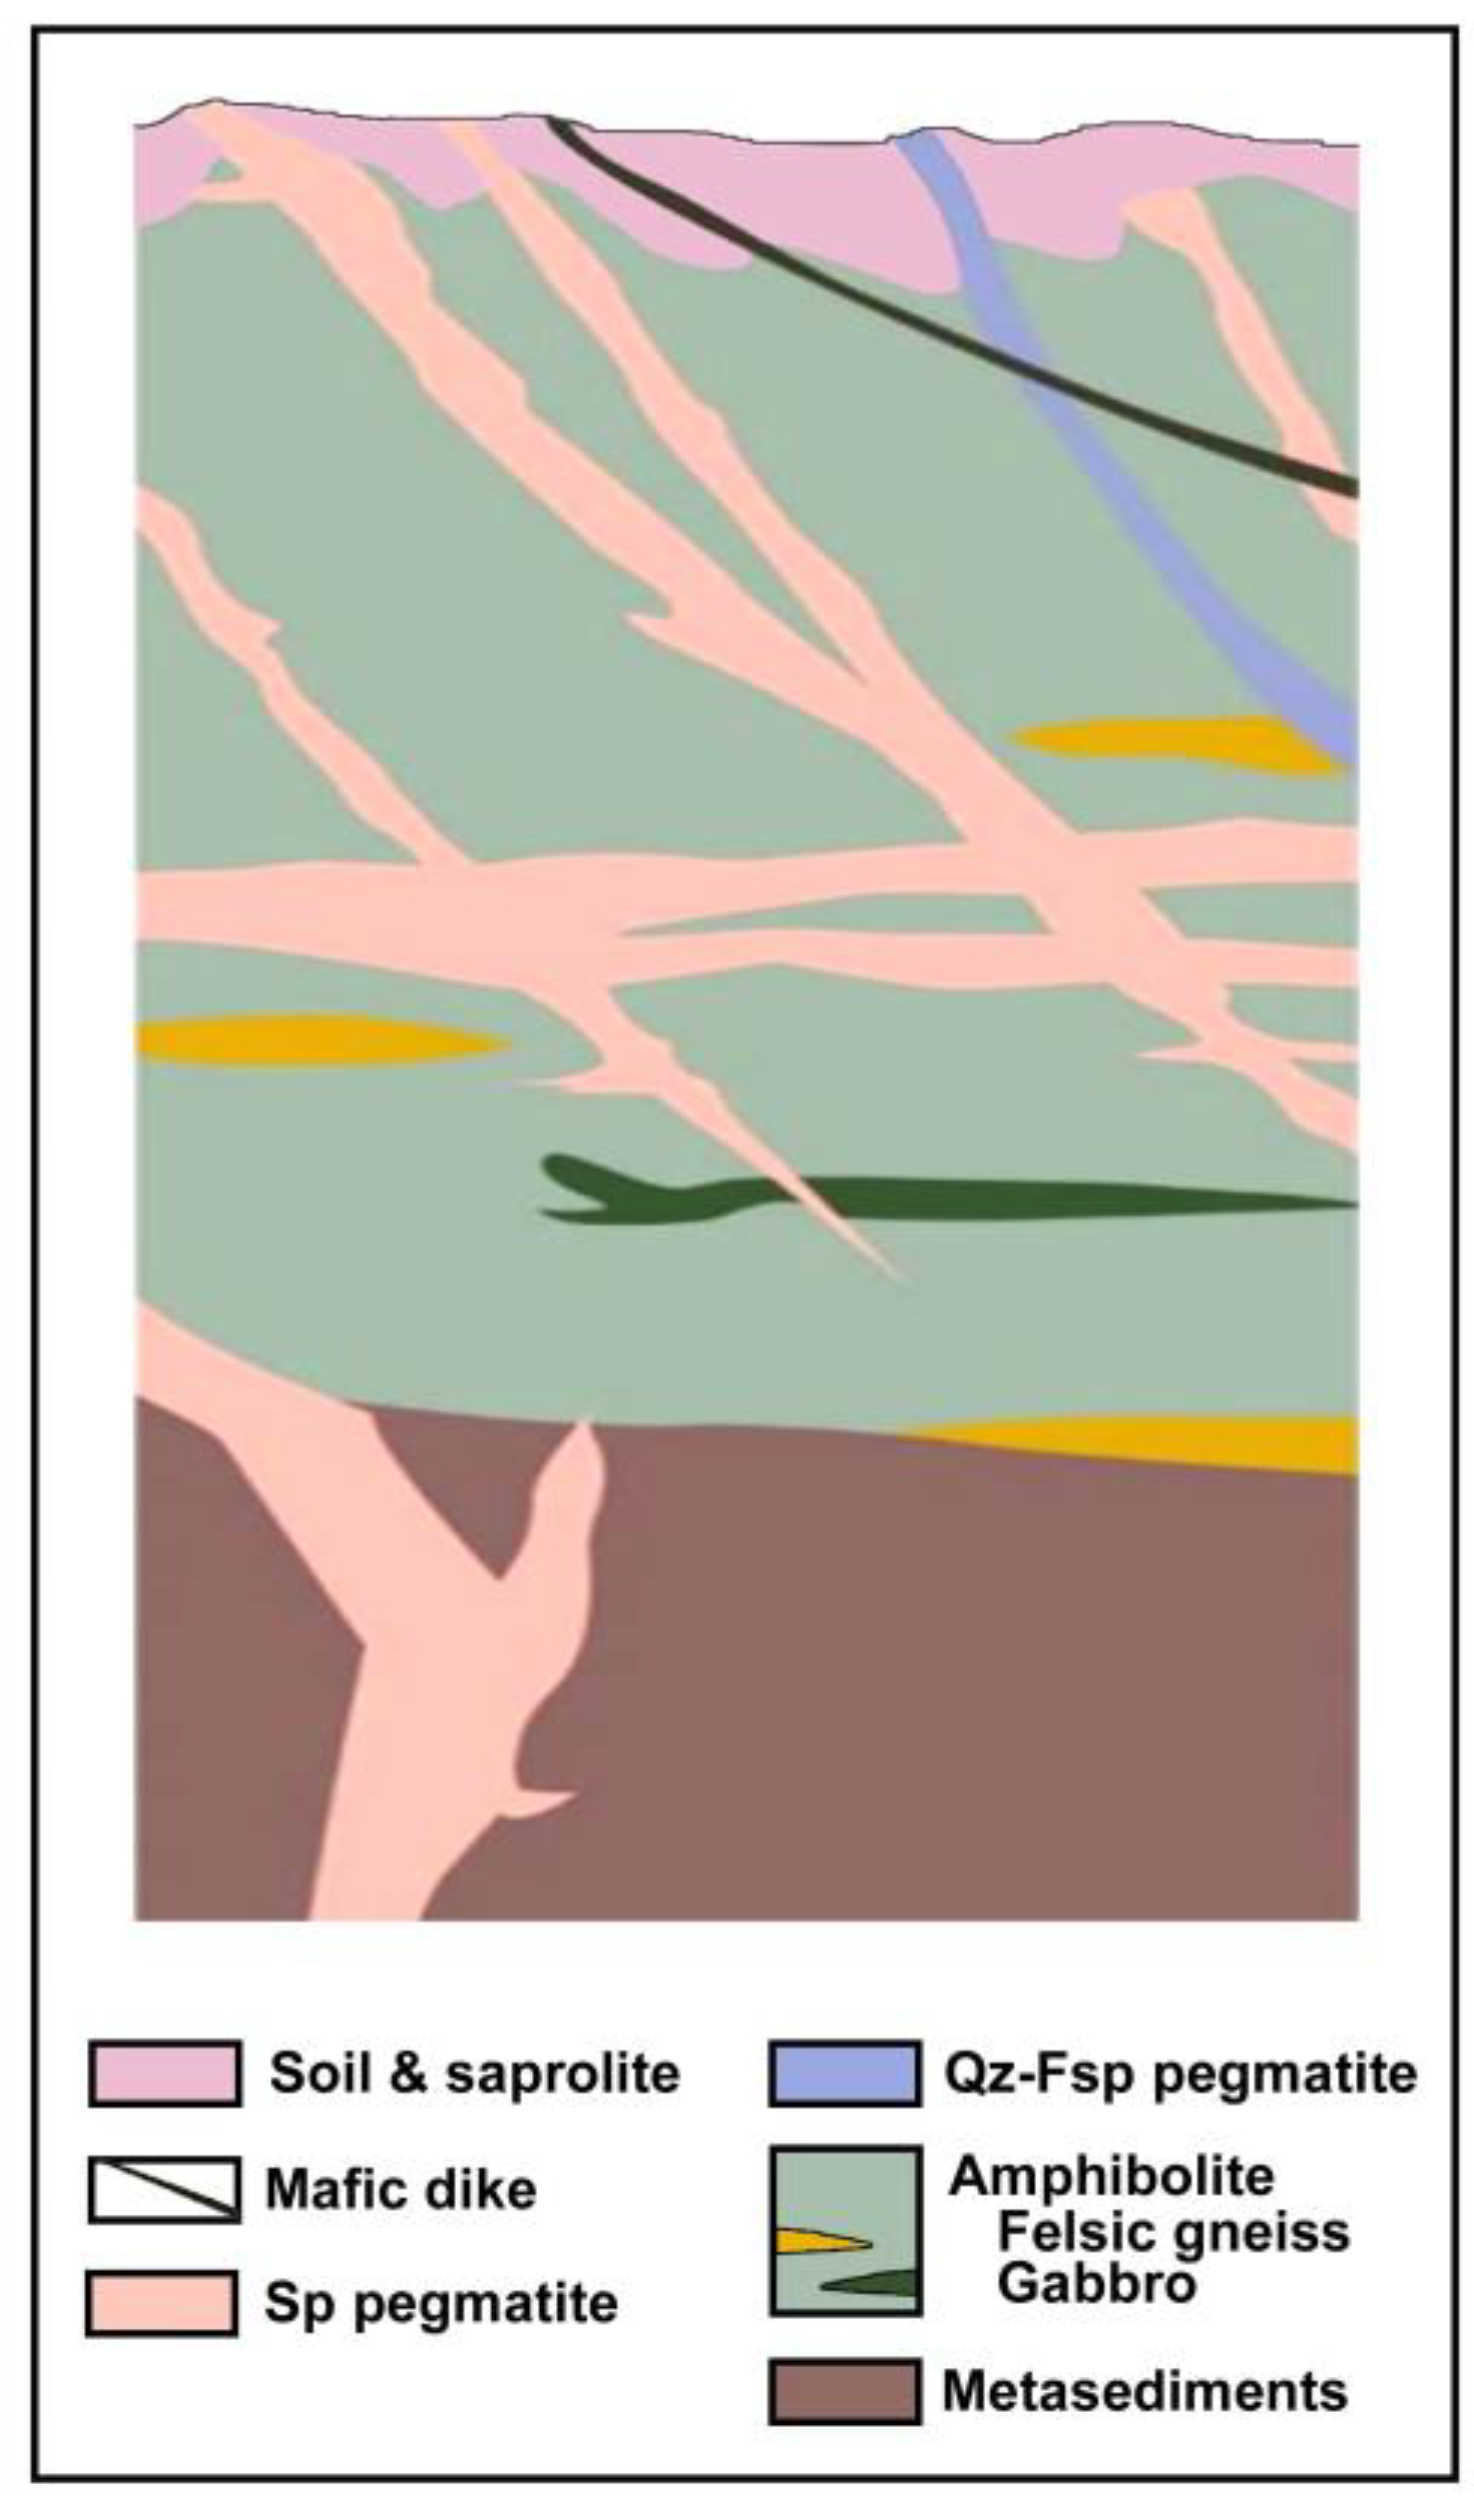
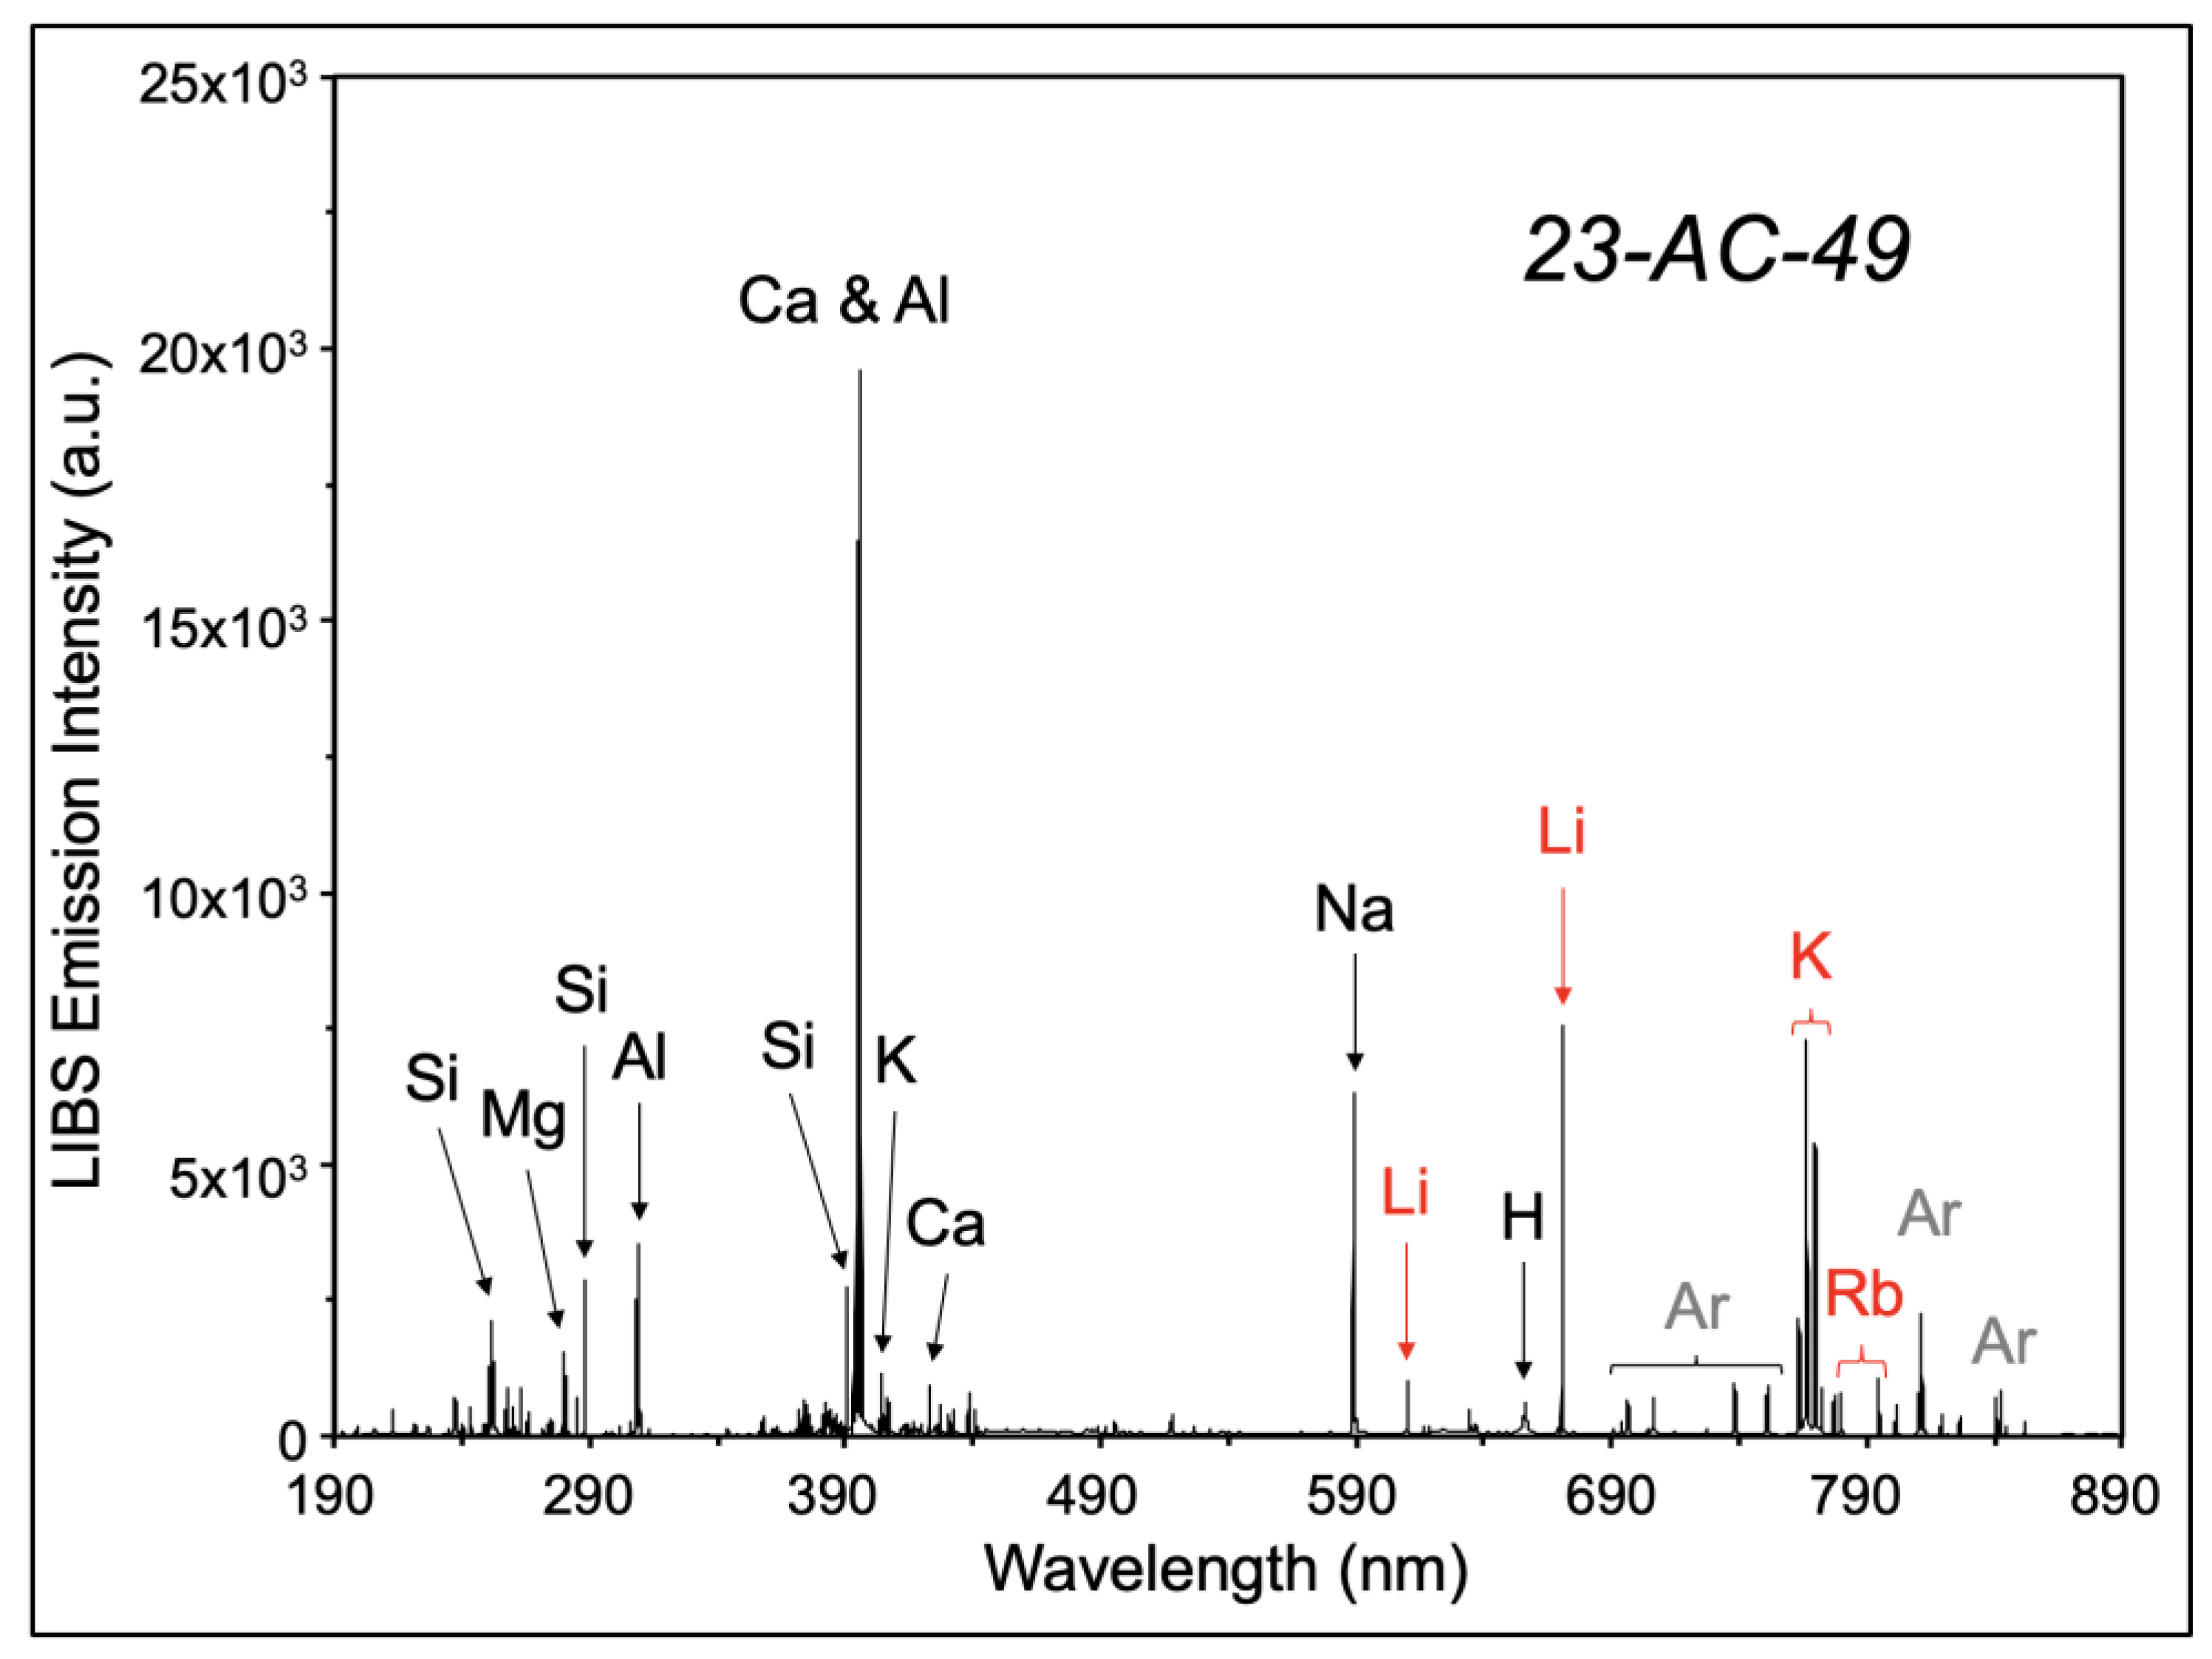
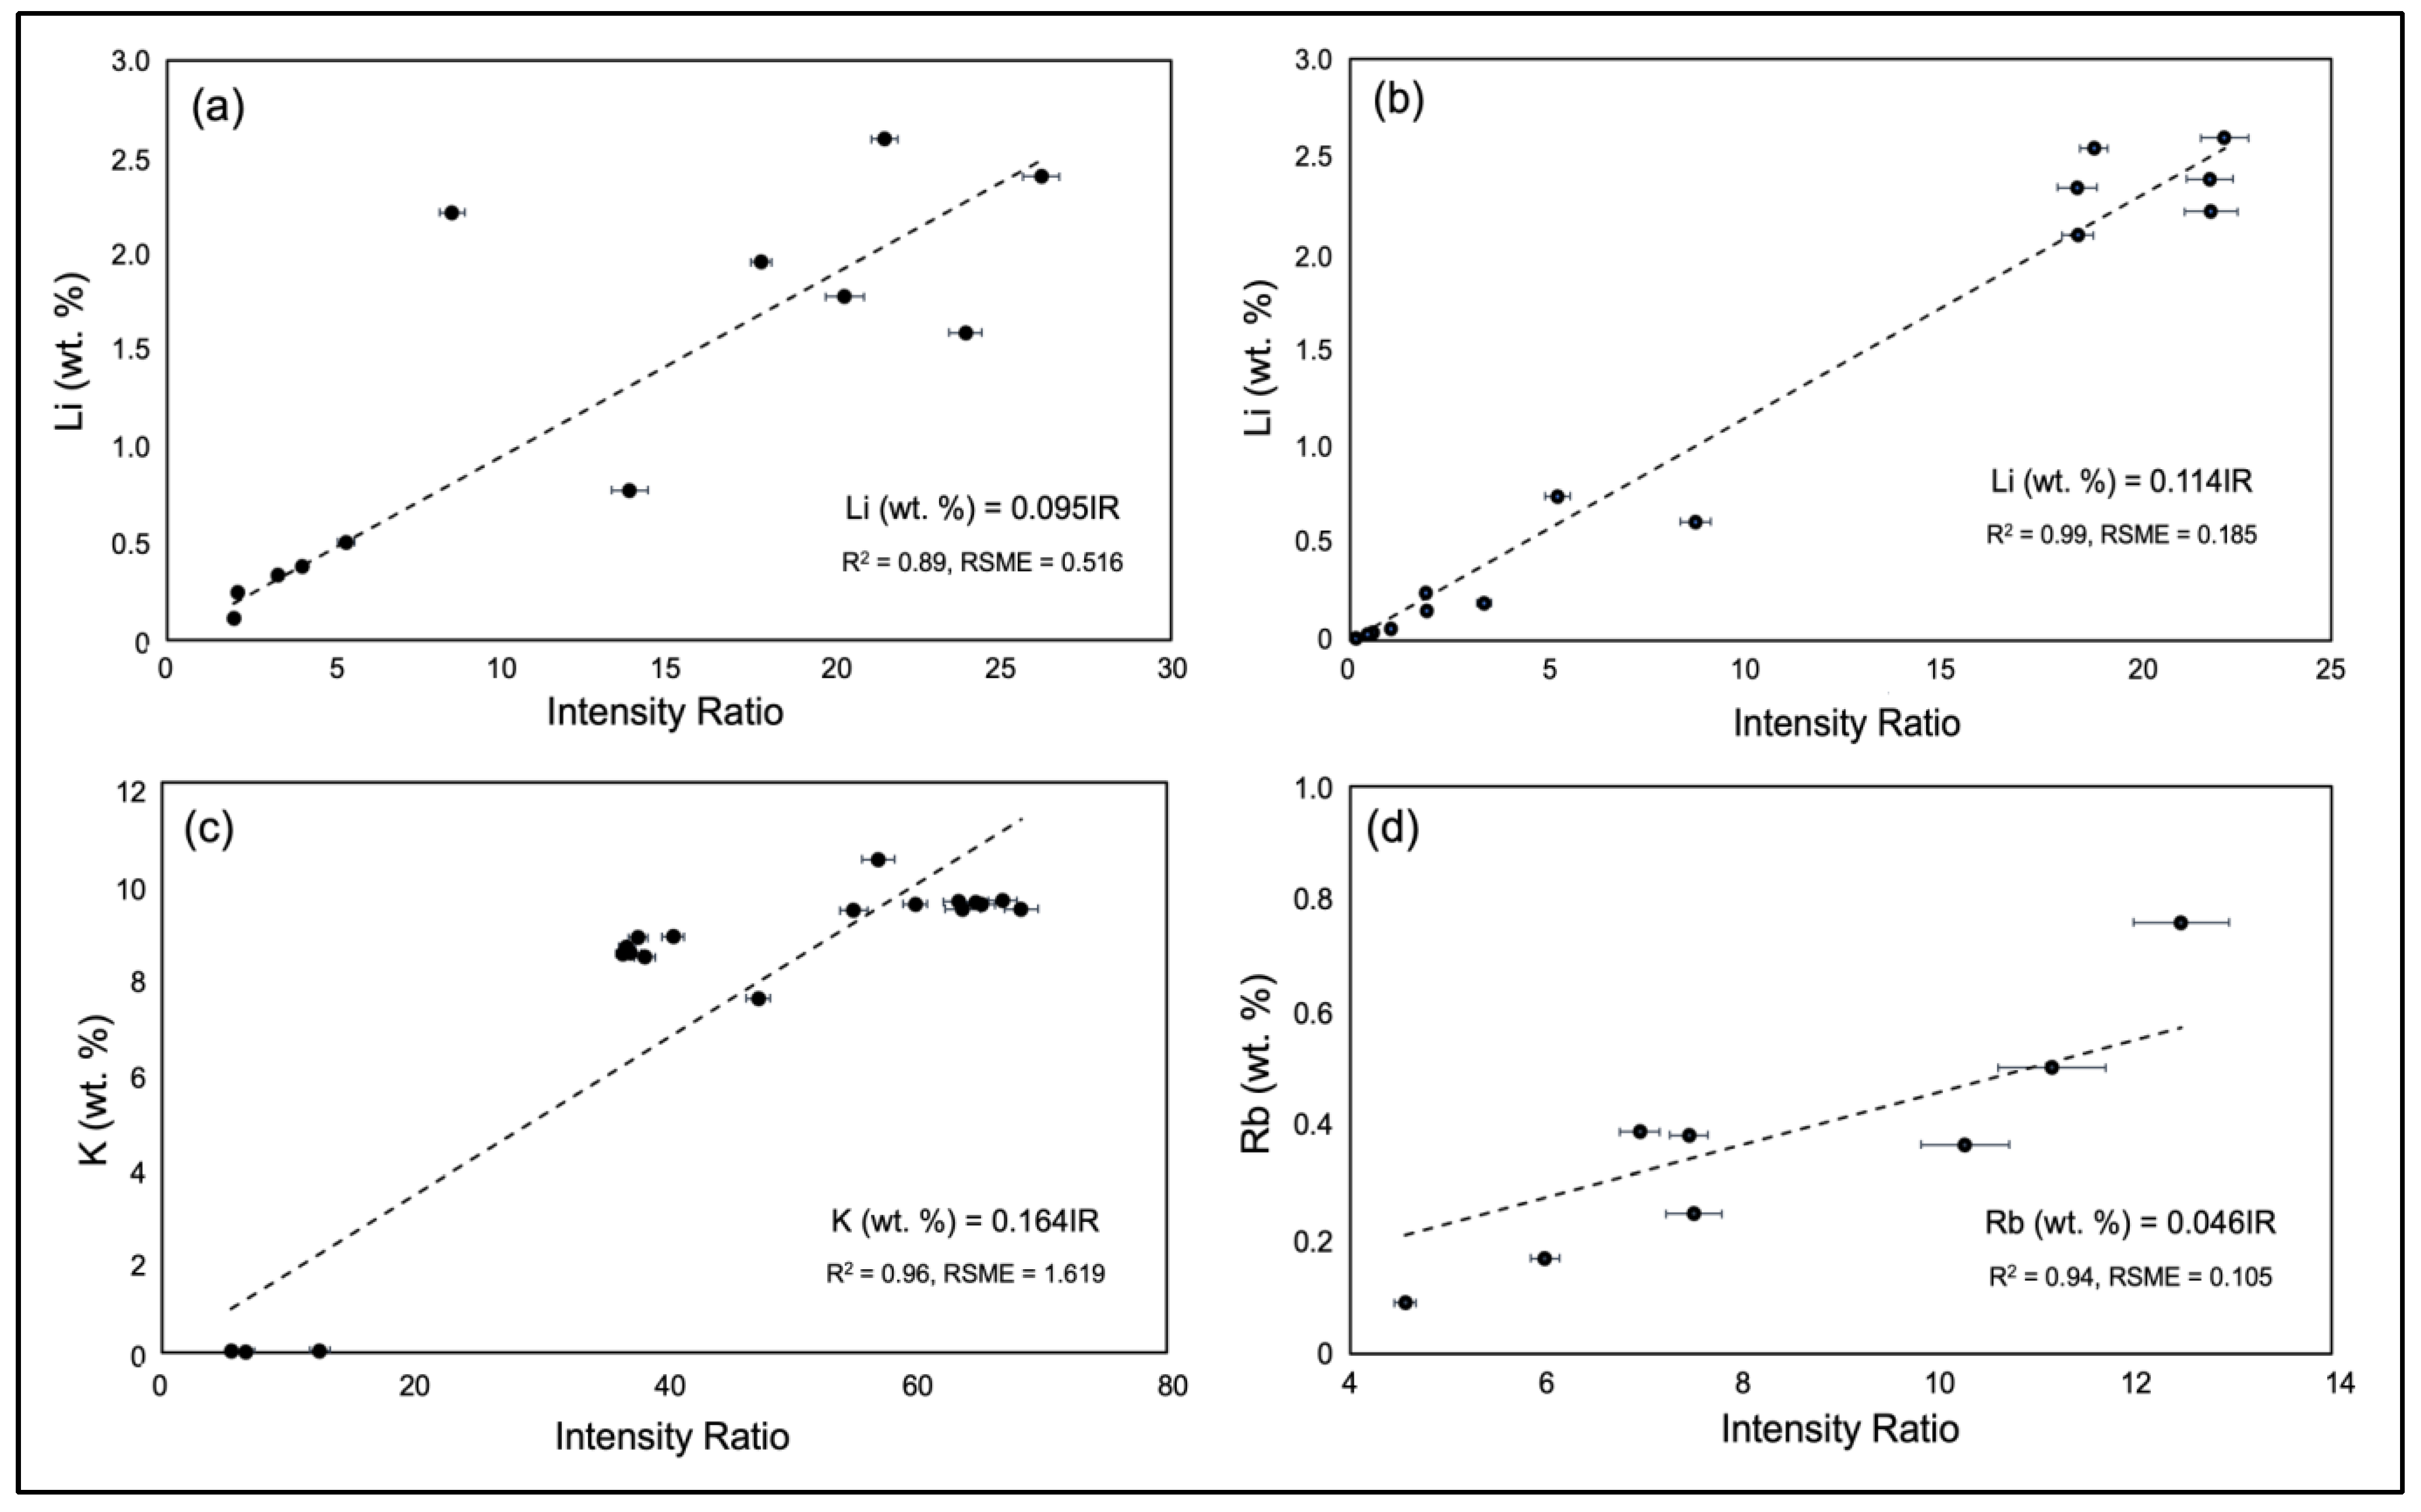
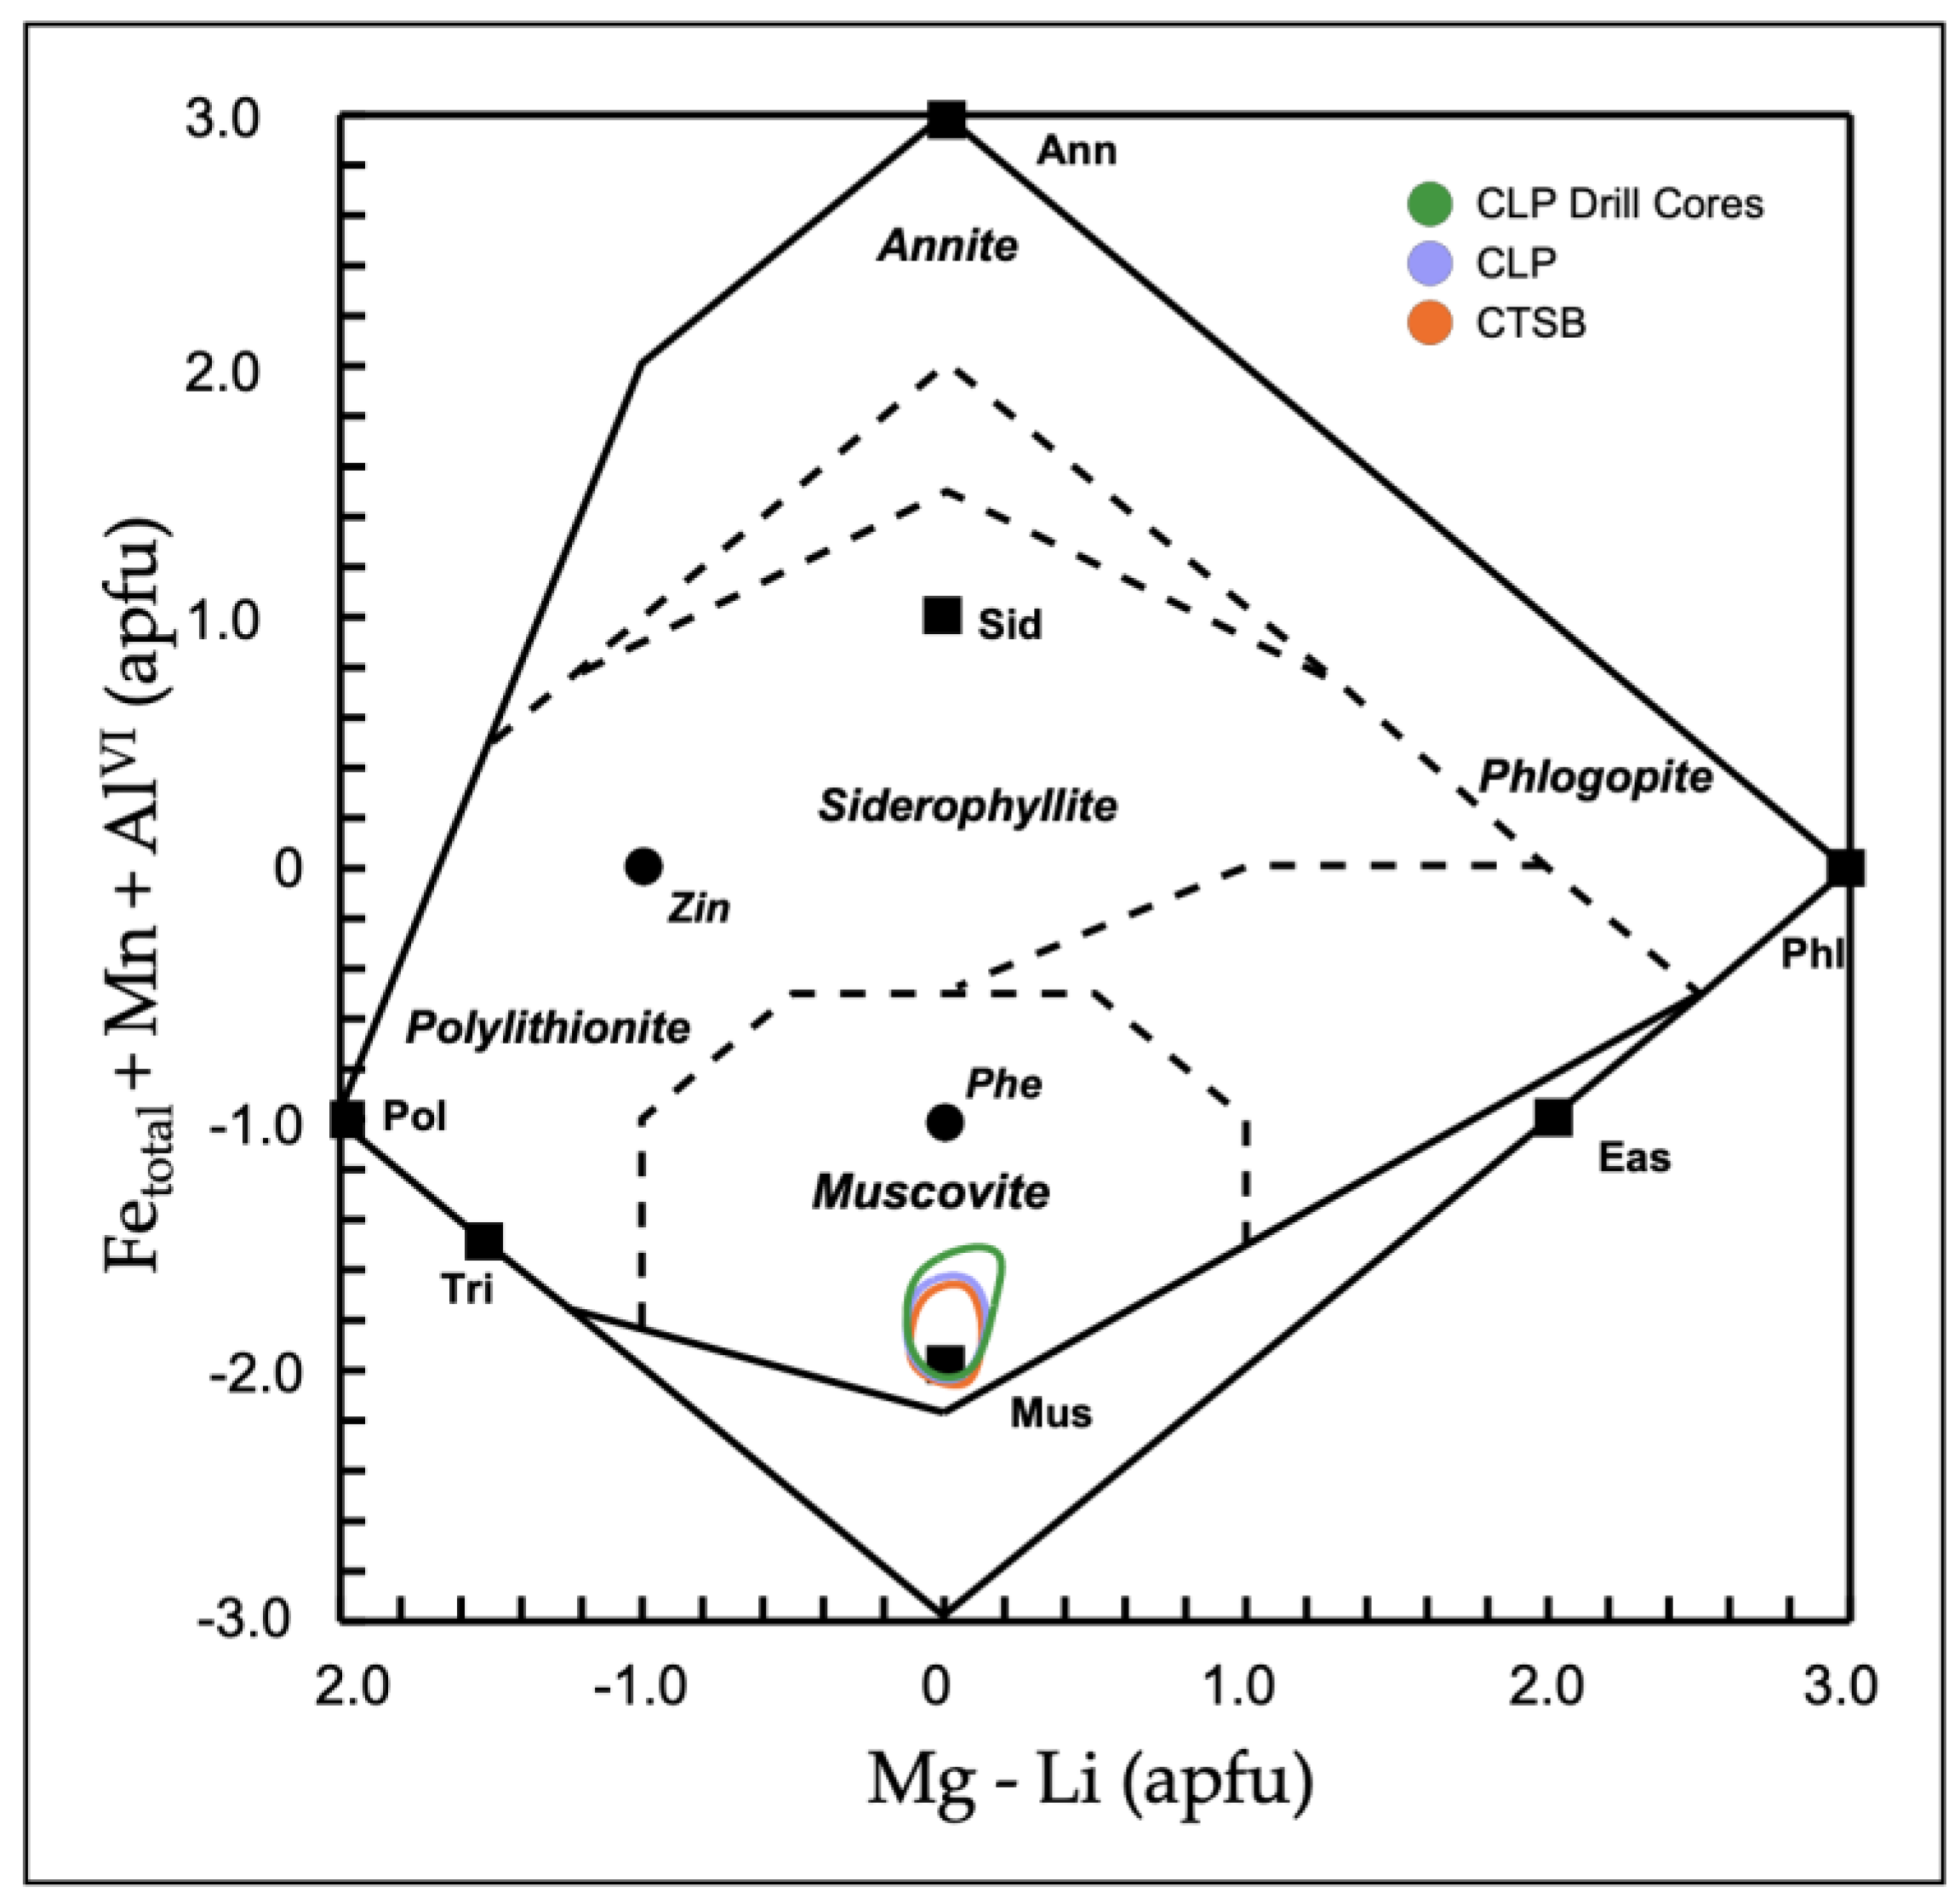
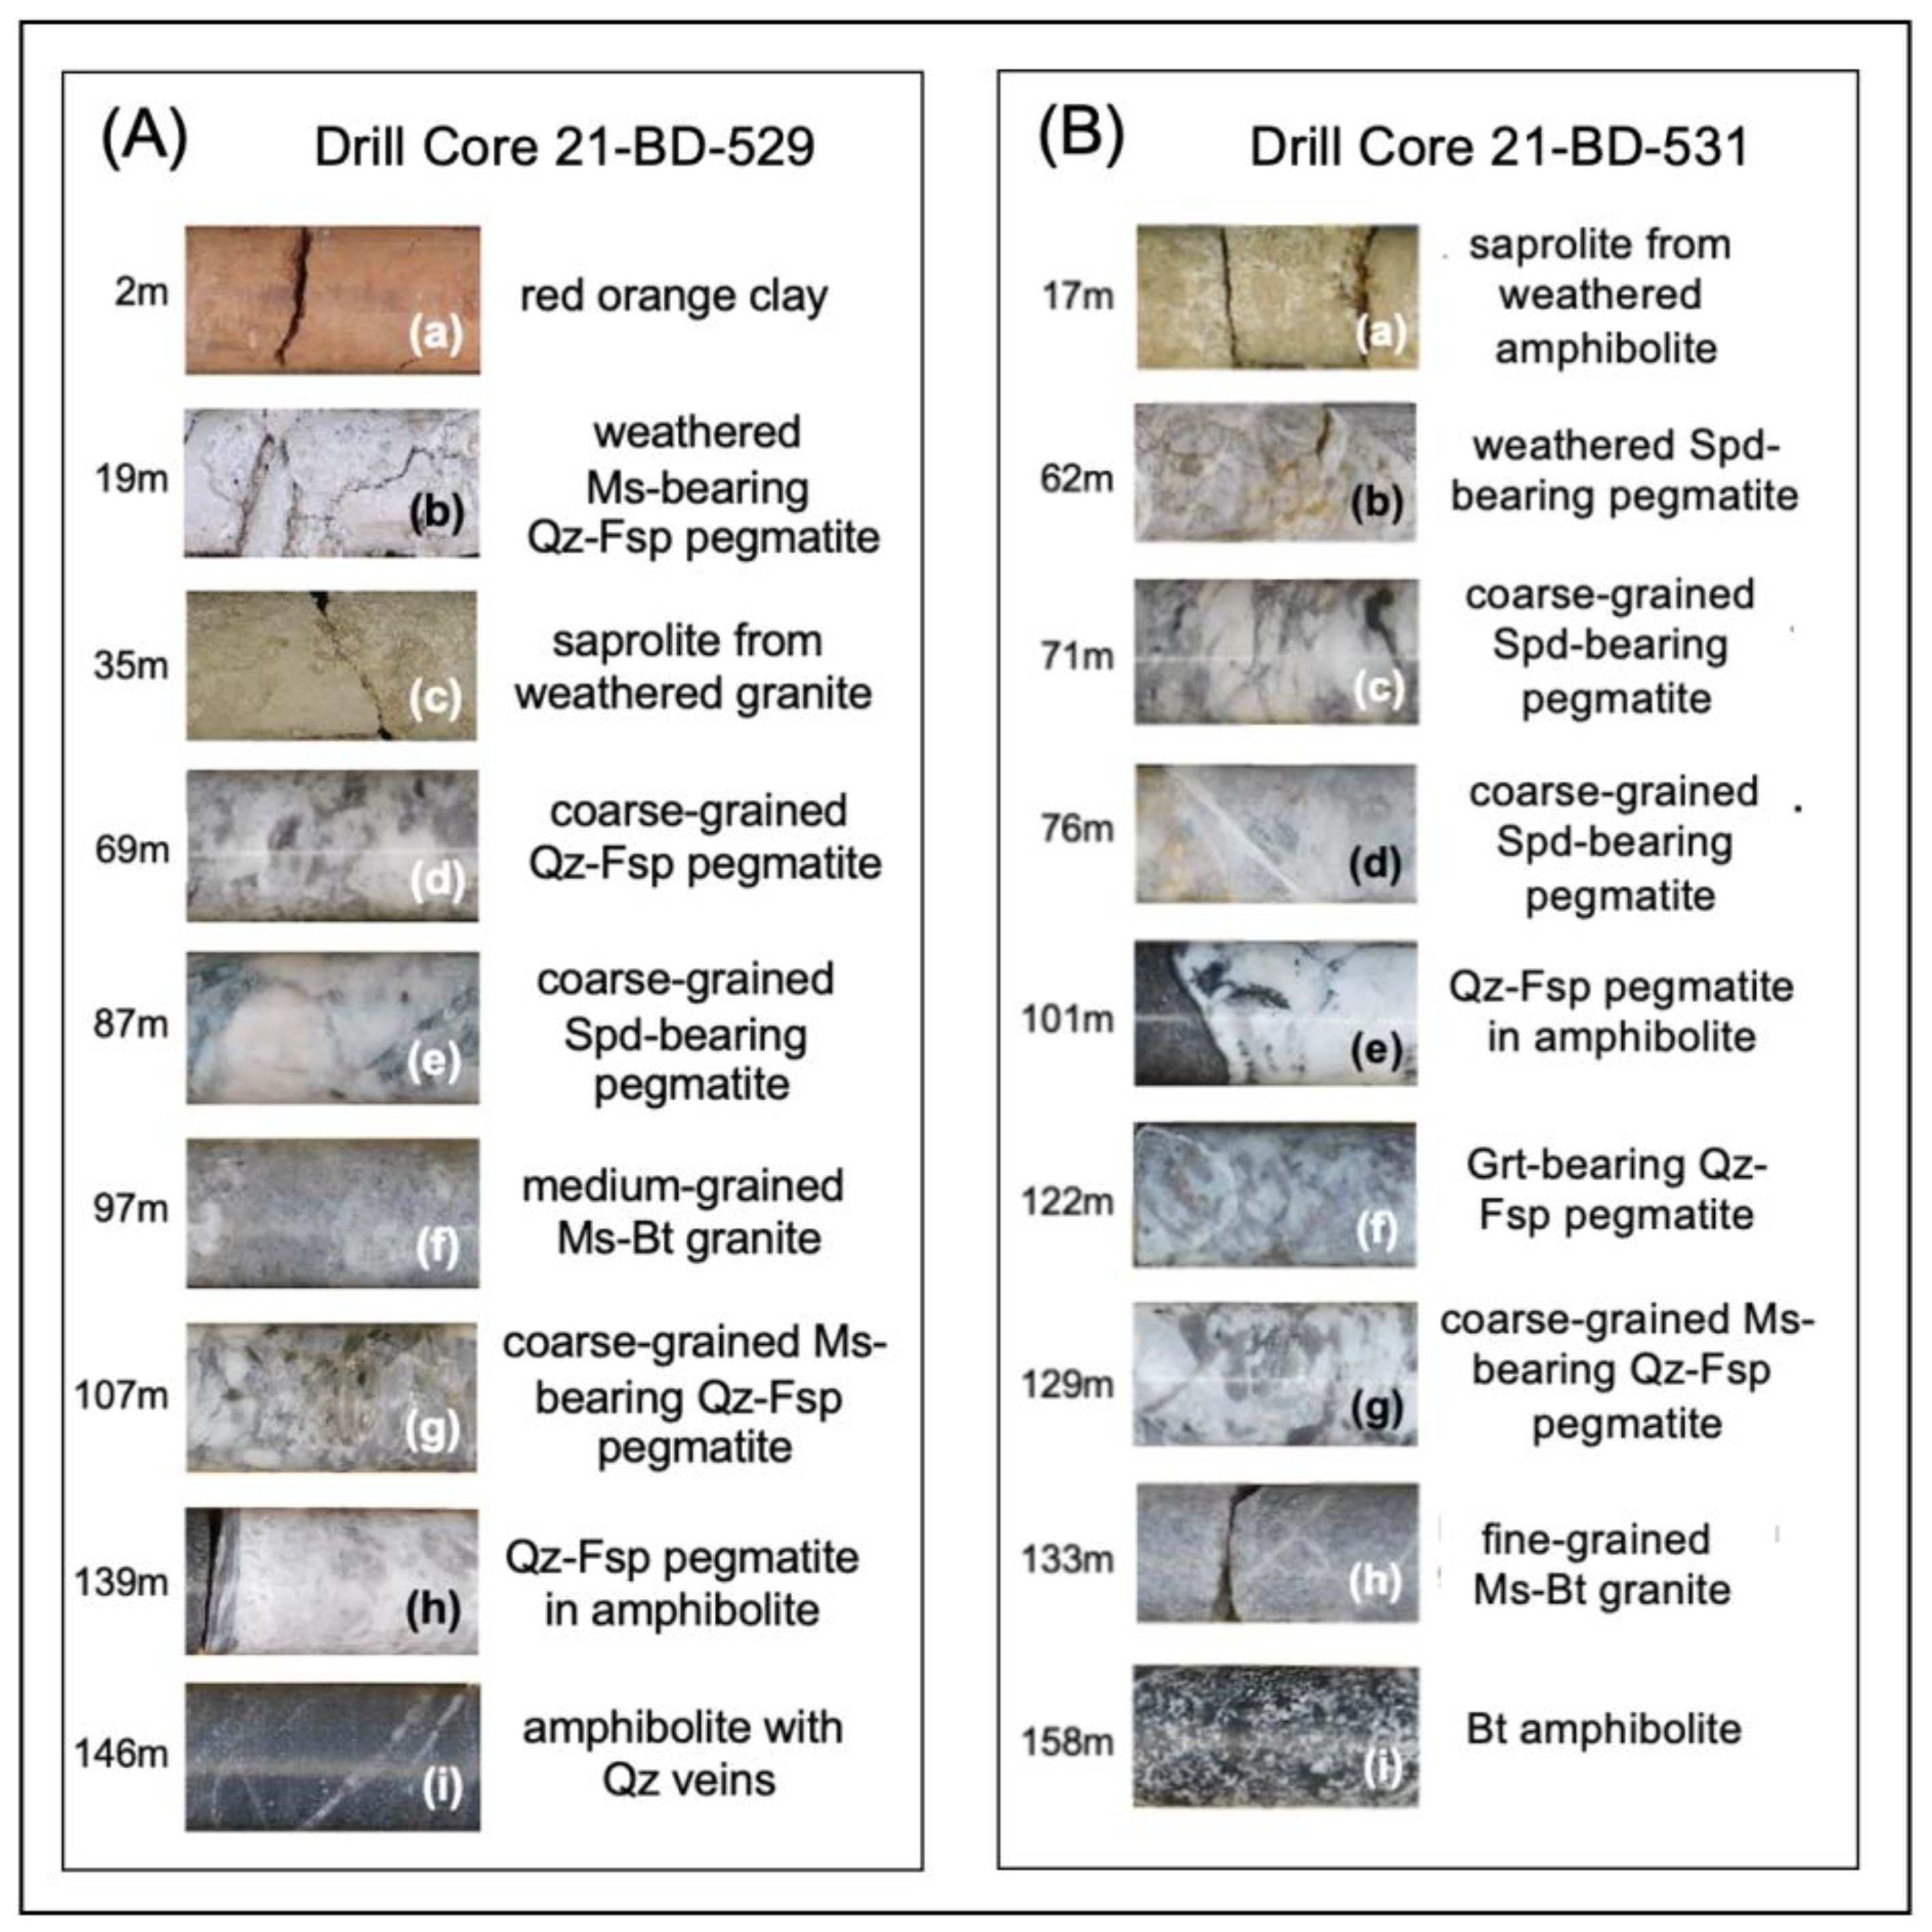
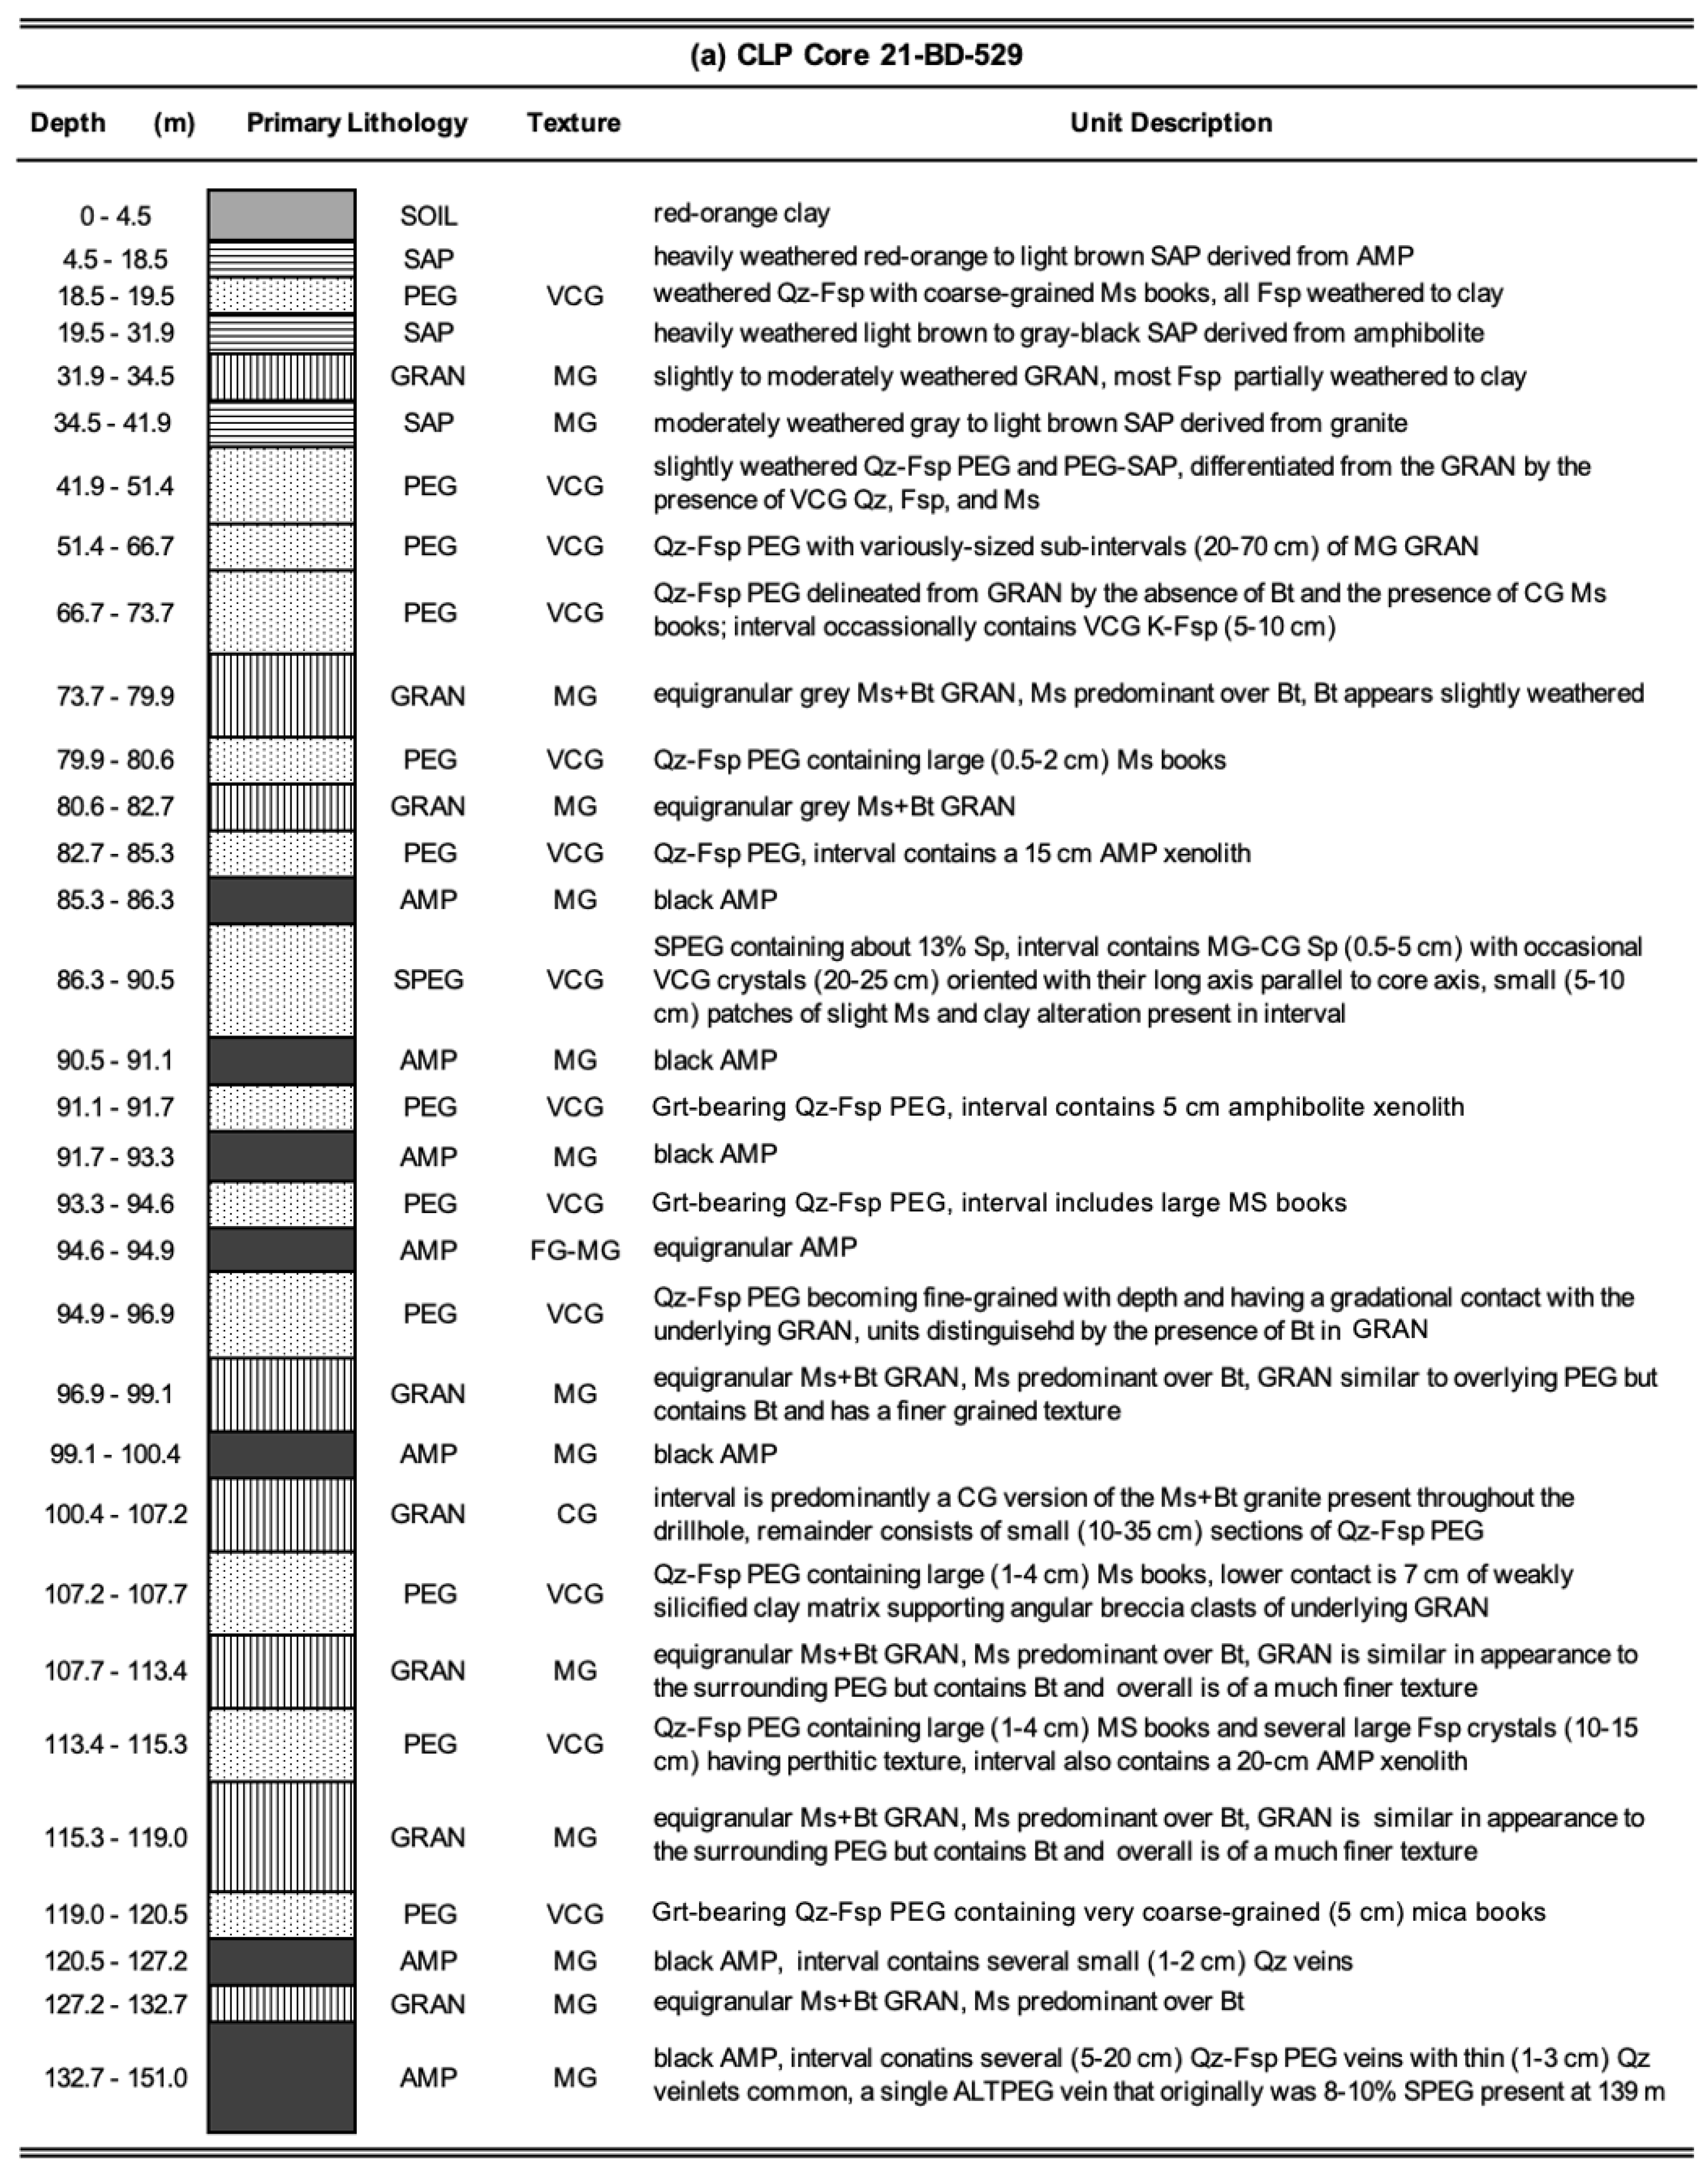
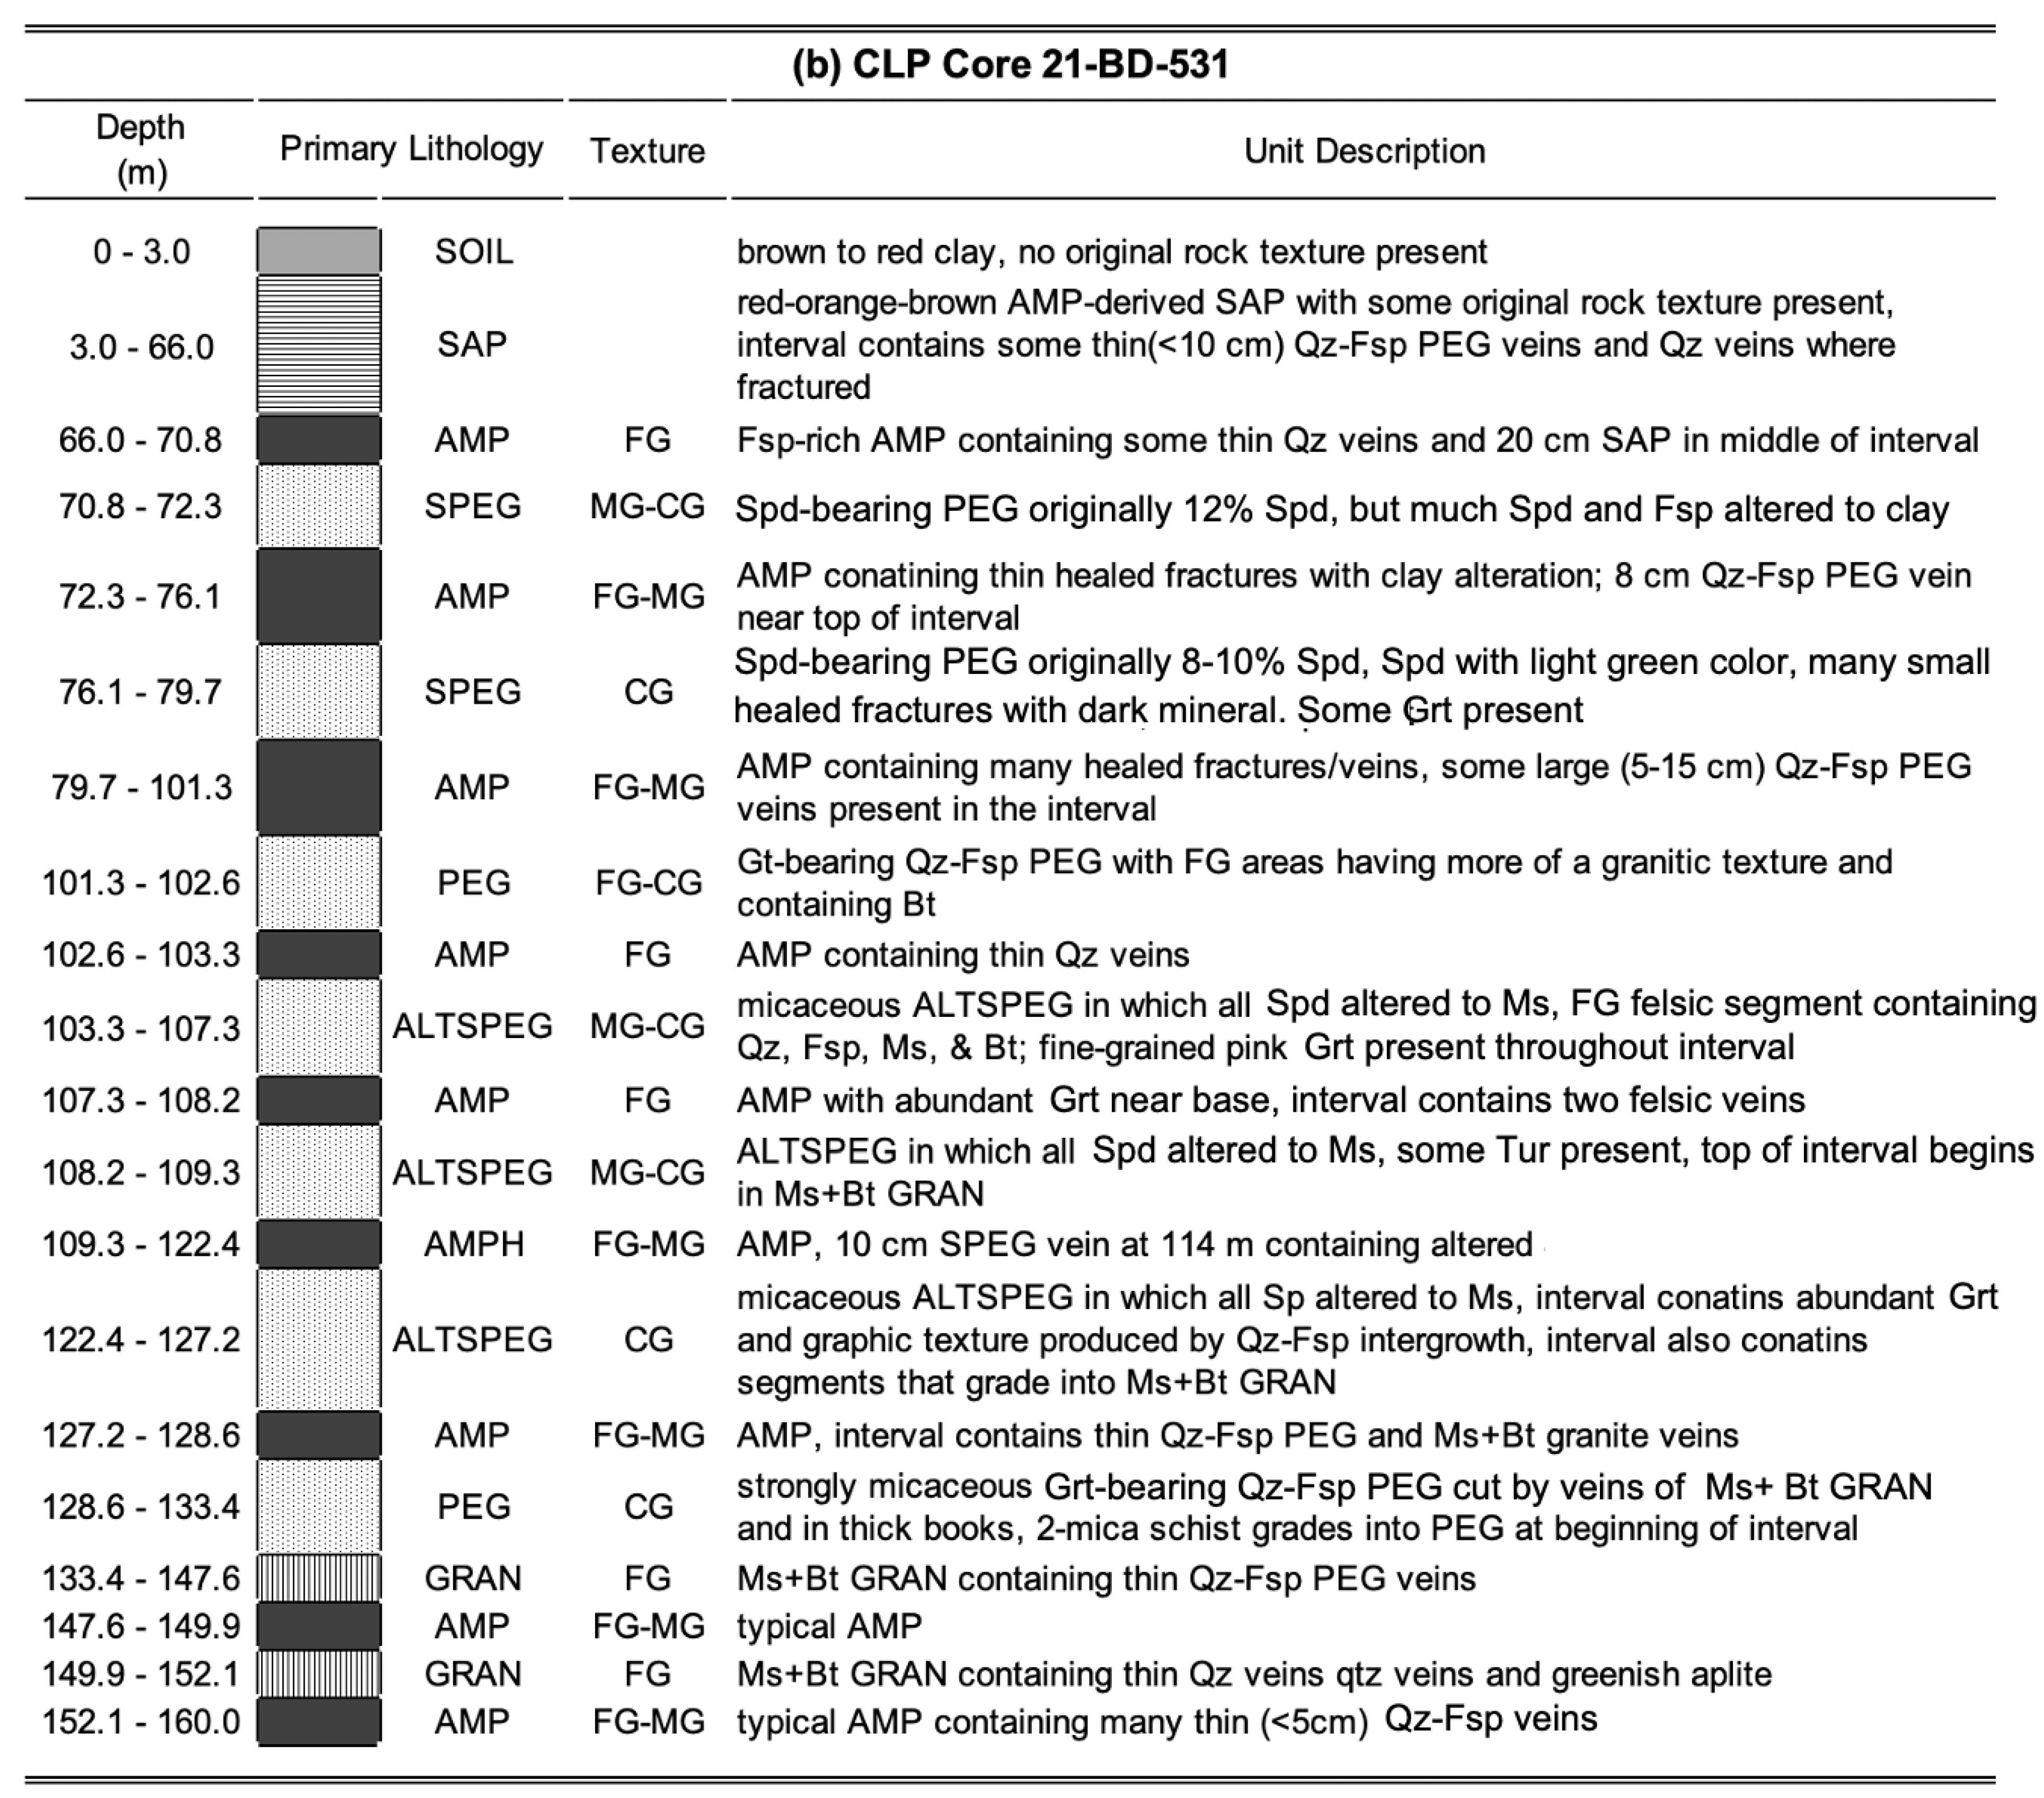
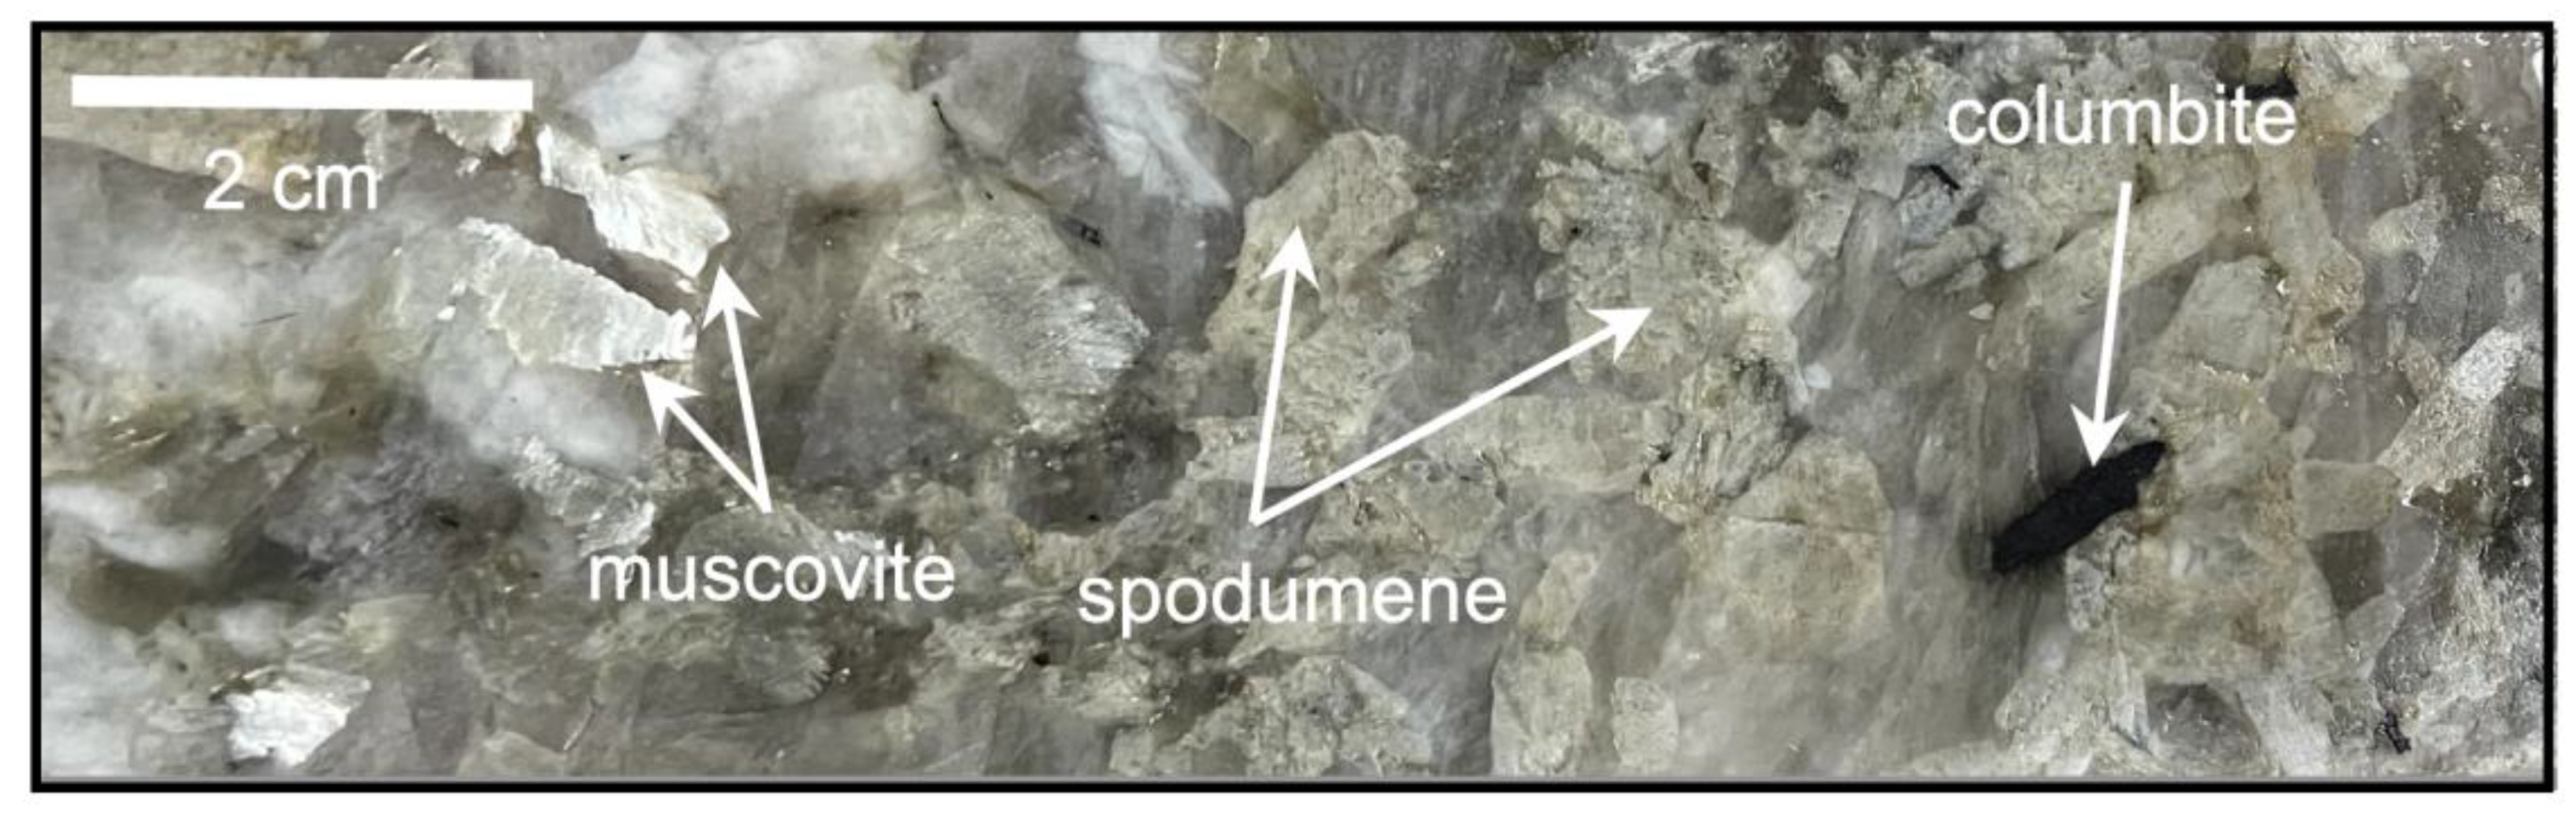
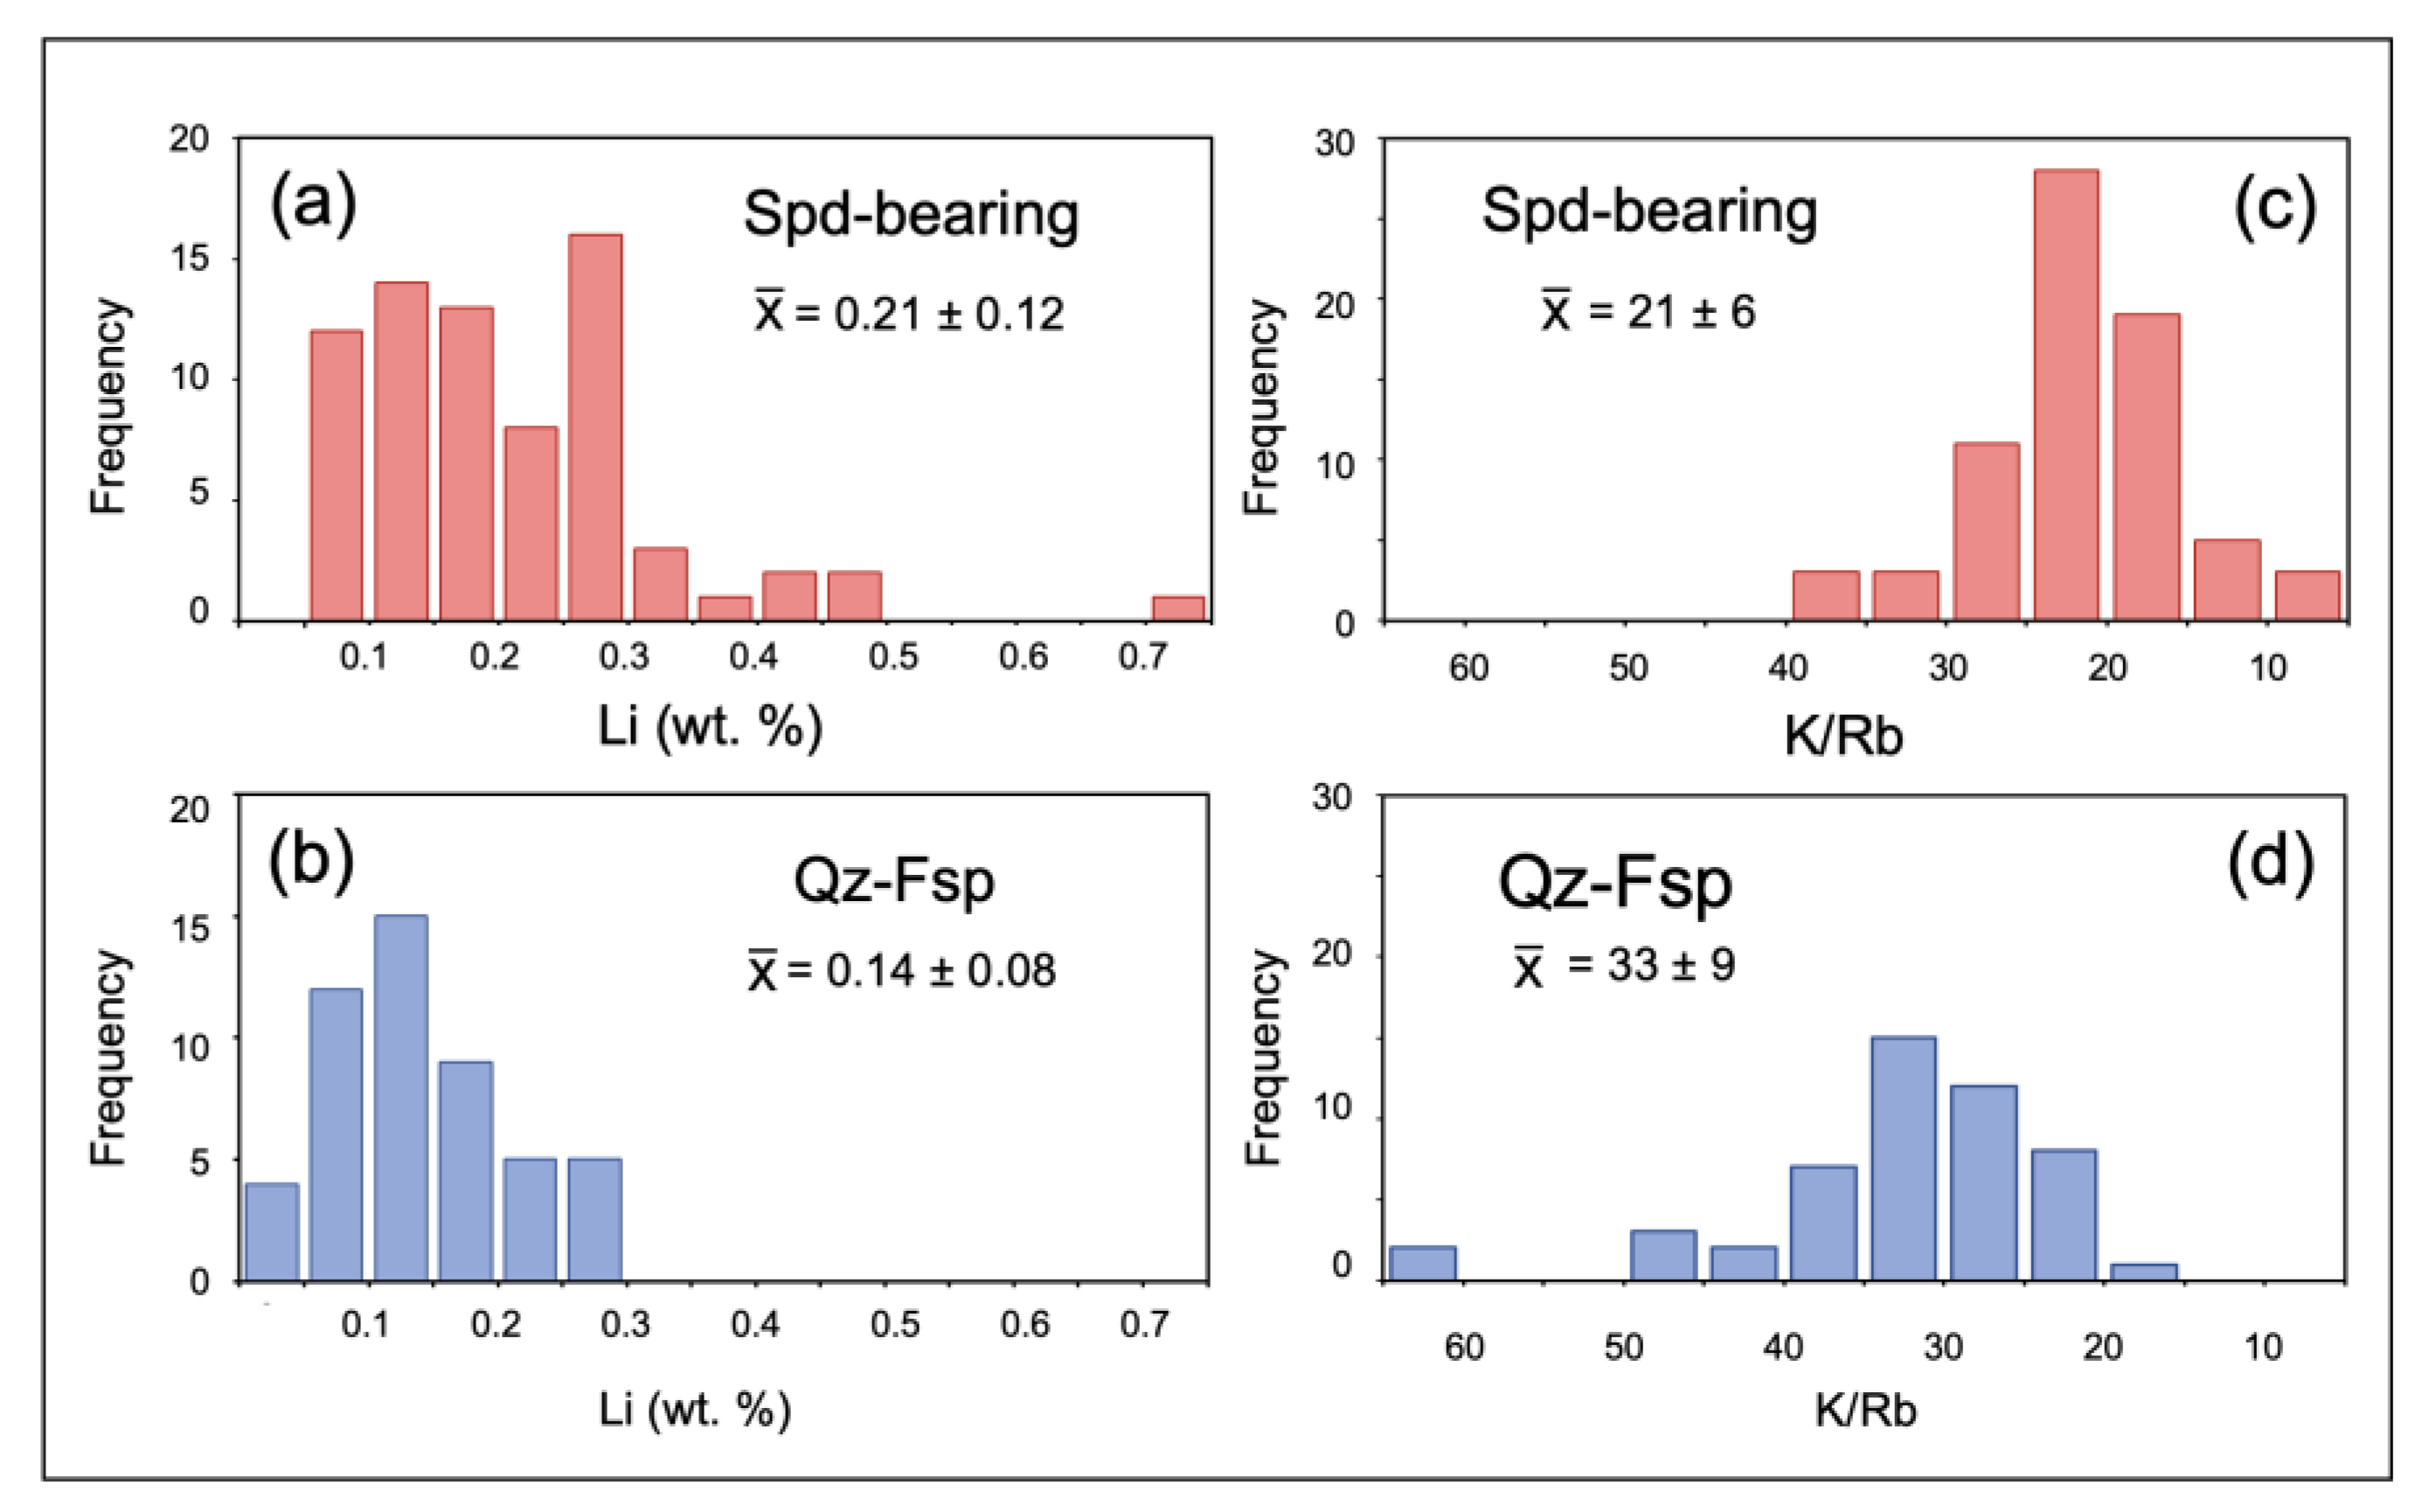
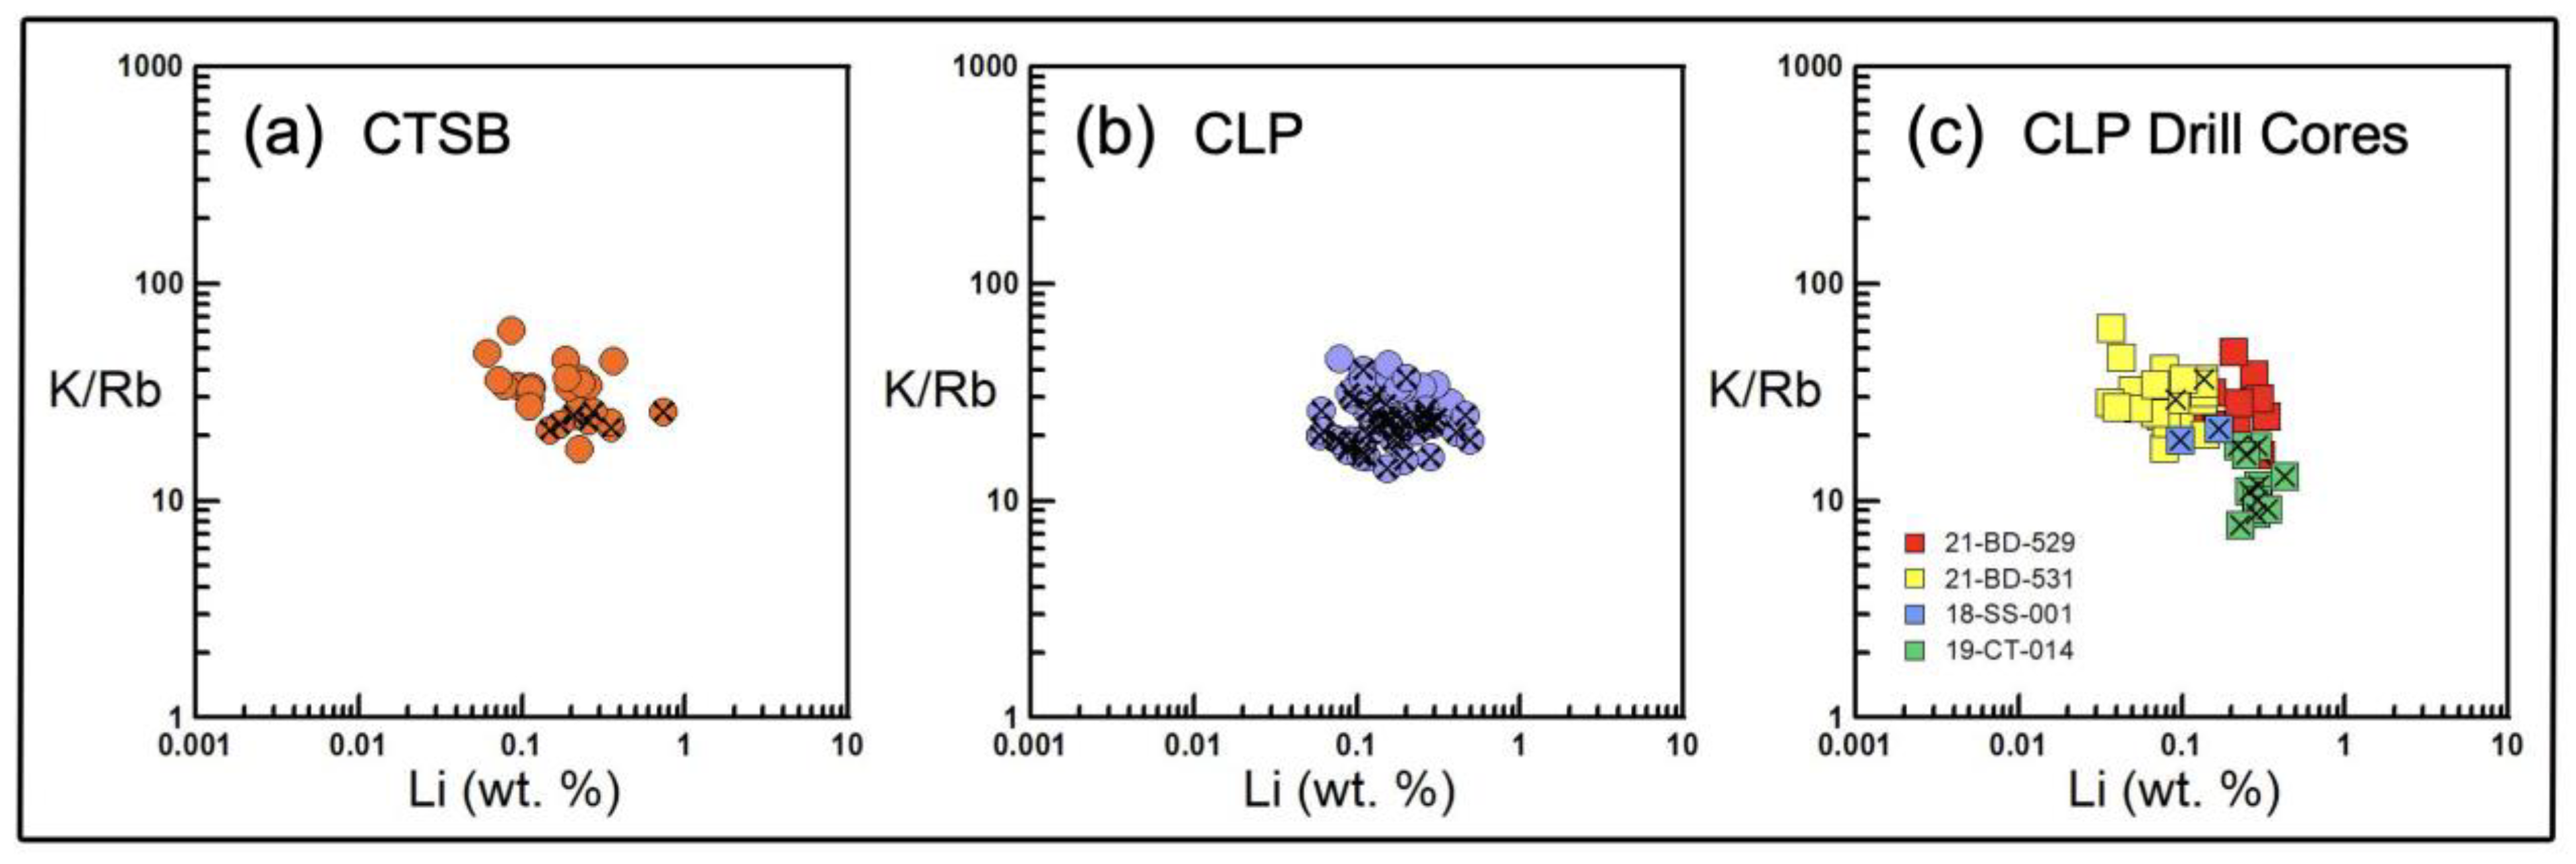
Table 1.
Compositional comparison of highly evolved, Li-rich granite pegmatites.
| CLP 21-BD-529 1 | CLP 21-BD-531 1 | Peg Claim, Maine, USA 2 | INCO, Manitoba, Canada 3 | Harding, New Mexico, USA 4 | Tanco, Manitoba, Canada 5 | Rubicon, Namibia 6 | Mt. Mica, Maine, USA 7 | Segura, Portugal 8 | |
|---|---|---|---|---|---|---|---|---|---|
| Pegmatite type * | Alb-Spd | Alb-Spd | Alb-Spd | Alb-Spd | Spd | Pet | Pet | Lep | Lep |
| SiO2 | 73.57 | 72.08 | 73 | 73.70 | 75.24 | 76.04 | 76.29 | 72.08 | 74.81 |
| Al2O3 | 15.44 | 15.61 | 17 | 16.53 | 14.42 | 13.62 | 14.40 | 17.33 | 13.83 |
| Fe2O3 | 1.06 | 0.81 | n.d. | 0.18 | 0.14 | 0.00 | 1.01 | 1.18 | 0.34 |
| MgO | 0.10 | 0.05 | n.d. | 0.05 | 0.01 | 0.00 | 0.04 | 0.15 | n.d. |
| CaO | 0.67 | 1.37 | n.d. | 0.13 | 0.20 | 0.15 | 0.19 | 0.48 | 0.49 |
| Na2O | 4.23 | 5.25 | 3.4 | 3.78 | 4.23 | 3.81 | 6.00 | 5.35 | 3.95 |
| K2O | 2.90 | 2.51 | 2.6 | 1.73 | 2.74 | 2.96 | 1.40 | 2.08 | 2.90 |
| TiO2 | 0.01 | 0.03 | n.d. | 0.01 | 0.05 | 0.01 | 0.02 | 0.07 | n.d. |
| MnO | 0.14 | 0.11 | n.d. | 0.16 | 0.18 | 0.18 | 0.14 | 0.04 | 0.04 |
| P2O5 | 0.25 | 0.30 | n.d. | <0.01 | 0.13 | 0.86 | 0.21 | 0.20 | 2.23 |
| Li | 3893 | 990 | 6968 | 6549 | 3019 | 3417 | 1178 | 511 | 1080 |
| Be | 122 | 158 | n.d. | n.d. | n.d. | 168 | 24 | ||
| Ga | 28 | 26 | n.d. | n.d. | n.d. | 74 | 42.4 | 34 | 35 |
| Rb | 617 | 504 | 1829 | 3292 | 1737 | 5244 | 1545 | 636 | 1502 |
| Cs | 69 | 34 | 66 | 283 | 472 | 2649 | 106.2 | 99.9 | |
| K/Rb | 43 | 42 | 11.8 | 4.4 | 13.1 | 4.7 | 9.8 | 27.1 | 16.0 |
| A/CNK | 1.36 | 1.13 | 2.02 | 1.99 | 1.40 | 1.40 | 1.23 | 1.45 | 1.31 |
* Pegmatite type based on the classification of Černý and Ercit [51]. n.d.—not determined. Mineral symbols used: Spd—spodumene, Ptl—petalite, Lpd—lepidolite, Ab—albite. References: 1—This study, 2—Sundelius [52], 3—Chackowsky [53], 4—Burnham and Jahns [54], 5—Stilling et al. [55], 6—Ashworth et al. [56], 7—Simmons et al. [57], and 8—Antunes et al. [58]. Li, Rb and Cs ppm values of the Peg Claim, INCO and Harding pegmatites was calculated from their wt. % oxide values.
Table 2.
Li abundance and K/Rb ratio by LIBS analysis for muscovite from CLP outcrops.
| # | Li (wt.%) | K/Rb | ||
|---|---|---|---|---|
| CLP Area 1 Spd-bearing pegmatites | range | 10 | 0.088–0.308 | 17.6–30.6 |
| ± 2σ | 0.176 ± 0.081 | 23.5 ± 4.1 | ||
| CLP Area 2 Qz-Fsp pegmaties | range | 7 | 0.104–0.376 | 28.2–35.6 |
| ± 2σ | 0.213 ± 0.101 | 30.7 ± 2.3 | ||
| CLP Area 3 Spd-bearing pegmatites | range | 5 | 0.131–0.489 | 19.0–24.5 |
| ± 2σ | 0.294 ± 0.150 | 21.4 ± 2.6 | ||
| CLP Area 4 Qz-Fsp pegmaties | range | 5 | 0.062–0.182 | 21.0–30.8 |
| ± 2σ | 0.138 ± 0.60 | 23.6 ± 3.5 |
Table 3.
Li abundance and K/Rb ratio by LIBS analysis for soil-derived muscovite.
| Sample # | Li (wt. %) | K/Rb |
|---|---|---|
| 22-AC-133 | 0.097 | 22.5 |
| 22-AC-135 | 0.146 | 17.1 |
| 22-AC-142 | 0.145 | 19.7 |
| 22-AC-144 | 0.164 | 25.9 |
Disclaimer/Publisher’s Note: The statements, opinions and data contained in all publications are solely those of the individual author(s) and contributor(s) and not of MDPI and/or the editor(s). MDPI and/or the editor(s) disclaim responsibility for any injury to people or property resulting from any ideas, methods, instructions or products referred to in the content. |
© 2023 by the authors. Licensee MDPI, Basel, Switzerland. This article is an open access article distributed under the terms and conditions of the Creative Commons Attribution (CC BY) license (https://creativecommons.org/licenses/by/4.0/).
Share and Cite
MDPI and ACS Style
Harmon, R.S.; Wise, M.A.; Curry, A.C.; Mistele, J.S.; Mason, M.S.; Grimac, Z. Rapid Analysis of Muscovites on a Lithium Pegmatite Prospect by Handheld LIBS. Minerals 2023, 13, 697. https://doi.org/10.3390/min13050697
AMA Style
Harmon RS, Wise MA, Curry AC, Mistele JS, Mason MS, Grimac Z. Rapid Analysis of Muscovites on a Lithium Pegmatite Prospect by Handheld LIBS. Minerals. 2023; 13(5):697. https://doi.org/10.3390/min13050697
Chicago/Turabian StyleHarmon, Russell S., Michael A. Wise, Adam C. Curry, Joshua S. Mistele, Michael S. Mason, and Zach Grimac. 2023. "Rapid Analysis of Muscovites on a Lithium Pegmatite Prospect by Handheld LIBS" Minerals 13, no. 5: 697. https://doi.org/10.3390/min13050697
Note that from the first issue of 2016, this journal uses article numbers instead of page numbers. See further details here.