Geochemical Characteristics of Primary Halos and Prospecting Significance of the Qulong Porphyry Copper–Molybdenum Deposit in Tibet

 ,
,
Abstract
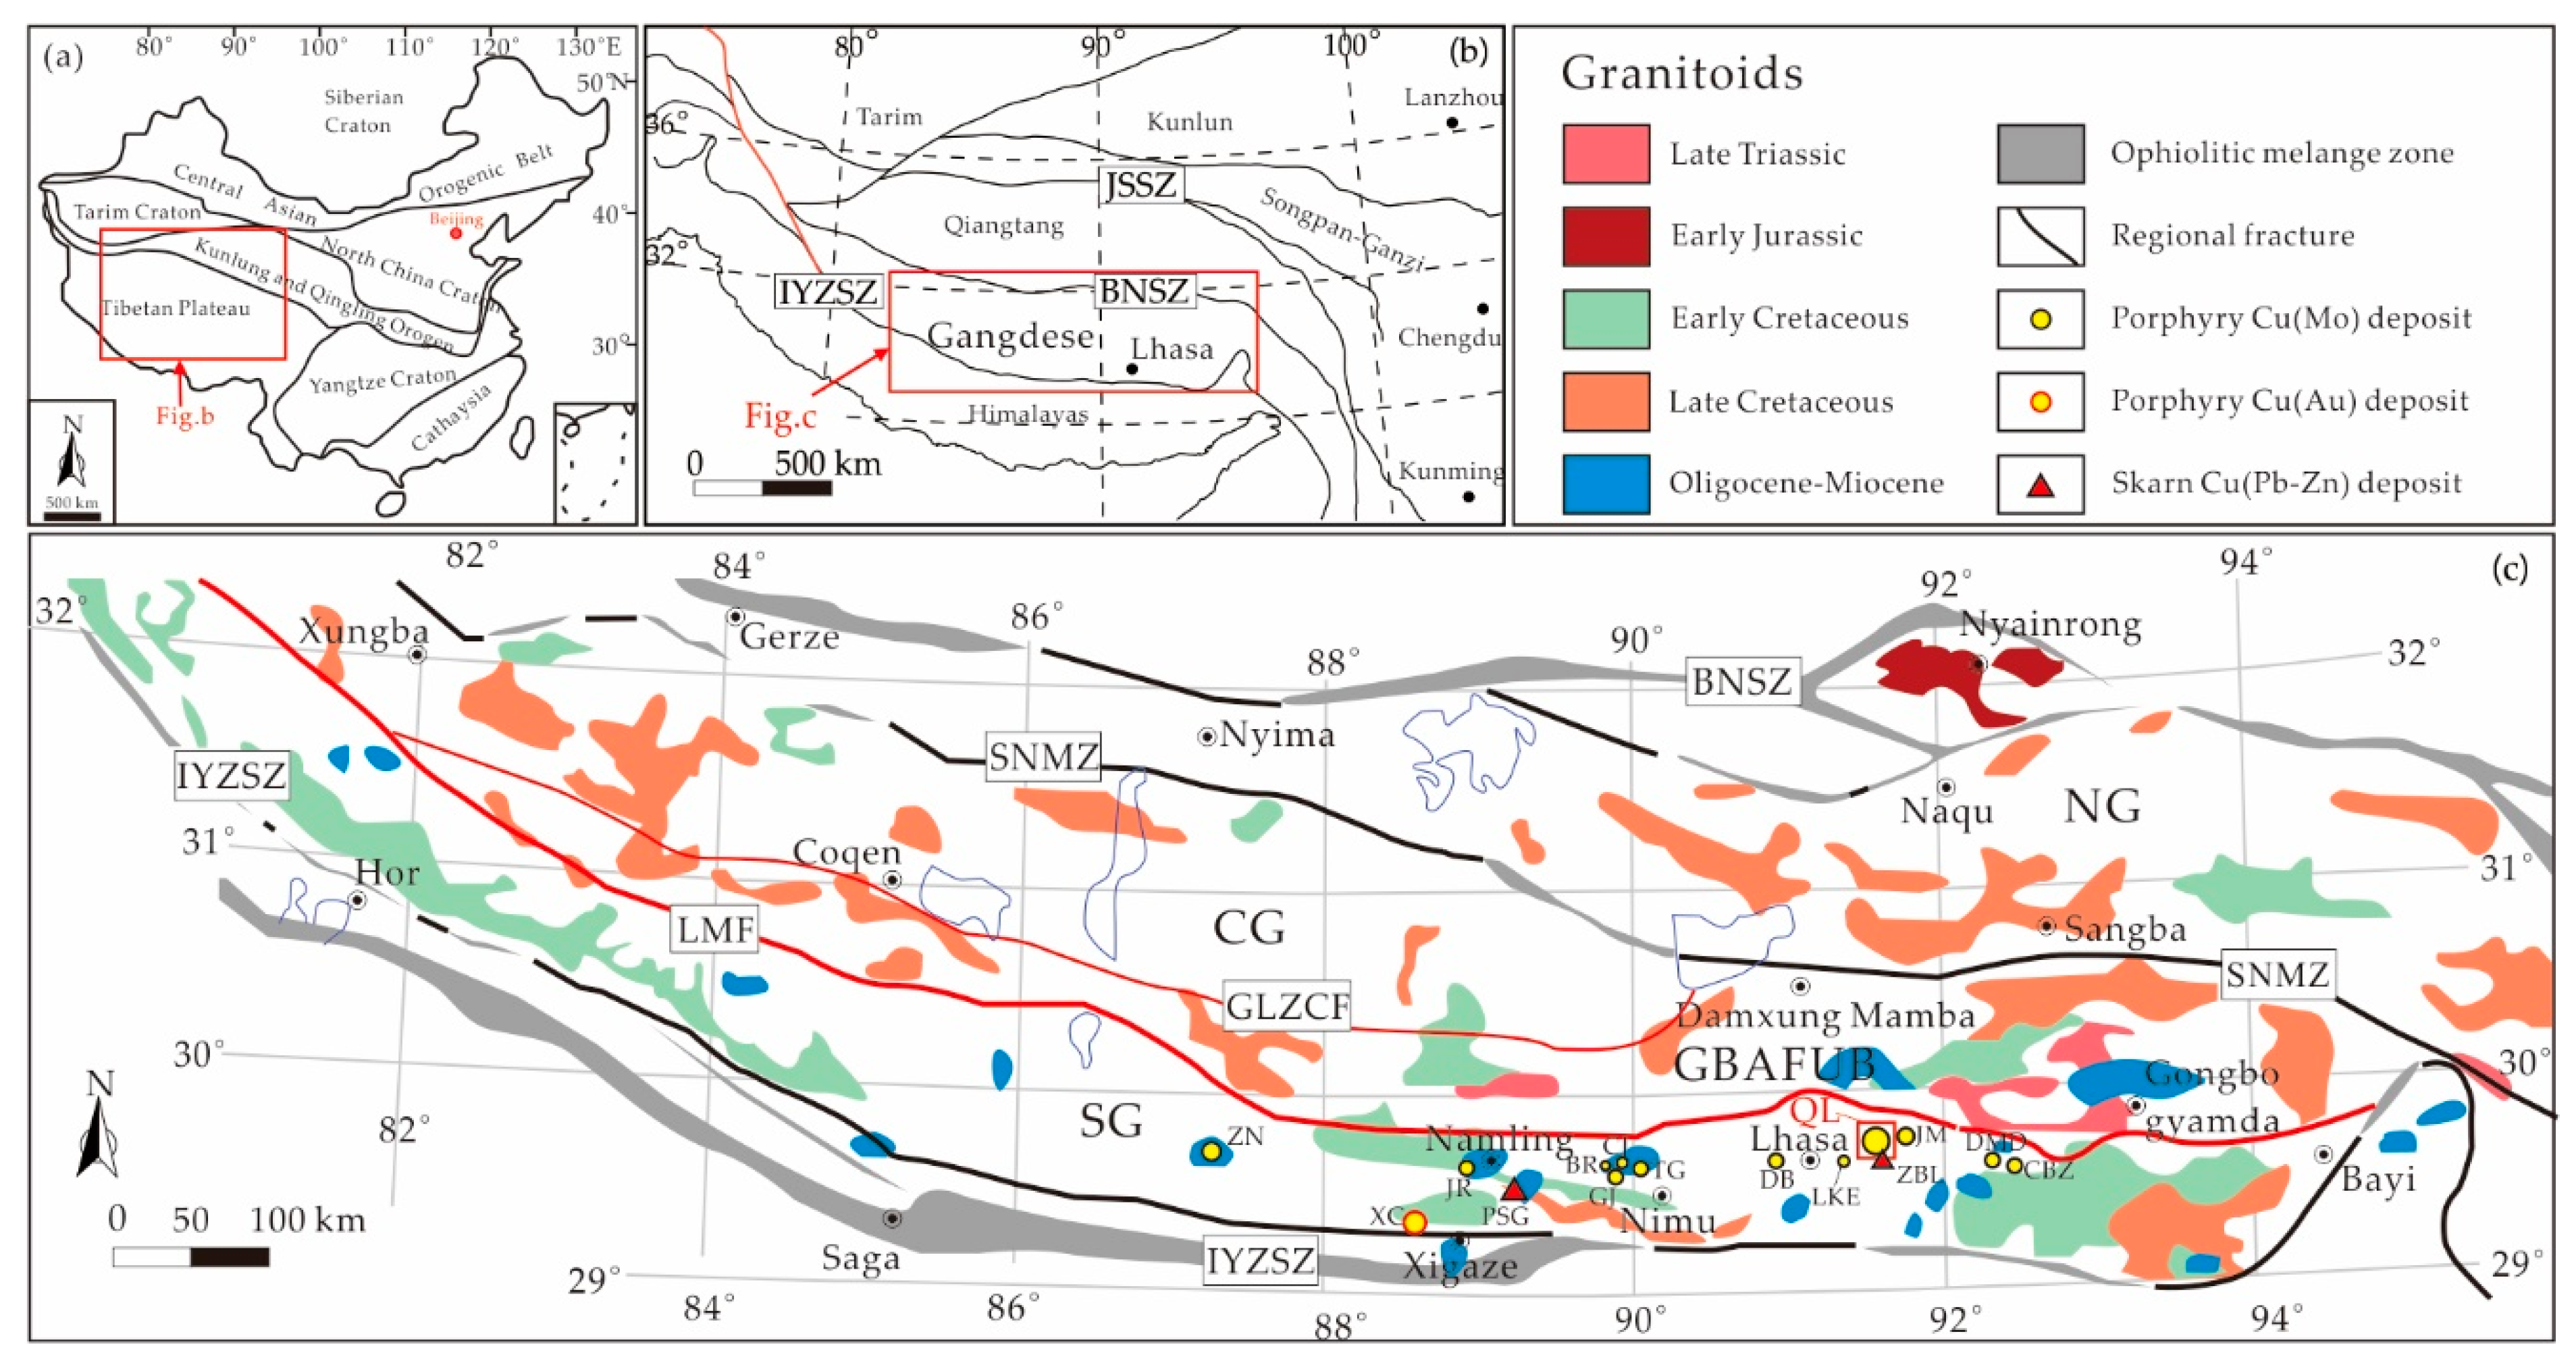
:1. Introduction

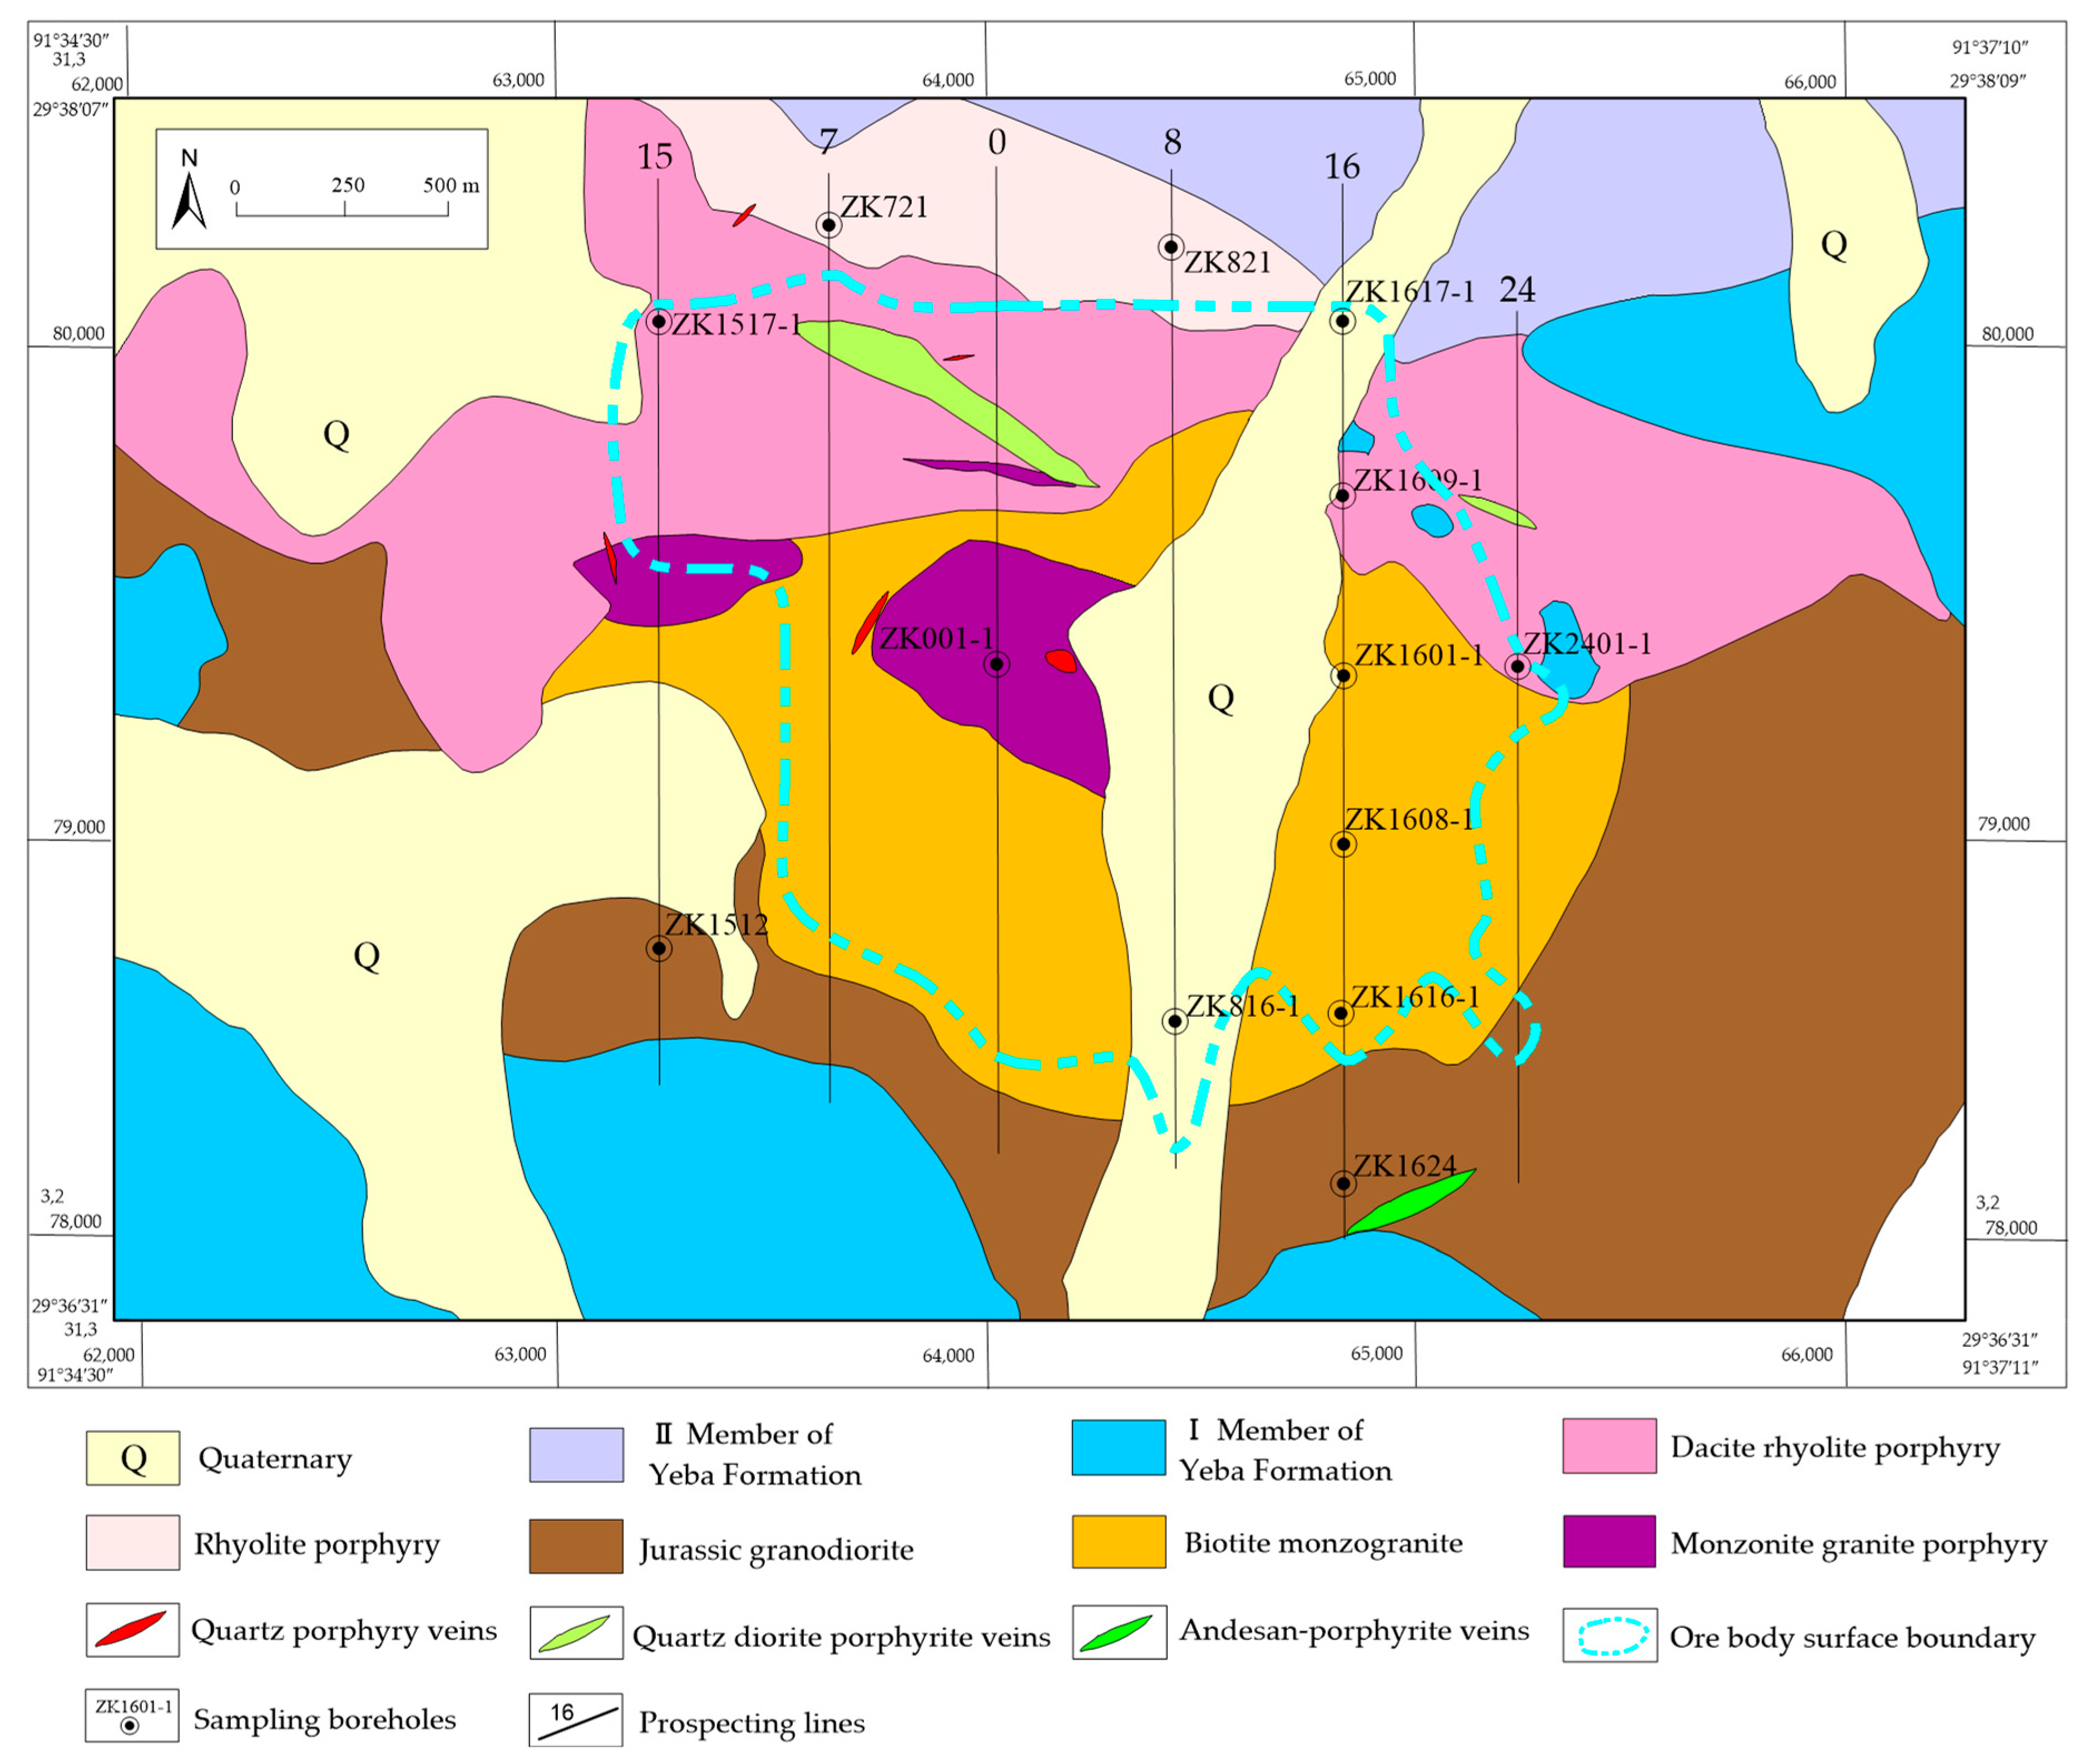
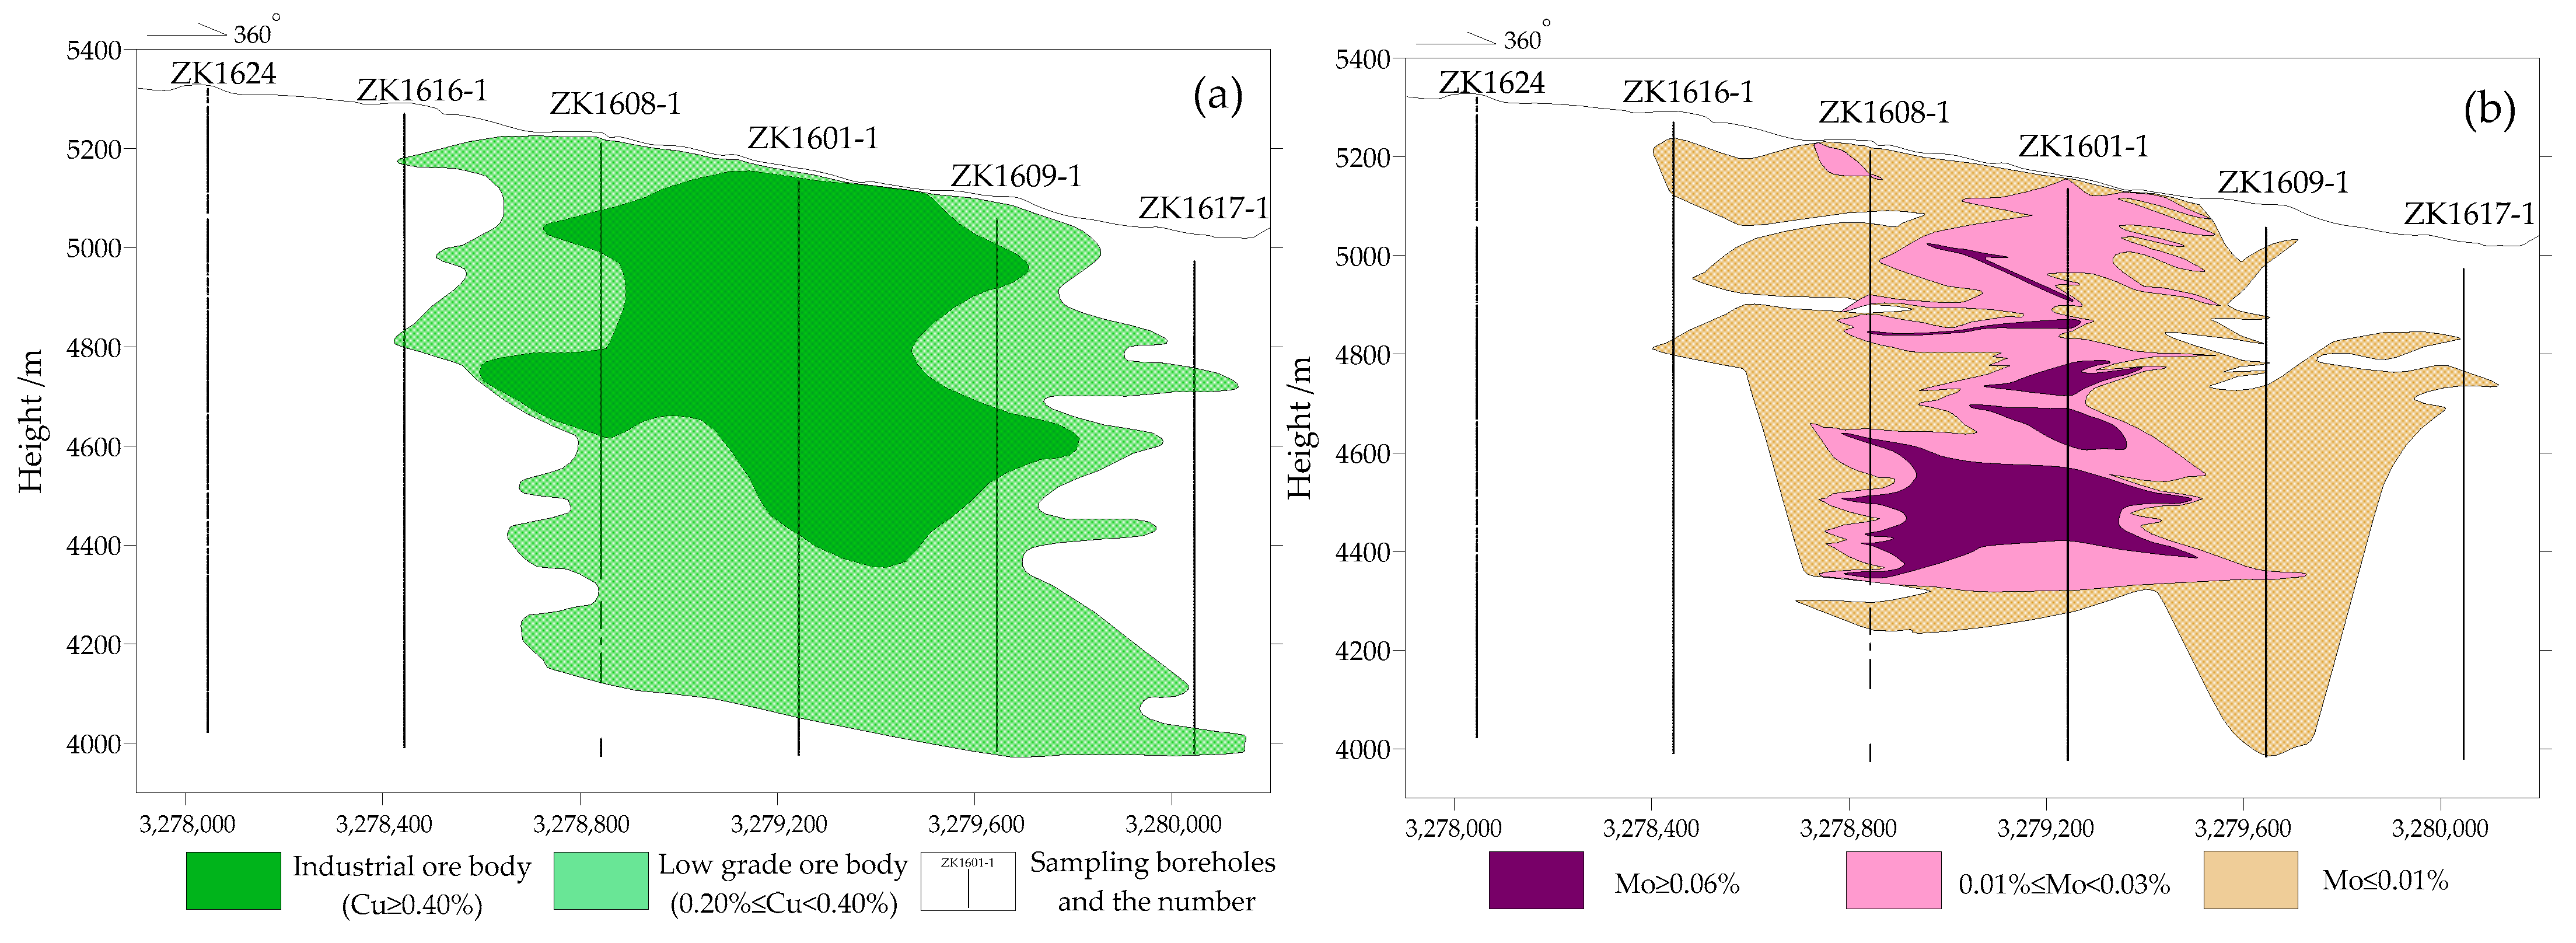
2. Deposit Geology and Mineralization
3. Materials and Methods
4. Data Processing and Analysis
4.1. Analysis of Correlation
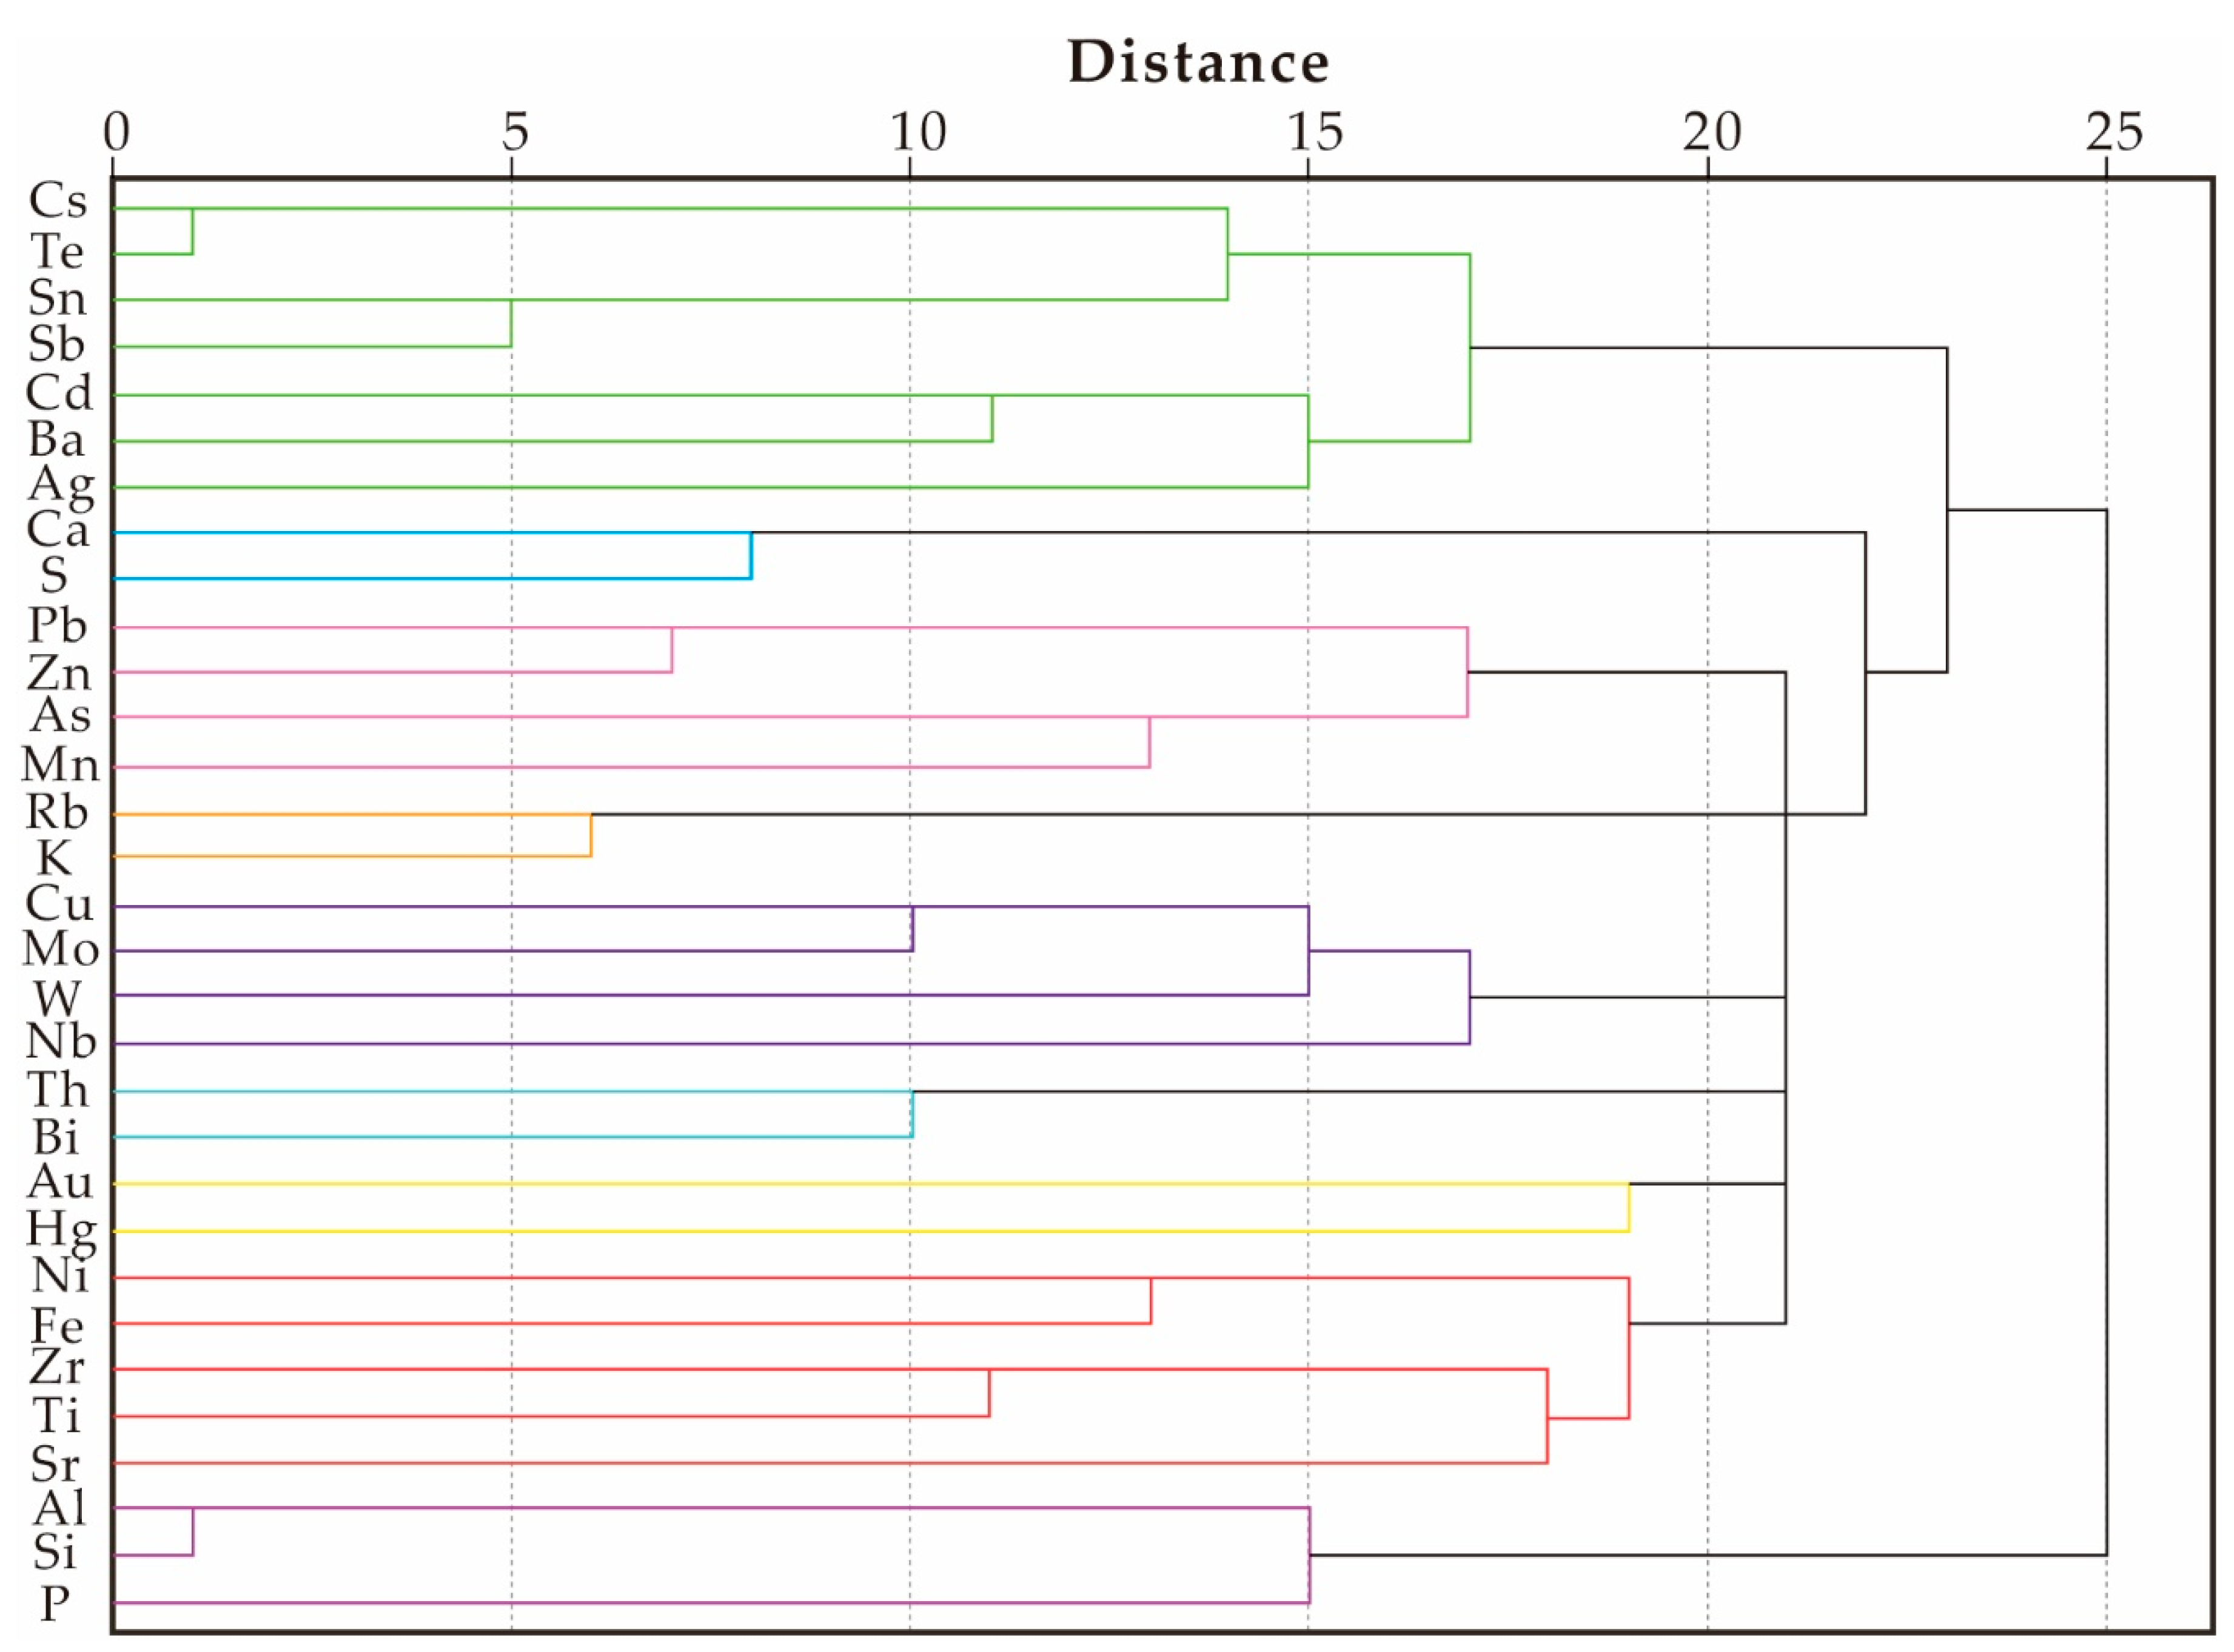
4.2. Cluster Analysis
4.3. Factor Analysis
4.4. Element Distribution Pattern
5. Discussion
5.1. Primary Halo Characteristics
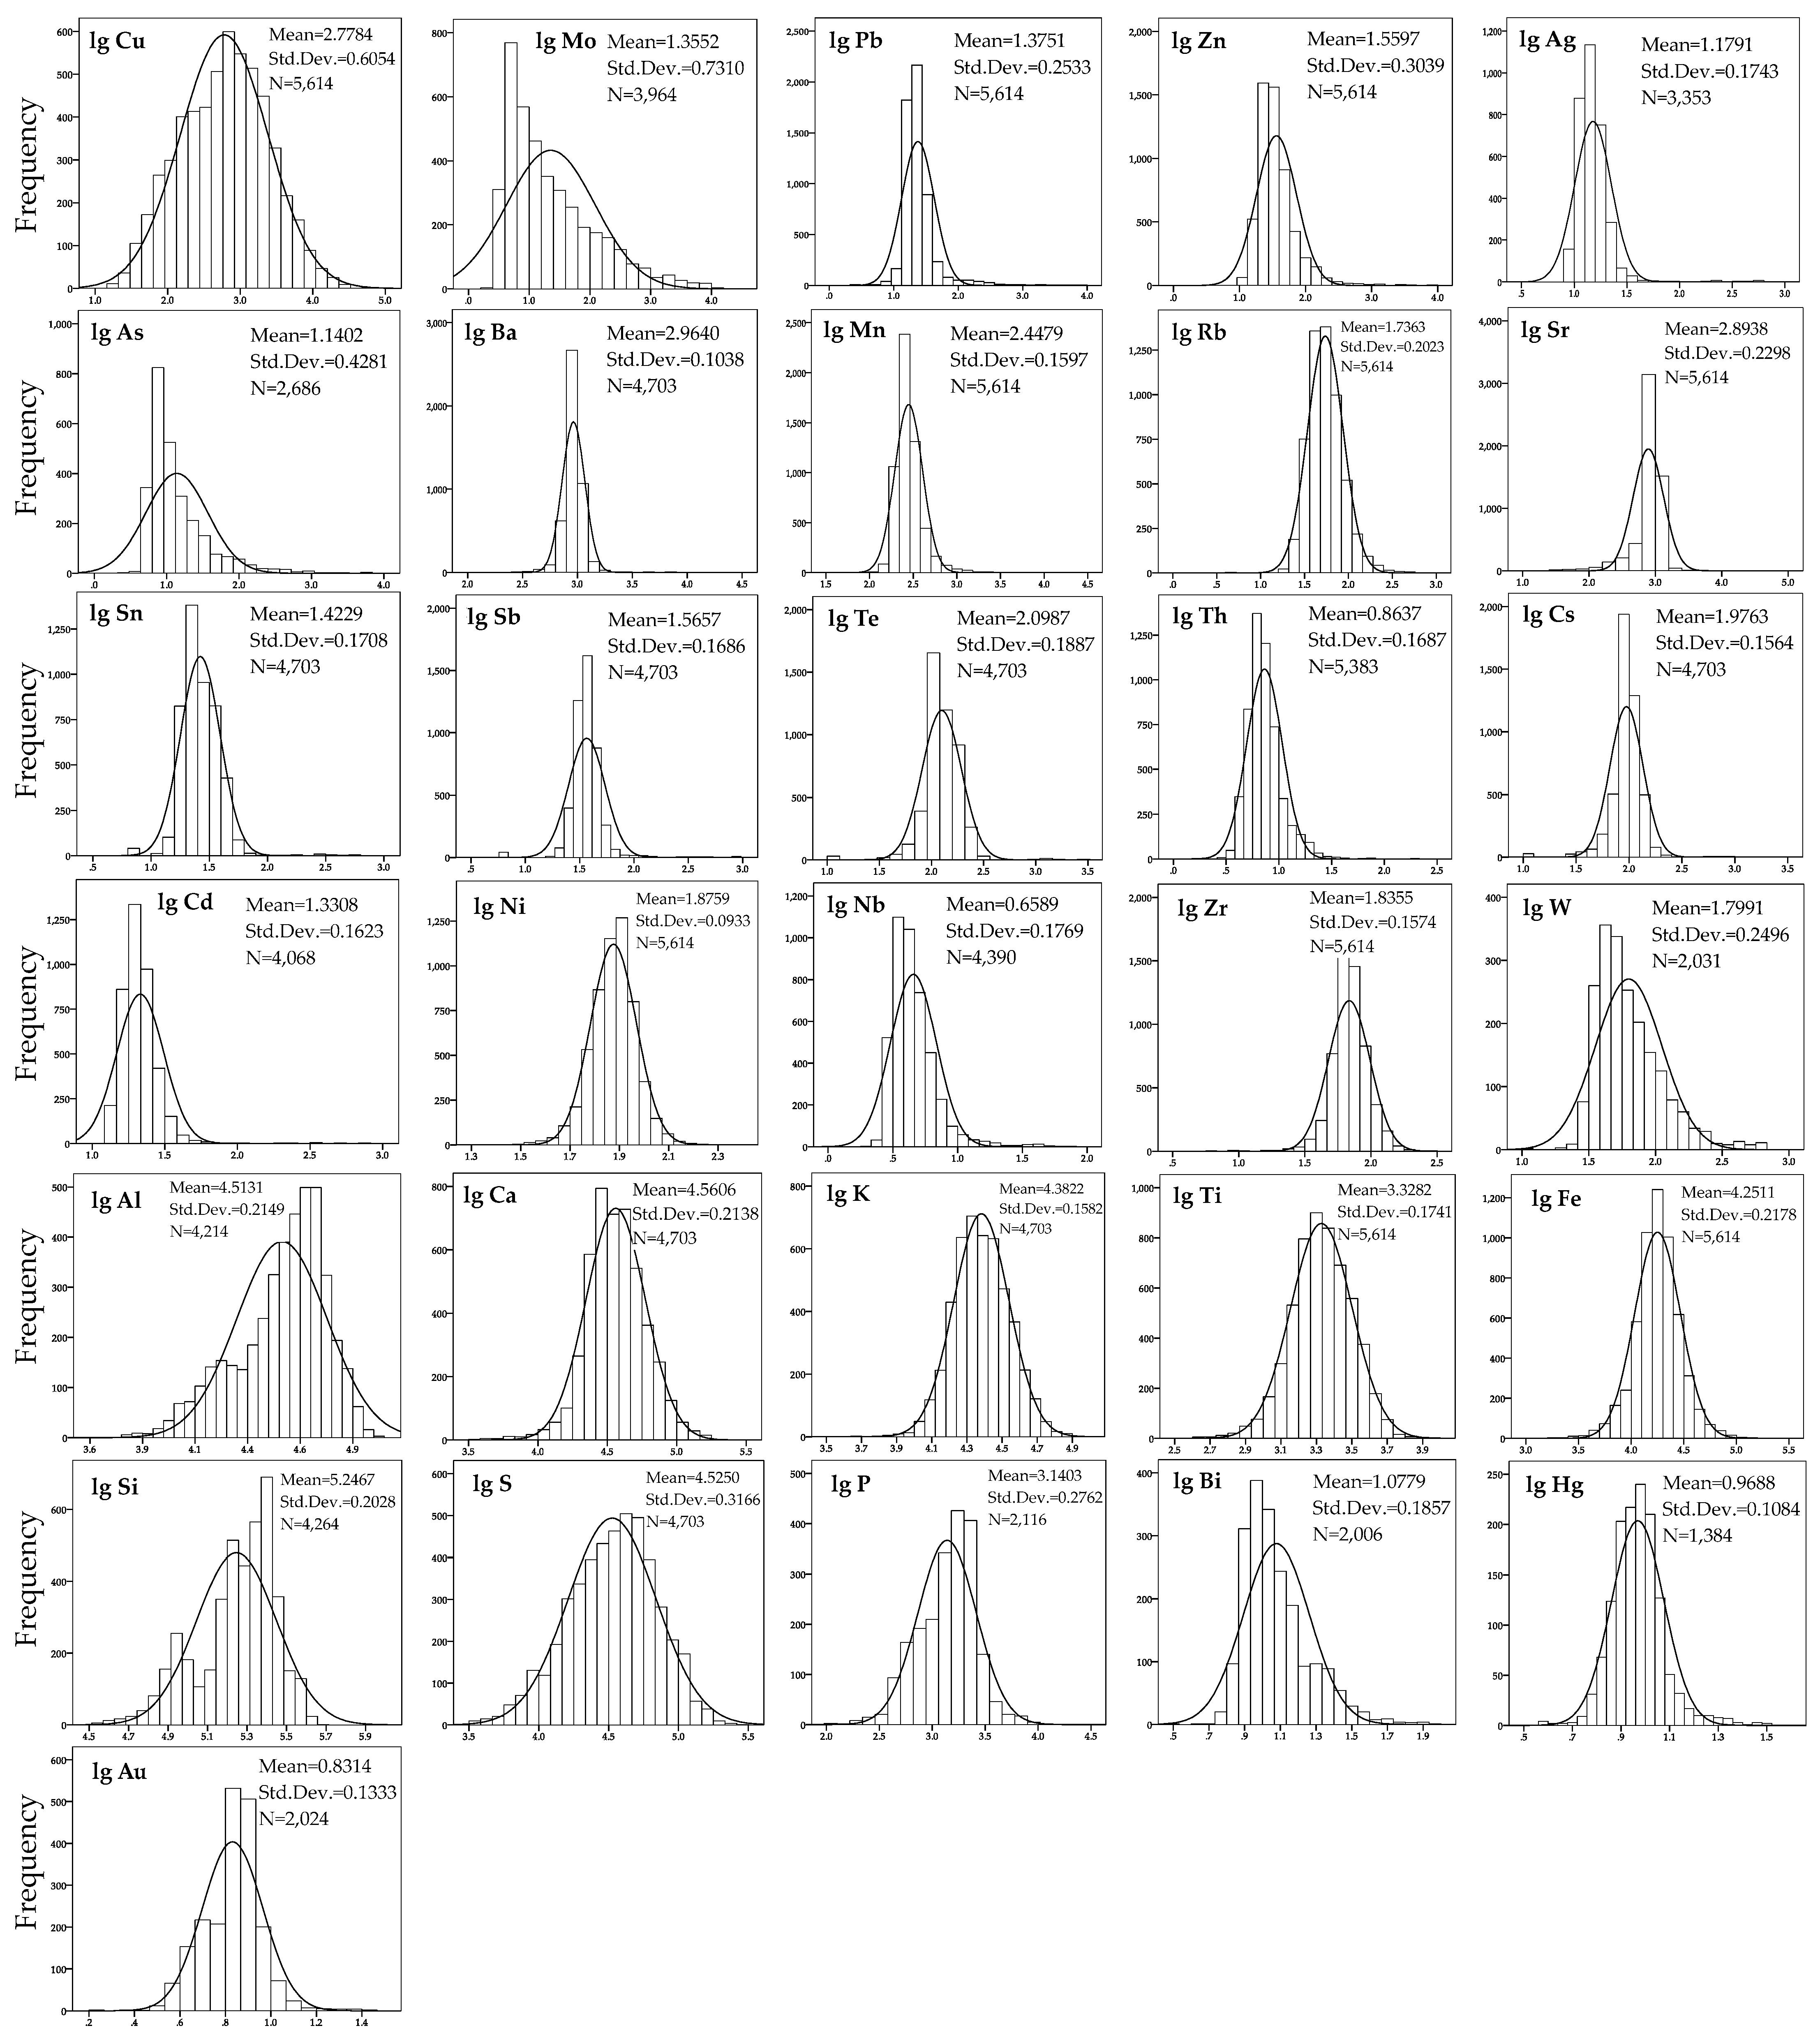
5.1.1. Background Value and Lower Exception Limit
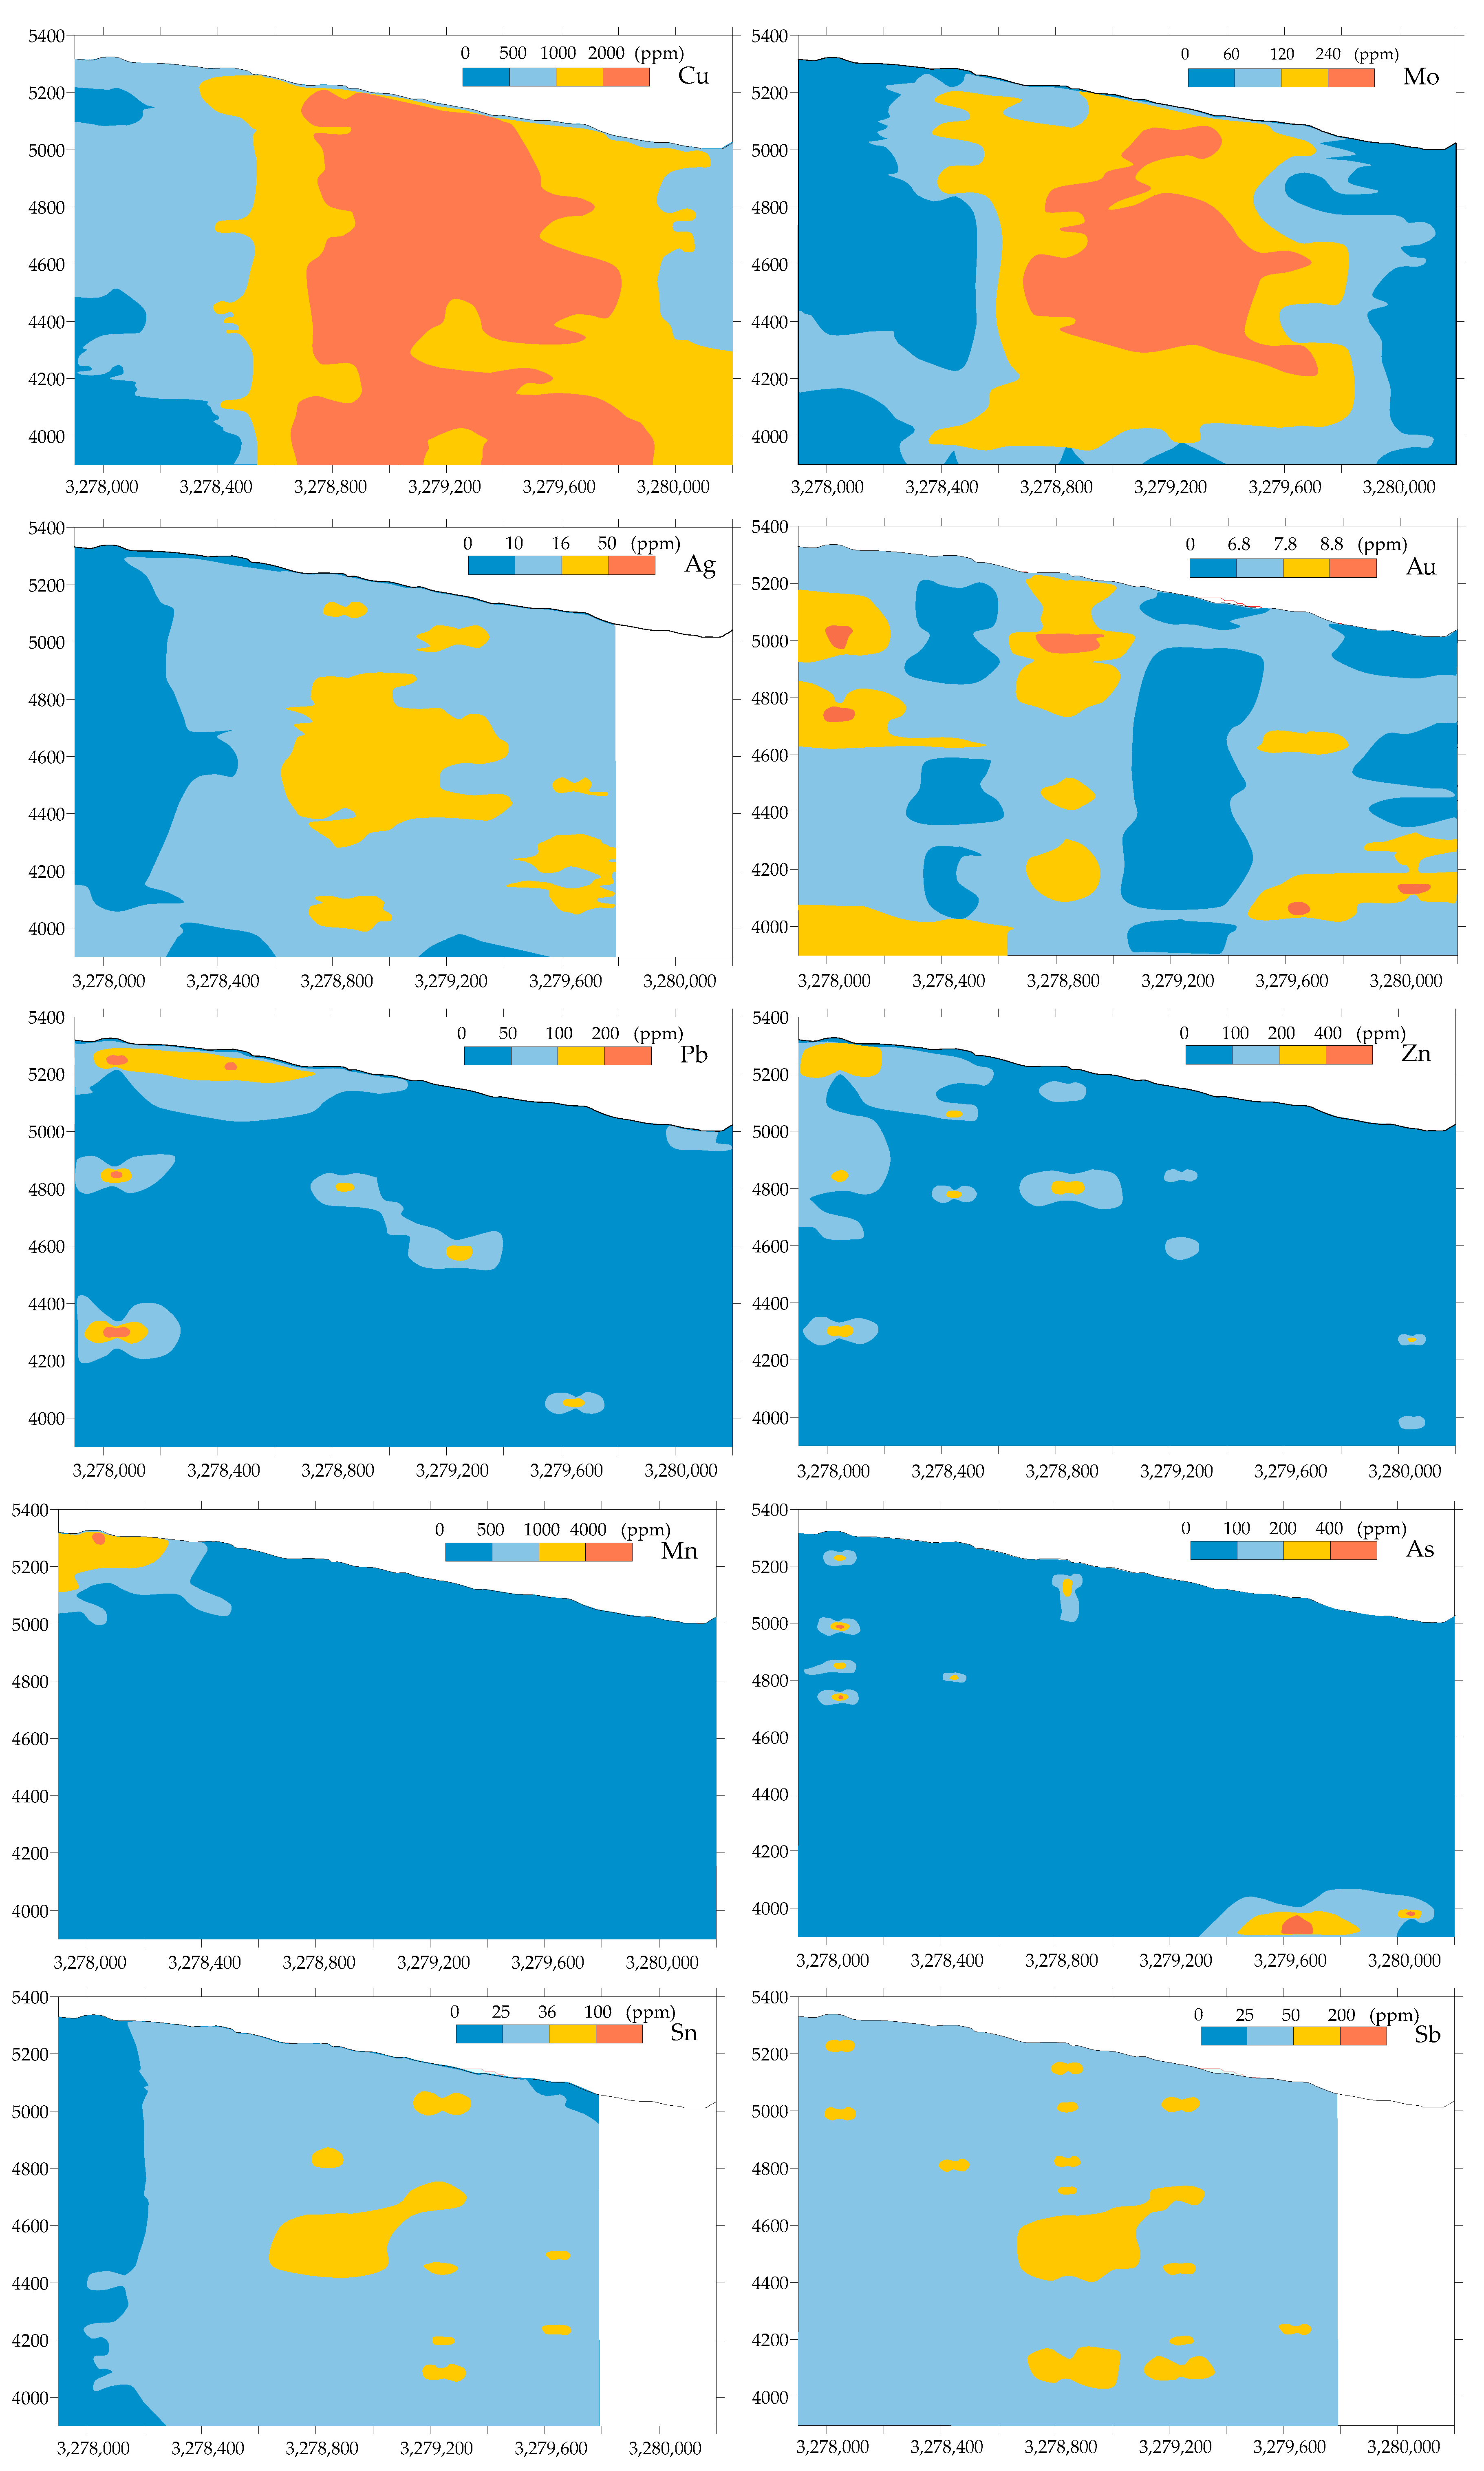
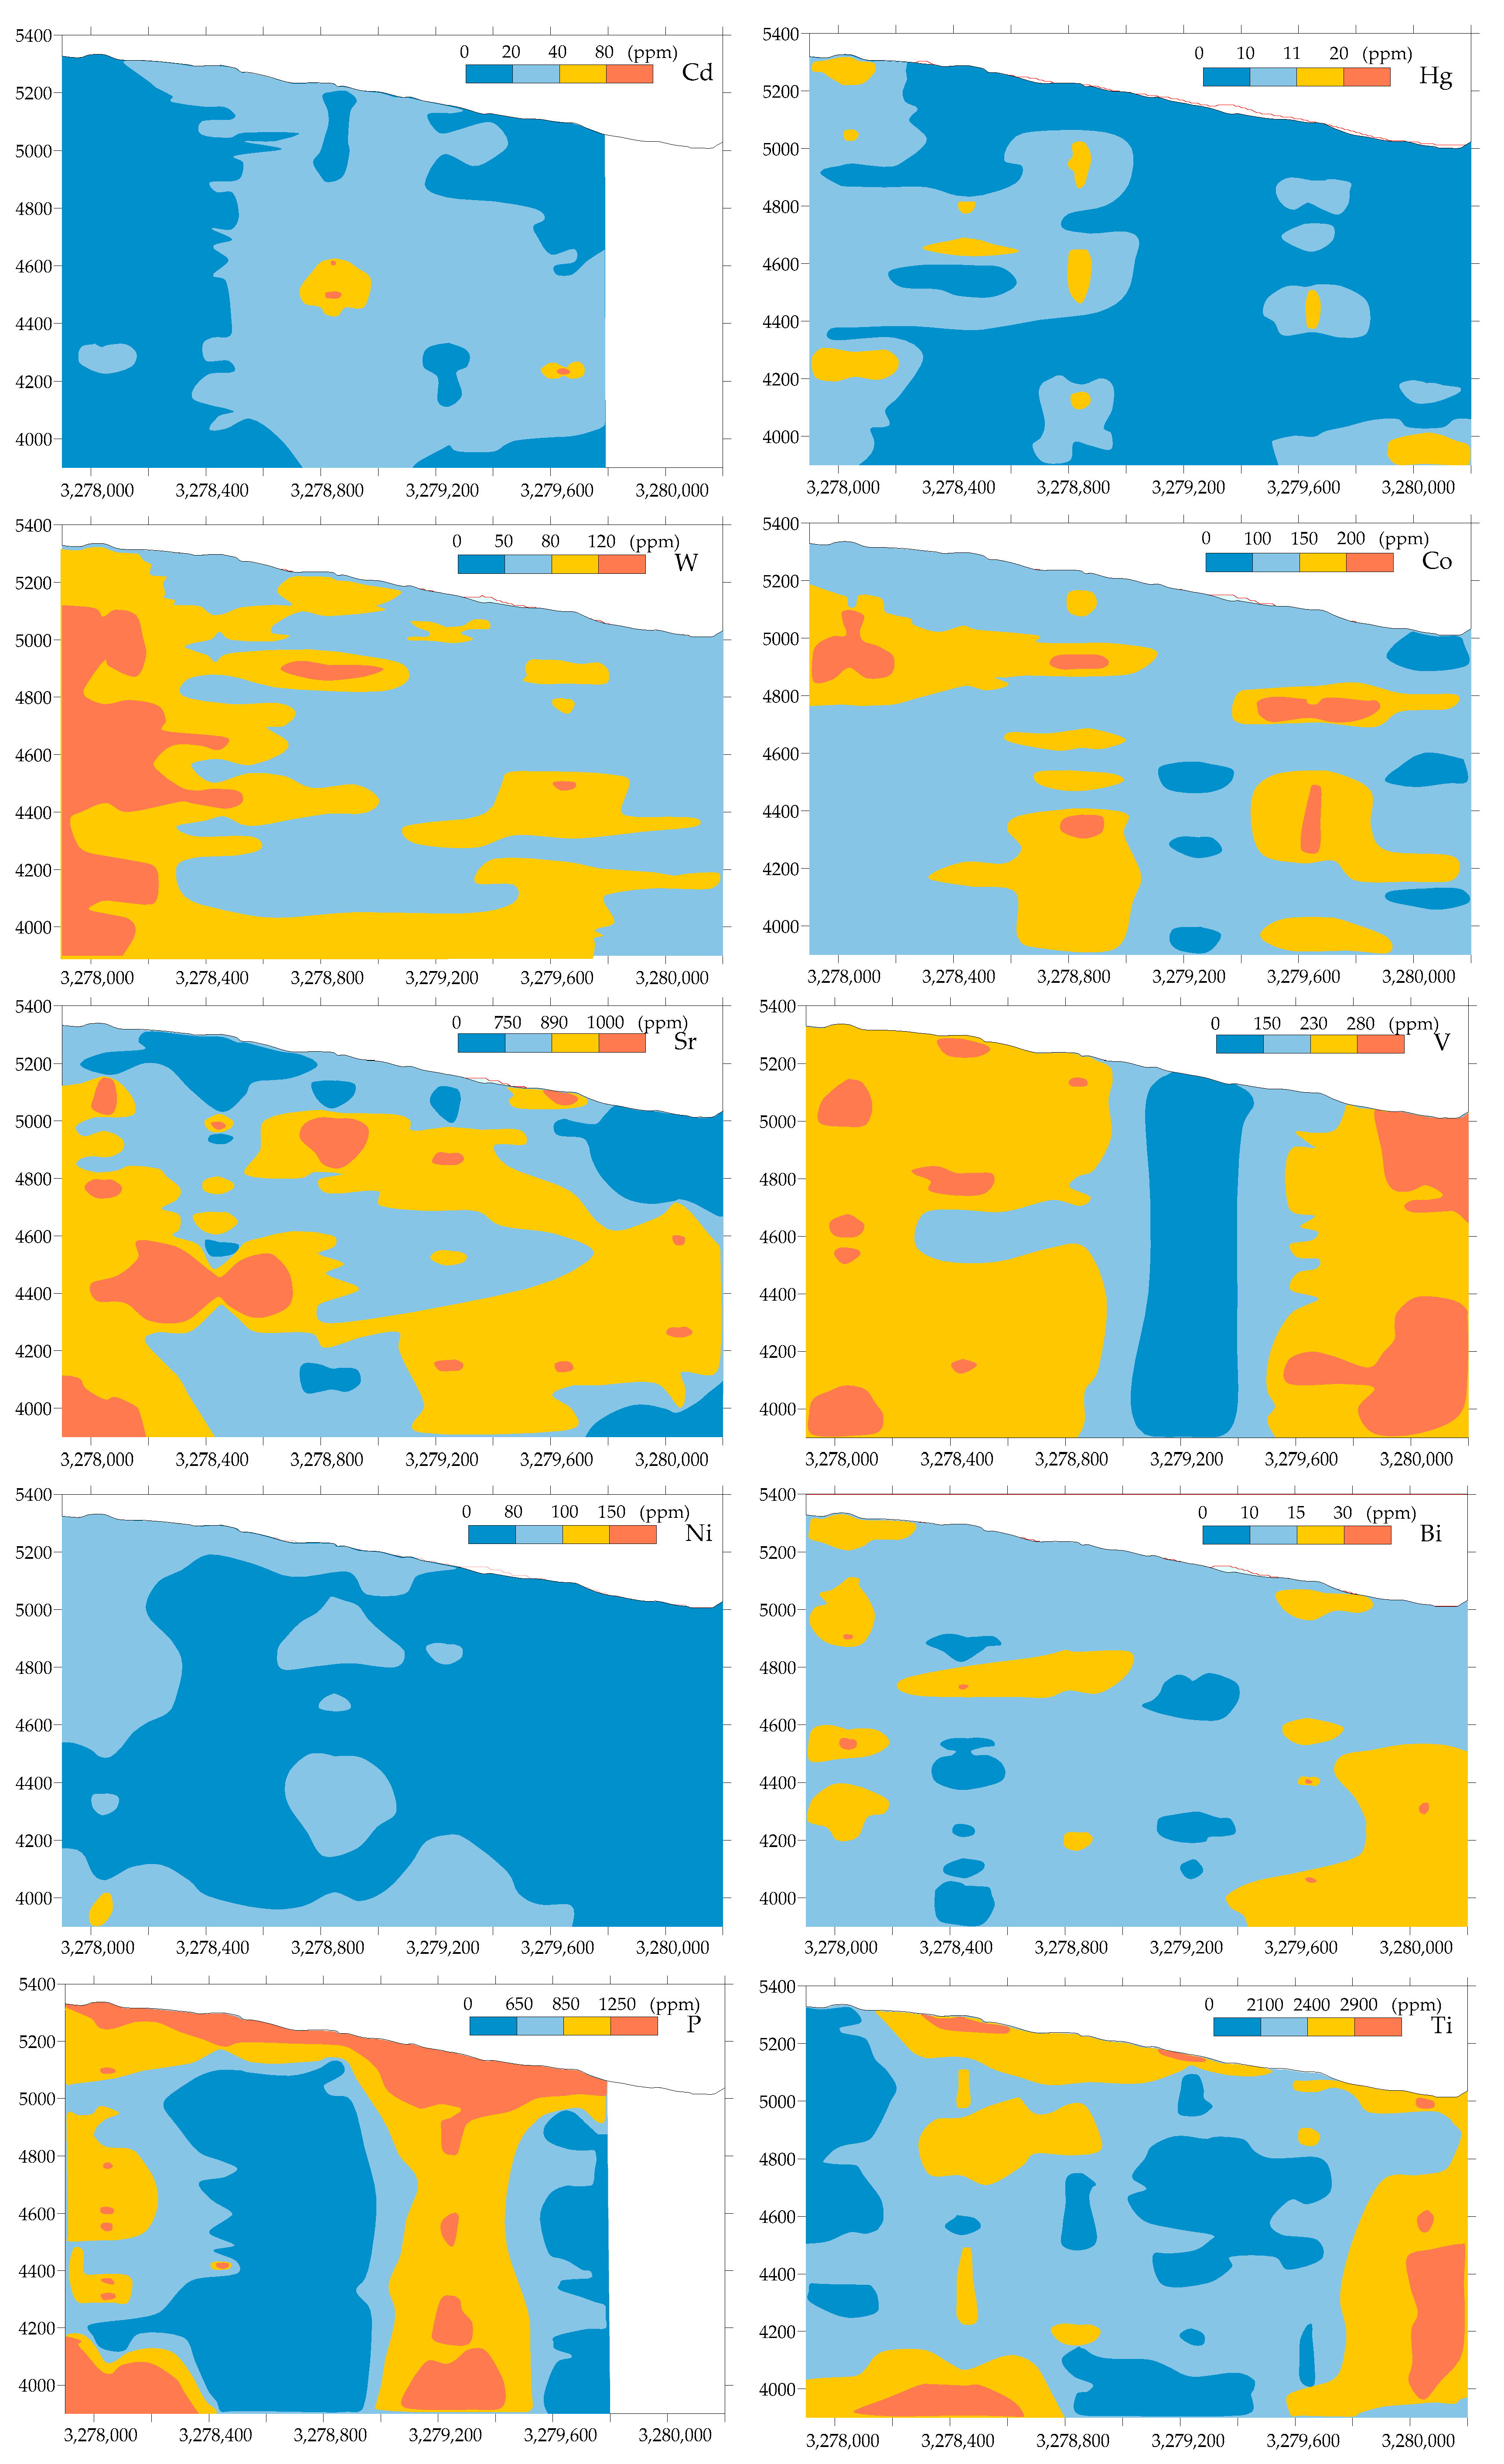
5.1.2. Profile Features of Primary Halo
5.1.3. Primary Halo Axial Zonation Sequence
5.2. Geochemical Parameters of Primary Halo
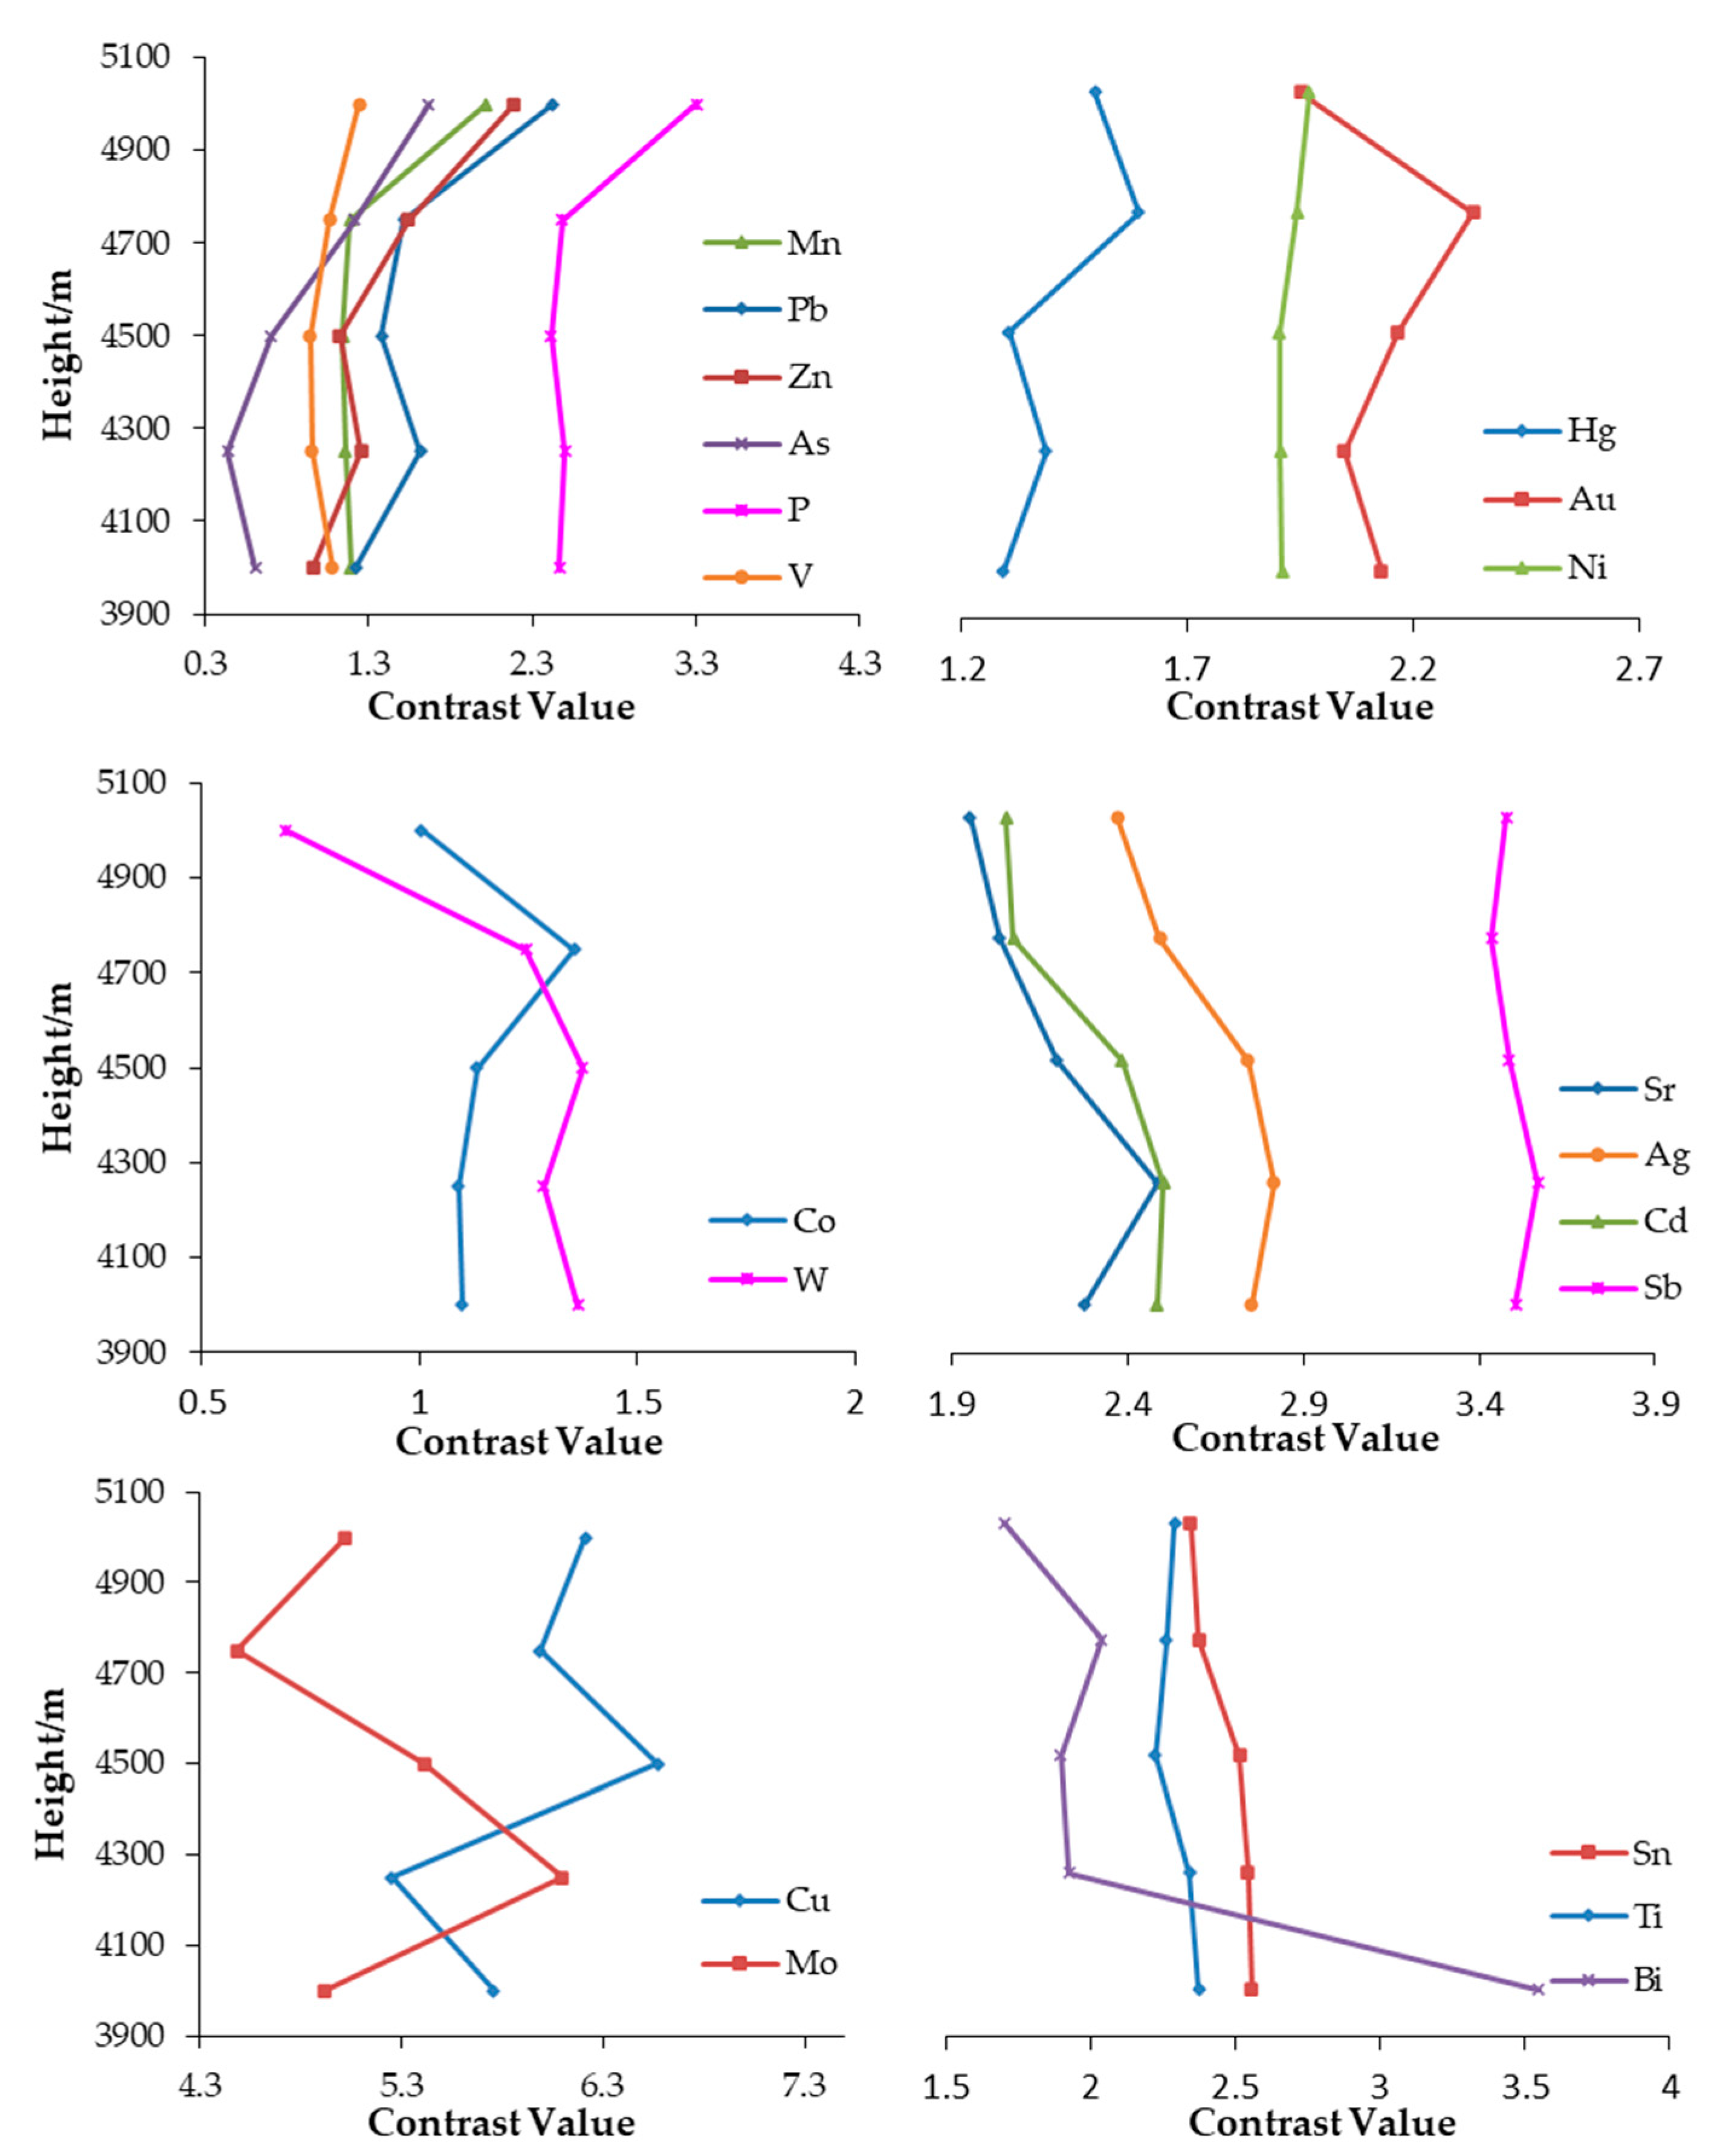
5.2.1. Element Content Contrast Coefficient
5.2.2. Geochemical Parameter Evaluation Index
5.3. Ore body Denudation Parameter Model
5.4. Ideal Superimposed Model of Primary Halo
6. Conclusions
Author Contributions
Funding
Data Availability Statement
Acknowledgments
Conflicts of Interest
References
- Zheng, Y. Study on Metallogenic Condition and Mechanism of Qulong Super-Large Porphyry Copper-Molybdenum Deposit in Tibet; Geological Publishing House: Beijing, China, 2013. (In Chinese) [Google Scholar]
- Zheng, Y.; Wu, S.; Ci, Q.; Chen, X.; Gao, S.; Liu, X.; Jiang, X.; Zheng, S.; Li, M.; Jiang, X. Cu-Mo-Au metallogenesis and minerogenetic series during superimposed. Earth Sci. 2021, 46, 1909–1940, (In Chinese with English Abstract). [Google Scholar]
- Wu, S.; Zheng, Y.; Sun, X. Subduction metasomatism and collision-related metamorphic dehydration controls on the fertility of porphyry copper ore-forming high Sr/Y magma in Tibet. Ore Geol. Rev. 2016, 73, 83–103. [Google Scholar] [CrossRef]
- Wu, S.; Zheng, Y.; Xu, B.; Jiang, G.; Yi, J.; Liu, X.; Zheng, S.; Li, L. Heterogeneous mantle associated with asthenosphere and Indian slab metasomatism: Constraints on fertilization of porphyry Cu mineralization in Tibetan orogen. Ore Geol. Rev. 2022, 140, 104601. [Google Scholar] [CrossRef]
- Yang, Z.; Hou, Z.; White, N.C.; Chang, Z.; Li, Z.; Song, Y. Geology of the post-collisional porphyry copper–molybdenum deposit at Qulong, Tibet. Ore Geol. Rev. 2009, 36, 133–159. [Google Scholar] [CrossRef]
- Meng, X.; Hou, Z.; Li, Z. Sulfur and lead isotope compositions of the Qulong porphyry copper deposit, Tibet: Implications for the sources of plutons and metals in the deposit. Acta Geol. Sin. 2006, 80, 554–560, (In Chinese with English Abstract). [Google Scholar]
- Li, Y.; Selby, D.; Condon, D.; Tapster, S. Cyclic magmatic-hydrothermal evolution in porphyry systems: High-precision U-Pb and Re-Os geochronology constraints on the Tibetan Qulong porphyry Cu-Mo deposit. Econ. Geol. 2017, 112, 1419–1440. [Google Scholar] [CrossRef]
- Qin, K. Qulong Porphyry-Skarn Copper-Molybdenum Deposit in Tibet; Science Press: Beijing, China, 2014. (In Chinese) [Google Scholar]
- Zhou, A.; Dai, J.; Li, Y.; Li, H.; Tang, J.; Wang, C. Differential exhumation histories between Qulong and Xiongcun porphyry copper deposits in the Gangdese copper metallogenic belt: Insights from low temperature thermochronology. Ore Geol. Rev. 2019, 107, 801–819. [Google Scholar] [CrossRef]
- Liu, C.; Hu, S. Characteristics of geochemical anomalies in the Qulong porphyry copper-molybdenum deposit of Tibet. Geophys. Geochem. Explor. 2003, 27, 441–444, (In Chinese with English Abstract). [Google Scholar]
- Goldberg, I.S.; Abramson, G.Y.; Los, V.L. Depletion and enrichment of primary haloes: Their importance in the genesis of and exploration for mineral deposits. Geochem.-Explor. Environ. A 2003, 3, 281–293. [Google Scholar] [CrossRef]
- Beus, A.A.; Gregorian, S.V. Geochemical Exploration Methods for Mineral Deposits; Applied Publishing Ltd.: Moscow, Russia, 1977. [Google Scholar]
- Li, Y.; Zhang, D.; Yang, N.; Zhang, T.; Shi, W. Primary geochemical haloes study of the possibly Carlin-like Dashui gold deposit for gold exploration in southern Gansu Province, central China. Geochem.-Explor. Environ. A 2018, 19, 6–23. [Google Scholar] [CrossRef]
- Schmid, S.; Taylor, W.R. Signifcance of carbonaceous shales and vanadium geochemical haloes in the exploration for rock phosphate deposits in the southern Georgina Basin, Central Australia. J. Geochem. Explor. 2009, 101, 91–92. [Google Scholar] [CrossRef]
- Imamalipour, A.; Karimlou, M.; Hajalilo, B. Geochemical zonality coeffcients in the primary halo of Tavreh mercury prospect, northwestern Iran: Implications for exploration of listwaenitic type mercury deposits. Geochem. Explor. Environ. Anal. 2018, 19, 347–357. [Google Scholar] [CrossRef]
- Boström, K. Geochemical exploration methods for mineral deposits. Earth-Sci. Rev. 1978, 14, 67–69. [Google Scholar] [CrossRef]
- Boyle, R.W. The prospect for geochemical exploration-predictable advances and new approaches. J. Geochem. Explor. 1984, 21, 1–18. [Google Scholar] [CrossRef]
- Shao, Y. Hydrothermal Deposit Prospecting of Lithochemical Methods (Primary Halo Methods); Geological Publishing House: Beijing, China, 1997. (In Chinese) [Google Scholar]
- Cameron, E.M.; Hamilton, S.M.; Leybourne, M.I.; Hall, G.E.M.; McClenaghan, M.B. Finding deeply buried deposits using geochemistry. Geochem.-Explor. Environ. A 2004, 4, 7–32. [Google Scholar] [CrossRef]
- Aliyari, F.; Yousefi, T.; Abedini, A.; Calagari, A.A. Primary geochemical haloes and alteration zoning applied to gold exploration in the Zarshuran Carlin-type deposit, northwestern Iran. J. Geochem. Explor. 2021, 231, 106864. [Google Scholar] [CrossRef]
- Liu, C.; Hu, S.; Ma, S. Lithochemical Exploration of Hydrothermal Polymetallic Ore; Geological Publishing House: Beijing, China, 2014. (In Chinese) [Google Scholar]
- Parsapoor, A.; Khalili, M.; Maghami, M. Discrimination between mineralized and unmineralized alteration zones using primary geochemical haloes in the Darreh-Zar porphyry copper deposit in Kerman, southeastern Iran. J. Afr. Earth Sci. 2017, 132, 109–126. [Google Scholar] [CrossRef]
- Cheng, W.; Yin, L.; Chen, C.; Song, Y.; Li, G.; Zhang, X.; Xia, B.; Dawa, C. Geochemical Characteristics of Primary Halos in No. I Ore Body of Keyue Pb Zn Sb Ag Polymetallic Deposit, Tibet. J. Jilin Univ. Earth Sci. Ed. 2016, 46, 1711–1723, (In Chinese with English Abstract). [Google Scholar]
- Li, Y.; Zhang, D.; Dai, L.; Wan, G.; Hou, B. Characteristics of structurally superimposed geochemical haloes at the polymetallic Xiasai silver-lead-zinc ore deposit in Sichuan Province, SW China. J. Geochem. Explor. 2016, 169, 100–122. [Google Scholar] [CrossRef]
- Zhu, X.; Yang, R.; Chen, Y.; Wang, L.; Li, G. Primary halo zonation in and a deep orebody prediction model for the inner-outer contact zone of the Laochang Sn-Cu deposit in Gejiu. Earth Sci. Front. 2021, 28, 112–127, (In Chinese with English Abstract). [Google Scholar]
- Zhu, D.C.; Zhao, Z.D.; Niu, Y.; Dilek, Y.; Wang, Q.; Ji, W.H.; Dong, G.C.; Sui, Q.L.; Liu, Y.S.; Yuan, H.L.; et al. Cambrian bimodal volcanism in the Lhasa Terrane, southern Tibet: Record of an early Paleozoic Andean-type magmatic arc in the Australian proto-Tethyan margin. Chem. Geol. 2012, 328, 290–308. [Google Scholar] [CrossRef]
- Zheng, Y.Y.; Sun, X.; Gao, S.B.; Zhao, Z.; Zhang, G.; Wu, S.; You, Z.; Li, J. Multiple Mineralization Events at the Jiru Porphyry Copper Deposit, Southern Tibet: Implications for Eocene and Miocene Magma Sources and Resource Potential. J. Asian Earth Sci. 2014, 79, 842–857. [Google Scholar] [CrossRef]
- Wu, S.; Zheng, Y.Y.; Sun, X.; Liu, S.A.; Geng, R.R.; You, Z.M.; Ouyang, H.T.; Lei, D.; Zhao, Z.Y. Origin of the Miocene porphyries and their mafic microgranular enclaves from Dabu porphyry Cu–Mo deposit, southern Tibet: Implications for magma mixing/mingling and mineralization. Int. Geol. Rev. 2014, 56, 571–595. [Google Scholar] [CrossRef]
- Pan, G.T.; Mo, X.X.; Hou, Z.Q.; Zhu, D.C.; Wang, L.Q.; Li, G.M.; Zhao, Z.D.; Geng, Q.R.; Liao, Z.L. Spatial-temporal framework of the Gangdese Orogenic Belt and its evolution. Acta Petrol. Sin. 2006, 22, 521–533, (In Chinese with English Abstract). [Google Scholar]
- Xiao, B.; Li, G.; Qin, K.; Li, J.; Zhao, J.; Liu, X.; Xia, D.; Wu, X.; Peng, Z. Magmatic intrusion center and mineralization center of Qulong porphyry Cu-Mo deposit in Tibet: Evidence from fissure-veinlets and mineralization intensity. Miner. Deposits. 2008, 2, 200–208, (In Chinese with English Abstract). [Google Scholar]
- Sun, W.; Zheng, Y.; Niu, X.; Qin, Y.; Wang, W.; Qiao, Y.; Di, B.; Hou, H.; Zhang, S.; Cong, P. Practicality of hand-held XRF analyzer in rapid exploration of porphyry copper deposit. Rock Miner. Anal. 2021, 40, 206–216, (In Chinese with English Abstract). [Google Scholar]
- Somerville, J. Critical factors affecting the assessment of student learning outcomes: A Delphi study of the opinions of community college personnel. J. Appl. Res. Community Coll. 2008, 15, 9–19. [Google Scholar]
- Williams, P.L.; Webb, C. The Delphi technique: A methodological discussion. J. Adv. Nurs. 1994, 19, 180–186. [Google Scholar] [CrossRef]
- Ghasemi, M.; Ghanavati, E.; Kazemi, J. Identifying the most effective geosite evaluation models in Iran using Delphi and analytic hierarchy process methods. Quaest. Geogr. 2021, 43, 21–31. [Google Scholar] [CrossRef]
- Howarth, R.J.; Sinding-Larsen, R. Multivariate analysis. In Statistics and Data Analysis in Geochemical Prospecting; Howarth, R.J., Ed.; Handbook of Exploration Geochemistry; Elsevier: Amsterdam, The Netherlands, 1983; Volme 2, pp. 207–291. [Google Scholar]
- Ji, H.; Zhu, Y.; Wu, X. Correspondence cluster analysis and its application in exploration geochemistry. J. Geochem. Explor. 1995, 55, 137–144. [Google Scholar] [CrossRef]
- Wang, C.; Carranza, E.J.M.; Zhang, S.; Zhang, J.; Liu, X.; Zhang, D.; Sun, X.; Duan, C. Characterization of primary geochemical haloes for gold exploration at the Huanxiangwa gold deposit, China. J. Geochem. Explor. 2013, 124, 40–58. [Google Scholar] [CrossRef]
- Kaiser, H.F. The application of electronic computers to factor analysis. Educ. Psychol. Meas. 1960, 20, 141–151. [Google Scholar] [CrossRef]
- Hu, Y. Multivariate Analysis in Geochemistry; China University of Geosciences Publishing House: Wuhan, China, 1991. (In Chinese) [Google Scholar]
- Jiang, J.; Cheng, J.; Qi, S.; Xiang, W. Applied Geochemistry; China University of Geosciences Publishing House: Wuhan, China, 2006. (In Chinese) [Google Scholar]
- Wang, J.; Zang, X.; Guo, X.; Xie, H.; Zhao, L.; Sun, Y. The improved Gregorian’s zoning index calculating method. J. Jilin Univ. Earth Sci. Ed. 2007, 37, 884–888, (In Chinese with English Abstract). [Google Scholar]
- Zhu, B.; Xu, W. Geochemical characteristics of mineralization of porphyry copper deposits. Geochemical 1984, 2, 107–117, (In Chinese with English Abstract). [Google Scholar]
- Liu, G.; Dai, M.; Qi, J.; Zhang, J. Geochemical characteristics of primary halos and ore-search prospecting in the depth of the Zijinshan copper-gold deposit, Fujian province. Geophys. Geochem. Explor. 2014, 38, 434–440, (In Chinese with English Abstract). [Google Scholar]


| Cu | Mo | Pb | Zn | Ag | Au | W | Bi | As | Sn | Sb | Cd | Ba | Ni | Rb | Fe | Mn | S | |
|---|---|---|---|---|---|---|---|---|---|---|---|---|---|---|---|---|---|---|
| Cu | 1.000 | |||||||||||||||||
| Mo | 0.466 ** | 1.000 | ||||||||||||||||
| Pb | 0.326 ** | 0.234 ** | 1.000 | |||||||||||||||
| Zn | 0.368 ** | 0.133 ** | 0.616 ** | 1.000 | ||||||||||||||
| Ag | 0.253 ** | 0.228 ** | 0.119 ** | 0.067 ** | 1.000 | |||||||||||||
| Au | 0.112 ** | 0.069 ** | 0.025 | 0.031 * | −0.014 | 1.000 | ||||||||||||
| W | 0.429 ** | 0.214 ** | 0.181 ** | 0.214 ** | 0.060 ** | 0.106 ** | 1.000 | |||||||||||
| Bi | 0.023 | 0.012 | 0.155 ** | 0.106 ** | −0.120 ** | 0.041 ** | 0.169 ** | 1.000 | ||||||||||
| As | 0.251 ** | 0.198 ** | 0.397 ** | 0.484 ** | 0.024 | 0.024 | 0.184 ** | 0.165 ** | 1.000 | |||||||||
| Sn | 0.177 ** | 0.240 ** | 0.075 ** | −0.004 | 0.649 ** | −0.009 | 0.001 | −0.168 ** | 0.010 | 1.000 | ||||||||
| Sb | 0.171 ** | 0.198 ** | 0.089 ** | 0.047 ** | 0.607 ** | 0.010 | −0.043 ** | −0.253 ** | 0.054 ** | 0.899 ** | 1.000 | |||||||
| Cd | 0.150 ** | 0.206 ** | 0.084 ** | 0.046 ** | 0.591 ** | −0.008 | −0.033 * | −0.199 ** | −0.011 | 0.744 ** | 0.738 ** | 1.000 | ||||||
| Ba | 0.115 ** | 0.193 ** | 0.111 ** | 0.035 * | 0.291 ** | 0.065 ** | 0.092 ** | 0.020 | −0.073 ** | 0.521 ** | 0.435 ** | 0.440 ** | 1.000 | |||||
| Ni | 0.142 ** | 0.019 | 0.103 ** | 0.163 ** | 0.081 ** | 0.097 ** | 0.080 ** | −0.114 ** | 0.069 ** | 0.197 ** | 0.227 ** | 0.146 ** | 0.272 ** | 1.000 | ||||
| Rb | 0.337 ** | 0.236 ** | 0.320 ** | 0.277 ** | 0.012 | 0.145 ** | 0.335 ** | 0.209 ** | 0.414 ** | −0.049 ** | −0.065 ** | −0.087 ** | 0.134 ** | 0.047 ** | 1.000 | |||
| Fe | 0.241 ** | −0.006 | 0.148 ** | 0.366 ** | −0.028 * | 0.038 ** | 0.253 ** | 0.138 ** | 0.207 ** | −0.094 ** | −0.139 ** | −0.126 ** | 0.152 ** | 0.261 ** | 0.150 ** | 1.000 | ||
| Mn | −0.071 ** | −0.154 ** | 0.183 ** | 0.484 ** | −0.078 ** | −0.013 | 0.008 | 0.055 ** | 0.357 ** | −0.109 ** | −0.036 ** | −0.059 ** | 0.054 ** | 0.230 ** | 0.203 ** | 0.345 ** | 1.000 | |
| S | 0.396 ** | 0.326 ** | 0.090 ** | −0.029 | 0.220 ** | 0.080 ** | 0.247 ** | 0.075 ** | 0.084 ** | 0.334 ** | 0.186 ** | 0.113 ** | 0.144 ** | 0.102 ** | 0.226 ** | 0.155 ** | −0.231 ** | 1.000 |
| Factor | Factor Composition | Eigenvalues | % of Variance | Cum. of Variance |
|---|---|---|---|---|
| F1 | 0.902Te + 0.883Cs + 0.849Sn + 0.819Sb + 0.757Cd + 0.641Ba + 0.584Ag | 4.560 | 14.711 | 14.711 |
| F2 | 0.848Pb + 0.735Zn + 0.640As + 0.612Mn | 2.457 | 7.924 | 22.635 |
| F3 | 0.956Al + 0.953Si + 0.591P | 2.396 | 7.730 | 30.365 |
| F4 | 0.872K + 0.813Rb | 2.038 | 6.575 | 36.940 |
| F5 | 0.735Fe + 0.740Ti + (0.454Zr) | 1.850 | 5.968 | 42.908 |
| F6 | 0.748Cu + 0.635W | 1.844 | 5.947 | 48.855 |
| F7 | 0.871Ca + 0.810S | 1.731 | 5.583 | 54.438 |
| F8 | 0.846Bi + 0.794Th | 1.564 | 5.046 | 59.484 |
| F9 | 0.841Sr + (0.429Zr) | 1.531 | 4.940 | 64.424 |
| F10 | 0.870Nb + 0.722Mo | 1.487 | 4.797 | 69.221 |
| F11 | 0.695Au + 0.589Ni + (0.367Hg) | 1.277 | 4.119 | 73.340 |
| Anomaly Classification | Cu | Mo | Ag | Au | S | Fe | Ti | Ca | K | Al | Si | Mg | P | Mn |
| (Sub) Inner Band | 2000 * | 240 * | 50 ** | 8.8 ** | 6% *** | 3% | 0.29% | 5% | 3.1% | 4.5% | 27% | 2% | 0.125% | 0.4% |
| Mesozone | 1000 | 120 | 16 | 7.8 | 4.5% | 2.1% | 0.24% | 4% | 2.7% | 4% | 23% | 1.5% | 0.085% | 0.1% |
| Outer Band (Anomaly Threshold) | 500 | 50 | 10 | 6.8 | 2% | 1.7% | 0.21% | 2.5% | 2.2% | 3.2% | 16% | 1% | 0.065% | 0.05% |
| Sub-outer Band (Background Value) | 250 | 25 | 5 | 2 | — | — | 0.10% | — | — | — | — | — | 0.050% | 0.025% |
| Anomaly Classification | Pb | Zn | As | Sb | Sn | Cd | V | Sr | Ni | Co | W | Bi | Hg | Ba |
| (Sub) Inner Band | 200 | 400 | 400 | 200 | 100 | 80 | 280 | 1000 | 200 | 200 | 120 | 40 | 20 | 5000 |
| Mesozone | 100 | 200 | 200 | 50 | 36 | 40 | 230 | 890 | 100 | 150 | 80 | 20 | 11 | 1250 |
| Outer Band (Anomaly Threshold) | 50 | 100 | 100 | 25 | 25 | 20 | 150 | 750 | 80 | 100 | 50 | 10 | 10 | 1000 |
| Sub-outer Band (Background Value) | 25 | 50 | 50 | 12 | 12 | 10 | 40 | 400 | 40 | 50 | 25 | 5 | 5 | 500 |
| Cross-Sections | Cu | Mo | Pb | Zn | Au | Ag | As | Hg | Sn | Sb |
| I | 0.077 | 0.035 | 0.105 | 0.105 | 0.000 | 0.000 | 0.105 | 0.072 | 0.000 | 0.034 |
| II | 0.071 | 0.000 | 0.031 | 0.060 | 0.127 | 0.035 | 0.080 | 0.127 | 0.016 | 0.000 |
| III | 0.135 | 0.078 | 0.018 | 0.018 | 0.077 | 0.114 | 0.029 | 0.006 | 0.109 | 0.053 |
| IV | 0.000 | 0.107 | 0.036 | 0.026 | 0.027 | 0.107 | 0.000 | 0.034 | 0.101 | 0.107 |
| V | 0.042 | 0.030 | 0.000 | 0.000 | 0.052 | 0.095 | 0.015 | 0.000 | 0.110 | 0.057 |
| Cross-Sections | Mn | Ni | W | Bi | Co | Cd | Sr | V | Ti | P |
| I | 0.105 | 0.105 | 0.000 | 0.000 | 0.000 | 0.000 | 0.000 | 0.105 | 0.047 | 0.105 |
| II | 0.006 | 0.076 | 0.103 | 0.023 | 0.127 | 0.006 | 0.020 | 0.052 | 0.033 | 0.010 |
| III | 0.000 | 0.000 | 0.135 | 0.014 | 0.049 | 0.100 | 0.063 | 0.000 | 0.000 | 0.000 |
| IV | 0.002 | 0.003 | 0.094 | 0.013 | 0.026 | 0.107 | 0.107 | 0.006 | 0.085 | 0.011 |
| V | 0.007 | 0.007 | 0.108 | 0.110 | 0.030 | 0.105 | 0.067 | 0.050 | 0.110 | 0.006 |
| IDX | Evaluation Index | I | II | III | IV | V |
|---|---|---|---|---|---|---|
| >5000 m | 4750–5000 m | 4500–4750 m | 4250–4500 m | <4250 m | ||
| 1 | a = As/Sn | 0.356 | 0.256 | 0.139 | 0.086 | 0.118 |
| 2 | b1 = (As × Mn)/(Sn × Bi) | 1.056 | 0.371 | 0.209 | 0.129 | 0.099 |
| 3 | b2 = (As × Sb)/(Sn × V) | 0.999 | 0.828 | 0.518 | 0.321 | 0.386 |
| 4 | c1 = (As × Sr × Hg)/(Sn × Bi × V) | 0.493 | 0.384 | 0.225 | 0.161 | 0.091 |
| 5 | c2 = (As × Mn × Sb)/(Sn × Ni × V) | 1.100 | 0.541 | 0.332 | 0.198 | 0.242 |
| 6 | c3 = (As × Sr × Sb)/(Sn × P × V) | 0.589 | 0.679 | 0.472 | 0.319 | 0.357 |
| 7 | d1 = (As × Mn × Sb × Sr)/(Sn × V × Ti × Ni) | 1.090 | 0.567 | 0.383 | 0.258 | 0.289 |
| 8 | d2 = (As × Hg × Sr × Sb)/(Sn × Bi × P × V) | 0.518 | 0.530 | 0.325 | 0.230 | 0.130 |
| 9 | e = (As × Mn × Hg × Sb × Sr)/(Sn × V × Bi × Ni × Ti) | 0.959 | 0.443 | 0.264 | 0.186 | 0.105 |
| Degree | Evaluation Index Parameter K = ln(η × 1000) | Central Location of Orebody Cross-Section | Linear Fitting Equation (ΔH) | Goodness of Fit R² | |||
|---|---|---|---|---|---|---|---|
| Indicator Symbol | η | 4875 m | 4625 m | 4375 m | |||
| 1 | A1 | As/Sn | 5.544 | 4.938 | 4.453 | y = 0.6083x − 3.1615 | 0.9959 |
| A2 | As/Mo | 4.906 | 4.170 | 3.578 | y = 0.5000x − 2.2424 | 0.9961 | |
| 2 | B1 | (As × Mn)/(Sn × Ti) | 5.119 | 4.491 | 3.970 | y = 0.5789x − 2.7538 | 0.9971 |
| B2 | (As × Mn)/(Ti × W) | 5.763 | 5.096 | 4.652 | y = 0.5924x − 3.1964 | 0.9867 | |
| B3 | (As × Hg)/(Mo × Ti) | 3.861 | 2.945 | 2.360 | y = 0.4371x − 1.4690 | 0.9841 | |
| B4 | (As × Mn)/(Mo × Sn) | 4.433 | 3.600 | 3.013 | y = 0.4647x − 1.8443 | 0.9901 | |
| 3 | C1 | (As × Mn × Hg)/(Mo × Sn × Ti) | 3.388 | 2.375 | 1.795 | y = 0.4084x − 1.1622 | 0.9760 |
| C2 | (Mn × Au × As)/(Ti × Sn × W) | 5.459 | 4.659 | 4.148 | y = 0.3751x − 1.3337 | 0.9562 | |
| C3 | (As × Au × Hg)/(Mo × Sn × W) | 4.154 | 2.990 | 2.455 | y = 0.5004x − 2.5127 | 0.9841 | |
| 4 | D | (As × Mn × Au × Hg)/(Mo × Ti × W × Sn) | 3.729 | 2.543 | 1.972 | y = 0.3647x − 1.1356 | 0.9608 |
| Elevation of Cross-Section | ΔH | Average Value (ΔH) | Predicted Position | |||||||||
|---|---|---|---|---|---|---|---|---|---|---|---|---|
| A1 | A2 | B1 | B2 | B3 | B4 | C1 | C2 | C3 | D | |||
| 5000–5250 m | 0.412 | 0.314 | 0.703 | 1.064 | 0.277 | 0.565 | 0.499 | 0.436 | 0.849 | 0.620 | 0.574 | Head of ore body |
| 4000–4250 m | −0.258 | −0.184 | −0.261 | −0.273 | −0.238 | −0.182 | −0.233 | −0.246 | −0.279 | −0.248 | −0.240 | Mid-tail of ore body |
Disclaimer/Publisher’s Note: The statements, opinions and data contained in all publications are solely those of the individual author(s) and contributor(s) and not of MDPI and/or the editor(s). MDPI and/or the editor(s) disclaim responsibility for any injury to people or property resulting from any ideas, methods, instructions or products referred to in the content. |
© 2023 by the authors. Licensee MDPI, Basel, Switzerland. This article is an open access article distributed under the terms and conditions of the Creative Commons Attribution (CC BY) license (https://creativecommons.org/licenses/by/4.0/).
Share and Cite
Sun, W.; Zheng, Y.; Wang, W.; Feng, X.; Zhu, X.; Zhang, Z.; Hou, H.; Ge, L.; Lv, H. Geochemical Characteristics of Primary Halos and Prospecting Significance of the Qulong Porphyry Copper–Molybdenum Deposit in Tibet. Minerals 2023, 13, 333. https://doi.org/10.3390/min13030333
Sun W, Zheng Y, Wang W, Feng X, Zhu X, Zhang Z, Hou H, Ge L, Lv H. Geochemical Characteristics of Primary Halos and Prospecting Significance of the Qulong Porphyry Copper–Molybdenum Deposit in Tibet. Minerals. 2023; 13(3):333. https://doi.org/10.3390/min13030333
Chicago/Turabian StyleSun, Weitao, Youye Zheng, Wei Wang, Xin Feng, Xiaosong Zhu, Zhongyue Zhang, Hongxing Hou, Liangsheng Ge, and Hanqin Lv. 2023. "Geochemical Characteristics of Primary Halos and Prospecting Significance of the Qulong Porphyry Copper–Molybdenum Deposit in Tibet" Minerals 13, no. 3: 333. https://doi.org/10.3390/min13030333