Article

Mid-Infrared (MIR) Spectroscopy of Silicate Glasses as Analogs for Mercury’s Surface: The Influence of Grain Size

1
Department of Physics and Geology, University of Perugia, 06123 Perugia, Italy
2
LESIA-Observatoire de Paris, Université PSL, CNRS, Sorbonne Université, Université de Paris, 5 Place Jules Janssen, 92190 Meudon, France
3
INAF-Astrophysical Observatory of Arcetri, Largo E. Fermi n. 5, 50125 Florence, Italy
4
CNR-IGG Sezione di Firenze, Via Giorgio La Pira 4, 50121 Florence, Italy
*
Author to whom correspondence should be addressed.
Minerals 2023, 13(2), 170; https://doi.org/10.3390/min13020170
Submission received: 15 December 2022 / Revised: 17 January 2023 / Accepted: 20 January 2023 / Published: 24 January 2023

Abstract

:
Volcanic products are widely present on Mercury: they occur as low-viscosity lava flows, but traces of ash deriving from explosive volcanism are also observed. Silicate glasses represent a major component in volcanic products, and it is likely that the fine-powdered regolith on Mercury contains a non-negligible fraction of glassy material. In the laboratory, we have reproduced a Mercury-like silicate glass, from which we have obtained 14 powdered samples with different granulometric characteristics: 8 samples are extremely sorted with grain sizes ranging from 25 to 425 µm, and 6 samples consist of less sorted powders with normal distributions, varying mean values (30, 95, and 160 µm) and standard deviation (40 and 80 µm). The reflectance of samples was investigated in the mid-infrared (MIR) region: we observe how the reflectance intensity increases with grain size, and the presence of extremely fine material defines the emergence of the transparency feature (TF). We provide reference data with qualitative observations and quantitative parameterization of spectral characteristics; in particular, we observe how a small fraction of fine material can greatly influence the spectral response of coarser powders. Results of this work will be crucial for the interpretation of data collected by the BepiColombo mission, but need to be integrated with other possible Mercurian compositions.

1. Introduction

All rocky planets in the Solar System have been subjected to magmatic and volcanic processes that shaped the face of their surface and determined a large part of the mineralogical diversity on them. Thus, a large number of morphologies and terrains have a volcanic origin [1,2,3]. Among these planets, Mercury hosts a plethora of areas of putative volcanic origin. The most notable are the so-called smooth plains [4], which occupy 27% of the planet’s surface and are thought to have been formed by a single large effusive event that involved partial melting of the Mercurian mantle [5]. However, it is hypothesized that explosive volcanism also occurred on Mercury: irregularly shaped depressions surrounded by high-reflectance halos have been interpreted as eruptive centers and proximal pyroclastic deposits [6], whereas other negative forms have been interpreted as collapsing calderas into underlying magma chambers [7] and a large number of vents are observed to lay on impact structures or within 20 km of a fault [8]. This suggests how volcanism might have been triggered by the release of gas subsequent to the breaking of the surface by other processes.
The analysis of spectral features detected on the surface of rocky planets, together with the study of geomorphological landforms, has always been a key process in the interpretation of geological features on planetary surfaces [9]. Among the different spectral regions that can be investigated, the mid-infrared region (hereon: MIR) is of particular interest for the interpretation of silicate products (like magmas) because it is the region where oxides of Si and Al (that taken together constitute more than 50% in weight of most igneous products) show Reststrahlen bands originated from the vibration of cation–anion bonds [10,11]. The problem with interpreting of spectra of geologic bodies relies on the fact that it is not always easy to distinguish which variable is determining the occurrence and the appearance of a particular spectral feature. For this reason, an exhaustive understanding of the spectral properties of geological samples with different chemical and physical structures is essential for the proper interpretation of spectral data obtained through terrestrial and extra-terrestrial remote sensing. In this sense, MIR spectral properties of igneous bodies were investigated by focusing on how it changes in respect with different variables: mineralogy [12,13], elemental abundance within mineral phases [14,15,16,17], temperature [18,19,20] surface roughness or porosity [21] and finally particles size [16,22,23,24,25], on which this study will focus.
Variation of the size of the particles causes powders to display notable spectral variation due to volume and surface scattering; in particular, it has a great influence on two aspects of MIR spectra: reflectance intensity and spectral shape [26]. Indeed, powdered samples’ spectral contrast of fundamental absorption features decreases as particle size decreases: Reststrahlen band features are weaker due to the increase in an incoherent scattering of light from multiple surface reflections at the clasts level, resulting in the formation of photon traps, where pores between particles acted as small black bodies [14,25,27]. On the other hand, grain size influences the shape of MIR spectroscopic features because an increase in volume scatterings results in an increase in the refraction index, and in the MIR region light can interact with many more particles to produce a prominent absorption feature, so-called transparency feature, hereon the TF [13,25,28]. In silicate-powdered samples, the TF shows the most intense absorption contrasts, and its predominance related to volume scattering has been recognized as a potentially useful indicator for remote sensing in order to identify fine particulate presence on the planetary surfaces [12,29,30]. Fine powders are hypothesized to be largely present in the regolith on planetary surfaces: as an example, possible TFs have been observed on the surface of Mercury, indicating that an important fraction of its regolith is constituted by very fine powders [31,32,33]. For this reason, it is very important to create exhaustive reference data of fine-grained material to correctly interpret geological features of planetary bodies, and, in this sense, many studies have been carried out focusing on the dependency of spectral properties in relation to granulometry, with various types of products that have been characterized: igneous minerals and rocks [23,24,34,35,36], carbonates [23,37], salts [38,39] and also amorphous phases such as silicate glasses [40,41,42,43].
Silicate glasses are magma-derived amorphous materials whose internal structure reflects the one of a completely molten magma [10,44]. Volcanic products can be constituted of large portions of silicate glasses, such as hypocrystalline, porphyric rocks, or volcanic ash [45], or be entirely constituted by glasses, such as obsidian. Mercury is indeed hypothesized to host hypocrystalline and porphyric material [46] and, as said, also volcanic ash [6,7,8], and therefore, even if their structure might have been influenced by the strong thermal excursion that is observed on the planet [9,46], silicate glasses might constitute a non-negligible part of Mercurian surface.
Only recent studies focused on the MIR spectral response of silicate glasses as possible magmatic analogs for planetary surfaces. Some of these studies investigated the spectral response of glasses in the visible and near-infrared region (VNIR) [43,47,48], but MIR studies were also performed with different planetary-related purposes: the MIR spectral response of possible impact glasses on planetary surfaces [42,49,50,51] or of possible silica coatings on particles on planetary terrains was investigated [52,53,54], but glasses were also accounted as possible principal components of volcanic products on other planets [18,41,55,56,57]. Moreover, a large part of the information that we can retrieve about the MIR spectral response of silicate glasses also comes from studies that are not directly focused on possible planetary implications [11,45,58,59,60,61,62,63,64,65].
Some of the above-mentioned studies also focused on the variation of silicate glasses’ MIR spectral response as a function of grain size [40,41,43,66,67]. However, such studies only observed materials that are extremely sorted from a granulometric point of view and regarding a maximum of 4–5 grain size classes. This was performed because of the fact that regolith, the main constituent of planetary surface [68], is often interpreted as made up of impact-derived particles following a power law grain size distribution [69] mostly constituted by fine powder that can be detected through the TF [31]. However, we know that explosive volcanism occurred on Mercury [6,70] and that volcanic processes create particles with grain size distributions whose fashion ranges between units and hundreds of μm [71,72].
In this study, we aim to integrate the knowledge of the spectral response of silicate glasses as a possible proxy for volcanic ash, proposing an investigation of the spectral response of a Mercury-like silicate glass more in detail, by using a higher granulometry resolution (given by a higher number of grain size classes) and by introducing investigation of less sorted material: in particular, we have produced samples with gaussian-like grain size distributions that vary by means of average value and standard deviation to observe how and how much fine-grained particles influence the spectral response of a heterogeneously sorted material. In this way, our work aims to provide an original database of characterized Mercury-like silicate glasses that adds up to the ones provided by previous works [40,41] for future interpretation of spectral information coming from areas of Mercury, where the surface is believed to be covered by volcaniclastic material.

2. Materials and Methods

2.1. Samples Preparation

2.1.1. Production of Silicate Glass

As a Mercurian analog sample, we have chosen a possible iron-bearing composition of Northern Volcanic Plains [73], as proposed in a previous study [47]. To reproduce such a composition, we have mixed pure oxides in proportions to obtain 100 g of glassy material. In Table 1, the target composition is reported together with the proportions used to reproduce it. For sodium, it was necessary to use sodium carbonate rather than pure Na2O, since the latter is not stable in air in form of powder.
The mixture was molten in the furnace at 1500 °C for >4 h to make the oxides bond together and expel CO2 from sodium carbonate. After quenching, the glass was crushed into powder (<200 μm) and the powder was molted again at 1500 °C for >4 h and quenched to obtain 100 g of homogeneous sample [74].

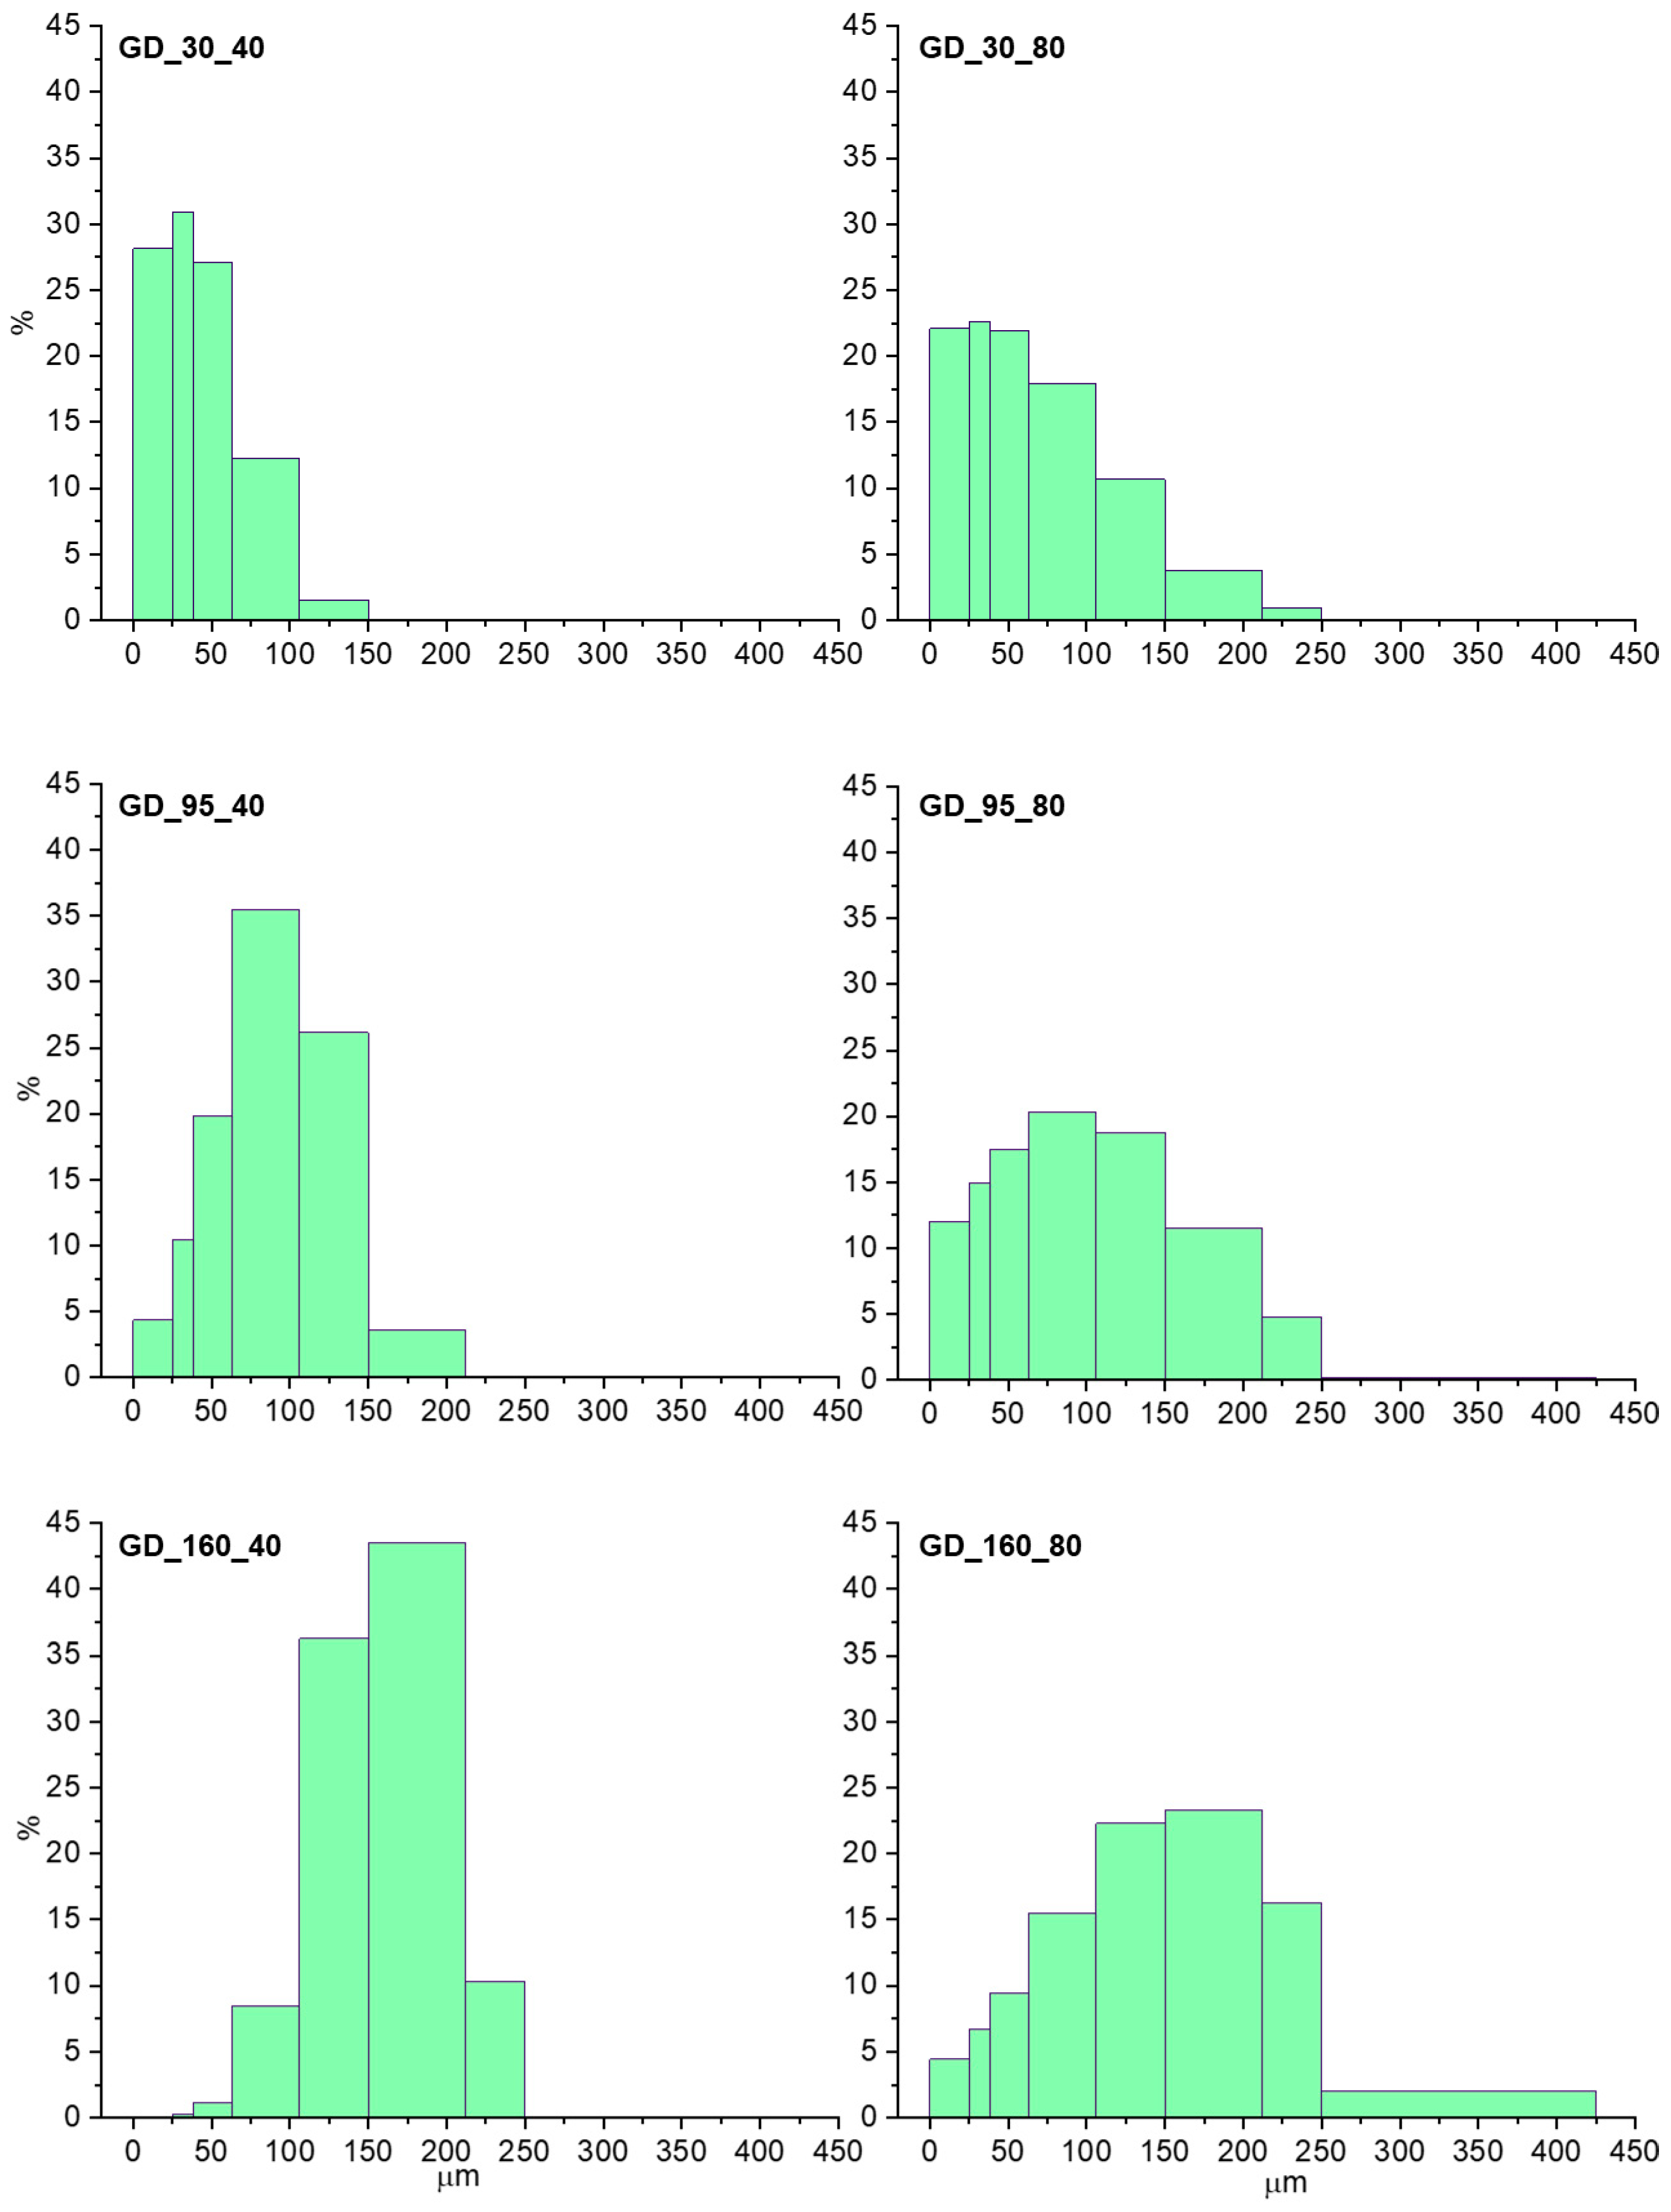
2.1.2. Grain Size of Samples

We have ground 100 g of homogeneous glass to a powder that we have sieved to obtain samples with the subsequent grain size fractions: 0–25 µm, 25–38 µm, 38–63 µm, 63–106 µm, 106–150 µm, 150–212 µm, 212–250 µm and 250–425 µm, therefore presenting a central value of, respectively, 12.5 µm, 31.5 µm, 50.5 µm, 84.5 µm, 128 µm, 181 µm, 231 µm, and 337 µm. In this way, we have obtained eight samples of glass powders that are homogeneous and well-sorted.
Subsequently, some of these samples were mixed to obtain differently sorted material and obtain six samples showing Gaussian-like distributions defined by their mean values (30, 95, and 160 µm) and standard deviations (40 and 80 µm). Grain size distributions of such samples are reported in Figure 1. The production of such samples was chosen to determine the possible influence of very-fine grained fractions on the spectral response of coarser material in the range of possible volcanic ash size, which can be up to hundreds of μm.
We will refer to the first set of well-sorted samples as SC samples (single class) and to the second set of unsorted samples as GD samples (gaussian distributed). More in detail, GD samples will be named with two numbers indicating the mean value and the stand deviation value, respectively (e.g., GD_95_40 will be the sample with average value of 95 μm and St.Dev. of 40 μm).

2.2. Samples Characterization

2.2.1. Chemical Analyses with EMPA

For the determination of the material’s chemical composition by means of major elements, four different fragments (mm sized) of the quenched material were saved from the grinding and embedded in epoxy for electron microprobe analyses (EMPA). In this way, it was possible to acquire chemical compositions on 21 spots randomly diffused in the material to assess chemical homogeneity.
EMPA measurements were performed at the joined laboratory (LaMA) of the DST and CNR-IGG of Firenze (Italy). The instrument was a JEOL Superprobe JXA-8230, equipped with 5 wavelength dispersion spectrometers (WDS) operating with different analyser crystals and different detectors (gas flow and sealed Xe type). The working conditions used were 15 kV accelerating voltage, beam current at 10 μA and beam diameter of 10 μm to reduce diffusion effect on alkali. Counting times consisted in 15 s on peak and 7 s on both backgrounds except for Na that was measured for 10 s on peak and 5 on both backgrounds, to limit the alkali loss. A selection of natural and synthetic minerals are used as primary standard for the elemental calibration (Astimex albite for Si and Na, plagioclase for Al, olivine for Mg, diopside for Ca, sanidine for K, and Smithsonian ilmenite for Fe). Two obsidian natural glasses (Obsidian by Astimex and Obsidian by Microanalytical Conrol) are used as secondary quality control standards.

2.2.2. Spectral Analyses with FT-IR

Spectroscopic analysis was performed using the experimental facility at INAF-Astrophysical Observatory of Arcetri (Florence, Italy). The FT-IR apparatus hosted in Arcetri consists of a Bruker Vertex 70v FTIR double pendulum coupled with Harrick Praying Mantis™ for Diffuse Reflectance Infrared Fourier Transform Spectroscopy (DRIFTS) analysis in biconical off axis geometry to obtain high collection efficiency and accurate determination of the reflectance profile by measuring diffuse reflectance at 90° with respect to the principal plane. The off axis geometry is helpful to prevent spectroscopic feature distortion due to preferential forward scattering, which can occur in other configuration (e.g., [75]). The interferometer is equipped with a Globar source, a DTGS detector and optical elements in KBr that allow investigation in the wavelength range 1.25–25 μm. Samples were measured in saturated nitrogen atmosphere and corrected to Infragold reference rough standard.
Spectroscopic analyses were performed on both SC samples, acquiring one spectrum per sample, and GD samples, where three spectra per sample were acquired, emptying and refilling the sample holder each time with new material from the same GD sample.
To focus on spectroscopic properties due to different grain sizes, we selected a wavelength range from 7 to 17 µm, and spectra were acquired with a resolution of 4 cm−1 averaging 100 pendulum scans.

3. Results

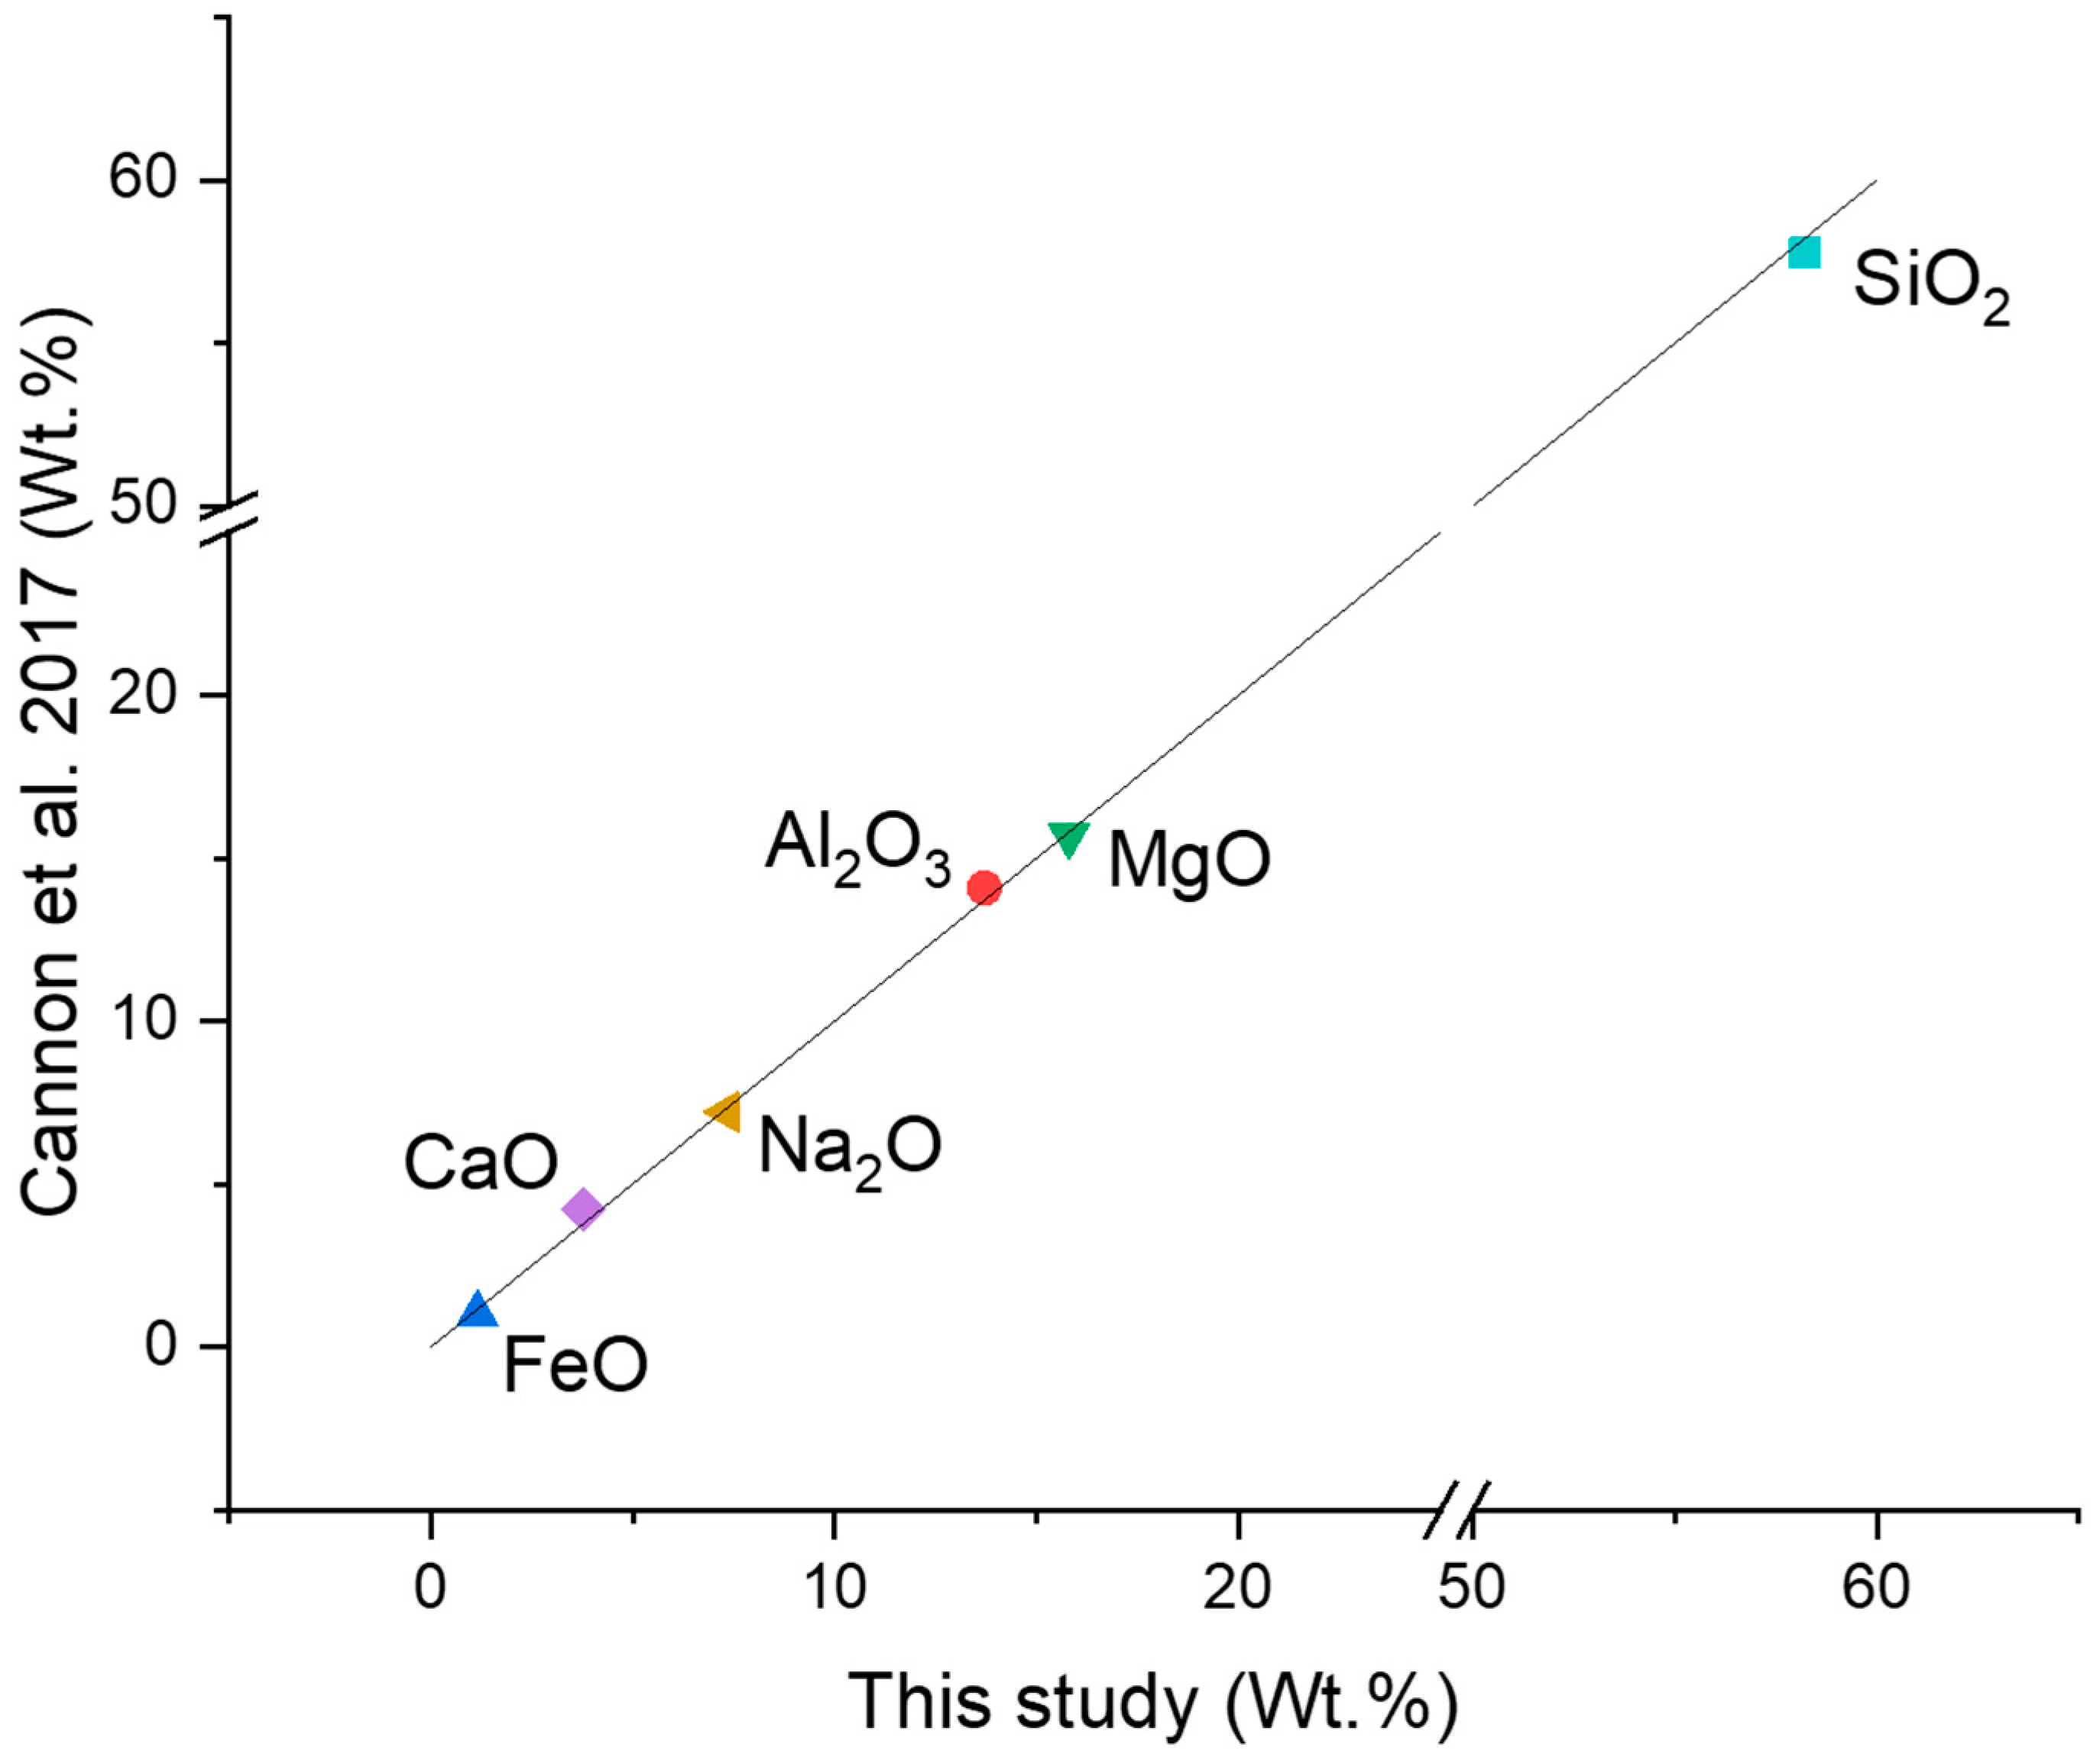
3.1. Chemical Characterization of Material

EMPA analyses are reported in Table 2, together with the standard deviations among the 21 measurements on four different fragments. We can observe how there is a general homogeneity among the measurements, with a standard deviation of only 0.28 for silica, which is the most abundant oxide component in the system.
In Figure 2, the relationship between the obtained chemical composition and the target composition ([47], Table 1) is reported. It can be seen that for all the accounted oxides, there is a deviation lower than 0.5 wt.%, with the major deviations being an excess of silica (0.47 wt.%) and a shortage of calcium oxide (0.45 wt.%). Overall, we can state that we were successful in reproducing a composition that can represent a possible analog for mercurial products.

3.2. Spectral Characterization of Samples

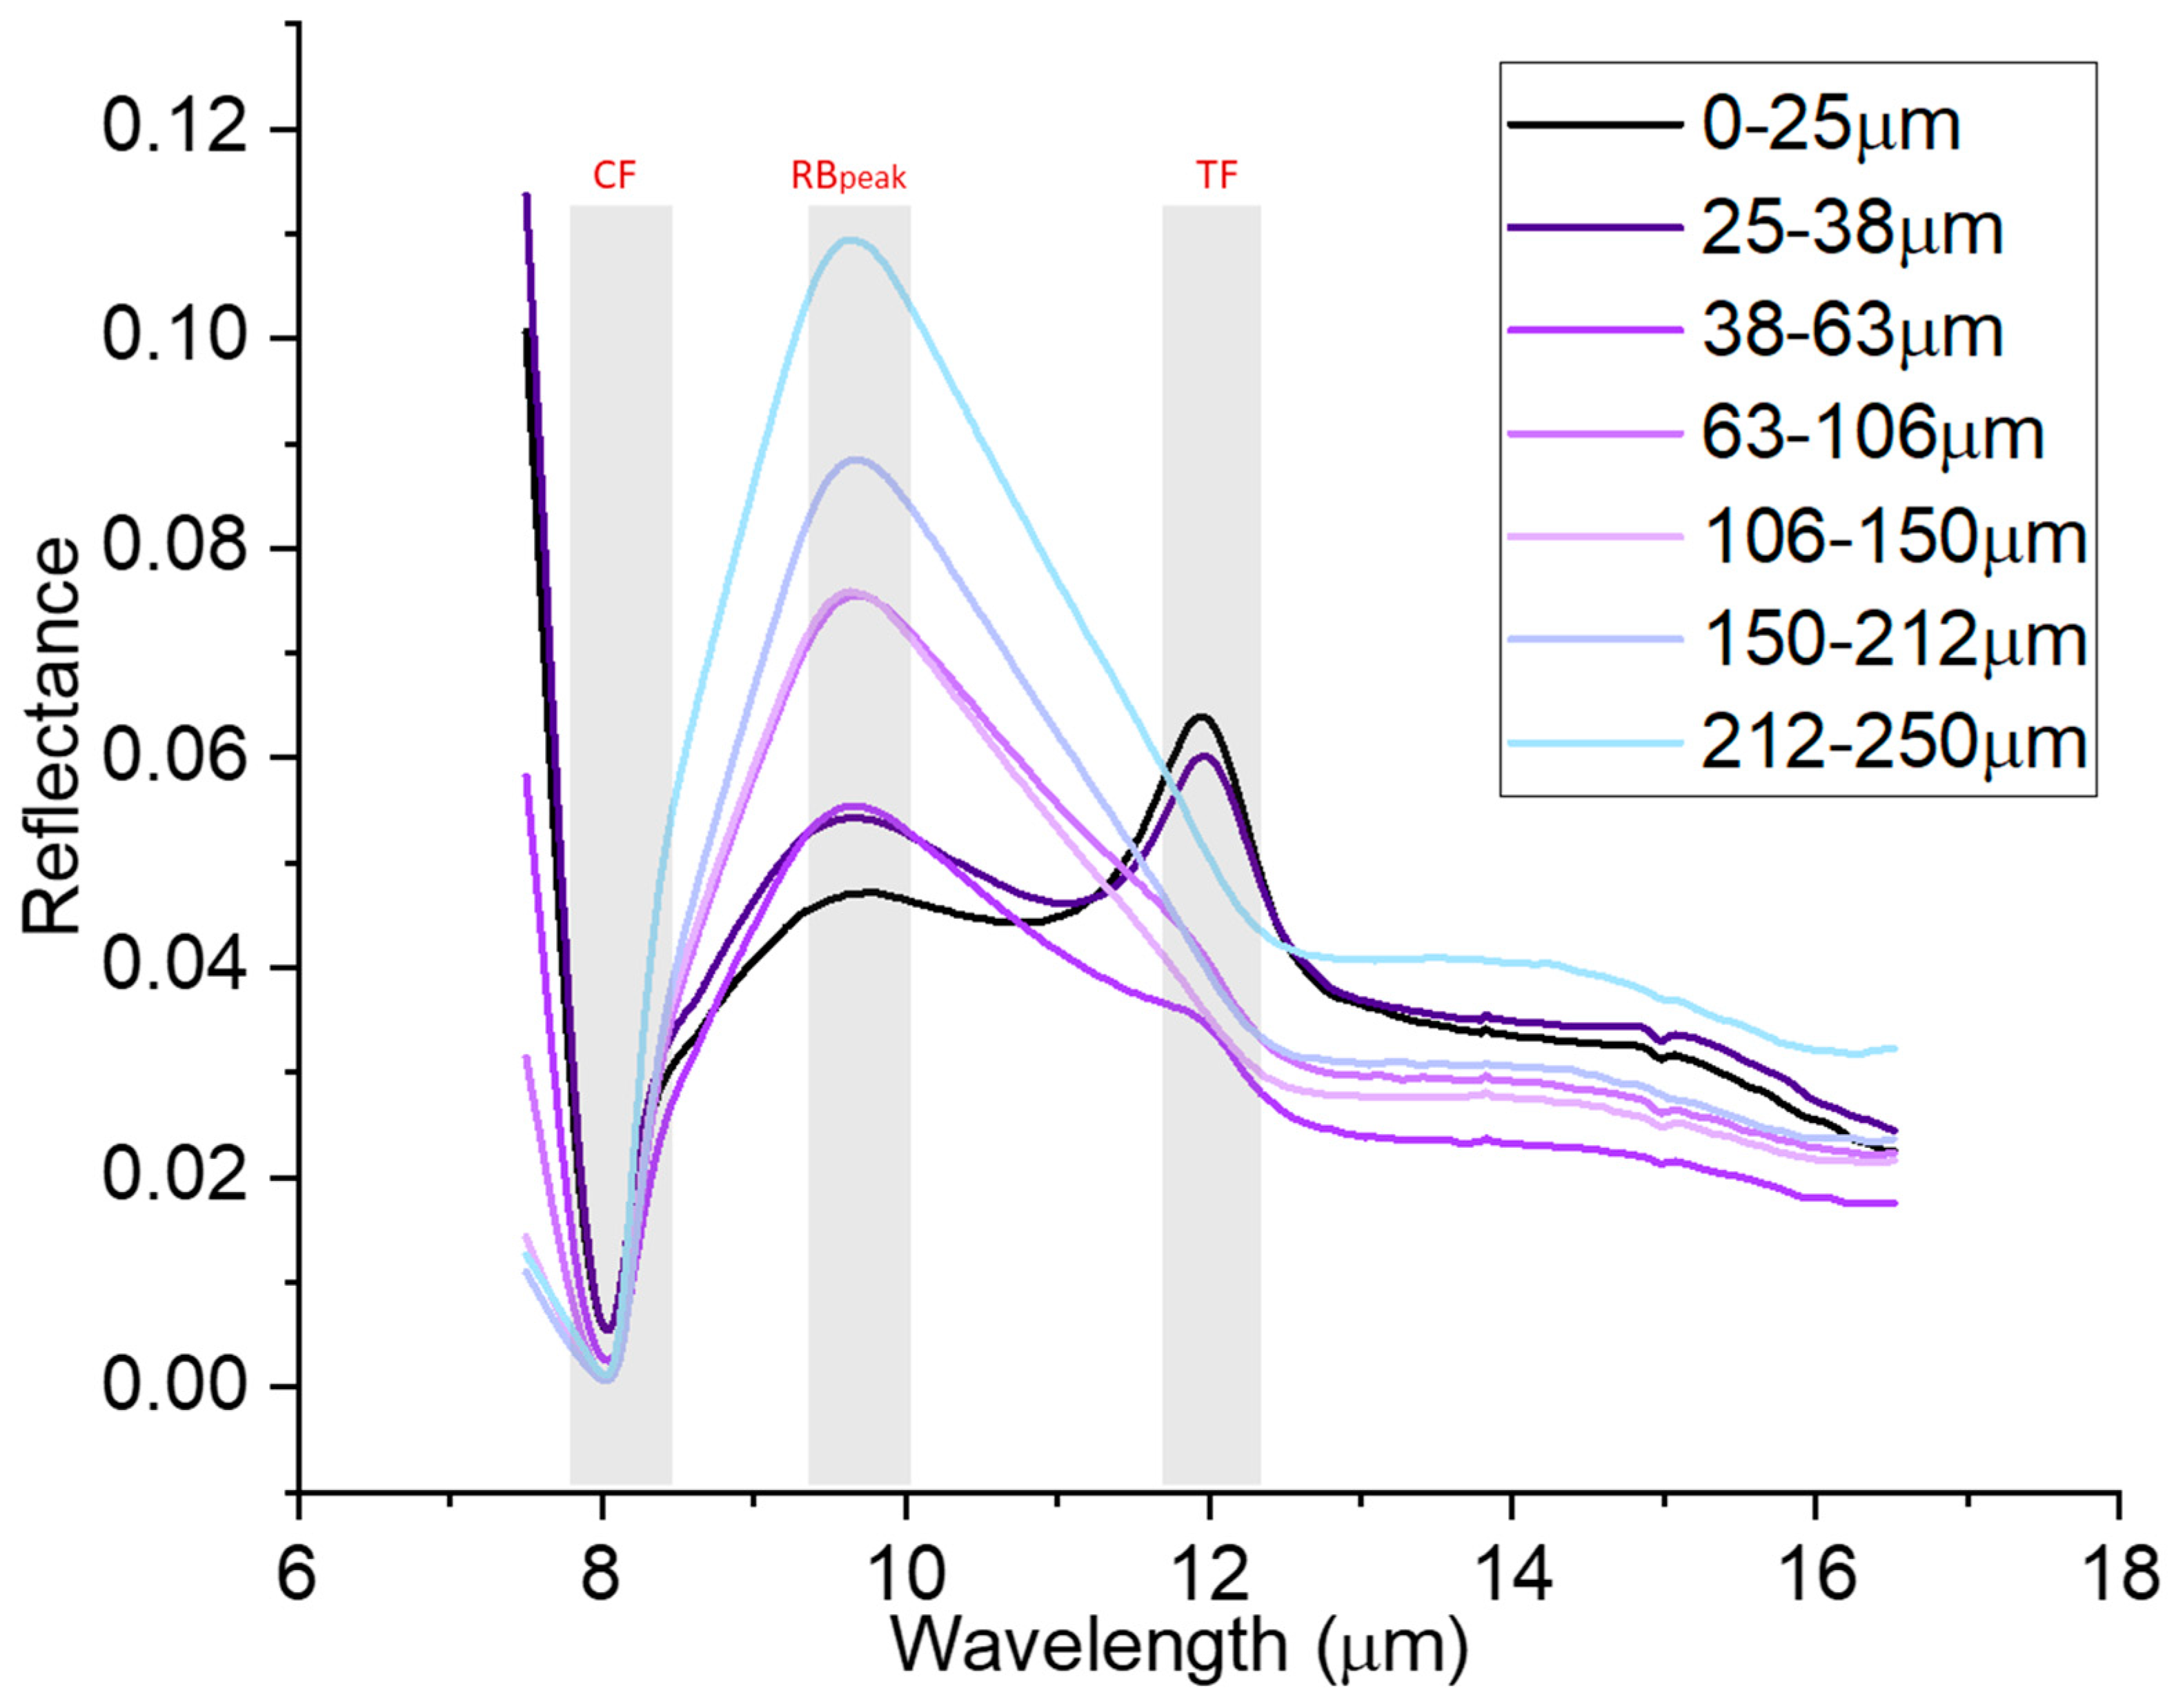
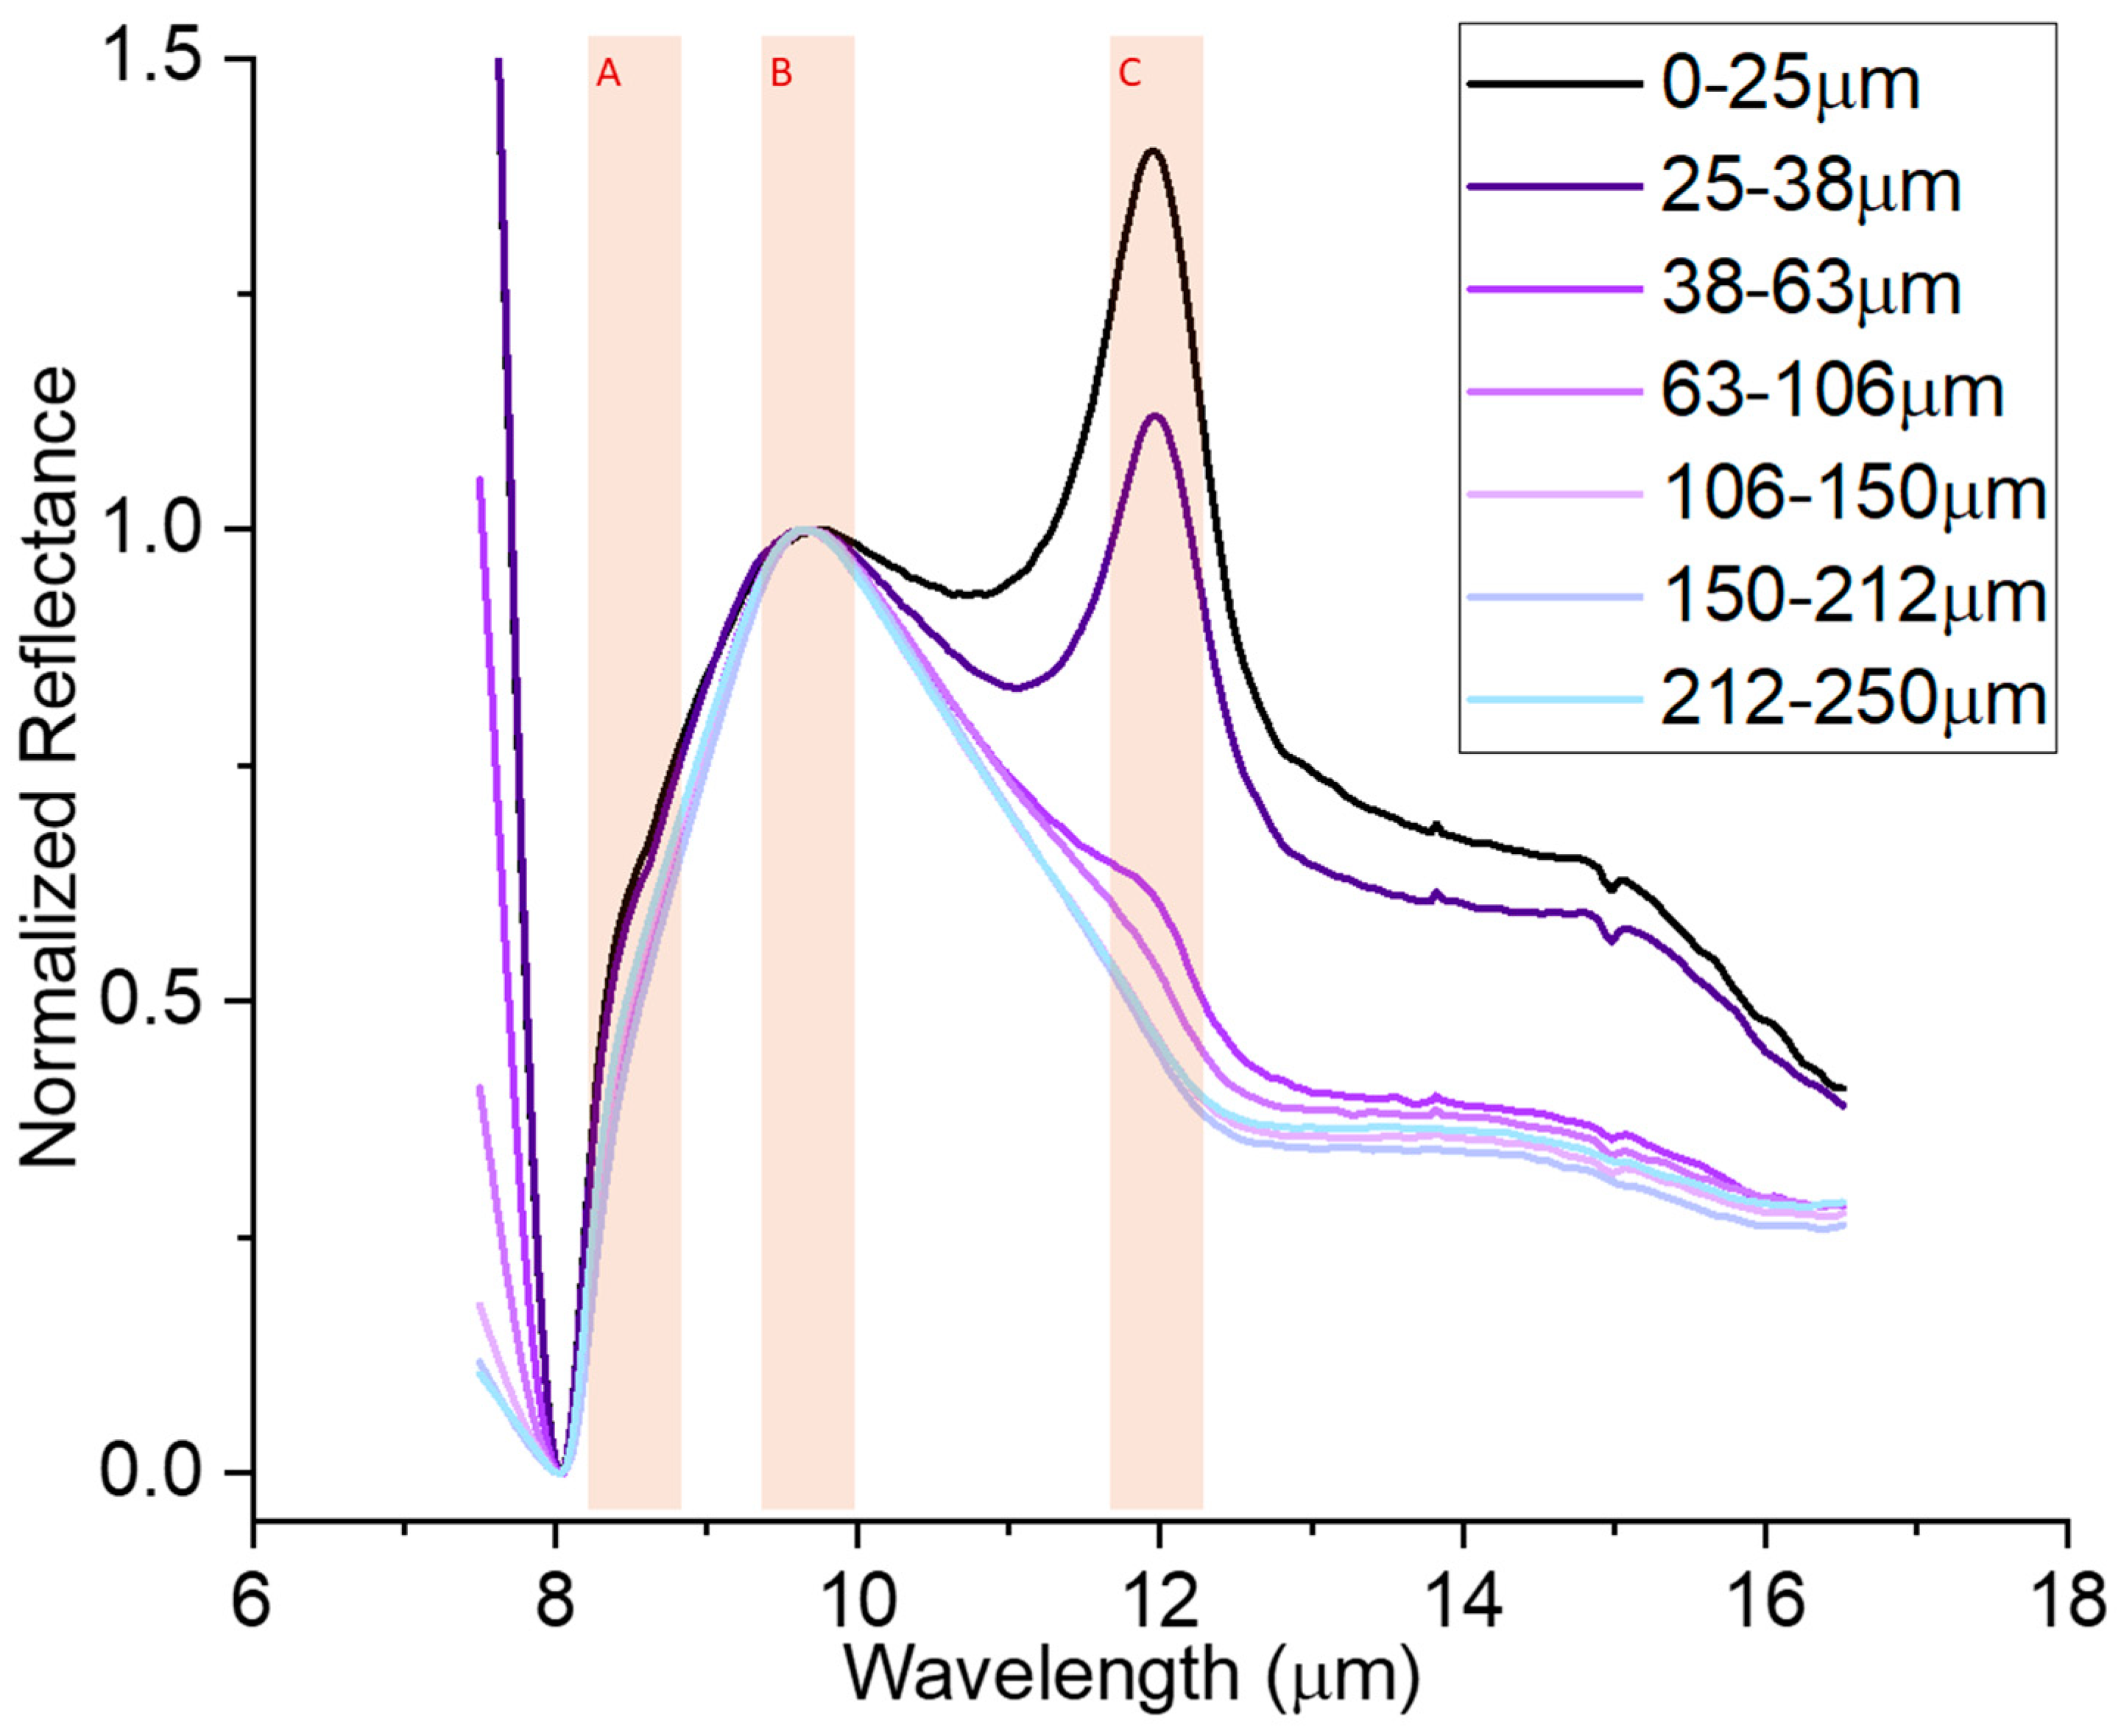
3.2.1. MIR Spectra of SC Samples

Spectra of SC samples are reported in Figure 3. Across the investigated spectral range, we can observe a variation in reflectance intensity and spectral shape with changing grain size of samples.
All the spectra present a local minimum in reflectance at approximately 8 µm, which is recognizable as the Christiansen Feature (hereon the CF), which appears when the refractive index of the investigated phase approaches the refractive index of the surrounding medium, causing a strong reduction in scattering, which results in a minimum in reflectance spectra (the CF). This is a common spectral feature among silicates, both crystalline and glassy [11,18,25,55]. At higher wavelengths (ca. 9.5 µm), all spectra present a local maximum, which is defined by a composition of bands derived from the Reststrahlen effect linked to Si/Al-O bond vibrations [11,76,77]. We will refer to this feature as the RBpeak [55]. The third observable spectral feature is located at ca. 12 µm, and it is only visible for finer samples and it fades away with increasing grain size of samples: 0–25 µm and 25–38 µm samples present a clear peak as local maximum, whereas only a shoulder can be detected in spectra of 38–63 µm and 63–106 µm samples and the spectra do not show any feature for coarser samples. Such features can be recognized as the transparency feature (hereon the TF [25,28]), and increase with decreasing grain size of samples because the lower absorption of small particles allows more photons to pass through the grains and then be backscattered [78]. All spectral features will be described more in detail in the Discussion section and their wavelength positions are reported in Table 3.
Wavelength positions of spectral features—the CF, the RBpeak and the TF—seem to be roughly constant for all samples in Figure 3. However, from the quantitative identification of their positions (Table 3), we can observe that the CF is indeed extremely stable, with a minimum variation in the order of 10−2 µm, which is comparable to the instrumental resolution. On the other hand, the RBpeak position oscillates presenting a particularly high value for SC 0–25 µm, more than 0.1 µm higher than the other spectra, which are all clustered in a span of 5 × 10⁻² µm.
Concerning the shape of SC spectra, we can observe that an increase in grain size results in the reflectance signal growing in intensity for the RBpeak, whereas it is the opposite for the TF: these two phenomena determine the spectral shape of samples with the same chemical composition and a different grain size to be substantially different.

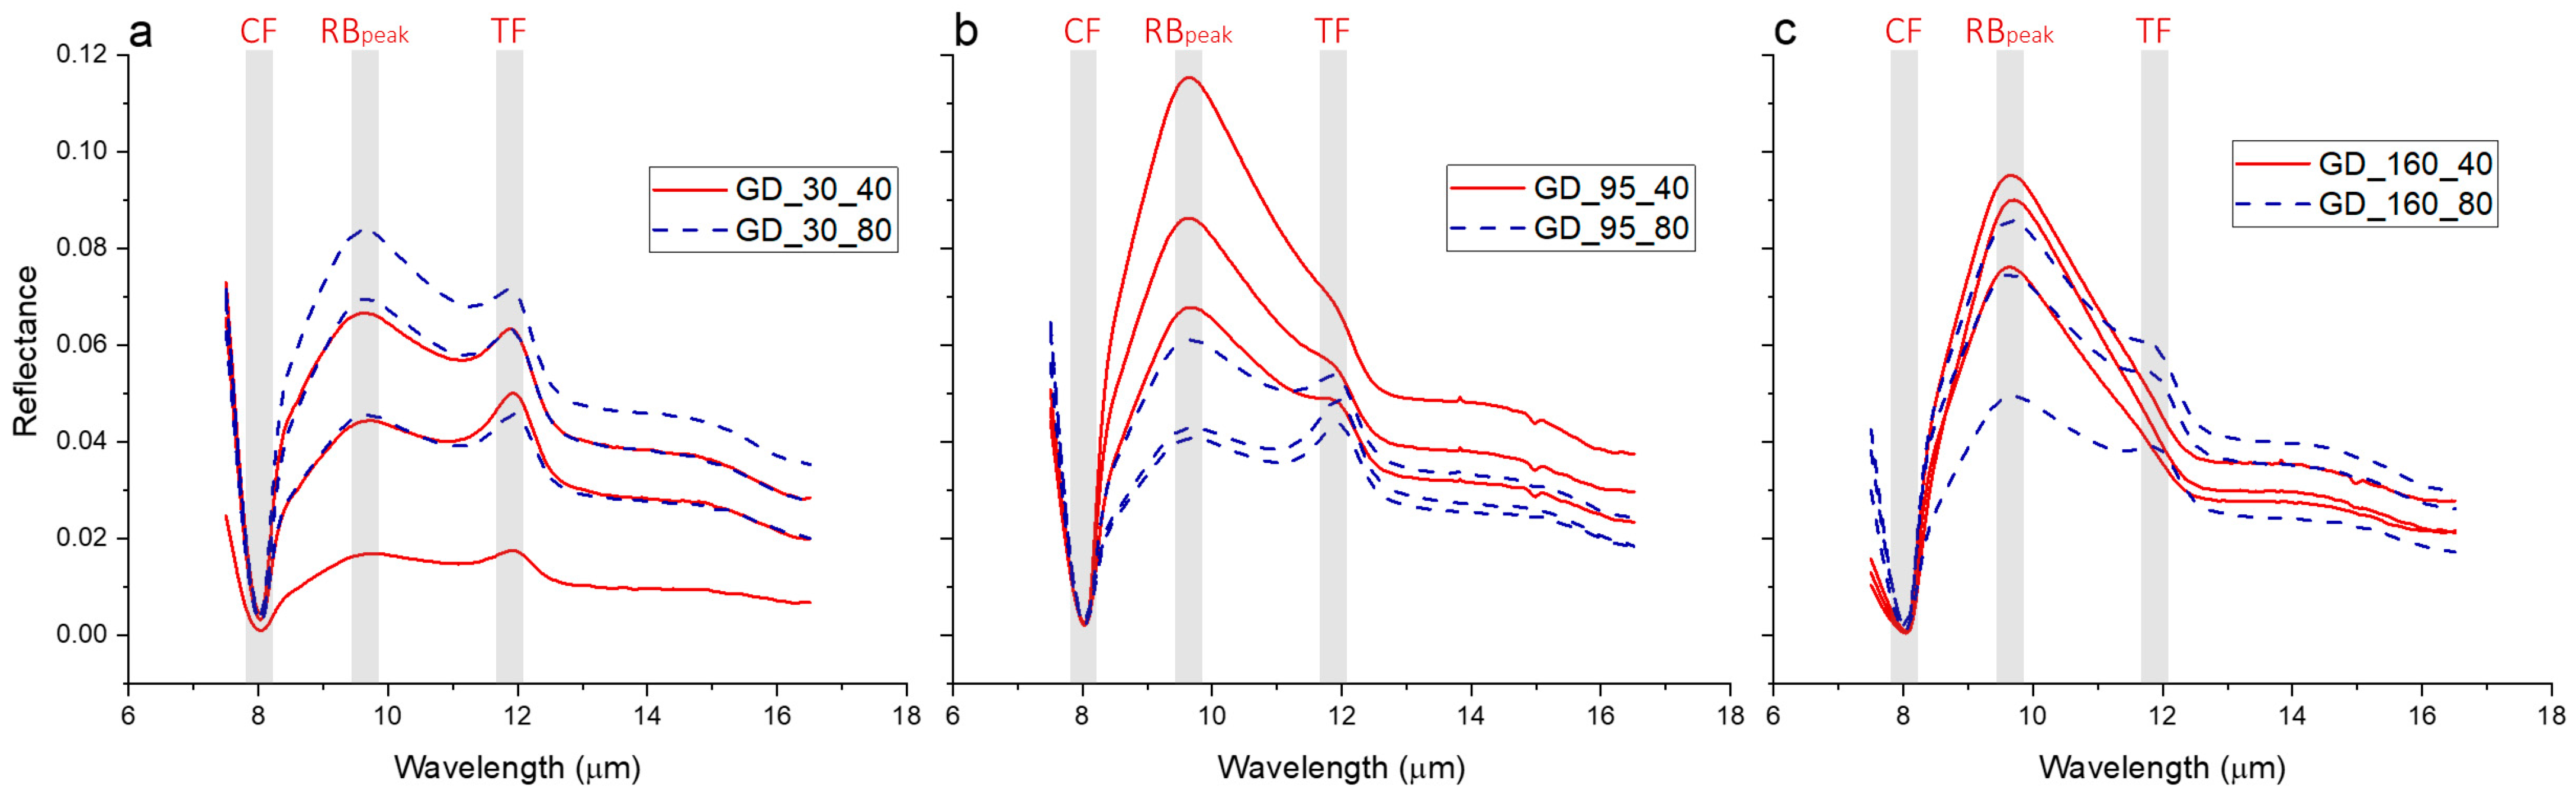
3.2.2. MIR Spectra of GD Samples

Spectra of GD samples are reported in Figure 4, in which three acquired spectra are reported for each sample. Here, each of the three subgraphs a, b and c reports spectra of samples with equal mean values and different standard deviation, so that each subgraph presents six spectra, three for each of the two GD sample depicted in it.
Concerning the intensity of reflectance, we observe how generally it can greatly vary, even among spectra acquired on the same samples. We must remind here that, in fact, for GD samples the spectral sampling cup was always emptied and re-filled with new powder from the same samples for each of the three measurements, and this, together with the fact that the sampling spot regarded a small portion of the cup, might have caused a slightly different effective sorting of each of the three spectra acquired for GD samples. However, we observe that spectra belonging to the same GD sample are quite similar in what concerns the shape of Reststrahlen bands and the emergence of the TF.
In addition, for each of the subgraphs from Figure 4, it is possible to make observations as follows: Figure 4a: spectra from GD_30_40 and GD_30_80 are very similar for what concerns their shape, with GD_30_80 (less sorted) with slightly larger reflectance intensity than the other; Figure 4b: spectra from GD_95_40 and GD_95_80 present quite a different shape, with GD_95_40 presenting a weak TF visible as a shoulder, whereas spectra from GD_95_80 present a prominent TF. Contrarily to what observed in the previous graph, here more sorted samples (GD_95_40) presents spectra with higher reflectance values; Figure 4c: spectra of samples with mean value 160µm have different shapes, with less sorted material (GD_160_80) presenting almost no feature in the proximity of the TF, and more sorted material showing the TF as a weak but always detectable shoulder. The reflectance intensity of spectra from GD_160_80 and GD_160_40 are comparable, the latter presents slightly larger intensity values.
Moreover, all GD spectra reported in Figure 4, such as the SC ones, present the spectral features—the CF, the RBpeak and the TF—and their wavelength position is reported in Table 4. As for sorted samples, the CF looks extremely stable in its wavelength position, varying only of 0.01 µm, which is comparable to the spectral resolution of the instrument, whereas the RBpeak oscillates between 9.60 µm and 9.73 µm, with no clear correlation to grain size. As for the third spectral feature, all spectra of GD samples with 30 µm average values show a stable TF, such as GD_95_80 spectra. Other spectra show weak TFs, detectable as local maximums (GD_95_40 and GD_160_80) but their position is heavily influenced by RB bands.

4. Discussion

In this study, we have observed how, in the MIR spectral range, products that are chemically identical can exhibit quite different spectroscopic characteristics because of the difference in their physical form, which in this case is represented by granulometry. However, we know that the MIR spectroscopic region is heavily influenced by the chemistry of the sample analyzed, but the chemical homogeneity of our set of samples allows us to rule out a possible composition effect in the observed spectroscopic differences.
In the previous section, we have recognized three spectral features—the CF, the RBpeak and the TF.
The Christiansen Feature (CF) is common among silicates, both crystalline and glassy [11,18,25,55]; its wavelength position can be used as a proxy for chemical composition [13,79]. In our case, for SC samples (Figure 3), the CF does not appear to be shifting in wavelength position as the grain size of the samples varies, reasonably because samples are extremely homogeneous and, as pointed out by previous studies, its position is not influenced by the grain size of investigated samples, both glassy [40] and crystalline [13].
At higher wavelengths (ca. 9.5 µm), all spectra in Figure 3 present the RBpeak, a local maximum that strongly increases its reflectance intensity as grain size is increasing. This maximum is defined by a composition of bands derived from the Reststrahlen effect linked to Si/Al-O bond vibrations [11,76,77]. The RBpeak is also known to be shifting with changing the chemical composition of silicate glasses [55], a phenomenon that we do cannot see at first glance in our spectral set in Figure 3. In the mentioned study [55], it is observed how the shift of the RBpeak with changing chemical composition is less straightforward if compared to the CF, and here, by looking at Table 3, we can see how the RBpeak position actually oscillates weakly among chemically homogeneous samples with different grain sizes. The reason behind such behavior might rely in the fact that such local maximum is as said defined by a convolution of numerous bands related to vibrations of bonds, in particular Si-O and Al-O [11,55], which are influenced by other physically driven phenomena such as the increase in reflectance intensity and the emergence of the TF. In particular, TF emergence for SC 0–25 µm might influence the shape of Reststrahlen bands because of its strong reflectance values, and this phenomenon might be responsible for the particularly high RBpeak position of the finest SC sample.
Indeed, the two spectral characteristics that are heavily influenced by grain size variation are the emergence of the TF and the intensity of reflectance. These will be discussed in the next two subsections, especially for SC samples. Then, in light of what was observed, SC and GD samples will be compared in the last subsection.

4.1. The Occurrence of the Transparency Feature (TF)

The occurrence of the TF is documented since the first studies on rock particulates. In FTIR spectroscopy, we know that particulate rock samples, when the diameter of particles is comparable to the wavelength of light (0–75 µm), show such peculiar feature in the MIR region [22,23,34,77,80]. In a fine multi-particle system, where the number of grain/air interfaces per unit volume is relatively high, surface scattering reflection occurs while on the other hand more photons pass between grains and penetrate easier into grains due to the low thickness of the grains. Additionally, particle adhesion increases apparent porosity by forming complex cavities amplifying volume scattering [26,35]. Therefore, for small particles, the material absorption coefficient is low (due to small grain size) and the refraction index is high (due to enhanced volume scattering), and photons can interact with many more particles and produce the TF as a maximum in reflectance.
An interesting fact about the occurrence of the TF is that previous studies by our research group [18,55] have observed how the TF is not always occurring for fine glass powders: silicic glasses present a sharper peak for the TF, that is indeed very weak and almost disappearing for mafic glasses. The weaker occurrence of the TF for more mafic products was also observed in other studies on fine rock material [77]. As for the spectra examined in one of our previous studies [55], the only mafic glass that showed a clear peak for the TF had a shoshonitic (high-K mafic volcanic product) composition, with a total alkaline content above 8 wt.%. All the other mafic samples in the mentioned study have alkaline content lower than 4.5 wt.% and present no TF in the spectra of <25 μm powders. Other recent studies [40,66] that investigated the spectral response of silicate glasses reported that for some samples’ TF can indeed be extremely weak and non-detectable as a local maximum: in the mentioned studies, the spectra of fine material (<25 μm) presenting no or a very weak TF belong to glasses whose composition was alkaline free. Another recent study [67] concerning the reflectance of glasses reported no TF for fine material with total alkaline oxides content below 2.6 wt.%. In the present study (Table 2), our set of glasses have a moderately alkaline character: even if they are K-free, they exhibit a relatively high NaO content above 7 wt.%.
It is indeed complex to explain this phenomenon: we have noticed a correlation between the emergence of the TF and the low-alkaline character of investigated glasses, but this empiric observation may not necessarily be directly linked to the real explanation. However, we know that alkaline elements (K, Na) act as charge balancers for Al cations, enabling them to act similar to Si in the tetrahedral network of silicate glasses [44,45]. Vibration of Al-O bonds in the Si cage is reported to occur between 11.35 and 14.70 μm [11], a region which could indeed influence the emergence of the TF. Indeed, in one of the mentioned studies [55], it was noted that subalkaline mafic glasses present a bulge in the TF which does not develop into a peak, and we might rise the hypothesis that the emergence of the TF for more alkaline glasses results from the combined influence of the TF itself with Al-related Reststrahlen bands. The correlation between the TF and chemical chemistry was already noted in the first databases created for rock particulates [30] and is extremely interesting for planetary implications. Such matter was worth being pointed out here, but it goes beyond the aim of this study because we only focused on one chemical composition. Nevertheless, it will surely need an ad hoc study comprehending both chemical and physical characteristics as variables.

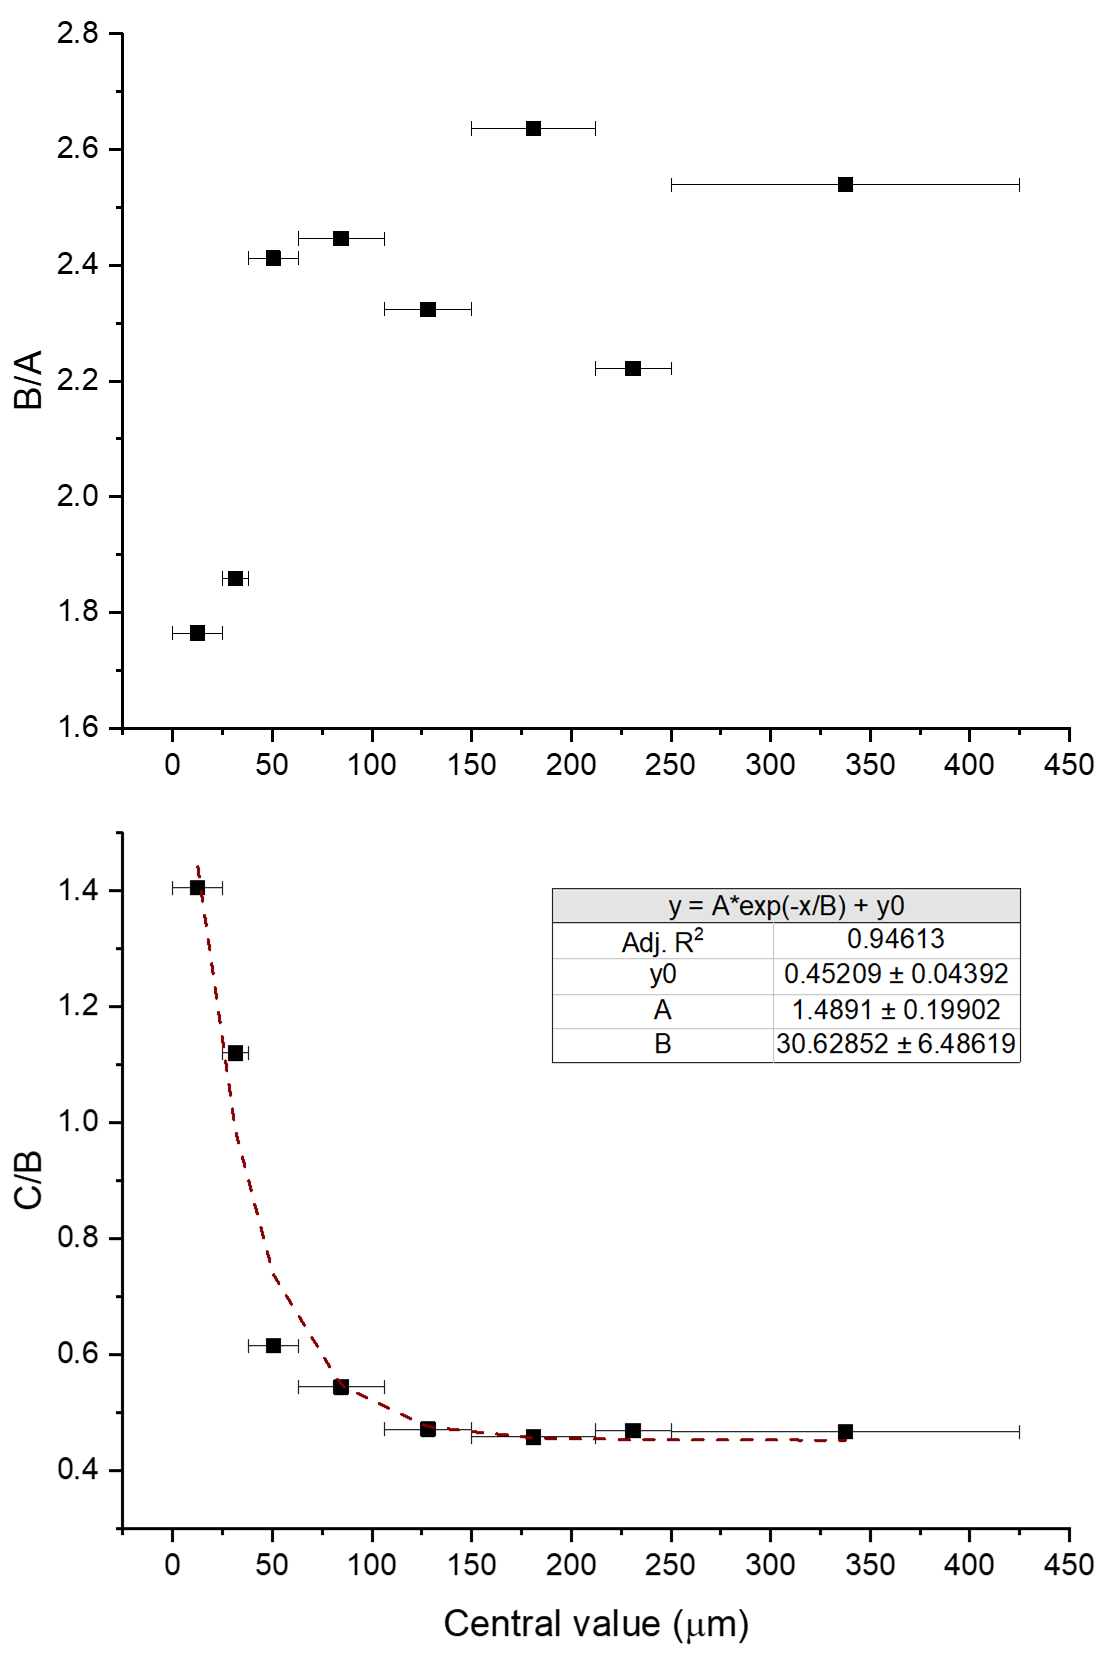
4.2. Normalization of Reflectance Intensity and Spectral Ratios

As said, we have observed that the variation in grain size determines a change in the shape and intensity of MIR spectra. In particular, intensity increases with increasing grain size, a phenomenon which has been observed in MIR for crystalline and glassy phases [16,23,25,35,40,41,55] which is inverse to what observed in VNIR [36,43].
To parameterize change in shape and better compare spectra, we can try to normalize the spectra of SC samples by setting the reflectance value of the CF to 0 and the reflectance value of the RBpeak to 1, in this way, we lose information about different intensities of reflectance, but we can more easily observe variation in the spectral shape of different samples [55]. Normalized spectra are reported in Figure 5, where we can see that shapes differ among our set of spectra especially in two regions: the TF region at approximately 12 μm, of which we have already spoken about, and another region between the CF and the RBpeak, roughly centered at 8.5 μm. In particular, we do not observe what was stated in previous studies [55], that the shape of spectra of powders with different grain sizes is identical between the CF and the RBpeak, because we see how finer material (especially the two that show a clear peak for the TF) present a shoulder that determines normalized reflectance to be slightly higher. In this way, we have individuated three regions of interest that characterize this region of the spectra: the region at approximately 8.5 μm, the RBpeak region, and the TF region, highlighted in Figure 5 as A, B and C, respectively. To parameterize spectra by means of their grain size, we can try to use an approach that is often used in the VNIR region [48,81] and use ratios of reflectance intensity regarding the A, B and C regions: in Table 5, we report the values of ratios B/A and C/B for all the spectra.
In Figure 6, ratio values for SC samples are shown in relationship with grain size (here central values are accounted, with horizontal bars representing the distance between two sieves). In Figure 6a, we can see that for the B/A ratio, there are two datapoints, regarding the finest samples, with a considerably lower value (approximately 1.8) than the other samples, for which the values oscillate between 2.2 and 2.7 without a clear trend. It is interesting to note that the mentioned two finest spectra (SC 0–25 μm and SC 25–38 μm) are also the ones for which the TF is emerging as a local maximum, even if not A nor B regions comprehend or are even close to the TF region. In Figure 6b, the relationship between C/B ratio and the grain size is inverse: the two finest samples present C/B >1, whereas the value is lower than one for all the other samples. However, differently from B/A, C/B seem to have a more regular trend: the larger the grain size, the is lower C/B for all the spectra, even coarser ones. In particular, it appears that this decrease in C/B with increasing grain size is still significant until ca. 200 μm, whereas the trend flattens for coarser samples. Overall, the datapoints seem to fit well within a negative exponential trend (which is reported in Figure 6b as a dashed line), making C/B ratio a good parameter to characterize and distinguish grain size of chemically homogeneous silicate glasses.

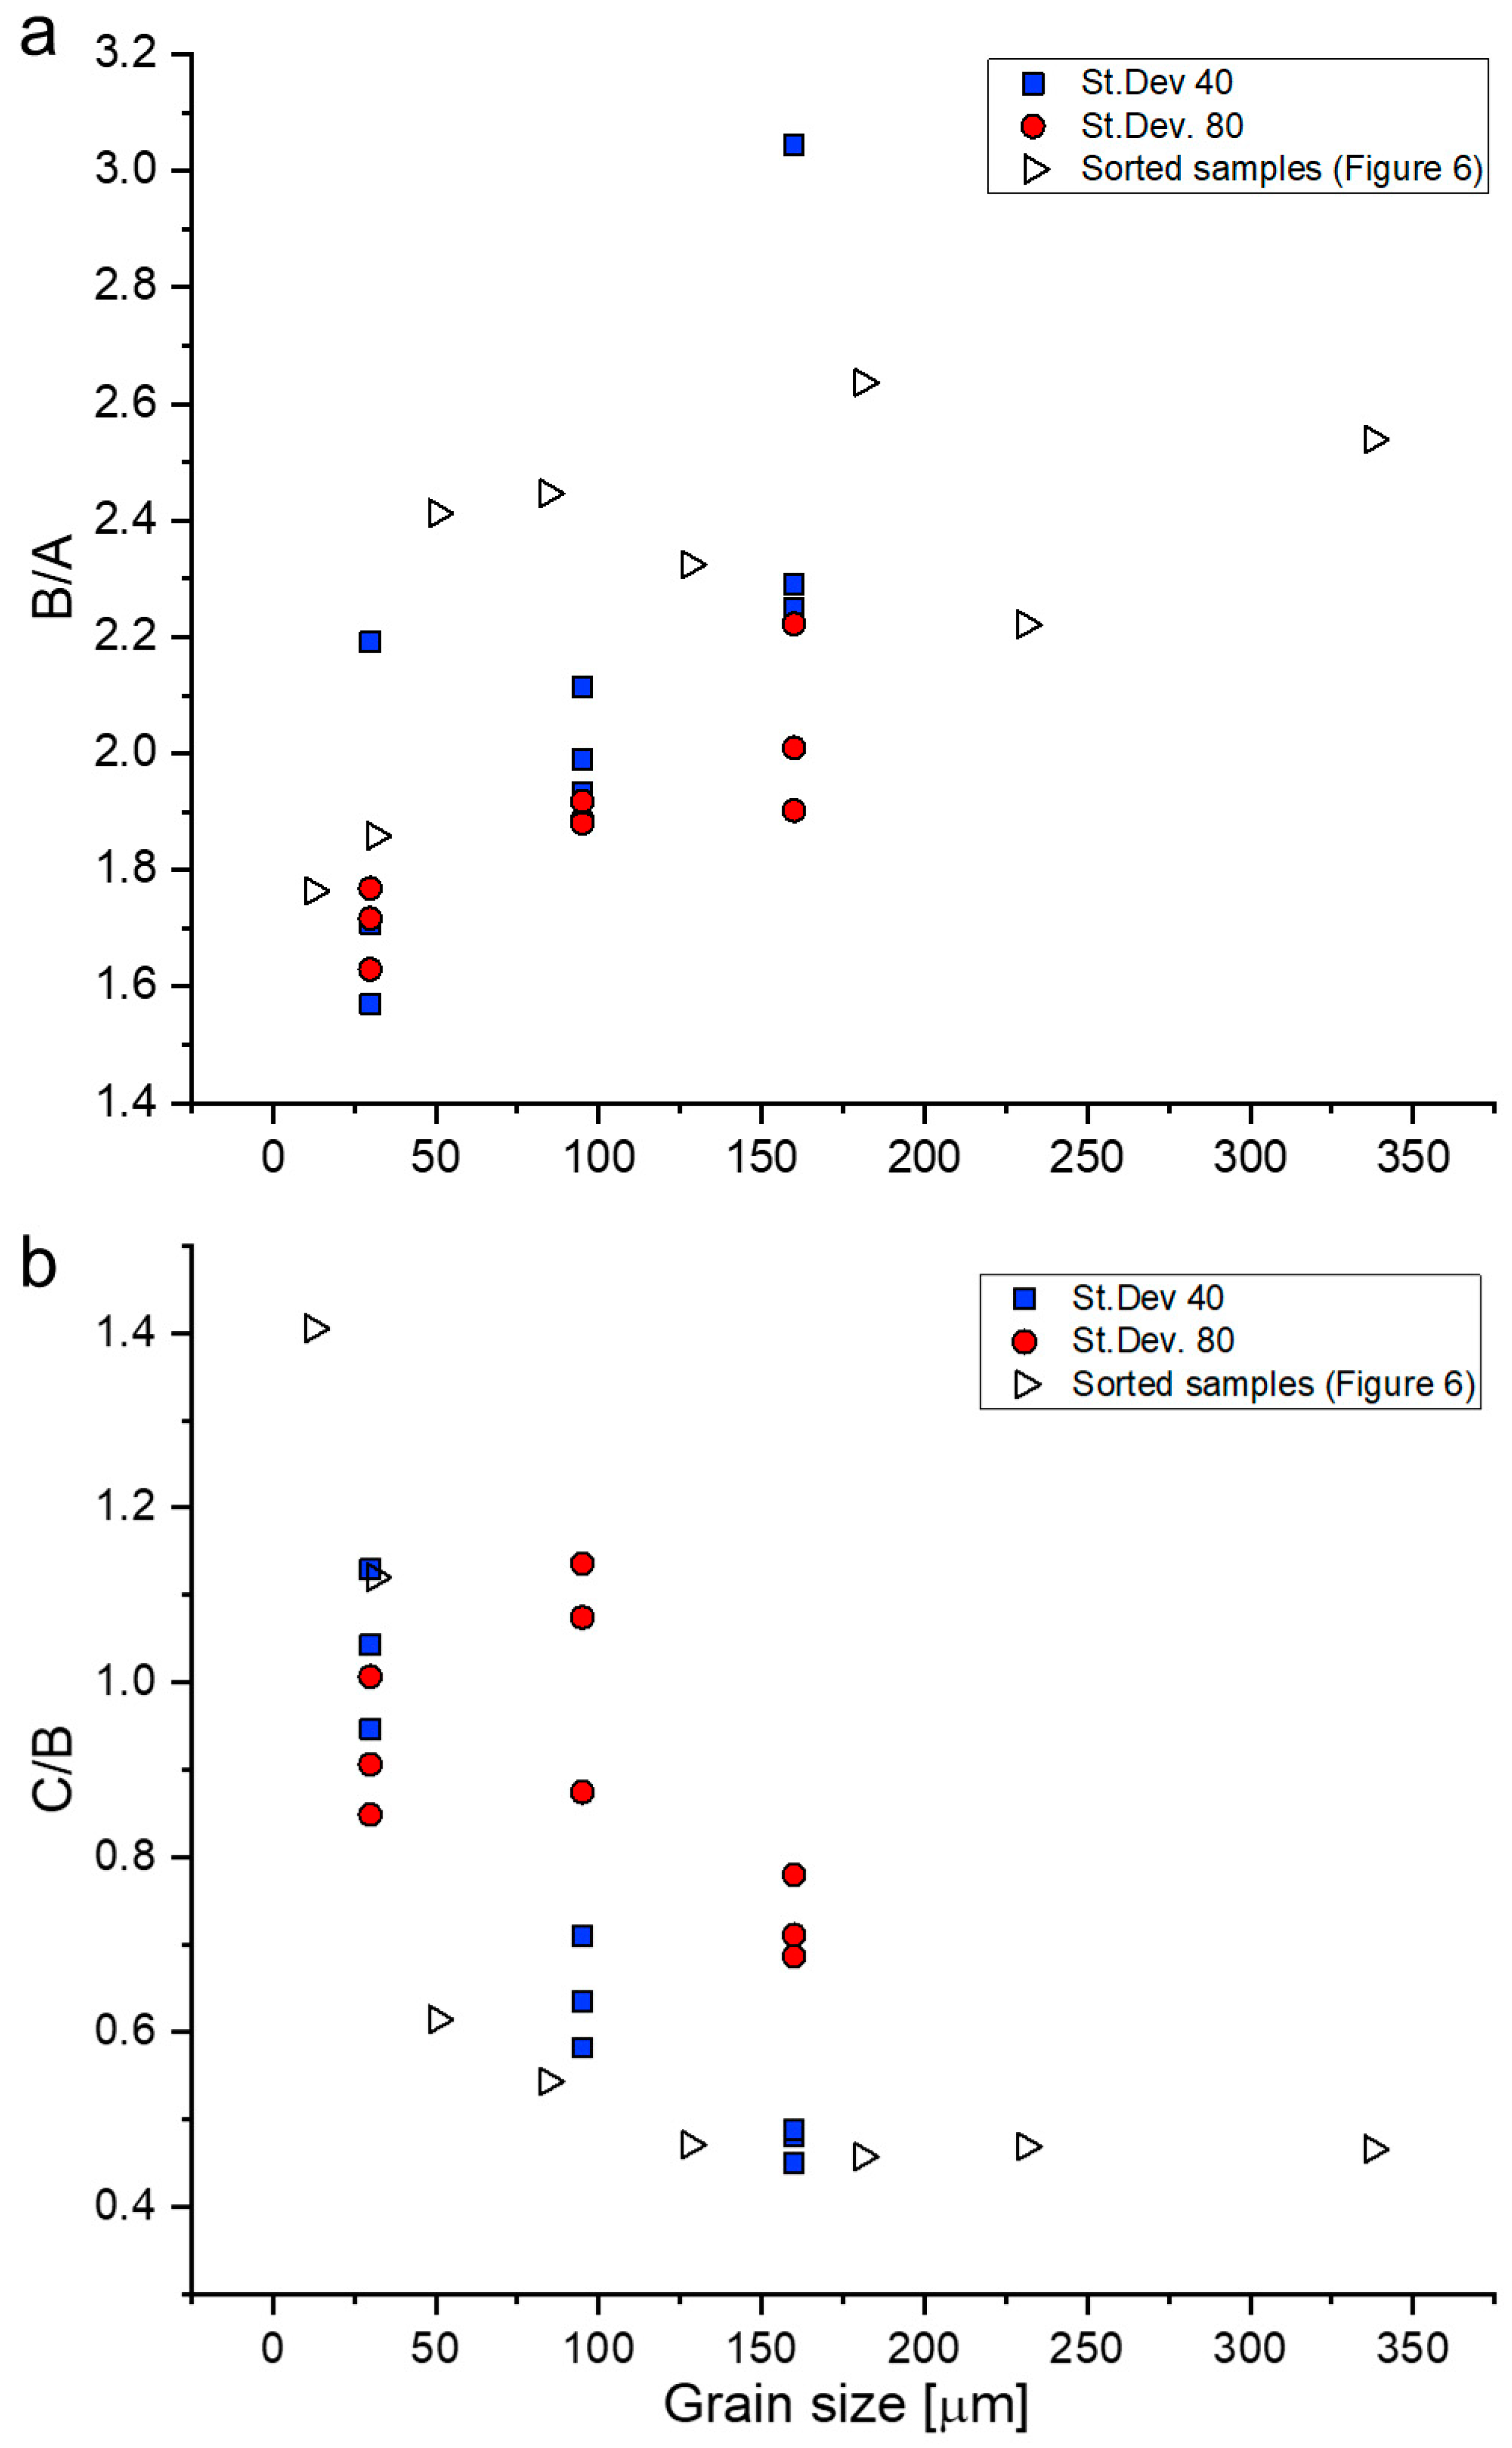
4.3. Comparison between SC and GD Samples

As for GD samples, we have parameterized their spectra by means of the same ratios introduced in the previous section, B/A and C/B, and their values are reported in Table 5 and graphed in Figure 7, where data from SC samples are also reported in black and white for better comparison.
Overall, we see that the large variability in spectral intensity observed in Figure 4 is reflected in a certain variability of values of B/A and B/C ratios reported in Table 5 for GD samples, which results in a vertical span of the GD-related datapoints depicted in Figure 7. Regarding such issues, we must state that there is indeed an operational bias which is derived by how is the sample holder filled, but we can anyway go on with some semi-qualitative observations.
Concerning the B/A ratio as reported in Figure 7a, we observe that values of GD samples are generally lower than the ones belonging to SC material, with the exception of two datapoints. We have previously observed that for SC samples this specific ratio is able to distinguish extremely fine material (<200 μm) because they show B/A < 2, whereas we can see that many datapoints show B/A < 2 for GD samples, and we can hypothesize that the presence of small grains greatly influences values of B/A by lowering them. Variation of C/B for GD samples can be observed in Figure 7b, where we can see that (i) all samples with an average grain size of 30 μm present C/B that spans of ca. 0.3, with GD_30_80 spectra presenting slightly higher values of C/B than GD_30_40. However, all the datapoints seem to fall well within the trend of SC samples, because even if they present a certain vertical span, they fall in a region where the trend of sorted samples is almost vertical; (ii) samples whose average value is 95 μm present a larger span in C/B values (ca. 0.6) but the different standard deviation clearly define two different clusters: with more sorted material (GD_95_40) with lower C/B values and getting close to the trend of SC samples and less sorted material (GD_95_80) with higher C/B values, probably influenced by larger fractions of fine materials; (iii) samples with average grain size of 160 present a total span in C/B values of ca. 0.4, and even here the different standard deviation clearly determines more sorted material (GD_160_40) to have lower C/B values and getting close to the trend of SC samples, whereas less sorted material (GD_160_80) have larger C/B values influenced by fine powder.

5. Conclusions

We have reported an investigation of reflectance spectroscopy in the mid-infrared (MIR) range for a series of Mercury-like silicate glasses with different granulometric characteristics, offering an unprecedented reference set for the interpretation of spectral properties of terrains on Mercury, in particular for what concerns the putative occurrences of volcaniclastic material, such as ash, on such planet.
We have observed that the grain size-derived spectral variation of MIR spectra in the 7–13 μm interval can be described by means of two characteristics: the increase in the intensity of Reststrahlen bands with increasing grain size and the emergence of the TF for finer samples.
We have reported and described spectra of samples presenting an extremely sorted grain size distribution and samples with wider distributions. We propose to simplify the analyses on three bands, centered, respectively, at 8.4, 9.66 and 11.95 μm. The ratio of reflectance values of such bands is able to characterize granulometries of materials: for sorted samples (SC), we have observed how variation of spectral characteristics is very large for granulometries up to 200 μm and can be easily parametrized by the mentioned ratios; as for less sorted samples (GD), we have observed that a small content of fine material in an overall coarser powder might heavily influence the shape of the spectra, and therefore the proposed ratios.
Information collected in this study will surely help the scientific community to interpret geological characteristics of putative volcanic terrains by means of their spectral features, especially for what concerns the portion of terrains which are thought to be constituted of extremely fine material. This dataset will be pivotal to compare with data acquired by the instrument onboard the BepiColombo mission such as SIMBIO-SYS [82] and MERTIS [83]. However, some unsolved questions, such as the dependency of the emergence of the TF on chemical composition, will need further studies concerning variation of grain size and chemical composition of silicate glasses.

Author Contributions

Conceptualization, D.P. and A.P.; methodology, E.B., A.P., J.R.B., G.P. and P.T.; formal analysis, E.B., A.P. and P.T.; investigation, A.P. and M.B.; writing—original draft preparation, A.P.; writing—review and editing, G.P., M.B. and D.P.; visualization, A.P.; supervision, D.P. and J.R.B.; funding acquisition, D.P. and J.R.B. All authors have read and agreed to the published version of the manuscript.

Funding

We acknowledge the support of ASI under the ASI-UniPG agreement 2019-2-HH.0. J.R.B. acknowledges INAF-ASI agreement 2022-1-HH.0 and G.P. acknowledges support by Centre national d’études spatiales (CNES).

Data Availability Statement

Publicly available datasets were analyzed in this study. These data can be found here: https://www.ssdc.asi.it (accessed 15 January 2023), under the PVRG rock catalog.

Acknowledgments

A.P. would like to thank G. Succi and B. Dorella for laboratory technical support.

Conflicts of Interest

We declare no conflict of interest.

References

  1. Wilson, L. Volcanism in the Solar System. Nat. Geosci. 2009, 2, 389–397. [Google Scholar] [CrossRef]
  2. Byrne, P.K. A Comparison of Inner Solar System Volcanism. Nat. Astron. 2019, 4, 321–327. [Google Scholar] [CrossRef]
  3. Gregg, T.K.P.; Lopes, R.M.C.; Sarah, A. Planetary Volcanism across the Solar System; Elsevier: Amsterdam, The Netherlands, 2022; ISBN 9780128139875. [Google Scholar]
  4. Denevi, B.W.; Ernst, C.M.; Meyer, H.M.; Robinson, M.S.; Murchie, S.L.; Whitten, J.L.; Head, J.W.; Watters, T.R.; Solomon, S.C.; Ostrach, L.R.; et al. The Distribution and Origin of Smooth Plains on Mercury. J. Geophys. Res. Planets 2013, 118, 891–907. [Google Scholar] [CrossRef] [Green Version]
  5. Head, J.W.; Chapman, C.R.; Strom, R.G.; Fassett, C.I.; Denevi, B.W.; Blewett, D.T.; Ernst, C.M.; Watters, T.R.; Solomon, S.C.; Murchie, S.L.; et al. Flood Volcanism in the Northern High Latitudes of Mercury Revealed by MESSENGER. Science 2011, 333, 1853–1856. [Google Scholar] [CrossRef] [Green Version]
  6. Head, J.W.; Murchie, S.L.; Prockter, L.M.; Solomon, S.C.; Chapman, C.R.; Strom, R.G.; Watters, T.R.; Blewett, D.T.; Gillis-Davis, J.J.; Fassett, C.I.; et al. Volcanism on Mercury: Evidence from the First MESSENGER Flyby for Extrusive and Explosive Activity and the Volcanic Origin of Plains. Earth Planet Sci. Lett. 2009, 285, 227–242. [Google Scholar] [CrossRef]
  7. Gillis-Davis, J.J.; Blewett, D.T.; Gaskell, R.W.; Denevi, B.W.; Robinson, M.S.; Strom, R.G.; Solomon, S.C.; Sprague, A.L. Pit-Floor Craters on Mercury: Evidence of near-Surface Igneous Activity. Earth Planet Sci. Lett. 2009, 285, 243–250. [Google Scholar] [CrossRef]
  8. Klimczak, C.; Crane, K.T.; Habermann, M.A.; Byrne, P.K. The Spatial Distribution of Mercury’s Pyroclastic Activity and the Relation to Lithospheric Weaknesses. Icarus 2018, 315, 115–123. [Google Scholar] [CrossRef]
  9. Platz, T.; Byrne, P.K.; Massironi, M.; Hiesinger, H. Volcanism and Tectonism across the Inner Solar System: An Overview. Geol. Soc. 2015, 401, 1–56. [Google Scholar] [CrossRef]
  10. Sitarz, M. The Structure of Simple Silicate Glasses in the Light of Middle Infrared Spectroscopy Studies. J. Non. Cryst. Solids 2011, 357, 1603–1608. [Google Scholar] [CrossRef]
  11. King, P.L.; McMillan, P.F.; Moore, G.M.; Ramsey, M.S.; Swayze, G.A. Infrared Spectroscopy of Silicate Glasses with Application to Natural Systems. Infrared Spectrosc. Geochem. Explor. Geochem. Remote Sens. 2004, 33, 93–133. [Google Scholar]
  12. Hamilton, V.E.; Christensen, P.R. Determining the Modal Mineralogy of Mafic and Ultramafic Igneous Rocks Using Thermal Emission Spectroscopy. J. Geophys. Res. Planets 2000, 105, 9717–9733. [Google Scholar] [CrossRef]
  13. Cooper, B.L.; Salisbury, J.W.; Killen, R.M.; Potter, A.E. Midinfrared Spectral Features of Rocks and Their Powders. J. Geophys. Res. Planets 2002, 107, 1. [Google Scholar] [CrossRef]
  14. Hamilton, V.E. Thermal Infrared Emission Spectroscopy of the Pyroxene Mineral Series. J. Geophys. Res. Planets 2000, 105, 9701–9716. [Google Scholar] [CrossRef] [Green Version]
  15. Lane, M.D.; Glotch, T.D.; Dyar, M.D.; Pieters, C.M.; Klima, R.; Hiroi, T.; Bishop, J.L.; Sunshine, J. Midinfrared Spectroscopy of Synthetic Olivines: Thermal Emission, Specular and Diffuse Reflectance, and Attenuated Total Reflectance Studies of Forsterite to Fayalite. J. Geophys. Res. Planets 2011, 116, 8010. [Google Scholar] [CrossRef] [Green Version]
  16. Hamilton, V.E.; Haberle, C.W.; Mayerhöfer, T.G. Effects of Small Crystallite Size on the Thermal Infrared (Vibrational) Spectra of Minerals. Am. Mineral. 2020, 105, 1756–1760. [Google Scholar] [CrossRef]
  17. Serventi, G.; Carli, C.; Sgavetti, M.; Ciarniello, M.; Capaccioni, F.; Pedrazzi, G. Spectral Variability of Plagioclase–Mafic Mixtures (1): Effects of Chemistry and Modal Abundance in Reflectance Spectra of Rocks and Mineral Mixtures. Icarus 2013, 226, 282–298. [Google Scholar] [CrossRef]
  18. Pisello, A.; Vetere, P.; Bisolfati, M.; Maturilli, A.; Morgavi, D.; Pauselli, C.; Iezzi, G.; Lustrino, M.; Perugini, D. Retrieving Magma Composition from TIR Spectra: Implications for Terrestrial Planets Investigations. Sci. Rep. 2019, 9, 15200. [Google Scholar] [CrossRef] [Green Version]
  19. Helbert, J.; Maturilli, A. The Emissivity of a Fine-Grained Labradorite Sample at Typical Mercury Dayside Temperatures. Earth Planet Sci. Lett. 2009, 285, 347–354. [Google Scholar] [CrossRef]
  20. Poggiali, G.; Brucato, J.R.; Dotto, E.; Ieva, S.; Barucci, M.A.; Pajola, M. Temperature Dependent Mid-Infrared (5–25 Μm) Reflectance Spectroscopy of Carbonaceous Meteorites and Minerals: Implication for Remote Sensing in Solar System Exploration. Icarus 2021, 354, 114040. [Google Scholar] [CrossRef]
  21. Martin, A.C.; Emery, J.P.; Loeffler, M.J. Spectral Effects of Regolith Porosity in the Mid-IR—Forsteritic Olivine. Icarus 2022, 378, 114921. [Google Scholar] [CrossRef]
  22. Aronson, J.R.; Emslie, A.G. Spectral Reflectance and Emittance of Particulate Materials. 2: Application and Results. Appl. Opt. 1973, 12, 2573–2584. [Google Scholar] [CrossRef] [PubMed]
  23. Udvardi, B.; Szalai, Z.; Fancsik, T.; Kónya, P.; Stercel, F.; Kovács, I.J.; Falus, G.; Bátori, M. Effects of Particle Size on the Attenuated Total Reflection Spectrum of Minerals. Appl. Spectrosc. 2017, 71, 1157–1168. [Google Scholar] [CrossRef] [PubMed]
  24. Wald, A.E.; Salisbury, J.W. Thermal Infrared Directional Emissivity of Powdered Quartz. J. Geophys. Res. 1995, 100, 665–689. [Google Scholar] [CrossRef]
  25. Salisbury, J.W.; Eastes, J.W. The Effect of Particle Size and Porosity on Spectral Contrast in the Mid-Infrared. Icarus 1985, 64, 586–588. [Google Scholar] [CrossRef]
  26. Mustard, J.F.; Hays, J.E. Effects of Hyperfine Particles on Reflectance Spectra from 0.3 to 25 Μm. Icarus 1997, 125, 145–163. [Google Scholar] [CrossRef] [Green Version]
  27. Salisbury, J.W.; Wald, A. The Role of Volume Scattering in Reducing Spectral Contrast of Reststrahlen Bands in Spectra of Powdered Minerals. Icarus 1992, 96, 121–128. [Google Scholar] [CrossRef]
  28. Conel, J.E. Infrared Emissivities of Silicates: Experimental Results and a Cloudy Atmosphere Model of Spectral Emission from Condensed Particulate Mediums. J. Geophys. Res. 1969, 74, 1614–1634. [Google Scholar] [CrossRef]
  29. Christensen, P.R.; Bandfield, J.L.; Hamilton, V.E.; Howard, D.A.; Lane, M.D.; Piatek, J.L.; Ruff, S.W.; Stefanov, W.L. A Thermal Emission Spectral Library of Rock-Forming Minerals. J. Geophys. Res. Planets 2000, 105, 9735–9739. [Google Scholar] [CrossRef] [Green Version]
  30. Salisbury, J.W.; Walter, L.S. Thermal Infrared (2.5–13.5 Μm) Spectroscopic Remote Sensing of Igneous Rock Types on Particulate Planetary Surfaces. J. Geophys. Res. Solid Earth 1989, 94, 9192–9202. [Google Scholar] [CrossRef]
  31. Sprague, A.; Warell, J.; Cremonese, G.; Langevin, Y.; Helbert, J.; Wurz, P.; Veselovsky, I.; Orsini, S.; Milillo, A. Mercury’s Surface Composition and Character as Measured by Ground-Based Observations; Springer: Cham, Switzerland, 2008; pp. 217–249. [Google Scholar] [CrossRef]
  32. Emery, J.P.; Sprague, A.L.; Witteborn, F.C.; Colwell, J.E.; Kozlowski, R.W.H.; Wooden, D.H. Mercury: Thermal modeling and mid-infrared (5–12 μm) observations. Icarus 1998, 136, 104–123. [Google Scholar] [CrossRef]
  33. Gundlach, B.; Blum, J. A new method to determine the grain size of planetary regolith. Icarus 2013, 223, 479–492. [Google Scholar] [CrossRef] [Green Version]
  34. Scudder, N.A.; Horgan, B.H.N.; Rampe, E.B.; Smith, R.J.; Rutledge, A.M. The Effects of Magmatic Evolution, Crystallinity, and Microtexture on the Visible/near-Infrared and Thermal-Infrared Spectra of Volcanic Rocks. Icarus 2021, 359, 114344. [Google Scholar] [CrossRef]
  35. Shirley, K.A.; Glotch, T.D. Particle Size Effects on Mid-Infrared Spectra of Lunar Analog Minerals in a Simulated Lunar Environment. J. Geophys. Res. Planets 2019, 124, 970–988. [Google Scholar] [CrossRef]
  36. Serventi, G.; Carli, C. The Role of Very Fine Particle Sizes in the Reflectance Spectroscopy of Plagioclase-Bearing Mixtures: New Understanding for the Interpretation of the Finest Sizes of the Lunar Regolith. Icarus 2017, 293, 157–171. [Google Scholar] [CrossRef]
  37. Lane, M.D. Midinfrared Optical Constants of Calcite and Their Relationship to Particle Size Effects in Thermal Emission Spectra of Granular Calcite. J. Geophys. Res. Planets 1999, 104, 14099–14108. [Google Scholar] [CrossRef]
  38. Lane, M.D.; Christensen, P.R. Thermal Infrared Emission Spectroscopy of Salt Minerals Predicted for Mars. Icarus 1998, 135, 528–536. [Google Scholar] [CrossRef]
  39. Fastelli, M.; Comodi, P.; Schmitt, B.; Beck, P.; Poch, O.; Sassi, P.; Zucchini, A. Reflectance Spectra (1–5 Μm) at Low Temperatures and Different Grain Sizes of Ammonium-Bearing Minerals Relevant for Icy Bodies. Icarus 2022, 382, 115055. [Google Scholar] [CrossRef]
  40. Morlok, A.; Klemme, S.; Weber, I.; Stojic, A.; Sohn, M.; Hiesinger, H. IR Spectroscopy of Synthetic Glasses with Mercury Surface Composition: Analogs for Remote Sensing. Icarus 2017, 296, 123–138. [Google Scholar] [CrossRef]
  41. Morlok, A.; Renggli, C.; Charlier, B.; Reitze, M.P.; Klemme, S.; Namur, O.; Sohn, M.; Martin, D.; Weber, I.; Stojic, A.N.; et al. Mid-Infrared Reflectance Spectroscopy of Synthetic Glass Analogs for Mercury Surface Studies. Icarus 2021, 361, 114363. [Google Scholar] [CrossRef]
  42. Morlok, A.; Stojic, A.; Weber, I.; Hiesinger, H.; Zanetti, M.; Helbert, J. Mid-Infrared Bi-Directional Reflectance Spectroscopy of Impact Melt Glasses and Tektites. Icarus 2016, 278, 162–179. [Google Scholar] [CrossRef]
  43. Carli, C.; Roush, T.L.; Pedrazzi, G.; Capaccioni, F. Visible and Near-Infrared (VNIR) Reflectance Spectroscopy of Glassy Igneous Material: Spectral Variation, Retrieving Optical Constants and Particle Sizes by Hapke Model. Icarus 2016, 266, 267–278. [Google Scholar] [CrossRef]
  44. Mysen, B.O.; Richet, P. Silicate Glasses and Melts: Properties and Structure; Elsevier: Amsterdam, The Netherlands, 2005; Volume 10. [Google Scholar]
  45. Dingwell, D.B.; Lavallée, Y.; Kueppers, U. Volcanic Ash: A Primary Agent in the Earth System. Phys. Chem. Earth Parts A B C 2012, 45, 2–4. [Google Scholar] [CrossRef]
  46. Namur, O.; Charlier, B. Silicate mineralogy at the surface of Mercury. Nat. Geosci. 2016, 10, 9–13. [Google Scholar] [CrossRef]
  47. Cannon, K.M.; Mustard, J.F.; Parman, S.W.; Sklute, E.C.; Dyar, M.D.; Cooper, R.F. Spectral Properties of Martian and Other Planetary Glasses and Their Detection in Remotely Sensed Data. J. Geophys. Res. Planets 2017, 122, 249–268. [Google Scholar] [CrossRef]
  48. Pisello, A.; de Angelis, S.; Ferrari, M.; Porreca, M.; Vetere, F.P.; Behrens, H.; de Sanctis, M.C.; Perugini, D. Visible and Near-InfraRed (VNIR) Reflectance of Silicate Glasses: Characterization of a Featureless Spectrum and Implications for Planetary Geology. Icarus 2022, 374, 114801. [Google Scholar] [CrossRef]
  49. Zeng, X.; Li, X.; Martin, D.; Tang, H.; Yu, W.; Liu, J.; Wang, S. Micro-FTIR Spectroscopy of Lunar Pyroclastic and Impact Glasses as a New Diagnostic Tool to Discern Them. J. Geophys. Res. Planets 2019, 124, 3267–3282. [Google Scholar] [CrossRef]
  50. Wright, H.M.N.; Folkes, C.B.; Cas, R.A.F.; Cashman, K. Heterogeneous Pumice Populations in the 2.08-Ma Cerro Galán Ignimbrite: Implications for Magma Recharge and Ascent Preceding a Large-Volume Silicic Eruption. Bull. Volcanol. 2011, 73, 1513–1533. [Google Scholar] [CrossRef]
  51. Moroz, L.V.; Basilevsky, A.T.; Hiroi, T.; Rout, S.S.; Baither, D.; van der Bogert, C.H.; Yakovlev, O.I.; Fisenko, A.V.; Semjonova, L.F.; Rusakov, V.S.; et al. Spectral Properties of Simulated Impact Glasses Produced from Martian Soil Analogue JSC Mars-1. Icarus 2009, 202, 336–353. [Google Scholar] [CrossRef] [Green Version]
  52. Seelos, K.D.; Arvidson, R.E.; Jolliff, B.L.; Chemtob, S.M.; Morris, R.V.; Ming, D.W.; Swayze, G.A. Silica in a Mars Analog Environment: Ka’u Desert, Kilauea Volcano, Hawaii. J. Geophys. Res. Planets 2010, 115, E4. [Google Scholar] [CrossRef] [Green Version]
  53. Kraft, M.D.; Michalski, J.R.; Sharp, T.G. Effects of Pure Silica Coatings on Thermal Emission Spectra of Basaltic Rocks: Considerations for Martian Surface Mineralogy. Geophys. Res. Lett. 2003, 30, 24. [Google Scholar] [CrossRef]
  54. Chemtob, S.M.; Jolliff, B.L.; Rossman, G.R.; Eiler, J.M.; Arvidson, R.E. Silica Coatings in the Ka’u Desert, Hawaii, a Mars Analog Terrain: A Micromorphological, Spectral, Chemical, and Isotopic Study. J. Geophys. Res. Planets 2010, 115, JE003473. [Google Scholar] [CrossRef] [Green Version]
  55. Pisello, A.; Ferrari, M.; de Angelis, S.; Vetere, F.P.; Porreca, M.; Stefani, S.; Perugini, D. Reflectance of Silicate Glasses in the Mid-Infrared Region (MIR): Implications for Planetary Research. Icarus 2022, 388, 115222. [Google Scholar] [CrossRef]
  56. Bell, P.M.; Mao, H.K.; Weeks, R.A. Optical Spectra and Electron Paramagnetic Resonance of Lunar and Synthetic Glasses-A Study of the Effects of Controlled Atmosphere, Composition, and Temperature. Proc. Lunar Planet. Sci. Conf. Proc. 1976, 7, 2543–2559. [Google Scholar]
  57. Cloutis, E.A.; Gaffey, M.J.; Smith, D.G.W.; Lambert, R.S.J. Reflectance Spectra of Glass-Bearing Mafic Silicate Mixtures and Spectral Deconvolution Procedures. Icarus 1990, 86, 383–401. [Google Scholar] [CrossRef]
  58. Biren, J.; Slodczyk, A.; Andújar, J.; del Campo, L.; Cosson, L.; Li, H.; Veron, E.; Genevois, C.; Ory, S.; Aufaristama, M. High Temperature Spectral Emissivity of Glass and Crystal-Bearing Basalts. J. Volcanol. Geotherm. Res. 2022, 430, 107623. [Google Scholar] [CrossRef]
  59. Dufresne, C.D.M.; King, P.L.; Dyar, M.D.; Dalby, K.N. Effect of SiO2, Total FeO, Fe3+/Fe2+, and Alkali Elements in Basaltic Glasses on Mid-Infrared Spectra. Am. Mineral. 2009, 94, 1580–1590. [Google Scholar] [CrossRef]
  60. King, P.L.; Larsen, J.F. A Micro-Reflectance IR Spectroscopy Method for Analyzing Volatile Species in Basaltic, Andesitic, Phonolitic, and Rhyolitic Glasses. Am. Mineral. 2013, 98, 1162–1171. [Google Scholar] [CrossRef]
  61. Dalby, K.N.; King, P.L. A New Approach to Determine and Quantify Structural Units in Silicate Glasses Using Micro-Reflectance Fourier-Transform Infrared Spectroscopy. Am. Mineral. 2006, 91, 1783–1793. [Google Scholar] [CrossRef]
  62. Byrnes, J.M.; Ramsey, M.S.; King, P.L.; Lee, R.J. Thermal Infrared Reflectance and Emission Spectroscopy of Quartzofeldspathic Glasses. Geophys. Res. Lett. 2007, 34, GL027893. [Google Scholar] [CrossRef] [Green Version]
  63. Scholze, H. Glass: Nature, Structure, and Properties; Springer Science & Business Media: New York, NY, USA, 2012. [Google Scholar]
  64. Mercier, M.; di Muro, A.; Métrich, N.; Giordano, D.; Belhadj, O.; Mandeville, C.W. Spectroscopic Analysis (FTIR, Raman) of Water in Mafic and Intermediate Glasses and Glass Inclusions. Geochim. Cosmochim. Acta 2010, 74, 5641–5656. [Google Scholar] [CrossRef]
  65. Mysen, B.O.; Virgo, D.; Scarfe, C.M. Relations between the Anionic Structure and Viscosity of Silicate Melts—A Raman Spectroscopic Study. Am. Mineral. 1980, 65, 690–710. [Google Scholar]
  66. Morlok, A.; Klemme, S.; Weber, I.; Stojic, A.; Sohn, M.; Hiesinger, H.; Helbert, J. Mid-Infrared Spectroscopy of Planetary Analogs: A Database for Planetary Remote Sensing. Icarus 2019, 324, 86–103. [Google Scholar] [CrossRef]
  67. Morlok, A.; Hamann, C.; Martin, D.; Weber, I.; Joy, K.H.; Hiesinger, H.; Wogelius, R.; Stojic, A.N.; Helbert, J. Mid-Infrared Spectroscopy of Laser-Produced Basalt Melts for Remote Sensing Application. Icarus 2020, 335, 113410. [Google Scholar] [CrossRef]
  68. Cord, A.M.; Pinet, P.C.; Daydou, Y.; Chevrel, S.D. Planetary Regolith Surface Analogs: Optimized Determination of Hapke Parameters Using Multi-Angular Spectro-Imaging Laboratory Data. Icarus 2003, 165, 414–427. [Google Scholar] [CrossRef]
  69. Buhl, E.; Sommer, F.; Poelchau, M.H.; Dresen, G.; Kenkmann, T. Ejecta from Experimental Impact Craters: Particle Size Distribution and Fragmentation Energy. Icarus 2014, 237, 131–142. [Google Scholar] [CrossRef]
  70. Kerber, L.; Head, J.W.; Solomon, S.C.; Murchie, S.L.; Blewett, D.T.; Wilson, L. Explosive Volcanic Eruptions on Mercury: Eruption Conditions, Magma Volatile Content, and Implications for Interior Volatile Abundances. Earth Planet Sci. Lett. 2009, 285, 263–271. [Google Scholar] [CrossRef]
  71. Jones, T.J.; Russell, J.K. Ash Production by Attrition in Volcanic Conduits and Plumes. Sci. Rep. 2017, 7, 1–12. [Google Scholar] [CrossRef] [Green Version]
  72. Springsklee, C.; Scheu, B.; Manga, M.; Cigala, V.; Cimarelli, C.; Dingwell, D.B. The Influence of Grain Size Distribution on Laboratory-Generated Volcanic Lightning. J. Geophys. Res. Solid Earth 2022, 127, e2022JB024390. [Google Scholar] [CrossRef]
  73. Nittler, L.R.; Starr, R.D.; Weider, S.Z.; McCoy, T.J.; Boynton, W.V.; Ebel, D.S.; Ernst, C.M.; Evans, L.G.; Goldsten, J.O.; Hamara, D.K.; et al. The Major-Element Composition of Mercury’s Surface from MESSENGER X-Ray Spectrometry. Science 2011, 333, 1847–1850. [Google Scholar] [CrossRef]
  74. Vetere, F.P.; Iezzi, G.; Behrens, H.; Holtz, F.; Ventura, G.; Misiti, V.; Cavallo, A.; Mollo, S.; Dietrich, M. Glass Forming Ability and Crystallisation Behaviour of Sub-Alkaline Silicate Melts. Earth Sci. Rev. 2015, 150, 25–44. [Google Scholar] [CrossRef]
  75. Salisbury, J.W.; D’Aria, D.M.; Jarosewich, E. Midinfrared (2.5–13.5 Μm) Reflectance Spectra of Powdered Stony Meteorites. Icarus 1991, 92, 280–297. [Google Scholar] [CrossRef]
  76. Meneses, D.D.S.; Eckes, M.; del Campo, L.; Santos, C.N.; Vaills, Y.; Echegut, P. Investigation of Medium Range Order in Silicate Glasses by Infrared Spectroscopy. Vib. Spectrosc. 2013, 65, 50–57. [Google Scholar] [CrossRef]
  77. le Bras, A.; Erard, S. Reflectance Spectra of Regolith Analogs in the Mid-Infrared: Effects of Grain Size. Planet Space Sci. 2003, 51, 281–294. [Google Scholar] [CrossRef]
  78. Ertel, A.B.; Brauer, C.S.; Richardson, R.L.; Tonkyn, R.G.; Myers, T.L.; Blake, T.A.; Johnson, T.J.; Su, Y.-F. Quantitative Reflectance Spectra of Solid Powders as a Function of Particle Size. Appl. Opt. 2015, 54, 4863–4875. [Google Scholar] [CrossRef]
  79. Fortin, M.-A.; Gazel, E.; Kaltenegger, L.; Holycross, M.E. Volcanic Exoplanet Surfaces. Mon. Not. R. Astron. Soc. 2022, 516, 4569–4575. [Google Scholar] [CrossRef]
  80. Carli, C.; Ciarniello, M.; Capaccioni, F.; Serventi, G.; Sgavetti, M. Spectral Variability of Plagioclase–Mafic Mixtures (2): Investigation of the Optical Constant and Retrieved Mineral Abundance Dependence on Particle Size Distribution. Icarus 2014, 235, 207–219. [Google Scholar] [CrossRef]
  81. De Angelis, S.; de Sanctis, M.C.; Ammannito, E.; Carli, C.; di Iorio, T.; Altieri, F. The Ma_Miss Instrument Performance, I: Analysis of Rocks Powders by Martian VNIR Spectrometer. Planet Space Sci. 2014, 101, 89–107. [Google Scholar] [CrossRef]
  82. Cremonese, G.; Capaccioni, F.; Capria, M.T.; Doressoundiram, A.; Palumbo, P.; Vincendon, M.; Massironi, M.; Debei, S.; Zusi, M.; Altieri, F.; et al. SIMBIO-SYS: Scientific Cameras and Spectrometer for the BepiColombo Mission. Space Sci. Rev. 2020, 216, 1–78. [Google Scholar] [CrossRef]
  83. Hiesinger, H.; Helbert, J.; Alemanno, G.; Bauch, K.E.; D’Amore, M.; Maturilli, A.; Morlok, A.; Reitze, M.P.; Stangarone, C.; Stojic, A.N.; et al. Studying the Composition and Mineralogy of the Hermean Surface with the Mercury Radiometer and Thermal Infrared Spectrometer (MERTIS) for the BepiColombo Mission: An Update. Space Sci. Rev. 2020, 216, 1–37. [Google Scholar]
Figure 1. Grain size distribution of GD samples.
Minerals 13 00170 g001
Figure 2. Relationship between target composition and measured composition of the produced glass. The black line represents a 1:1 relationship.
Minerals 13 00170 g002
Figure 3. Set of spectra obtained from SC samples with main spectral features highlighted.
Minerals 13 00170 g003
Figure 4. Set of spectra obtained from GD samples, divided by means of the mean value of the grain-size: (a) samples with mean value of 30 µm, (b) samples with mean value of 95 µm, (c) samples with mean value of 160 µm.
Minerals 13 00170 g004
Figure 5. Normalized spectra obtained from SC samples with regions of interest A, B and C highlighted.
Minerals 13 00170 g005
Figure 6. Relationship between ratios of reflectance (a) B/A and (b) C/B (see Figure 5) and grain size (central value) of SC samples.
Minerals 13 00170 g006
Figure 7. Relationship between ratios of reflectance (a) B/A and (b) C/B (see Figure 5) and grain size (average value) of SC samples.
Minerals 13 00170 g007
Table 1. Target composition and oxides used for the production of glass samples.
Target CompositionSiO2Al2O3FeOMgOCaONa2O
(wt.%)57.7714.081.0415.674.237.21
Oxide MixtureSiO2Al2O3FeOMgOCaONa2CO3
(g)57.7714.081.1615.674.2312.33
Table 2. Chemical composition and relative standard deviations of the produced silicate glass, performed with EMPA on 21 spots of three different fragments.
SiO2Al2O3FeOMgOCaONa2OTotal
Av. Measured wt.%57.8013.601.1515.683.757.2799.24
St.Dev.0.280.140.070.170.040.130.35
Normalized wt.%58.2413.711.1615.803.787.32100.00
Table 3. Wavelength position of main spectral features for SC samples.
0–25 µm25–38 µm38–63 µm63–106 µm106–150 µm150–212 µm212–250 µm250–425 µm
CF (µm)8.048.048.048.038.038.038.038.03
RBpeak (µm)9.789.679.649.669.649.679.629.67
TF (µm)11.9511.97------
Table 4. Wavelength position of spectral features for GD samples.
GD_30_40 GD_30_80
CF (µm)8.038.038.048.038.048.03
RBpeak (µm)9.69.699.769.669.699.64
TF (µm)11.8911.9211.9211.8911.9211.89
GD_95_40 GD_95_80
CF (µm)8.048.038.038.048.048.03
RBpeak (µm)9.679.649.629.719.739.67
TF (µm)11.73--11.9511.9511.86
GD_160_40 GD_160_80
CF (µm)8.038.048.038.038.038.03
RBpeak (µm)9.629.719.649.679.649.69
TF (µm)----11.711.86
Table 5. Values of ratios of reflectance for zones of interests highlighted in Figure 5. B/A and C/B ratios are reported for both SC and GD samples.
SC
Grain Size ClassCentral ValueB/AC/B
0–25 µm12.5 µm1.761.41
25–38 µm31.5 µm1.861.12
38–63 µm50.5 µm2.410.61
63–106 µm84.5 µm2.450.54
106–150 µm128 µm2.320.47
150–212 µm181 µm2.640.46
212–250 µm231 µm2.220.47
250–425 µm337.5 µm2.540.47
GD
SampleMean ValueSt. Dev.B/AC/B
GD_30_4030401.570.95
1.711.13
2.191.04
GD_30_8030801.630.85
1.721.01
1.770.91
GD_95_4095402.110.71
1.930.63
1.990.58
GD_95_8095801.891.07
1.881.14
1.920.87
GD_160_40160402.250.48
3.040.45
2.290.49
GD_160_80160802.010.69
1.900.71
2.220.78
Disclaimer/Publisher’s Note: The statements, opinions and data contained in all publications are solely those of the individual author(s) and contributor(s) and not of MDPI and/or the editor(s). MDPI and/or the editor(s) disclaim responsibility for any injury to people or property resulting from any ideas, methods, instructions or products referred to in the content.

