
Insights into Regional Metallogeny from Detailed Compositional Studies of Alluvial Gold: An Example from the Loch Tay Area, Central Scotland

Ores and Mineralization Group, School of Earth and Environment, The University of Leeds, Leeds LS2 9JT, UK
*
Author to whom correspondence should be addressed.
Minerals 2023, 13(2), 140; https://doi.org/10.3390/min13020140
Submission received: 12 December 2022
/
Revised: 10 January 2023
/
Accepted: 11 January 2023
/
Published: 18 January 2023
(This article belongs to the Special Issue Native Gold as a Specific Indicator Mineral for Gold Deposits)
Abstract
:Compositional features of a total of 1887 gold alluvial particles from six localities to the south of Loch Tay in central Scotland were interpreted to establish different types of source mineralization. Populations of gold particles from each locality were grouped according to alloy and inclusion signatures. Inclusion suites provided the primary discriminant with gold from Group 1 localities showing a narrow range of simple sulphide and sulphoarsenide inclusion species, whereas a wide range of minerals including molybdenite, bornite and various Bi and Te- bearing species were identified in gold from Group 2 localities. Whilst the range of Ag in alloys in all populations was similar, higher incidences of measurable Hg and Cu were detected in Group 1 and Group 2 gold samples respectively. The application of compositional templates of gold from other localities worldwide indicated that Group 1 gold is orogenic and Group 2 gold is a mixture of porphyry and epithermal origin; a result that is sympathetic to the spatial relationships of sample localities with local lithologies. This approach both provides an enhanced level of understanding of regional gold metallogeny where in situ sources remain undiscovered, and permits clearer targeting of deposit types during future exploration.
1. Introduction
1.1. Application of Gold Compositional Studies to Understanding Regional Metallogeny
Stream sediment geochemistry is a widely used tool in early stage exploration [1,2], and in many cases field teams are taught to record the presence of visible gold in panned concentrates. Regional scale reconnaissance yields important information on the relative distribution of alluvial gold that can in some cases inform follow up study, e.g., [3], but in areas of complex geology different deposit types may be present in the same drainage system, and therefore the discovery of particulate gold in the pan is not indicative of a specific exploration target. The ability to differentiate between gold particles derived from different deposit types would, consequently, be extremely useful. The compositional characteristics of alluvial gold particles that may be related to conditions of formation are preserved after liberation [4,5] and hence provide a route by which this may be achieved.
The development of gold studies as a tool in mineral exploration has been described previously in terms of composition [4,6], and particle morphology [7,8] and the reader is referred to those texts for full accounts. This study focuses on compositional characteristics of gold particles but clear evidence from alluvial gold morphology indicating of a lack of fluvial transport and hence a proximal influx is also an important consideration. In summary, mineralogical features of gold particles comprise the metallic elements other than gold present in the alloy and the suite of inclusions of other minerals observed in the polished section. These features provide criteria by which to characterize a population of gold particles collected from a specific locality (henceforward referred to as ‘a sample population’). Mineralogical characteristics of gold can provide two important types of information in these circumstances. Firstly, characterization of sample populations from different localities permits evaluation of whether or not they are likely to be derived from genetically related sources. Such information is valuable when establishing the extent of mineralization that contributes to an alluvial occurrence. This aspect is particularly important when investigating the source of gold from economic placers because these are likely to be derived from substantial lode occurrences [9]. Secondly, compositional signatures of gold particles may be specific to their hard-rock source, i.e., the deposit type. The development of methodologies to develop gold as an indicator mineral have been reviewed [4] and generic deposit-specific inclusion suite signatures have been reported [10]. In other words, specific mineralogical features of gold within a sample population can point towards a specific deposit type; equally, a range of features within a single population can indicate the presence of several different deposit types within an area. The approach of mineralogical characterization of alluvial gold has been used to advantage in various studies to elucidate the placer-lode gold relationships in orogenic gold districts e.g., Klondike, Yukon [11] and the Cariboo Gold District, British Columbia [9]. Similarly, gold formed in magmatic hydrothermal systems was the focus of studies undertaken in Ecuador [12], British Columbia [13] and Yukon [14]. The same principles were applied to infer the source(s) of gold in economic placers of the Ural Mountains, [15,16] and Salair Ridge [17], Russia. In this paper, we show how alluvial gold characterization can offer valuable insights into the regional metallogeny and gold mineralization styles in the Grampian Terrane of Scotland.
1.2. The Study Area
The Highlands of Scotland (Figure 1A) are world famous for their role in the development of geology as a science, particularly for understanding thrust tectonics and metamorphism, e.g., [18,19], but there is also a long history of small scale metalliferous mining [20]. In Perthshire, historic mining was undertaken for lead and silver at Coire Buidhe, with some native gold recorded as well; and for copper at Tomnadashan (Figure 1B) [21]. Whilst gold from hard-rock sources has historically only been produced as a by-product of mining other metals, some fairly notable alluvial mines operated in the 1500s and the widespread existence of alluvial gold in the drainage of the central Highlands and elsewhere in Scotland has been long recognized [22]. Other accounts, presumably drawn from oral traditions [23,24] of artisanal gold seeking, describe a ‘Central Goldfield’ comprising auriferous areas in Perthshire, Angus and Aberdeen that define a belt to the north of the Highland Boundary Fault (HBF; Figure 1A). Some large gold nuggets have been recorded, e.g., the Turrich Nugget from Glen Quaich, which forms part of the collections of the Natural History Museum, London. Bedrock sources for the widespread alluvial gold in Scotland remained undiscovered until the latter part of the 20th century, when a concerted exploration effort combined traditional prospecting, geophysics, and stream sediment geochemical approaches. These ultimately led to the discovery of in-situ gold-bearing mineralization at Cononish near Tyndrum (Figure 1A; [25]) which is currently the focus of mining operations by Scotgold Ltd. but remains the only hard-rock gold mine ever to have operated in Scotland. The Cononish deposit has attracted some research interest and many aspects of ore genesis have been clarified [26,27]. In addition to Cononish, bedrock occurrences of gold-bearing quartz veins have been identified at localities near Loch Tay (Calliachar-Urlar and Tombuie Figure 1B; [28,29,30,31]). In 2020, Green Glen Minerals Ltd. also discovered a new bedrock occurrence of Au-Ag-Pb-Zn quartz veins at Lead Trial (Figure 1B) [32]. The Loch Tay area where these gold occurrences have been identified is the focus of our study because the mutual genetic relationships of gold localities in the Loch Tay area, their classification in the context of modern deposit models and their relationship to the tectonomagmatic history of central Scotland remain unclear.
The study area comprises large tracts of hilly upland moor incised by drainage systems that ultimately discharge in the Firth of Tay at Perth, either via Strathearn in the south, Glen Almond and Glen Quaich in the center, or Strath Tay in the north (Figure 1B). Exposure is generally poor and often confined to the fluvial incisions along the valley floor. The valley sides normally exhibit till deposits and moraines resulting from glaciation, and much of the sediment in the present channels comprises reworked glacial sediment. Consequently, in general, the spatial correlation of alluvial gold with the in-situ source is difficult to establish because of the probable involvement of both glacial and fluvial processes. Glaciers were confined to valleys in the last stages of glaciation [34], and therefore the current fluvial sediment load (and by inference gold particles) comprises material derived from within the current drainage basins. Based on the authors’ field work, alluvial gold was found to be present in all of the main drainage systems, i.e., the Tay, Quaich, Almond and Earn, and therefore it is almost certain that in situ gold mineralization is widespread.
A summary of the geological history of central Scotland and the known aspects of the gold mineralization are provided in the subsequent section. However, it is important to highlight that the deposit styles of the gold occurrences at Loch Tay are currently unknown. The geological complexity of the area means several different gold deposit types are possible: igneous rocks provide potential for porphyry and associated epithermal mineralization, whilst the metasedimentary and metaigneous packages are globally common host rocks for orogenic gold deposits. In this contribution we use gold compositional studies to demonstrate that not only do different deposit types occur, but they can be identified in specific drainage systems. Resolving the deposit type(s) present in an area is not a trivial academic exercise as differentiation of the deposit type(s) is important both for guiding exploration approaches and prospect development [35]. As some of our samples were collected upstream from the known vein occurrences, our work also demonstrates that new, still unknown potential targets exist within the study area.
1.3. Geological Background
The study area lies mostly within the Grampian Terrane of Scotland (Figure 1). The Grampian Terrane consists of chiefly Neoproterozoic to Cambrian sedimentary and igneous rocks deposited onto the Laurentian passive margin, e.g., [36]. Most of the study area comprises the Southern Highland Group of the Dalradian Supergroup, consisting predominantly of metapelites and metapsammites with some layers of mafic and felsic igneous rocks (Figure 1B; [37,38]). The Grampian Terrane was pervasively deformed during the Ordovician-Silurian Caledonian orogeny. The first Caledonian collisional event, often referred to as the Grampian phase in Scotland and Ireland, was characterized by a ~NW-SE relative convergence of Laurentia vs. Baltica with crustal thickening through thrust and nappe tectonics [39,40,41]. This thickening phase was relatively short-lived, culminating at c. 475–465 Ma with granitoid magmatism and regional prograde metamorphism (e.g., [42,43,44]). The Grampian phase was followed by a period of uplift and unroofing until c. 430 Ma [45,46,47,48] and various authors have suggested that cooling through 300 °C occurred between 460 and 430 Ma [46,48].
The second phase of the Caledonian orogeny, the Scandian phase, resulted in the final closure of the Iapetus Ocean and the docking of Avalonia against Laurentia between c. 435 and 410 Ma, although its duration is somewhat debated, with estimates ranging from 10 to 35 Ma (e.g., [40,49,50]). Within central Scotland, the main effects of the Scandian event were transpressional strike-slip movements along major transcurrent orogen-parallel faults and their subsidiary fault systems, resulting from an approximately N-S orientated maximum principal stress [41]. These structures, which include the Loch Tay Fault in Figure 1B, are widely recognized throughout the Grampian Terrane; many of the largest faults are probably long-lived structures but at least some fault activity has been dated at 416–395 Ma [39]. A second phase of significant igneous activity took place around the same time, from c. 425 Ma onwards, interpreted to be mostly related to slab roll-back and subsequent break-off [43,51,52]. This magmatism was dominantly felsic, but most exhibit some degree of bimodalism, particularly the c. 404 Ma Comrie pluton which has a voluminous, early dioritic stage, followed by a slightly younger granitic stage [26,43,53]. It has been proposed that the emplacement of the Late Silurian–Early Devonian granitoids occurred in a transtensional setting, with a WSW-ENE directed regional extension [26]. Certainly there was a transition from transpression to transtension near this time: from c. 410 Ma onwards, widespread deposition of sedimentary rocks and both extrusive and intrusive magmatism, mostly mafic, occurred in association with pull-apart basin formation across central Scotland (Figure 1A) [54,55,56]. The final convergent event in the region is related to the ~N-S directed Acadian event around 400–390 Ma [40]. The effect of this event was mostly felt in the southern UK and the extent and style of its expression in Scotland is still unclear, but various fault reactivation features, interpreted to be transpressional, of fault zones in the Grampian Terrane show mid-Devonian radiometric dates [56]. The dominant tectonic style from Devonian to Permian was, however, that of extension/transtension.
Various localities with gold-bearing quartz veins have been identified in the Grampian Terrane in Scotland: in addition to Cononish, Calliachar-Urlar, Tombuie, and Lead Trial mentioned earlier, the epithermal hot-spring Rhynie gold occurrence is known NW of Aberdeen (Figure 1A) [57]. Which phase of the Caledonian-Acadian tectonism resulted in the formation of the veining and the gold mineralization in the Grampian Terrane is partly an open question as few of the vein systems have been directly dated, but at least some of the mineralization seems to be Early Devonian. The fault gouge and hydrothermal K-feldspar associated with the gold-bearing veins of the Cononish gold mine was dated at c. 410 Ma, [26] with probable indications of partial setting of the isotope system around 340 Ma (K-Ar and 40Ar/39Ar ages). The paragenesis, particularly with respect to the relationship between the dated material and gold, was not described, but the 410 Ma age was interpreted to represent the gold mineralization age, and the later age was suggested to reflect a Carboniferous dextral reactivation of the fault zone (associated with galena precipitation, without gold). The 410 Ma age coincides with the post-Scandian transition from transpression to transtension [58]. The only other age that exists for gold-bearing rocks in Scotland is the 407.1 ± 2.2 Ma age for the Rhynie cherts, obtained by sampling hydrothermal K-feldspar from two veins that represent feeder conduits and a hydrothermally altered andesite wall rock [58]. A detailed paragenetic interpretation is not provided, but SEM imaging shows a gold particle spatially associated with feldspars and quartz in hydrothermally altered and fractured andesite. The gold mineralization at Rhynie has also been linked with the extensional tectonics and pull-apart volcanosedimentary basin formation [58]. For both Cononish and Rhynie, studies to date suggest dominantly magmatic systems but with complex, evolving fluid sources. Rhynie has been categorized as an epithermal deposit, reporting both meteoric water and magmatic fluid signatures in the hydrothermal alteration minerals associated with the mineralization [57]. At Cononish, the early fluids responsible for the gold mineralization were magmatic but evolved to involve a strong isotopic signature from the surrounding Dalradian metasediments [27].
In the Loch Tay area, little information exists on the known vein systems. Some “deposit”-scale work has been completed on basic vein structures, mineralogy and preliminary parageneses of the veins at Calliachar-Urlar, Tombuie and Coire Buidhe [21,29,31]. No published data exists for the Lead Trial veins, but they are similarly orientated as the Tombuie, Calliachar-Urlar and Coire Buidhe veins, i.e., subvertical with fairly consistent NNW-SSE strikes (Figure 1B). Likewise, very little compositional information describing gold from the study area has been published. Studies of a gold particles observed in ore, liberated from crushed vein samples and collected from adjacent alluvial localities at Calliachar Burn all showed similar Ag and Hg profiles [28,29], with relatively high maxima of 30 wt% and 40 wt% respectively. The inclusion suite was reported in terms of metal element components (Fe: 55%, (Pb + Zn): 20%, Cu: 15% and Co: 10%) and non-metal element components (S: 65%, As: 35%) [28]. For Tombuie, high Ag and Hg values in Au-Ag alloy were reported for seven gold particles in a mineralized in-situ sample [31]. Alluvial gold from Glen Lednock yielded a distinctive inclusion signature containing molybdenite, chalcocite and bornite, not observed in the other localities [59]. The authors interpreted this mineralogical association as indicative of a genetic relationship between the gold and the Comrie pluton (Figure 1B).
Even this limited amount of gold compositional data from Loch Tay, derived from small sample suites, provides an indication of variable gold deposit types and the potential for further gold compositional studies to illuminate regional metallogeny. The results to date demonstrate the genetic relationship between gold in the Calliachar vein system and the adjacent placer, and hint at a genetic relationship with the Tombuie veins on account of the distinctive Ag and Hg contents of the Au alloy. By contrast, gold from Glen Lednock shows clear geochemical markers suggestive of mineralization formed in a magmatic hydrothermal system. We now expand from these previous gold characterization studies to investigate in more detail the range of gold compositional and inclusion data and their wider implications, with samples from different drainages and from upstream of the known vein occurrences at Calliachar-Urlar.
2. Materials and Methods
2.1. Collection of Gold Particles
The alluvial gold particles were collected using the field techniques previously described [59]. Sampling campaigns focused on obtaining sufficient particles to underpin subsequent interpretations of the gold signatures. The sample from Glen Lednock comprises material previously reported [59] augmented by gold particles collected during the present study. Characterization of the inclusion suites have proved to be very effective in establishing the type of gold mineralization [10]; however, the abundance of inclusions varies substantially between sample populations [60], and was unknown at the time of sampling. The average abundance of inclusions in polished sections is 10%, whilst at least 15 inclusion-bearing particles are considered necessary to generate a robust characterization [60]. Consequently field sampling aimed to collect at least 150 gold particles in a single sample population, but the relatively high abundance of gold at some localities facilitated collection of substantially larger numbers.
2.2. Analytical Approach
Compositional characterization of the sample suites was carried out at the University of Leeds according to the methodology previously described [56]. Particles were mounted according to size on double sided tape, set in resin and polished to optical flatness. All particles within the resin blocks were visually inspected to record the presence of inclusions, using scanning electron microscope (SEM) imaging by a FEI Quanta 650 FEG-ESEM. Inclusion species were identified using an energy dispersive X-ray spectroscopy system (EDS) of the SEM. The Au, Ag, Cu and Hg contents of gold alloys were determined with electron probe microanalyzer (EPMA) JEOL 8230 Superprobe, using 20 kV accelerating voltage, 50 nA beam current, and a combined on- and off-peak count time of 1 min per element. Limits of detection (LOD) for Cu and Pd, were typically around 200 ppm and 900 ppm respectively, whilst avoidance of spectral interference between the HgMα and AuMβ X-rays necessitated using the Hg Mβ x-ray line and the associated higher detection limit of 3000 ppm.
The Ag profile of a sample population was based on a single analysis per sample. In cases where alloy heterogeneity was observed, spatial relationships between the different alloys were used to deduce the earliest alloy stage, and this value was adopted for profiling purposes.
2.3. Data Treatment
Approaches to depicting gold compositional data have been discussed previously [4,10]. Cumulative percentile vs. increasing metal concentration in alloy plots permit direct comparison of sample populations that comprise different numbers of particles and the covariance of metals within Au-Ag alloy may be depicted using binary plots to identify distinct compositional fields. For both plot types, logarithmic scales may be used where appropriate. Data describing minor alloying elements are frequently discussed in terms of the proportions of particles that contain the element to concentrations of >LOD and the proportion in which the element is quantifiable (3 × LOD = limit of quantitation LOQ).
Graphical depiction of inclusion suites is challenging because of the wide range of mineral species that have been observed. Two approaches have been used to depict inclusion suites, one based on inclusion mineralogy and the other on inclusion mineral chemistry. The use of radar diagrams based on mineral chemistry [14] are particularly useful where numerous inclusion species contain multiple cations or anions, as is commonly observed on gold formed in magmatic–hydrothermal systems [14]. The method involves attributing a ‘metal’ and ‘non-metal’ score to each inclusion species observed within a gold particle, with the total metal and non- metal scores each being 1. For example pyrite is scored Fe = 1 and S = 1, and chalcopyrite Fe = 0.5, Cu = 0.5, S = 1. The aggregate metal and non- metal scores for each element are expressed as proportions and plotted on the radar diagrams. This chemical approach to inclusion suite characterization can identify elemental components of the ore fluid even if they are represented in several mineral species. In other cases, specific mineral species may be a useful diagnostic tool and mineralogical data are best represented by spider plots, where tailored arrangement of mineral species on the x-axis highlights differences between inclusion suites in gold from different localities. The vertical axis depicts the proportion of inclusion-bearing particles within the population that contain a specific mineral inclusion. Spider diagrams were used in the current study to aid interpretation of inclusion assemblages where distinctive inclusions were present, and radar diagrams are presented to permit comparisons with previous work that examined the signatures of different deposit types globally.
2.4. Interpretation of Compositional Signatures
Interpretation of gold compositions is based on a multivariate treatment of the information available. The type of information may vary between sample populations, e.g., minor elements may be detectable or not, and inclusion suites may be more or less representative of the actual population depending on sample size. When available, inclusion suites provide clear evidence of genetic relationships between sample populations and strong indications of the deposit type. Ranges of Ag compositions are useful to establish ‘same or different’ criteria and may find application in speculating on zonal relationships between mineralization within the same hydrothermal system, as a consequence of the significant control of the temperature of the depositional environment over the Au-Ag ratio within the alloy. The importance of minor alloying metals (Cu, Hg and Pd) varies according to the degree to which they are present and their concentration.
3. Results
3.1. Gold Particle Size and Morphology
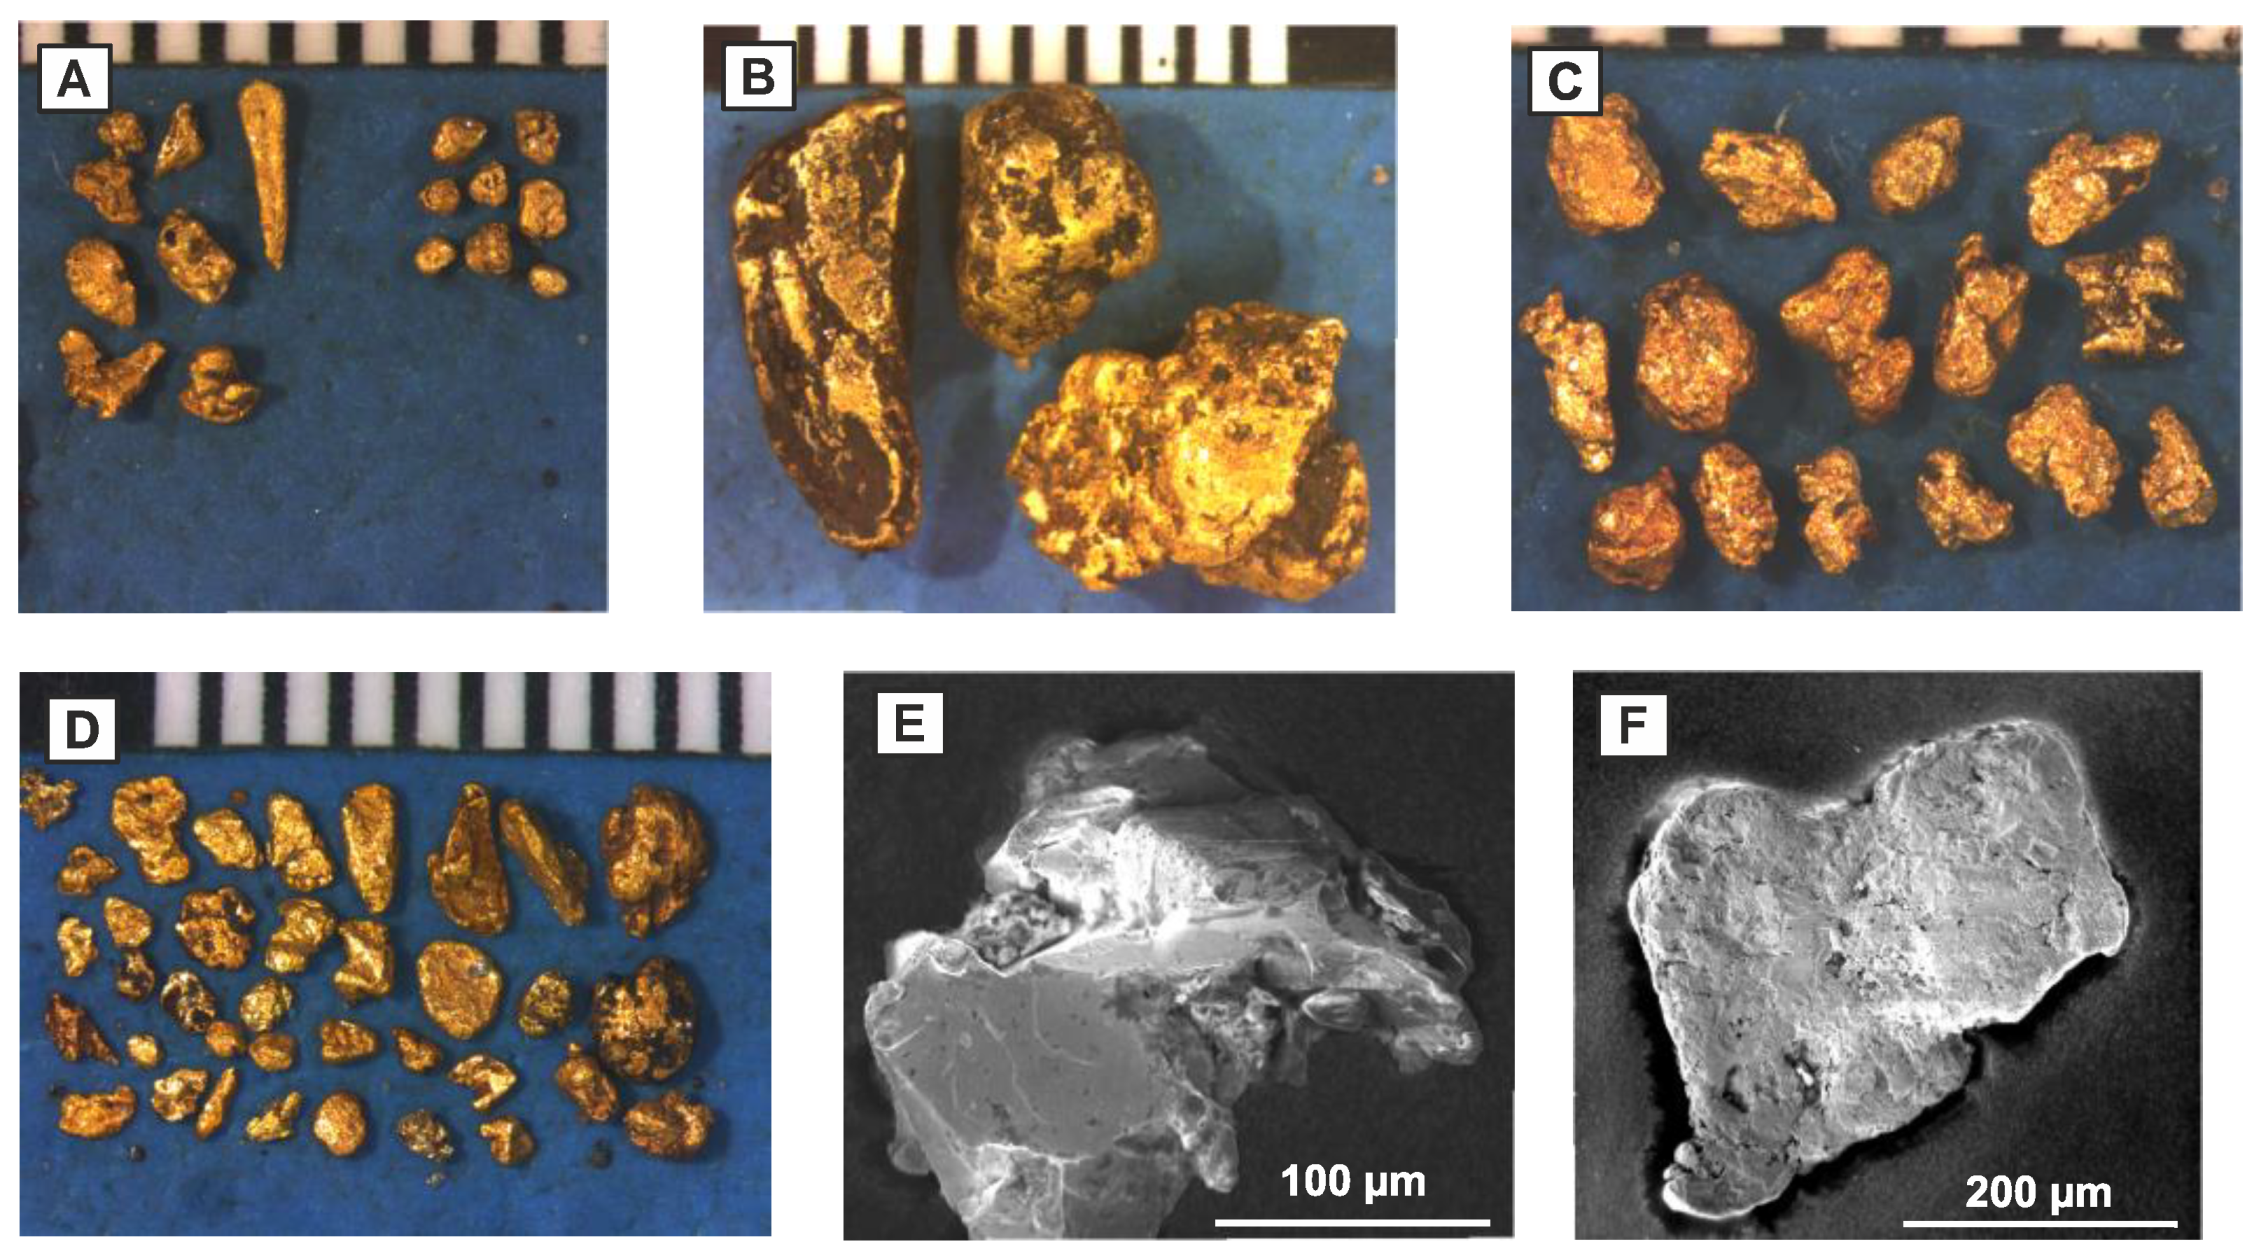
The size range of gold particles from the various sampling localities is indicated in Table 1 with examples of panned particles shown in Figure 2. The data can identify large differences between populations, but they are also influenced by the choice of the specific sampling locality as sedimentary environment has significant control over dense particle accumulation both in terms of the number and size of gold particles [2]. Nevertheless, with large sample populations such as these, the datasets clearly show that very coarse gold (up to >10 mm) is present in Calliachar Burn and the River Almond, whereas gold in Glen Quaich, Glen Lednock, and Keltie Burn was recorded to a maximum of 2–3 mm. Gold particles from Sma Glen are even smaller, with most being <1 mm.
Gold particles from the River Almond and Calliachar Burn are often equant and many have rough textures (Figure 2A–C). By contrast, the gold collected in Glen Quaich exhibited a more flaky, flat morphology (Figure 2D). A range of particle morphologies was evident in gold from Glen Lednock and Keltie Burn. The populations of small gold particles from Sma Glen were predominantly equant and rough/hackly with some showing perfectly flat, reflective faces, presumably following detachment from other vein minerals (e.g., Figure 2E). Some very flaky and waterworn gold was also present (e.g., Figure 2F) but visual inspection showed these to comprise less than 20% of the sample population.
3.2. Gold Alloy Composition
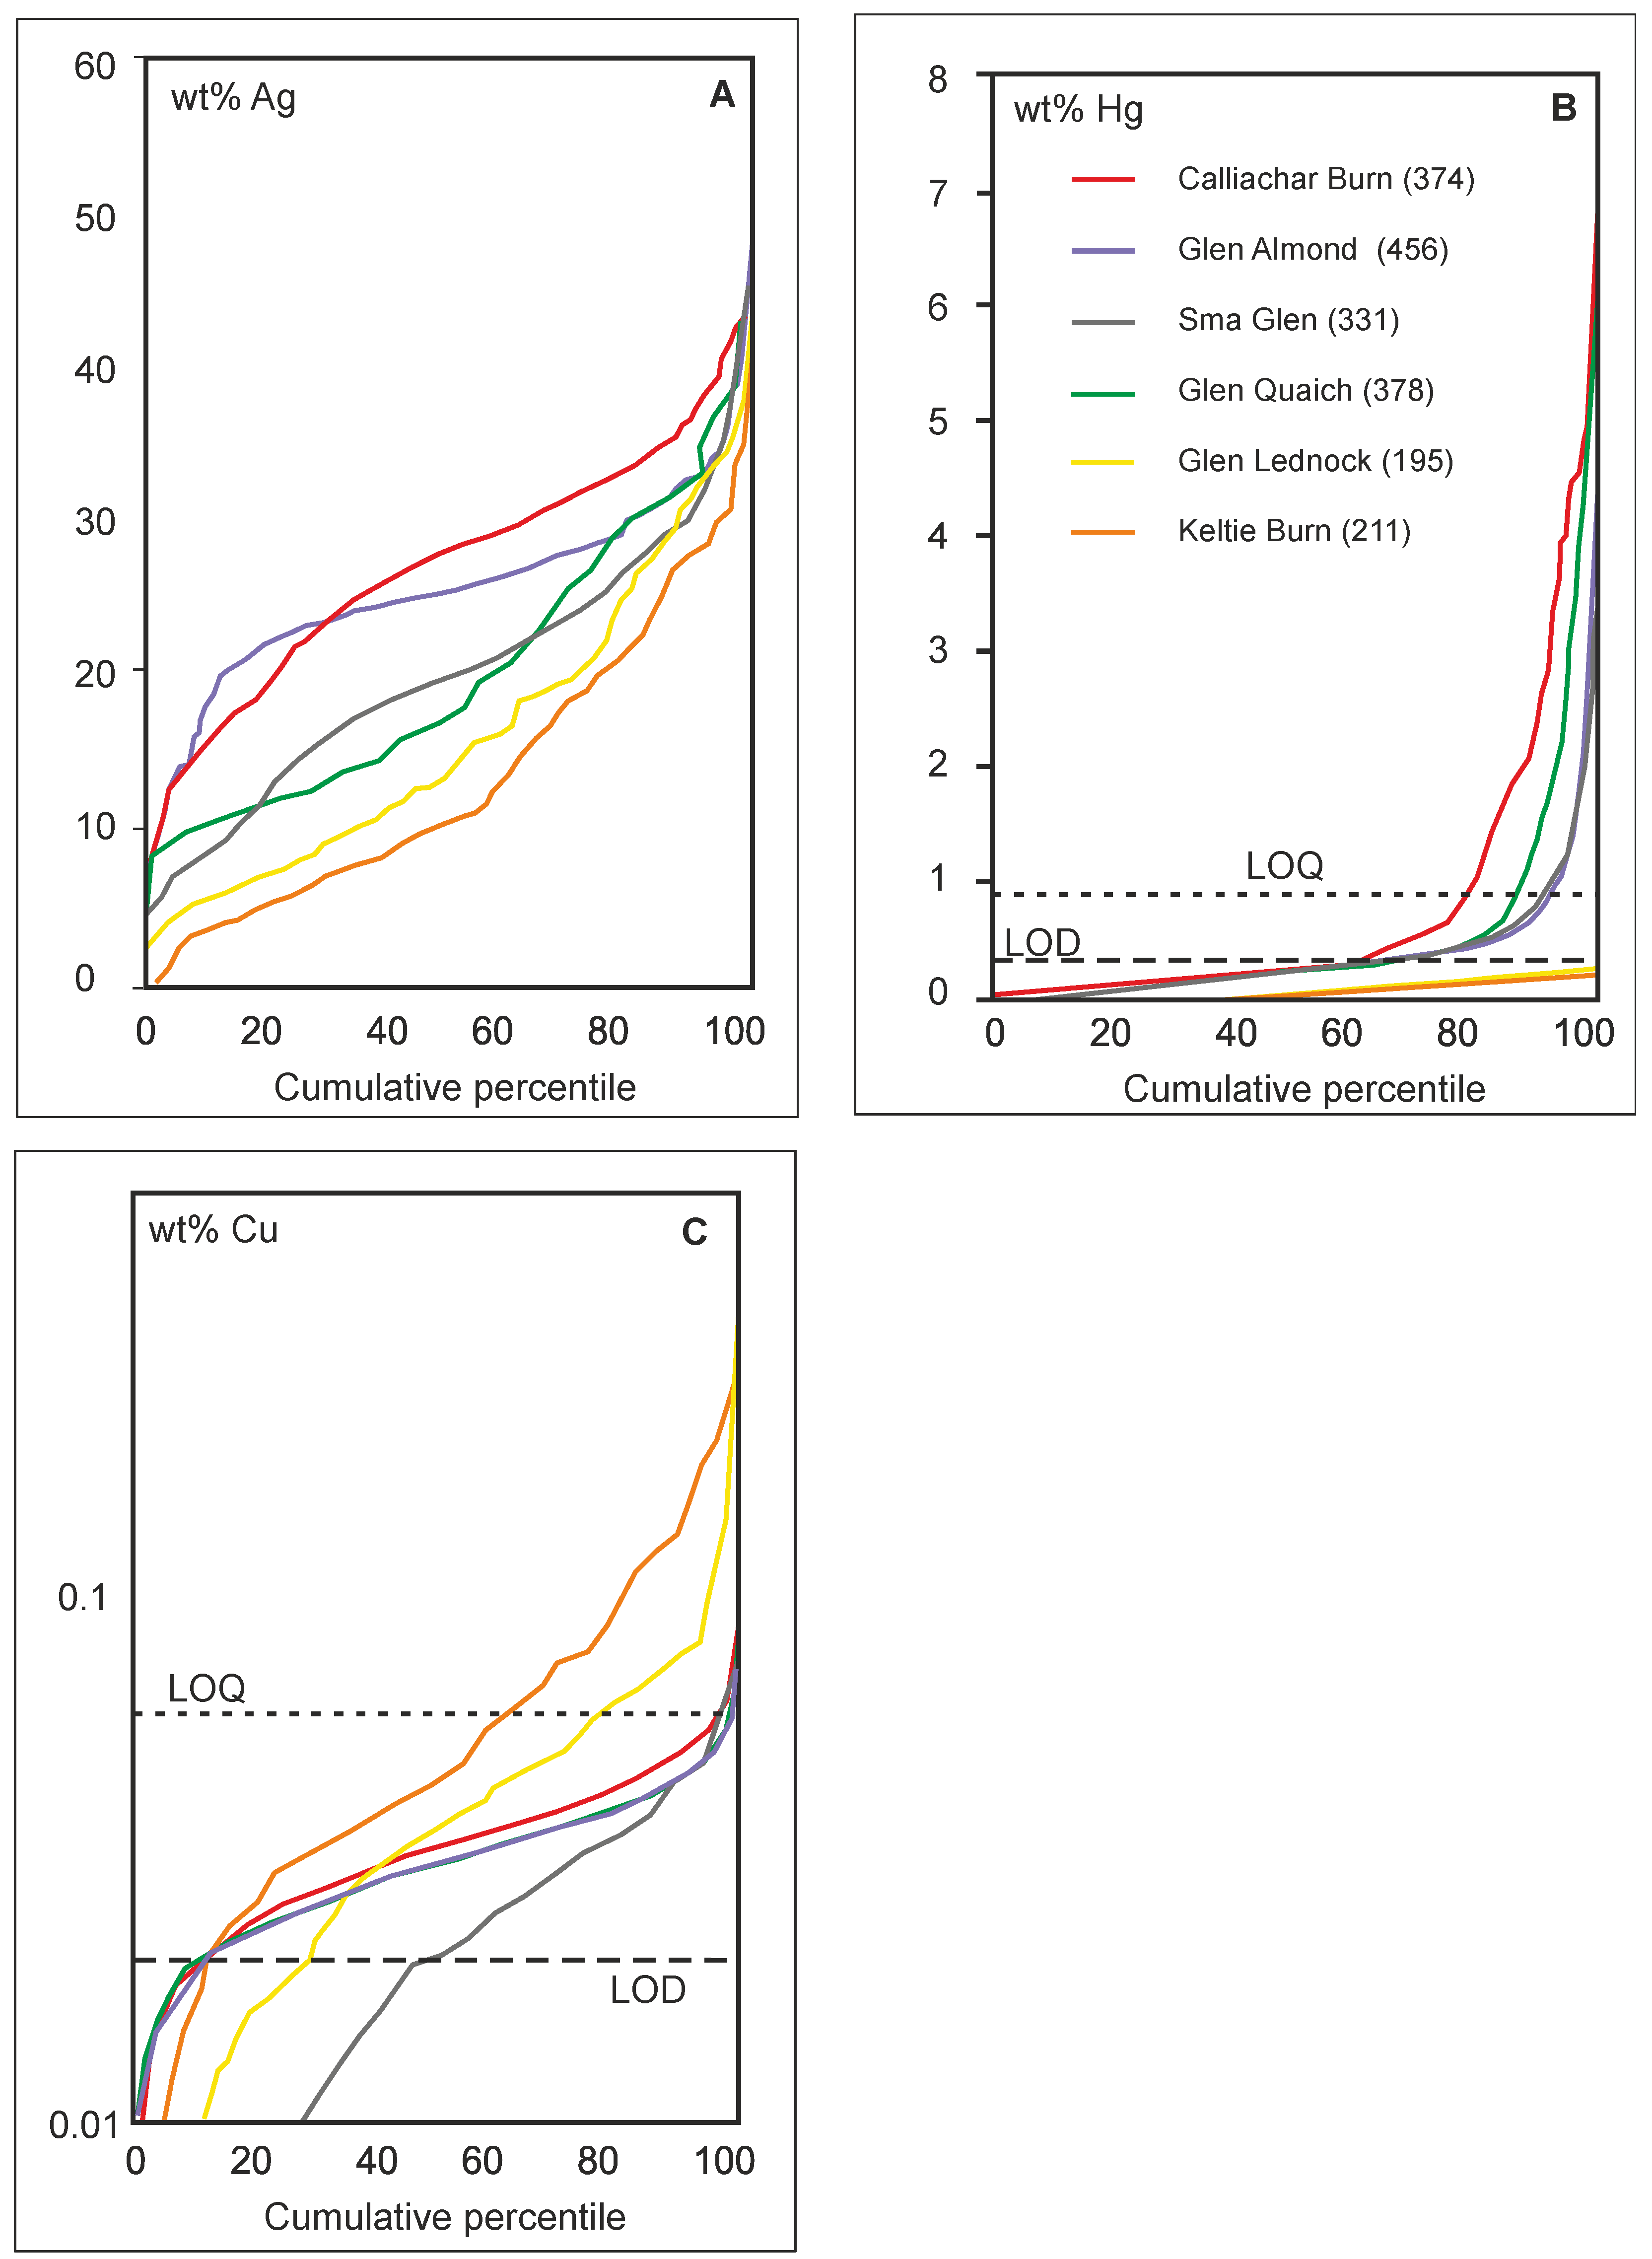
The Ag profiles of the sample populations from the study are depicted in Figure 3A. All sample populations exhibit a similar range of Ag, typically between 0 and 40 wt%, however the profile shapes differ substantially, with over 75% of the particles in sample populations from Calliachar Burn and the River Almond containing >20 wt% Ag, whereas Ag contents of >20 wt% are observed in less than 30% of the particles from Keltie Burn and Glen Lednock sample populations. The resulting profile shapes of these two groups reflect the dominance of high-Ag alloy (convex curves) and low-Ag alloy (concave curves), respectively. Gold samples from Glen Quaich and Sma Glen exhibit a Ag profile between these end members.
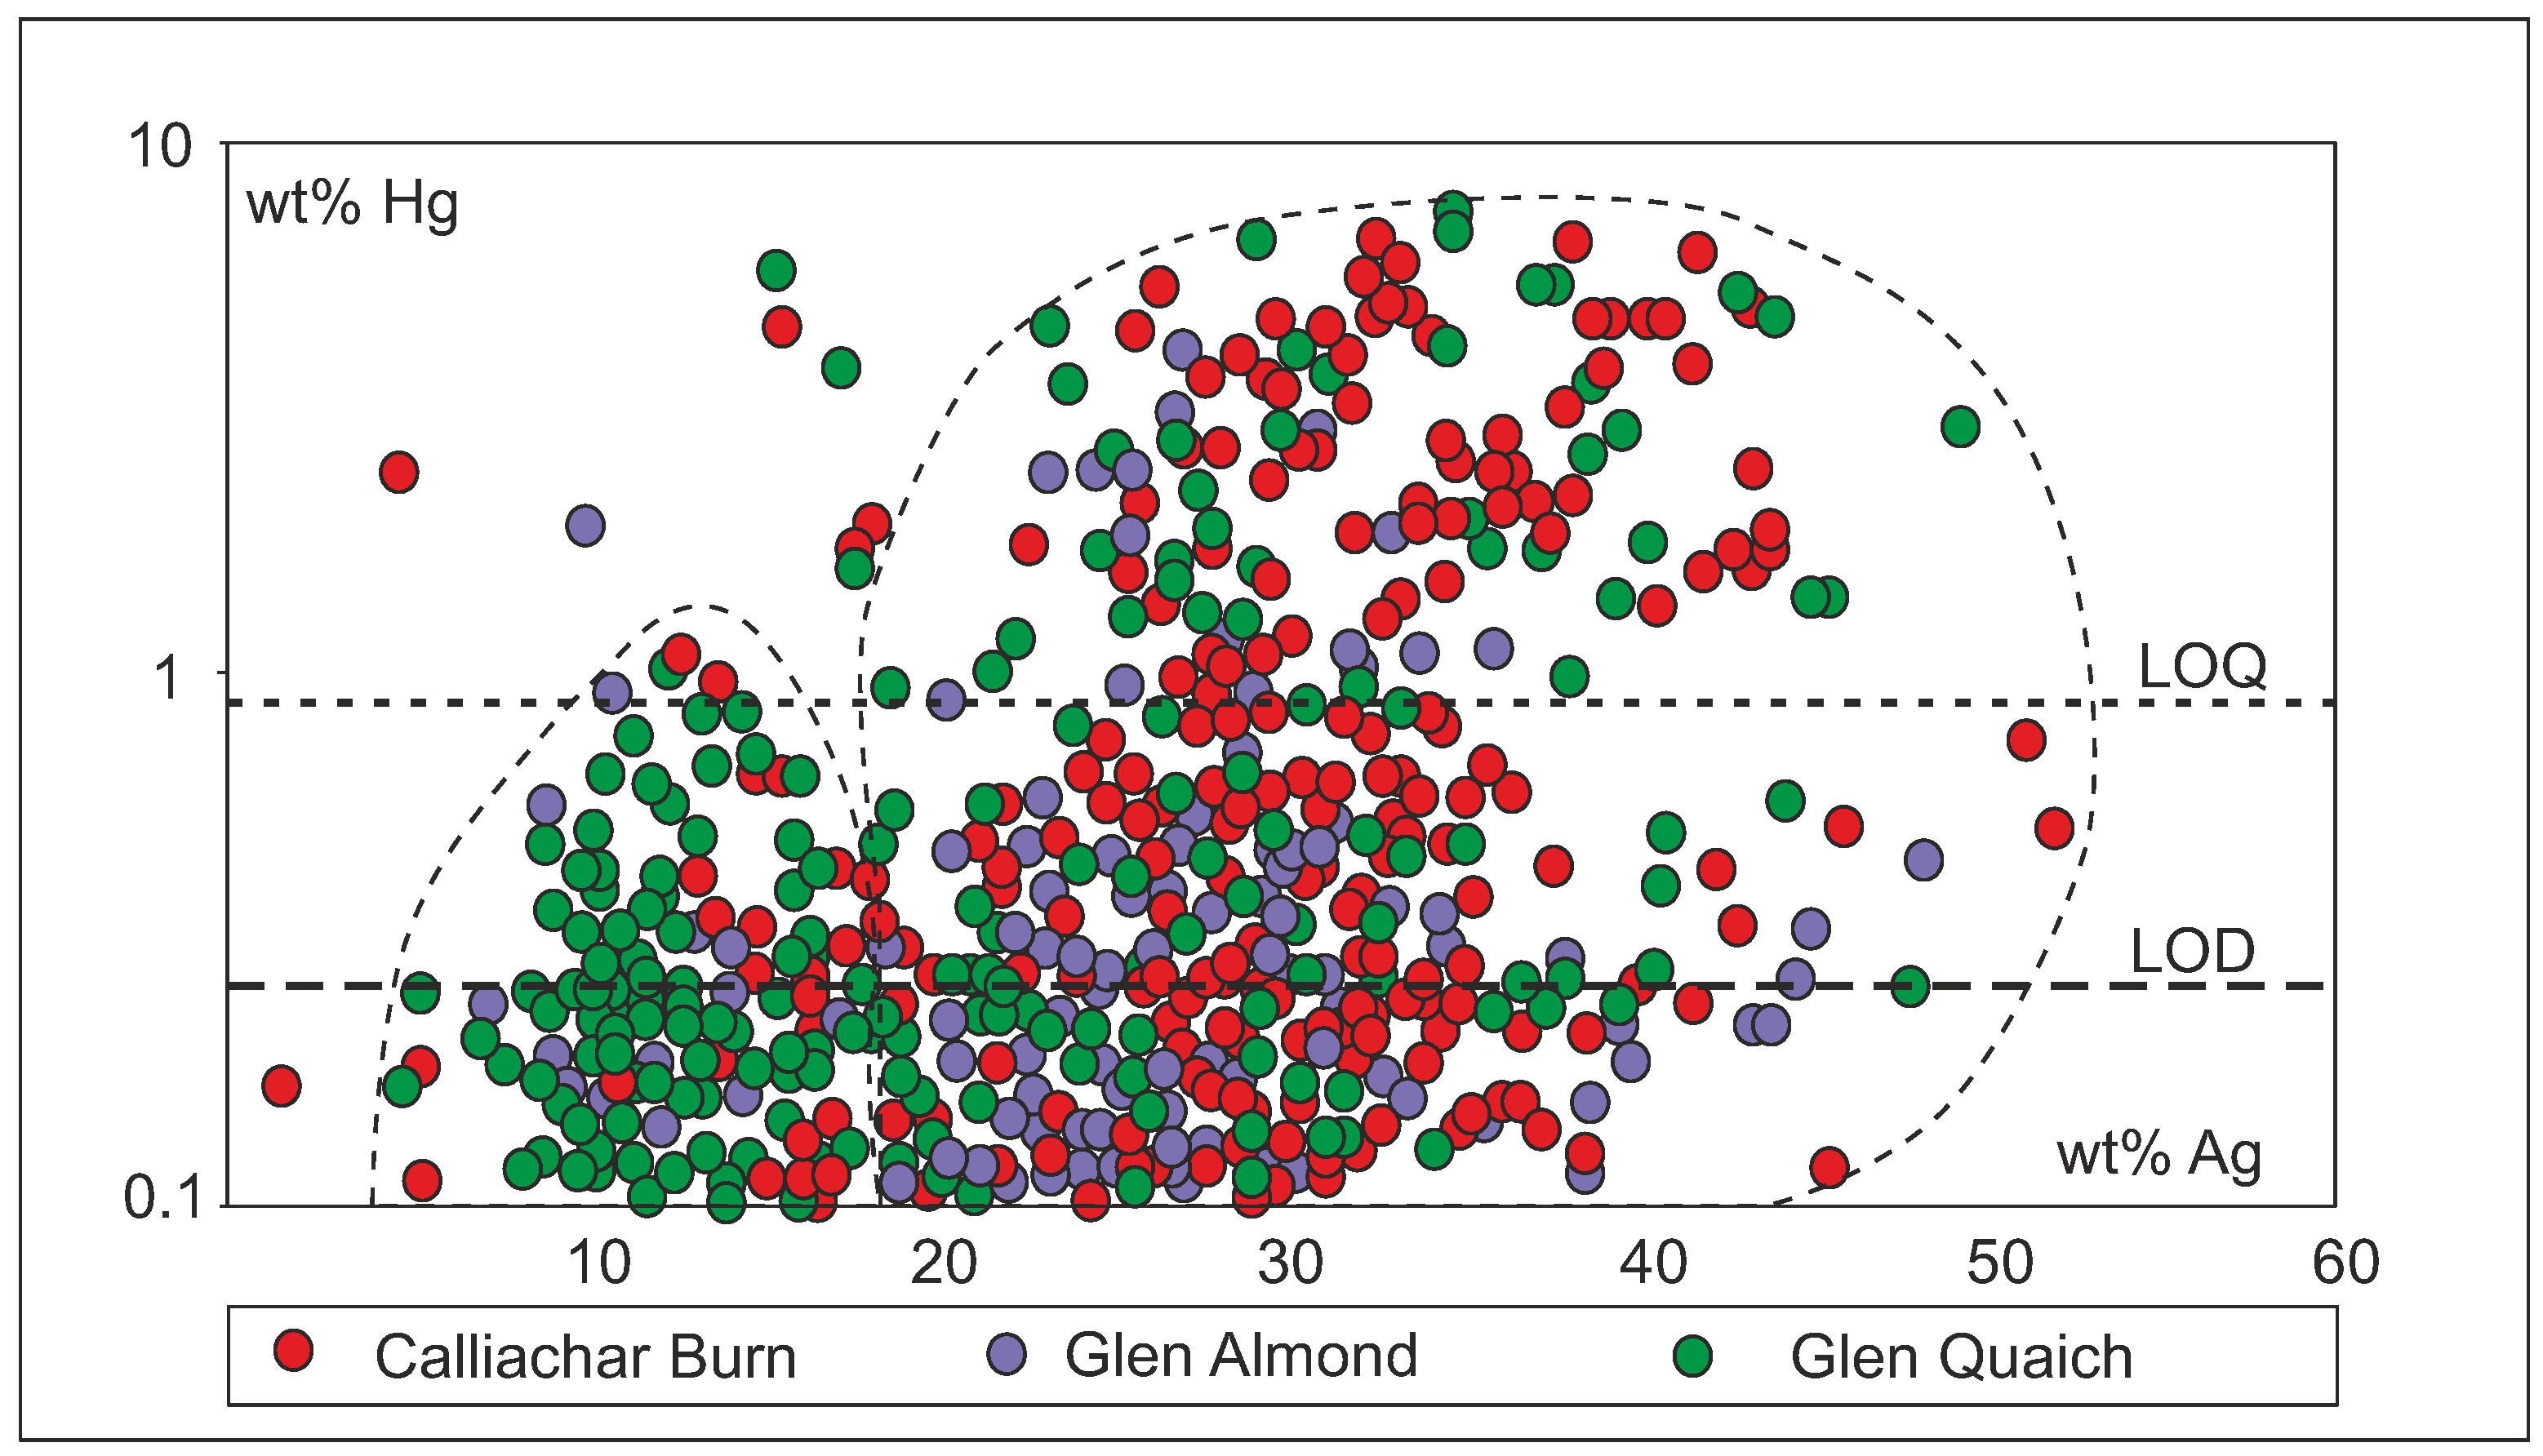
Hg concentrations in Au-Ag alloy are presented in Figure 3B. Sample populations of gold from Calliachar Burn Glen Quaich and Glen Almond show quantifiable Hg in 20, 13 and 8% of particles, respectively. Around 8% of particles from Sma Glen contain detectable Hg, but Hg values in gold from Keltie Burn and Glen Lednock are below LOD.
The cumulative plot for Cu content in the sample alloys is shown in Figure 3C. Copper was detectable in the majority of gold particles from all localities except Sma Glen where only 50% of particles show Cu values over the detection limit of 0.02 wt%. Gold from Keltie Burn and Glen Lednock exhibited the highest proportion of particles containing quantifiable Cu (40% and 25% of the sample, respectively). Only about 5% of the sample populations from Sma Glen, the River Almond, Glen Quaich, and Calliachar Burn contained quantifiable Cu.
The Ag-Hg binary plot for samples with Hg above LOD is presented in Figure 4. The data suggest two, probably overlapping, compositional fields according to Ag and Hg concentrations in the alloy (indicated in Figure 4 with dashed lines). Gold containing between 10 and 15 wt% Ag is far less likely to show high Hg values than gold containing over 15 wt% Ag. Gold from Glen Quaich dominates the low-Ag compositional field whereas all localities are represented in the high Ag-Hg set. The Ag profile for gold from Glen Quaich (Figure 3A) shows a slight break in the slope at around 15 wt% Ag, corresponding to the point of increased abundance of elevated Hg. Within the high Ag-Hg set there does not appear to be any covariance of Ag and Hg.
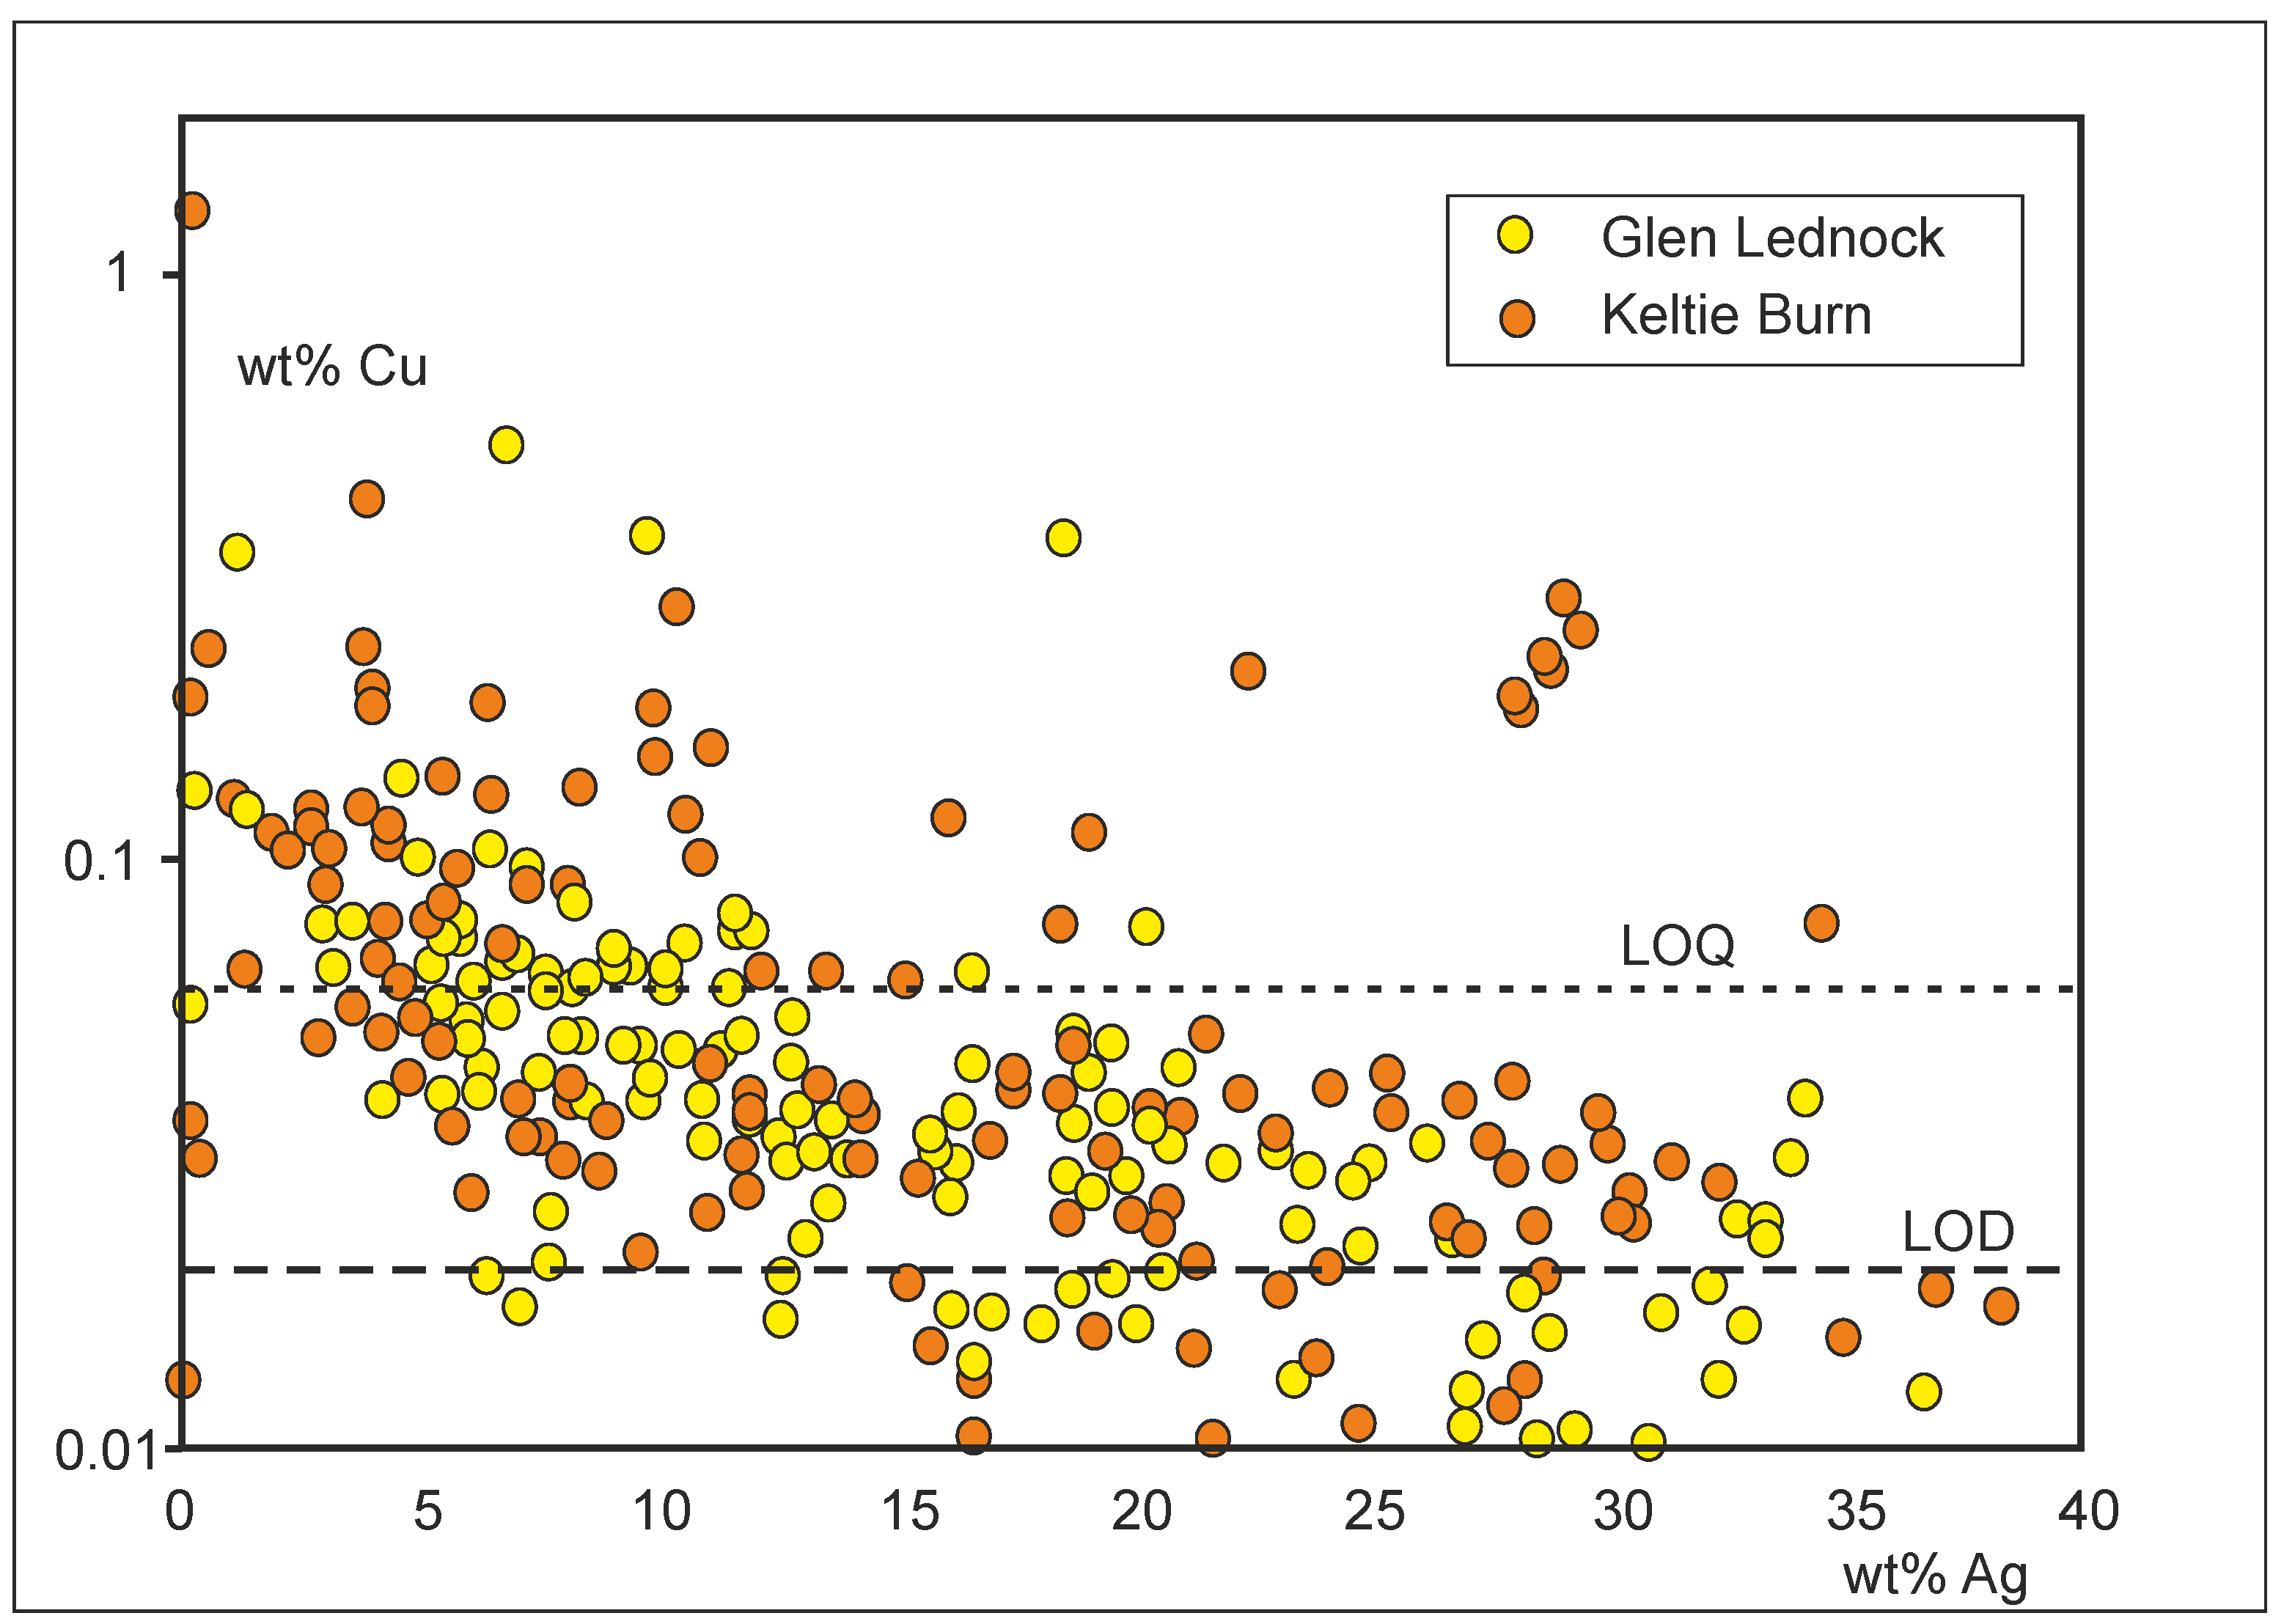
Figure 5 shows the covariance of Cu and Ag for the two sample populations where some gold particles contain Cu to >LOQ (Keltie Burn and Glen Lednock). The general inverse relationship between Cu and Ag appears to be a generic feature [60] and overall the two populations appear broadly equivalent.
The sample populations from Glen Lednock and Keltie Burn each contained two gold particles with values of Pd > 4 wt%. Palladium was undetectable in all other cases.
3.3. Inclusion Suites
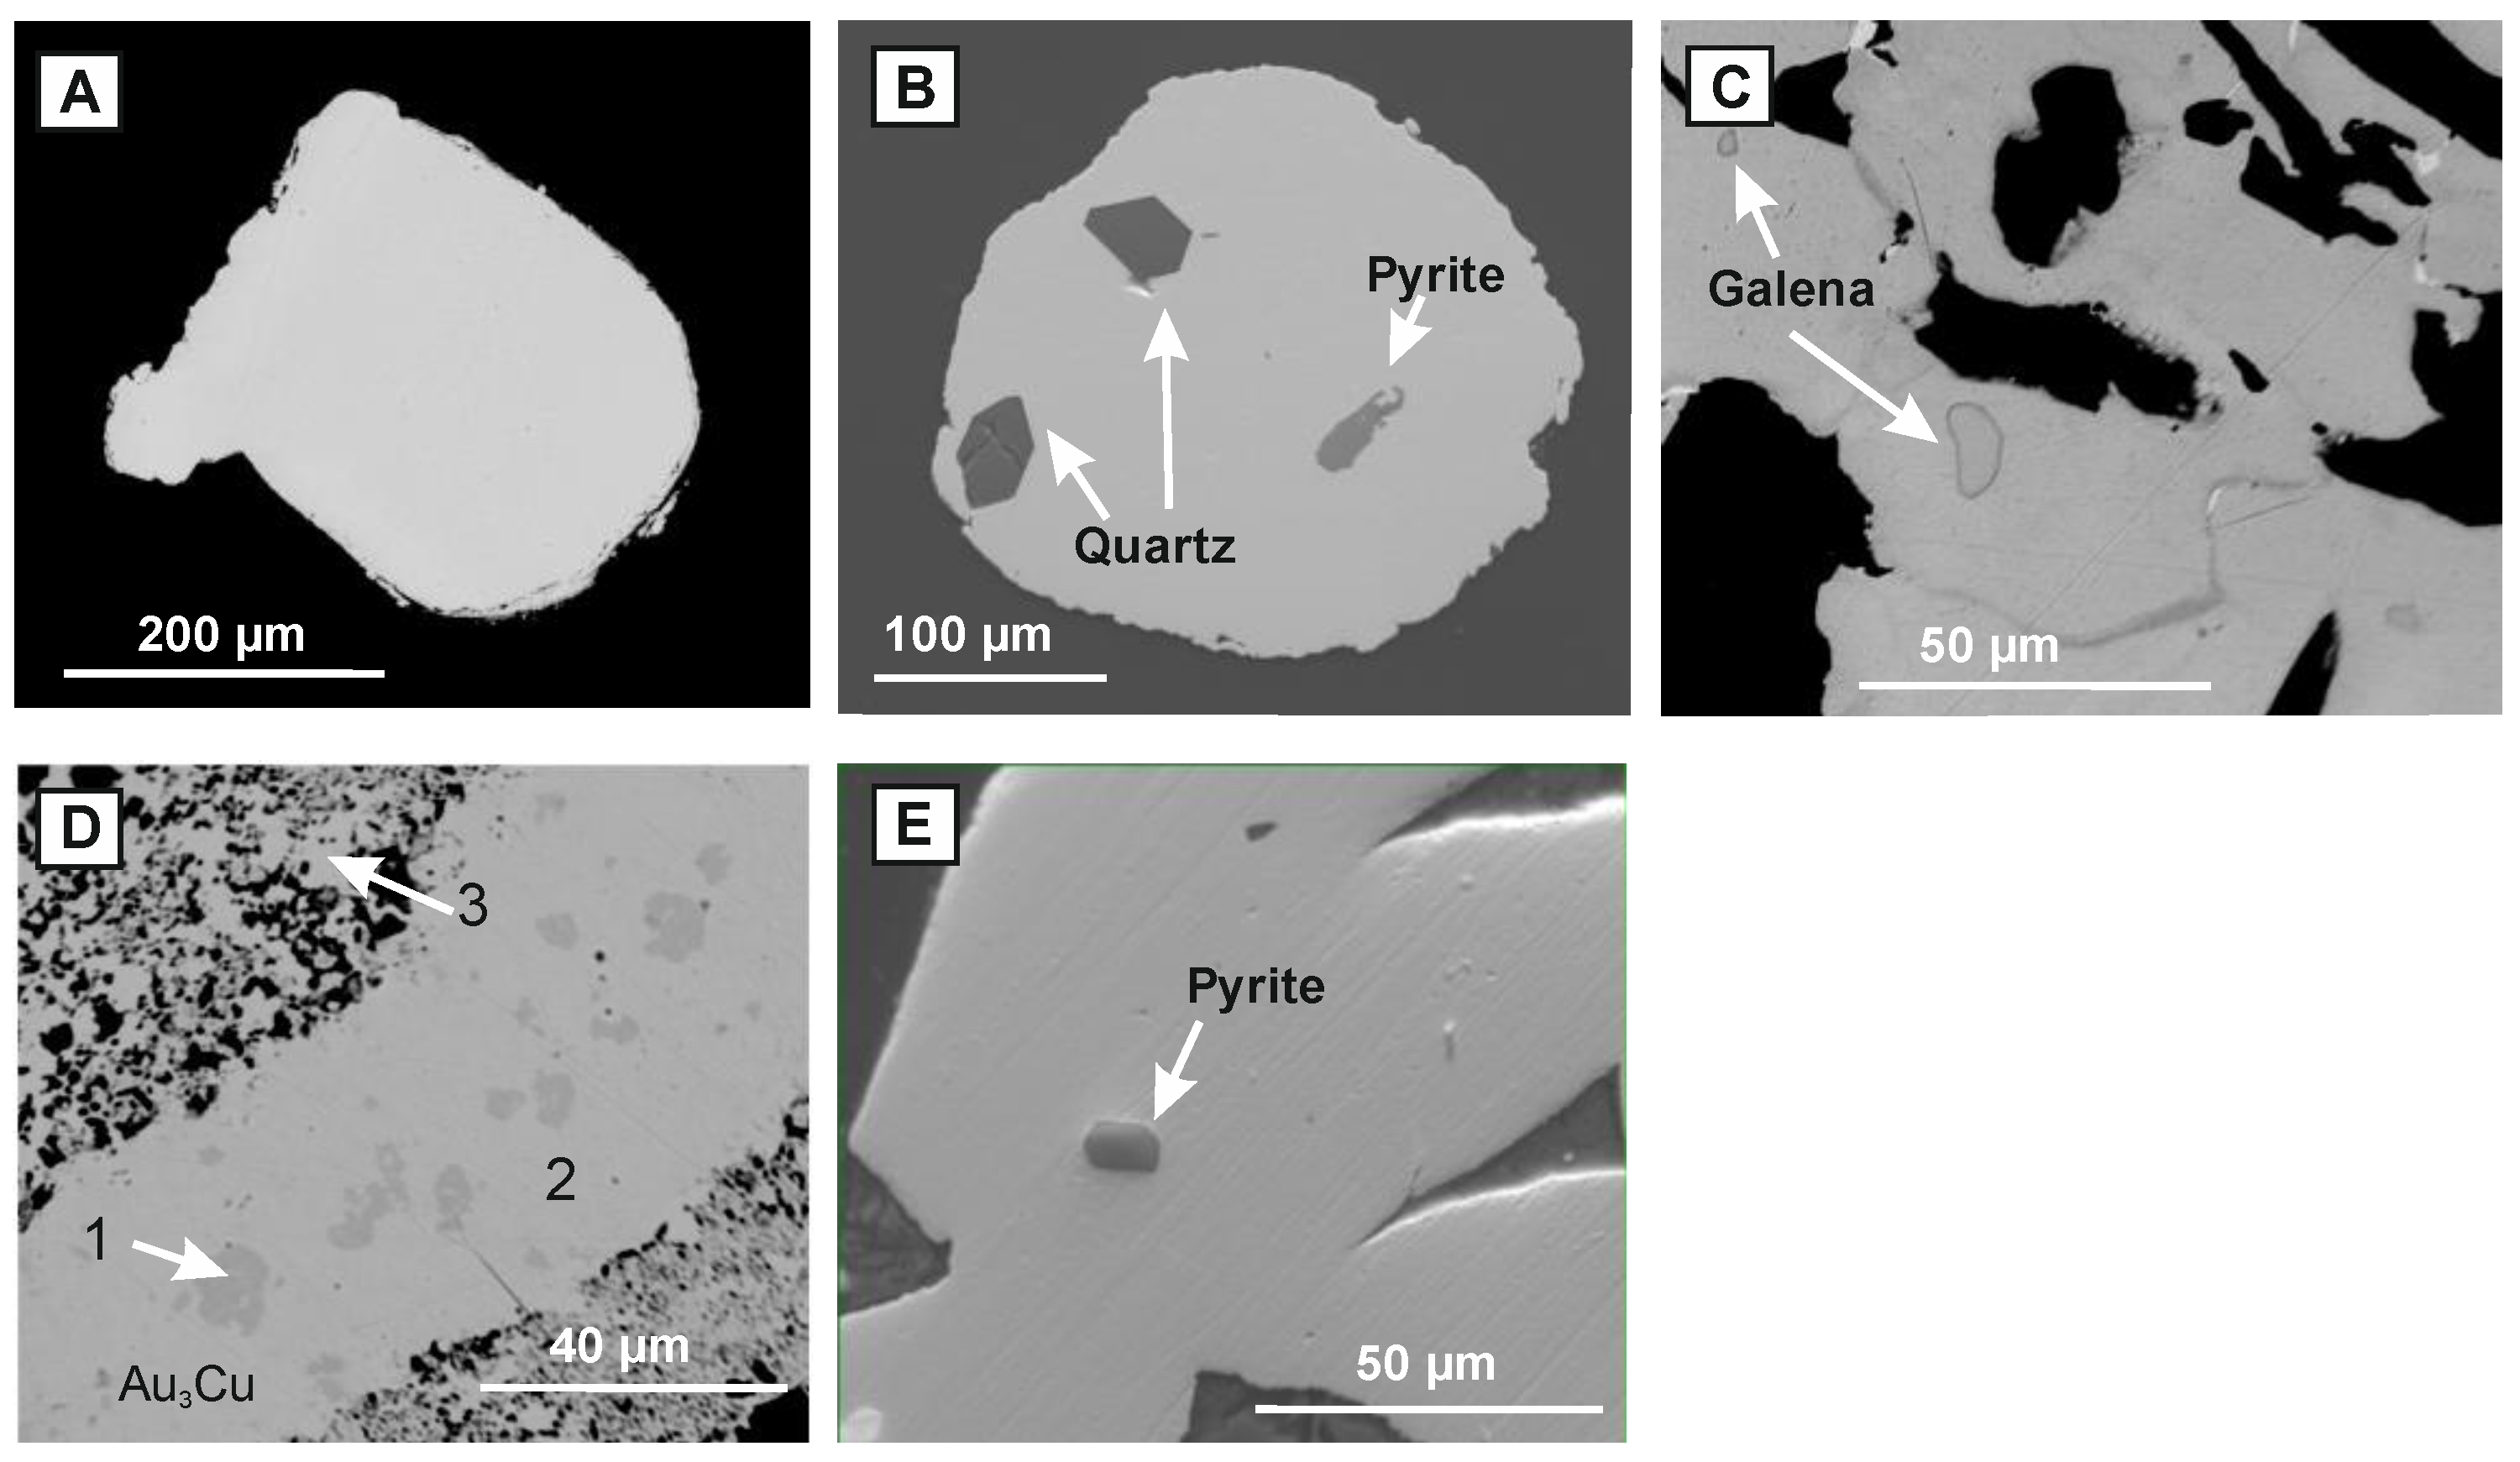
A representative set of SEM images of the analyzed gold grains is shown in Figure 6. The inclusion data were used to generate both spider diagrams to depict mineralogy (Figure 7) and radar plots to characterize inclusion suites according to mineral chemistry (Figure 8).
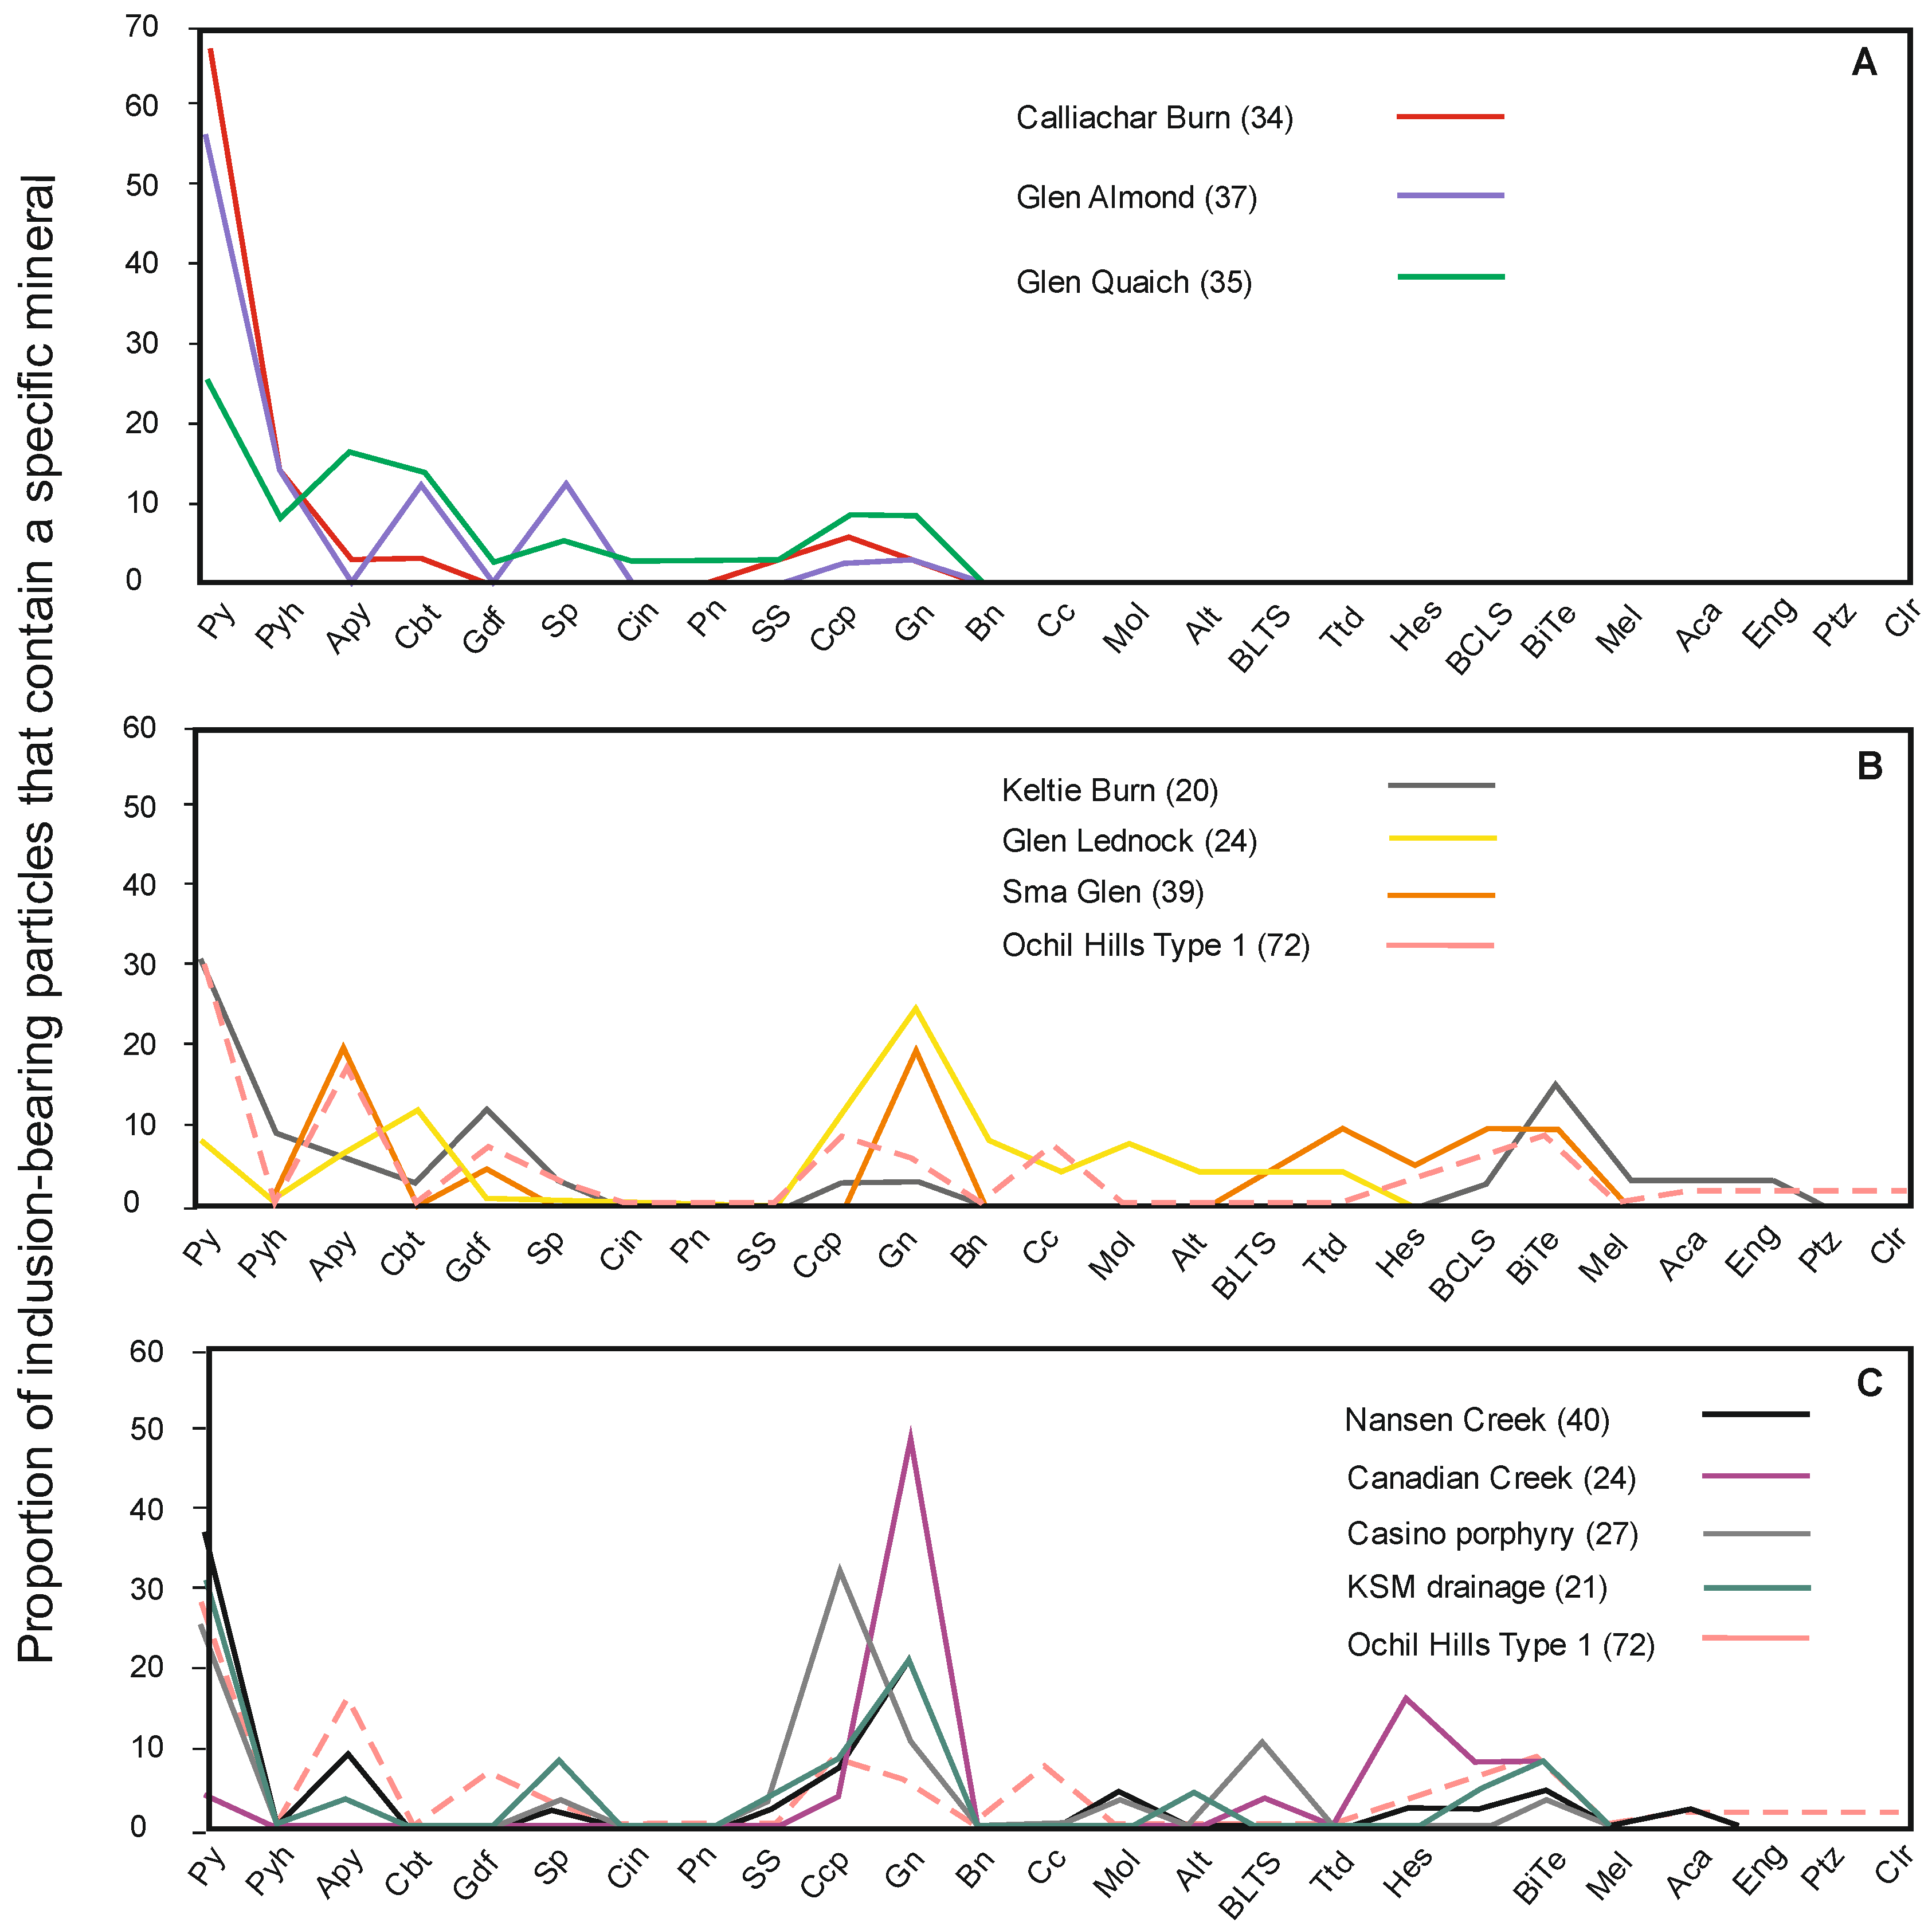
Sample populations from Calliachar Burn, the River Almond and Glen Quaich all exhibit inclusion suites of the same relatively limited number of mineral species, with the non- metal signature confined to sulphides and sulphoarsenides (Figure 7A and Figure 8A). We grouped the sample populations showing these inclusion characteristics to ‘Group 1’. Pyrite is the dominant sulphide within the inclusion suites in Group 1, with minor contributions from various sulphoarsenides and simple metal sulphides. The main differences between inclusion assemblages within Group 1 derive from the relative abundance of arsenopyrite inclusions in the gold from Glen Quaich and the apparent absence of sphalerite inclusions in the gold from Calliachar Burn. The radar plots depicting the inclusion assemblages (Figure 8A) also depict sulphide and sulphoarsenide minerals with occasional contributions from sulphosalts. In general, gold samples from the River Almond and Glen Quaich contain a greater proportion of sulphides other than pyrite than the gold from Calliachar Burn.
The inclusion suites of gold from samples from Sma Glen, Keltie Burn and Glen Lednock differ from those of group 1 in the more extensive range of minerals present and their similar mineralogical and chemical profiles (Figure 7B and Figure 8B). These general similarities permit classification into a single second Group. The inclusion suites in Group 2 samples may be immediately distinguished from those of Group 1 by the strong and consistent Te-signature (Figure 7B and Figure 8B). In addition, the presence of Bi-bearing minerals provides a discriminant, although the speciation varies according to locality. A distinctive bornite-chalcocite-molybdenite inclusion suite contributes to the inclusion suite from Glen Lednock, where the abundance of chalcopyrite is higher than any other locality. Analysis of these inclusion suites by the radar diagrams (Figure 8B) highlights the diversity of metallic element contributions, and the contribution from Bi and Ag in the cases of gold from Sma Glen and Keltie Burn.
Figure 7.
Spider plots showing inclusion suites. (A) Sample populations within Group 1 showing similar, restricted inclusion signatures (Calliachar Burn, the River Almond, Glen Quaich); (B) Sample populations within Group 2, showing a more variable signature with a wider range of inclusion mineralogy (Sma Glen, Keltie Burn, Glen Lednock) together with the signature of the gold from the Ochil Hills [56]. (C) Comparison of inclusion signatures in gold from Canadian porphyry and epithermal localities, [10] with those of the most widespread gold type from Ochil Hills, Scotland [32]. ‘KSM’ = ‘Kerr-Sulphuretes-Mitchell’.

Mineral abbreviations used in Figure 7: Py = pyrite, Pyh = pyrrhotite, Apy = arsenopyrite, Cbt = cobaltite, Gdf = gersdorffite, Sp = sphalerite, Cin = cinnabar, Pn = pentlandite, SS = various sulphosalts, Ccp = chalcopyrite, Gn = galena, Bn = bornite, Cc = chalcocite, Mol = molybdenite, Alt = altaite, BLTS = undifferentiated Bi-Pb-tellurosulphides, Ttd = tetradymite, Hes = hessite, BCLS = undifferentiated Bi-Cu = Pb sulphides, BiTe = undifferentiated Bi tellurides, Me = melonite, Aca = acanthite, Eng = enargite, Ptz = petzite, Clr = coloradoite.
Figure 8.
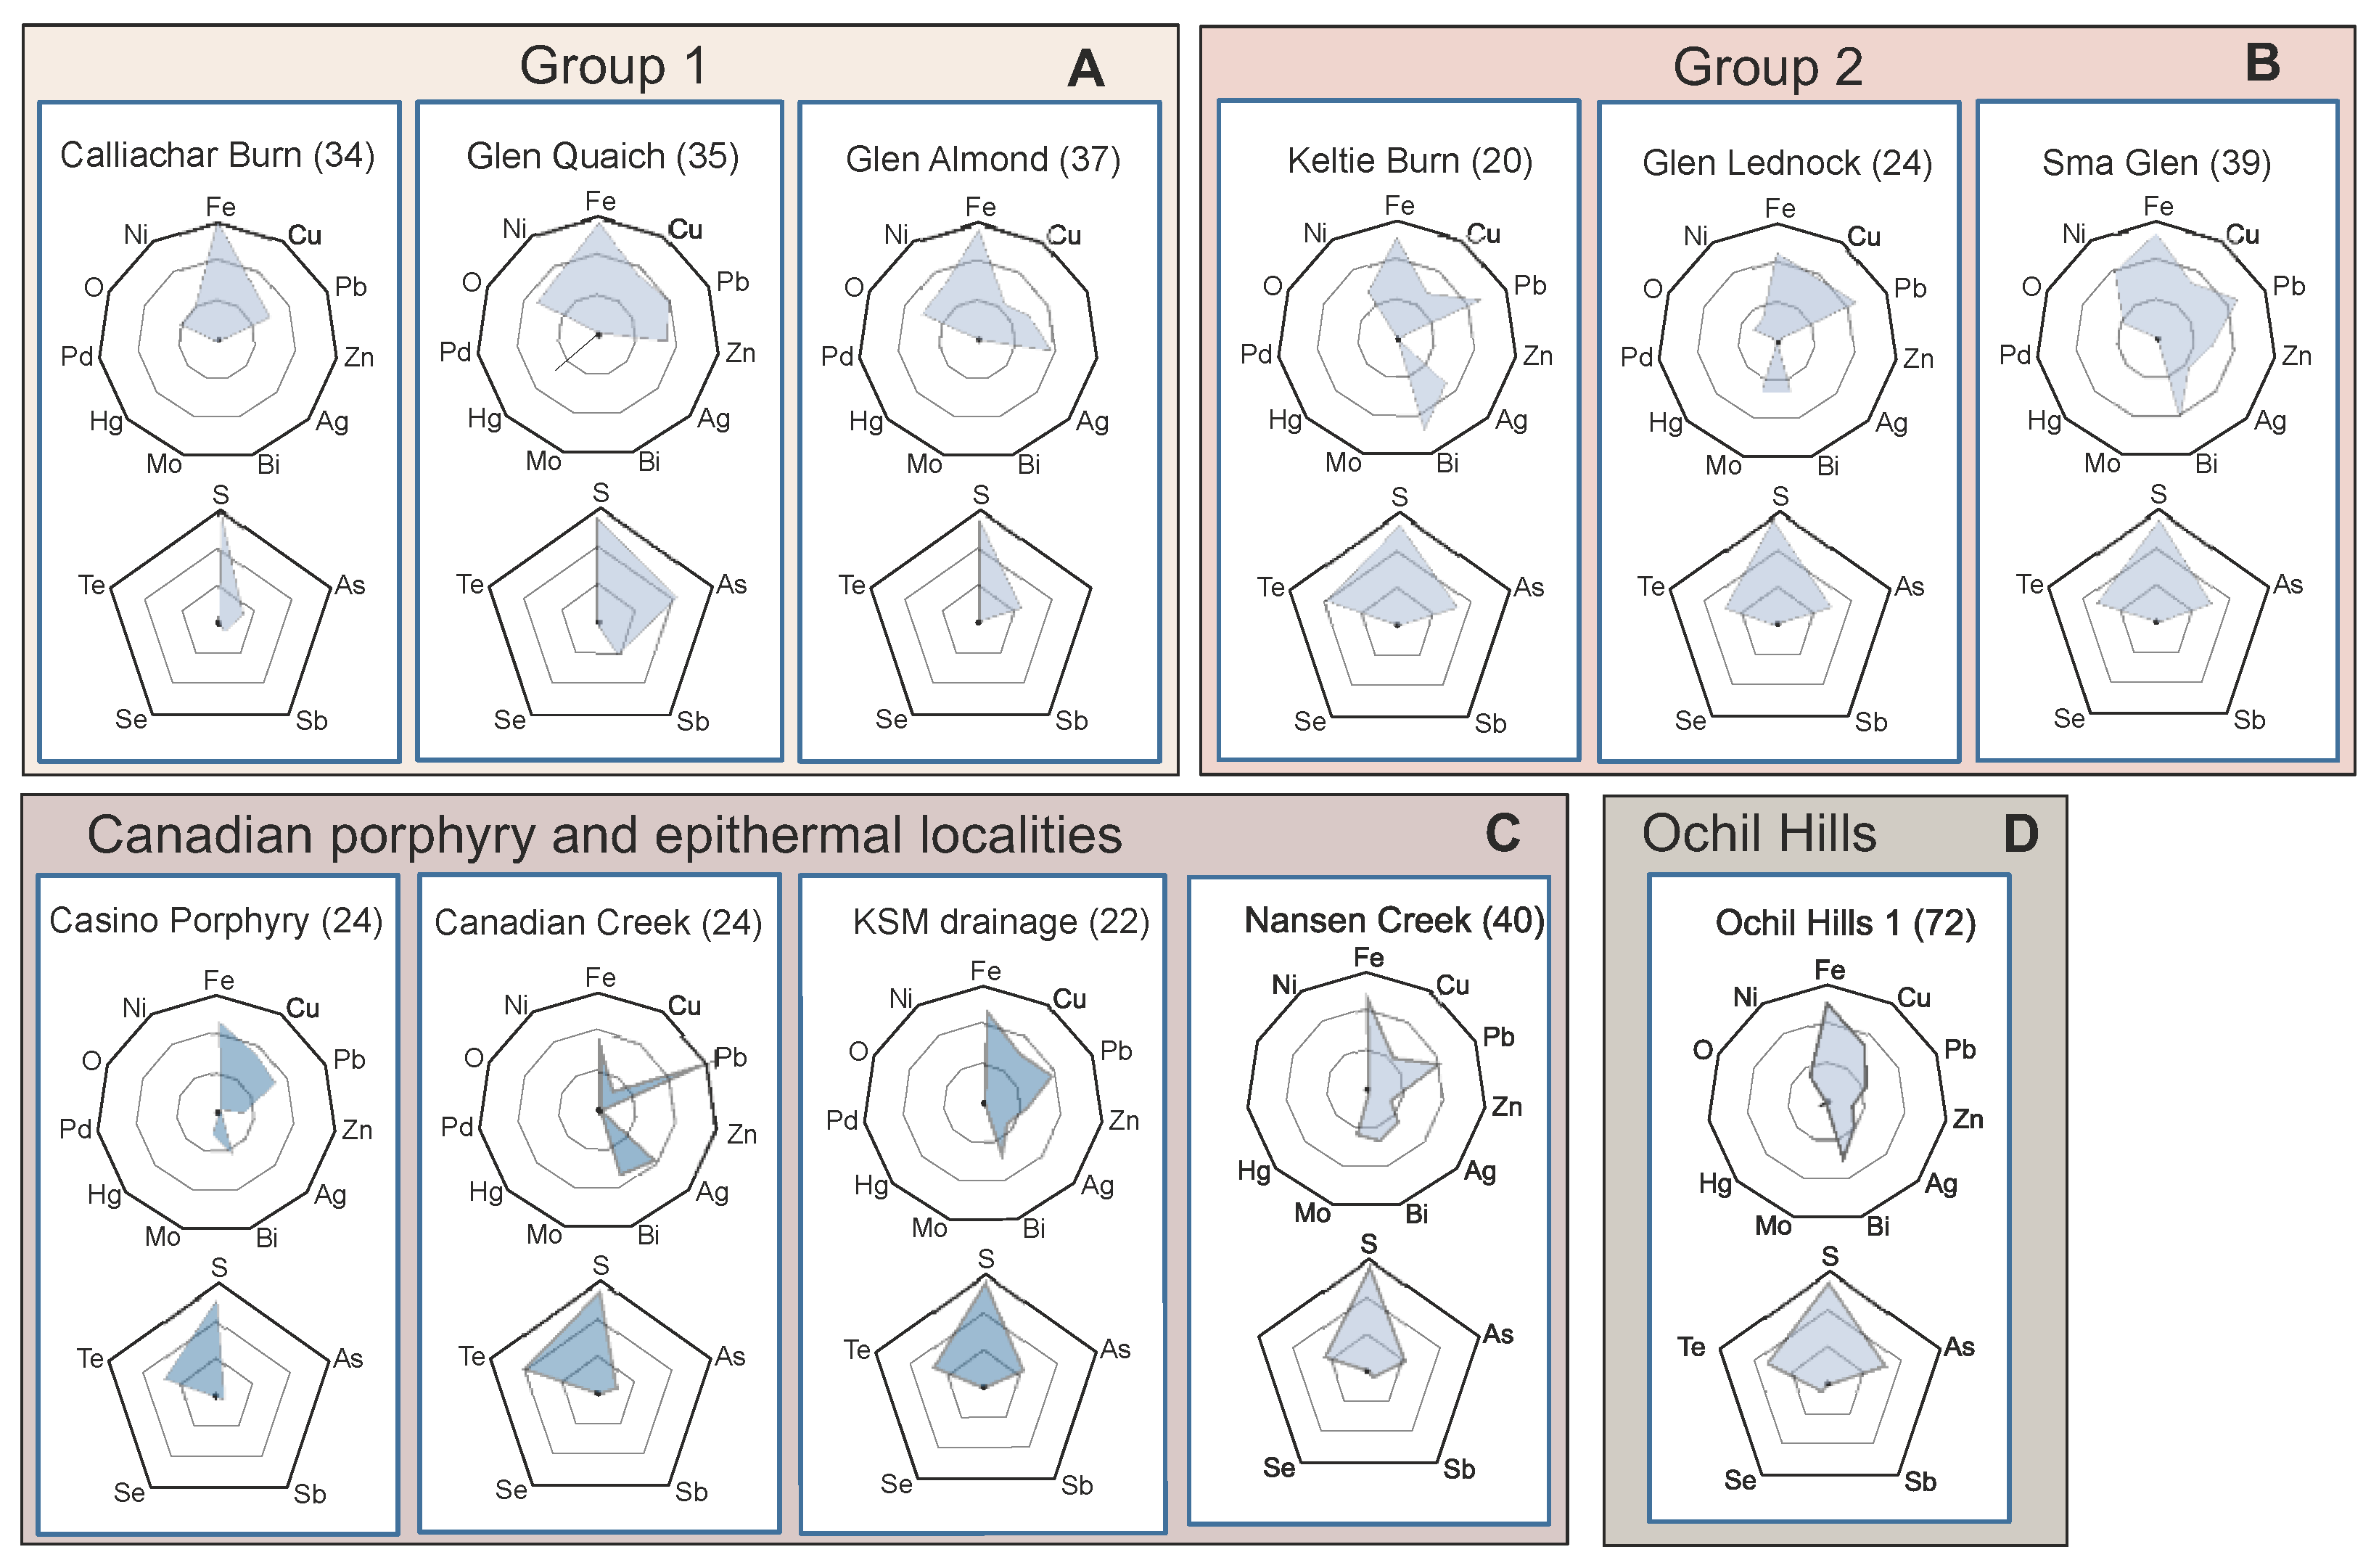
Radar plots showing the elemental components of the various inclusion suites, according to group and locality. Data origins: as per Figure 7: (A) Sample localities of Group, (B) Sample localities of Group 2, (C) Inclusion signatures in gold from Canadian porphyry and epithermal localities, [10], (D) Inclusion signature of gold from Ochil Hills, Scotland [32].
Figure 8.
Radar plots showing the elemental components of the various inclusion suites, according to group and locality. Data origins: as per Figure 7: (A) Sample localities of Group, (B) Sample localities of Group 2, (C) Inclusion signatures in gold from Canadian porphyry and epithermal localities, [10], (D) Inclusion signature of gold from Ochil Hills, Scotland [32].

4. Discussion
Interpreting the implications of the various gold signatures will be undertaken in two ways: firstly a broad approach that aims to identify any major relationships between signature and local lithologies and geological history, and secondly via a more detailed examination of the individual alloy and inclusion signatures and their relationship to other sources of information. It is worth noting that the large sample populations available to the study provide an excellent platform to characterize inclusion suites, even though the overall inclusion abundance is not high.
4.1. Relationship between Gold Signatures and Local Lithologies
The sample localities that comprise Group 1 (Calliachar Burn, Glen Quaich, Glen Almond) are all located in the Pitlochry Formation of the Southern Highland Group (Figure 1B). For Group 2 sampling localities, Glen Lednock and Sma Glen are within the Ben Ledi Grit Formation, with the Glen Lednock sampling locality being situated very close to the Early Devonian Comrie Pluton. The third Group 2 locality, Keltie Burn, lies south of the unconformity between the deformed rocks of the Southern Highland Group and the overlying Devonian sedimentary and igneous rocks. The sample of gold from Keltie Burn was collected a short distance downstream from the contact between the Devonian sedimentary rocks and mafic igneous rocks (Figure 1B).
There are some clear correlations between the signatures of the various sample populations gold reported above and their geological setting. Sample localities in Group 1 yield broadly comparable inclusion signatures (as described above), but in contrast, signatures of gold from localities in Group 2 show a wide compositional variability. The dominance of Early Devonian igneous rocks in the catchments of the River Lednock and Keltie Burn provides a first order explanation of the differences between signatures of the Group 1 and 2 localities. For Sma Glen, the interpretation is slightly more complicated. The inclusion suite in gold from Sma Glen is clearly more similar to the inclusion suites of the other Group 2 localities than to those in Group 1, although the alloy signature is less distinctive. Demonstrating a clear association with a potential magmatic source in geological terms is less straightforward for Sma Glen as no igneous rocks have been identified within the Ben Ledi Grit Fm. upstream from the sampling locality. The significance of the sample population from Sma Glen and its likely geological origins is discussed in more detail in a later section. Despite the level of uncertainty regarding the origins of gold from Sma Glen, the broad differences in the compositional signatures in gold in Groups 1 and 2 clearly correlate with geological differences within the study area, permitting confident speculation on the nature of the source mineralization that is yet to be discovered.
4.2. Interpretation of Gold Origins According to Compositional Signatures
4.2.1. Group 1 Localities
The Group 1 localities have been considered together because of the overall similarities in their inclusion suites, alloy compositions and the general geological setting. At Calliachar Burn, previous gold compositional work has focused on the relationship between the vein mineralogy and signature of detrital gold collected downstream of the vein outcrops [6,28,29]. The gold from Calliachar Burn used in the present study was collected approximately 1km upstream of the known vein occurrences but exhibits the high-Ag-and-Hg signature (Figure 3A,B) previously reported of gold from lower Calliachar Burn [28,29].
The setting of Group 1 localities is within metasedimentary sequences with no igneous intrusions located nearby. The closest intrusion is the granite intrusion of unknown age at Loch Lednock c. 5 km west of the Glen Almond sampling site (Figure 1B). The general absence of late-Silurian-Early Devonian igneous rocks near the sampling sites in the northern part of the study area suggests that any gold mineralization here did not originate from magmatic fluids, i.e., they are more likely to be “classical” orogenic gold occurrences. Therefore, a comparison with compositional signatures from other orogenic systems globally may be informative. The Ag profiles of the sample populations from Group 1 localities show a range between 10 and 40 wt% Ag, with mean values of 27.0, 25.5 and 20.2 wt% Ag for gold from Calliachar Burn, Glen Almond and Glen Quaich respectively. Such a large degree of variability within a single sample population from an alluvial occurrence may be ascribed to either variation in the parameters that influence alloy composition within a single mineralizing event [61,62] or the physical mixing of gold populations of a narrower Ag range each relating to different mineralizing episodes. These different episodes may be genetically unrelated but present within the fluvial catchment area or reflect multiple fluid pulses during the evolution of a single mineralizing system. Consideration of the mean Ag contents of populations of multiple samples of gold from Phanerozoic orogenic deposits showed a bimodal distribution with a small high-Ag group yielding values of between 18 and 30 wt% [60]. The Ag profiles of Group 1 gold are most similar to those classified as epizonal orogenic systems [10] both in terms of Ag range and distribution. However textural evidence for epizonal textures in gold from the Calliachar veins has not been reported [29]. Detailed paragenetic studies of the Eas Anie Vein at the Cononish deposit [CSJ] 30 km to the west of the study area showed clear ranges of Ag content within gold of different paragenetic stages, and the Ag range of 10–50 wt% in a sample of alluvial gold from the adjacent Cononish River [59] reflects those contributions. However the Cononish mineralizing system has been linked with magmatic fluids, [27] and appears to be genetically unrelated to the known vein arrays in the study area.
The inclusion suite previously reported in samples of gold from gossan and alluvial localities [59] shows a similar profile to that recorded in the present study, but with a larger contribution from Pb, Zn and Cu. Overall the inclusion suites of pyrite, pyrrhotite, and simple sulphides are most closely aligned with those reported form various Phanerozoic orogenic gold systems worldwide [10]. Gold from the River Almond exhibits a Ag profile very similar to that of Calliachar Burn gold, with high Ag contents dominating the sample population. Around 10% of the gold particles contain Hg to quantifiable concentrations, but Cu is almost entirely below the level of quantification. The Ag profile of gold from Glen Quaich (Figure 3A) contains a relatively low Ag component when compared with the signatures of gold from Glen Almond and Calliachar Burn. Consideration of the covariance of Ag and Hg reveals a distinct low Ag, low Hg compositional field identified in Figure 4, whilst the remainder of the population conforms to the compositional field of gold from Glen Almond and Calliachar Burn. Inspection of the inclusion suites in the two subsets defined by alloy composition of the Glen Quaich sample did not reveal any clear affiliations, implying that all gold in this sample population is probably genetically related.
The strong similarities in the dataset from Group 1 overall suggests that there is a genetic link between these gold sources and also with the Calliachar veins and adjacent alluvial locality [28,29]. Subtle differences between the individual alloy profiles and inclusion suites are noted, but we suggest that these variations are a consequence of small compositional differences in the source fluids (perhaps generated by contact with a common fluid with different lithologies) or the prevailing physicochemical conditions at the point of precipitation. This hypothesis is consistent with the small degree of variation in the vein mineralogy within the array of veins at Calliachar-Urlar [29]. Furthermore, all known auriferous veins in the northern part of the study area region exhibit a consistent NNW-SSE orientation which further supports a genetic commonality. The relatively simple inclusion suite mineralogy points towards a hydrothermal system typically associated with “orogenic gold” deposits for which both metamorphic and mantle fluid sources have been suggested [63]. This may explain the abundance of Ni and Co-bearing minerals in the inclusion suite of gold from the Group 1 localities. As for Hg, there is a suggestion of a systematic decrease in the Hg content of gold from north to south, i.e., between Calliachar Burn, Glen Quaich and Glen Almond, (Figure 3B), but previous attempts to infer the causality of the Hg contents of gold in relation to wider geological considerations have been unsuccessful [11]. The overall similarity between the signatures of gold from localities in Group 1 and their similarity to the compositional characteristics of in-situ gold from the Calliachar-Urlar area reported by other workers, strongly suggests that exploration in the upper Calliachar, Almond and Quaich catchments should focus on identifying similar vein systems.
4.2.2. Group 2 Localities
This section will first consider the gold from Glen Lednock and Keltie Burn where there is a close spatial relationship between sampling location and igneous lithologies, before moving on to discuss the potential origins of gold in Sma Glen.
In magmatic-hydrothermal systems, the spatial and temporal evolution of hydrothermal systems may be pronounced, encompassing the formation and modification of porphyry mineralization and also the subsequent transition to an epithermal environment [64]. Consequently, the Ag profiles of populations of gold particles precipitated at specific localities within the system also vary [61,62]. Populations of gold particles collected from drainages in the environs of porphyry mineralization are, therefore, likely to include contributions from several of these different populations, with the resulting profile governed by the interplay of drainage, erosion profile of the system and sampling locality. For this reason, Ag profiles do not necessarily constitute a useful primary discriminant for the identification of specific deposit types in the porphyry-epithermal environment, nor are they infallible as a comparator to establish ‘same or different’ for sample populations collected from different localities. Nevertheless the Ag profiles exhibited by the sample populations from Group 2 localities show Ag ranges which are compatible with those previously reported from porphyry-epithermal systems [60,65,66].
Only around 10% of gold particles from Sma Glen had Hg values above the level of quantitation, and all gold particles from Keltie Burn and Glen Lednock had Hg values below LOD. Consequently a compositional field for Group 2 gold has not been included in Figure 4.
Consideration of the inclusion signature has proved a far more robust approach by which to establish genetic relationships between sample populations from different localities [10], particularly where the ranges of Ag contents of alloy overlap substantially. The inclusion suite of gold from Glen Lednock contains chalcocite, molybdenite and bornite, (Figure 8B) all of which are mineralogically compatible with a porphyry genesis and the location of the sampling site close to the Comrie pluton (Figure 1B). Ore fluids of high Te fugacity are indicated at Glen Lednock and Keltie Burn by the presence of altaite (PbTe) and Pb-Bi telluride inclusions [67]. Chalcopyrite inclusions were not recorded in gold from Keltie Burn, whereas both chalcopyrite and bornite were present in the gold from Glen Lednock (Figure 8B). Interpretation of these features is aided by previous work that has focused on gold from calc-alkalic porphyry systems and related epithermal mineralization: here, we compare our findings with previously reported signatures of gold from magmatic hydrothermal systems in the Canadian Cordillera [10,14] and another within a region of Devonian igneous rocks in the Ochil Hills, Scotland, (Figure 1A) where widespread alluvial gold has been recorded [56].
Inclusion signatures of gold from calc alkaline porphyry systems and related low sulphidation epithermal systems in Yukon [14] and British Columbia [10] were depicted using both spider plots and radar diagrams and these are reproduced in Figure 7C and Figure 8C, respectively. The spider diagrams show the same general form as those describing gold from Glen Lednock and Keltie Burn, in that pyrite, chalcopyrite and galena are the dominant sulphides, with contributions from sulphoarsenides and an array of tellurides, whose speciation varies between localities. The radar diagrams, likewise, exhibit mutually consistent forms owing to minerals containing Bi, Pb, S and Te with varying contributions from Cu, Ag, Mo and Zn.
Four distinct compositional signatures were identified in populations of alluvial gold from the Ochil Hills (Figure 1A) during a regional study of detrital gold [56]. The most common signature was interpreted to be derived from low-sulphidation epithermal mineralization. The inclusion signatures of this gold type (labeled ‘Ochil Hills type 1’ in Figure 7 and Figure 8) are compared to those of gold from the Canadian localities specified earlier (Figure 7C and Figure 8C). In all cases the same general range of mineralogical characteristics and elemental signature can be observed although the Ochil Hills gold has a slightly less complex array of metals. The elemental signature of gold from Group 2 in our study (Figure 8B) shows many similarities with both the Canadian and the Ochil Hills localities, particularly with regard to S, As and Te. A high Te fugacity in the ore fluid of gold in mineralization in the Ochil Hills is indicated by the presence of coloradoite (HgTe) and petzite (AuAg)Te as inclusion species.
Some useful information is available from the Pd content of the Au-Ag alloy. Gold alloys have been reported from a number of geological settings, often associated with ultrabasic rocks [60,68,69], or the scavenging of various elements including Au and Pd from such rocks [69]. Palladium- bearing Au alloys are also formed in low temperature oxidizing chloride hydrothermal systems [70] and in association with Hg- bearing Au-Ag alloys in late stage hydrothermal activity associated with alkalic porphyry systems [13]. In the present study Pd-bearing Au was identified in sample populations from both Keltie Burn (Figure 6D) and Glen Lednock. Gold alloys of similar composition has previously been reported in detrital gold in the Ochil Hills from drainages also within Devonian Volcanic rocks [56]. Therefore, derivation from veins of this type is the most likely explanation of palladian gold occurrences within our study area.
The Hg content of gold from Keltie Burn and Glen Lednock is well below detection, unlike gold from the Ochil Hills where values to percent levels were sporadically encountered [56]. The proportion of gold particles containing quantifiable Cu in gold from Keltie burn (40%) appears higher than that from Glen Lednock (23%), although the reasons for this difference are unclear.
Overall, the mineralogical signatures of gold from Glen Lednock and Keltie Burn strongly indicate derivation from a magmatic hydrothermal system, with the mineralogy of the inclusion assemblages suggesting clear contributions from porphyry-derived gold at Glen Lednock (bornite-molybdenite-chalcocite) and low-sulphidation epithermal gold in Keltie Burn (an apparent absence of chalcopyrite and a general similarity to gold from the Ochil Hills 20 km to the south).
The interpretation of the compositional characteristics of gold from Sma Glen is slightly more complicated. Gold from Sma Glen exhibits some features that are very closely aligned with those of other Group 2 gold signatures, both in terms of the elemental and mineralogical profiles of the inclusion suites (Figure 7B and Figure 8B). However, the alloy profiles of Sma Glen gold more closely resemble the gold of Group 1, particularly for Ag, although the profiles do not perfectly conform (Figure 3). It is important to note that the Sma Glen locality is within the Glen Almond catchment, 10 km downstream of the Glen Almond sampling locality (Figure 1B). Consequently, it is probable that some gold present at Sma Glen has been fluvially transported from upstream, and the presence of some topologically water-worn grains supports this (Figure 2F). This likely mixture of gold from the large catchment area may account for some similarity between the alloy signature of Group 1 gold and gold from Sma Glen. However the inclusion signature of the Sma Glen sample is less likely to exhibit characteristics of Group 1 gold because of the obliteration of inclusions with gold particle deformation during prolonged transport [5]. Consequently both the morphology of gold particles at this site (Figure 2E) and the inclusion signature (Figure 8A,B) provide clear evidence of a local influx of gold.
The Te signature of the inclusion suite of gold from Sma Glen is pronounced, and is in part due to the presence of both altaite (PbTe) and melonite (NiTe), both indicative of high-Te fugacity environments [67]. The Bi signature, often in the form of Bi-telluride minerals is also very clear, providing another point of difference with gold from Group 1. As discussed above, it seems reasonable to assume that gold particles derived from porphyry, epithermal and transitional environments may be represented in populations of gold particles collected from the sampling points in Glen Lednock and Keltie Burn and therefore minerals reflecting these environments may be present within the overall inclusion assemblages. The Au-Bi-Te assemblage has been linked to ‘deep seated epithermal’ mineralization at several localities [56,71,72]. The associated, lower temperature mineralization may exhibit a Au-Ag-Te signature [56,71]. Evidence from inclusion signatures of gold from both Keltie Burn and Glen Lednock indicates that the overall signature is that of a multistage magmatic-hydrothermal system.
With regards to a plausible geological setting for local mineralization, proximity to the northern margin of the Devonian igneous rocks and the unconformity below them, now eroded at the Sma Glen sampling locality (Figure 1B), raises the possibility that the generally poor exposure has prevented the detection of Devonian igneous activity in the vicinity of Sma Glen. It is entirely feasible that some parts of the Devonian magmatic-hydrothermal system permeated farther north into the Ben Ledi Grit Formation.
5. Conclusions
Detailed characterization of alluvial gold particles adds a detailed layer of information over and above that gained from merely recording the presence, abundance and morphology of visible gold during routine stream sediment sampling. Characterization of gold particles also adds value to understanding gained through the study of known bedrock sources, as it can establish whether specific types of mineralization are more widespread than currently recognized. In the area south of Loch Tay, we have identified two distinct gold deposit signatures using analyses of alloy compositions and mineral inclusion suites. The first signature (Group 1) is defined by a large degree of replication in the gold signature from three separate sampling localities in the northern part of the study area. These signatures identify a regional type whose characteristics are compatible with mineralizing fluids generated by deep crust/mantle dehydration (“orogenic gold”). Similarities between these signatures indicate that future exploration in this part of the study area should focus on vein types similar to those already known at Calliachar-Urlar and Tombuie.
The second signature (Group 2), observed in the southern part of the study area in close proximity to Devonian igneous rocks, strongly indicates an association with magmatic hydrothermal systems. No known bedrock sources exist in this area but the comparison of the robust signatures gained from a large sample set with previously determined deposit type templates enabled the identification of the dominant source of gold. In addition to the sampling localities in the vicinity of exposed Devonian magmatic rocks, this approach identified the influx of gold from a presently unknown magmatic-hydrothermal source at Sma Glen in the mid-reaches of the River Almond, clearly distinguishable from alluvial gold present upstream in Glen Almond.
This study provides an example of the application of gold characterization studies during the exploration of areas of complex and poorly outcropping geology. In cases such as this where several deposit types are present, the outcomes of the approach permit more detailed subsequent targeting on a drainage-by-drainage basis, informed by an understanding of the likely deposit type. Further ongoing work will refine the characterization of gold from this study area and more widely, to further develop our understanding of the metallogeny of the Scottish Highlands in the Loch Tay region and in the contiguous auriferous areas along the HBF margins.
Author Contributions
Conceptualization, R.C. and T.T.; methodology, R.C., T.T., L.S.; formal analysis, L.S., R.C.; investigation, R.C., L.S., T.T.; data curation, R.C.; writing—original draft preparation, R.C., T.T.; writing—R.C., T.T., L.S.; visualization, R.C., T.T. All authors have read and agreed to the published version of the manuscript.
Funding
LS is in receipt of a NERC student award.
Data Availability Statement
The data presented in this study are available on request from the corresponding author. The data are not currently publicly available before the submission of the PhD thesis of LS.
Acknowledgments
We are indebted to the Ardtalnaig, Auchnafree, Garrows, Invergeldy, Monzie and Urlar Estates for permission to undertake the sampling that made this work possible. Aiden Lavelle, Kevin Dalton and Gregor Donaghy of Green Glen Minerals are thanked for their assistance in accessing field locations in their license area. Richard Walshaw is also sincerely thanked for assisting with the analytical work.
Conflicts of Interest
The authors declare no conflict of interest.
References
- McClenaghan, M.B.; Cabri, L.J. Review of gold and platinum group element (PGE) indicator minerals methods for surficial sediment sampling. Geochem. Explor. Environ. Anal. 2011, 11, 251–263. [Google Scholar] [CrossRef]
- Moles, N.R.; Chapman, R.J. Integration of detrital gold microchemistry, heavy mineral distribution, and sediment geochemistry to clarify regional metallogeny in glaciated terrains: Application in the Caledonides of southeast Ireland. Econ. Geol. 2019, 114, 207–232. [Google Scholar] [CrossRef]
- Aherne, S.; Reynolds, N.A.; Burke, D.J. Gold mineralization in the Silurian and Ordovician of South Mayo. In The Irish Minerals Industry 1980–1990; Bowden, A.A., Earls, G., O’Connor, P.G., Pyne, J.F., Eds.; Irish Association for Economic Geology: Dublin, Ireland, 1992; pp. 39–49. [Google Scholar]
- Chapman, R.J.; Moles, N.R.; Bluemel, B.; Walshaw, R.D. Detrital gold as an indicator mineral. In Recent Advances in Understanding Gold Deposits: From Orogeny to Alluvium; Torvela, T.M., Chapman, R.J., Lambert-Smith, J., Eds.; Geological Society Publications: London, UK, 2022; Volume 516, pp. 313–336. [Google Scholar]
- Nikiforova, Z.S.; Kalinin, Y.A.; Makarov, V.A. Evolution of native gold in exogenous conditions. Russ. Geol. Geophys. 2020, 61, 1244–1259. [Google Scholar] [CrossRef]
- Chapman, R.J.; Leake, R.C.; Moles, N.R.; Earls, G.; Cooper, C.; Harrington, K.; Berzins, R. The application of microchemical analysis of gold grains to the understanding of complex local and regional gold mineralization: A case study in Ireland and Scotland. Econ. Geol. 2000, 95, 1753–1773. [Google Scholar]
- Nikiforova, Z.S. Criteria for determining the genesis of placers and their different sources based on the morphological features of placer gold. Minerals 2021, 11, 381. [Google Scholar] [CrossRef]
- Masson, F.X.; Beaudoin, G.; Laurendeau, D. Multi-method 2D and 3D reconstruction of gold grain morphology in alluvial deposits: A review and application to the Rivière du Moulin (Québec, Canada). In Recent Advances in Understanding Gold Deposits: From Orogeny to Alluvium; Torvela, T.M., Chapman, R.J., Lambert-Smith, J., Eds.; Geological Society Publications: London, UK, 2022; Volume 516, pp. 337–352. [Google Scholar]
- Chapman, R.J.; Mortensen, J.K. Characterization of gold mineralization in the northern Cariboo gold district, British Columbia, Canada, through integration of compositional studies of lode and detrital gold with historical placer production: A template for evaluation of orogenic gold districts. Econ. Geol. 2016, 111, 1321–1345. [Google Scholar]
- Chapman, R.J.; Mortensen, J.K.; Allan, M.M.; Walshaw, R.D.; Bond, J.; MacWilliam, K. A New Approach to Characterizing Deposit Type Using Mineral Inclusion Assemblages in Gold Particles. Econ. Geol. 2022, 117, 361–381. [Google Scholar] [CrossRef]
- Chapman, R.J.; Mortensen, J.K.; Crawford, E.C.; Lebarge, W. Microchemical studies of placer and lode gold in the Klondike District, Yukon, Canada: 1. Evidence for a small, gold-rich, orogenic hydrothermal system in the Bonanza and Eldorado Creek area. Econ. Geol. 2010, 105, 1369–1392. [Google Scholar] [CrossRef]
- Potter, M.; Styles, M.T. Gold characterization as a guide to bedrock sources for the Estero Hondo alluvial gold mine, western Ecuador. Trans Inst. Min. Metall. 2003, 112, 297–304. [Google Scholar]
- Chapman, R.J.; Mileham, T.J.; Allan, M.M.; Mortensen, J.K. A distinctive Pd-Hg signature in detrital gold derived from alkalic Cu-Au porphyry systems. Ore Geol. Rev. 2017, 83, 84–102. [Google Scholar] [CrossRef] [Green Version]
- Chapman, R.J.; Allan, M.M.; Mortensen, J.K.; Wrighton, T.M.; Grimshaw, M.R. A new indicator mineral methodology based on a generic Bi-Pb-Te-S mineral inclusion signature in detrital gold from porphyry and low/intermediate sulfidation epithermal environments in Yukon Territory, Canada. Miner. Deposita 2018, 53, 815–834. [Google Scholar] [CrossRef] [Green Version]
- Lalomov, A.V.; Chefranov, R.M.; Naumov, V.A.; Naumova, O.B.; Lebarge, W.; Dilly, R.A. Typomorphic features of placer gold of Vagran cluster (the Northern Urals) and search indicators for primary bedrock gold deposits. Ore Geol. Rev. 2017, 85, 321–335. [Google Scholar] [CrossRef]
- Nevolko, P.A.; Kolpakov, V.V.; Nesterenko, G.G.; Fominykh, P.A. Alluvial placer gold of the Egor’evsk district (northern-Western Salair): Composition characteristics, types and mineral microinclusions. Russ Geol. Geophys. 2019, 60, 67–85. [Google Scholar] [CrossRef]
- Fominykh, P.A.; Nevolko, P.A.; Svetlitskaya, T.V.; Kolpakov, V.V. Native gold from the Kamenka-Barabanovsky and Kharuzovka alluvial placers (Northwest Salair Ridge, Western Siberia, Russia): Typomorphic features and possible bedrock sources. Ore Geol. Rev. 2020, 126, 103781. [Google Scholar] [CrossRef]
- Barrow, G. On an intrusion of muscovite-biotite gneiss in the south-east Highlands of Scotland, and its accompanying metamorphism. Quart. J. Geol. Soc. Lond. 1893, 49, 330–358. [Google Scholar] [CrossRef] [Green Version]
- Peach, B.N.; Horne, J.; Gunn, W.; Clough, C.T.; Hinxman, L.W.; Teall, J.J.H. The Geological Structure of the North-West Highlands of Scotland; HMSO: London, UK, 1907. [Google Scholar]
- Wilson, G.V.; Flett, J.S. Vol 17: The Lead, Zinc, Copper and Nickel Ores of Scotland. In Special Reports on the Mineral Resources of Great Britain; HMSO: London, UK, 1921; Volume 17. [Google Scholar]
- Pattrick, R.A.D. Sulphide mineralogy of the Tomnadashan copper deposit and the Corrie Buie lead veins, south Loch Tayside, Scotland. Min. Mag. 1984, 48, 85–91. [Google Scholar] [CrossRef]
- McClaren, M.J. The occurrence of gold in Great Britain and Ireland. Trans. Inst. Min. Eng. 1903, 25, 435–508. [Google Scholar]
- Calvert, J. The Gold Rocks of Great Britain and Ireland; Chapman and Hall: London, UK, 1853. [Google Scholar]
- Lindsay, W.L. The gold and gold-fields of Scotland. Trans Edinburgh Geol. Soc. 1868, 1, 105–115. [Google Scholar] [CrossRef] [Green Version]
- Parker, R.T.; Clifford, J.A.; Meldrum, A.H. The Cononish gold-silver deposit, Perthshire, Scotland. Trans. Inst. Min. Metall 1989, 98, 51–54. [Google Scholar]
- Treagus, J.E.; Pattrick, R.A.D.; Curtis, S.F. Movement and mineralization in the Tyndrum fault zone, Scotland and its regional significance. J. Geol. Soc. 1999, 156, 591–604. [Google Scholar] [CrossRef]
- Spence-Jones, C.; Jenkin, G.; Boyce, A.; Hill, N.; Sangster, C. Tellurium, magmatic fluids and orogenic gold: An early magmatic fluid pulse at Cononish gold deposit, Scotland. Ore Geol. Rev. 2018, 102, 894–905. [Google Scholar] [CrossRef]
- Leake, R.C.; Bland, D.J.; Cooper, C. Source Characterization of alluvial gold from mineral inclusions and internal compositional variation. Trans. Instn. Min. Metal. 1993, 102, 65–82. [Google Scholar]
- Ixer, R.A.; Pattrick, R.A.; Stanley, C.J. Geology, mineralogy and genesis of gold mineralization at Calliachar-Urlar Burn, Scotland. Trans. Instn. Min. Metall. 1997, 106, 99–108. [Google Scholar]
- Mason, J.; Pattrick, R.A.D.; Gallagher, M.J. Auriferous vein mineralization near Aberfeldy, Scotland. In Exploration and the Environment; Institution of Mining and Metallurgy Meeting: Edinburgh, UK, 1991; pp. 50–52. [Google Scholar]
- Corkhill, C.; Ixer, R.A.; Mason, J.S.; Irving, D.; Pattrick, R.A. Polymetallic auriferous vein mineralization near Loch Tay, Perthshire, Scotland. Scot. J. Geol. 2010, 46, 23–30. [Google Scholar] [CrossRef]
- Green Glen Minerals. Available online: https://greenglenminerals.com (accessed on 10 November 2022).
- Chapman, R.J.; Shaw, M.H.; Leake, R.C.; Jackson, B. Gold mineralisation in the central Ochil Hills, Perthshire, UK. Trans. Instn. Min. Metall. 2005, 114, 53–64. [Google Scholar] [CrossRef] [Green Version]
- Thompson, K.S.R. The Last Glaciers in Western Perthshire. Ph.D. Thesis, University of Edinburgh, Edinburgh, UK, 1972. [Google Scholar]
- Torvela, T.; Chapman, R.J.; Lambert-Smith, J. The importance of multi-method approaches and developing a characterisation. In Recent Advances in Understanding Gold Deposits: From Orogeny to Alluvium; Torvela, T.M., Chapman, R.J., Lambert-Smith, J., Eds.; Geological Society Publications: London, UK, 2022; Volume 516. [Google Scholar]
- Stephenson, D.; Mendum, J.; Fettes, D.; Leslie, A. The Dalradian rocks of Scotland: An introduction. Proc. Geol. Assoc. 2013, 124, 3–82. [Google Scholar] [CrossRef] [Green Version]
- Tanner, P.; Thomas, C.; Harris, A.; Gould, D.; Harte, B.; Treagus, J.; Stephenson, D. The Dalradian rocks of the Highland Border region of Scotland. Proc. Geol. Assoc. 2013, 124, 215–262. [Google Scholar] [CrossRef]
- Roberts, J.L.; Treagus, J.E. Polyphase generation of nappe structures in the Dalradian rocks of the southwest Highlands of Scotland. Scot. J. Geol. 1977, 13, 237–254. [Google Scholar] [CrossRef]
- Chew, D.; Strachan, R. The Laurentian Caledonides of Scotland and Ireland. Geol Soc. Lond. 2014, 390, 45–91. [Google Scholar] [CrossRef] [Green Version]
- Corfu, F.; Gasser, D.; Chew, D.M. New Perspectives on the Caledonides of Scandinavia and Related Areas. Geol. Soc. Lond. 2014, 390, 467–511. [Google Scholar] [CrossRef]
- Baxter, F.B.; Ague, J.J.; Depaolo, D.J. Prograde temperature–time evolution in the Barrovian type-locality constrained by Sm/Nd garnet ages from Glen Clova, Scotland. J. Geol. Soc. Lond. 2002, 159, 71–82. [Google Scholar] [CrossRef] [Green Version]
- Oliver, G.J.H.; Wilde, S.A.; Wan, Y. Geochronology and geodynamics of Scottish granitoids from the late Neoproterozoic break-up of Rodinia to Palaeozoic collision. J. Geol. Soc. Lond. 2008, 165, 661–674. [Google Scholar] [CrossRef]
- Mark, D.F.; Rice, C.M.; Hole, M.; Condon, D. Multi-chronometer dating of the Souter Head complex: Rapid exhumation terminates the Grampian Event of the Caledonian Orogeny. Earth Environ. Sci. Trans. R. Soc. Edinb. 2020, 2, 95–108. [Google Scholar] [CrossRef]
- Dempster, T. Uplift patterns and orogenic evolution in the Scottish Dalradian. J. Geol. Soc. Lond. 1985, 142, 111–128. [Google Scholar] [CrossRef]
- Soper, N.J.; Ryan, P.D.; Dewey, J.F. Age of the Grampian Orogeny in Scotland and Ireland. J. Geol. Soc. Lond. 1999, 156, 1231–1236. [Google Scholar] [CrossRef]
- Oliver, G.J.H. Reconstruction of the Grampian episode in Scotland: Its place in the Caledonian Orogeny. Tectonophys. 2001, 332, 23–49. [Google Scholar] [CrossRef]
- Dempster, T.J.; Hudson, N.F.C.; Rogers, G. Metamorphism and cooling of the NE Dalradian. J. Geol. Soc. Lond. 1995, 152, 383–390. [Google Scholar] [CrossRef]
- Dewey, J.F.; Mange, M. Petrography of Ordovician and Silurian sediments in the western Irish Caledonides: Tracers of a short-lived Ordovician continent—Arc collision orogeny and the evolution of the Laurentian Appalachian—Caledonian margin. Geol Soc. Lond. 1999, 164, 55–107. [Google Scholar] [CrossRef]
- Dallmeyer, R.D.; Strachan, R.A.; Rogers, G.; Watt, G.R.; Friend, C.R.L. Dating deformation and cooling in the Caledonian thrust nappes of north Sutherland, Scotland: Insights from 40Ar/39Ar and Rb–Sr chronology. J. Geol. Soc. Lond. 2001, 158, 501–512. [Google Scholar] [CrossRef]
- Jacques, J.M.; Reavy, R.J. Caledonian plutonism and major lineaments in the SW Scottish Highlands. J. Geol. Soc. London 1994, 151, 955–969. [Google Scholar] [CrossRef]
- Neilson, J.C.; Kokelaar, B.P.; Crowley, Q.G. Timing, relations and cause of plutonic and volcanic activity of the Siluro-Devonian post-collision magmatic episode in the Grampian Terrane, Scotland. J. Geol. Soc. Lond. 2009, 166, 545–561. [Google Scholar] [CrossRef] [Green Version]
- Stephenson, D.; Bevins, R.E.; Millward, D.; Highton, A.J.; Parsons, I.; Stone, P.; Wadsworth, W.J. Caledonian Igneous Rocks of Great Britain; Joint Nature Conservation Committee 17: Peterborough, UK, 1999. [Google Scholar]
- Rippon, J.; Read, W.A.; Park, R.G. The Ochil Fault and the Kincardine basin: Key structures in the tectonic evolution of the Midland Valley of Scotland. J. Geol. Soc. Lond. 1996, 153, 573–587. [Google Scholar] [CrossRef]
- Dewey, J.F.; Strachan, R.A. Changing Silurian–Devonian relative plate motion in the Caledonides; sinistral transpression to sinistral transtension. J. Geol. Soc. Lond. 2003, 160, 219–229. [Google Scholar] [CrossRef]
- Monaghan, A.A.; Pringle, M.S. 40Ar/39Ar geochronology of Carboniferous-Permian volcanism in the Midland Valley, Scotland. Geol. Soc. Lond. 2004, 223, 219–241. [Google Scholar] [CrossRef]
- Mendum, J.R.; Noble, S.R. Mid-Devonian sinistral transpression on the Great Glen Fault: The rise of the Rosemarkie Inlier and the Acadian Event in Scotland. Geol. Soc. Lond. 2010, 335, 161–187. [Google Scholar] [CrossRef] [Green Version]
- Rice, C.M.; Ashcroft, W.A.; Batten, D.J.; Boyce, A.J.; Caulfield, J.B.D.; Fallick, A.E.; Hole, M.J.; Jones, E.; Pearson, M.J.; Rogers, G.; et al. A Devonian auriferous hot spring system, Rhynie, Scotland. J. Geol. Soc. Lond. 1995, 152, 229–250. [Google Scholar] [CrossRef]
- Mark, F.D.; Rice, C.M.; Fallick, A.E.; Trewin, N.H.; Lee, M.R.; Boyce, A.; Lee, J.K.W. 40Ar/39Ar dating of hydrothermal activity, biota and gold mineralization in the Rhynie hot-spring system, Aberdeenshire, Scotland. Geochim. et Cosmochim. Acta 2011, 75, 555–569. [Google Scholar] [CrossRef]
- Leake, R.C.; Chapman, R.J.; Bland, D.J.; Condliffe, E.; Styles, M.T. Microchemical characterization of alluvial gold from Scotland. Trans. Instn. Min. Metal. 1997, 106, 85–98. [Google Scholar]
- Chapman, R.J.; Banks, D.A.; Styles, M.T.; Walshaw, R.D.; Piazolo, S.; Morgan, D.J.; Grimshaw, M.R.; Spence-Jones, C.P.; Matthews, T.J.; Borovinskaya, O. Chemical and physical heterogeneity within native gold: Implications for the design of gold particle studies. Miner. Deposita 2021, 56, 1563–1588. [Google Scholar] [CrossRef]
- Gammons, C.H.; Williams-Jones, A.E. Hydrothermal geochemistry of electrum; thermodynamic constraints. Econ. Geol. 1995, 90, 420–432. [Google Scholar] [CrossRef]
- Palyanova, G.A. Gold and silver minerals in sulfide ore. Geol. Ore Dep. 2020, 62, 383–406. [Google Scholar] [CrossRef]
- Goldfarb, R.J.; Groves, D.I. Orogenic gold: Common or evolving fluid and metal sources through time. Lithos 2015, 233, 2–26. [Google Scholar] [CrossRef]
- Gammons, C.H.; Williams-Jones, A.E. Chemical mobility of gold in the porphyry-epithermal environment. Econ. Geol. 1997, 92, 45–59. [Google Scholar] [CrossRef]
- Morrison, G.W.; Rose, W.J.; Jaireth, S. Geological and geochemical controls on the silver content (fineness) of gold in gold-silver deposits. Ore Geol. Rev. 1991, 6, 333–364. [Google Scholar] [CrossRef]
- Savva, N.E.; Kravtsova, R.G.; Anisimova, G.S.; Palyanova, G.A. Typomorphism of Native Gold (Geological-Industrial Types of Gold Deposits in the North-East of Russia). Minerals 2022, 12, 561. [Google Scholar] [CrossRef]
- Affifi, A.M.; Kelly, W.C.; Essene, E.J. Phase relations among tellurides, sulfides, and oxides; I, Thermochemical data and calculated equilibria. Econ. Geol. 1988, 83, 377–394. [Google Scholar] [CrossRef]
- Palyanova, G.; Murzin, V.; Borovikov, A.; Karmanov, N.; Kuznetsov, S. Native gold in the chudnoe Au-Pd-ree deposit (Subpolar Urals, Russia): Composition, minerals in intergrowth and genesis. Minerals 2021, 11, 451. [Google Scholar] [CrossRef]
- Murzin., V.; Palyanova, G.; Mayorova, T.; Beliaeva, T. The Gold–Palladium Ozernoe Occurrence (Polar Urals, Russia): Mineralogy, Conditions of Formation, Sources of Ore Matter and Fluid. Minerals 2022, 12, 765. [Google Scholar] [CrossRef]
- Chapman, R.J.; Leake, R.C.; Bond, D.P.; Stedra, V.; Fairgrieve, B. Chemical and mineralogical signatures of gold formed in oxidizing chloride hydrothermal systems and their significance within populations of placer gold grains collected during reconnaissance. Econ. Geol. 2009, 104, 563–585. [Google Scholar] [CrossRef]
- Kondratieva, L.A.; Anisimova, G.S.; Kardashevskaia, V.N. Types of Tellurium Mineralization of Gold Deposits of the Aldan Shield (Southern Yakutia, Russia). Minerals 2021, 11, 698. [Google Scholar] [CrossRef]
- James, L.P.; Fuchs, W.A. Exploration of the Exciban gold-copper-tellurium vein system, Camarines Norte, Philippines. J. Geochem. Expl. 1990, 35, 363–385. [Google Scholar] [CrossRef]
Figure 1.
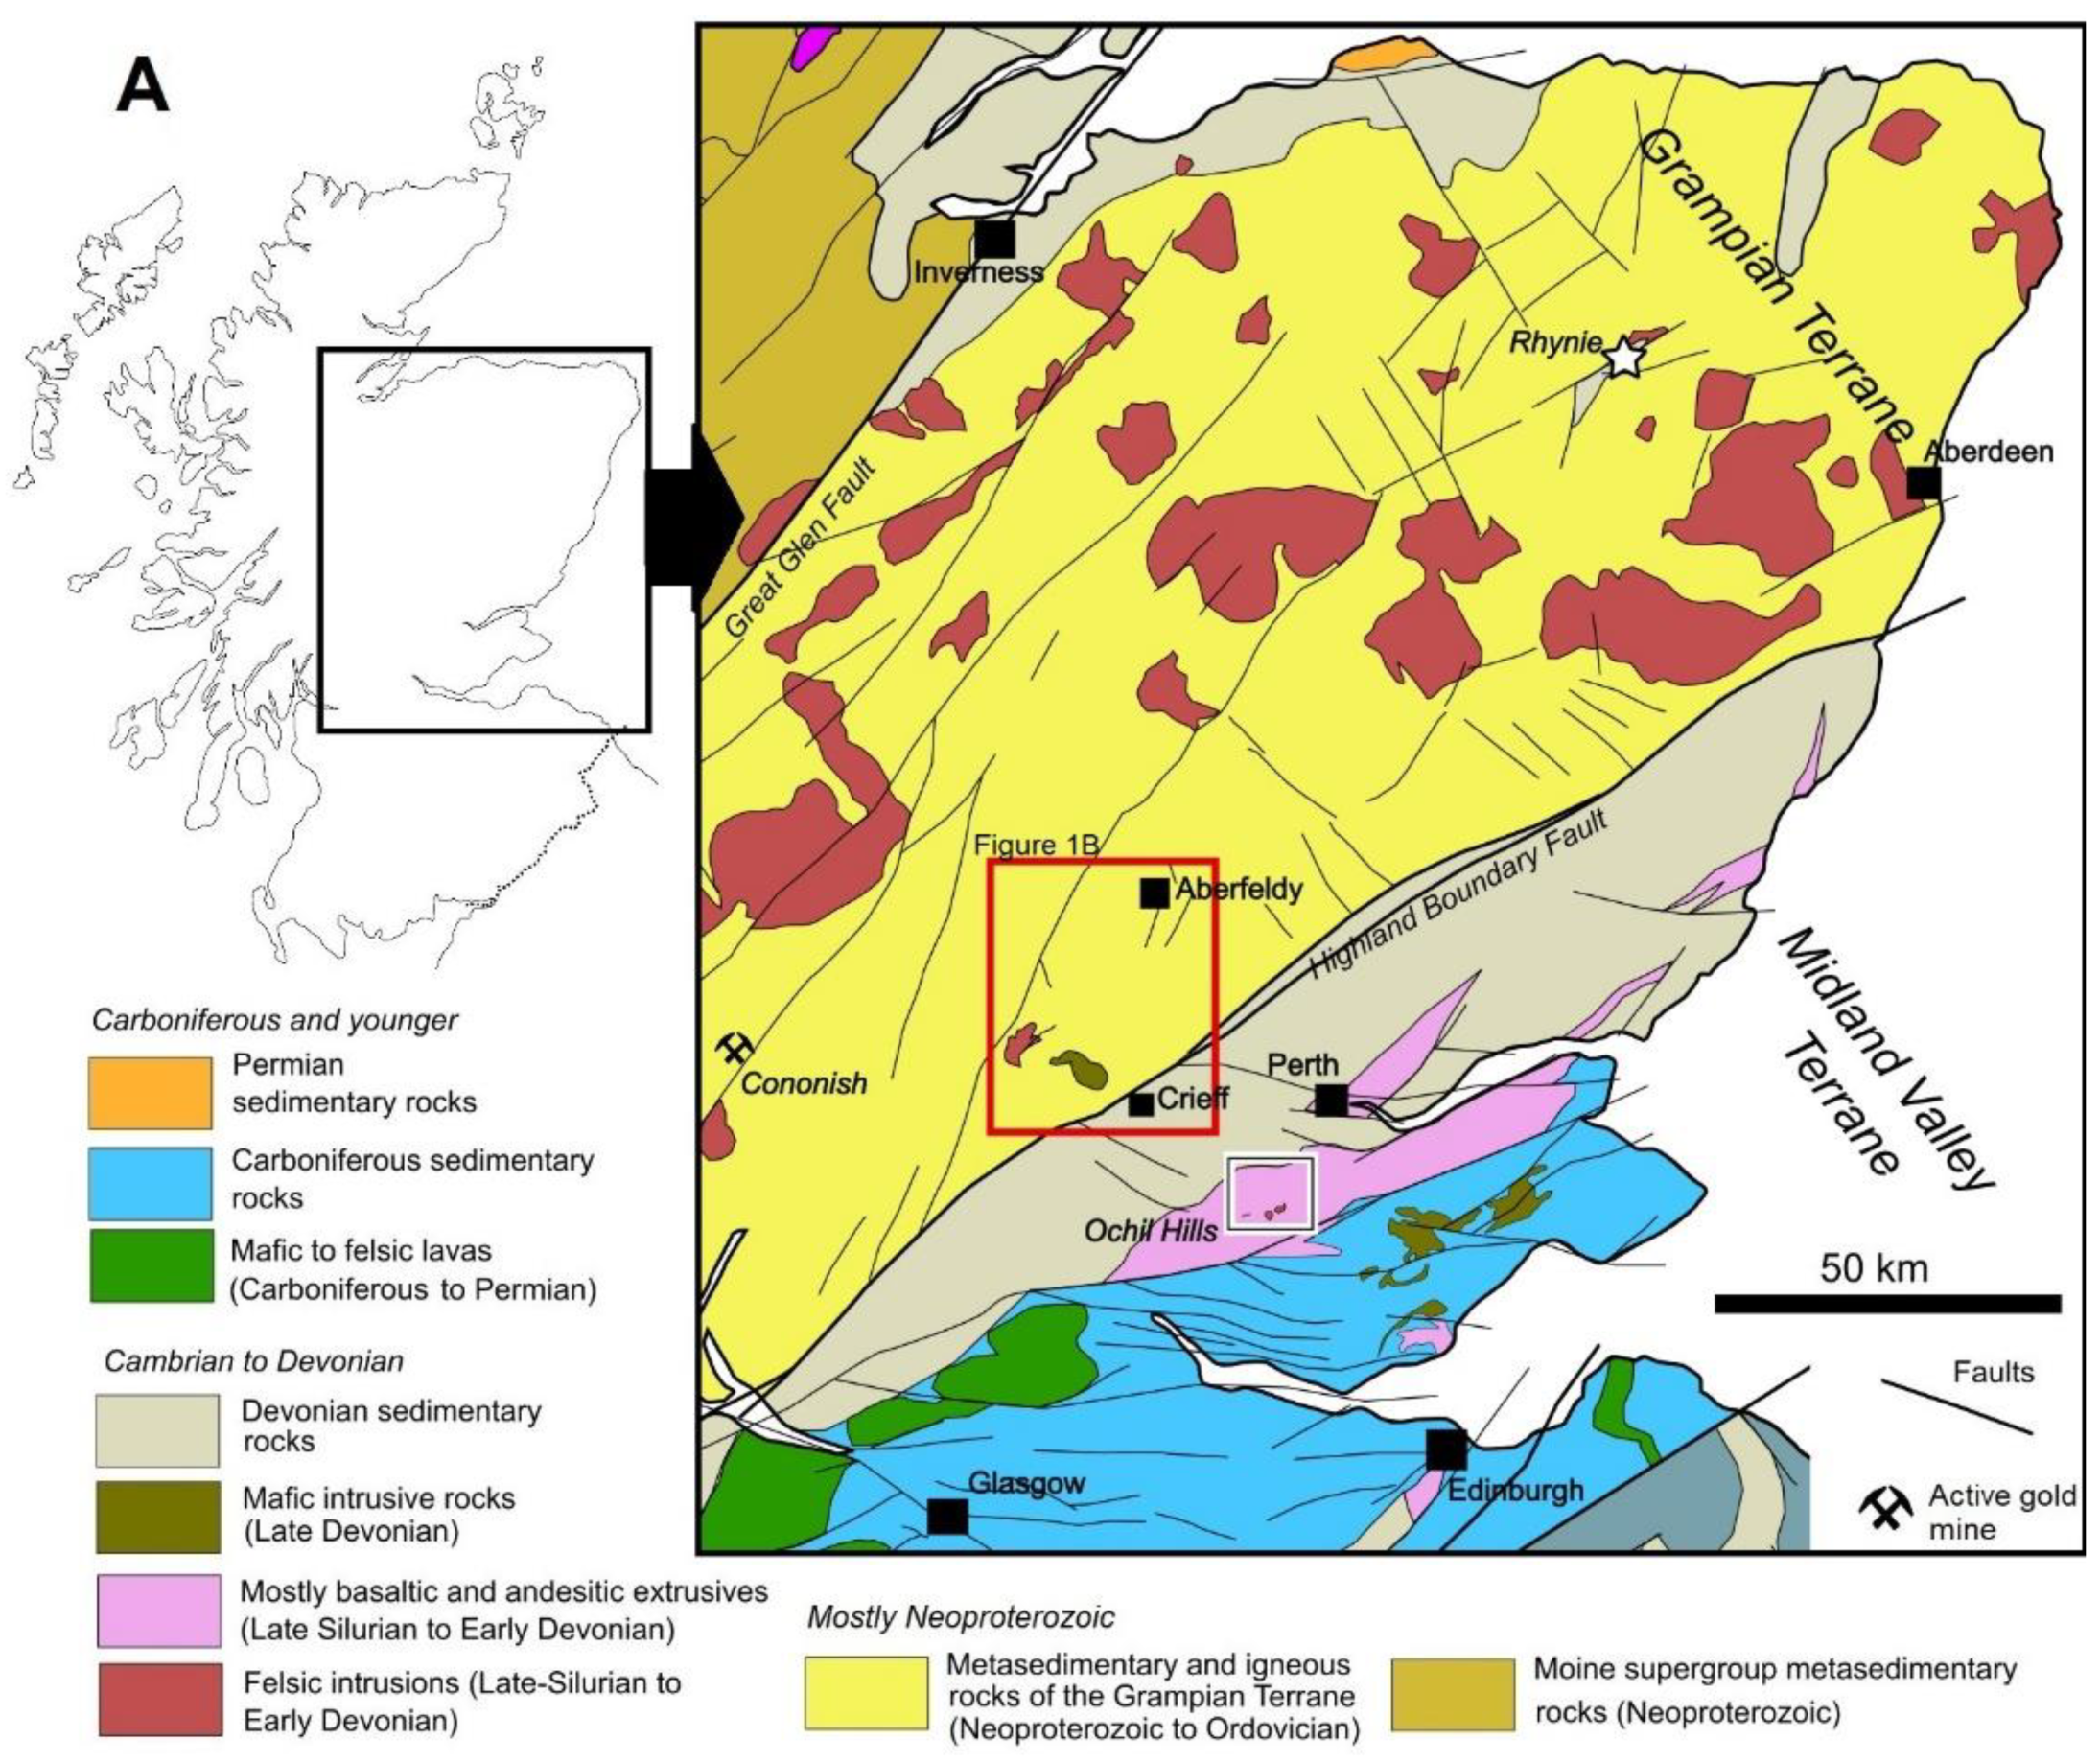
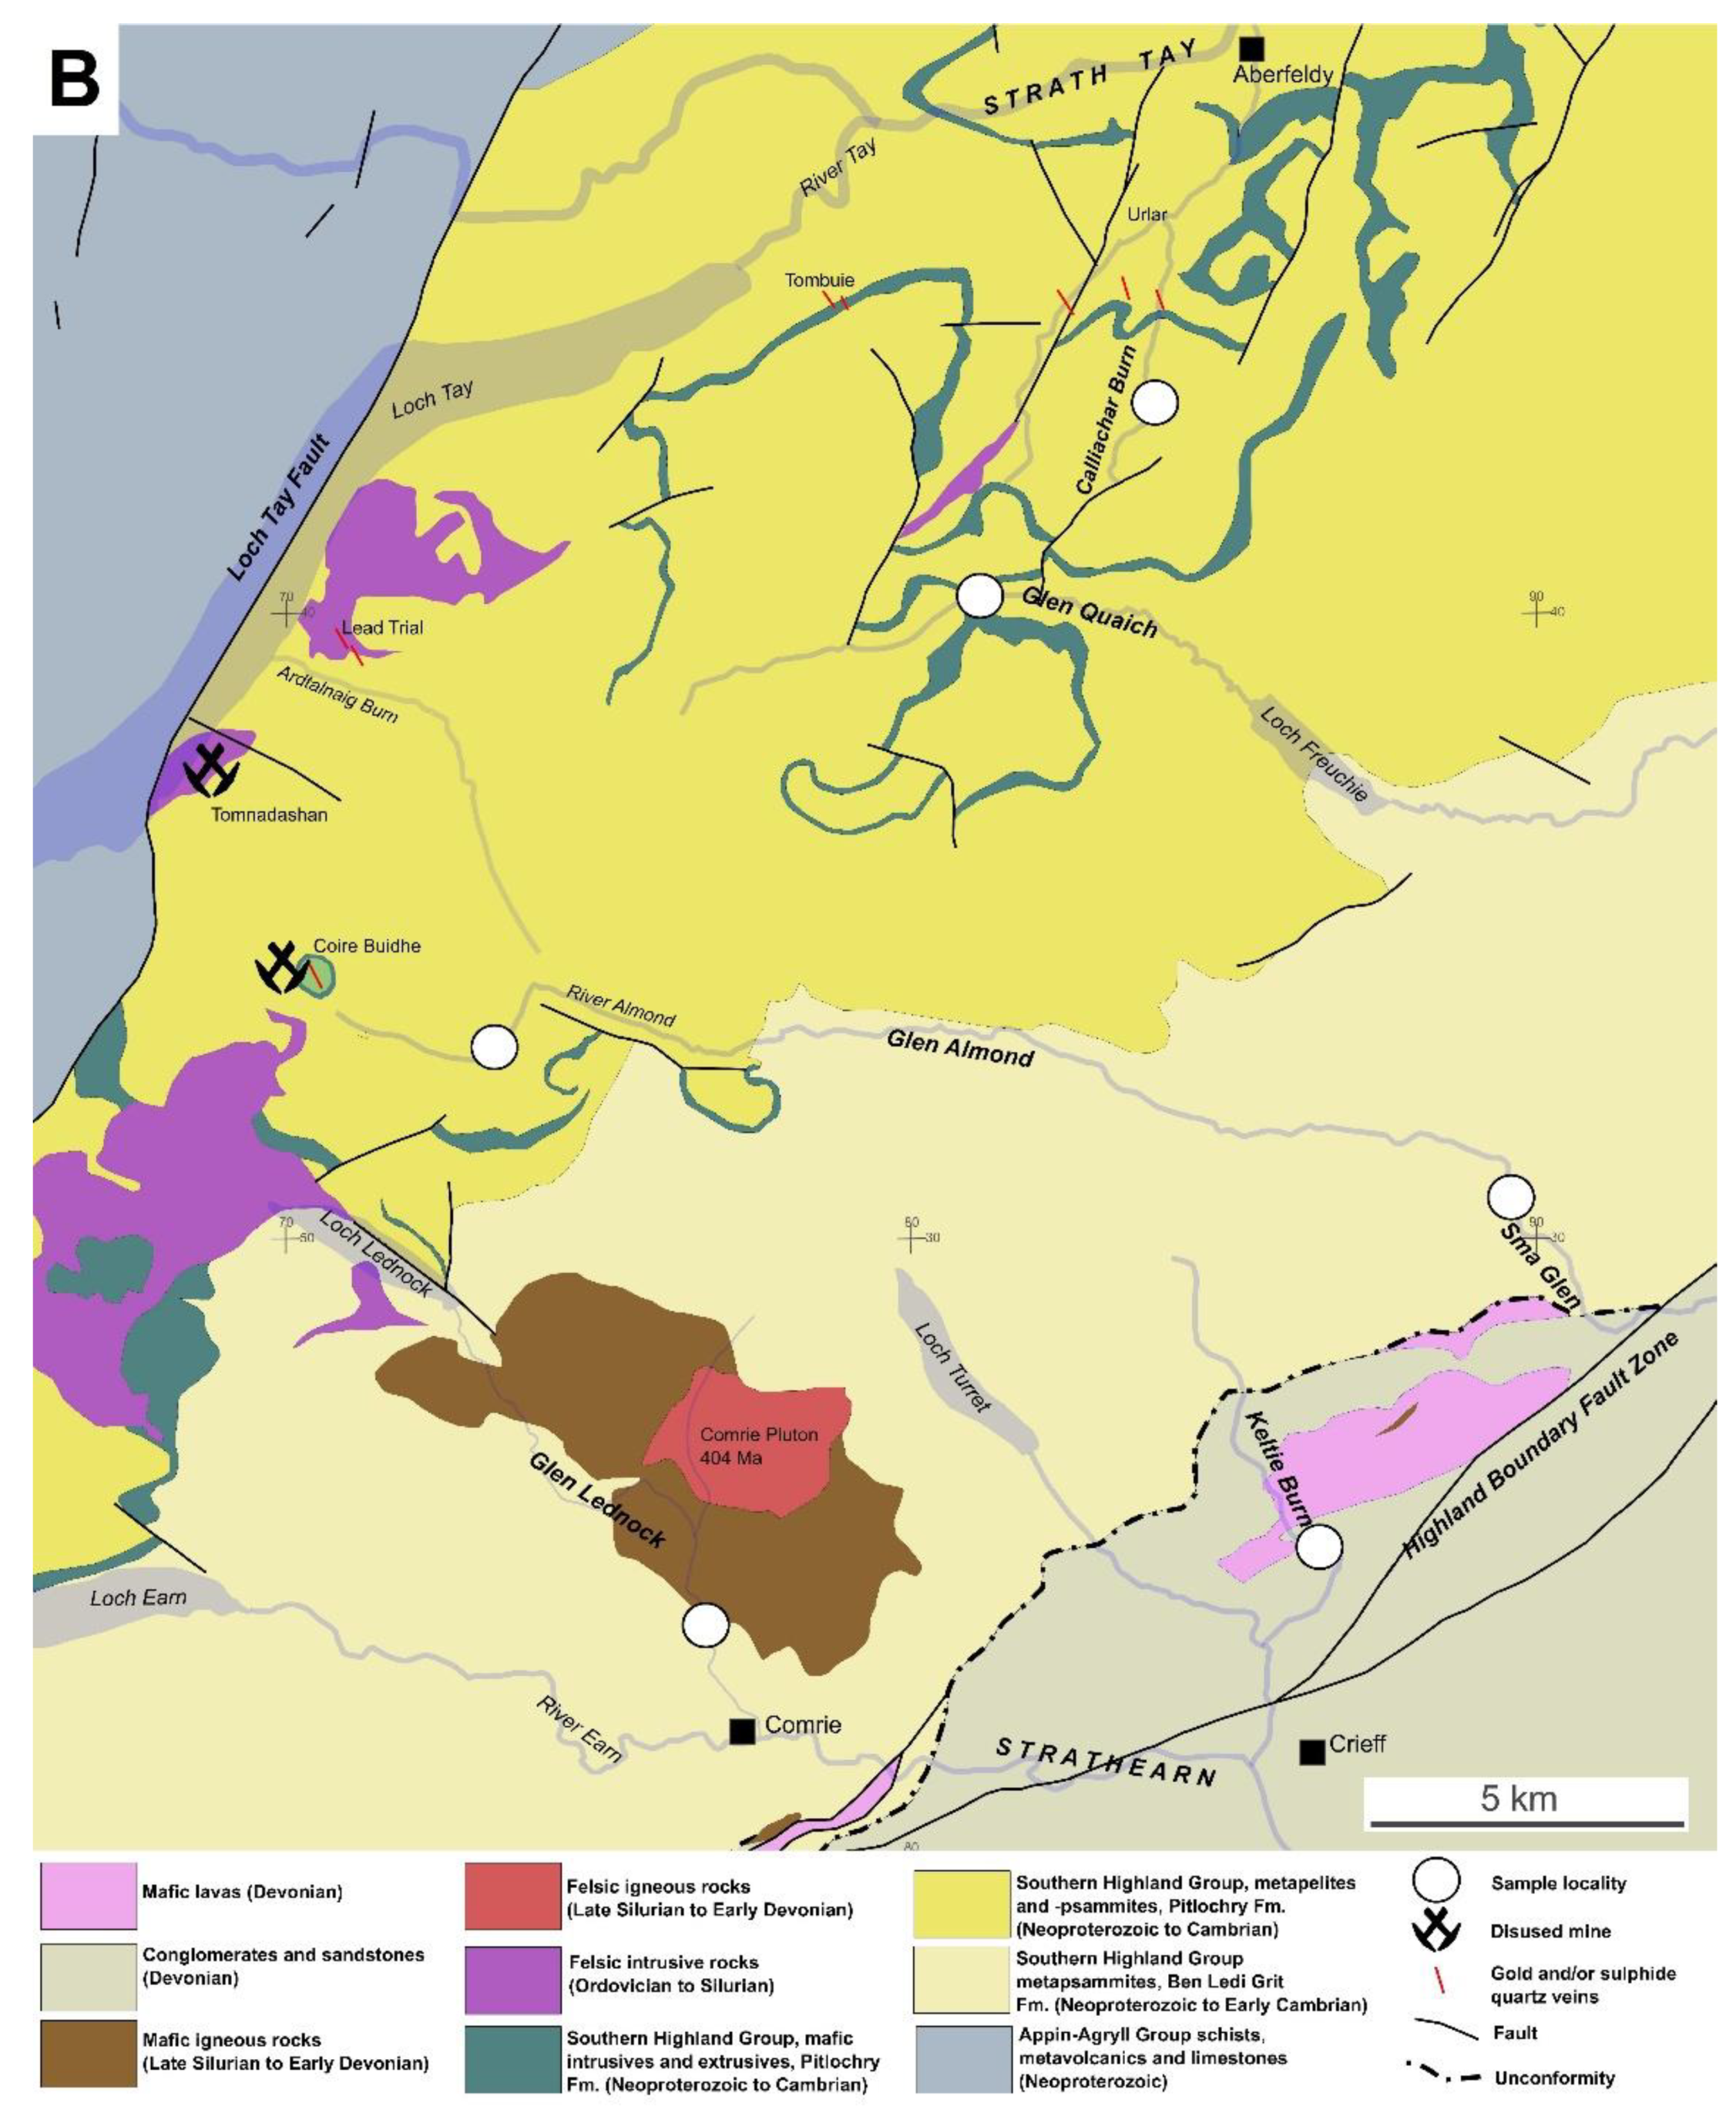
(A) Simplified geological map of central Scotland. The location of the study area is indicated with a red rectangle (Figure 1B overleaf); the area of the Ochil Hills gold particle study area of Chapman et al. (2005) [33] is indicated by a white box. The Early Devonian Rhynie gold occurrence is also indicated. (B) Geological map of the study area. The sampling localities are indicated, along with the location of the known gold- and sulphide-bearing quartz vein systems.
Figure 1.
(A) Simplified geological map of central Scotland. The location of the study area is indicated with a red rectangle (Figure 1B overleaf); the area of the Ochil Hills gold particle study area of Chapman et al. (2005) [33] is indicated by a white box. The Early Devonian Rhynie gold occurrence is also indicated. (B) Geological map of the study area. The sampling localities are indicated, along with the location of the known gold- and sulphide-bearing quartz vein systems.


Figure 2.
Examples of gold particles from different localities in the study area. (A,B) Images of alluvial gold particles from Calliachar Burn; (C) Glen Almond; and (D) Glen Quaich. (E,F) SEM SE images of gold particles from Sma Glen, showing contrasting morphologies indicative of different transport histories (see text).

Figure 3.
Gold alloy composition. (A) Silver content of Au-Ag alloys; (B) Mercury content of Au-Ag alloys; (C) Cu content of Au-Ag alloys. Note logarithmic scale for y axis of Cu plot. Figures in parentheses refer to number of particles in the sample population. Key in Figure 3B applies to all.
Figure 3.
Gold alloy composition. (A) Silver content of Au-Ag alloys; (B) Mercury content of Au-Ag alloys; (C) Cu content of Au-Ag alloys. Note logarithmic scale for y axis of Cu plot. Figures in parentheses refer to number of particles in the sample population. Key in Figure 3B applies to all.

Figure 4.
Ag vs. Hg binary plot. Data for gold from Keltie Burn, Sma Glen and Glen Lednock have been omitted as all Hg values are below LOD (Figure 3B). Compositional fields discussed in the text are identified by dashed lines.
Figure 4.
Ag vs. Hg binary plot. Data for gold from Keltie Burn, Sma Glen and Glen Lednock have been omitted as all Hg values are below LOD (Figure 3B). Compositional fields discussed in the text are identified by dashed lines.

Figure 5.
Ag vs. Cu binary plot for gold particles from Glen Lednock and Keltie Burn. Data for gold from other localities has been omitted, as all is <LOQ.
Figure 5.
Ag vs. Cu binary plot for gold particles from Glen Lednock and Keltie Burn. Data for gold from other localities has been omitted, as all is <LOQ.

Figure 6.
Internal compositional characteristics of gold revealed by SEM imaging. (A) An example BSE image of homogenous, inclusion-free gold particle (Glen Quaich); (B) Homogenous alloy, containing inclusions of quartz and pyrite (Calliachar Burn); (C) Films of Ag-rich Au alloy (dark grey) and Ag-poor Au alloy(very light grey) in a gold particle containing galena inclusions (Glen Quaich); (D) Compositional heterogeneity within agold particle containing Pd as an alloy component, (Glen Lednock); 1: Au: 87.4%, Cu: 8.4%, Pd: 4.3%, 2: Au: 91.8%, Ag: 0.2%, Cu: 1.3%, Hg: 0.6%, Pd: 5.6%, 3: Au: 95.1%, Cu: 1.5%, Pd: 3.4% (all wt%); (E) example of typical small pyrite inclusion found in gold from localities of Group 1.


Table 1.
Sample locations and sample characteristics.
| Sample | Grid Reference | No. of Particles | Size Range (mm) | |
|---|---|---|---|---|
| Min | Max | |||
| Calliachar Burn | NN 84011 45090 | 335 | 0.1 | >10 |
| Glen Quaich | NN 81863 40280 | 378 | 0.1 | 3 |
| Glen Almond | NN 73798 33629 | 376 | 0.1 | >10 |
| Sma Glen | NN 90561 29437 | 393 | 0.1 | 1 |
| Glen Lednock | NN 76808 23704 | 194 | 0.1 | 2 |
| Keltie Burn | NN 86808 25013 | 211 | 0.1 | 2 |
Disclaimer/Publisher’s Note: The statements, opinions and data contained in all publications are solely those of the individual author(s) and contributor(s) and not of MDPI and/or the editor(s). MDPI and/or the editor(s) disclaim responsibility for any injury to people or property resulting from any ideas, methods, instructions or products referred to in the content. |
© 2023 by the authors. Licensee MDPI, Basel, Switzerland. This article is an open access article distributed under the terms and conditions of the Creative Commons Attribution (CC BY) license (https://creativecommons.org/licenses/by/4.0/).
Share and Cite
MDPI and ACS Style
Chapman, R.; Torvela, T.; Savastano, L. Insights into Regional Metallogeny from Detailed Compositional Studies of Alluvial Gold: An Example from the Loch Tay Area, Central Scotland. Minerals 2023, 13, 140. https://doi.org/10.3390/min13020140
AMA Style
Chapman R, Torvela T, Savastano L. Insights into Regional Metallogeny from Detailed Compositional Studies of Alluvial Gold: An Example from the Loch Tay Area, Central Scotland. Minerals. 2023; 13(2):140. https://doi.org/10.3390/min13020140
Chicago/Turabian StyleChapman, Robert, Taija Torvela, and Lucia Savastano. 2023. "Insights into Regional Metallogeny from Detailed Compositional Studies of Alluvial Gold: An Example from the Loch Tay Area, Central Scotland" Minerals 13, no. 2: 140. https://doi.org/10.3390/min13020140
Note that from the first issue of 2016, this journal uses article numbers instead of page numbers. See further details here.