
Synergy Effect between Sodium Oleate and Alcohol Ethoxylates on the Reverse Flotation of Quartz

School of Civil and Resource Engineering, University of Science and Technology Beijing, Beijing 100083, China
*
Author to whom correspondence should be addressed.
Minerals 2023, 13(1), 93; https://doi.org/10.3390/min13010093
Submission received: 3 December 2022
/
Revised: 30 December 2022
/
Accepted: 5 January 2023
/
Published: 7 January 2023
(This article belongs to the Section Mineral Processing and Extractive Metallurgy)
Abstract
:In this study, an optimized method was presented for the reverse quartz flotation in iron ore purification where sodium oleate (NaOL) was always selected as the collector due to its accessibility and economic benefits. Three alcohol ethoxylates, octylphenol ethoxylate (OP-10), nonylphenol ethoxylate (NP-10) and fatty alcohol ethoxylates (AEO-9) were introduced to improve the collecting performance of NaOL in the reverse flotation of quartz. It turned out that the addition of alcohol ethoxylates was helpful to increase the recovery of quartz in the flotation with the order of OP-10 > NP-10 > AEO-9. To characterize the adsorption of NaOL on activated quartz in different surfactant systems, Fourier-Transform Infrared Spectroscopy (FTIR) and Quartz Crystal Microbalance with Dissipation (QCM-D) were employed. Furthermore, the contact angles of the quartz surface that interacted with different surfactant systems were measured to investigate the synergy effect of NaOL and alcohol ethoxylates on the hydrophobicity of quartz. It turned out that alcohol ethoxylates promoted the adsorption of NaOL on the activated quartz, resulting in an increase in the hydrophobicity of quartz also in the order of OP-10 > NP-10 > AEO-9, which well explained the flotation results. Regular Solution Theory (RST) and the dilution effect based on the surface tension analysis were utilized to elucidate the synergy mechanism between NaOL and the alcohol ethoxylate.
1. Introduction
The reverse flotation of quartz is a critical process for the purification of iron concentrates after magnetic separation [1,2]. In this process, quartz is activated by Ca2+ or other multivalent metal cations followed by flotation with sodium oleate (NaOL) or other anionic collectors at pH 11–12 into a froth product, while iron-bearing minerals (hematite and magnetite) being depressed by corn starch are left in the pulp, which achieves quartz separation from the iron-bearing minerals [3]. Quartz exhibits a very poor floatability across the entire pH range in its anionic collector flotation. However, the active species Ca(OH)+ derived from Ca2+ can be specifically adsorbed on the negatively charged quartz surface, which provides adsorption sites for NaOL toward quartz [4,5]. The chemical reaction between oleate (OL−) and Ca2+ generates –Si-O-Ca-OOCR on the Ca2+-activated quartz surface, which enhances the hydrophobicity and floatability of quartz [6]. As a result, once it is activated by Ca2+ or other multivalent metal cations, the floatability of quartz improves dramatically [7].
Despite successful and economic recovery of quartz via flotation, its efficiency using NaOL as the collector still can be improved. Normally, improving temperature and employing mixed collectors are the two main methods to enhance the collector effectiveness [5,8,9,10]. At higher temperatures, the interaction between NaOL and the calcium-activated quartz surface becomes stronger, so as a result, quartz flotation was improved by increasing temperatures [5]. However, high temperatures result in high processing cost [11]. Therefore, employing synergic reagents to enhance the performance of NaOL has drawn widespread attention, and the application of mixed collectors has become an important procedure to reduce the reagent cost and enhance collector effectiveness [9,11,12,13,14,15,16]. The adsorption of one surfactant is often enhanced by the addition of a small amount of the other surfactant through hydrophobic interactions [9,15]. It has been certified that non-ionic lipophilic surfactant and non-ionic hydrophilic surfactant could improve the quartz recovery when mixed with NaOL [9].
Alcohol ethoxylates (R(OC2H4)nOH) are a common form of nonionic surfactant, which have advantages of low toxicity, rapid biodegradation and foamability [17,18]. However, alcohol ethoxylates have been seldom used in quartz flotation and reported in the literature. The physical and performance properties of alcohol ethoxylates depend on the alkyl chain length, the alkyl branching and the polyethylene glycol chain [17]. In this study, octylphenol ethoxylate (OP-10), nonylphenol ethoxylate (NP-10) and fatty alcohol ethoxylates (AEO-9) were introduced to assist the flotation of quartz. The three alcohol ethoxylates have a similar polyethylene glycol chain and alkyl chain length, but different alkyl branching. The ability of alcohol ethoxylates to improve the collecting performance of NaOL in quartz flotation was investigated using OP-10, NP-10 and AEO-9 as examples.
In this study, the quartz recovery in flotation with NaOL as the collector was investigated with the addition of different types and concentrations of alcohol ethoxylates (OP-10, NP-10 and AEO-9). The adsorption of NaOL on activated quartz under the influence of different alcohol ethoxylates was characterized through Fourier-Transform Infrared Spectroscopy (FTIR) and Quartz Crystal Microbalance with Dissipation (QCM-D). Furthermore, the synergy effect of NaOL and different alcohol ethoxylates on the surface hydrophobicity of quartz was investigated. In addition, Regular Solution Theory (RST) and the dilution effect based on the surface tension analysis were utilized to elucidate the synergy mechanism between NaOL and the alcohol ethoxylate.
2. Materials and Methods
2.1. Materials
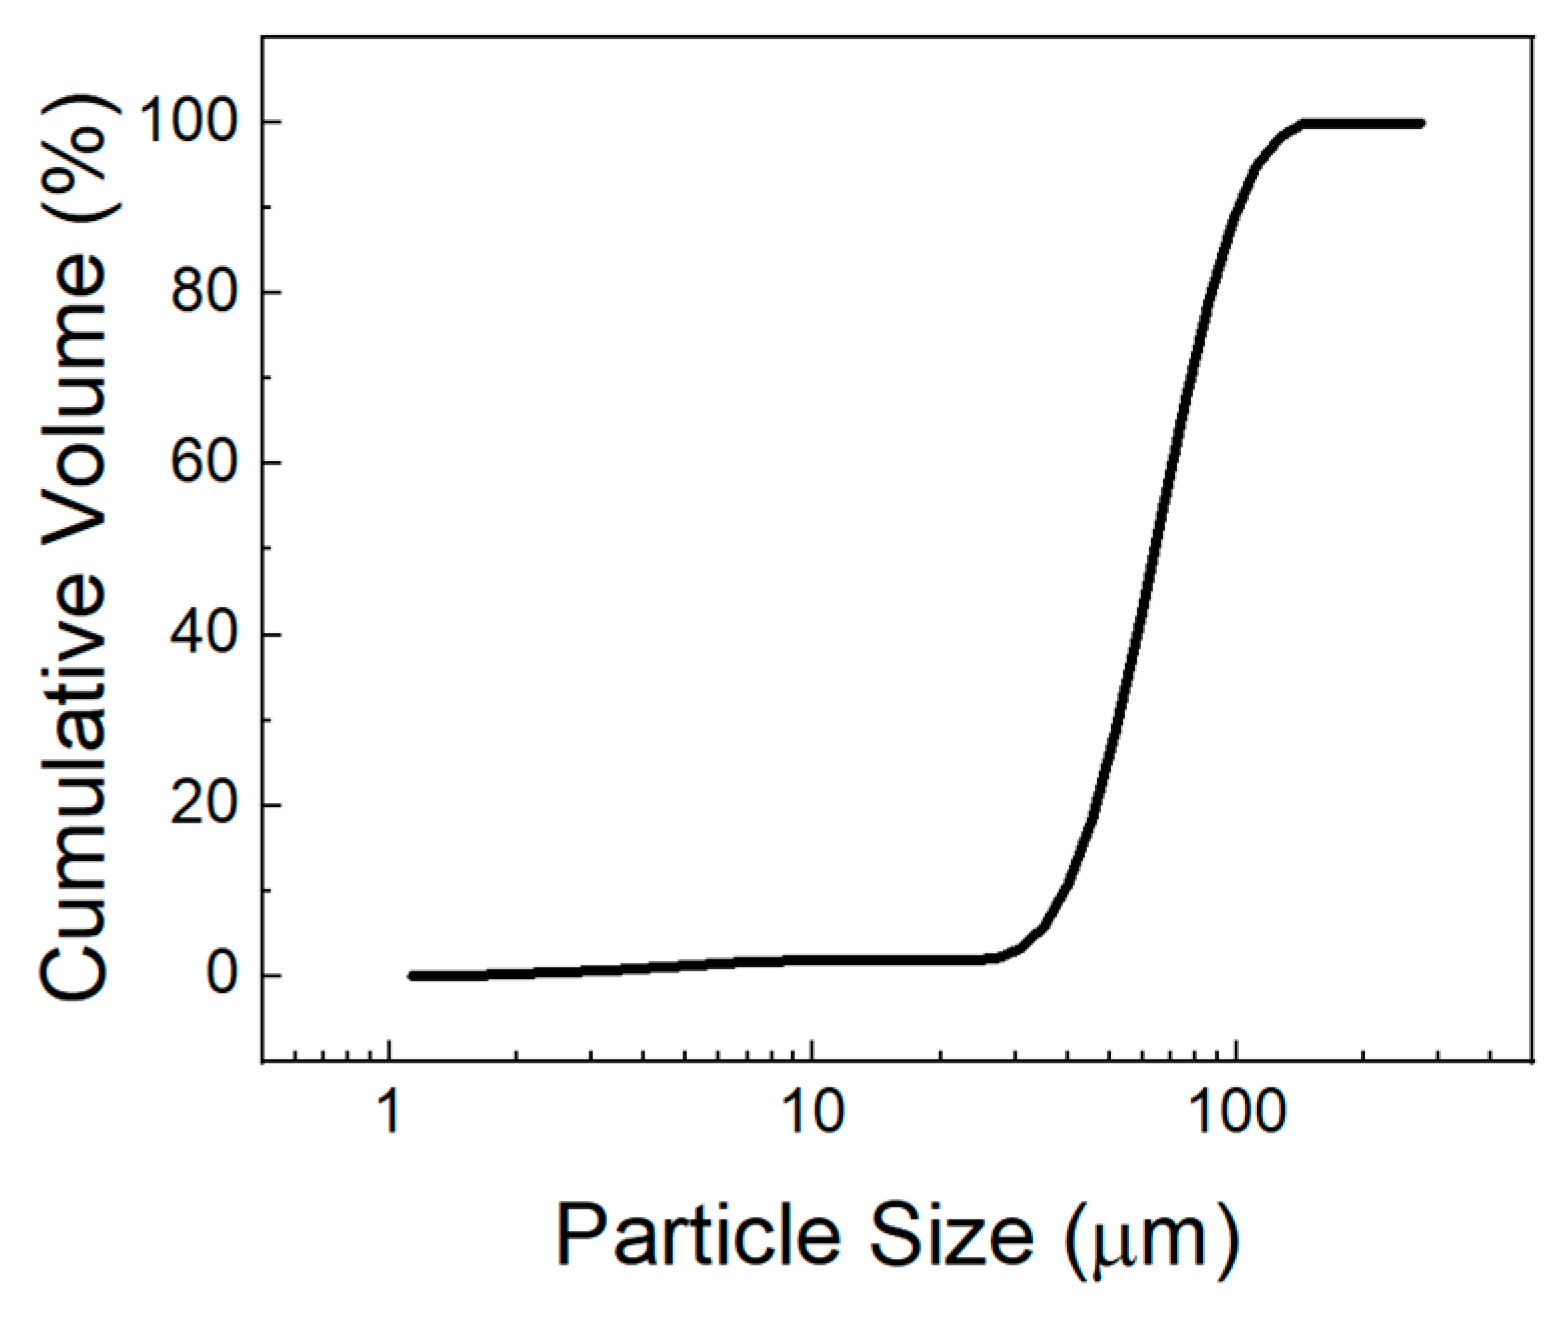
The quartz used in this study was obtained from Yunnan Province, China. The quartz lumps were crushed by a hummer and then were pulverized using a laboratory sample preparation pulverizer (Jiangxi Guangming Intelligent Technology Co., Ltd., Nanchang, China). The pulverized quartz particles were then sieved and the size fraction of −74 + 38 μm was used in the flotation test. The size distribution of quartz was tested by a Mastersizer 3000 (Malvern Instrument Ltd., Malvern, UK), and Figure 1 illustrates the results. The surfaces of quartz particles were cleaned by being soaked in a HCl solution (4 mol/L) for 24 h, which was repeated twice. The cleaned quartz particles were rinsed by deionized water until the pH of the cleaning water was 7, which was followed by being dried in an oven at 90 °C for 12 h. The purification of the quartz particles was 99.74%.
The water used in this study was deionized water with a conductivity of 0.054 μS/cm. Sodium hydroxide (NaOH, analytical reagent) was obtained from Tianjin Fuchen Chemical Co., Ltd. China. Calcium oxide (CaO, ≥98%), sodium oleate (NaOL, ≥98%), nonylphenol ethoxylate (NP-10, ≥99.5%) and fatty alcohol ethoxylates (AEO-9, chemically pure) were obtained from Beijing Honghu Lianhe Huagong Chanpin Co., Ltd., Beijing, China. Octylphenol ethoxylate (OP-10, chemically pure) was obtained from Tianjin Bailunsi Biotechnology Co., Ltd, Tianjin, China. The information on NaOL, OP-10, NP-10 and AEO-9 is listed in Table 1.
2.2. Flotation Test
The flotation tests were carried out on a 50 mL hanging grooved XFGCⅡ laboratory flotation machine (Jilin Exploration Machinery Plant, Jilin, China) at room temperature (25 °C), where 2.0 g quartz particles (−74 + 38 μm) and 30 mL deionized water were added to the flotation cells, which were stirred at 1992 r/min. NaOH solution (75 mg/L) was added to adjust the pH to 11.5, and the pulp was stirred for 3 min. Then 1.5 mg CaO (50 mg/L) was added to the pulp and was stirred for another 3 min to activate the quartz particles. After that, 6.0 mg NaOL (200 mg/L) with different amounts of alcohol ethoxylates (OP-10, NP-10 and AEO-9) was added to the pulp as the collector, which was also stirred for 3 min. The froths were collected at the air flow rate of 1 L/min for 4 min, during which a moderate amount of deionized water was added to make sure the froths could be collected. The collected froth and the tailings were filtrated and dried separately, and then their mass was measured to calculate the quartz recovery.
2.3. Fourier-Transform Infrared Spectroscopy (FTIR) Measurement
The FTIR spectra of the quartz surface was performed on a Nicolet™ iS50 FTIR Spectrometer (Thermo Scientific™, Waltham, MA, USA) at room temperature (25 °C). Cleaned quartz particles were grinded to −5 μm using an onyx mortar. 0.2 g quartz particles (−5 μm) were added to a 100 mL beaker with 50 mL deionized water, and then NaOH (300 mg/L) was added to adjust the pH to 11.5 followed by adding CaO (50 mg/L), NaOL (150 mg/L) or NaOL (150 mg/L) + OP-10/NP-10/AEO-9 (7.5 mg/L) in order. The modified quartz particles were filtered and dried after being stirred for 30 min. Quartz particles (1 wt%) were mixed with spectroscopic grade KBr. The wavenumber range of the spectra was 500–4000 cm−1.
2.4. Quartz Crystal Microbalance with Dissipation (QCM-D) Measurement
The QCM-D was conducted on a QSense Explorer (Biolin Scientific, Gothenburg, Sweden) at room temperature (25 °C), and the QSense Silicon dioxide sensor (f0 = 5 Hz) was employed. The sensor and chamber were cleaned using ethanol and deionized water in order, and then were dried by N2 before use. The system first ran under dry conditions with no liquid injected into the module. When the signal became stable, deionized water was injected into the system at the flow rate of 100 μL/min for a baseline measurement. Then CaO (50 mg/L) solution (pH was adjusted to 11.5), NaOL (150 mg/L) or NaOL (150 mg/L) mixed with OP-10/NP-10/AEO-9 (7.5 mg/L) were pumped in at a flow rate of 100 μL/min to obtain the data for the frequency shift Δf and dissipation shift ΔD. QSense Dfind software was employed to analyze the data and obtain the adsorbed mass.
2.5. Contact Angle Measurement
The contact angle of the quartz surface was measured on a Drop Shape Analyzer DSA100S (Kruss, Germany) at room temperature (25 °C). A piece of pure quartz lump was sliced, polished, cleaned using ethanol and dried in order. The quartz lump with a smooth and clean surface was soaked in the solution containing 300 mg/L NaOH, 50 mg/L CaO, 150 mg/L NaOL (or 150 mg/L NaOL + 7.5 mg/L OP-10//NP-10/AEO-9) for 30 min. Then the quartz lump was dried and put on the Drop Shape Analyzer to carry out the contact angle measurement using the sessile drop method.
2.6. Surface Tension Measurement
The surface tension (γ) of the surfactant solution was measured by a Force Tensiometer K100 (Kruss, Germany) using the ring tear-off method at room temperature (25 °C). The container was cleaned using ethanol and then dried before adding the surfactant solution. The ring was burnt by a spray gun before use. The solution to be tested was put in the cleaned container. The ring was soaked in the solution horizontally at first, and then the ring was gently pulled out of the solution. A layer of water film formed on the ring when it was out of the solution. As the ring was pulled out, the surface tension on the water-air interface held back the ring, and the pulling force of the ring reached the maximum when the water film on the ring was torn off. The maximum pulling force was recorded, based on which, the surface tension was obtained. The surface tension of the NaOL and alcohol ethoxylates (OP-10, NP-10, AEO-9) solution of different concentrations in a pure state and in a mixed state (0.001 wt% NaOL + alcohol ethoxylates of different concentration) was measured, which was repeated 5 times for each system, and the average value was adopted.
2.7. Geometry Optimization for Surfactants
All computational works were performed with the Gaussian 16 (Revision C.02) suite of programs [19]. Geometry optimization of OL−, OP-10, NP-10 and AEO-9 was realized by the density functional theory (DFT) using the B3LYP functional in conjunction with the 6-31G* basis set in the gas phase [20]. All optimized structures were confirmed to be real minima by frequency calculations at the same level of theory (no imaginary frequency).
3. Results
3.1. The Synergy Effect of NaOL and Alcohol Ethoxylates in Flotation
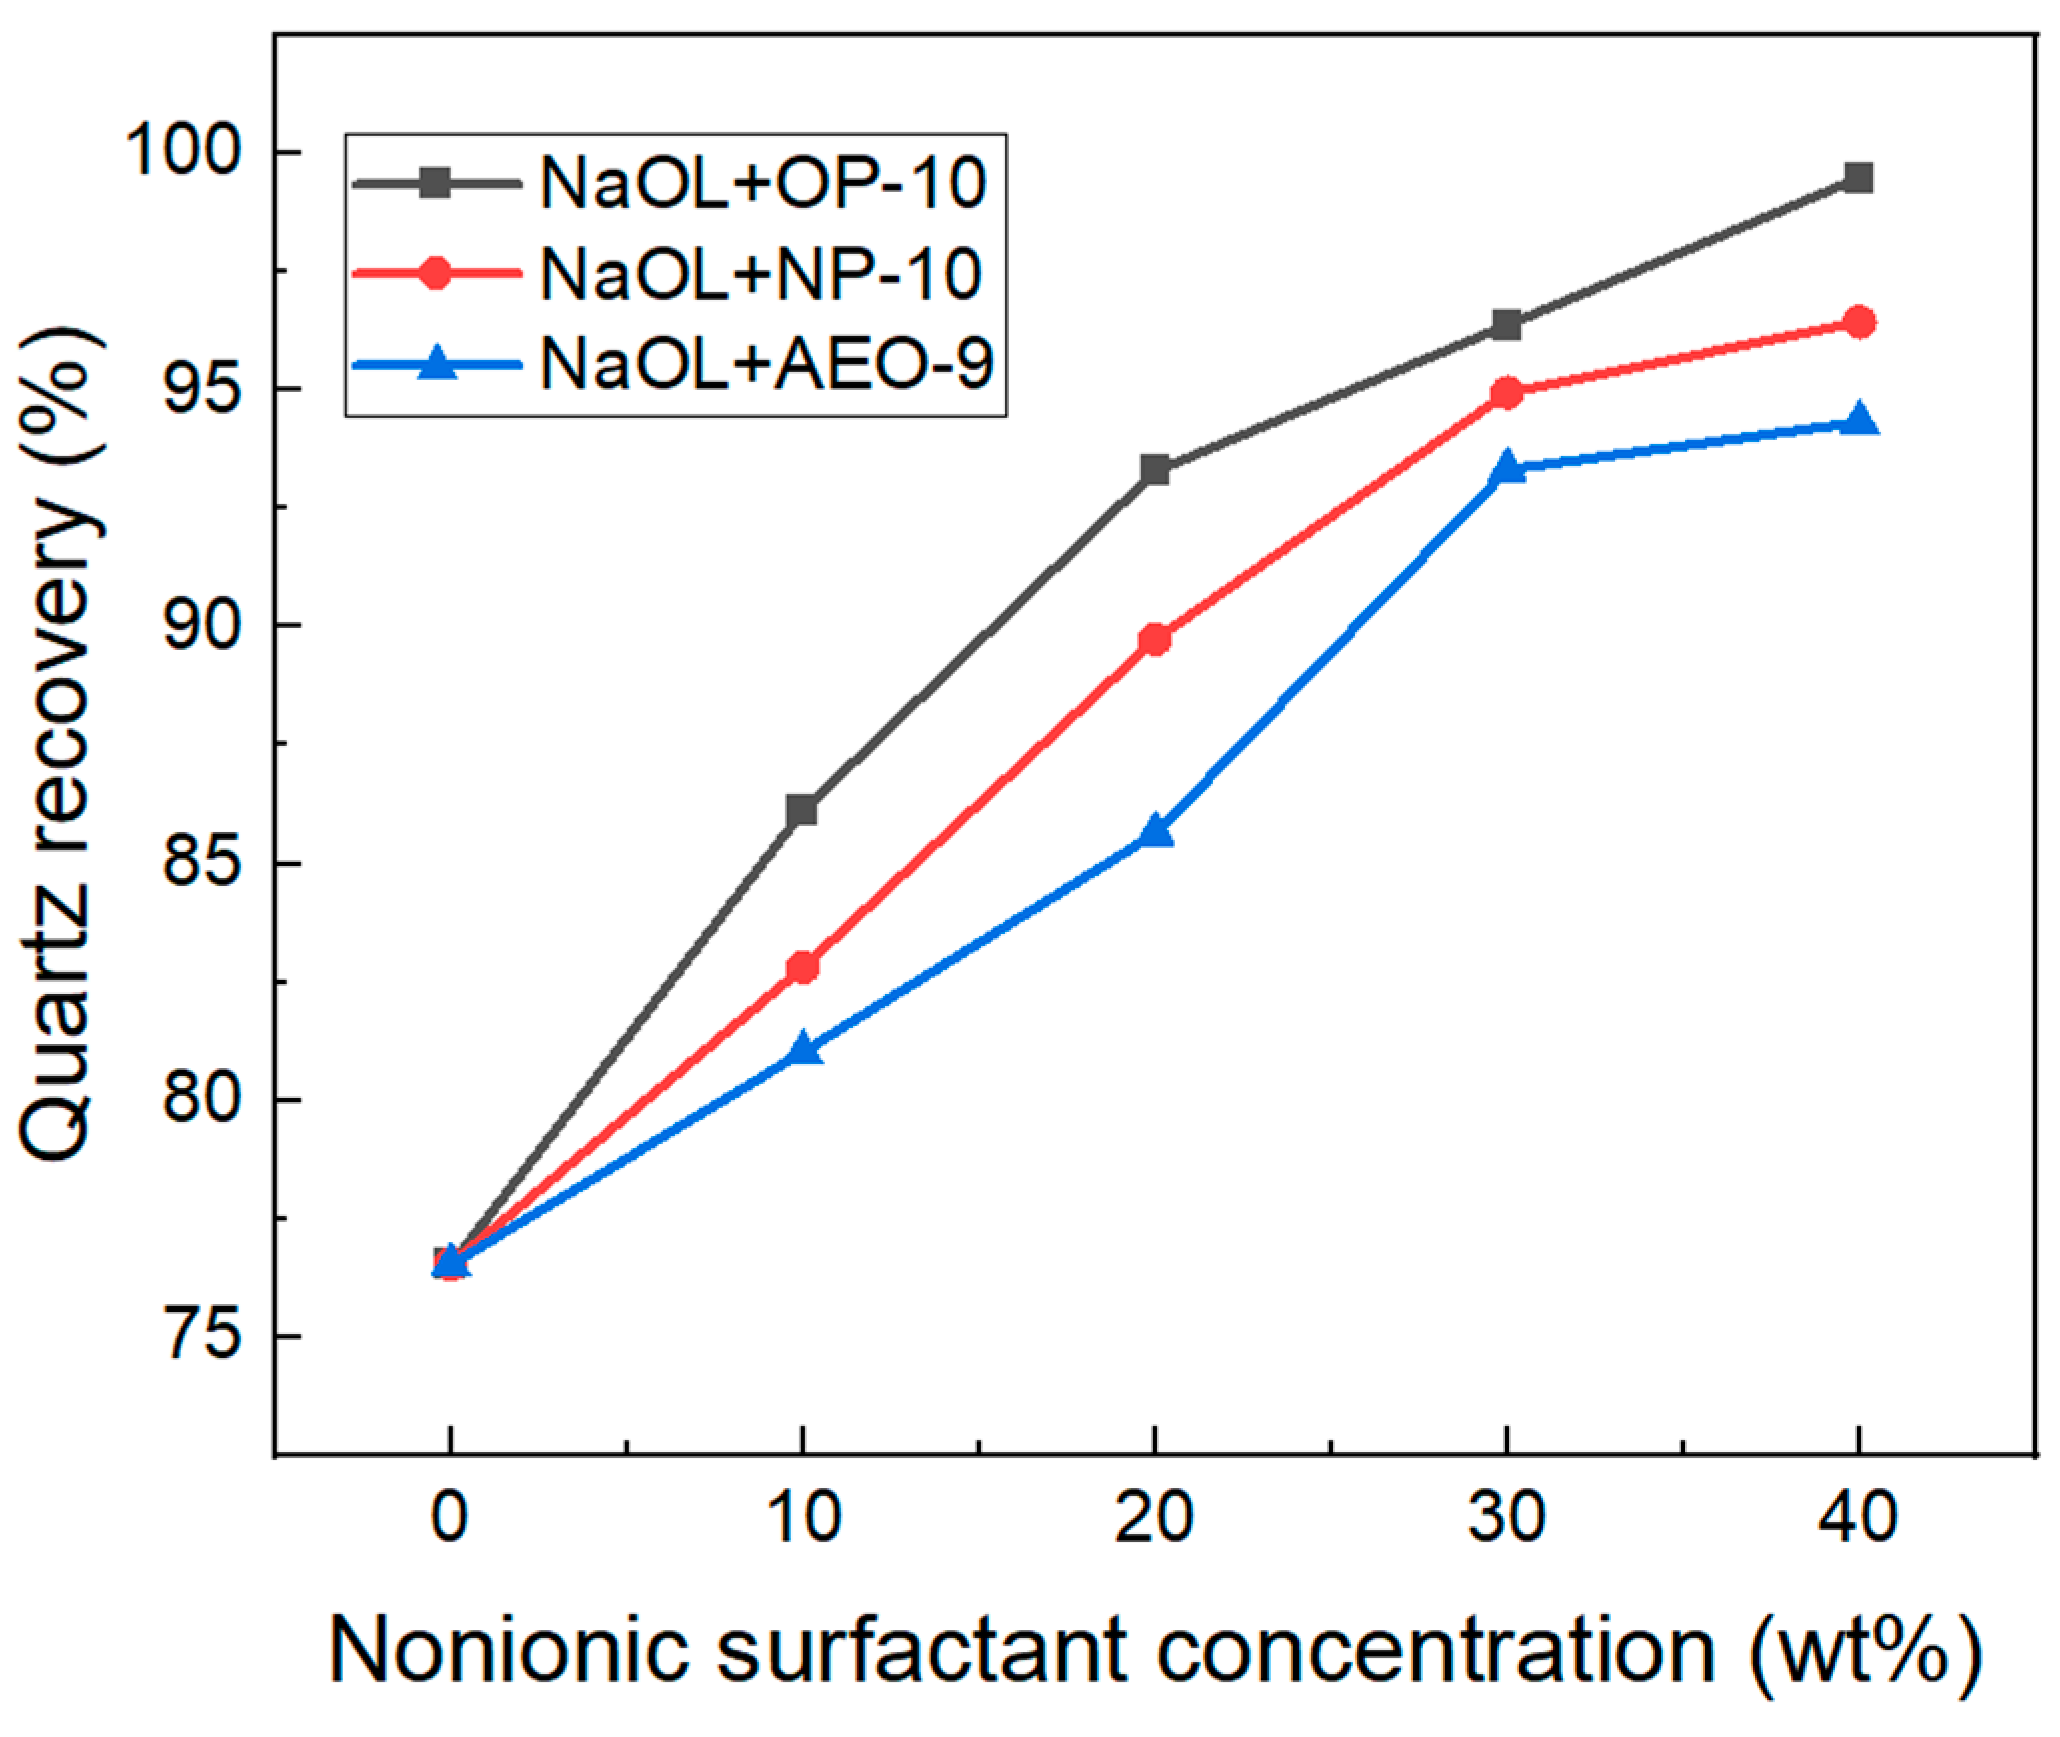
The recovery of quartz particles using NaOL as the collector with different kinds of alcohol ethoxylates is shown in Figure 2. The recovery of quartz was 76.53% when 200 mg/L NaOL was added without alcohol ethoxylates. With an increase in the amount of alcohol ethoxylates from 0 to 40 mg/L, the recovery of quartz increases gradually, and with the synergy of OP-10 the recovery increased the most. The recovery of quartz was 99.50%, 96.45% and 94.33% when 40 mg/L OP-10, NP-10 and AEO-9 was added, respectively. The sequence of the synergy effect was: OP-10 > NP-10 > AEO-9.
It can be clearly seen that the synergy effects between NaOL and three different alcohol ethoxylates all performed well; namely, alcohol ethoxylates improved the performance of NaOL as the collector of quartz in flotation.
3.2. FTIR Analysis
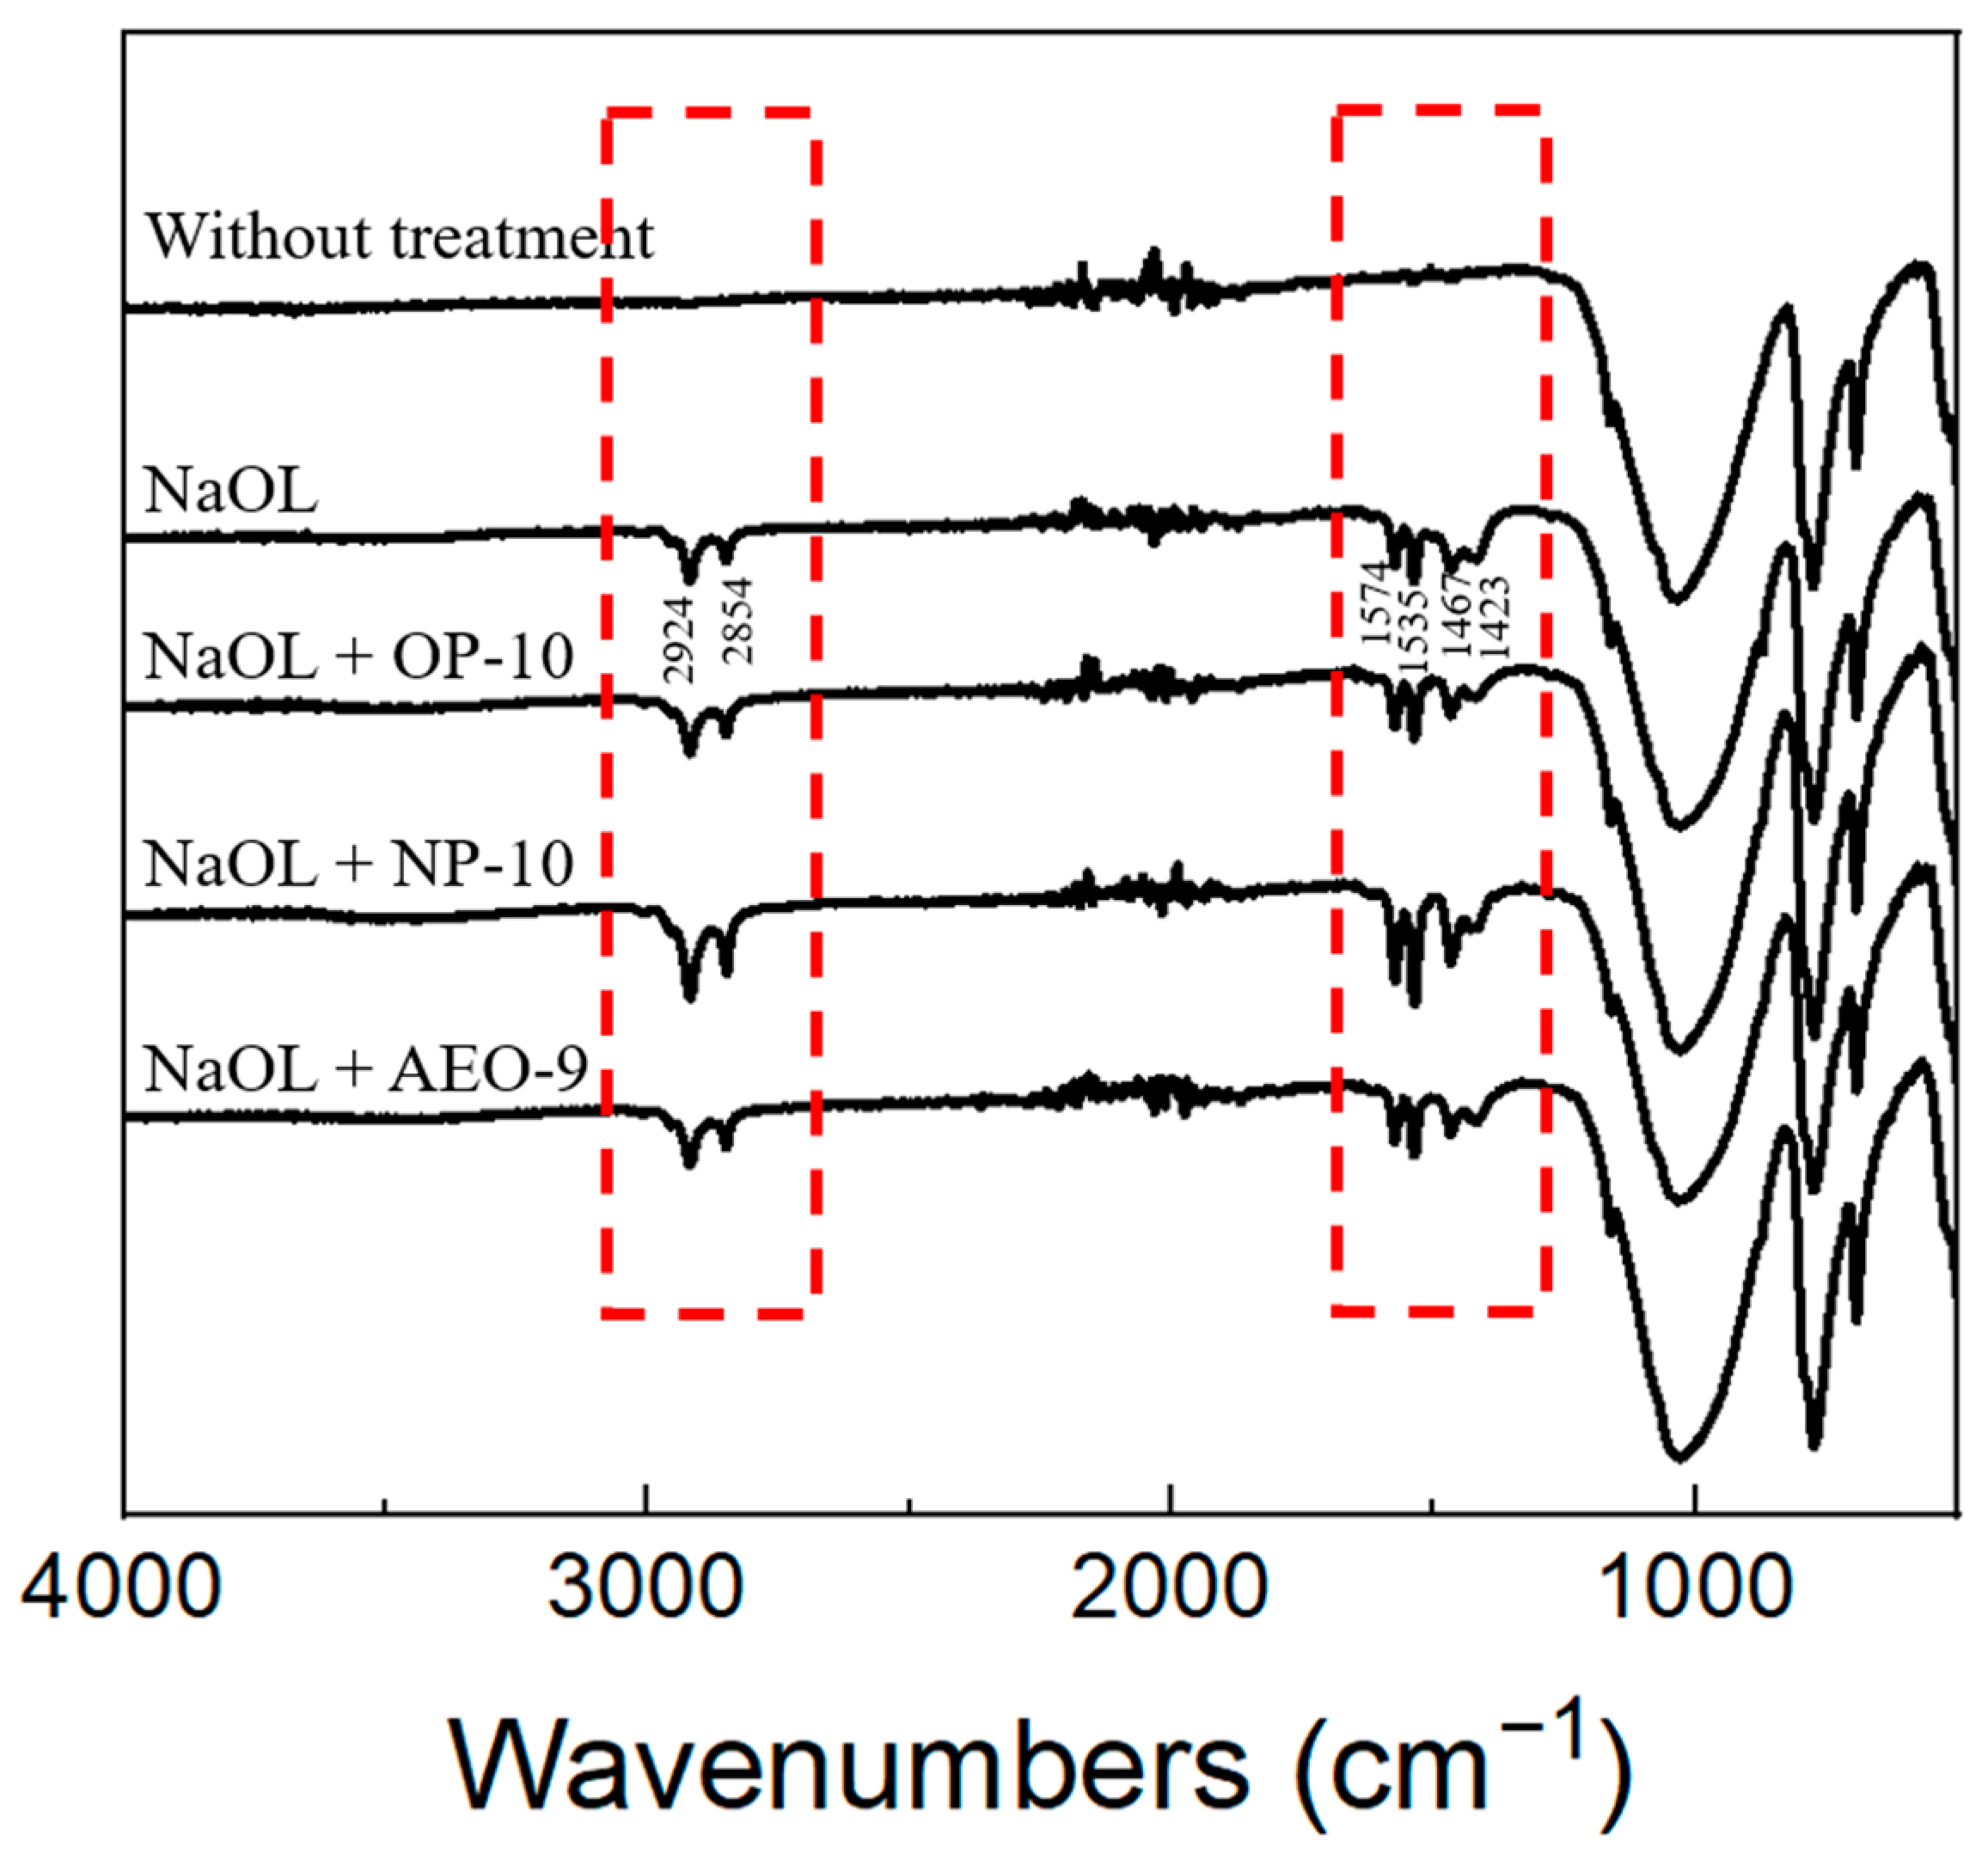
The FTIR spectra of pure quartz and activated quartz conditioned with NaOL or NaOL + alcohol ethoxylate (Figure 3) were conducted to analyze the reaction that happened on the quartz surface in different surfactant systems. Compared with the pure quartz surface, when the activated quartz conditioned with NaOL, bands at 2924 cm−1, 2854 cm−1, 1574 cm−1, 1535 cm−1, 1467 cm−1 and 1423 cm−1 appeared on the FTIR spectra. The bands at 2924 cm−1 and 2854 cm−1 were attributed to the C-H stretching vibration of the -CH2- and -CH3- groups in oleate, respectively. Furthermore, the bands at 1574 cm−1, 1535 cm−1, 1467 cm−1 and 1423 cm−1 were attributed to the -COO- vibration, among which, the band at 1574 cm−1 and 1535 cm−1 can be attributed to the -COOC- asymmetric stretching vibration. The bands at 1467 cm−1 and 1423 cm−1 can be attributed to the -COOC- symmetric stretching vibration [21,22]. All the bands’ information above indicated the adsorption of oleate on the quartz surface and the formation of -Si-O-Ca-OOCR on the Ca2+-activated quartz surface.
For the activated quartz conditioned with NaOL mixed with OP-10/NP-10/AEO-9, no extra peaks appeared on their FTIR spectra, which showed little difference compared to quartz conditioned with pure NaOL. It can be illustrated that the alcohol ethoxylate did not attach on the quartz surface, which meant that the alcohol ethoxylate assisted the adsorption of oleate on quartz instead of attaching on quartz by itself.
3.3. QCM-D Measurement Analysis
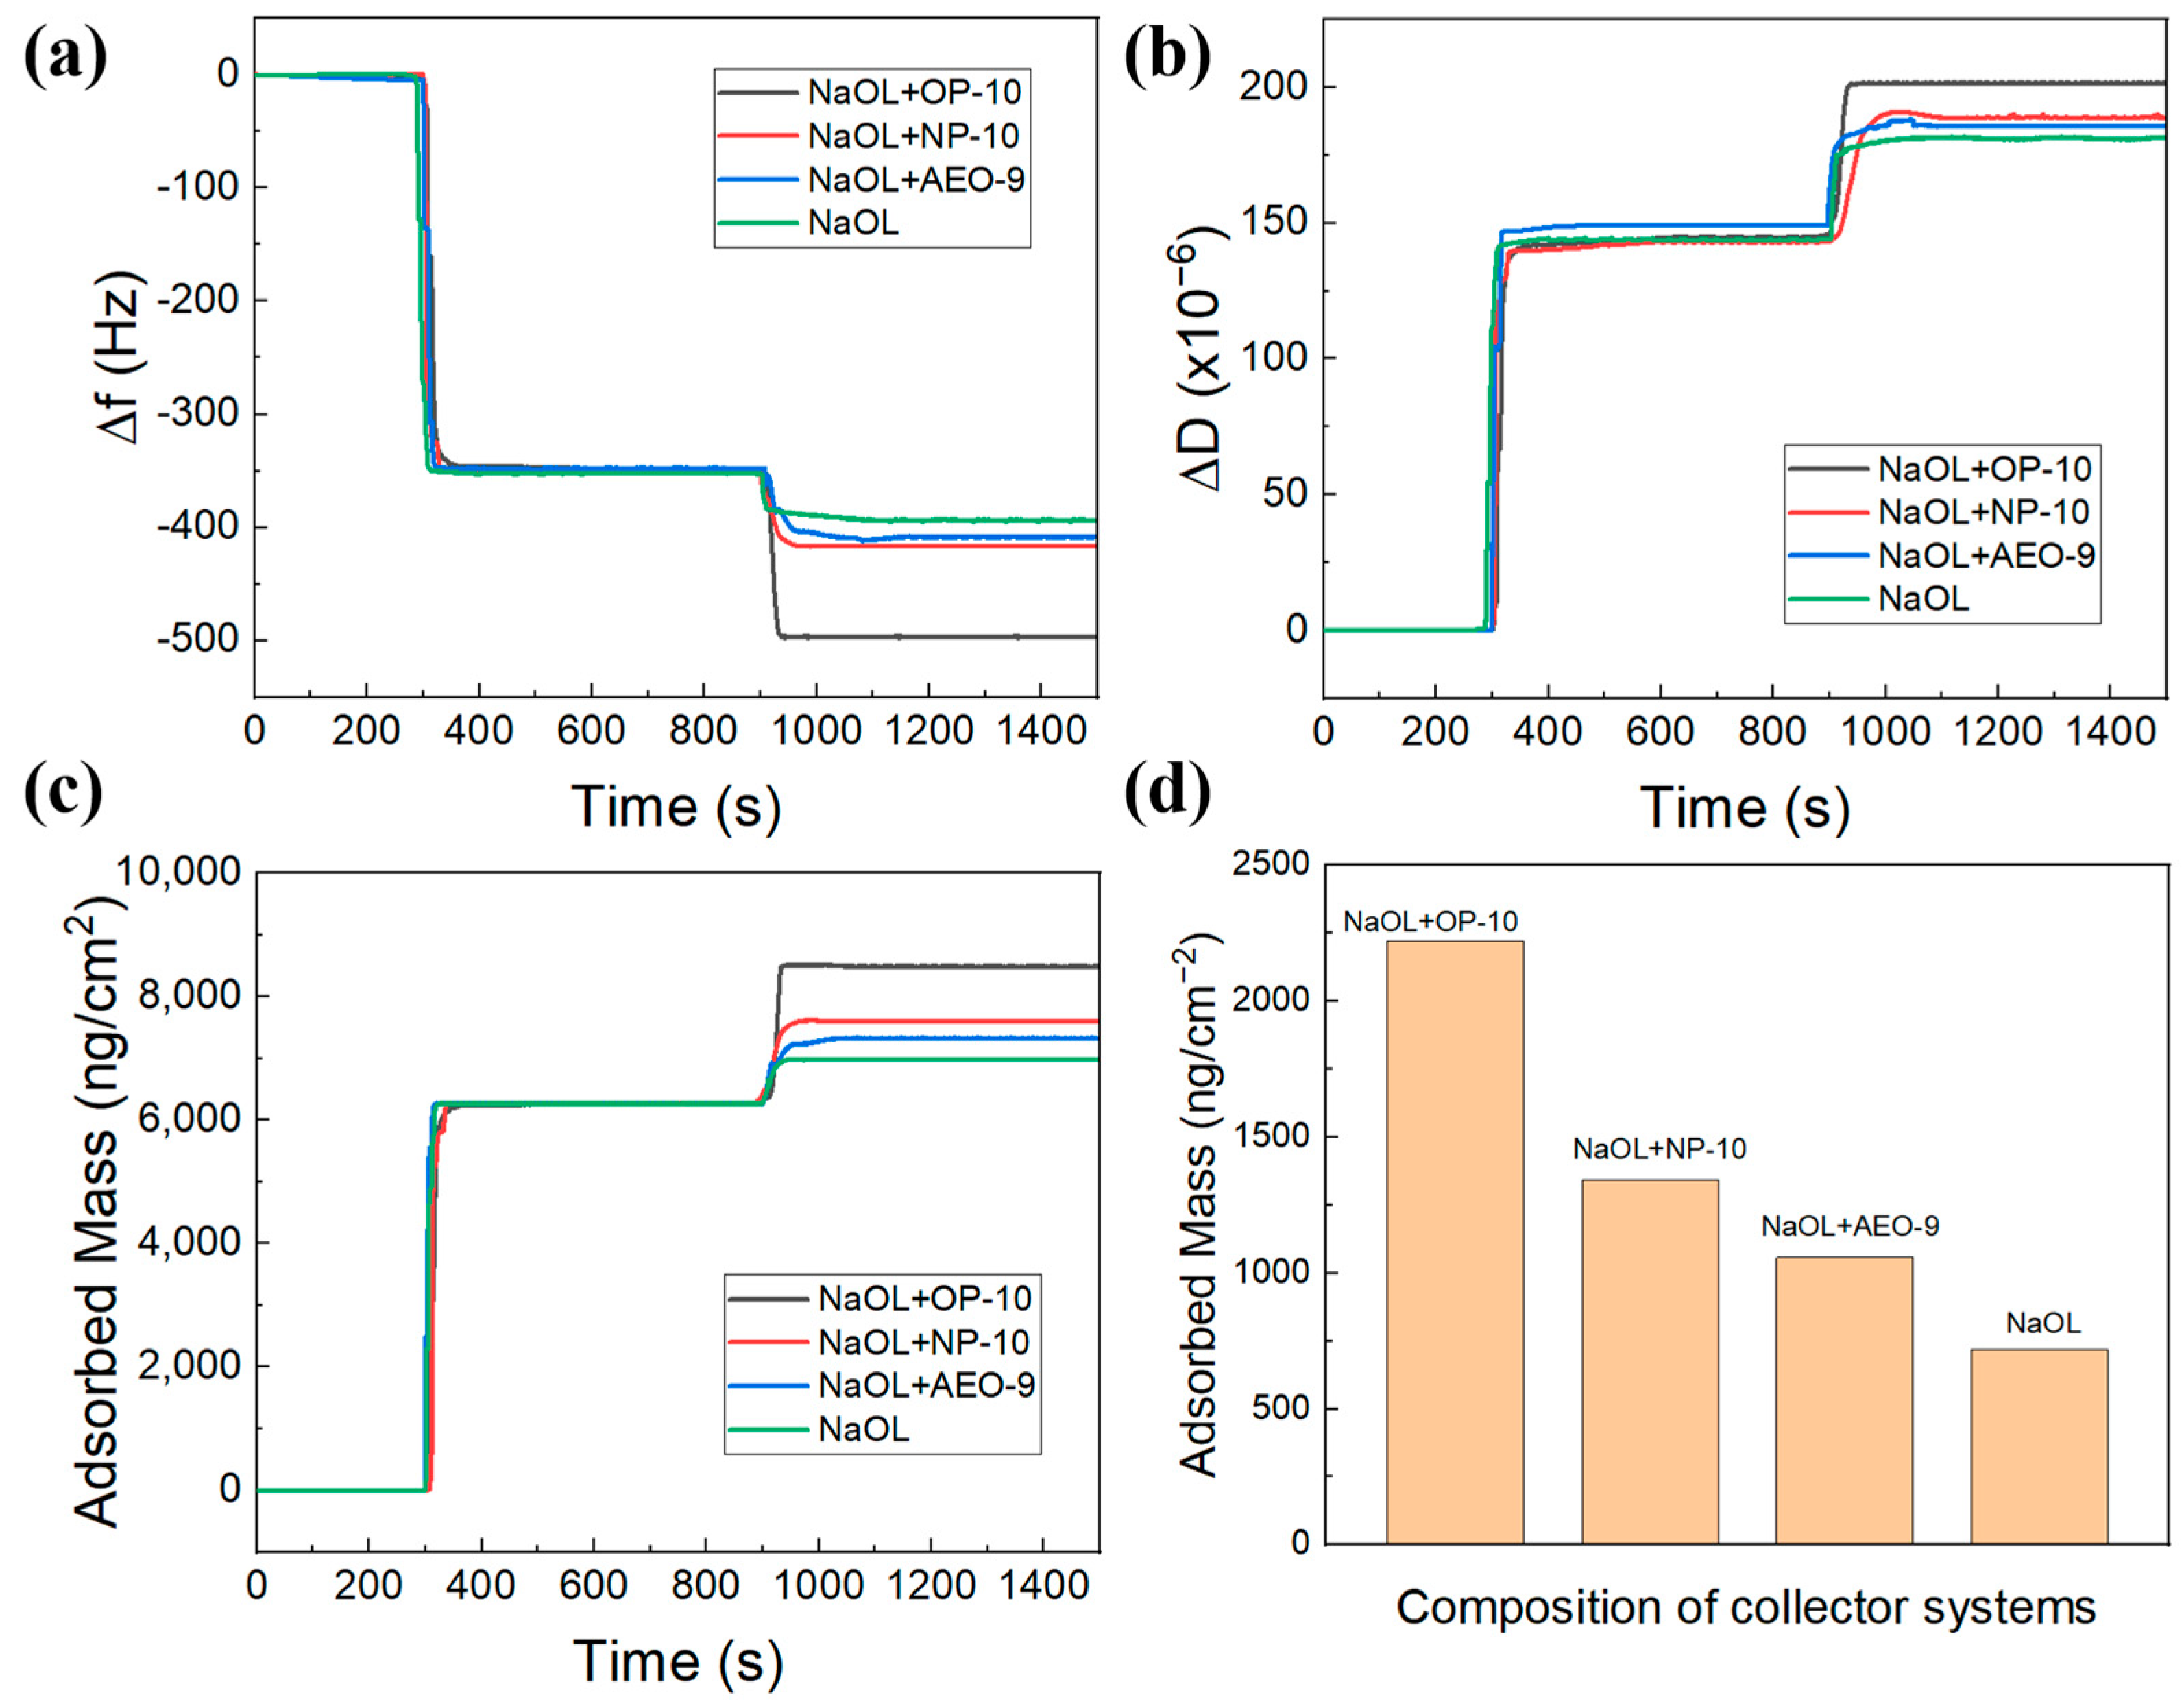
QCM-D is always employed to investigate the behavior of surfactant adsorption in aqueous solutions with sensitivity in the ng/cm2 (submonolayer) region. In addition, it can simultaneously determine changes in frequency (Δf) and energy dissipation (ΔD) of a quartz crystal at nanoscale in real-time and derives valuable in-situ information on adsorbed mass from experimentally obtained data of energy dissipation (ΔD) in relation to frequency shift (Δf) [23].
Figure 4 presents the real-time change in Δf (Figure 4a), ΔD (Figure 4b) and adsorbed mass (Figure 4c) of the Ca2+-activated silicon dioxide sensor associated with different collector systems. After the injection of the CaO solution (0.1 wt%), there was a vertical decrease of Δf and increase of ΔD and adsorbed mass, which was stable at −352 Hz, 1.44 × 10⁻⁴ and 6262 ng/cm2, respectively. Those illustrated that an activation layer was formed on the sensor surface. Then when a different collector was injected, there was also an instant steep decrease of Δf and an increase of ΔD and adsorbed mass, which suggested the adsorption of oleate. The magnitude of the change was different for different collector systems; however, the changes of Δf, ΔD and adsorbed mass had the same order for different collector systems. Compared with the pure NaOL system, the mixed system containing NaOL and alcohol ethoxylate resulted in a larger change in Δf, ΔD and adsorbed mass with the sequence of OP-10 > NP-10 > AEO-9. Figure 4d demonstrates the mass of the oleate adsorption layer when it reacted with different collector systems. With the synergy of OP-10, NP-10 and AEO-9, the oleate adsorption layer reached a density of 2223 ng/cm−2, 1343 ng/cm−2 and 1056 ng/cm−2, respectively.
3.4. Hydrophobicity of Quartz Surface
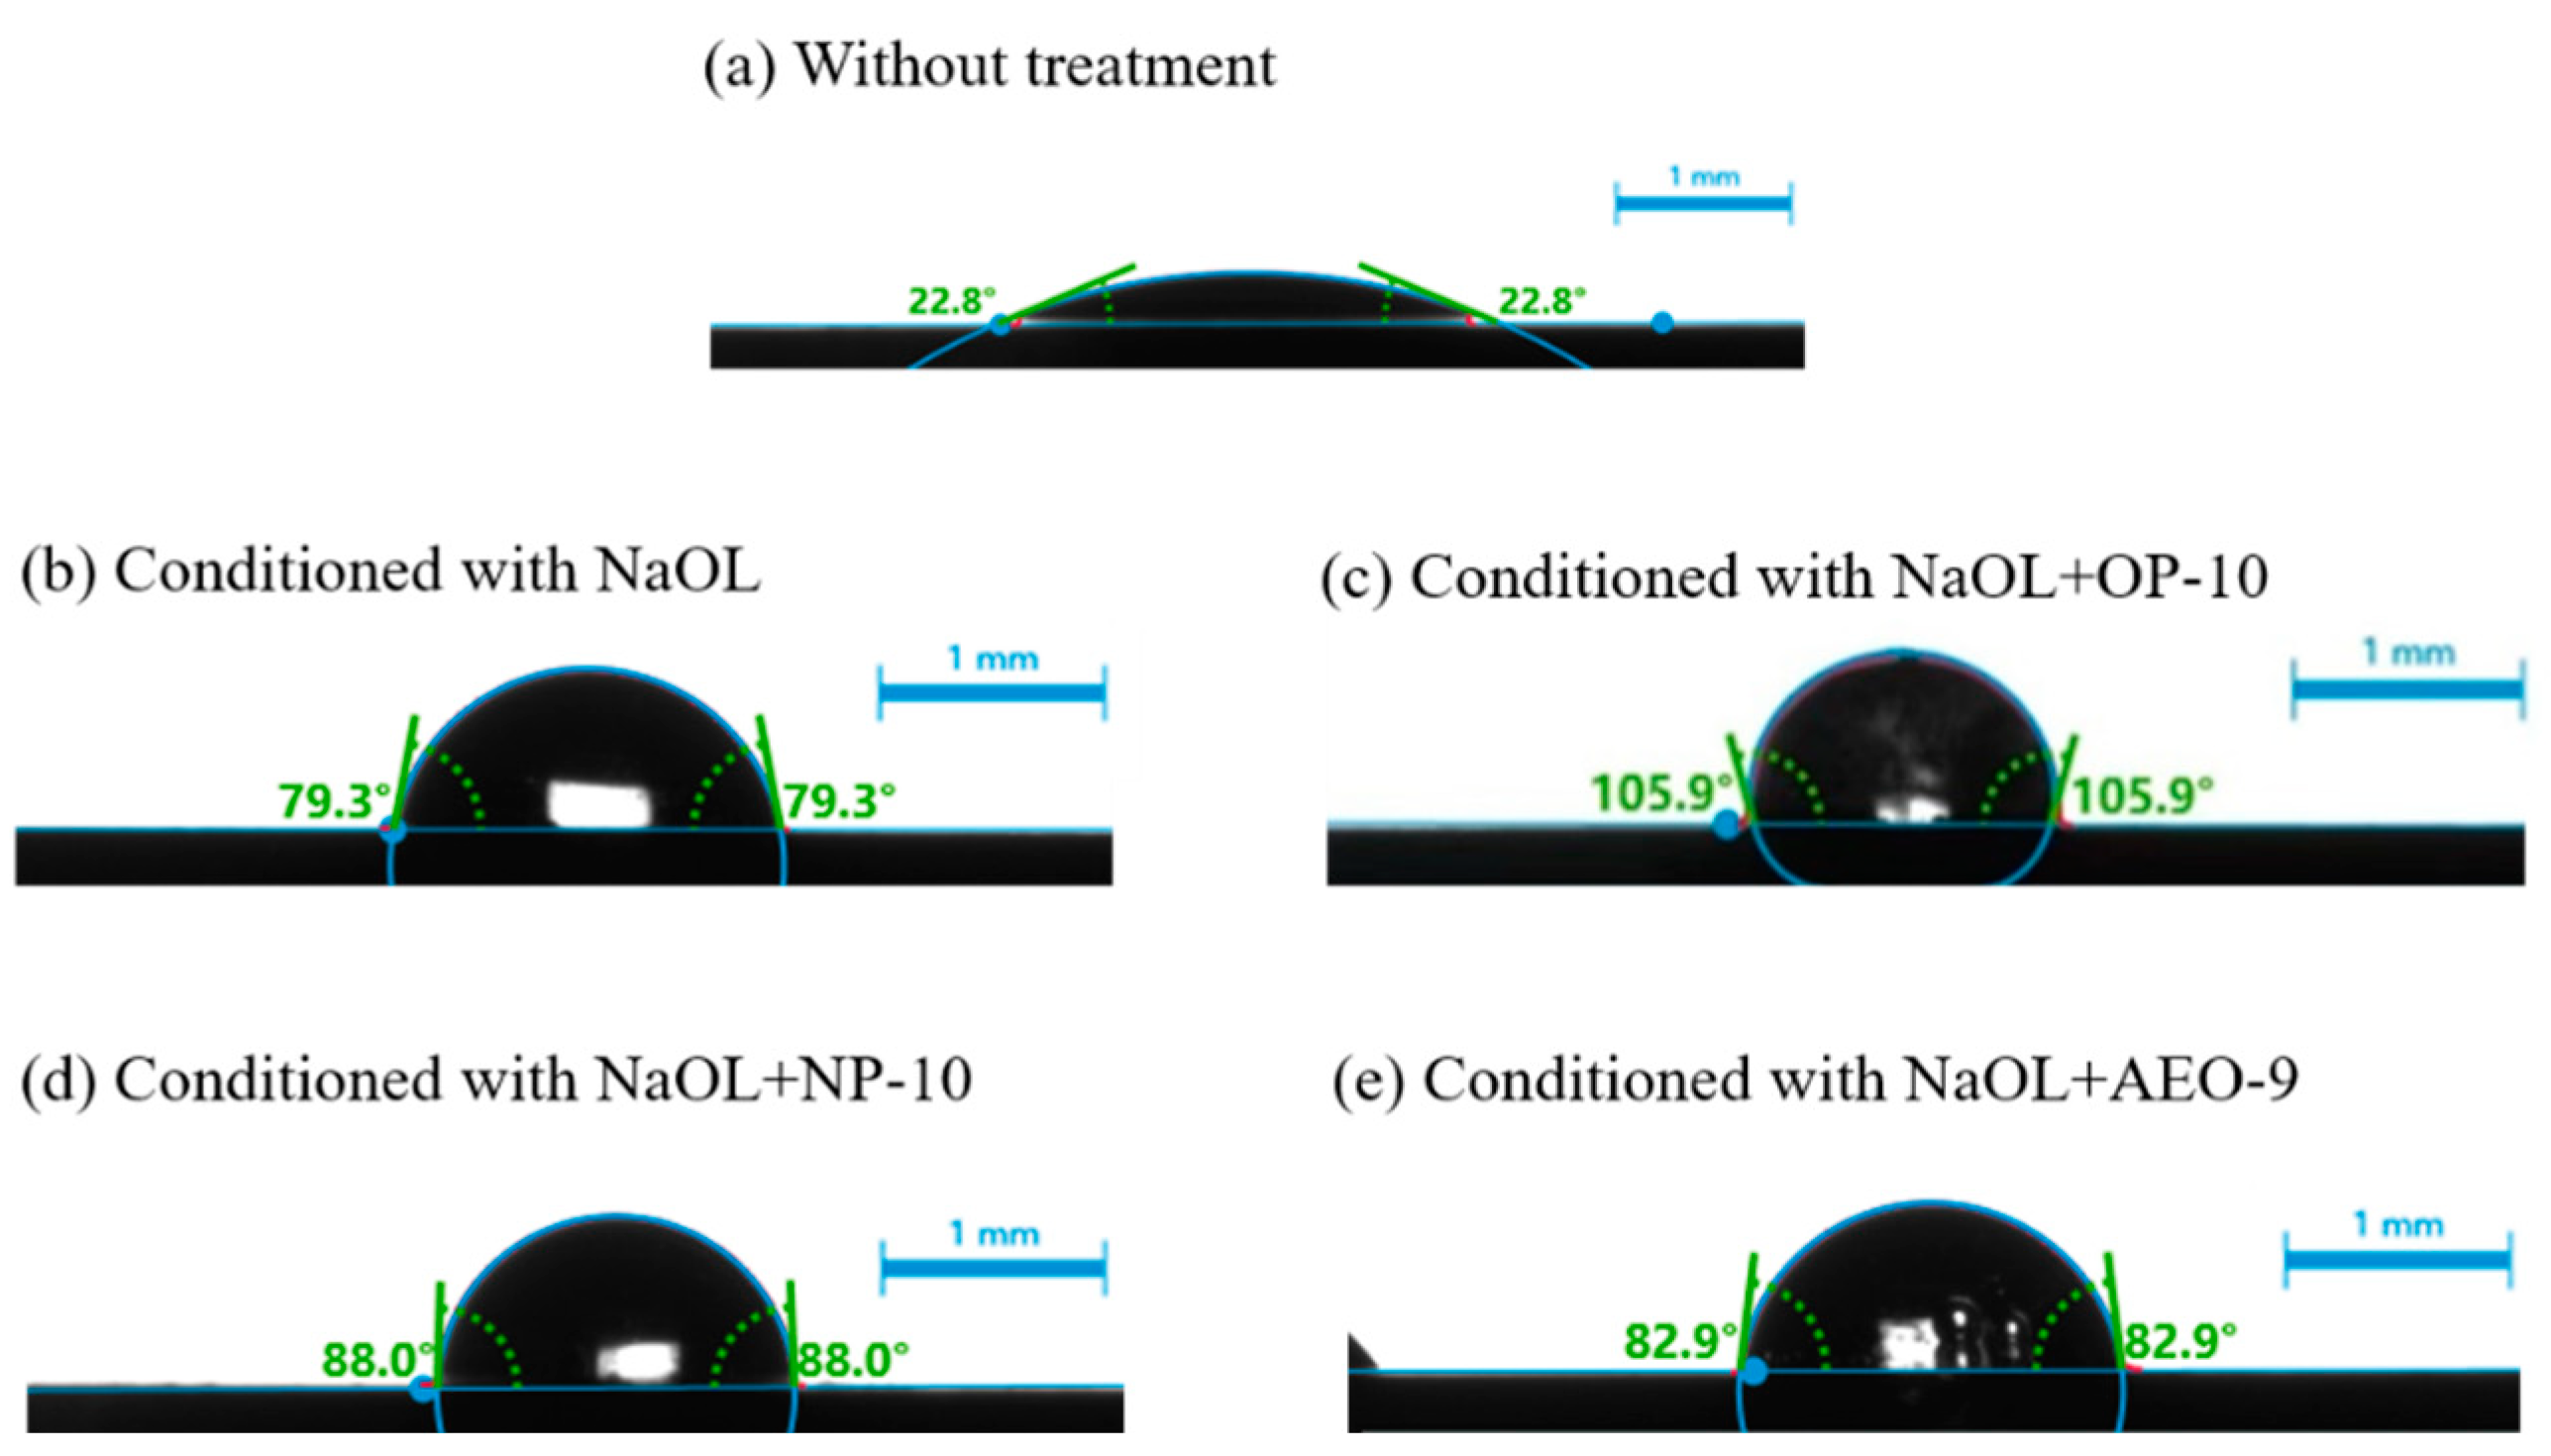
The activation of quartz by Ca2+ is that Ca2+ adsorbs on the quartz surface in the form of Ca(OH)+ and metal hydroxides, which permits the chemical adsorption of NaOL forming calcium oleate on the quartz surface [3,4]. Due to the amphiphility of NaOL, when oleate attached on the quartz surface, the hydrophobic tails were exposed on the quartz surface, which increased the hydrophobicity of quartz. The contact angel represents the wettability of a solid surface, and with the increase of the contact angle, the hydrophobicity of the surface increases, and vice versa. The contact angles of quartz in different conditions were measured (Figure 5). It can be observed straightforward that the pure quartz surface was hydrophilic with a contact angle of 22.8°, but when the activated quartz surface reacted with NaOL, its contact angle increased to 79.3°. When NaOL cooperated with OP-10//NP-10/AEO-9, it made the activated quartz surface more hydrophobic, with a contact angle of 105.9°, 88.0° and 82.9°, respectively, which meant that the sequence of the alcohol ethoxylates’ ability to increase the hydrophobicity of activated quartz was OP-10 > NP-10 > AEO-9, agreeing well with the sequence about quartz recovery in flotation.
From the results above, it can be clearly illustrated that the synergism between NaOL and alcohol ethoxylate assisted the adsorption of NaOL on the Ca2+-activated quartz surface through the chemical reaction between oleate and Ca2+. Since the hydrophilic base COO− of oleate reacts with Ca2+, the hydrophobic base of oleate sticks out of the surface, increasing the hydrophobicity of quartz [7]. With an increase of the amount of NaOL adsorbed on the quartz surface, the increased contact angle of quartz indicated an increase in quartz hydrophobicity. Hydrophobic particles easily attach on bubbles, resulting in a significant increase in froth stability and good flotation recovery [24,25]. Therefore, with an increase in quartz hydrophobicity, the quartz recovery increased.
All the results illustrated that the level of synergism for different alcohol ethoxylates was different. Comparing the results of QCM-D and contact angles of quartz in different mixed surfactant systems, they all showed the same sequence about the magnitude of change compared with that in the pure NaOL system: OP-10 > NP-10 > AEO-9, which corresponded with the sequence in the results of the quartz flotation. Take OP-10 as an example, with the assistant of OP-10, the amount of NaOL attached on the activated quartz surface was the most drawn from the QCM-D results. Correspondingly, the contact angle of quartz in the system of NaOL synergy with OP-10 was the largest. As a result, the quartz recovery in the same flotation system was also the best.
4. Discussion
OP-10, NP-10 and AEO-9 are alcohol ethoxylates composed of a lipophilic group and a hydrophilic group. The HLB value is defined as the ratio of the hydrophilic group to the lipophilic group, indicating whether the surfactant will promote a water-in-oil or an oil-in-water emulsion. The HLB values from 10 to 18 mean that the surfactant is a hydrophilic biosurfactant, which favors an oil-in-water emulsification [26]. The HLB values of the three alcohol ethoxylates are shown in Table 1, which were in the range of 12 to 15 belonging to hydrophilic biosurfactants. In water, as the concentration of a surfactant increases, adsorption takes place at the surface, which reduces the surface tension (γ) until it is fully overlaid; above the critical micellar concentration (CMC), the surfactant tends to self-assemble and forms micelles, which would not reduce the surface tension [27]. The CMCs of NaOL and three alcohol ethoxylates were determined by Figure S1 and the values are shown in Table S1 (see Supplementary Materials). The CMC and surface tension of the mixed system both decreased compared with the NaOL solution. The mole fractions of NaOL in the mixed micelle () and interaction parameter (βm) can be calculated by the regular solution theory (RST) [13,14,28,29].
The calculation of mole fractions of NaOL in the mixed micelle () used the Equation (1) [13,30]:
where y1 is the bulk mole fraction of NaOL in the mixed solution, CMC1 is the measured CMC of NaOL in the pure state, CMC2 is the measured CMC of alcohol ethoxylates in the pure state and CMC12 is the measured CMC in the mixed system between NaOL and alcohol ethoxylate.
Based on the calculated values of (see Supplementary Materials, Table S2), the interaction parameter (βm) can be calculated by Equation (2) [13,14,30]:
The calculated values of βm (see Supplementary Materials, Table S2) for the three mixture systems were all negative (<0).
The calculated values of (see Supplementary Materials, Table S2) for the three mixture systems were all <1. βm < 0 and < 1 confirmed an attractive behavior between NaOL and the alcohol ethoxylate, showing the high interaction between them [30].
Surface excess concentrations (Γ) in mol/cm2 and minimum area per molecule (Amin) in Å2 at the air/aqueous solution interface for both individual surfactants and surfactant mixtures can be calculated by Equations (4) and (5) [13,28,29]:
where (∂γ/∂logC)T is the slope in the γ versus log C plot (see Supplementary Materials, Figure S1), T is the absolute temperature, R is 8.314 J/(mol·K) and N is Avogadro’s number. The calculated Amin is listed in Table S1, which shows that with the synergy of alcohol ethoxylate, the minimum area per NaOL molecule increased, meaning that the NaOL molecule showed expansion at the air/aqueous interface or in the micelle when mixed with alcohol ethoxylate.
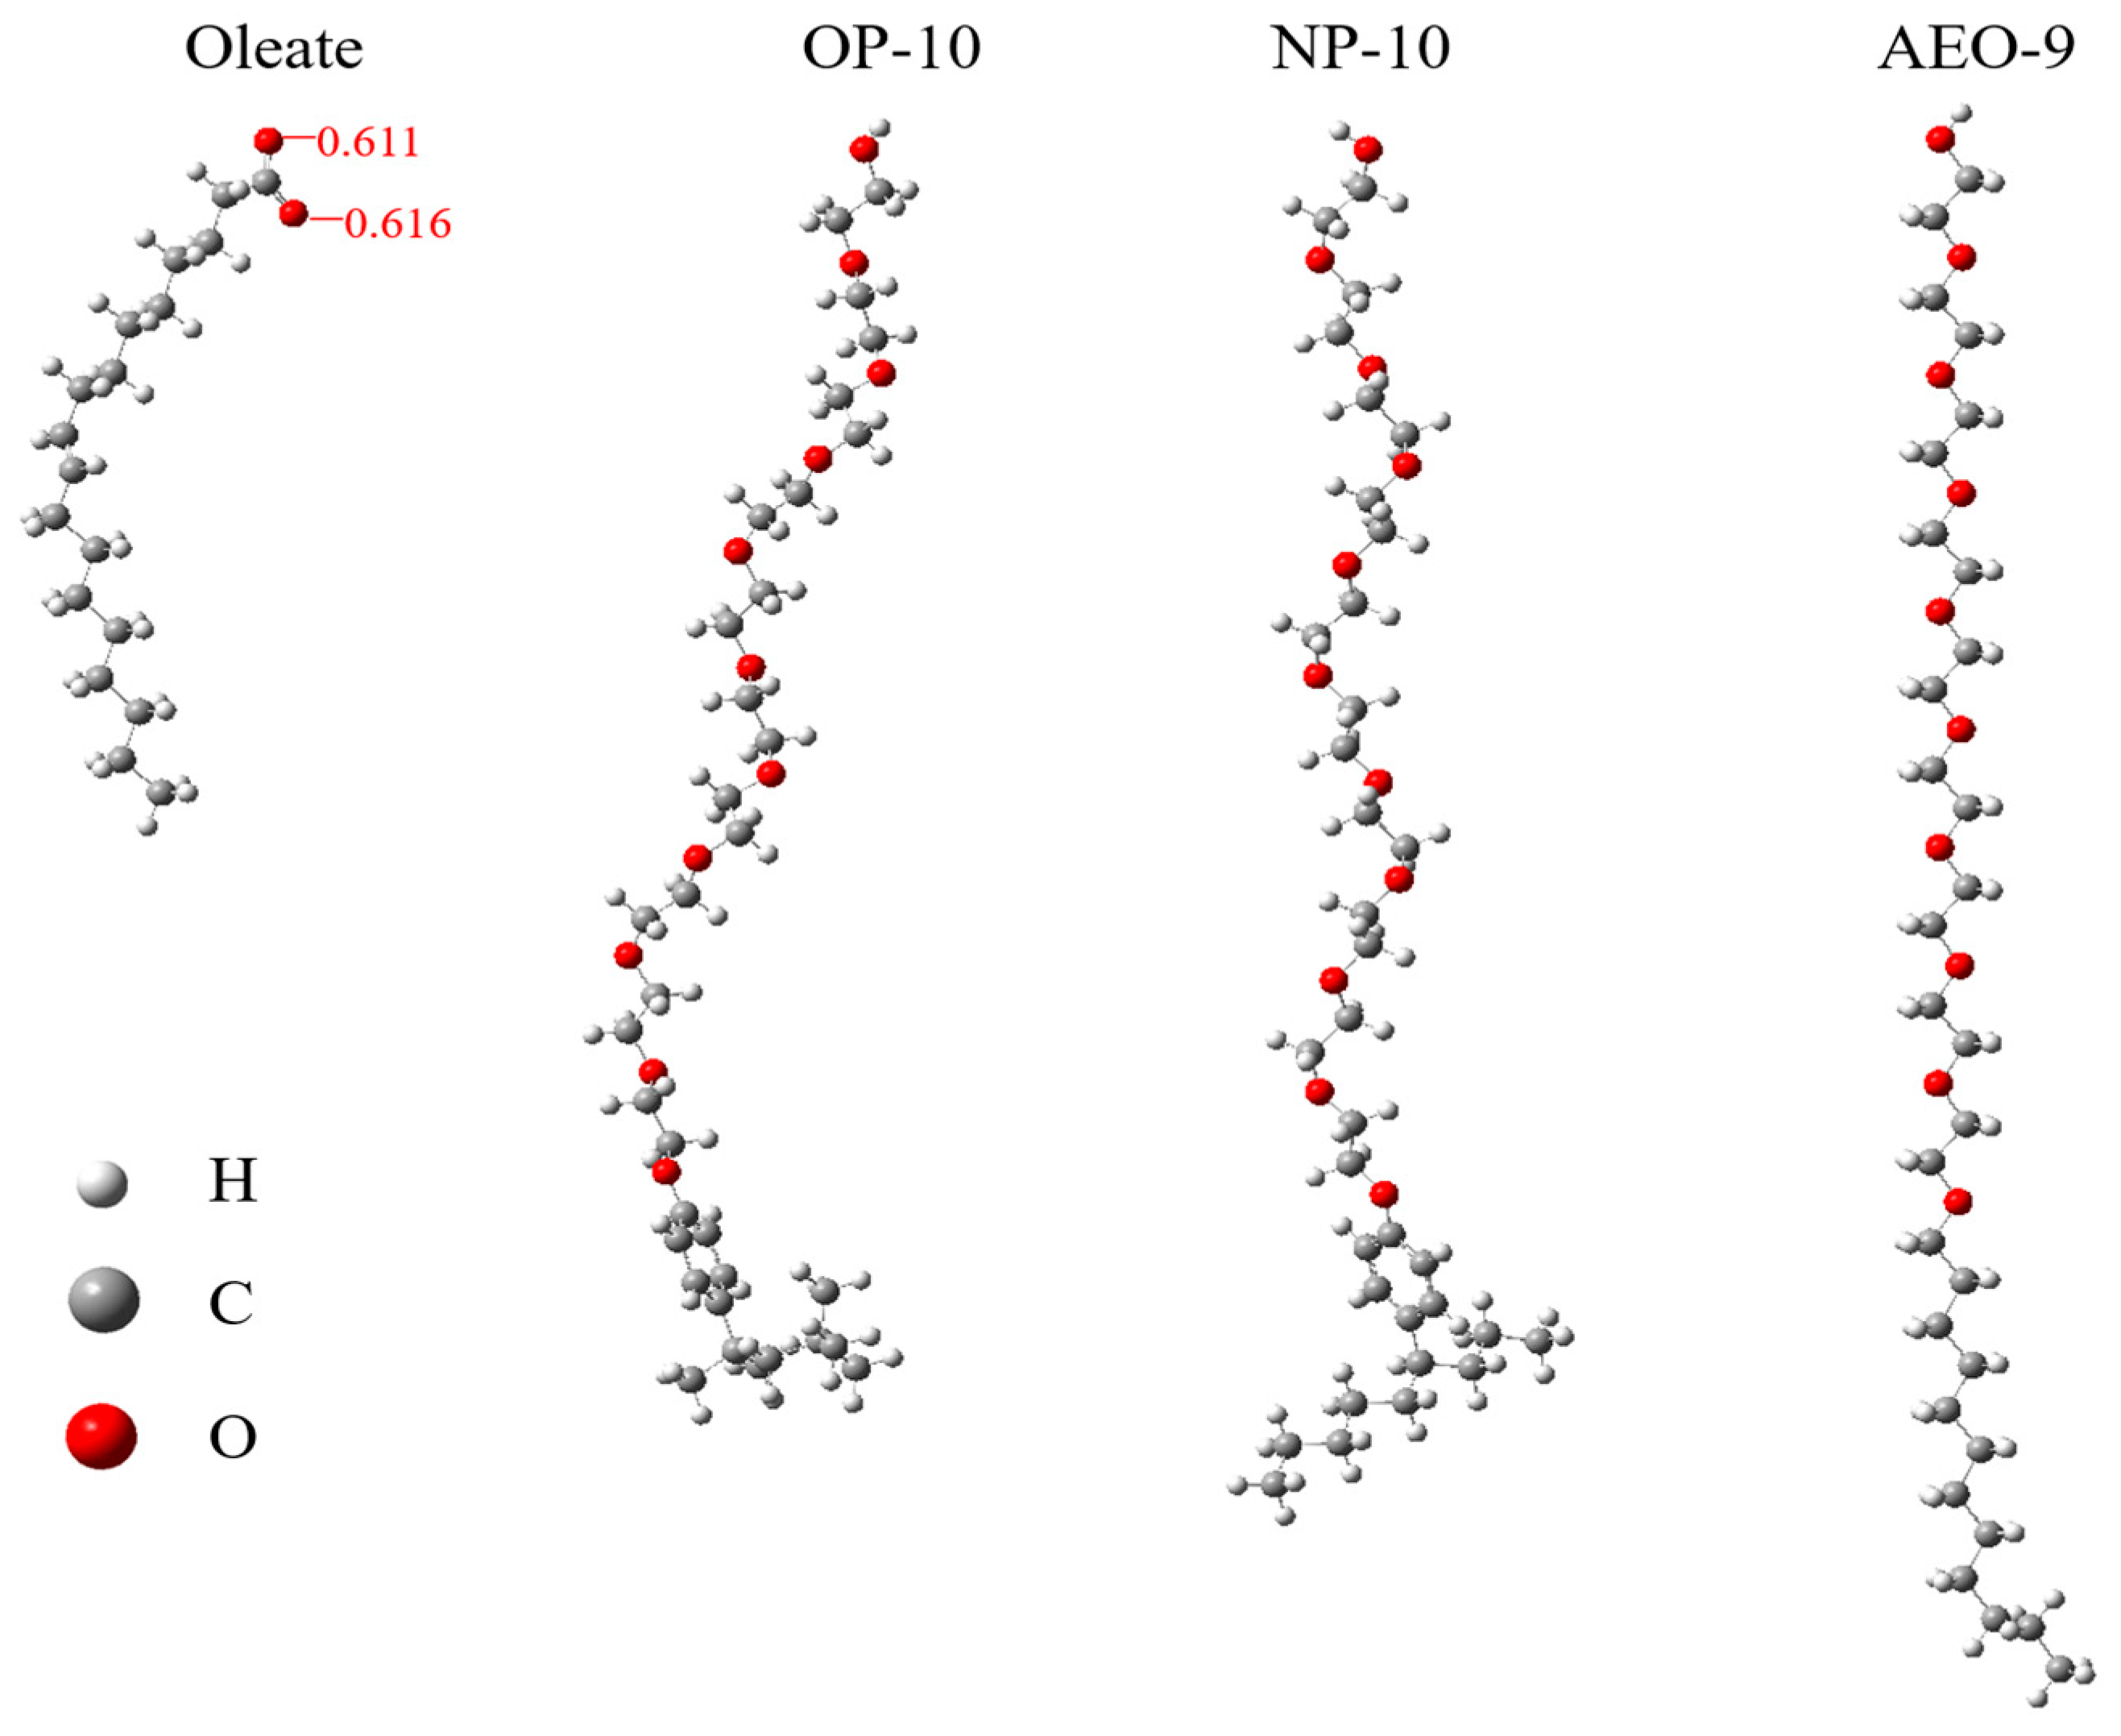
The calculated interaction parameter (βm) for the mixed system of NaOL and OP-10/NP-10/AEO-9 was less than 0, indicating that the interactions between the NaOL and alcohol ethoxylates are more attractive or less repulsive than before mixing. The geometry structures of OL−, OP-10, NP-10 and AEO-9 are presented in Figure 6, based on which, it can be evidently observed that the two O atoms in OL− were negative charged with −0.611 and −0.616 (Mulliken atomic charge), respectively. Therefore, before mixing, negatively charged oleate has a strong electrostatic self-repulsion. For the alcohol ethoxylates (OP-10, NP-10 and AEO-10), their molecular length was larger than that of oleate, and for OP-10 and NP-10, they have branches in the hydrophobic groups, so they have a steric self-repulsion before being mixed with NaOL. However, after mixing, both of these repulsions are weakened by a dilution effect [28,31].
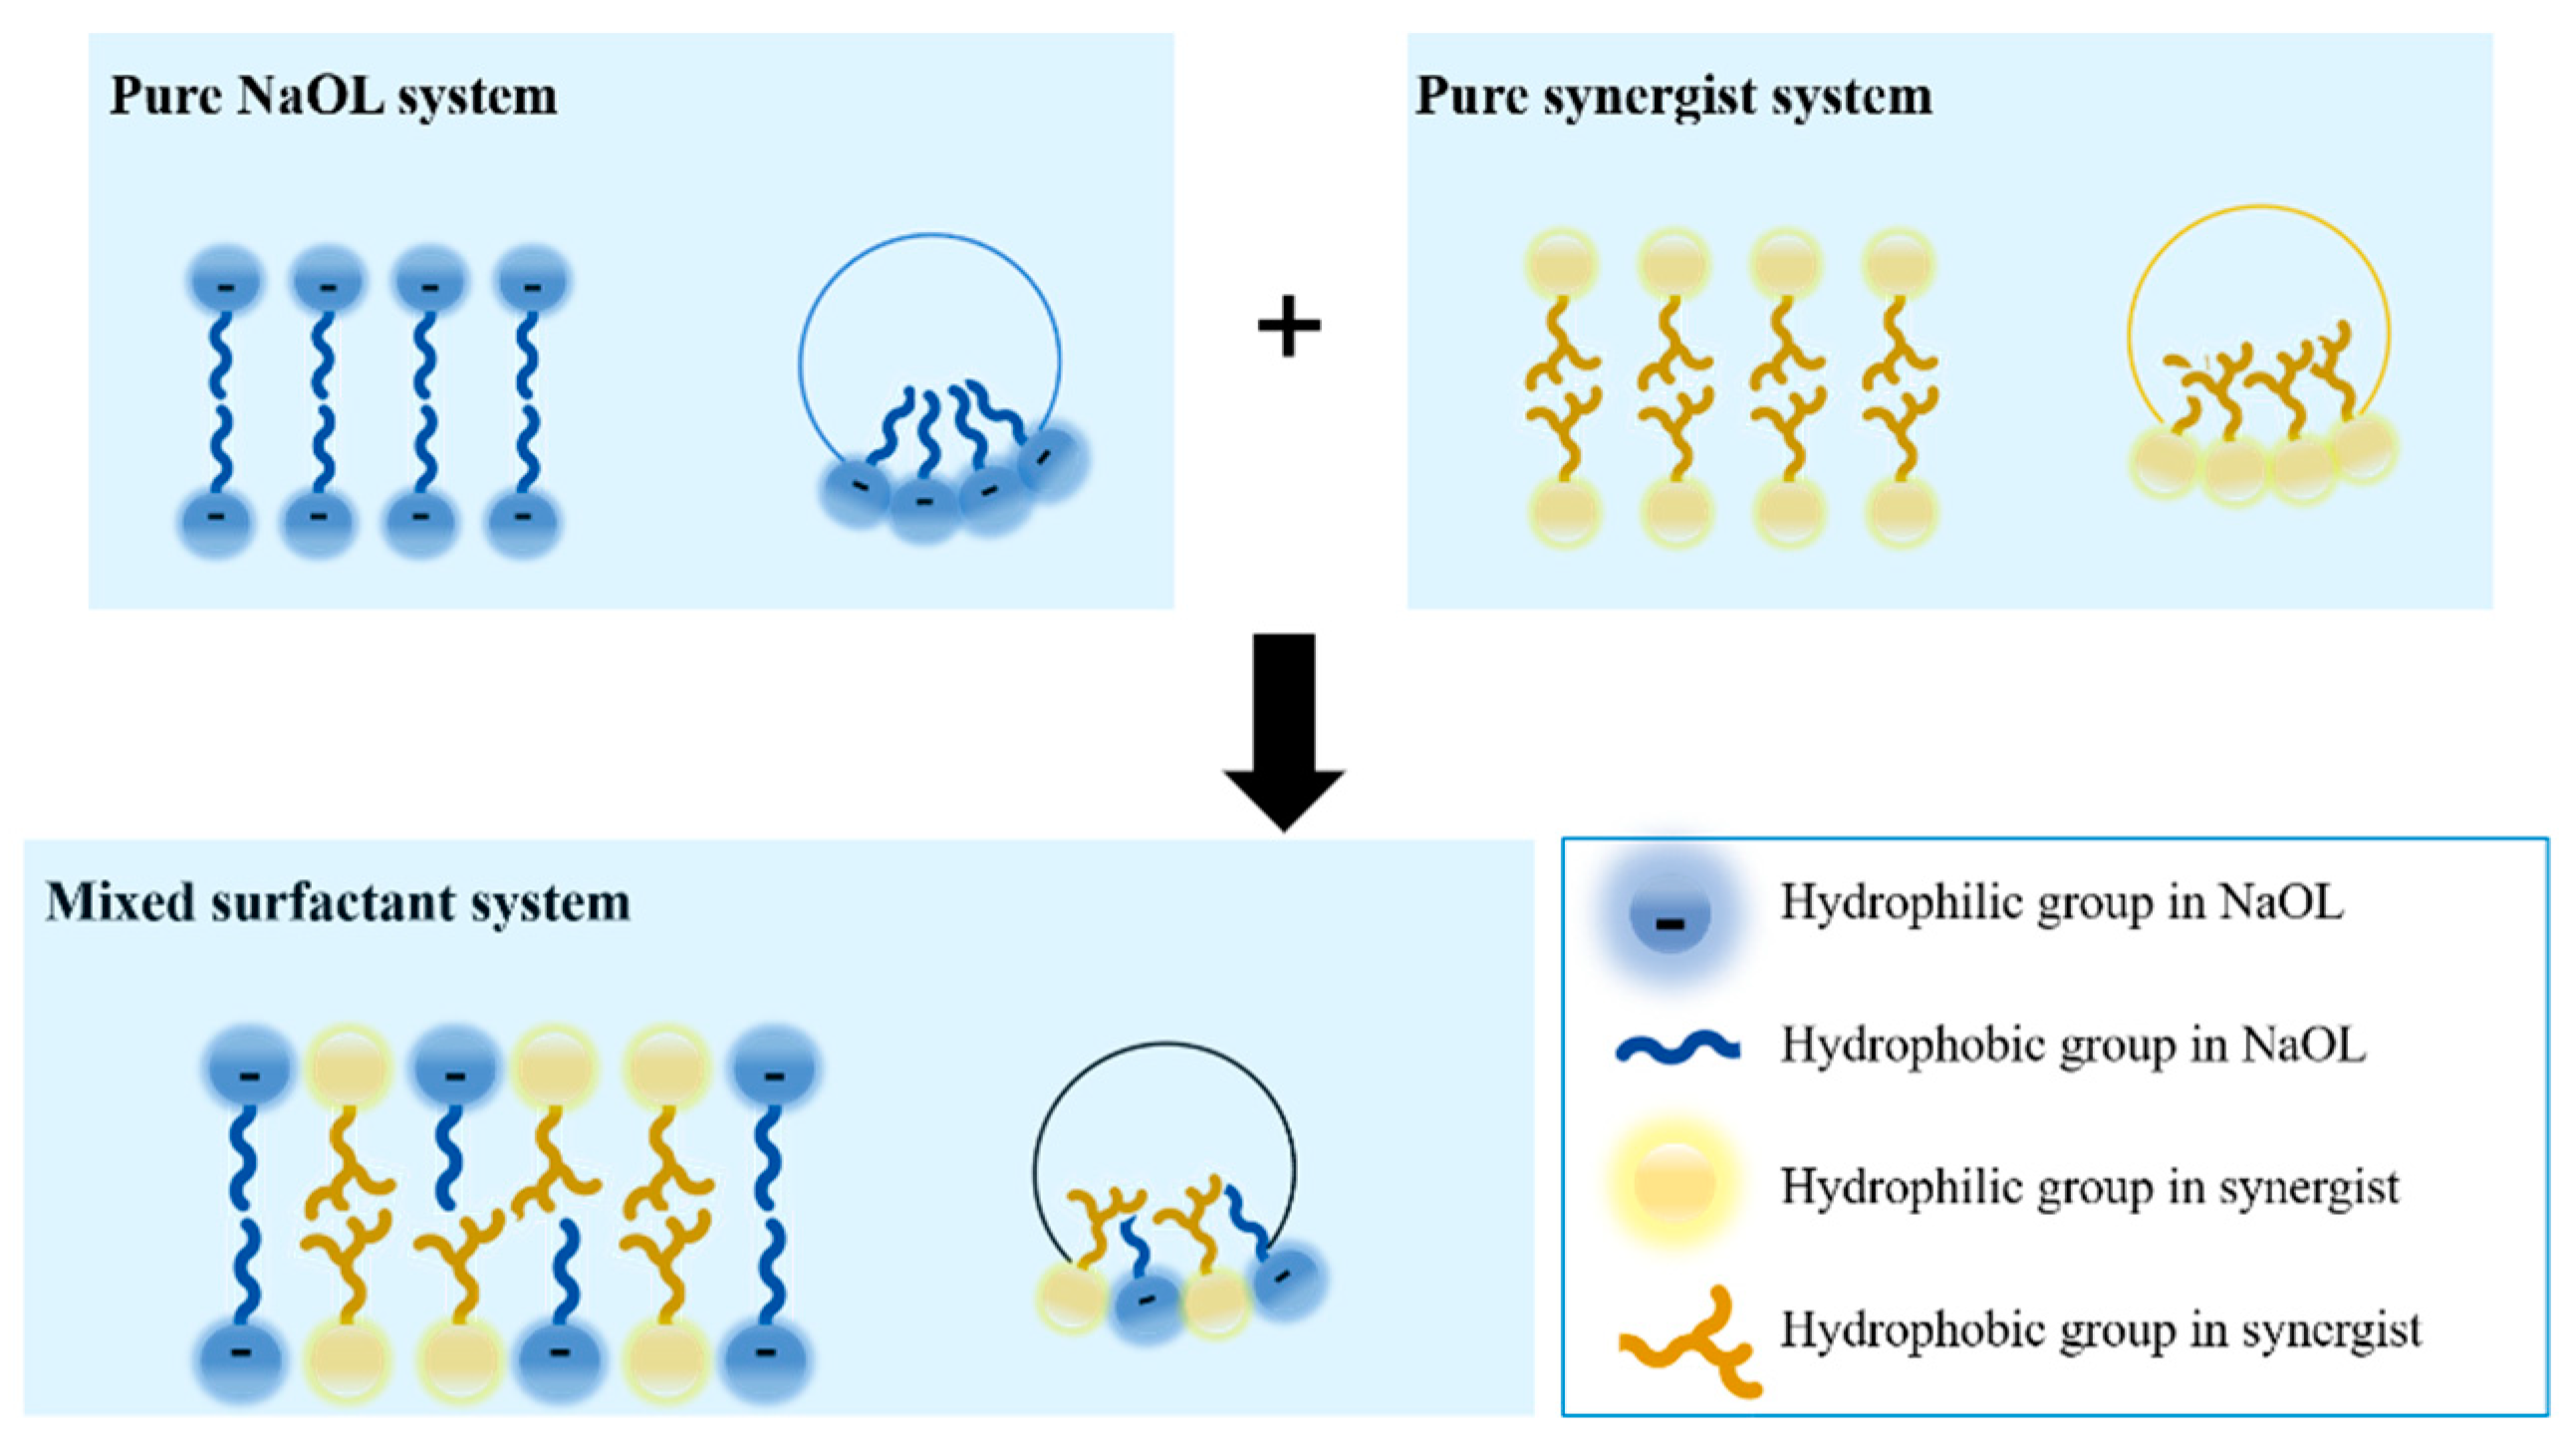
Figure 7 illustrates the dilution effect in the mixed surfactant system schematically. It can be clearly informed that the distance between the self-repelling oleate molecules will be much larger after mixing, making the repulsion interaction less than the average self-repulsion before mixing. In the mixed surfactant system, the steric repulsion between OP-10 or NP-10 also decreased with the increase of distance between them. Furthermore, there was a hydrogen bond OH…O between the OL− and OP-10/NP-10/AEO-9 molecules, which also stabled the system. In this way, the mixture system became more stable than the pure surfactant system, which well explained the attraction between the NaOL and OP-10/NP-10/AEO-9 molecules.
Due to the dilution effect, the CMC and surface tension of the mixed system both decreased compared with the NaOL solution, which increased the surface activity of NaOL. Furthermore, the average surface area per molecule of NaOL increased on the air-water interface or in the micelle, which increased its collision probability with the activated quartz surface. As a result, the collecting performance of NaOL increased, which explained the better quartz recovery in the mixed surfactant system.
5. Conclusions
The synergism effect between the collector NaOL and alcohol ethoxylates OP-10/NP-10/AEO-9 on the quartz recovery in flotation and its mechanism were investigated in this study, and the following conclusions were drawn.
- With the assistance of alcohol ethoxylates, the quartz recovery increased in flotation compared to when only NaOL was added as the collector. Furthermore, the level of synergism followed the sequence: OP-10 > NP-10 > AEO-9.
- The hydrophobicity of quartz increased in the synergy system in the order of OP-10 > NP-10 > AEO-9, which was the result of adsorption of NaOL on the activated quartz surface with the synergy of OP-10/NP-10/AEO-9 characterized by FTIR and QCM-D. Since hydrophobic quartz particles could easily attach on the bubble surface and thus increase froth stability, it resulted in the increase of quartz recovery in flotation.
- The dilute effect between NaOL and alcohol ethoxylate molecules based on surface tension analysis well explained the attraction and synergism between them. Due to the synergism, the CMC and surface tension of the mixed system both decreased and the average surface area per molecule of NaOL on the air-water interface or in the micelle increased compared with the NaOL solution, which increased the surface activity and collecting performance of NaOL, resulting in the better flotation performance.
Supplementary Materials
The following Supporting Information can be downloaded at: https://www.mdpi.com/article/10.3390/min13010093/s1, Figure S1: (a) Variation of the surface tension with the concentration of OP-10, NP-10, AEO-9 and NaOL in the pure state; (b) Variation of the surface tension with the concentration of OP-10, NP-10, AEO-9 mixed with 0.001 wt% NaOL. Critical micelle concentration (CMC) was determined by the cross-point of the two solid lines before and after CMC on the curves; Table S1: The CMC value, the surface tension at CMC and Amin for pure systems and mixed systems with 0.001 wt% NaOL; Table S2: Parameters and values in Equations (1)–(3).
Author Contributions
Conceptualization and methodology, N.Z. and C.S.; software, N.Z.; validation, J.K. and J.L.; formal analysis and writing, N.Z.; investigation, J.L. All authors have read and agreed to the published version of the manuscript.
Funding
This research received no external funding.
Data Availability Statement
The data presented in this study are available on request from the corresponding author.
Conflicts of Interest
The authors declare no conflict of interest.
References
- Luo, X.; Wang, Y.; Wen, S.; Ma, M.; Sun, C.; Yin, W.; Ma, Y. Effect of carbonate minerals on quartz flotation behavior under conditions of reverse anionic flotation of iron ores. Int. J. Miner. Process. 2016, 152, 1–6. [Google Scholar] [CrossRef]
- Cao, Z.; Zhang, Y.; Cao, Y. Reverse Flotation of Quartz from Magnetite Ore with Modified Sodium Oleate. Miner. Process. Extr. Metall. Rev. 2013, 34, 320–330. [Google Scholar] [CrossRef]
- Kou, J.; Xu, S.; Sun, T.; Sun, C.; Guo, Y.; Wang, C. A study of sodium oleate adsorption on Ca2+ activated quartz surface using quartz crystal microbalance with dissipation. Int. J. Miner. Process. 2016, 154, 24–34. [Google Scholar] [CrossRef]
- Ozkan, A.; Ucbeyiay, H.; Duzyol, S. Comparison of stages in oil agglomeration process of quartz with sodium oleate in the presence of Ca(II) and Mg(II) ions. J. Colloid Interface Sci. 2009, 329, 81–88. [Google Scholar] [CrossRef]
- Cao, S.; Yin, W.; Yang, B.; Zhu, Z.; Sun, H.; Sheng, Q.; Chen, K. Insights into the influence of temperature on the adsorption behavior of sodium oleate and its response to flotation of quartz. Int. J. Min. Sci. Technol. 2022, 32, 399–409. [Google Scholar] [CrossRef]
- Hao, H.; Li, L.; Yuan, Z.; Liu, J. Molecular arrangement of starch, Ca2+ and oleate ions in the siderite-hematite-quartz flotation system. J. Mol. Liq. 2018, 254, 349–356. [Google Scholar] [CrossRef]
- Wang, Y.; Khoso, S.A.; Luo, X.; Tian, M. Understanding the depression mechanism of citric acid in sodium oleate flotation of Ca2+-activated quartz: Experimental and DFT study. Miner. Eng. 2019, 140, 105878. [Google Scholar] [CrossRef]
- Meng, Q.-Y.; Feng, Q.-M.; Ou, L.-M. Effect of temperature on floatability and adsorption behavior of fine wolframite with sodium oleate. J. Cent. South Univ. 2018, 25, 1582–1589. [Google Scholar] [CrossRef]
- Liu, A.; Fan, P.P.; Qiao, X.X.; Li, Z.H.; Wang, H.F.; Fan, M.Q. Synergistic effect of mixed DDA/surfactants collectors on flotation of quartz. Miner. Eng. 2020, 159, 106605. [Google Scholar] [CrossRef]
- Zhang, H.; Liu, W.; Han, C.; Hao, H. Effects of monohydric alcohols on the flotation of magnesite and dolomite by sodium oleate. J. Mol. Liq. 2018, 249, 1060–1067. [Google Scholar] [CrossRef]
- Cao, Q.; Cheng, J.; Wen, S.; Li, C.; Bai, S.; Liu, D. A mixed collector system for phosphate flotation. Miner. Eng. 2015, 78, 114–121. [Google Scholar] [CrossRef] [Green Version]
- Bera, A.; Ojha, K.; Mandal, A. Synergistic Effect of Mixed Surfactant Systems on Foam Behavior and Surface Tension. J. Surfactants Deterg. 2013, 16, 621–630. [Google Scholar] [CrossRef]
- Bagheri, A.; Khalili, P. Synergism between non-ionic and cationic surfactants in a concentration range of mixed monolayers at an air–water interface. RSC Adv. 2017, 7, 18151–18161. [Google Scholar] [CrossRef] [Green Version]
- Rosen, M.J.; Zhou, Q. Surfactant-Surfactant Interactions in Mixed Monolayer and Mixed Micelle Formation. Langmuir 2001, 17, 3532–3537. [Google Scholar] [CrossRef]
- Agneta, M.; Zhaomin, L.; Chao, Z.; Gerald, G. Investigating synergism and antagonism of binary mixed surfactants for foam efficiency optimization in high salinity. J. Pet. Sci. Eng. 2019, 175, 489–494. [Google Scholar] [CrossRef]
- Bagheri, A.; Abolhasani, A. Binary mixtures of cationic surfactants with triton X-100 and the studies of physicochemical parameters of the mixed micelles. Korean J. Chem. Eng. 2014, 32, 308–315. [Google Scholar] [CrossRef]
- Talmage, S.S. Environmental and Human Safety of Major Surfactants: Alcohol Ethoxylates and Alkylphenol Ethoxylates; CRC Press: Boca Raton, FL, USA, 2020. [Google Scholar]
- Espeso, M.B.; Corada-Fernández, C.; García-Delgado, M.; Candela, L.; González-Mazo, E.; Lara-Martín, P.A.; Jiménez-Martínez, J. Structural control of the non-ionic surfactant alcohol ethoxylates (AEOs) on transport in natural soils. Environ. Pollut. 2021, 269, 116021. [Google Scholar] [CrossRef] [PubMed]
- Frisch, M.; Trucks, G.W.; Schlegel, H.B.; Scuseria, G.E.; Robb, M.A.; Cheeseman, J.R.; Scalmani, G.; Barone, V.; Petersson, G.A.; Nakatsuji, H.; et al. Gaussian 16; Gaussian, Inc.: Wallingford, CT, USA, 2016. [Google Scholar]
- Lee, C.; Yang, W.; Parr, R.G. Development of the Colle-Salvetti correlation-energy formula into a functional of the electron density. Phys. Rev. B 1988, 37, 785. [Google Scholar] [CrossRef] [Green Version]
- Liu, C.; Feng, Q.; Zhang, G.; Ma, W.; Meng, Q.; Chen, Y. Effects of lead ions on the flotation of hemimorphite using sodium oleate. Miner. Eng. 2016, 89, 163–167. [Google Scholar] [CrossRef]
- Du, Y.; Meng, Q.; Yuan, Z.; Ma, L.; Zhao, X.; Xu, Y. Study on the flotation behavior and mechanism of ilmenite and titanaugite with sodium oleate. Miner. Eng. 2020, 152, 106366. [Google Scholar] [CrossRef]
- Kou, J.; Tao, D.; Xu, G. Fatty acid collectors for phosphate flotation and their adsorption behavior using QCM-D. Int. J. Miner. Process. 2010, 95, 1–9. [Google Scholar] [CrossRef]
- Hadler, K.; Cilliers, J. The effect of particles on surface tension and flotation froth stability. Min. Metall. Explor. 2019, 36, 63–69. [Google Scholar] [CrossRef] [Green Version]
- Fang, J.; Ge, Y.; Yu, J. Effects of particle size and wettability on froth stability in a collophane flotation system. Powder Technol. 2021, 379, 576–584. [Google Scholar] [CrossRef]
- Arathi, A.; Akhil, V.; Mohanan, P. Chapter 15—Application of biosurfactants in the disruption of cell biomass. In Green Sustainable Process for Chemical and Environmental Engineering and Science; Inamuddin, R.B., Asiri, A.M., Eds.; Elsevier: Amsterdam, The Netherlands, 2021; pp. 317–328. [Google Scholar]
- Assadi, Y.; Farajzadeh, M.; Bidari, A. 2.10—Dispersive Liquid–Liquid Microextraction. In Comprehensive Sampling and Sample Preparation; Pawliszyn, J., Ed.; Academic Press: Oxford, UK, 2012; pp. 181–212. [Google Scholar]
- Zhou, Q.; Rosen, M.J. Molecular Interactions of Surfactants in Mixed Monolayers at the Air/Aqueous Solution Interface and in Mixed Micelles in Aqueous Media: The Regular Solution Approach. Langmuir 2003, 19, 4555–4562. [Google Scholar] [CrossRef]
- Feky, A.A.E.; Shalaby, M.N.; El-Shamy, O.A.; Suzy, A. Surface Activity and Adsorption of Some Surfactants at Aqueous/Air Interface at Different Temperatures. Int. J. Sci. Technol. Res. 2016, 5, 179–184. [Google Scholar]
- Jafari-Chashmi, P.; Bagheri, A. The strong synergistic interaction between surface active ionic liquid and anionic surfactant in the mixed micelle using the spectrophotometric method. J. Mol. Liq. 2018, 269, 816–823. [Google Scholar] [CrossRef]
- Holland, P.M.; Rubingh, D.N. Chapter 1–Mixed Surfactant Systems: An Overview. In Mixed Surfactant Systems; Paul, M.H., Donn, N.R., Eds.; ACS Publications: Washington, DC, USA, 1992. [Google Scholar]
Figure 1.
The size distribution of quartz used in flotation.

Figure 2.
Dependence of quartz recovery using NaOL in synergy with alcohol ethoxylates (OP-10, NP-10 and AEO-9).
Figure 2.
Dependence of quartz recovery using NaOL in synergy with alcohol ethoxylates (OP-10, NP-10 and AEO-9).

Figure 3.
FTIR spectra of pure quartz and activated quartz conditioned with NaOL, NaOL + OP-10, NaOL + NP-10 and NaOL + AEO-9.
Figure 3.
FTIR spectra of pure quartz and activated quartz conditioned with NaOL, NaOL + OP-10, NaOL + NP-10 and NaOL + AEO-9.

Figure 4.
Real-time change in Δf (a), ΔD (b) and adsorbed mass (c) of the Ca2+-activated silicon dioxide sensor associated with different collector systems (NaOL, NaOL + OP-10, NaOL + NP-10 and NaOL + AEO-9); (d) The adsorbed mass of oleate on the sensor without and with the synergy of OP-10, NP-10 and AEO-9.

Figure 5.
Contact angles of pure quartz surface (a) and activated quartz surface conditioned with NaOL (b), NaOL + OP-10 (c), NaOL + NP-10 (d) and NaOL + AEO-9 (e).
Figure 5.
Contact angles of pure quartz surface (a) and activated quartz surface conditioned with NaOL (b), NaOL + OP-10 (c), NaOL + NP-10 (d) and NaOL + AEO-9 (e).

Figure 6.
Optimized geometry structure of oleate, OP-10, NP-10 and AEO-9 by DFT.

Figure 7.
Schematic of the dilution effect in the mixed surfactant system showing the change in electrostatic self-repulsion and steric repulsion before and after mixing between NaOL and alcohol ethoxylates.
Figure 7.
Schematic of the dilution effect in the mixed surfactant system showing the change in electrostatic self-repulsion and steric repulsion before and after mixing between NaOL and alcohol ethoxylates.


Table 1.
The chemical structures, chemical formula and HLB values of NaOL, OP-10, NP-10 and AEO-9.
| Compound | Chemical Structure | Chemical Formula | HLB |
|---|---|---|---|
| Sodium Oleate (NaOL) |  | C18H33O2−Na+ | 18.0 |
| Octylphenol Ethoxylate (OP-10) |  | C34H62O11 | 13.6 |
| Nonylphenol Ethoxylate (NP-10) |  | C35H64O11 | 13.2 |
| Fatty Alcohol Ethoxylates (AEO-9) |  | C30H62O10 | 12.5 |
Disclaimer/Publisher’s Note: The statements, opinions and data contained in all publications are solely those of the individual author(s) and contributor(s) and not of MDPI and/or the editor(s). MDPI and/or the editor(s) disclaim responsibility for any injury to people or property resulting from any ideas, methods, instructions or products referred to in the content. |
© 2023 by the authors. Licensee MDPI, Basel, Switzerland. This article is an open access article distributed under the terms and conditions of the Creative Commons Attribution (CC BY) license (https://creativecommons.org/licenses/by/4.0/).
Share and Cite
MDPI and ACS Style
Zhang, N.; Li, J.; Kou, J.; Sun, C. Synergy Effect between Sodium Oleate and Alcohol Ethoxylates on the Reverse Flotation of Quartz. Minerals 2023, 13, 93. https://doi.org/10.3390/min13010093
AMA Style
Zhang N, Li J, Kou J, Sun C. Synergy Effect between Sodium Oleate and Alcohol Ethoxylates on the Reverse Flotation of Quartz. Minerals. 2023; 13(1):93. https://doi.org/10.3390/min13010093
Chicago/Turabian StyleZhang, Na, Jiajia Li, Jue Kou, and Chunbao Sun. 2023. "Synergy Effect between Sodium Oleate and Alcohol Ethoxylates on the Reverse Flotation of Quartz" Minerals 13, no. 1: 93. https://doi.org/10.3390/min13010093
Note that from the first issue of 2016, this journal uses article numbers instead of page numbers. See further details here.