
Impacts of Clay Content and Type on Shear Strength and Splash Erosion of Clay–Sand Mixtures
by
 , , , and
Shamsollah Ayoubi
1,*,
Anashia Milikian
1 ,
,
Mohammad Reza Mosaddeghi
1,
Mojtaba Zeraatpisheh
2,3 and
and
Shuai Zhao
4 1
Department of Soil Science, College of Agriculture, Isfahan University of Technology, Isfahan 8415683111, Iran
2
Rubenstein School of Environment and Natural Resources, University of Vermont, 81 Carrigan Drive, Burlington, VT 05405, USA
3
Gund Institute for Environment, University of Vermont, 210 Colchester Ave, Burlington, VT 05401, USA
4
Department Xinjiang Institute of Ecology and Geography, Chinese Academy of Sciences, 818 South Beijing Road, Urumqi 830011, China
*
Author to whom correspondence should be addressed.
Minerals 2022, 12(11), 1339; https://doi.org/10.3390/min12111339
Submission received: 8 September 2022
/
Revised: 19 October 2022
/
Accepted: 20 October 2022
/
Published: 22 October 2022
(This article belongs to the Section Clays and Engineered Mineral Materials)
Abstract
:Soil characteristics, especially clay content and clay type, have significant impacts on splash erosion. This investigation was conducted to determine the effects of clay content and clay type (zeolite, phlogopite, bentonite, and kaolinite) on the shear strength and splash erosion of clay–sand mixtures compared with a clay soil under controlled conditions. Clay–sand mixtures were prepared by mixing 15, 30, and 45 kg 100 kg−1 of the selected clays with pure sand and a clay soil; these mixtures were pre-treated with three levels of wetting and drying (W&D) cycles, and then shear strength was measured. The splash erosion rate was measured at three levels of water status: air-dry, plastic limit (PL), and liquid limit (LL). The highest values of splash erosion were observed in the samples without the W&D cycle, and after applying the W&D cycles, splash erosion decreased. Moreover, splash erosion was higher in the air-dry and LL groups. Splash erosion decreased with increased clay content because of the structure development in the mixtures. In general, as clay content increased, splash erosion was reduced and shear strength was significantly increased. From the highest to lowest mean of cohesion, the results showed the following order: bentonite > kaolinite > phlogopite > clay soil > zeolite. However, splash erosion showed the following order for the studied clays: zeolite > clay soil > phlogopite > kaolinite > bentonite. Nonlinear power models, best-fitted relations between splash erosion and shear strength, and the shear strength could explain about 30–33% of the splash erosion variability in this study.
1. Introduction
The global average soil erosion in the world is 570 Mg km−2 y−1, and this figure in Iran is reported to be 2500 Mg km−2 y−1; consequently, soil erosion in Iran is more than four times the global average [1,2]. Splash, as the first soil erosion process, detaches materials that could be relocated by aboveground flow and influences further erosion processes such as interrill and rill erosion [3,4]. Soil splash erosion and subsequent sedimentation throughout the world, especially in hilly regions, are among the most significant obstacles to achieving sustainable agricultural development and resources [4]. Splash erosion involves complicated processes in which part of the disintegrated particles is displaced by the impact of raindrops on the soil surface. When an erosive rainfall event happens, splash erosion, as the first step water soil erosion, is initiated [5,6]. Moreover, splash erosion has been identified as one of the main erosional processes, and it is considered in some erosion models such as EUROSEM [5], LISEM [7], and TEST [7] since the correctness of splash measurements as the input variable in these models remarkably influences their output.
The detachment of soil particles by rain splash is not only related to the characteristics of raindrops including the size and volume of raindrops [8], droplet speed [9], intensity of rainfall [10], rainfall depth [11], and kinetic energy [12] but also significantly related to soil interrill erodibility [13]. Several researchers have found that various soil characteristics, especially in the surface layer (such as organic matter content, clay content, soil moisture content and land roughness [14,15] soil aggregation [16], particle size distribution [13], infiltrability, and cohesion [17], as well as the shear strength and bulk density [18]), effectively influence soil splash erosion [19,20,21,22,23]. Therefore, to understand more about the splash erosion process, further studies are needed to investigate all soil surface conditions affecting splash erosion.
Previous studies have shown that clay content could regulate various mechanical and physical soil properties [24,25], as well as soil erodibility [19]. Wuddivira et al. [26] showed that clay particles and soil organic matter had positive effects on aggregation due to their binding effects, while wetting showed a weakened influence on aggregate stability. Hence, these factors could significantly regulate aggregate breakdown due to splash erosion. Moreover, soil distribution size has significant effects on soil erodibility. In this regard, Huang et al. [27] indicated that soil erodibility showed a negative correlation with sand content but was positively related to soil silt and clay contents. In a study on clay–sand mixtures, Wei et al. [4] indicated that the angle φ and cohesion c of saturated soils showed a parabolic trend and an exponential increase with clay content, respectively, while cohesion c was better quantified by particle fractal dimension D than clay content. Moreover, they revealed that the temporal variation of splash erosion was significantly affected by particle size distribution. Many scholars have stated that internal soil forces induced by clay particles, soil organic matter, and other soil conditions have higher contributions to splash erosion than the kinetic energy of raindrops [28,29,30].
The behavior of clay soils also significantly depends on the clay type. Legout et al. [3] reported that clay content could be considered to predict the size distribution of splashed soil particles and that the stability of aggregates is the controlling factor in splash erosion. Different clay types have different mechanical behaviors, such as soil dispersion. The water-dispersible clay fraction released from unstable aggregates suites the formation of surface crust [31], decreases macro-porosity [32], decreases pore junctions [33], decreases hydraulic conductivity [31], and (consequently) increases soil loss.
Although several studies have shown the significance of clay content on mechanical soil properties and splash erosion [3,15], little attempt has been made to investigate effects of clay type on these soil variables. Therefore, this study was executed to examine the influences of clay content and type on mechanical soil behaviors and their consequences on soil splash erosion in a clay soil and sand mixtures of some clay minerals (zeolite, phlogopite, bentonite, and kaolinite) in a laboratory raindrop simulation.
2. Materials and Methods
2.1. Soil Samples and Preparation
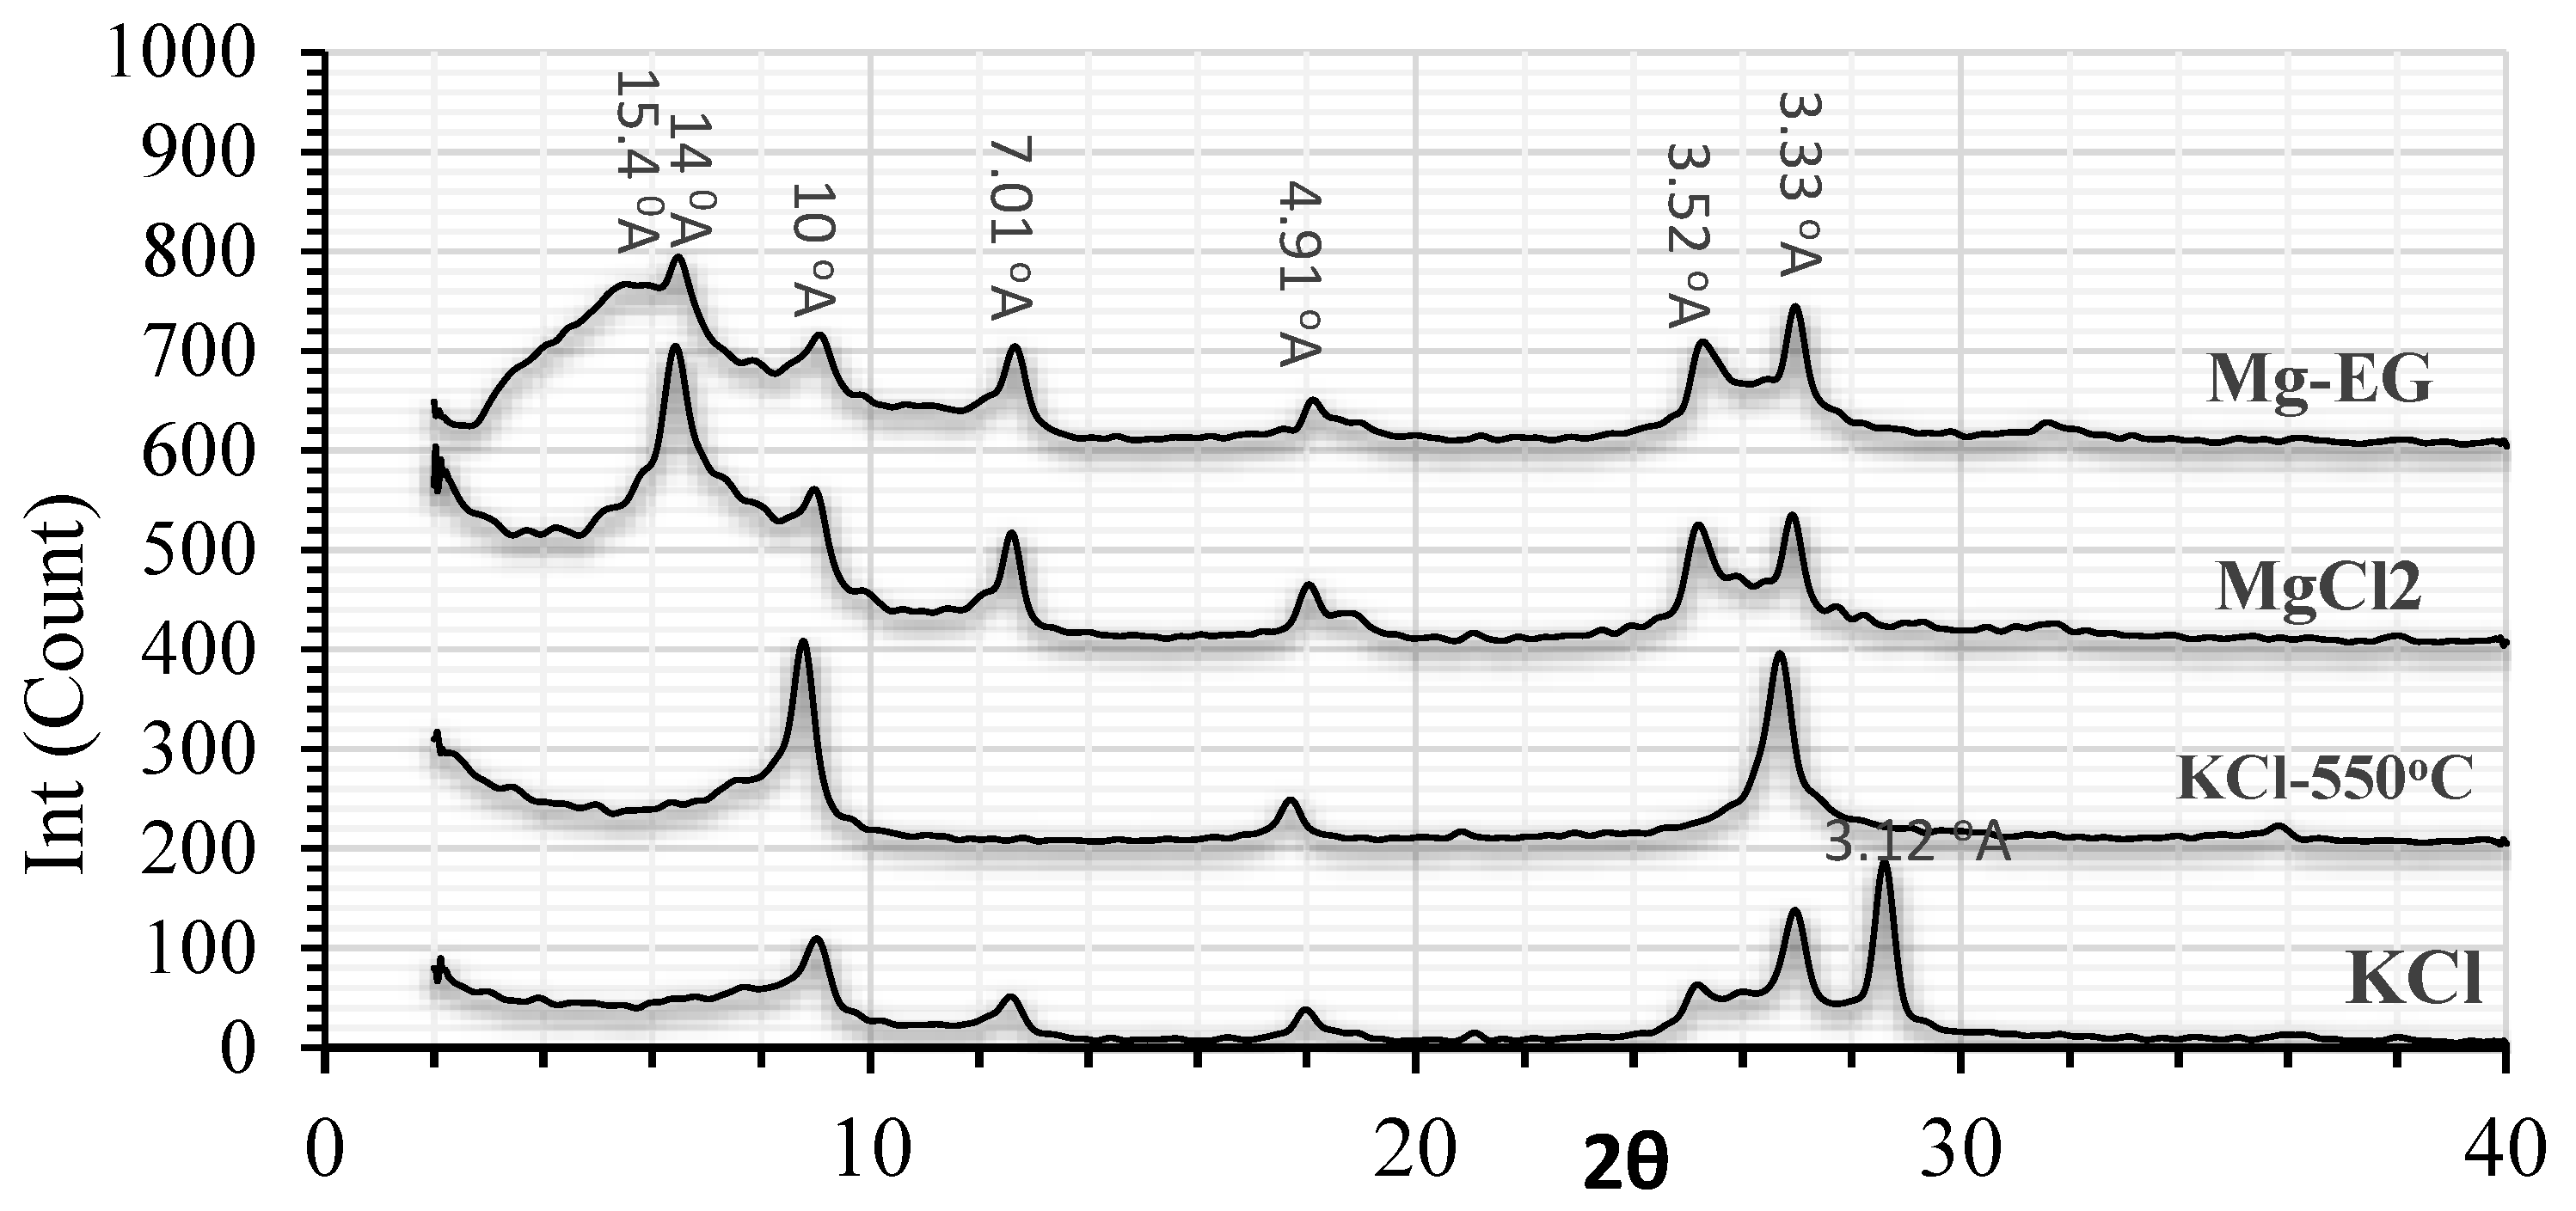
This study was conducted on mixtures of sand and some clay minerals (zeolite, phlogopite, bentonite, and kaolinite), as well as a clay soil. A sample soil, classified as a clay soil according to the USDA [34], was collected from Charmahal and Bakhtiari province, Central Iran as a representative of semiarid region soils under pasture land use and Quaternary deposits. We used Kittrick and Hope’s [35] method to separate the clay fraction from the bulk of the selected soil. An analysis of the Mg-saturated, ethylene glycol (EG)-solvated, and K-saturated clay-oriented samples at 25, 330, and 550 °C was performed with X-ray diffraction (XRD) by applying a D8 ADVANCE diffractometer with CuK radiation (40 kV and 40 mA). The peak area related to the 001 reflections for the considered main clay minerals (smectite = 17 Å, illite = 10 Å, and kaolinite/chlorite = 7 Å) on the EG-treated sample could be applied for the semiquantitative calculation of the clay minerals [36]. The collected clay soil primarily included montmorillonite, vermiculite, kaolinite, and small portions of chlorite and illite (Figure 1). The soil sample was dried at air temperature and then passed through a 2 mm sieve. To text our hypothesis in this study, 15, 30, and 45 kg 100 kg−1 of selected clays were mixed with pure sand (quartz with a size range of 0.3–0.8 mm). A factorial experimental design was applied to evaluate the splash rates of the five prepared treatments and the pre-wetted treatment as follows: (i) under an air-dry condition, (ii) at a water content of plastic limit (PL), and (iii) at a water content of liquid limit (LL) in three replicates in the laboratory.
2.2. Laboratory Analyses
The Casagrande three-point approach was used to determine the liquid limit (LL) of the clay–sand mixtures and clay soil [37]. The plastic limit (PL) was measured with the method proposed in Campbell [37]. The characterization of the studied clay–sand mixtures is presented in Table 1. The shear strength or cohesion of the prepared samples was measured with a shear vane (model: BS1377-9). Shear strength was determined in all of the treatments in the air-dry, PL, and LL conditions.
2.3. Splash Erosion Experiment
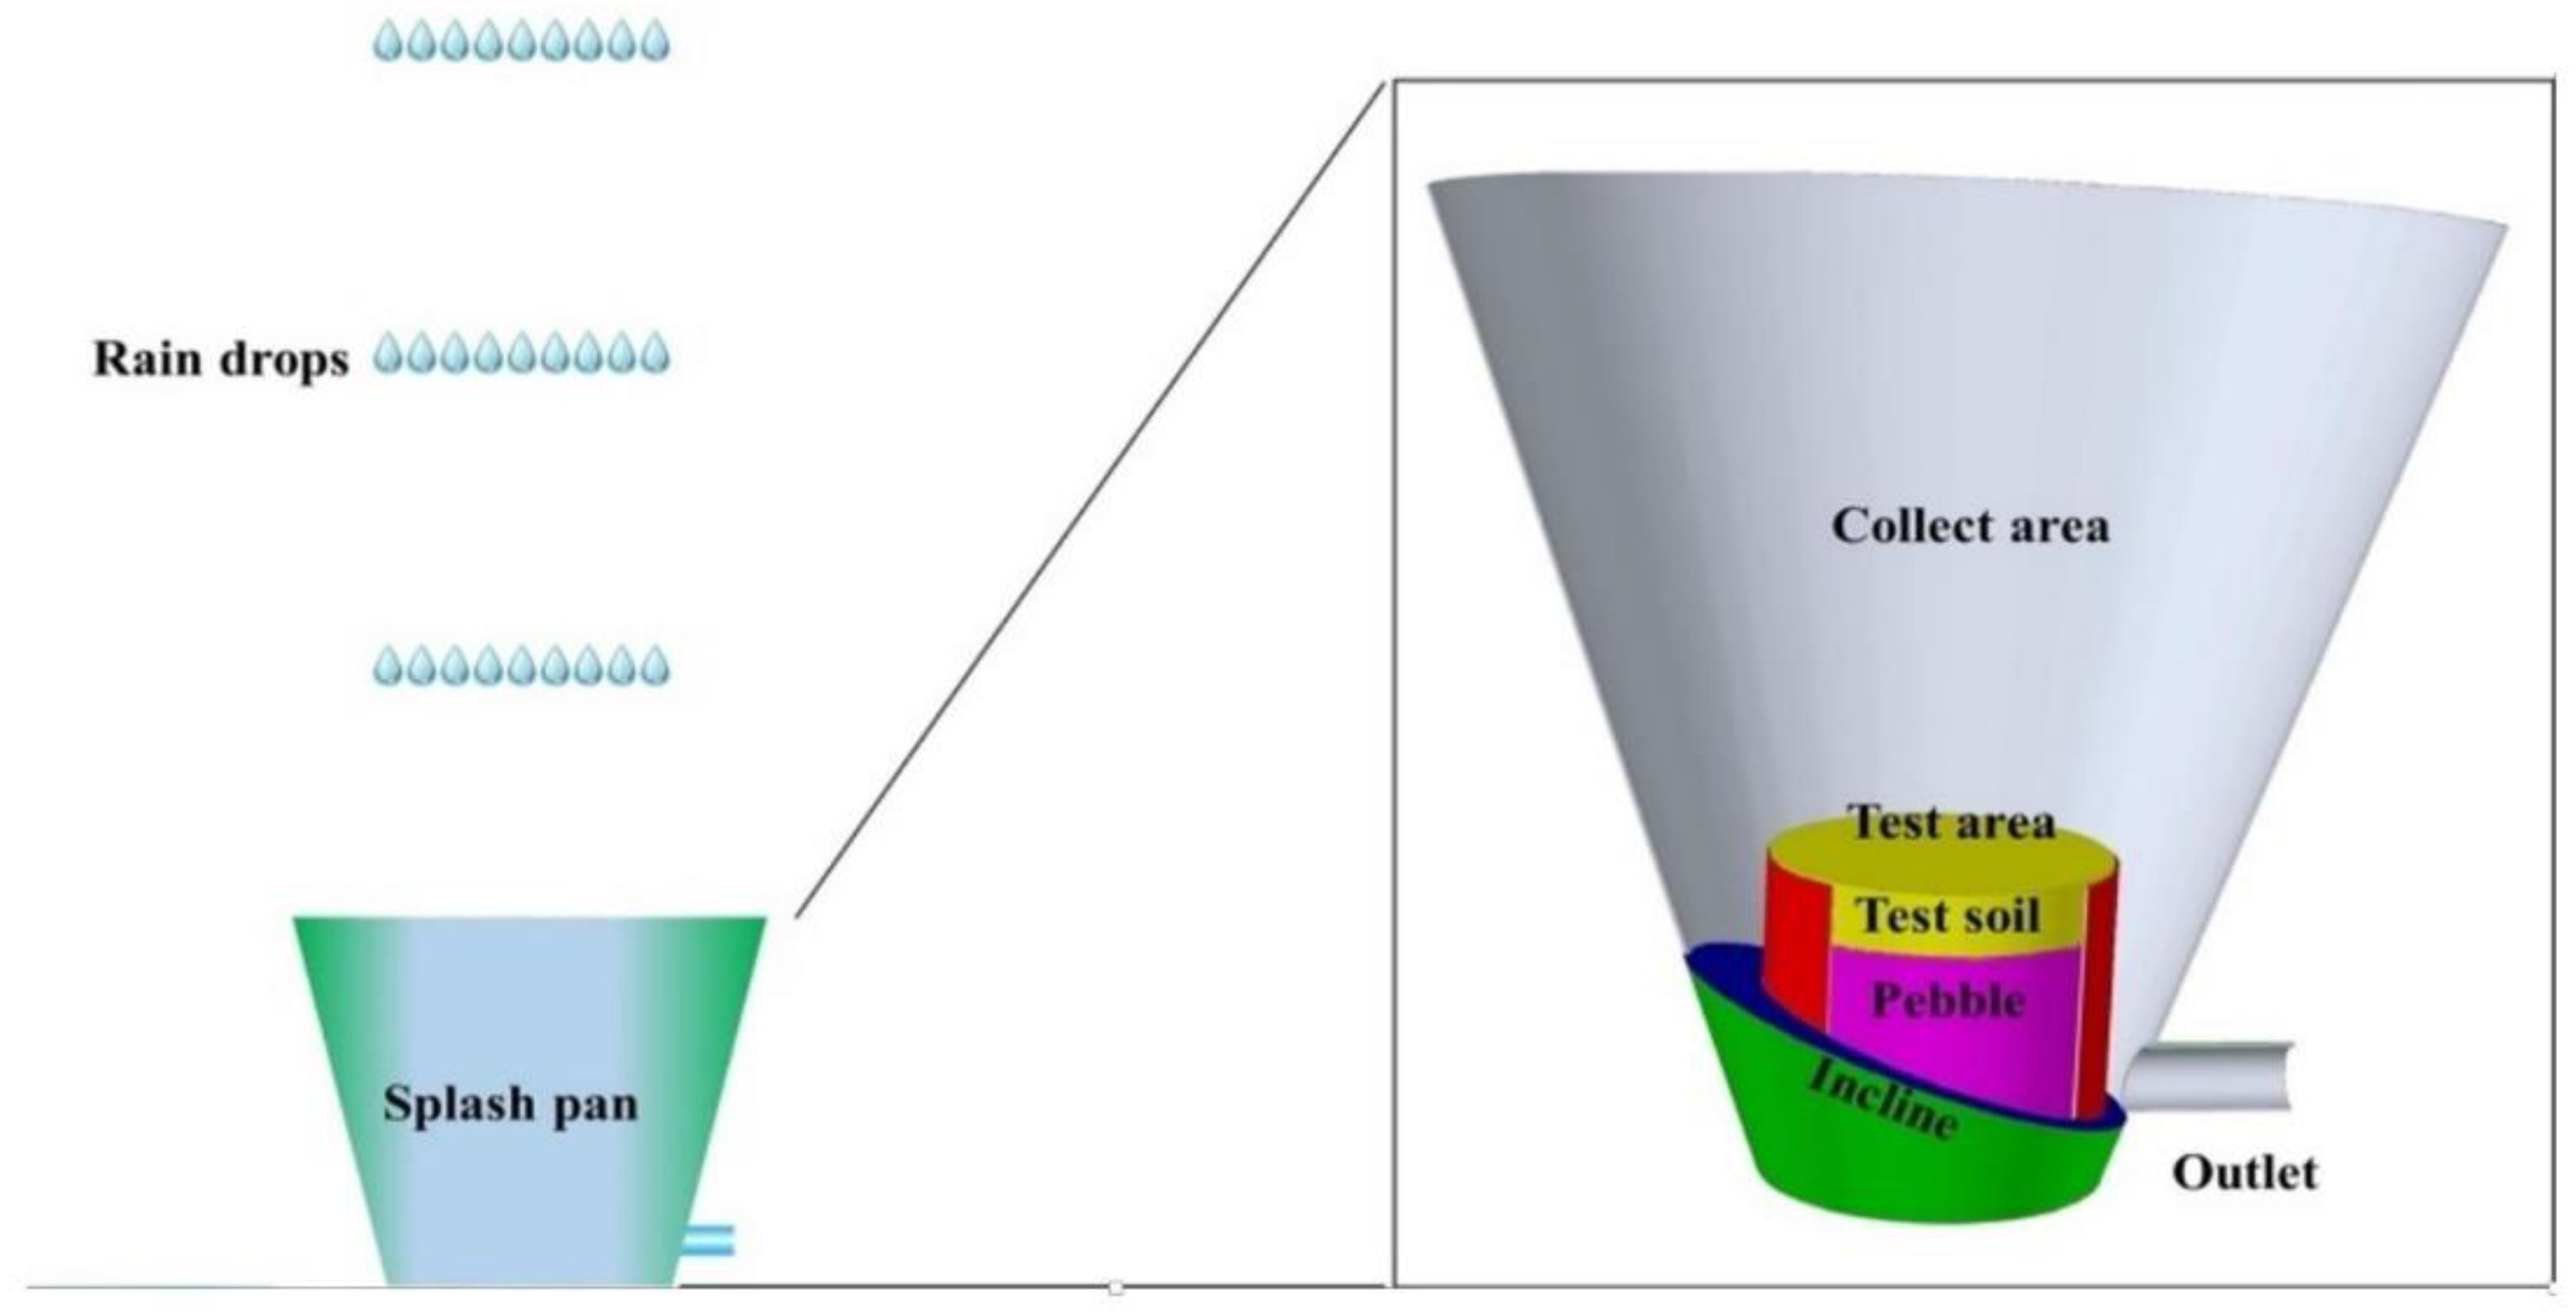
We used a splash simulator that included a splash outset located under a rainfall simulator (Figure 2). Rainstorms for the testing of splash erosion were employed by a rainfall simulator [38]. Based on precipitation data and the annual rainstorm frequency in Isfahan city [39], the rainfall intensity in the splash erosion experiment was set to 60 mm h–1 for 10 min for each treatment. The rainfall simulator comprised a SPRACO cone jet nozzle placed at 200 cm above the splash outset. The median drop size (MDS) was 2.5 mm, with a homogeneity of 95%, and 0.08 MPa of pressure was applied. The splash outset was an erosion tray adapted from the work of Morgan [40]. It comprised an outer ring with an inner diameter of 40 cm and a height of 35 cm and an inner ring with a diameter and height of 10 cm. The splash cups included holes at the bottom for the draining of excess water during rainfall from the cup. When the soil sample was placed in the middle of the erosion tray, the outer gap was applied to exclude sediments derived by the overland flow till to isolate the sediments from splash erosion. An oblique plane was placed between two rings, and an aperture was adjoined to the outer ring at the bottommost point of the plane. Therefore, any particles splashed out the experiment area could be collected during rainfall simulation. Ma et al. [7] and Wei et al. [33] already applied this set for investigations of the splash erosion rate. The prepared samples were well-set into the soil erosion tray. The simulation for each sample was performed in three replicates. The splashed sediments were set at 110 °C for 24 h to be dried and then weighted to measure soil loss following each event.
2.4. Statistical Analysis
The descriptive statistics of the minimum, maximum, mean, standard deviation (SD), skewness, and coefficient of variation (CV) were determined, and comparisons of means were performed. A completely random factorial design with three replicates was applied to conduct statistical analysis. The arrangement of treatments was as follows: two cycles of wetting and drying in a range of saturation followed by air-drying (one and three W&D cycles), three levels of moisture content (air-dry, PL, and LL), and five clay types (phlogopite, bentonite, kaolinite, zeolite, and clay soil). The SAS statistical program (SAS Institute, 1990) was used to analyze the variance (ANOVA) in the data. The comparison of means was performed using the least significant difference (LSD) test at the p < 0.05 probability level.
3. Results and Discussion
3.1. Descriptive Statistics
The descriptive statistics related to the water content and the percentage of clay–sand mixtures for splash erosion in different air-dry and wet cycles are presented in Table 2. According to the Kolmogorov–Smirnov test, all treatments showed normal distributions. The highest variation (CV = 116%) for splash erosion was observed for PL after one W&D cycle, while the lowest CV (62.5%) was observed for air-dried samples following two cycles of W&D (Table 2). In the treatment without a W&D cycle, splash erosion varied from 0.321 to 5.472 with a mean of 2.155 g m−2 min−1. In the water state without W&D and under the PL status, splash erosion varied from 0.065 to 2.27 with a mean 0.915 g m−2 min−1, while under the LL status, splash erosion ranged from 0.193 to 5.52 with an average of 1.91 g m−2 min−1. A similar trend was observed following both one and two cycles of W&D; somehow, the highest splash erosion values were found under the dry status, the lowest splash erosion values were found under the PL status, and moderate splash erosion values were found under the LL status.
Overall, the highest amounts of splash erosion were observed in the condition without W&D. After applying the W&D cycle, soil splash erosion was decreased, and the least amount of splash erosion was observed following two cycles of W&D. Furthermore, upon the application of the W&D cycles, the CV values were higher than those under the dry status (Table 2). According to the results of Table 2, the highest and lowest values of splash erosion in the treatment without W&D were observed with 15 and 45 kg 100 kg−1 of applied clay, respectively. In the treatment without W&D, the presence of 45 kg 100 kg−1 of clay in the mixture led to the values of splash erosion ranging from 0.065 to 4.952 g m−2 min−1, with an average of 1.342 g m−2 min−1. In the same condition with the presence of 30 kg 100 kg−1 of clay, the splash erosion varied from 0.101 to 5.472 g m−2 min−1, and with the presence of 15 kg 100 kg−1 of clay, the splash erosion ranged from 0.165 to 5.52 g m−2 min−1. In general, splash erosion values were decreased following the application of wetting and drying cycles, and the smallest values were obtained following two cycles of W&D. The reasons for the reduction in splash erosion after W&D cycles could be soil aggregation and structure formation. Moreover, Mamedov et al. [20] reported that surface conditions such as wetting/drying and the maintenance of certain water contents in the soil could influence structural stability and lead to increases in soil resistance to detachment and soil losses. Additionally, Saedi et al. [13] emphasized that the higher the stability of aggregates in wet conditions, the lower the breakdown of aggregates by splash erosion due to smaller amounts of detachable fine particles. In this study, the highest variability in splash erosion was observed following one cycle of W&D, and the lowest CV values were observed following two cycles of W&D. All the CVs for soil splash erosion were higher than 62%, indicating a comparatively considerable spatial variability based on Wilding’s [41] classification (Table 2). Accordingly, in a study of splash erosion under various rainfall integrities and slope gradients in the natural soils of Central Iran, Saedi et al. [13] reported a high variability for splash erosion (CV > 36%).
The results of descriptive statistics for soil cohesion (c) in various treatments are presented in Table 3. In the treatment without W&D under the dry status, c varied from 3 to 20 kPa with a mean of 11.3 kPa. Under the PL status, cohesion values ranged from 5 to 25 kPa, and under the LL status, cohesion values varied from 2 to 18 kPa. Similarly, after applying a W&D cycle, we observed higher values of c compared with those observed following treatment without W&D. Rajarama and Erbach [42] discovered that the W&D of a clay loam soil significantly enhanced the size of aggregates, cone penetration resistance, internal friction angle, adhesion, cohesion, and soil–metal friction angle. Farmland soils are usually subjected to numerous cycles of seasonal wetting and drying because of irrigation or rainfall events; therefore, the impacts of wetting and drying on mechanical soil attributes associated with splash erosion need more consideration [43,44]. Several studies have reported that soil aggregation is induced by wetting and drying conditions [45,46]. In a study of the effects of W&D cycles and drying stress on physical soil behaviors,
Overall, the ranking of c values was as follows: PL > air-dry > LL. It is widely reported that the shear strength of soil reaches its highest value at specific water contents. Near-saturated conditions and LL status have shown the lowest levels of shear strength according to previous studies [47,48], though these results are inconsistent with our findings. At different clay contents in the treatment without W&D, the mean c values were 13.9, 11.6, and 7.7 kPa for 45, 30, and 15 kg 100 kg−1 of clay content, respectively. After applying W&D cycling, c values showed an increasing trend such that the highest value was recorded following two W&D cycles. Cohesion values showed CV values ranging from 33.8 to 56.1%, the highest values were observed in the treatment without W&D, and the lowest variability was observed following two cycles of W&D. According to Wilding’s [41] categorization, almost all treatments showed a high variability (CV > 36%). Furthermore, the Kolmogorov–Smirnov normality test verified the normal distribution of the cohesion values. In a study of the effect of soil strength on splash erosion in the natural soils of central Zagros of Iran, Saedi et al. [13], reported that the soil’s shear strength varied from 5 to 22.2, with an average of 12.9 kPa and CV of 22%. In natural soils of Central Iran, Khalili Moghadam et al. [2] reported that soil shear strength ranged from 12.3 kPa in dryland farm soils to 14.7 kPa in pasture soils; additionally, they reported that CV values differed from 12 to 23% for soil strength for various land-use types.
3.2. Impacts of Clay Content and Type on Cohesion at Various Water Contents and W&D Cycles
The results of our analysis of variance (ANOVA) revealed that there were significant differences (p < 0.05) in soil cohesion among treatments with different clay contents. The mean soil cohesion increased with increases in clay content because the clay particles created bonds between fine particles. Al-Shayea [19] stated that soil cohesion could be controlled by the following forces: electrostatic and electromagnetic attraction, adhesion and compaction, cementation, and capillary effective stress; furthermore, all these cohesion sources increased with increasing clay content. Our results were inconsistent with the results of Shanyoug and Chan [47] and Tiwari and Marui [48], who found that clay content increases led to shear strength increases in sandy soils. They showed that soil cohesion was increased with increases in clay content.
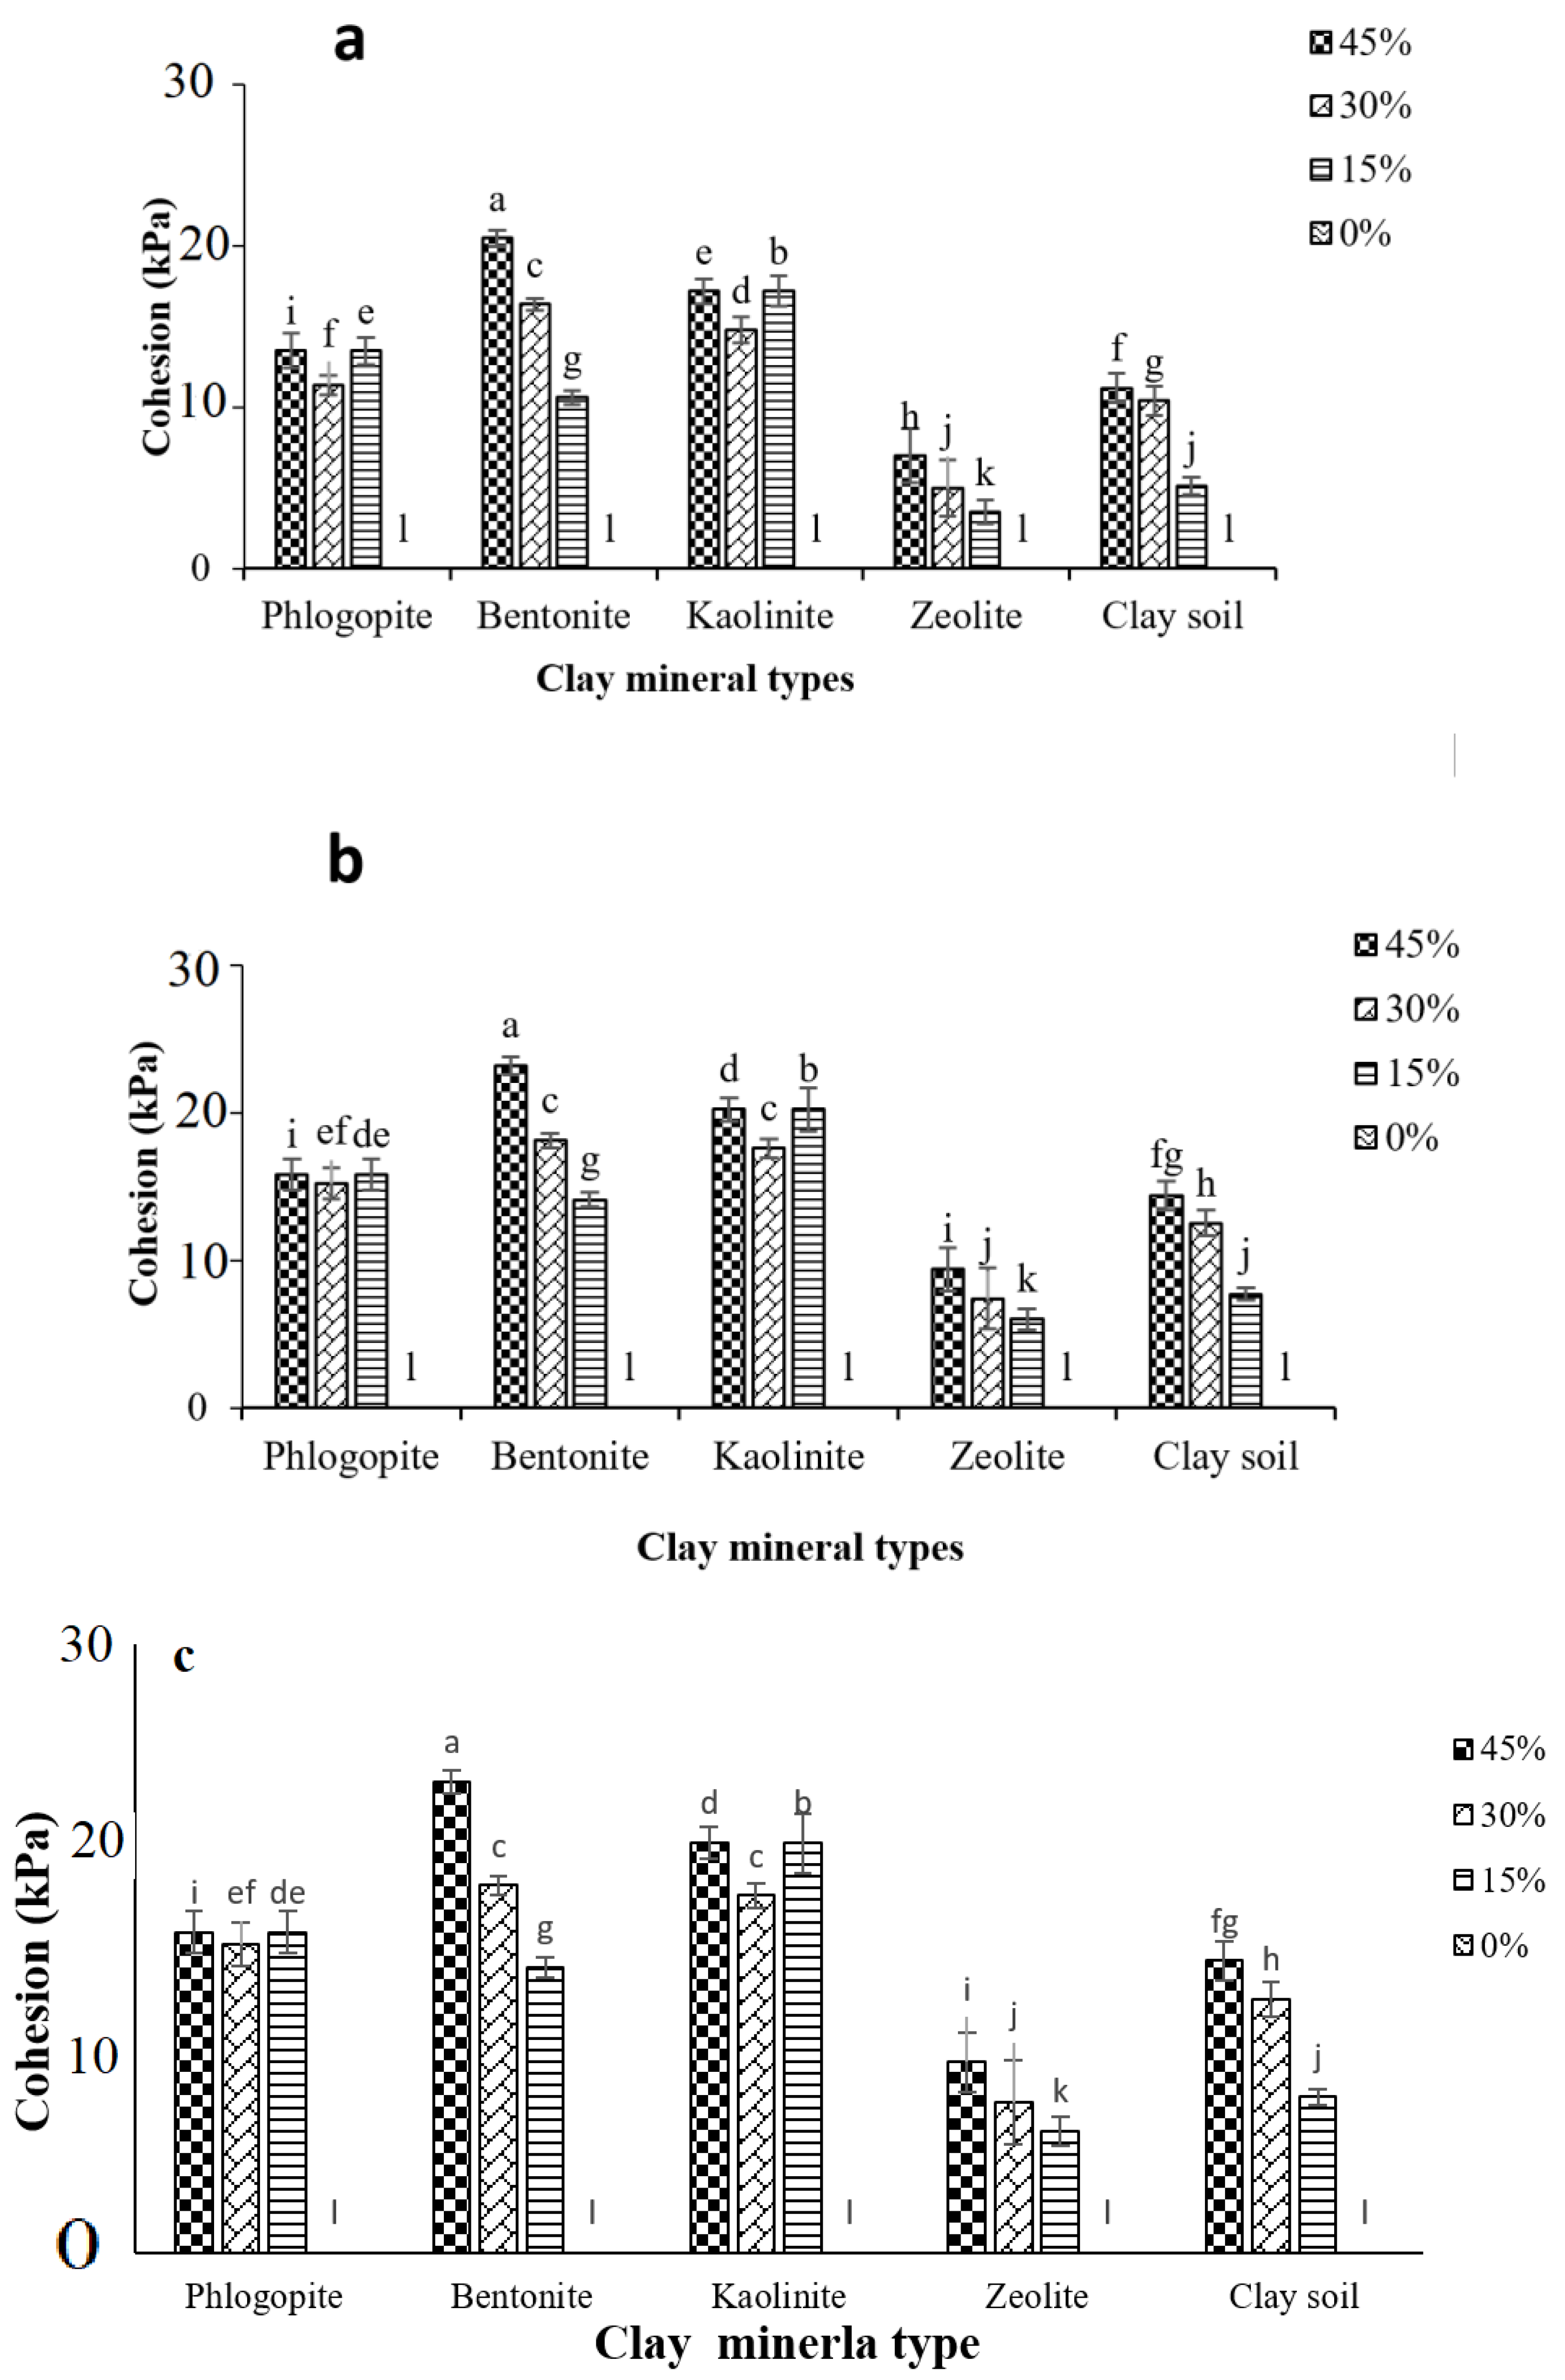
A comparison of the means of cohesion among the clay types and contents in the treatments with and without W&D cycles is presented in Figure 3. Increases in clay percentage, except for kaolinite and phlogopite (see Figure 3), resulted in increases in the cohesion of the clay–sand mixtures because the clay particles enhanced water retention, electrostatic forces, and capillary-induced effective stress between soil particles. From the highest to lowest means of soil cohesion, the results showed the following order: bentonite > kaolinite > phlogopite > clay soil > zeolite (Table 4). The effect of clay type on soil cohesion was greater than that of clay percentage. The results indicated that increases in water content led to reductions in the cohesion of the clay–sand mixtures. Moreover, the W&D cycles led to a rise in cohesion, probably because of aggregation and structure formation. The highest values of cohesion were observed following three W&D cycles, and the lowest values of cohesion were observed in the treatment without W&D (Table 4).
Shear strength is directly related to a clay type’s properties. For example, Domitrović and Kovačević Zelić [49] found that shear strength testing showed decreasing cohesion following greater extensions of the hydration of bentonite. Furthermore, Müller-Vonmoos and Løken [50] reported that the highest shear strength of kaolinite occurred in sodium- and calcium-saturated systems, which they ascribed to an internal friction angle of approximately 25°. Several studied have been conducted on the mechanical behaviors of different soil mixtures [51,52,53]. In this regard, Karim and Alam [53] concluded that a low amount of fine particles (e.g., clay) could change the behavior of soil mixtures. Müller-Vonmoos and Løken [50] demonstrated that the comparatively high shear strength of clay types such as kaolinite mainly originates from inter-granular frictional strength; illite is strongly subjected to exchangeable ions, and the layers of montmorillonite are mostly held together by intergranular forces (i.e., cohesive strength). In contrast to the previously mentioned results, Nagaraj [52] carried out an unconfined compressive trial of mixtures of clay (bentonite and kaolinite) and sand, as well as two natural soils, and they concluded that the greatest unconfined compressive strength was achieved from 40 to 60% of sand contents regardless of the clay type.
Clay type showed significant importance on soil cohesion in our studied clay–sand mixtures, even at the lowest level of clay (15 kg 100 kg−1 of clay). Cohesion decreased during the treatment with 30 kg 100 kg−1 of kaolinite and phlogopite compared with the 15 kg 100 kg−1 treatment. Increasing the clay percentage from 30 to 45 kg 100 kg−1 led to an increase in cohesion. Vallejo et al. [51] quantified the porosity and shear strength of sand–kaolinite mixtures with different clay contents. At a clay content of less than 25 kg 100 kg−1, the soil shear strength was directly affected by the sand fraction, while at a clay content of more than 60 kg 100 kg−1, the soil shear strength was directly affect by the clay fraction. We found that cohesion increased with increasing clay content, except for kaolinite and phlogopite, probably due to the water adsorption by these two clay types (Figure 3). After the W&D cycles, cohesion continuously increased due to soil aggregation. In the kaolinite or phlogopite treatments (30%) after W&D cycles, the results showed no significant increase in soil cohesion (Figure 3).
3.3. Impacts of Clay Content and Type on Splash Erosion at Various Water Contents and W&D Cycles
The splash erosion rate showed the following order for the studied clays: zeolite > clay soil > phlogopite > kaolinite > bentonite (Table 5). The rates of splash erosion decreased with increases in the clay percentage because of the greater physicochemical activity of the clay particles and structure development. Regarding the effect of clay type, the results showed that clay type had a significant influence on splash erosion even at the lowest clay percentage (15 kg 100 kg−1) in the clay–sand mixtures (Table 5). The splash erosion rate decreased following the W&D cycles. Additionally, with increasing water content from dry to PL, the splash erosion rate was reduced. Then, with a further increase in the water content to LL, the splash erosion rate was increased again (Table 5). This finding might be interpreted as the combination of two mechanisms: first is the effective stress due to internal forces, which usually rises with reductions in water content, and second is the fabric alterations of mixtures following an increase in water content from an initial value to near-saturated conditions during a rainfall event. In fact, the mechanical strength and cohesion of a porous medium at saturated and near-saturated (i.e., at LL) states are low because of the low effectual stress enabled by the matric potential. In an unsaturated porous medium, water menisci can pull fine particles closer together, decrease the distance between contact points of larger particles, and increase the mechanical strength of the medium [54,55]. The second mechanism is related to the fact that more considerable and quick changes of water content in a dry treatment could cause the disaggregation of clay–sand mixtures and result in greater splash erosion rates.
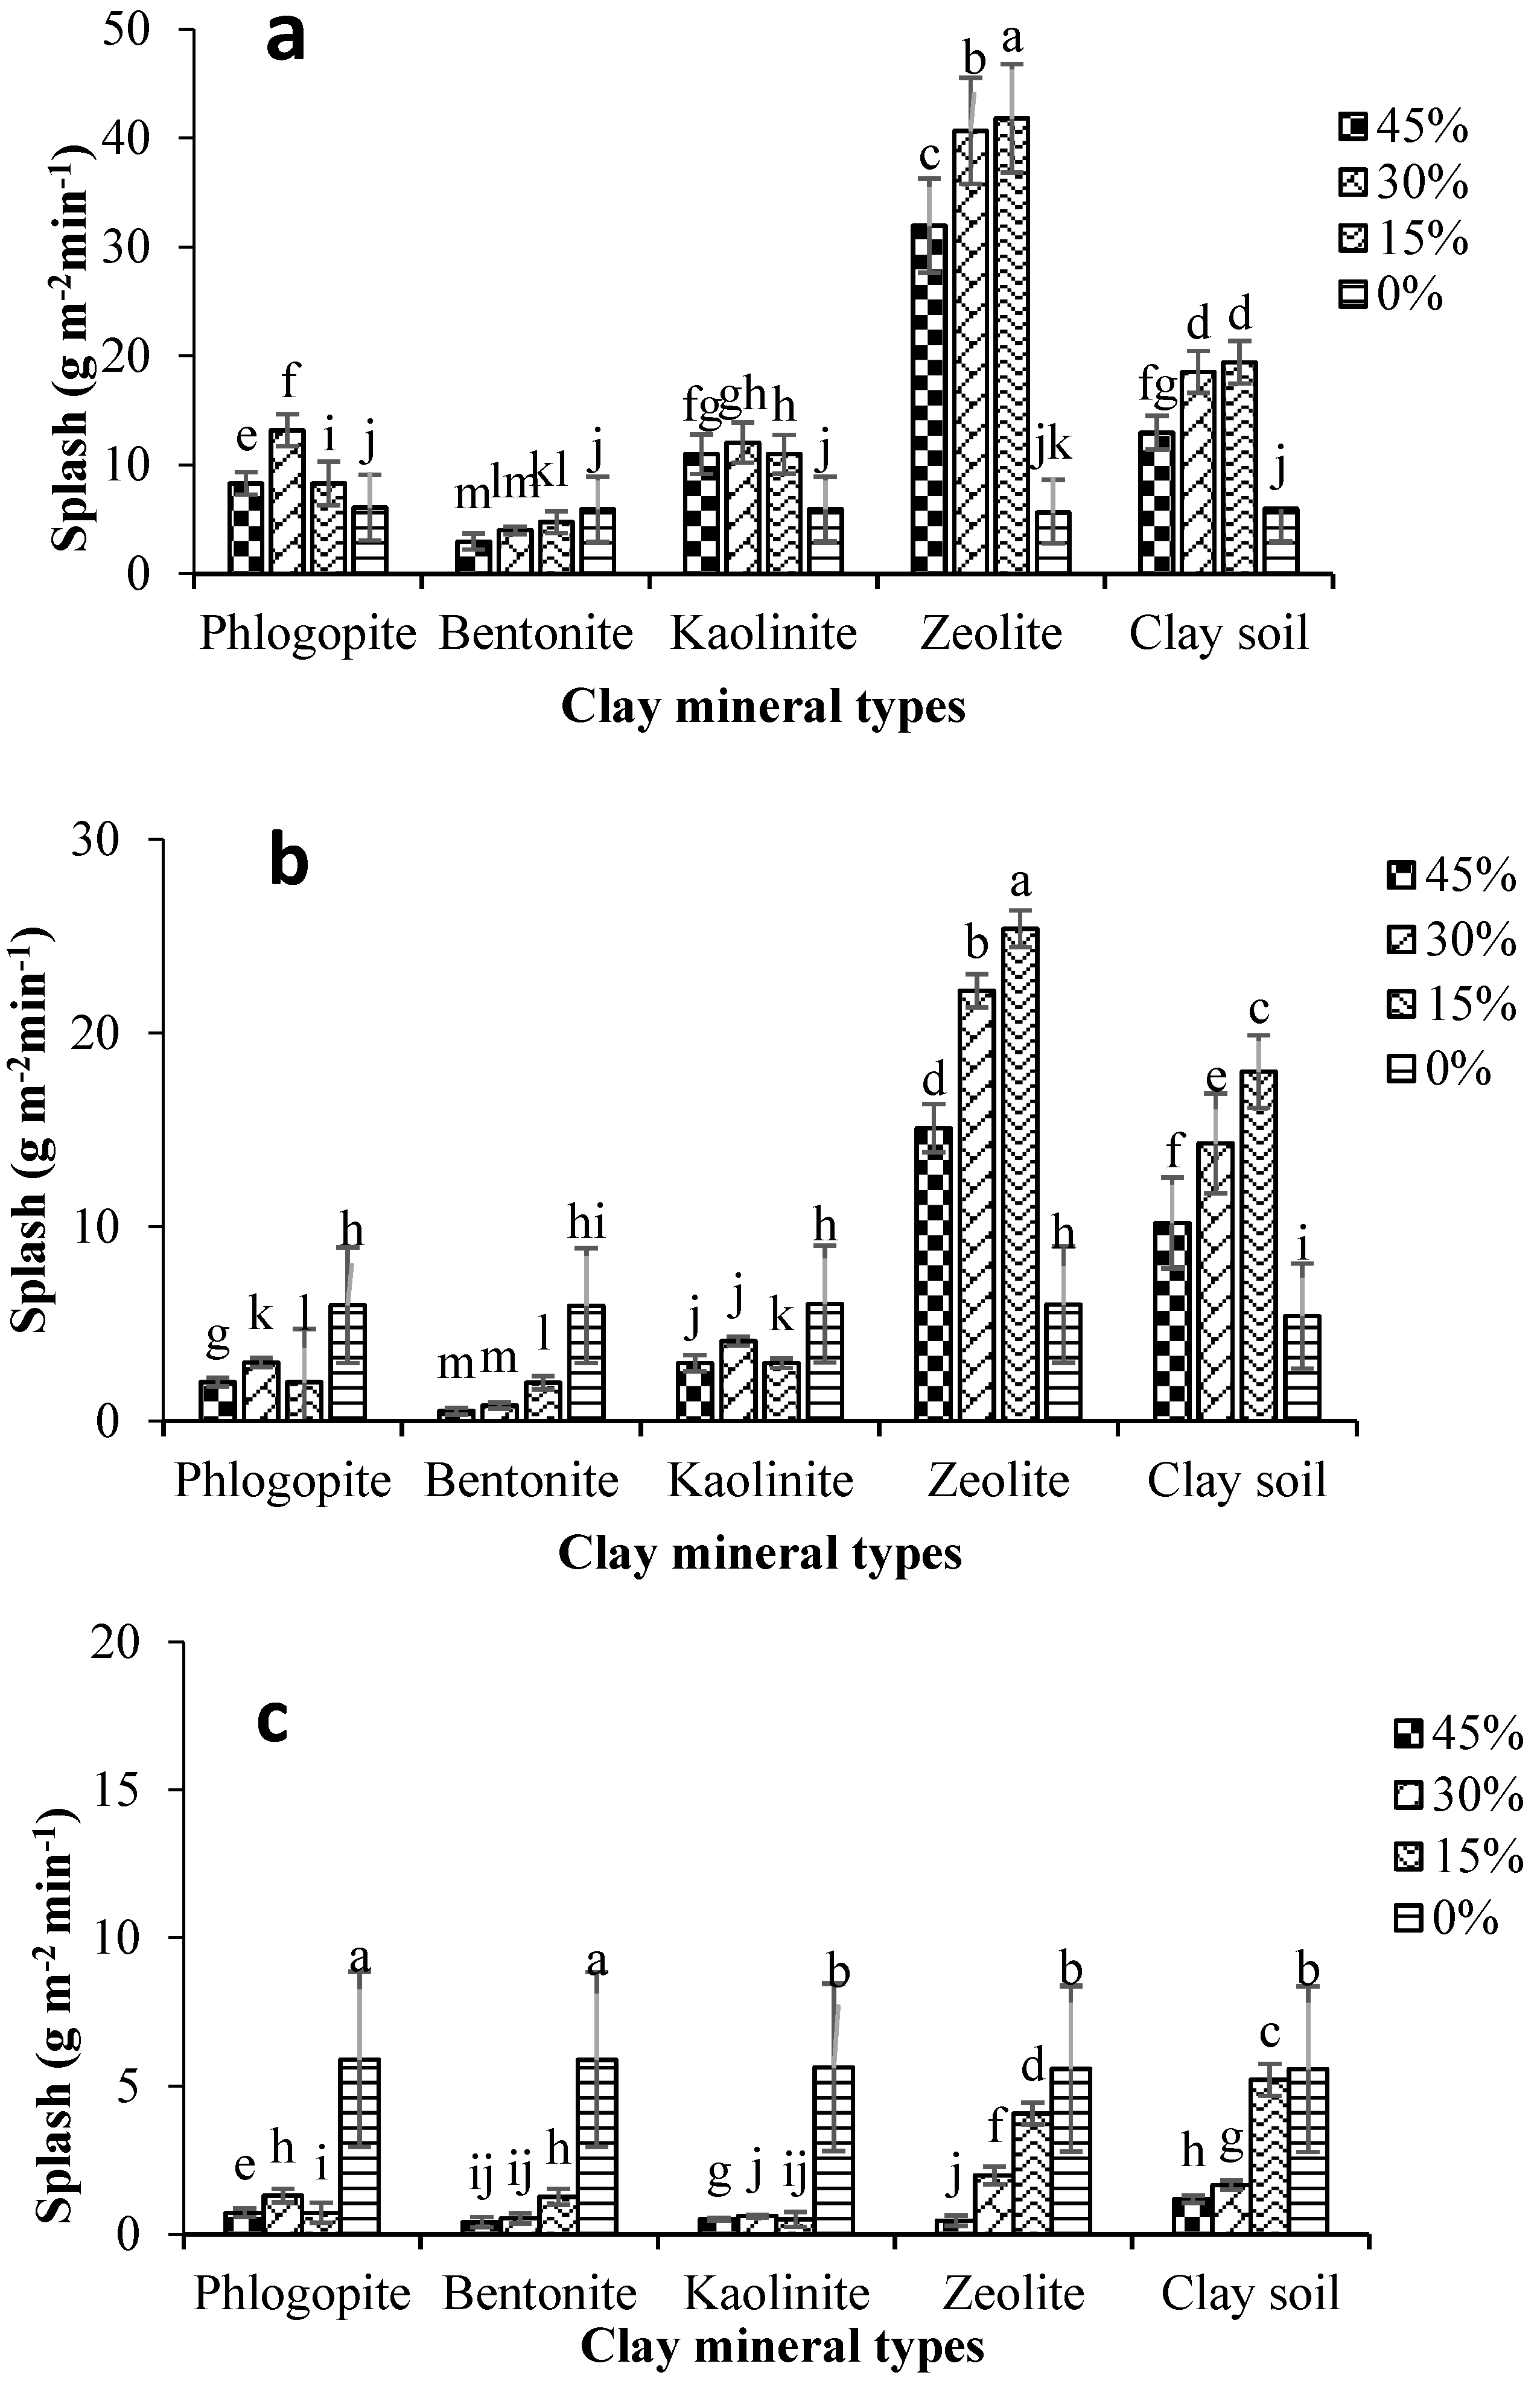
Comparisons of the mean splash erosion rates of the clay types and percentages in treatments with and without W&D cycles are presented in Figure 4. The interactive effect of clay type and content indicated that the highest and the lowest values of splash erosion were associated with 15 and 45 kg 100 kg−1 of clay, respectively. Poesen [24] and Quansah [56] reported that in the absence of a clay fraction, the highest splash erosion rates occurred due to a lack of bonds between soil particles; their treatments with very low clay contents showed a low cohesion and high potential for splash and dispersion [25]. We observed a reverse association between splash erosion and cohesion in the mixtures, and the treatments with more than 30 kg 100 kg−1 of clay had a high cohesion and resistance against splash erosion.
For the clay minerals, including kaolinite and phlogopite, there were no significant trends in splash erosion in association with clay percent, though the treatment with 15 kg 100 kg−1 of clay showed less splash erosion than the treatment with 45 kg 100 kg−1 of clay (Figure 4). The highest and the lowest values of soil splash erosion were obtained in the zeolite– and bentonite–sand mixtures, respectively (Figure 4). Zeolite had a greater splash erosion rate than the other clays due to its lowest cohesion among the studied clays, and bentonite showed the lowest splash erosion rate because it had the highest cohesion. The clay soils showed intermediate splash erosion rates, presumably because of intermediate strength against the raindrops. As explained in the Section 2, the clay soils had a combination of different clays, i.e., montmorillonite, vermiculite, kaolinite, chlorite, and illite, with high variations in cohesion.
Following the W&D cycles, the rates of soil splash erosion decreased for all the studied treatments, which could be attributed to the structure formation in the clay–sand mixtures after W&D cycling. In the bentonite–sand mixture, after three cycles of W&D, no significant difference was observed between the 45 and 30 kg 100 kg−1 treatments (Figure 4c). The sudden occurrence of drying and wetting could lead to the creation of fractures in surface soils and soil weakening, but in this study, slow and continuous wetting and drying led to aggregation and strong bonding among particles.
The first process in water soil erosion is the detachment of particles by raindrop splashes [57]. Therefore, soil splash erosion can be directly and indirectly controlled by clay mineralogy and clay types. Soils containing clay types with the ability to produce large and strong aggregates are more resistant against soil and splash erosion. In soils with a great amount of montmorillonite, clay colloids can easily break down due to swelling upon wetting and lead to increased splash erosion, thus lowering the infiltration rate and increasing the runoff rate [58]. There are many reasons for the breakdown of soil aggregates during rainfall, including physical–chemical dispersion, differential clay swelling, and slaking [59].
Regarding the stability of aggregates following a quick wetting process, several studies have reported soil slaking to be the dominant process in aggregate breakdown [60,61]. In Central–South China, Wei et al. [33] reported that soils with significant contents of kaolinite and illite faced with slaking effect and aggregate breakdown had increases splash erosion and soil loss rates. Additionally, in non-phyllosilicate soils of semi-arid regions, calcite, feldspar, and dolomite are the main minerals. These minerals contain close to zero surface charges, resulting in an intermediate soil aggregate stability and also contributing to intermediate soil erosion [62] and low splash erosion rates. In terms of aggregate stability, kaolinite clay minerals and iron oxides are imperative agents for soil structural stability [63]. Soil loss was found to be lowest in kaolinitic soils, intermediate in non-phyllosilicate soils, and highest in montmorillonitic soils. In contrast to montmorillonitic soils, a low soil detachment, low soil loss, low runoff transport capacity, and high aggregate stability were reported in kaolinitic soils [64].
3.4. Relationships between Splash Erosion and Shear Strength
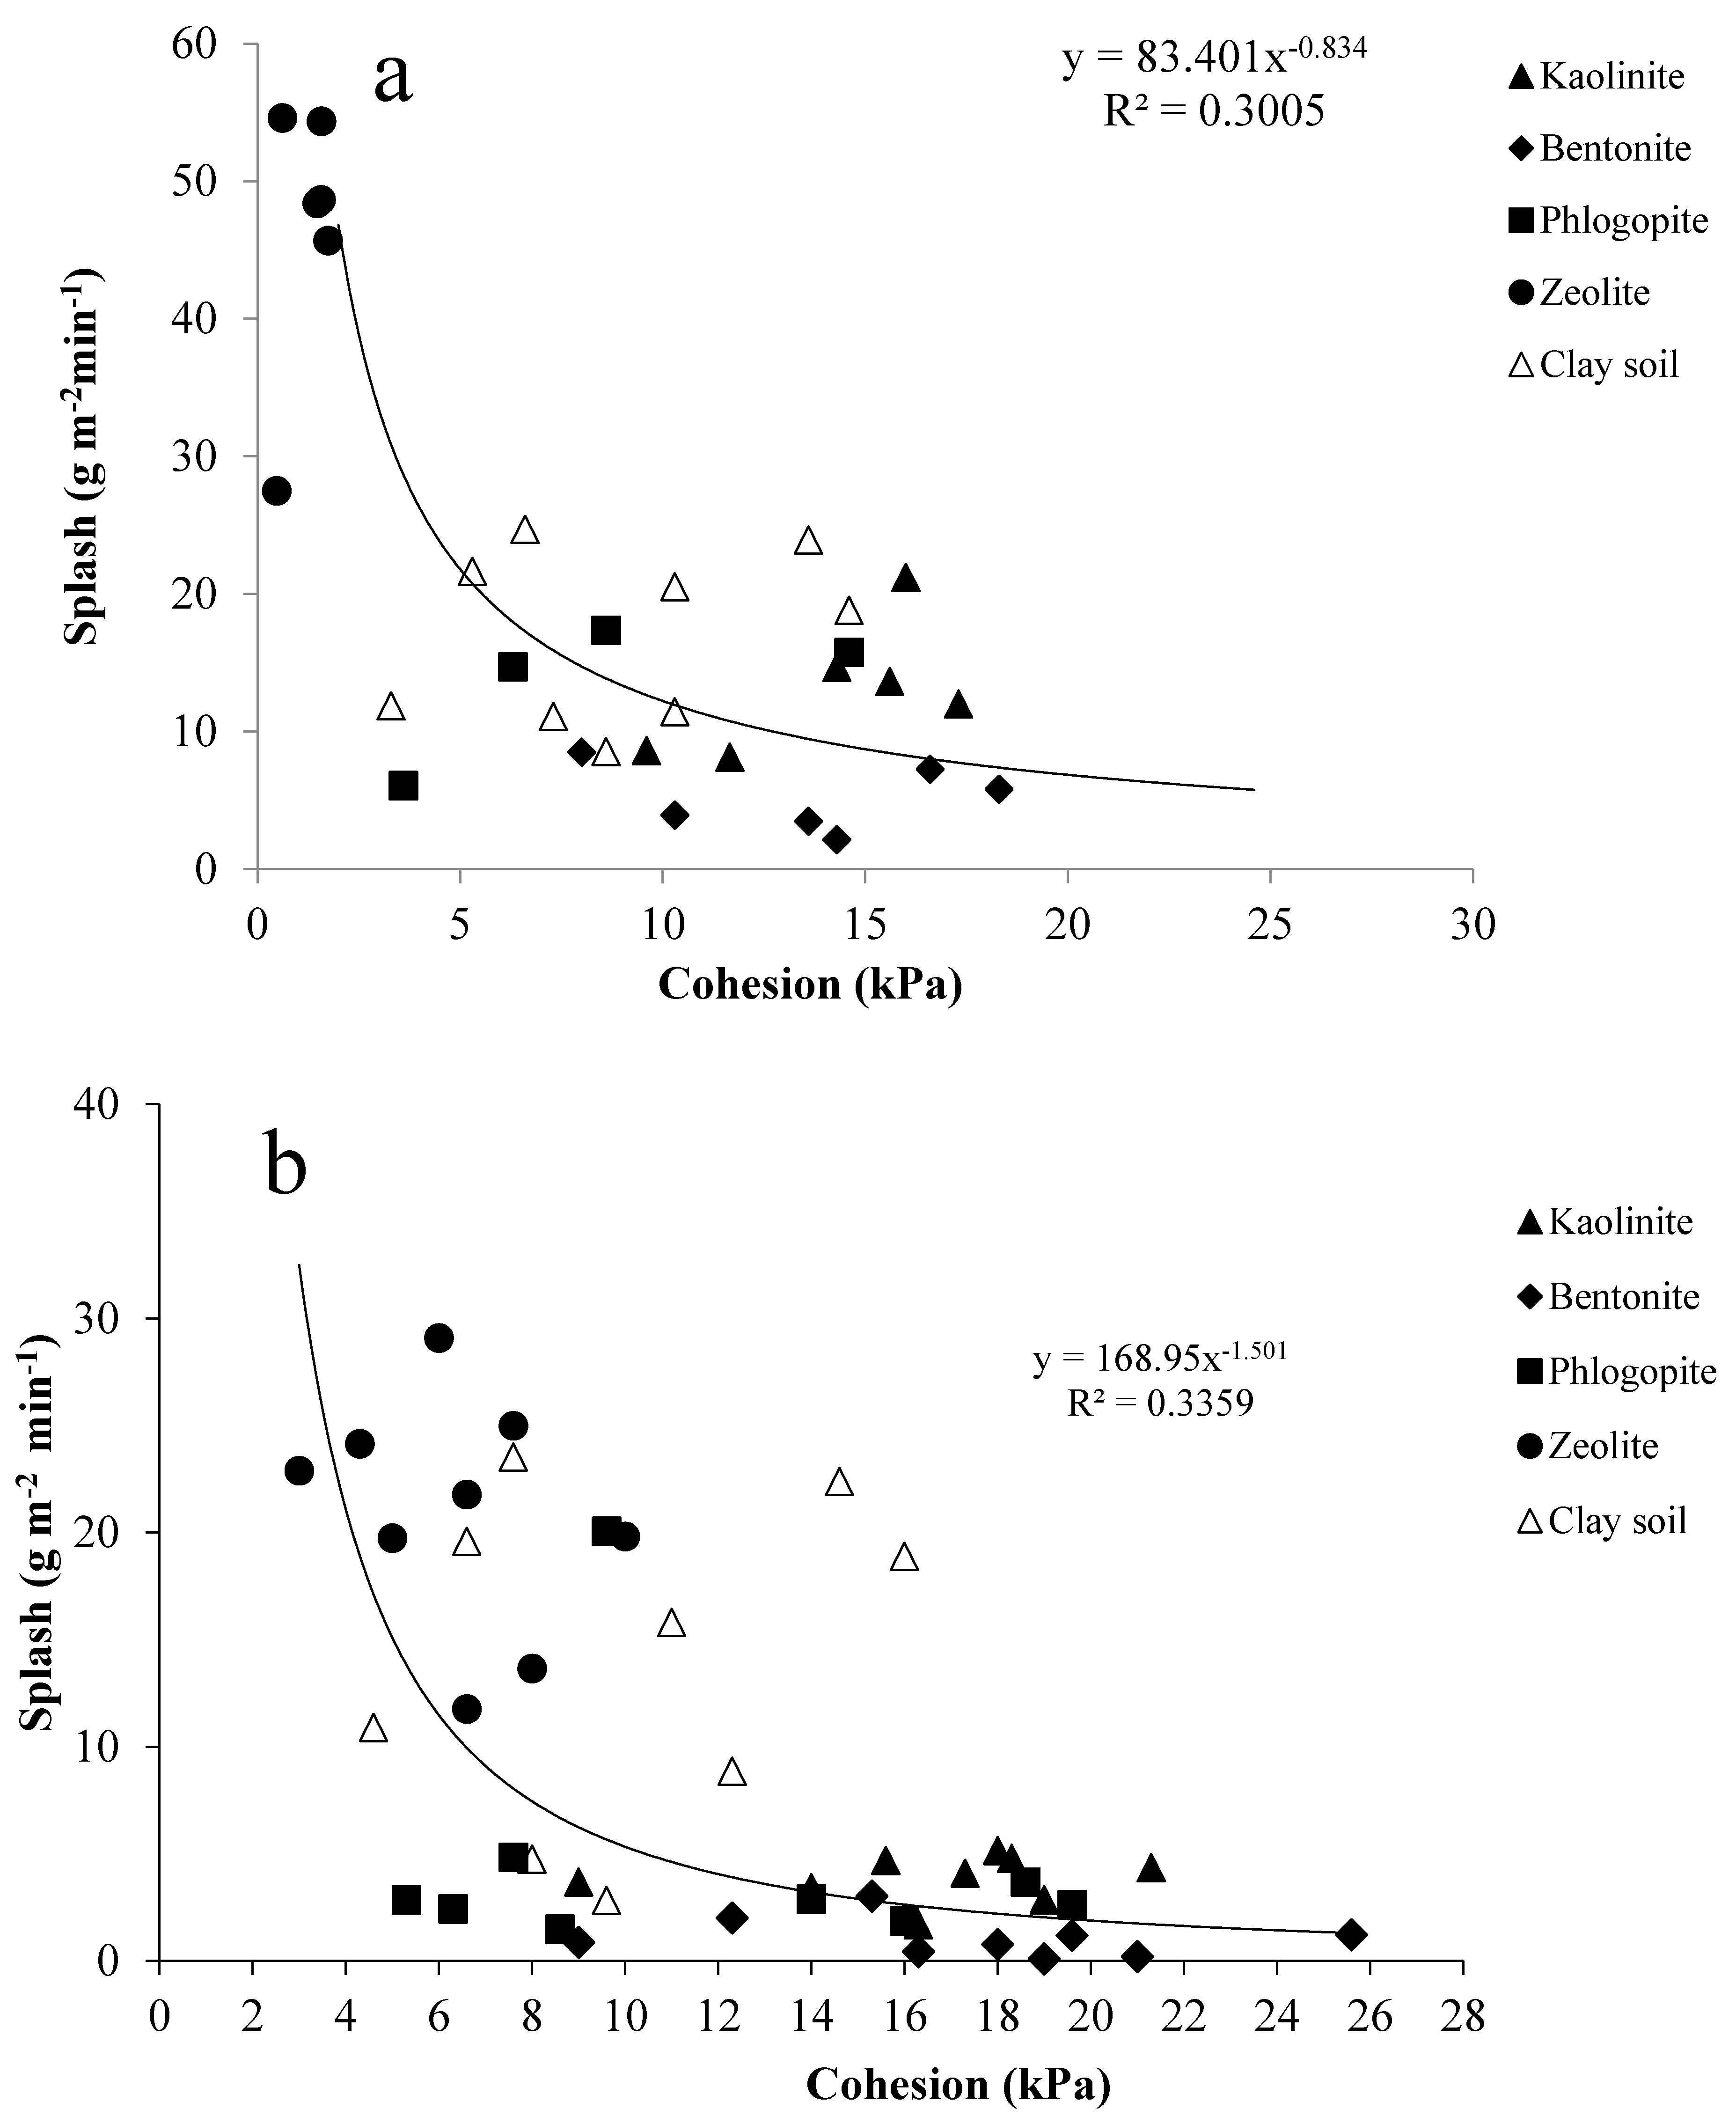
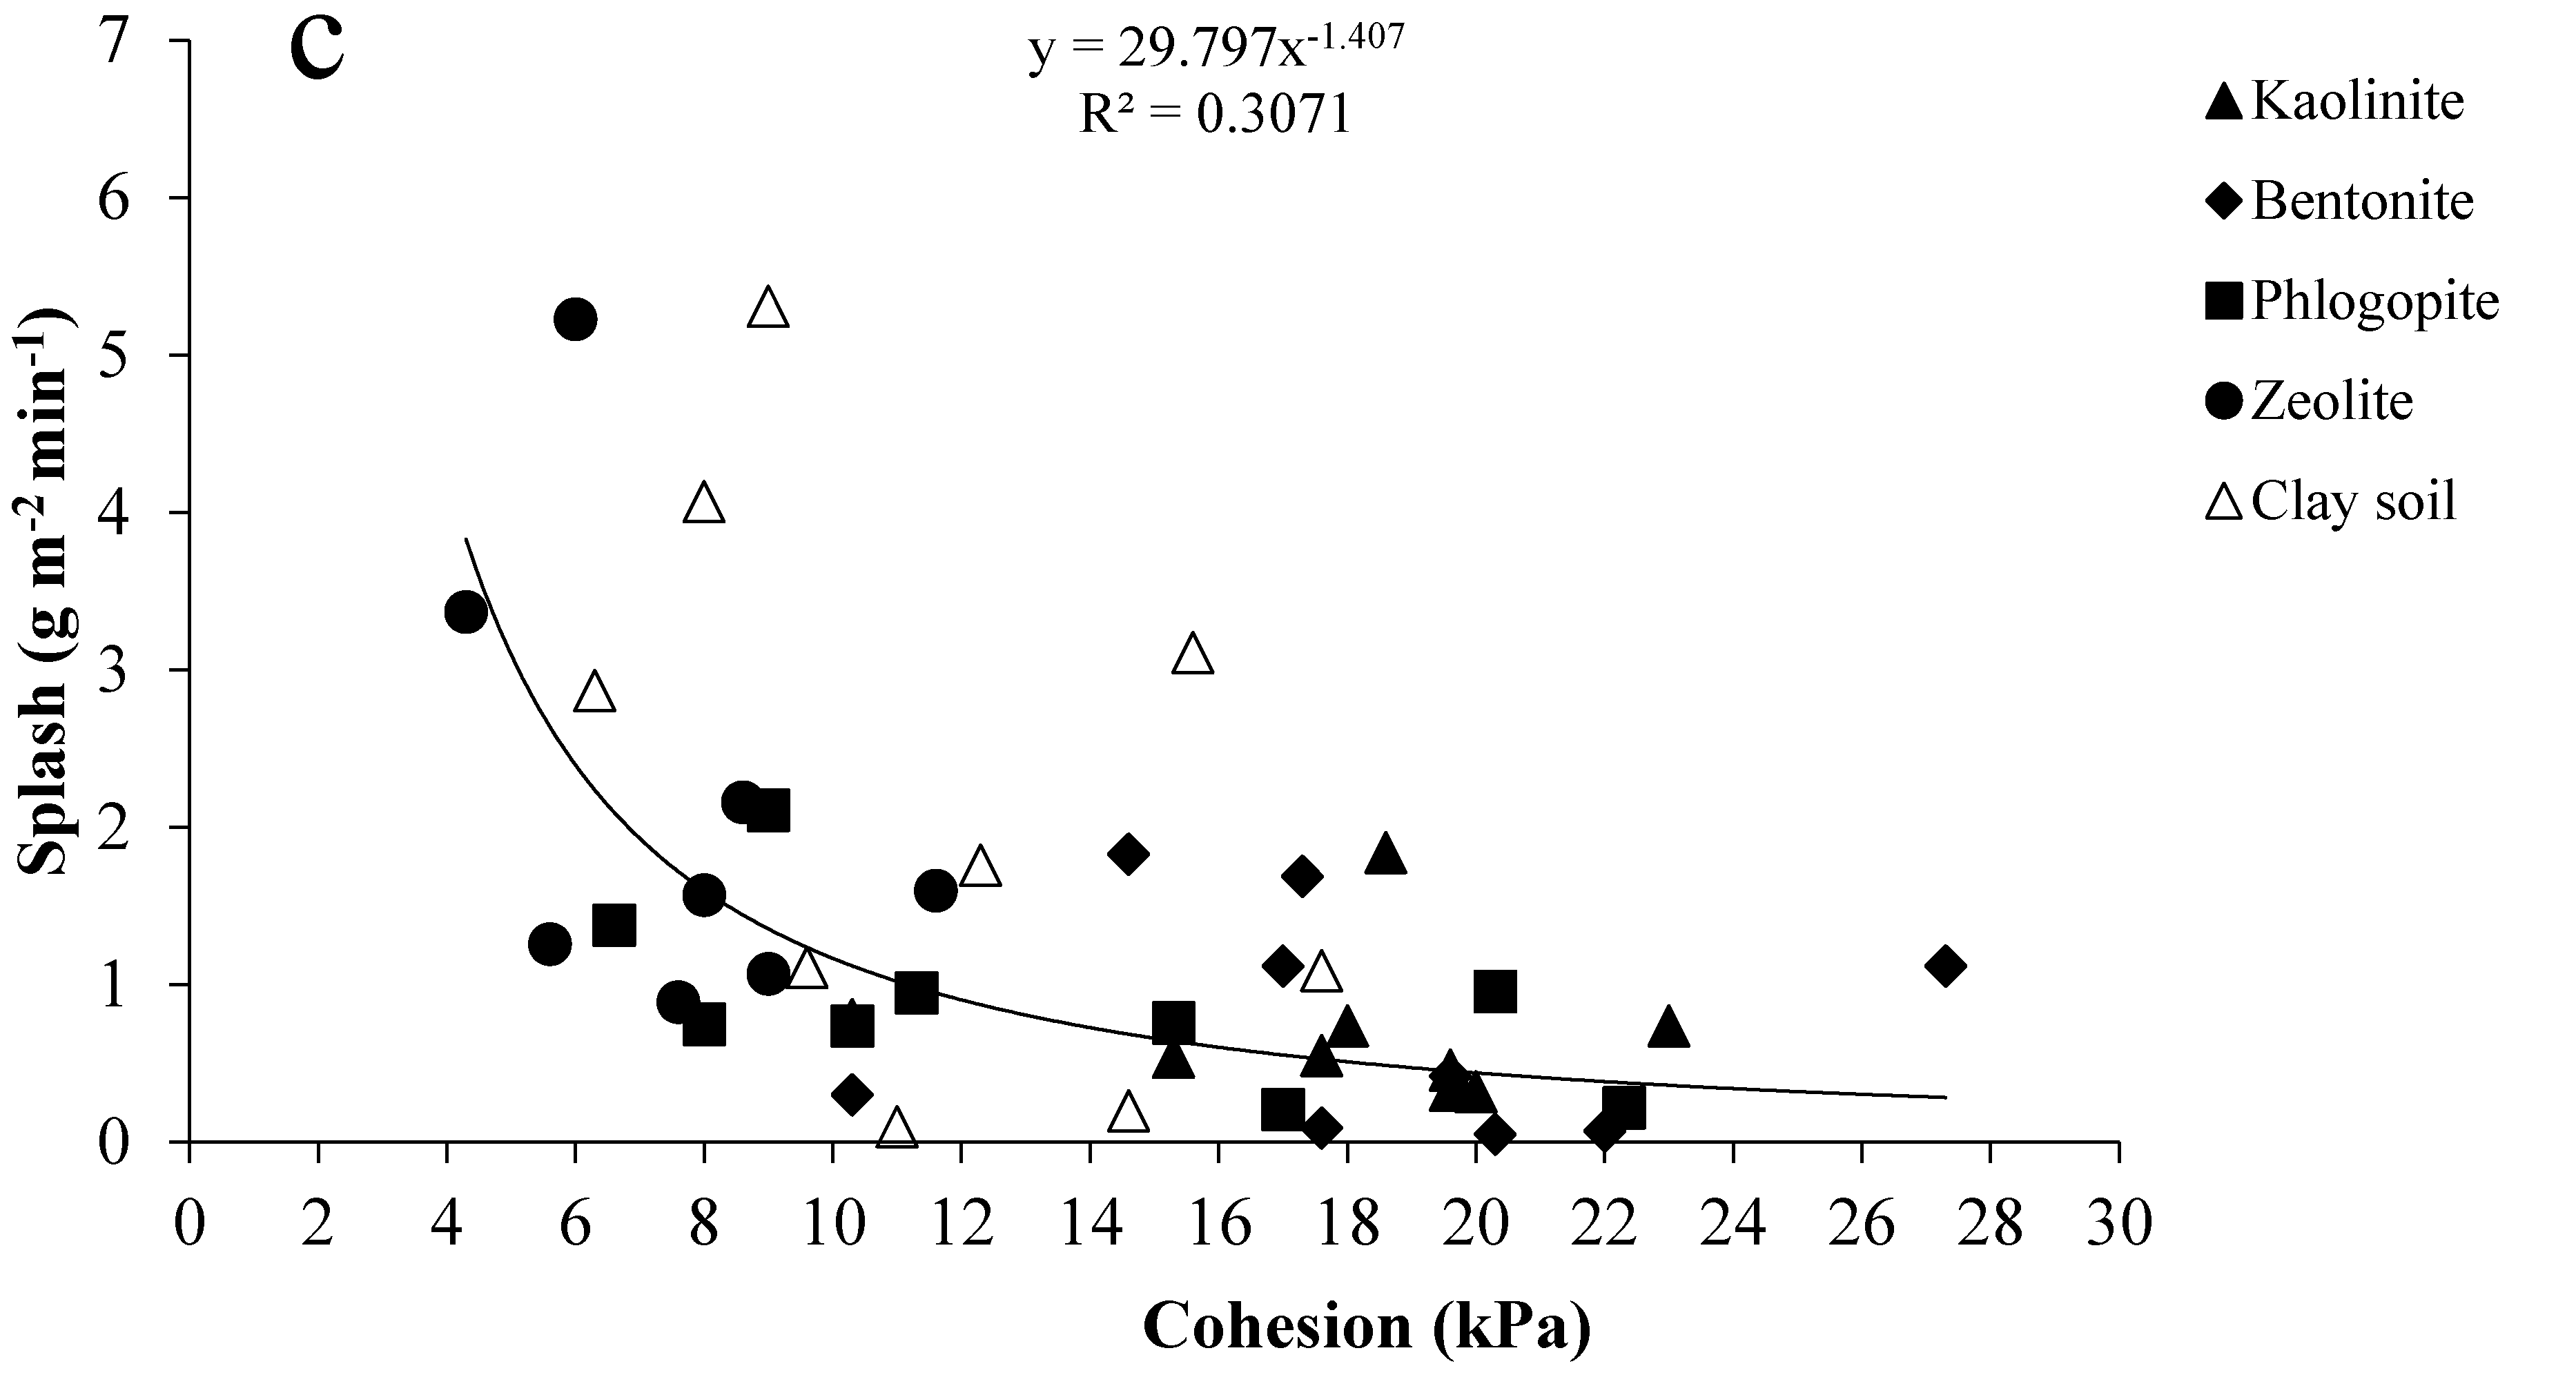
The relationships between splash erosion and shear strength following different W&D cycles for all studied clay–sand mixtures are presented in Figure 5. The results show that an increase in the cohesion of clay–sand mixtures led to a decrease in splash erosion. Splash erosion showed a diverse relationship with cohesion (Figure 5). These results are in line with the findings of Torri et al. [25], Rachman et al. [65], and Wuddivira et al. [61], who indicated that a rise in soil shear strength decreased soil erosion and splash erosion. Our power model suggested many mechanistic facts by showing that erodibility declined as shear strength rose up to a threshold, after which erodibility did not further decrease and remained at a constant level. Similarly, Wuddivira et al. [61] reported that a nonlinear power model resulted in the finest fit for the association between splash erosion and shear strength (R2 = 0.851).
Following W&D cycling, cohesion increased, which directly decreased the rate of splash erosion (Figure 5a–c). Nearing and Bradford [66] and Mouzai and Bouhadef [44] stated that the wetting and drying process directly increased aggregation, soil consistency, and cohesion. Furthermore, they reported that all of these positive processes would decrease soil splash erosion. However, based on the correlation of soil cohesion and splash erosion after dry and wet periods, it could be concluded that there are probably more controlling factors that need to be considered in future investigations.
4. Conclusions
- (1)
- The impacts of clay percent and clay type on the cohesion and splash erosion of clay–sand mixtures were studied at different initial water states in comparison with a clay soil under controlled conditions. The results revealed that the highest values of splash erosion were observed in the samples without the wetting and drying cycle. Furthermore, the splash erosion rate decreased following the drying and wetting cycles.
- (2)
- The lowest splash erosion rate was observed at an intermediate water content (i.e., plastic limit) compared with lower (air-dry) and higher (liquid limit) water statuses. Increases in the clay content led to decreases splash erosion due to structure formation in the clay–sand mixtures.
- (3)
- The shear strength of the clay–sand mixtures significantly increased following the wetting and drying cycles. The cohesion showed the following order for the clay–sand mixtures: bentonite > kaolinite > phlogopite > clay soil > zeolite. However, splash erosion showed the following order for the studied clay–sand mixtures: zeolite > clay soil > phlogopite > kaolinite > bentonite. These results show that splash erosion is not solely controlled by shear strength.
- (4)
- Nonlinear power relations were obtained between splash erosion and cohesion, showing that shear strength could explain about 30–33% of the splash erosion variability in the studied clay–sand mixtures.
Author Contributions
Conceptualization, S.A. and M.R.M.; Formal analysis, A.M.; Investigation, A.M., M.Z. and S.A.; Resources, S.A.; Visualization, M.Z.; Writing—original draft, M.Z.; Writing—review and editing, S.A., M.R.M., S.Z. and M.Z. All authors have read and agreed to the published version of the manuscript.
Funding
This work was supported by the Isfahan University of Technology, Isfahan, Iran.
Data Availability Statement
Data are contained in the tables of the article.
Acknowledgments
The authors thank the Isfahan University of Technology for their financial support. The authors also thank the reviewers for their constructive suggestions on the modification and improvement of the manuscript.
Conflicts of Interest
The authors declare no conflict of interest.
References
- Abbaszadeh Afshar, F.; Ayoubi, S.; Jalalian, A. Soil redistribution rate and its relationship with soil organic carbon and total nitrogen using 137Cs technique in a cultivated complex hillslope in western Iran. J. Environ. Radioact. 2010, 101, 606–614. [Google Scholar] [CrossRef]
- Khalili Moghadam, B.; Jabarifar, M.; Bagheri, M.; Shahbazi, E. Effects of land use change on soil splash erosion in the semi-arid region of Iran. Geoderma 2015, 241–242, 210–220. [Google Scholar] [CrossRef]
- Legout, C.; Leguedois, S.; Le Bissonnais, Y.; Issa, O.M. Splash distance and size distribution for various soils. Geoderma 2005, 124, 279–292. [Google Scholar] [CrossRef]
- Wei, Y.; Wu, X.; Cai, C. Splash erosion of clay-sand mixtures and its relationship with soil physical properties: The effects of particle size distribution on soil structure. Catena 2015, 135, 254–262. [Google Scholar] [CrossRef]
- Soil Erosion and Conservation, 3rd ed.; Blackwell Publishing: Oxford, UK, 2005; 303p.
- Angulo-Martinez, M.; Begueria, S.; Navas, A.; Machin, J. Splash erosion under natural rainfall on three soil types in NE Spain. Geomorphology 2010, 175–176, 38–44. [Google Scholar] [CrossRef]
- Ma, Q.; Zhang, K.; Cao, Z.; Wei, M. Soil detachment by overland flow on steep cropland in the subtropical region of China. Hydrol. Process. 2020, in press. [Google Scholar] [CrossRef]
- Bisal, F. The effect of raindrop size and impact velocity on sand splash. Can. J. Soil Sci. 1960, 40, 242–245. [Google Scholar] [CrossRef] [Green Version]
- Ellison, W.D. Studies of raindrop size erosion. Agric. Eng. 1944, 25, 131–136. [Google Scholar]
- Ting, M.; Chenghu, Z.; Tongxin, Z.; Qiangguo, C. Modeling raindrop impact and splash erosion processes within a spatial cell: A stochastic approach. Earth Surf. Process. Landf. 2008, 33, 712–723. [Google Scholar]
- Kinnell, P.I.A. Raindrop-impact-induced erosion processes and prediction: A review. Hydrol. Process. 2005, 19, 2815–2844. [Google Scholar] [CrossRef]
- Fernández-Raga, M.; Fraile, R.; Keizer, J.J.; Tiejiero, M.E.V.; Castro, A.; Palencia, C.; Calvo, I.; Ghahramani, A.; Ishikawa, Y.; Gomi, T.; et al. Effect of ground cover on splash and sheetwash erosion over a steep forested hillslope: A plot-scale study. Catena 2011, 85, 34–47. [Google Scholar]
- Saedi, T.; Shorafa, M.; Gorji, M.; KhaliliMoghadam, B. Indirect and direct effects of soil properties on soil splash erosion rate in calcareous soils of the central Zagross, Iran: A laboratory study. Geoderma 2016, 271, 1–9. [Google Scholar] [CrossRef]
- Ekwue, E.I. The effects of soil organic matter content. Rainfall duration and aggregate size on soil detachment. Soil Technol. 1991, 4, 197–207. [Google Scholar] [CrossRef]
- Jomaa, S.; Barry, D.A.; Brovelli, A.; Sander, G.C.; Parlange, J.Y.; Heng, B.C.P.; Tromp-van Meerveld, H.J. Effect of raindrop splash and transversal width on soil erosion: Laboratory flume experiments and analysis with the Hairsine-Rose model. J. Hydrol. 2010, 395, 117–132. [Google Scholar] [CrossRef]
- Qinjuan, C.H.; Qiangguo, C.; Wenjun, M.A. Comparative study on rain splash erosion of representative soils in China. Chin. Geogr. Sci. 2008, 18, 155–161. [Google Scholar]
- Planchon, O.; Esteves, M.; Silvera, N.; Lapetite, J.M. Raindrop erosion of tillage induced microrelief: Possible use of the diffusion equation. Soil Tillage Res. 2000, 56, 131–144. [Google Scholar] [CrossRef]
- Ayoubi, S.; Mokhtari, J.; Mosaddeghi, M.R.; Zeraatpisheh, M. Erodibility of calcareous soils as influenced by land use and intrinsic soil properties in a semiarid region of central Iran. Environ. Monit. Assess. 2018, 190, 192. [Google Scholar] [CrossRef] [PubMed]
- Al-Shayea, N.A. The combined effect of clay and moisture content on the behavior of remolded unsaturated soils. Eng. Geol. 2001, 62, 319–342. [Google Scholar] [CrossRef]
- Mamedov, A.I.; Huang, C.; Levy, G.J. Antecedent moisture content and aging duration effects on seal formation and erosion in smectitic soils. Soil Sci. Soc. Am. J. 2006, 70, 832–843. [Google Scholar] [CrossRef]
- Wan, Y.; El-Swaify, S.A.; Sutherland, R.A. Partitioning interrill splash and wash dynamics: A novel laboratory approach. Soil Technol. 1996, 9, 55–69. [Google Scholar] [CrossRef]
- Victora, C.; Kacevas, A.; Fiori, H. Soil erodibility assesments with simulated rainfall and with the USLE nomograph in soil from Uruguay. In Proceedings of the 16th World Congress Soil Science, Montpellier, France, 20–26 August 1998; p. 1041. [Google Scholar]
- Piccarreta, M.; Faulkner, H.; Bentivenga, M.; Capolongo, D. The influence of physic-chemical material properties of erosion process in the badlands of Basilicata, Southern Italy. Geology 2006, 29, 235–251. [Google Scholar]
- Poesen, J. An improved splash transport model. Geology 1985, 29, 193–211. [Google Scholar]
- Torri, D.; Sfalanga, M.; Delsette, M. Splash detachment: Runoff depth and soil cohesion. Catena 1987, 14, 149–155. [Google Scholar] [CrossRef]
- Wuddivira, M.N.; Stone, R.J.; Ekwue, E.I. Clay, Organic Matter, and Wetting Effects on Splash Detachment and Aggregate Breakdown under Intense Rainfall. Soil Sci. Soc. Am. J. 2009, 73, 226–232. [Google Scholar] [CrossRef]
- Huang, X.; Lin, L.; Ding, S.; Tian, Z.; Zhu, X.; Wu, K.; Zhao, Y. Characteristics of Soil Erodibility K Value and Its Influencing Factors in the Changyan Watershed, Southwest Hubei, China. Land 2022, 11, 134. [Google Scholar] [CrossRef]
- Ma, R.T.; Guo, W.; Hu, F.N.; Xu, C.Y.; Liu, G.; Zhao, S.W.; Zheng, F.L. Effects of soil internal forces on splash detachment and transport of aggregate fragments in Mollisols of Northeast China. Eur. J. Soil Sci. 2022, 73, 3273. [Google Scholar] [CrossRef]
- Zambon, N.; Johannsen, L.L.; Strauss, P.; Dostal, T.; Zumr, D.; Cochrane, T.A.; Klik, A. Splash erosion affected by initial soil moisture and surface conditions under simulated rainfall. Catena 2021, 196, 104827. [Google Scholar] [CrossRef]
- Hu, F.; Liu, J.; Xu, C.; Wang, Z.; Liu, G.; Li, H.; Zhao, S. Soil internal forces initiate aggregate breakdown and splash erosion. Geoderma 2018, 320, 43–51. [Google Scholar] [CrossRef]
- Spera, S.T.; Denardin, J.E.; Escosteguy, P.A.V.; Santos, H.P.; Figueroa, E.A. Clay dispersion in microaggregates of soil incubated with limestone. Rev. Bras. De Ciência Do Solo 2008, 32, 2613–2620. [Google Scholar] [CrossRef] [Green Version]
- Marchuk, A.; Rengasamy, P.; McNeill, A.; Kumar, A. Nature of the clay-cation bond affects soil structure as verified by X-ray computed tomography. Soil Res. 2012, 50, 638–644. [Google Scholar] [CrossRef]
- Wei, Y.; Wu, X.; Xia, J.; Miller, G.A.; Cai, C.; Guo, Z.; Arash, H. The effect of water content on the shear strength characteristics of granitic soils in South China. Soil Till. Res. 2019, 187, 50–59. [Google Scholar] [CrossRef]
- Soil Survey Staff. Keys to Soil Taxonomy; United States Department of Agriculture: Washington, DC, USA, 2014. [Google Scholar]
- Kittrick, J.A.; Hope, E.W. A procedure for the particle size separation of soils for X-ray diffraction analysis. Soil Sci. 1963, 96, 312–325. [Google Scholar] [CrossRef]
- Moore, D.M.; Reynolds, R.C., Jr. X-ray Diffraction and the Identification and Analysis of Clay Minerals, 2nd ed.; Oxford University Press: New York, NY, USA, 1997. [Google Scholar]
- BSI (British Standards Institution). British Standards Institution). British Standard Methods of Test for Soils for Civil Engineering Campbell, D.J. 2001. Liquid and plastic limits. In Soil and Environmental Analysis-Physical Methods; Smith, K.A., Mullins, C.E., Eds.; Dekker Inc.: New York, NY, USA, 2000; pp. 349–375. [Google Scholar]
- Ellison, W.D. Soil erosion studies-part 2: Soil detachment hazard by raindrop splash. Agric. Eng. 1947, 28, 197–201. [Google Scholar]
- Nasri, M.; Modarres, R. Dry spell trend analysis of Isfahan Province, Iran. Int. J. Climatol. A J. R. Meteorol. Soc. 2009, 29, 1430–1438. [Google Scholar] [CrossRef]
- Morgan, R.P.C. Field studies of rainsplash erosion. Earth Surf. Proc. Land 1978, 3, 295–299. [Google Scholar] [CrossRef]
- Wilding, L.P. Spatial variability: Its documentation, accommodation and implica tion to soil surveys. In Soil Spatial Variability; Nielsen, D.R., Bouma, J., Eds.; Pudoc: Wageningen, The Netherlands, 1985; pp. 166–194. [Google Scholar]
- Rajarama, G.; Erbach, D.C. Effect of wetting and drying on soil physical properties. J. Terramech. 1999, 36, 39–49. [Google Scholar] [CrossRef]
- Dexter, A.; Kroesbergen, B.; Kuipers, H. Some mechanical properties of aggregates of top soils from the IJsselmeerpolders. 2. Remoulded soil aggregates and the effects of wetting and drying cycles. Neth. J. Agri. Sci. 1984, 32, 215–227. [Google Scholar]
- Mouzai, L.; Bouhadef, M. Shear strength of compacted soil: Effects on splash erosion by single water drops. Earth Surf. Proc. Land 2011, 36, 87–96. [Google Scholar] [CrossRef]
- Mohamed, T.; Ali, F.; Hashim, S.; Huat, B. Relationship between shear strength and soil water characteristic curve of an unsaturated granitic residual soil. Am. J. Environ. Sci. 2006, 2, 142–145. [Google Scholar] [CrossRef]
- Tariq, B.H.; Miller, G.A. A constitutive model for unsaturated soil interfaces. Int. J. Numer. Anal. Met. 2008, 32, 1693–1714. [Google Scholar]
- Shanyoug, W.; Chan, D. Experimental study of the fines content on dynamic compaction grouting in completely decomposed grantie of Hong Kong. Cons. Build. Mater. 2009, 23, 1249–1264. [Google Scholar]
- Tiwari, B.; Marui, H. A new method for the correlation of residual shear strength of soil with mineralogical composition. Geothech. Geoenviron. Eng. J. 2005, 131, 1139–1150. [Google Scholar] [CrossRef]
- Domitrović, D.; Kovačević Zelić, B. The relationship between swelling and shear strength properties of bentonites. In Proceedings of the 18th International Conference on Soil Mechanics and Geotechnical Engineering, Paris, France, 2–6 September 2013. [Google Scholar]
- Müller-Vonmoos, M.; Løken, T. The shearing behaviour of clays. Appl. Clay Sci. 1989, 4, 125–141. [Google Scholar] [CrossRef]
- Vallejo, L.E.; Mawby, R. Porosity influence on the shear strength of granular material–clay mixtures. Eng. Geol. 2000, 58, 125–136. [Google Scholar] [CrossRef]
- Nagaraj, H. Influence of gradation and proportion of sand on stress–strain behavior of clay-sand mixtures. Int. J. Geo. Eng. 2016, 7, 19. [Google Scholar] [CrossRef] [Green Version]
- Karim, M.E.; Alam, M.J. Effect of nonplastic silt content on undrained shear strength of sand–silt mixtures. Int. J. Geo. Eng. 2017, 8, 14. [Google Scholar] [CrossRef] [Green Version]
- Horn, R.; Dexter, A. Dynamics of soil aggregation in an irrigated desert loess. Soil Tillage Res. 1989, 13, 253–266. [Google Scholar] [CrossRef]
- Farahani, E.; Mosaddeghi, M.R.; Mahboubi, A.A.; Dexter, A.R. Prediction of soil hard-setting and physical quality using water retention data. Geoderma 2019, 338, 343–354. [Google Scholar] [CrossRef]
- Quansah, C. The effect of soil type, slope, rain intensity and their interactions on splash detachment and transport. Soil Sci. J. 1981, 32, 215–224. [Google Scholar] [CrossRef]
- Fernandez-Raga, M.; Palencia, C.; Keesstra, S.; Jordan, A.; Fraile, R.; Angulo-Martinez, M.; Cerda, A. Splash erosion: A review with unanswered questions. Earth-Sci. Rev. 2017, 171, 463–477. [Google Scholar] [CrossRef]
- Luk, S. Effect of soil properties on erosion by wash and splash. Earth Surf. Process. 1979, 4, 241–255. [Google Scholar] [CrossRef]
- Levy, G.J.; Mamedov, A.I.; Goldstein, D. Sodicity and water quality effects on slaking of aggregates from semi-arid soils. Soil Sci. 2003, 168, 552–562. [Google Scholar] [CrossRef]
- Zaher, H.; Caron, J. Aggregate slaking during rapid wetting: Hydrophobicity and pore occlusion. Can. J. Soil Sci. 2008, 88, 85–97. [Google Scholar] [CrossRef]
- Wuddivira, M.N.; Stone, R.J.; Ekwue, E.I. Influence of cohesive and disruptive forces on strength and erodibility of tropical soils. Soil Till. Res. 2013, 133, 40–48. [Google Scholar] [CrossRef]
- Lado, M.; Ben-Hur, M. Soil mineralogy effects on seal formation, runoff and soil loss. Appl. Clay Sci. 2004, 24, 209–224. [Google Scholar] [CrossRef]
- Six, J.; Elliott, E.; Paustian, K. Soil structure and soil organic matter II. A normalized stability index and the effect of mineralogy. Soil Sci. Soc. Am. J. 2000, 64, 1042–1049. [Google Scholar] [CrossRef]
- Yilmaz, K.; Çelik, I.; Kapur, S.; Ryan, J. Clay minerals, Ca/Mg ratio and Fe-Al-oxides in relation to structural stability, hydraulic conductivity and soil erosion in southeastern Turkey. Turk. J. Agric. For. 2005, 29, 29–37. [Google Scholar]
- Rachman, A.; Anderson, S.H.; Gantzer, C.J.; Thompson, A.L. Influence of long term cropping systems on soil physical properties related to soil erosibility. Soil Sci. Soc. Am. J. 2003, 67, 637–644. [Google Scholar] [CrossRef]
- Nearing, M.A.; Bradford, J.M. Single water drop splash detachment and mechanical properties of soils. Soil Sci. Am. J. 1985, 49, 547–551. [Google Scholar] [CrossRef]
Figure 1.
X-ray diffractograms of the clay soil collected from the Charmahal and Bakhtiari province for laboratory analysis.
Figure 1.
X-ray diffractograms of the clay soil collected from the Charmahal and Bakhtiari province for laboratory analysis.

Figure 2.
Schematic setup of splash tray used in this experiment.

Figure 3.
Comparisons of the mean interaction effects of clay type and percentage on the cohesion (kPa) of clay–sand mixtures and clay soil (LSD0.05) without wetting and drying (W&D) cycles (a), after one cycle of W&D (b), and after two cycles of W&D (c). Different letters in the same column indicate significant differences (p < 0.05) among land uses. For example, two columns labelled with the “c” letter are not statistically different, but columns labelled with the “a” and “b” letters are statistically different (p < 0.05).

Figure 4.
Comparisons of the mean interaction effects of clay type and percentage on the splash erosion (g cm−2) of clay–sand mixtures and clay soil (LSD0.05) without wetting and drying (W&D) cycles (a), after one cycle of W&D (b), and after two cycles of W&D (c). Different letters in the same column indicate significant differences (p < 0.05) among land uses. For example, two columns labelled with the “b” letter are not statistically different, but columns labelled with the “a” and “b” letters are statistically different (p < 0.05).

Figure 5.
Relationships between splash erosion and cohesion in clay–sand mixtures and clay soil following various wetting and drying cycles: (a) without wetting and drying (W&D) cycles, (b) after one cycle of W&D (c), and after two cycles of W&D.
Figure 5.
Relationships between splash erosion and cohesion in clay–sand mixtures and clay soil following various wetting and drying cycles: (a) without wetting and drying (W&D) cycles, (b) after one cycle of W&D (c), and after two cycles of W&D.


Table 1.
Liquid limit (LL) and plastic limit (PL) for the studied clay–sand mixtures and clay soil.
| Clay (kg 100 kg−1) | Water Content (kg 100 kg−1) | Treatment | ||||
|---|---|---|---|---|---|---|
| Kaolinite | Bentonite | Phlogopite | Zeolite | Clay Soil | ||
| 45 | PL | 22.4 | 27.6 | 7.2 | 7.4 | 12 |
| LL | 69.8 | 134.9 | 22.7 | 23.2 | 25 | |
| 30 | PL | 15.4 | 22.9 | 4.9 | 6.3 | 9 |
| LL | 48.1 | 119.2 | 15.2 | 19.7 | 18.7 | |
| 15 | PL | 9.3 | 14.3 | 4.6 | 5.8 | 8.2 |
| LL | 29.1 | 74.9 | 14.3 | 18.2 | 17 | |
Table 2.
Summary of statistics of the splash erosion rate (g m−2 min−1) for the studied clay–sand mixtures and clay soil at different water contents and clay contents (kg 100 kg−1) in various wetting and drying (W&D) cycles (N = 45).
Table 2.
Summary of statistics of the splash erosion rate (g m−2 min−1) for the studied clay–sand mixtures and clay soil at different water contents and clay contents (kg 100 kg−1) in various wetting and drying (W&D) cycles (N = 45).
| Treatments | Min | Max | Range | Mean | SD | CV % | Skewness |
|---|---|---|---|---|---|---|---|
| Without W&D | |||||||
| Air-dry | 0.321 | 5.472 | 5.151 | 2.155 | 1.565 | 72.66 | 1.13 |
| PL | 0.065 | 2.27 | 2.205 | 0.915 | 0.701 | 76.6 | 0.79 |
| LL | 0.193 | 5.52 | 5.327 | 1.91 | 1.438 | 75.3 | 1.23 |
| 45 | 0.065 | 4.952 | 4.887 | 1.342 | 1.19 | 88.7 | 1.74 |
| 30 | 0.101 | 5.472 | 5.371 | 1.768 | 1.456 | 82.3 | 1.38 |
| 15 | 0.165 | 5.52 | 5.355 | 1.87 | 1.482 | 79.2 | 1.33 |
| One cycle of W&D | |||||||
| Air-dry | 0.074 | 2.53 | 2.456 | 1.062 | 0.93 | 87.5 | 0.45 |
| PL | 0.001 | 2.31 | 2.309 | 0.6 | 0.696 | 116 | 1.46 |
| LL | 0.018 | 2.95 | 2.923 | 1.025 | 0.94 | 91.7 | 0.67 |
| 45 | 0.001 | 201.7 | 2.016 | 0.615 | 0.661 | 107.4 | 1.07 |
| 30 | 0.016 | 2.53 | 2.514 | 0.888 | 0.891 | 100.3 | 0.79 |
| 15 | 0.059 | 2.95 | 2.891 | 1.183 | 0.986 | 83.4 | 0.43 |
| Two cycles of W&D | |||||||
| Air-dry | 0.058 | 5.04 | 0.482 | 0.201 | 0.125 | 62.5 | 1.28 |
| PL | 0.002 | 0.392 | 0.39 | 0.093 | 0.098 | 105.7 | 1.62 |
| LL | 0.002 | 0.73 | 0.728 | 0.187 | 0.197 | 105.3 | 1.53 |
| 45 | 0.002 | 0.2 | 0.198 | 0.066 | 0.05 | 75.3 | 0.51 |
| 30 | 0.002 | 0.318 | 0.316 | 0.122 | 0.081 | 65.9 | 0.79 |
| 15 | 0.018 | 0.73 | 0.712 | 0.293 | 0.185 | 63 | 0.68 |
Min: minimum; Max: maximum; SD: standard deviation; CV: coefficient of variation; LL: liquid limit; PL: plastic limit.
Table 3.
Summary of statistics of cohesion (kPa) for the studied clay–sand mixtures and clay soil at different water contents and clay contents (kg 100 kg−1) in various wetting and drying (W&D) cycles (N = 45).
Table 3.
Summary of statistics of cohesion (kPa) for the studied clay–sand mixtures and clay soil at different water contents and clay contents (kg 100 kg−1) in various wetting and drying (W&D) cycles (N = 45).
| Treatments | Min | Max | Range | Mean | SD | CV % | Skewness |
|---|---|---|---|---|---|---|---|
| Without W&D | |||||||
| Air-dry | 3.0 | 20 | 17 | 11.3 | 4.9 | 43.60 | 0.01 |
| PL | 5.0 | 25 | 20 | 13.8 | 5.6 | 40.60 | −0.05 |
| LL | 2.0 | 18 | 16 | 8.0 | 4.5 | 56.1 | 0.56 |
| 45 | 5.0 | 25 | 20 | 13.9 | 5.6 | 40.5 | 0.09 |
| 30 | 3.0 | 19 | 16 | 11.6 | 4.9 | 42.7 | −0.30 |
| 15 | 1.0 | 16 | 14 | 7.7 | 4.2 | 54.5 | 0.55 |
| One cycle of W&D | |||||||
| Air-dry | 4.0 | 21 | 17 | 12.6 | 5.0 | 39.9 | −0.05 |
| PL | 6.0 | 26 | 20 | 15.2 | 5.6 | 37.4 | −0.12 |
| LL | 3.0 | 19 | 16 | 9.4 | 4.7 | 50.0 | 0.72 |
| 45 | 6.0 | 26 | 20 | 15 | 5.6 | 36.9 | 0.01 |
| 30 | 5.0 | 20 | 15 | 13 | 5.0 | 38.6 | −0.28 |
| 15 | 3.0 | 18 | 15 | 8.9 | 4.4 | 49.4 | 0.70 |
| Two cycles of W&D | |||||||
| Air-dry | 6.0 | 22 | 16 | 14.1 | 5.0 | 35.5 | −0.14 |
| PL | 7.0 | 28 | 16.5 | 16.5 | 5.8 | 35.4 | −0.04 |
| LL | 4.0 | 21 | 10.7 | 10.7 | 4.7 | 44.3 | 0.68 |
| 45 | 7.0 | 28 | 21 | 16.6 | 5.6 | 33.8 | 0.01 |
| 30 | 5.0 | 23 | 18 | 14.2 | 5.1 | 36.6 | −0.12 |
| 15 | 4.0 | 20 | 16 | 10.6 | 4.7 | 44.4 | 0.74 |
Min: minimum; Max: maximum; SD: standard deviation; CV: coefficient of variation; LL: liquid limit; PL: plastic limit.
Table 4.
Comparisons of the mean effects of treatments on the cohesion (kPa) of the studied clay–sand mixtures and clay soil.
Table 4.
Comparisons of the mean effects of treatments on the cohesion (kPa) of the studied clay–sand mixtures and clay soil.
| Without W&D Cycle | After One W&D Cycle | After Three W&D Cycles | |
|---|---|---|---|
| Clay type | |||
| Phlogopite | 7.8 c | 8.8 c | 10.0 b |
| Bentonite | 11.9 a | 13.0 a | 13.8 a |
| Kaolinite | 11.3 b | 12.4 b | 13.5 a |
| Zeolite | 3.8 e | 4.7 e | 5.8 d |
| Clay soil | 6.6 d | 7.5 d | 8.6 c |
| Clay content (kg 100 kg−1) | |||
| 45 | 13.9 a | 15.2 a | 16.6 a |
| 30 | 7.7 c | 8.9 c | 10.6 c |
| 15 | 11.6 b | 13.0 b | 14.2 b |
| Water status | |||
| Air-dry | 8.5 b | 9.5 b | 10.6 b |
| PL | 10.4 a | 11.4 a | 12.4 a |
| LL | 6.0 c | 7.0 c | 8.0 c |
LL: liquid limit; PL: plastic limit; W&D: wetting and drying. In each column and each group, figures followed by similar letters are not significantly different at p < 0.05 (LSD).
Table 5.
Comparisons of the mean effects of treatments on the splash erosion (g m−2 min−1) of the studied clay–sand mixtures and clay soil.
Table 5.
Comparisons of the mean effects of treatments on the splash erosion (g m−2 min−1) of the studied clay–sand mixtures and clay soil.
| Without W&D Cycle | After One W&D Cycle | After Three W&D Cycles | |
|---|---|---|---|
| Clay type | |||
| Phlogopite | 10.60 c | 5.06 c | 2.58 c |
| Bentonite | 4.41 d | 2.30 e | 2.03 d |
| Kaolinite | 10.42 c | 4.40 d | 2.11 d |
| Zeolite | 30.01 a | 17.16 a | 3.41 a |
| Clay soil | 14.21 b | 11.98 b | 3.03 b |
| Clay content (kg 100 kg−1) | |||
| 45% | 13.42 c | 6.15 c | 1.22 c |
| 30% | 18.70 a | 11.83 a | 5.72 a |
| 15% | 17.68 b | 8.88 b | 2.93 b |
| Water status | |||
| Air-dry | 17.31 a | 9.24 b | 1.76 b |
| PL | 6.86 b | 4.50 c | 0.70 c |
| LL | 17.61 a | 10.81 a | 5.45 a |
LL: liquid limit; PL: plastic limit; W&D: wetting and drying. In each column and each group, figures followed by similar letters are not significantly different at p < 0.05 (LSD).
Publisher’s Note: MDPI stays neutral with regard to jurisdictional claims in published maps and institutional affiliations. |
© 2022 by the authors. Licensee MDPI, Basel, Switzerland. This article is an open access article distributed under the terms and conditions of the Creative Commons Attribution (CC BY) license (https://creativecommons.org/licenses/by/4.0/).
Share and Cite
MDPI and ACS Style
Ayoubi, S.; Milikian, A.; Mosaddeghi, M.R.; Zeraatpisheh, M.; Zhao, S. Impacts of Clay Content and Type on Shear Strength and Splash Erosion of Clay–Sand Mixtures. Minerals 2022, 12, 1339. https://doi.org/10.3390/min12111339
AMA Style
Ayoubi S, Milikian A, Mosaddeghi MR, Zeraatpisheh M, Zhao S. Impacts of Clay Content and Type on Shear Strength and Splash Erosion of Clay–Sand Mixtures. Minerals. 2022; 12(11):1339. https://doi.org/10.3390/min12111339
Chicago/Turabian StyleAyoubi, Shamsollah, Anashia Milikian, Mohammad Reza Mosaddeghi, Mojtaba Zeraatpisheh, and Shuai Zhao. 2022. "Impacts of Clay Content and Type on Shear Strength and Splash Erosion of Clay–Sand Mixtures" Minerals 12, no. 11: 1339. https://doi.org/10.3390/min12111339
Note that from the first issue of 2016, this journal uses article numbers instead of page numbers. See further details here.