
Expansion Properties of Cemented Foam Backfill Utilizing Coal Gangue and Fly Ash
by
 , ,
, ,
Xiao Wang
1 ,
,
Jixiong Zhang
1,*,
Meng Li
1,
Feng Gao
2,
Abbas Taheri
3,*,
Binbin Huo
1 and
Ling Jin
1 1
School of Mines, State Key Laboratory of Coal Resources and Safe Mining, China University of Mining and Technology, Xuzhou 221116, China
2
State Key Laboratory for Geomechanics and Deep Underground Engineering, School of Mechanics and Civil Engineering, China University of Mining and Technology, Xuzhou 221116, China
3
Department of Mining, Queen’s University, Kingston, ON K7L3N6, Canada
*
Authors to whom correspondence should be addressed.
Minerals 2022, 12(6), 763; https://doi.org/10.3390/min12060763
Submission received: 16 May 2022
/
Revised: 5 June 2022
/
Accepted: 14 June 2022
/
Published: 15 June 2022
(This article belongs to the Special Issue Backfilling Materials for Underground Mining, Volume III)
Abstract
:The cemented backfill (CB) utilizing coal gangue (CG) and fly ash (FA) is widely applied in coal mines. However, the bleeding and shrinkage of CB leads to insufficient contact with surrounding rock, which is not beneficial for controlling roof subsidence and even stope stability. Herein, a cemented foam backfill (CFB) formulation is demonstrated, employing hydrogen dioxide (H2O2) as a chemical foaming agent. The cement and FA show noticeable inhibiting effects on volume expansion due to the network formed by their hydrates. Moderately lower cement, FA, and solid concentration are beneficial to improve volume increment and prolong expanding duration. A foaming coefficient (k) is proposed in theory to evaluate the foaming efficiency. The kem values, determined by volume evolution experiments of CFB slurries, provide a calculation basis for the needed dosage of H2O2 solution targeting specific volume increment. CFB specimens with expanding ratios of 21%~103% and densities of 994~592 kg/cm3 were prepared, with an actual foaming coefficient of 52.40 cm3/g and uniaxial compressive strength (UCS) of 0.32~0.55 MPa. The mass of H2O2 solution was 1.9%~11.3% of cement and 0.29%~1.67% of total solid materials by weight. The UCS decline compared to CB was attributed to rich pores observed by CT and carbonation indicated by X-ray diffraction (XRD).
1. Introduction
In the past decades, backfilling has been extensively applied in underground coal mining from the perspectives of mining technology, ecological environment, and economic benefit. The backfill bodies offer support to control strata movement, maintaining a stable condition to reduce ground subsidence, underground water loss, and so forth [1,2,3,4,5,6]. Meanwhile, backfilling employing coal gangue (CG), fly ash (FA), or tailings as primary materials provides a feasible approach to dispose of and utilize solid wastes from mining industries [7,8,9,10,11]. Moreover, reserved coal pillars and coal seams under buildings and roadways can also be exchanged with backfill to increase the recovery ratio [12,13,14].
Cemented backfill (CB) utilizes cementitious materials to bind aggregates, finally providing a stable body via curing reactions. The raw materials are mixed with water and conveniently transported to the filling site as slurries [2,9,15]. However, the volume shrinkage of CB occurs with water bleeding and aggregates sedimentation, leading to considerable interspaces between the surrounding rock and filling bodies. The insufficient contact is not beneficial for controlling roof subsidence and even stope stability [16,17,18]. Additionally, in some filling applications, raw materials such as CG and FA are quite inadequate to fill the mine-out areas [2,19]. Therefore, backfill materials with the function of volume expansion are expected to offer timely and effective support.
Based on CB, cemented foam backfill (CFB) incorporates hydrogen dioxide (H2O2) as a chemical foaming agent into CB slurries, exhibiting in situ volume expansion in filling sites via continuous H2O2 decomposition. Compared to other foaming agents relying on pyrolysis, such as azo or carbonate compounds [20,21], H2O2 spontaneously decomposes in the presence of catalysts in cement-based slurries under ambient conditions [22,23,24,25], applicable to backfill mining environments. The products are merely oxygen and water, without any harmful byproducts. Therefore, CFB utilizing H2O2 provides a green and practical pathway to improve filling quality by achieving sufficient contact with surrounding rock with limited raw materials.
Numerous studies of tailing-based CFB employing H2O2 have been published to enrich backfill formulas, optimize performances, and apply to filling fields [16,18,25,26]. A hybrid artificial intelligence model was proposed to predict the UCS of CFB [18]. Influencing factors showed sensitivity to UCS ranking as: cement-tailings ratio > curing time > H2O2 dosage > solid content. The H2O2 dosage mainly affects the strength by changing the pore characteristics, especially the large pore volume [16,18]. Moreover, the bubbles inside the slurry can reduce the aggregate settlement and provide a backfill with rather uniform distributions [27]. Compared with CB, foamed backfill shows higher energy absorption ability and better anti-explosion performance [18,28,29]. The CFB can be utilized as a primary filling body or supplementary parts combined with CB of different ratios or positions, considering actual conditions and cost [16,25,30].
The foaming efficiency of H2O2 essentially affects the volume increment, mechanical performance, and cost. However, informed studies involving in situ expansive CFB typically described the expansion results by expansion ratio varying with H2O2 dosage and other apparent factors including water/binder ratio and solid content [16,25,31]. The expansion ratio is typically defined as the ratio of volume increment to volume of CB counterparts. The actual volume increment varies with both pressure and temperature of bubbles, further influenced by simultaneous H2O2 decomposition and hydration reactions. Therefore, a quantitative parameter defined by volume increment and H2O2 dosage is highly desirable to evaluate the foaming efficiency under specific conditions. The quantitative parameter characterizing the foaming efficiency is further expected to supply the calculation basis for the needed H2O2 dosage targeting specific volume increments. In addition, to our knowledge, compared to tailings and FA, CFB utilizing coarser aggregate such as CG and concerning backfilling characters in coal mines is rarely reported. This is possibly because CFB in coal mines has raised higher requirements, such as a reduction in the aggregate settlement, shorter setting time, and better performances of strength and fire resistance.
Herein, based on typical CB utilizing CG and FA, a CFB formulation employing H2O2 as a chemical foaming agent is proposed. As depicted in Figure 1, The slurry exhibits in situ expansion in volume after being mixed with H2O2 solution, finally forming a porous body to supply enough contact to the roof. A foaming coefficient (k) is defined in theory and interpreted by volume increment and H2O2 dosage via volume evolution experiments. The calculation of the needed dosage of H2O2 solution and the preparation of CFB specimens with specific volumes are demonstrated. The UCS, microstructure, and composition of CB and CFB are also characterized and discussed.
2. Materials and Methods
2.1. Materials
The CB and CFB investigated in this work were prepared with coal gangue, fly ash, cement, admixtures, and water. The gangue was used as primary aggregate, while the fly ash was employed as fine aggregate. Composite Portland cement (P.C 42.5) was used as the binder. The admixtures were hydroxyethyl cellulose (HEC) as a foam stabilizer and H2O2 solution (30 wt% in water) as the foaming agent in CFB preparation. Tap water from Xuzhou city with a pH of 7.3 was used to mix the raw materials. The metallic ion composition of the tap water is summarized in Table A1 in Appendix A.
2.1.1. Coal Gangue (CG)
The coal gangue was sampled from Xinjulong Coal Mine, Shandong. The raw gangue was crushed by a jaw crusher, screened to less than 5 mm, and then utilized as the main aggregate for the backfill materials. The particle size distribution of the gangue aggregate was analyzed with the sieving method and is depicted in Figure 2a. The nonuniformity coefficient (Cu) and curvature coefficient (Cc) are 18.4 and 1.3, indicating that the gangue aggregate is well graded. Further analysis based on XRD spectrum in Figure 3a shows that the gangue mainly consists of quartz, kaolinite, and less muscovite.
2.1.2. Fly Ash (FA)
The fly ash was commercially obtained from a thermal power plant. Figure 2b shows that the particles vary from 0.93 to 232 μm, with the vast majority between 7 and 81 μm. XRD analysis in Figure 3b shows that the main components are quartz, mullite, hematite, and a moderate amount of amorphous glassy phase [32]. Both the size as well as component characters suggest the fly ash can act as fine aggregate and secondary binder for the backfill materials.
2.1.3. Composite Portland Cement
Composite Portland cement (P.C 42.5) was purchased from China United Cement (CUCC). As shown in Figure 2c, the particle size distributes from 0.93 to 129 μm, while major particles are between 6 and 50 μm. Based on the XRD analysis in Figure 3c, the cement mainly contains calcium silicate, calcium aluminate, and gypsum. The hydration of these components contributes to the material strength.
2.1.4. Admixtures
Hydroxyethyl cellulose (HEC) bought from Aladdin Reagent Co. Ltd. was employed as a foam stabilizer by decreasing surface tension and thickening the CFB slurry [33]. The as-received HEC was a slightly yellow and odorless powder, with a viscosity of 1500~2500 mPa.s at 25 °C. Hydrogen dioxide (H2O2) solution with a concentration of 30 wt% in water was purchased from Sinopharm and utilized as a chemical foaming agent via self-decomposition.
2.2. Preparation and Characterization Methods
2.2.1. Volume Evolution of CFB Slurry
As shown in Figure 4, to evaluate the volume evolution of CFB slurry after injecting H2O2 solution, the expanding experiments were conducted in a graduated cylinder. First, the solid materials (including CG, FA, cement, and HEC or some of them in control groups) and water were mixed and stirred in a plastic beaker to give a slurry. Subsequently, the overall slurry was transferred into a graduated cylinder. Finally, the H2O2 solution was injected into the slurry via a syringe equipped with a long plastic needle. The whole process was recorded as a video. The volume increment (ΔV) of the slurry was determined by the difference value between Vi and V1. The ΔV curves varying with the expanding time immediately after injecting H2O2 solution were depicted according to the expanding process.
2.2.2. Preparation of CFB and CB Samples
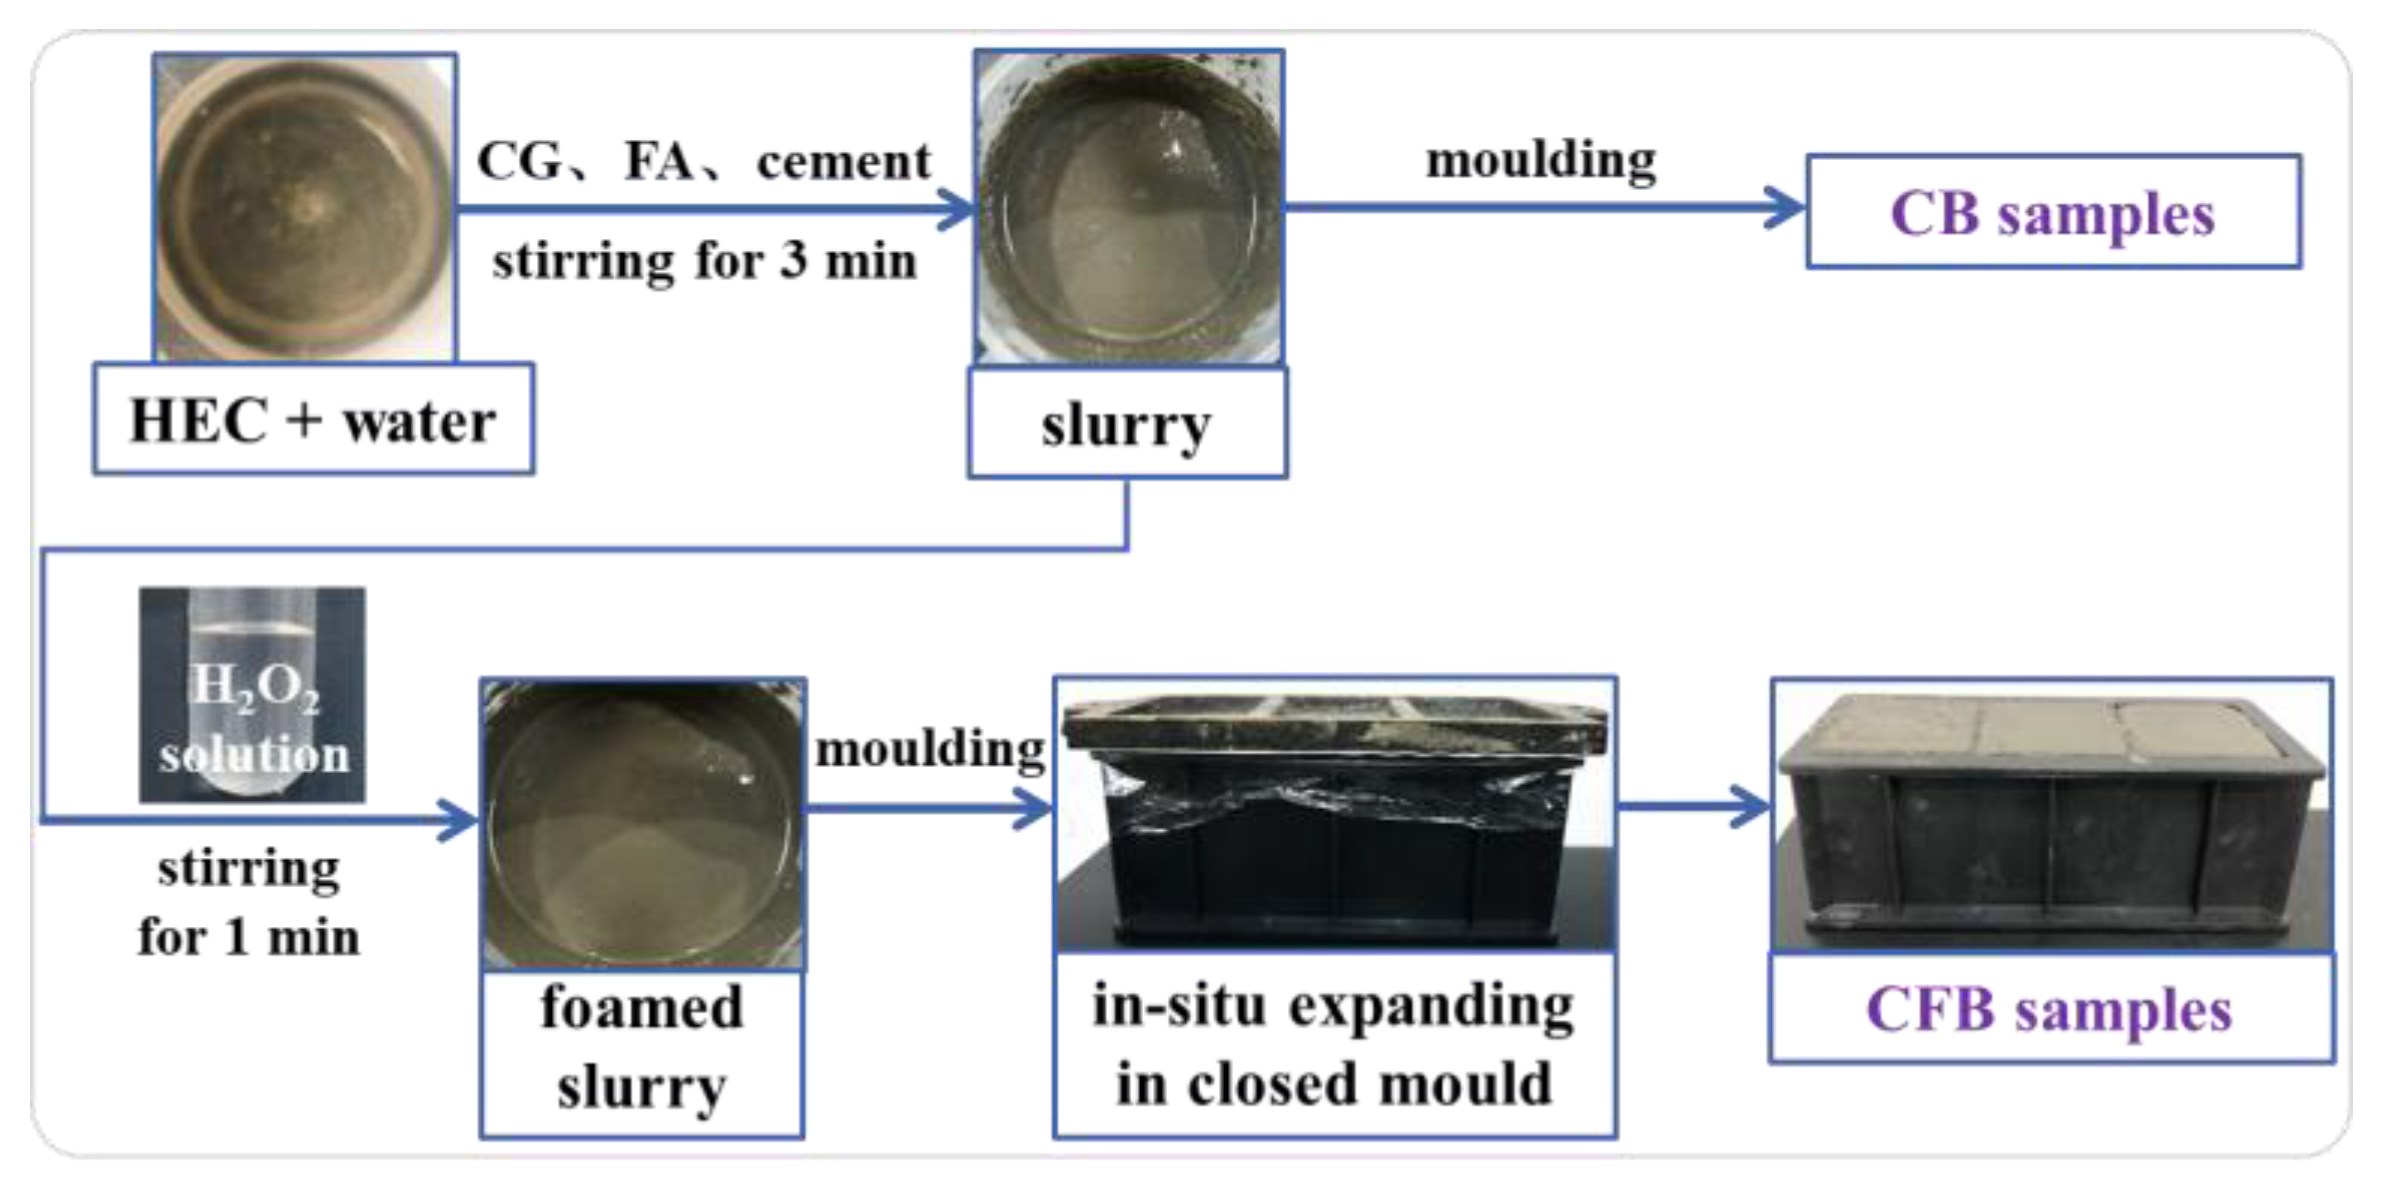
The preparation route is schemed in Figure 5. Instead of typical foaming and subsequent cutting into specific shapes and size [22], the CFB samples for the UCS test were directly produced in a cubic mold with an iron lid via an expanding process. When the H2O2 solution reached an adequate dosage, the slurry expanded steadily with H2O2 decomposition until the closed space was full.
The CFB samples were prepared via mixing, foaming, and molding. To afford contrasts to CFBs, CBs were also produced via mixing and molding. In order to exclude all other influence factors except H2O2 dosage, HEC was used in both CFB and CB samples to eliminate its effects on hydration and performance [33,34]. Given HEC becomes viscous once mixed with water, the HEC was first dispersed in water. CG, FA, and cement were subsequently added into the dispersion, providing a slurry after intensively stirring. In CB cases, the slurry was directly poured into a cubic mold (70.7 × 70.7 × 70.7 mm), while in CFB cases, an H2O2 solution was further added into the slurry, stirring for another 1 min. The foamed slurry was poured into the same mold, and an iron lid was placed on the top. The samples were cured at 20 °C and 95% RH for 28 d after demolding.
2.2.3. Uniaxial Compressive Strength (UCS)
The UCS tests of the CB and CFB samples (70.7 × 70.7 × 70.7 mm) were conducted on an MTS 815.02 electro-hydraulic servo-controlled testing system, with a loading rate of 0.2 mm/min. The UCS values were determined by the ratio of peak stress to cross-sectional area of tested specimens.
2.2.4. X-ray Diffraction (XRD)
The phase composition of CB and CFB were analyzed by XRD. The cured specimens after the UCS test were washed using ethanol to terminate hydration reactions. After subsequent drying at 40 °C for 24 h in a vacuum drying cabinet, the solid samples were further ground into a powder with a mortar and sieved through a #200 mesh. XRD tests of obtained powder were performed on a Bruker D8 Advance from 4 to 70°.
2.2.5. X-ray Computed Tomography (X-CT)
X-CT tests were conducted to observe the microstructure of CB and CFB specimens. The samples for CT tests were prepared using cylinder molds with a diameter of 50 mm and a height of 100 mm and cured for 28 days at 20 °C and 95% RH. An Xradia 510 Versa with a pixel size of 50.2691 μm was used to perform the CT test. The pores and CG aggregate were recognized according to differences in gray values with DragonFly software. Then, other regions were identified as the matrix, including FA, cement, and their hydration products, and so forth. Finally, the pores, CG aggregate, and matrix were respectively rendered in red, yellow, and blue to enhance the overall identification.
2.2.6. X-ray Fluorescence (XRF)
The chemical components of the CG, FA, and cement were quantitatively analyzed by XRF spectra. The powder samples were obtained via grinding and further sieving through a #200 mesh. A Bruker S8 TIGER wavelength dispersive XRF (WDXRF) spectrometer was employed to perform the tests. Qualitative analysis was conducted using a fundamental parameter method without standard samples [35]. Elements from 4Be to 92U were detected, and mass fraction of their oxides were finally given.
3. Results and Discussion
3.1. Expanding Mechanism
3.1.1. H2O2 Decomposition
Equation (1) shows that H2O2 generates oxygen and water by a self-decomposition reaction. The decomposing rate significantly accelerates when heating to 60~90 °C or in the presence of catalysts. The generated oxygen becomes an expanding source, so H2O2 solution is usually employed as a green and chemical foaming agent.
2H2O2 → O2 + 2H2O
Rapidly heating the overall slurry up to 60~90 ℃ is not feasible under current backfilling conditions in coal mines. Metallic compounds, such as MnO2, Fe2O3, and FeCl3, are reported as efficient catalysts for H2O2 decomposition [23,36,37,38]. Therefore, chemical catalysis between H2O2 and potential compounds in raw materials for CFBs dominate the decomposition process.
Herein, CG, FA, and cement are the primary materials to prepare CFBs. As given in Table 1, the XRF results show that the main components of these raw materials were SiO2, Al2O3, Fe2O3, and CaO. Notably, the CG, FA, and cement contain an amount of Fe2O3 of 4.19%, 5.30%, and 3.63%, respectively. The moderate content of Fe2O3 and other metallic compounds endows them with the function of catalyzing H2O2 decomposition [23,36,37,38]. Moreover, the strong alkaline condition (pH > 9) of the CFB slurry caused by basic oxides, including CaO, K2O, and Na2O, also contribute to H2O2 decomposition [22,25]. Therefore, the metallic catalysts, as well as basic oxides in CG, FA, and cement, provide suitable conditions for the efficient decomposition of H2O2 in CFB slurry.
3.1.2. Foaming Coefficient
With H2O2 decomposing, the generated oxygen steadily accumulates to form bubbles, leading to the apparent volume expansion of the slurry, finally forming a porous filling body via curing reactions. The volume of generated oxygen mainly determines the volume increment of the foamed slurry. However, according to the ideal gas law in Equation (2), the actual volume of a certain amount of oxygen is influenced by pressure and temperature [39].
where P, V, and T represent pressure, volume, and temperature, n represents the amount of substance, and R is the molar gas constant.
PV = nRT
The pressure and temperature of bubbles in the slurry are further influenced by various factors involving H2O2 dosage, solid content, and ratio. With H2O2 decomposition and simultaneous hydration reactions of cement and FA, the changes in the pressure and temperature of the bubbles are quite complex. On the one hand, H2O2 decomposition and hydration reactions generate a lot of heat, thus raising the temperature of the foamed slurry, which is beneficial to the volume expansion of the bubbles. On the other hand, the network formed by hydration products and aggregates increases the pressure of the bubbles, thus inhibiting its volume expansion. Consequently, it is difficult to accurately calculate the volume of generated oxygen.
Given the complex process of H2O2 decomposition and volume expansion, a foaming coefficient (k) is put forward to evaluate the foaming efficiency of the H2O2 solution. As given in Equation (3), assuming all H2O2 converts to O2 under an ideal condition, the amount of substance (n) is calculated by the mass of H2O2 solution. According to n(O2) and ideal gas law, the volume of generated oxygen is further derived as per Equation (4).
where m is the mass of the H2O2 solution (30 wt% in water), M is the molar mass of H2O2, n(O2) and V(O2) represent the amount of substance and volume of generated oxygen in theory, and ΔV represents the volume increment of CFB.
As shown in Equation (4), the foaming coefficient in theory (kth) is defined as the product of R/227 and T/P. The former is a constant, and the latter varies with H2O2 decomposition and hydration reactions. However, H2O2 loss possibly occurs by generating hydroxyl radical (·OH) instead of O2 [38]. Moreover, the generated O2 loss inevitably occurs on the CFB surface [23]. Therefore, as shown in Equation (5), the foaming coefficient kem is interpreted as ΔV/m. The volume increment of CFB slurry using a certain mass of H2O2 solution can be roughly measured via volume evolution tests in the lab. The kem value characterizes the foaming efficiency of H2O2 under a specific condition and provides an empirical reference to calculate the needed dosage of H2O2 solution for the target volume increment.
3.2. Effect of CG, FA, and Cement on Volume Evolution
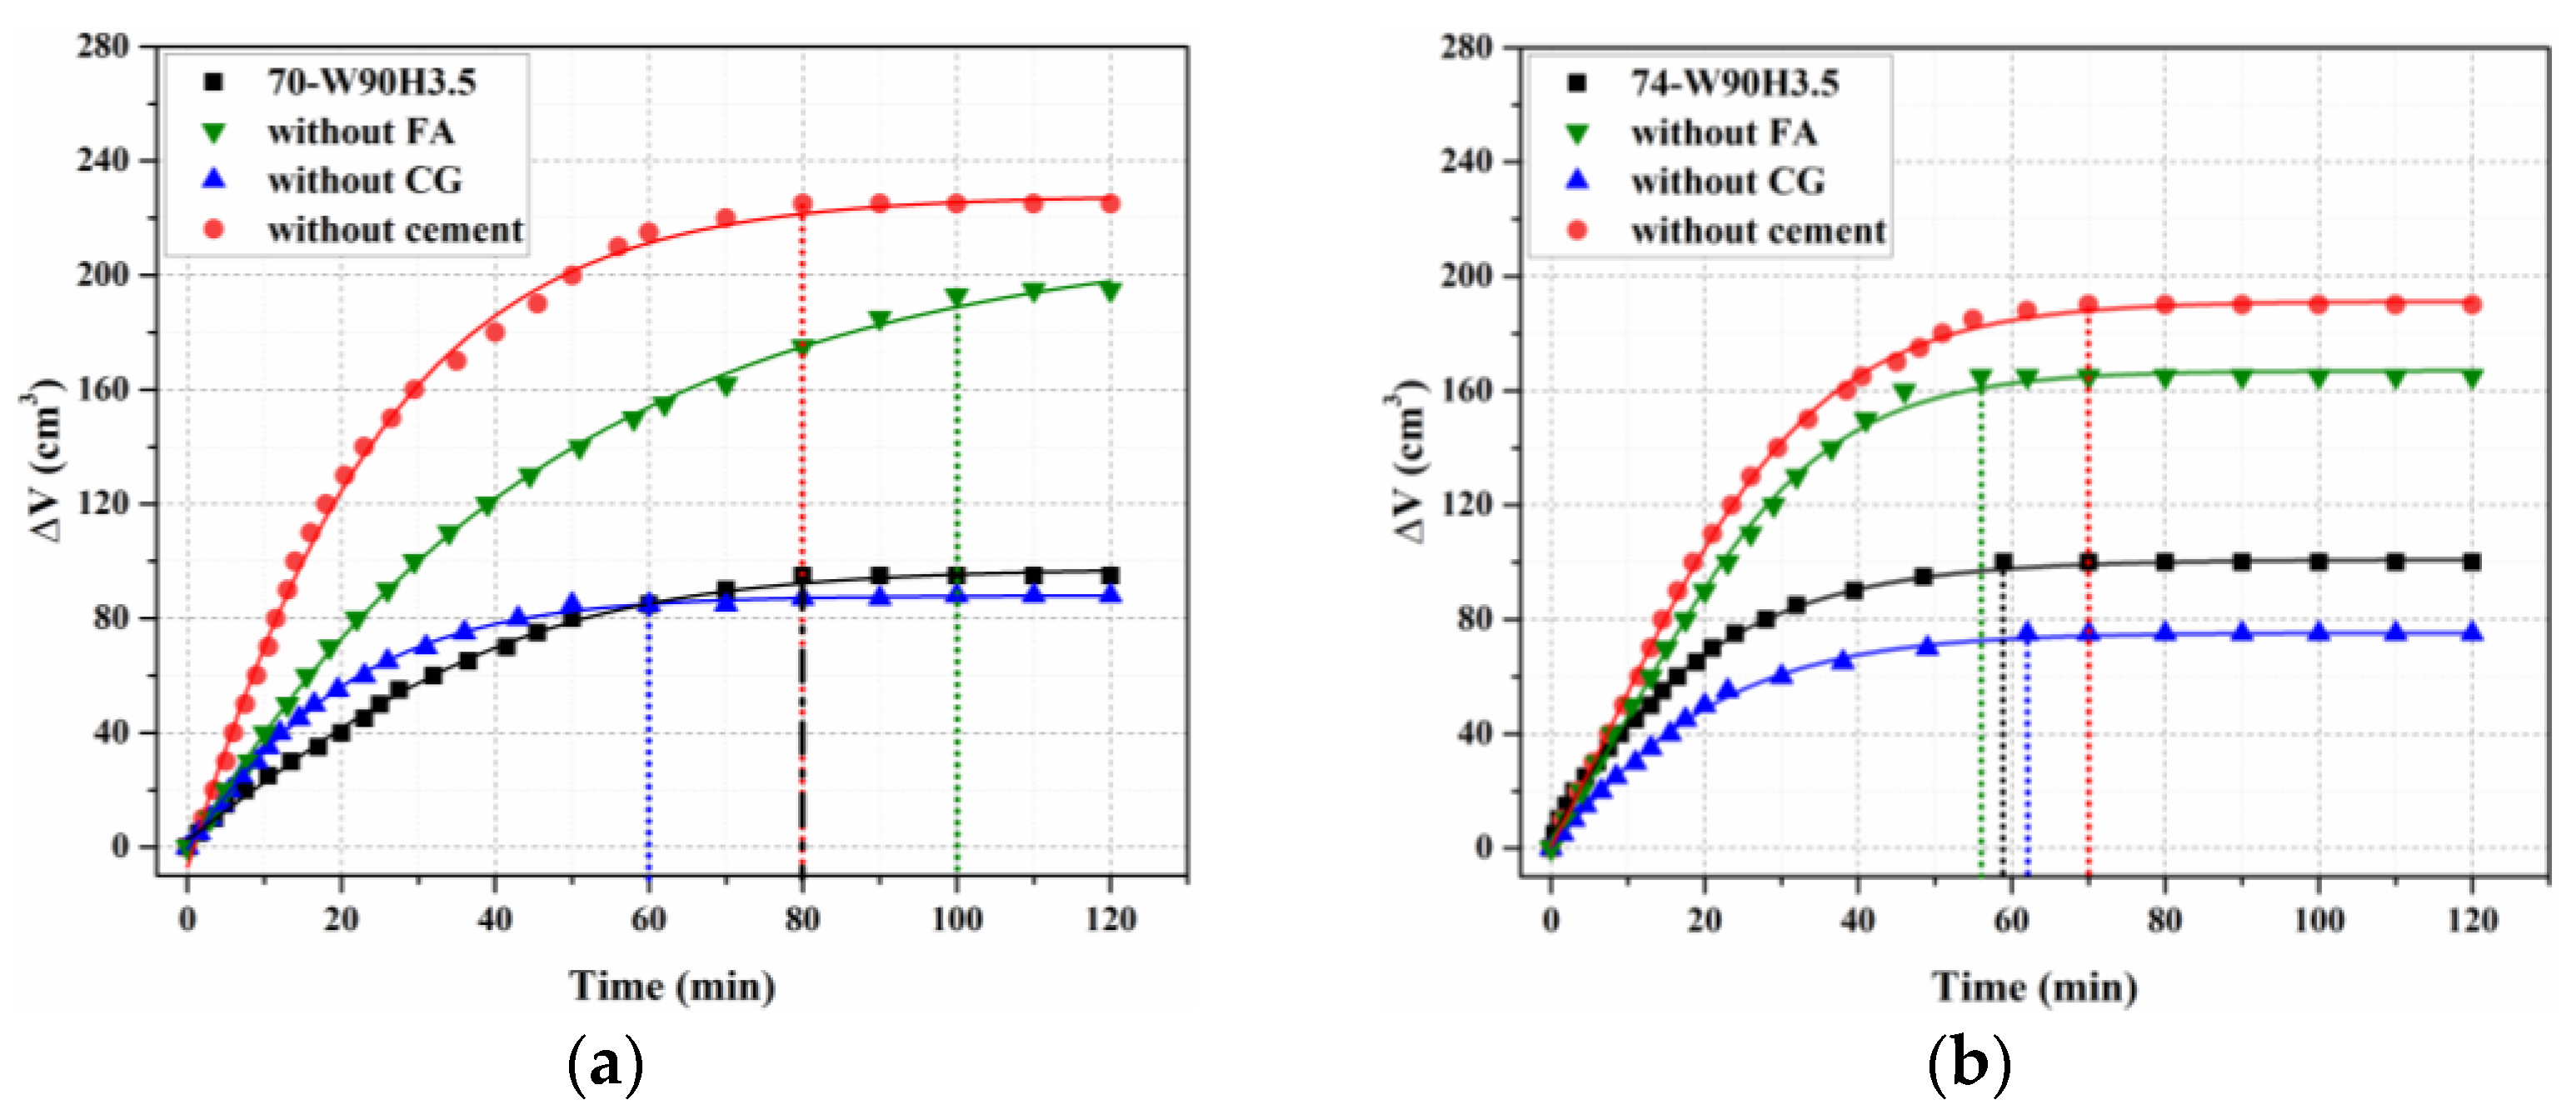
As listed in Table 2, the volume evolution tests of the CFB slurry at 70 and 74 wt% in the absence of CG, FA, or cement were conducted separately. The mass ratio of [CG]:[FA]:[cement]:[HEC] was set as 45:40:15:0.3. Given the HEC dosage is relatively low, the solid content was determined by the mass ratio of [CG+FA+cement] to [CG+FA+cement+water]. WxHy is used to label the CFB samples. W and H are abbreviations of water and H2O2 solution, respectively, while x and y represent the mass of water and H2O2 solution utilized in each sample.
The ΔV evolution curves under various conditions are displayed in Figure 6, while the corresponding foaming coefficients are calculated and listed in Table 3. The results of the volume evolution help to further inspect the effect of the primary solid materials on the foaming process. In both the 70 and 74 wt% cases, compared with W90H3.5, the inhibiting effects on volume increment and expanding rate appear to be in the order of cement > FA > CG. CG has a negligible effect on the foaming process due to its chemical inertness and larger particle sizes compared to cement and FA [8]. In the absence of cement or FA, the foamed slurries achieve a higher volume increment and expanding rate, possibly because of the weaker limit by the network formed by rapid hydrations of cement or FA [32,40]. Notably, despite the low dosage of cement, foamed slurries in the absence of cement exhibit the largest increments and fastest expanding rate. This indicates that cement plays the most significant role in inhibiting volume expansion. Overall, the expanding cases at 74 wt% last for 58~70 min, while cases at 70 wt% last longer for 60~100 min. This suggests that a lower concentration leads to fewer limits to the volume expansion, thus allowing a larger volume increment as well as a longer duration of expansion.
To sum up, the volume increment and expanding rate of foamed slurries are reasonably sensitive to cement and FA dosage. Moderately lower cement or FA dosage and lower solid concentrations are beneficial to improve volume increment and prolong the duration of expansion.
The foaming coefficients in Table 3 obtained from the volume evolution tests of the CFB slurry also provide a calculation basis for H2O2 dosage corresponding to CFB specimens with target volume. Under the standard temperature and pressure (STP, 0 °C, 101 kPa), the molar volume of any gas is 22.4 L/mol. As shown in Equation (6), the foaming coefficient of the H2O2 solution under STP is 98.68 cm3/g. However, the foaming coefficients of CFB slurries decrease to 21.43~64.29 cm3/g. These contrasts also prove the inhibiting effects of slurry conditions on volume expansion. Therefore, the k value provides a quantitative index to characterize the foaming efficiency of the H2O2 solution. The improvement of k value offers a clear direction to optimize the CFB formula and filling operations.
where m is the mass of the H2O2 solution (30 wt% in water), Vm is the molar volume of O2, n(O2), and ΔV represents the amount of substance and volume of generated oxygen under STP.
3.3. Expanding Performance of CFB
According to the above results concerning the volume evolution of the foamed slurry, lower concentrations tend to improve the volume increment and prolong the duration of expansion. Therefore, compared to 74 wt%, the CB and CFB specimens subsequently prepared at 70 wt% were further studied. The mass ratio of [CG]:[FA]:[cement]:[HEC] was still fixed as 45:40:15:0.3. No obvious bleeding water was observed in either case. The volume increment and, thus, the expansion ratio of CFB were determined in comparison with CB counterparts.
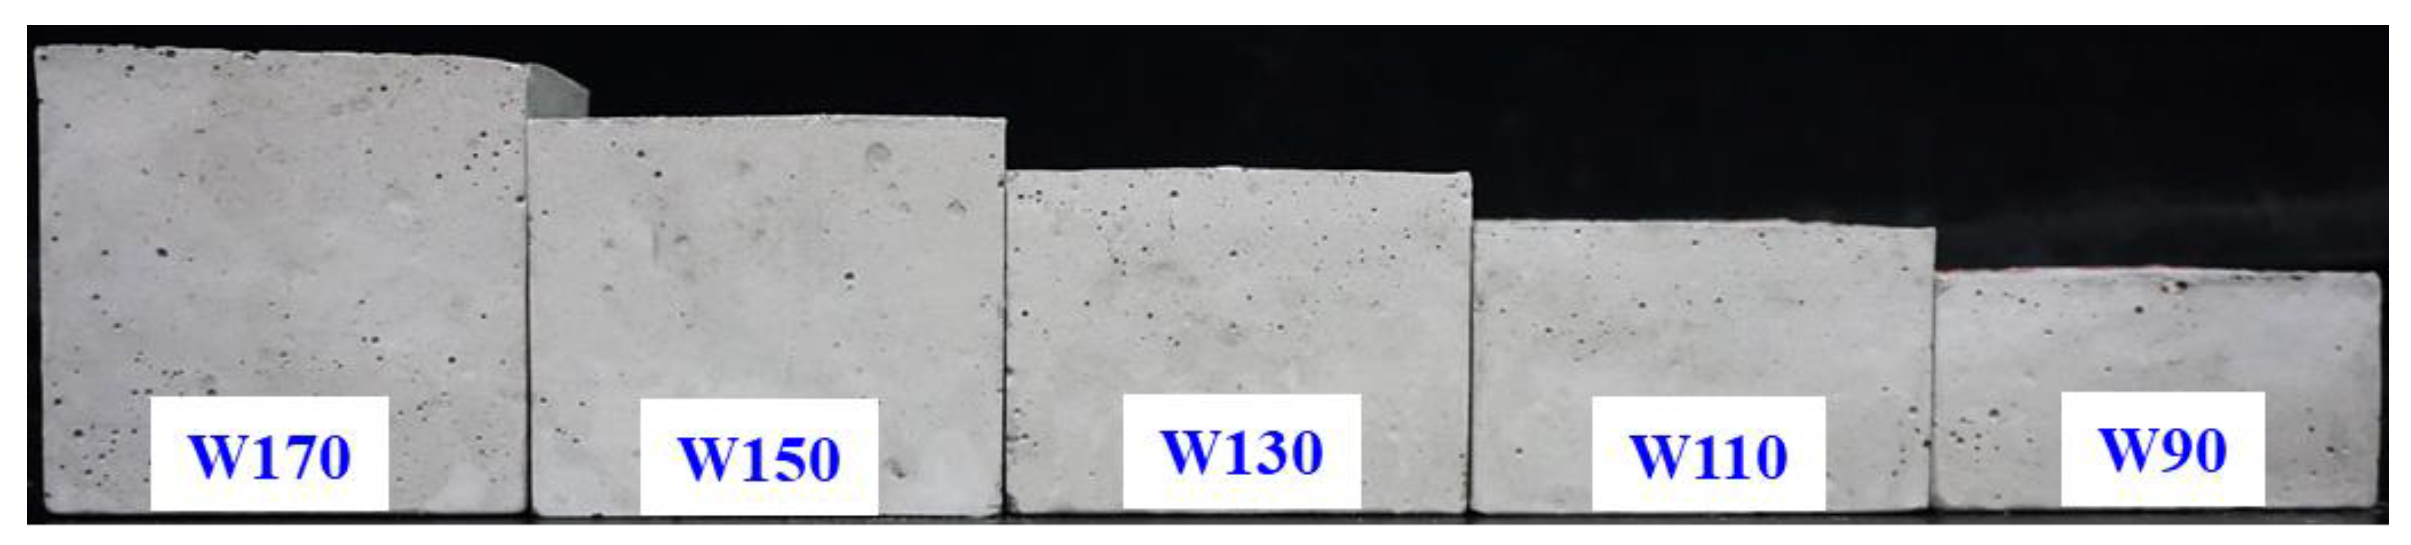
Typical CB specimens of different volumes (Figure 7) were first prepared to provide contrasts to CFB. The preparation parameters are given in Table 4. Wx is used to label the CBs, while x represents the mass of water in each case. By taking the cubic mold as a simple mined-out area, the CB specimens could be regarded as a series of backfill bodies with different filling ratios. A digital caliper was used to measure the height of each specimen. Then, the filling ratios were calculated by the percentage of sample height to mold height (70.7 mm). As shown in Figure 7, W170 affords a height of 67.6 mm and a filling ratio of 96%. W150, W130, W110, and W90 were produced by decreasing raw materials in the proportion of water, giving filling ratios of 85%, 73%, 61%, and 50%, respectively.
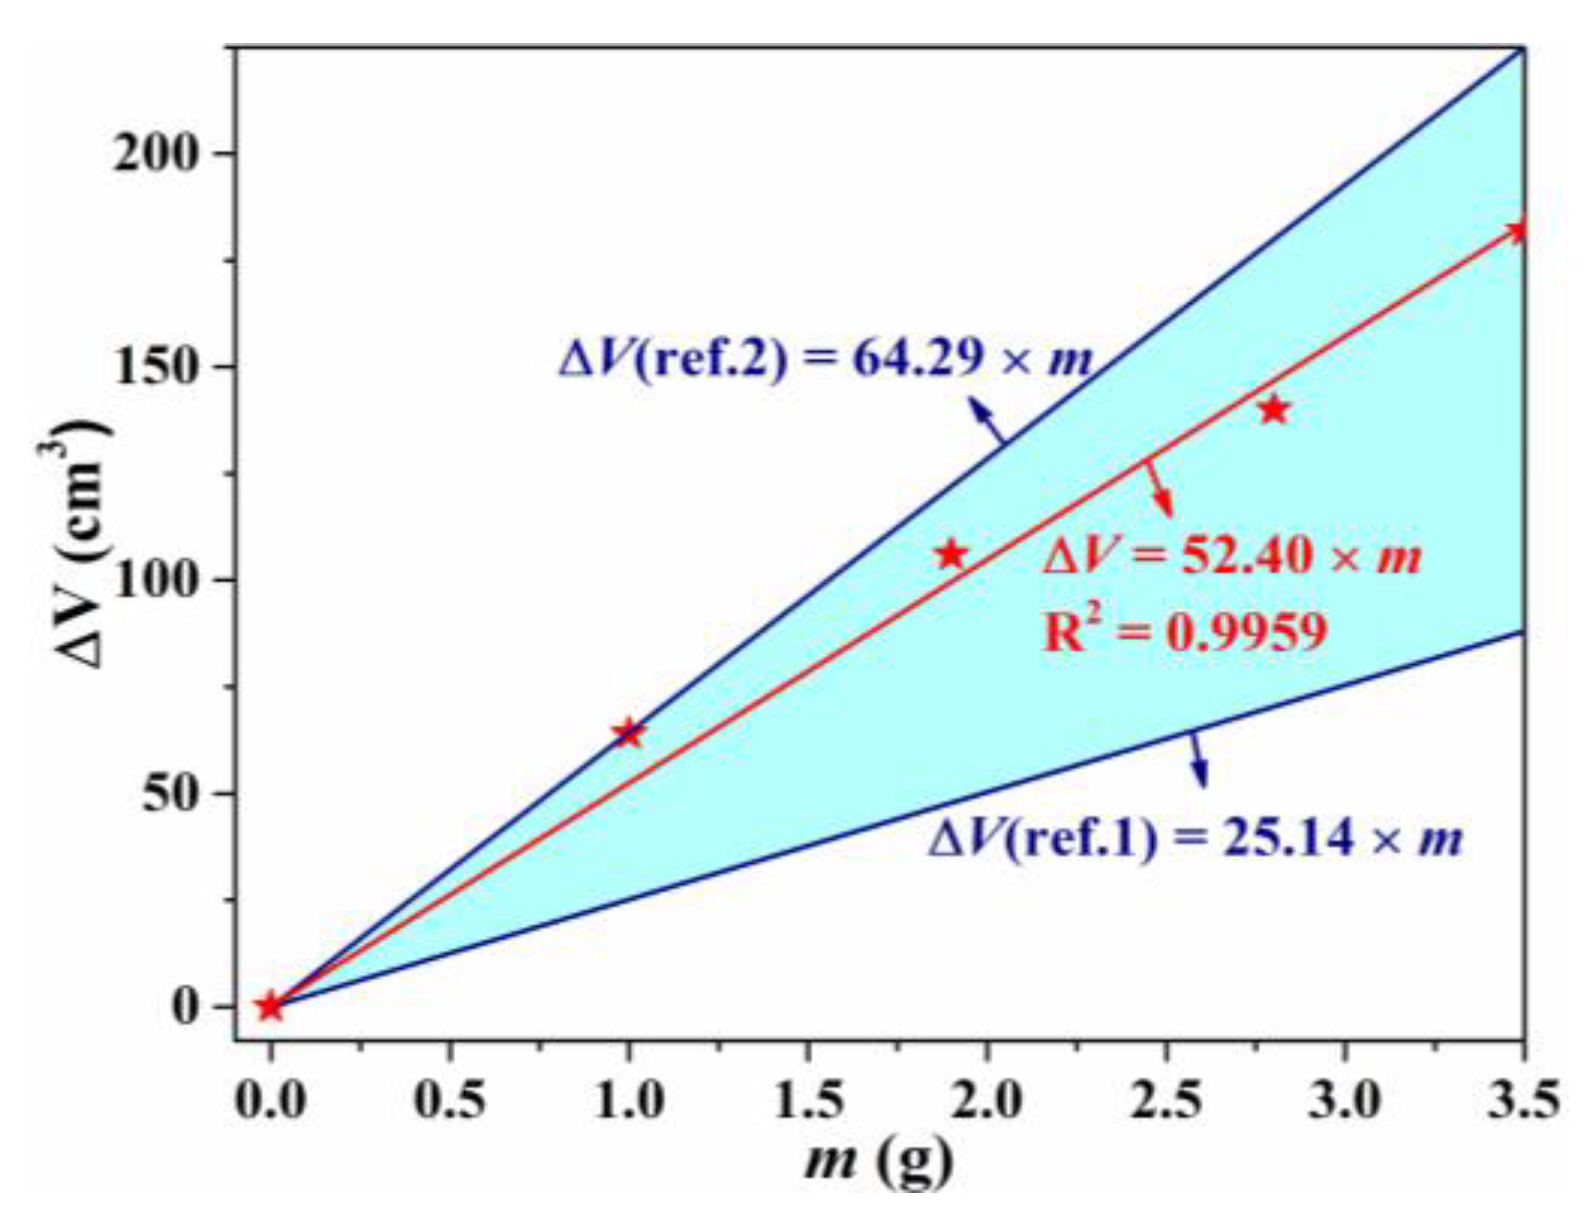
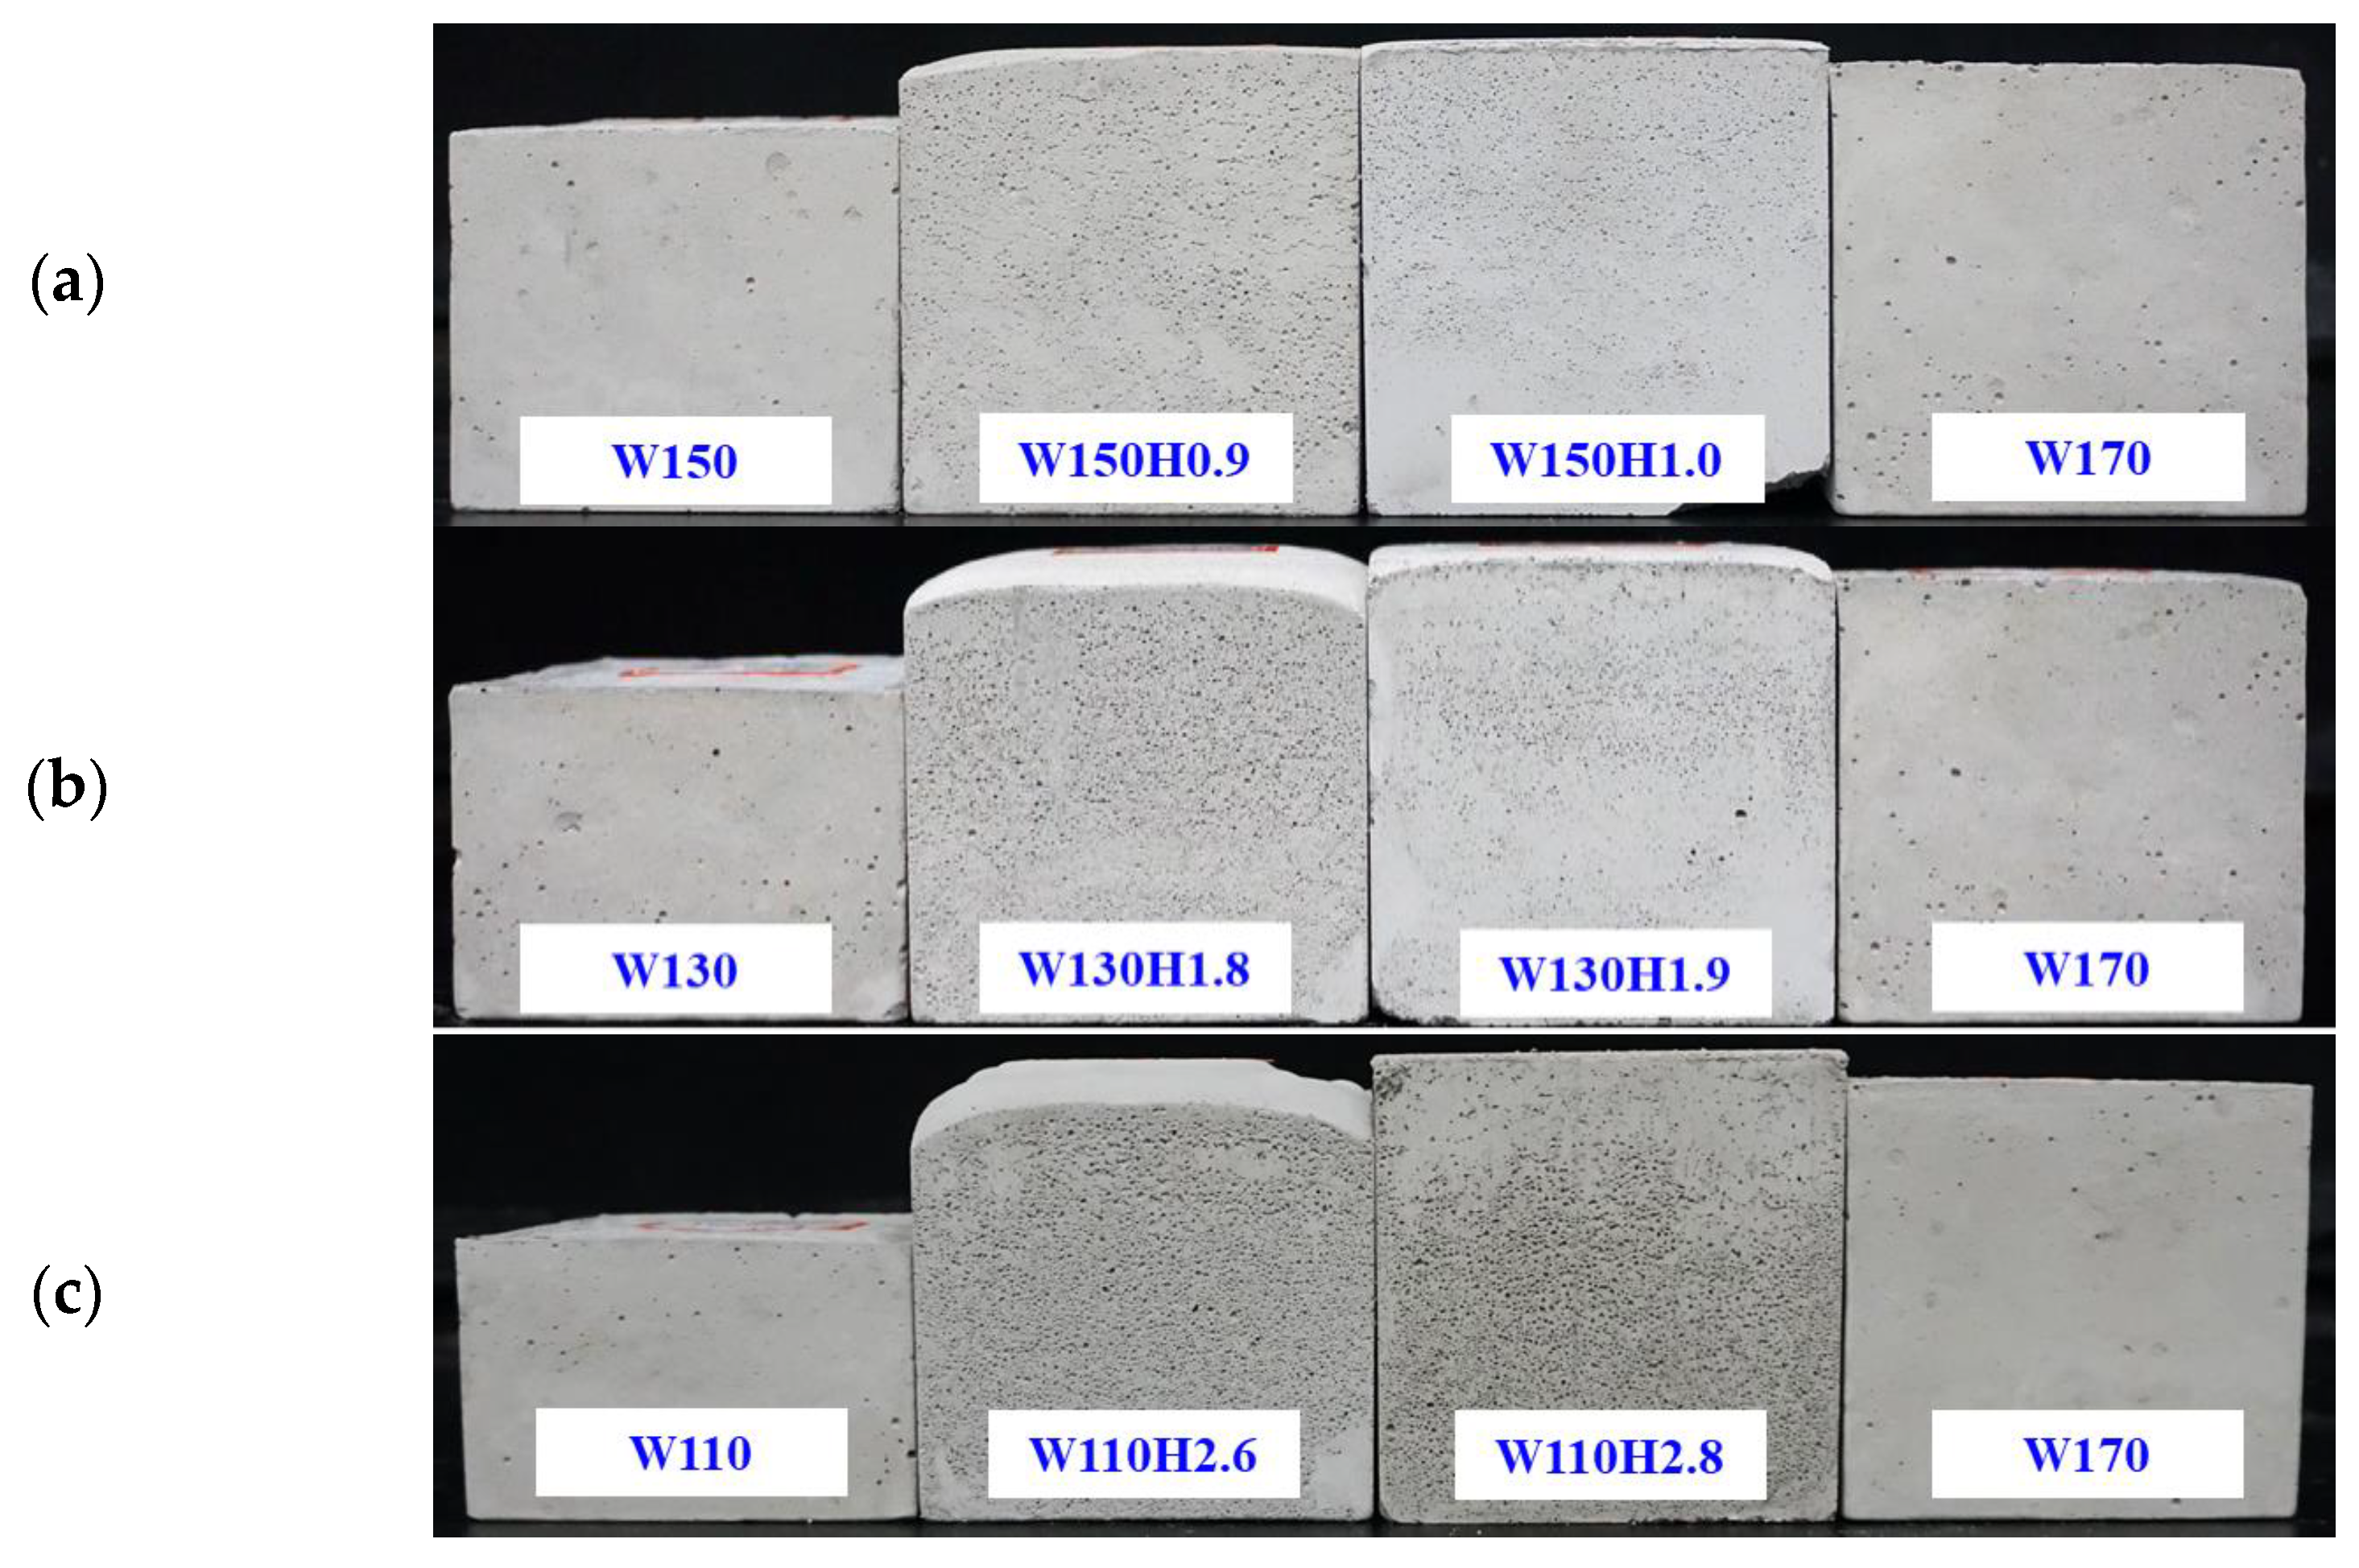
Based on the CB series, referring to the foaming coefficients, the preparation of CFB specimens with target volume is demonstrated herein. The target ΔV values were determined by comparing the mold volume with corresponding W150, W130, W110, and W90 specimens. The foaming coefficients of slurries obtained via volume evolution studies were 25.14~64.29 cm3/g. According to Equation (5), as per the blue region depicted in Figure 8, a recommended range of H2O2 dosage was acquired between two reference lines. As displayed in Figure 9, a series of CFB specimens were attempted, with an increasing dosage of H2O2 solution until the slurry filled the whole mold.
The minimum dosages of H2O2 solution for CFB specimens with filling ratios of >99% are listed in Table 4 and labeled as red star patterns in Figure 8. The fitting line indicates that the foaming coefficient of the CFB specimens is 52.40 cm3/g, which is much higher than 27.14 cm3/g of W90H3.5 slurry. A poorer network of hydration products can explain this; thus, there was a weaker limit to the bubbles under intensive stirring conditions during the specimen preparation, differing from the relatively still conditions during the slurry volume test.
Therefore, as listed in Table 4, compared to the corresponding CBs, the CFB specimens with expanding ratios of 21~103% and apparent densities of 994~592 kg/cm3 were obtained. The mass of H2O2 solution was 1.9%~11.3% of cement and 0.29%~1.67% of total solid materials by weight. Regarding the expansion ratio, the H2O2 solution dosage with 1.9% of cement and 0.29% of total solid materials, giving an expansion ratio of 21%, appears more efficient than the reported CFB cases [16,25]. The higher foaming efficiency is mainly due to the lower concentration and cement dosage. It also confirms the inhibiting effects of cement and high concentration on volume expansion.
3.4. UCS, Microstructure, and Composition of CB and CFB
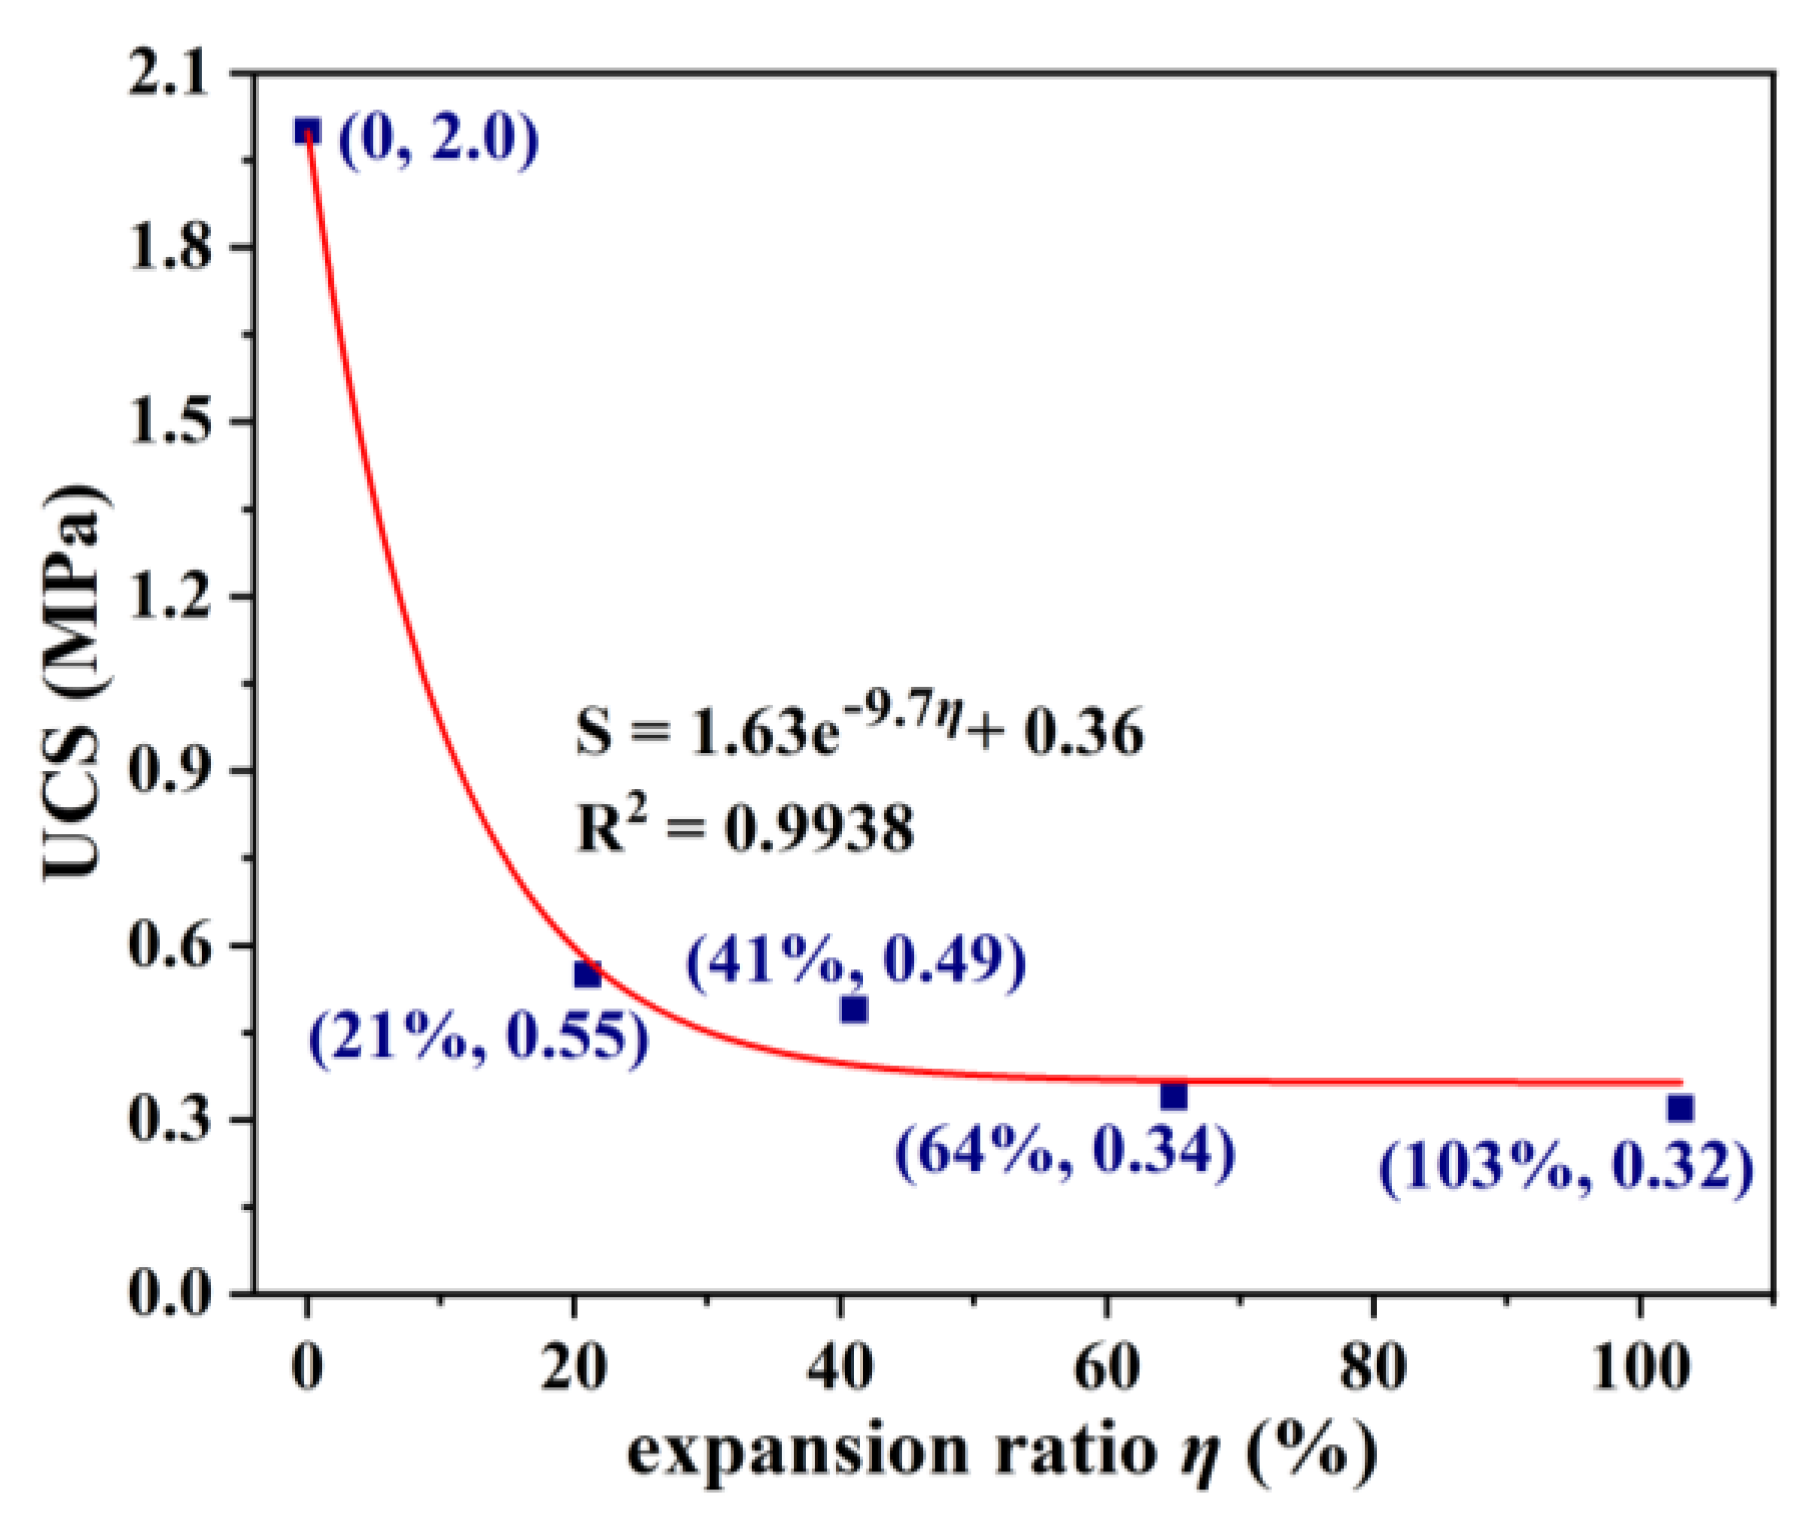
Figure 10 shows the UCS results of the CB and CFB specimens cured for 28 days. The UCS of W170 reached 2.0 MPa, lower than ~5 MPa of typical CBs utilizing CG and FA [42,43]. This could be mainly ascribed to the lower solid content and smaller size of CG in this work. With an expansion ratio of 21%, the W150H1.0 UCS further decreased to 0.55 MPa, and was as low as 27.5% of W170. The fitting curve implies that the UCS declines sharply with the expansion ratio approximatively in an exponential relationship. However, among the CFB specimens, the UCS varies from 0.55 to 0.32 MPa, showing lower sensitivity to the expansion ratio (21%~103%). The insignificant variation might be caused by the rather low UCS of the overall CFB specimens. Apparently, the rich pores in the CFBs of low densities negatively affect the compressive strength. Therefore, the expansion ratio of CFB should also be designed according to the needed strength considering the actual mining conditions.
The UCS of CFB alone is far from satisfying typical requirements—higher than 3.5 MPa at 28 days—in coal mine settings [19,44]. However, the CFB can be utilized as supplementary parts combined with CB of different ratios or positions, considering the actual conditions and cost. By incorporating CFB into typical CB, the mechanical performance of the whole filling body is more controllable [16]. Therefore, it provides a more promising approach to desired effects on both strength and roof contact.
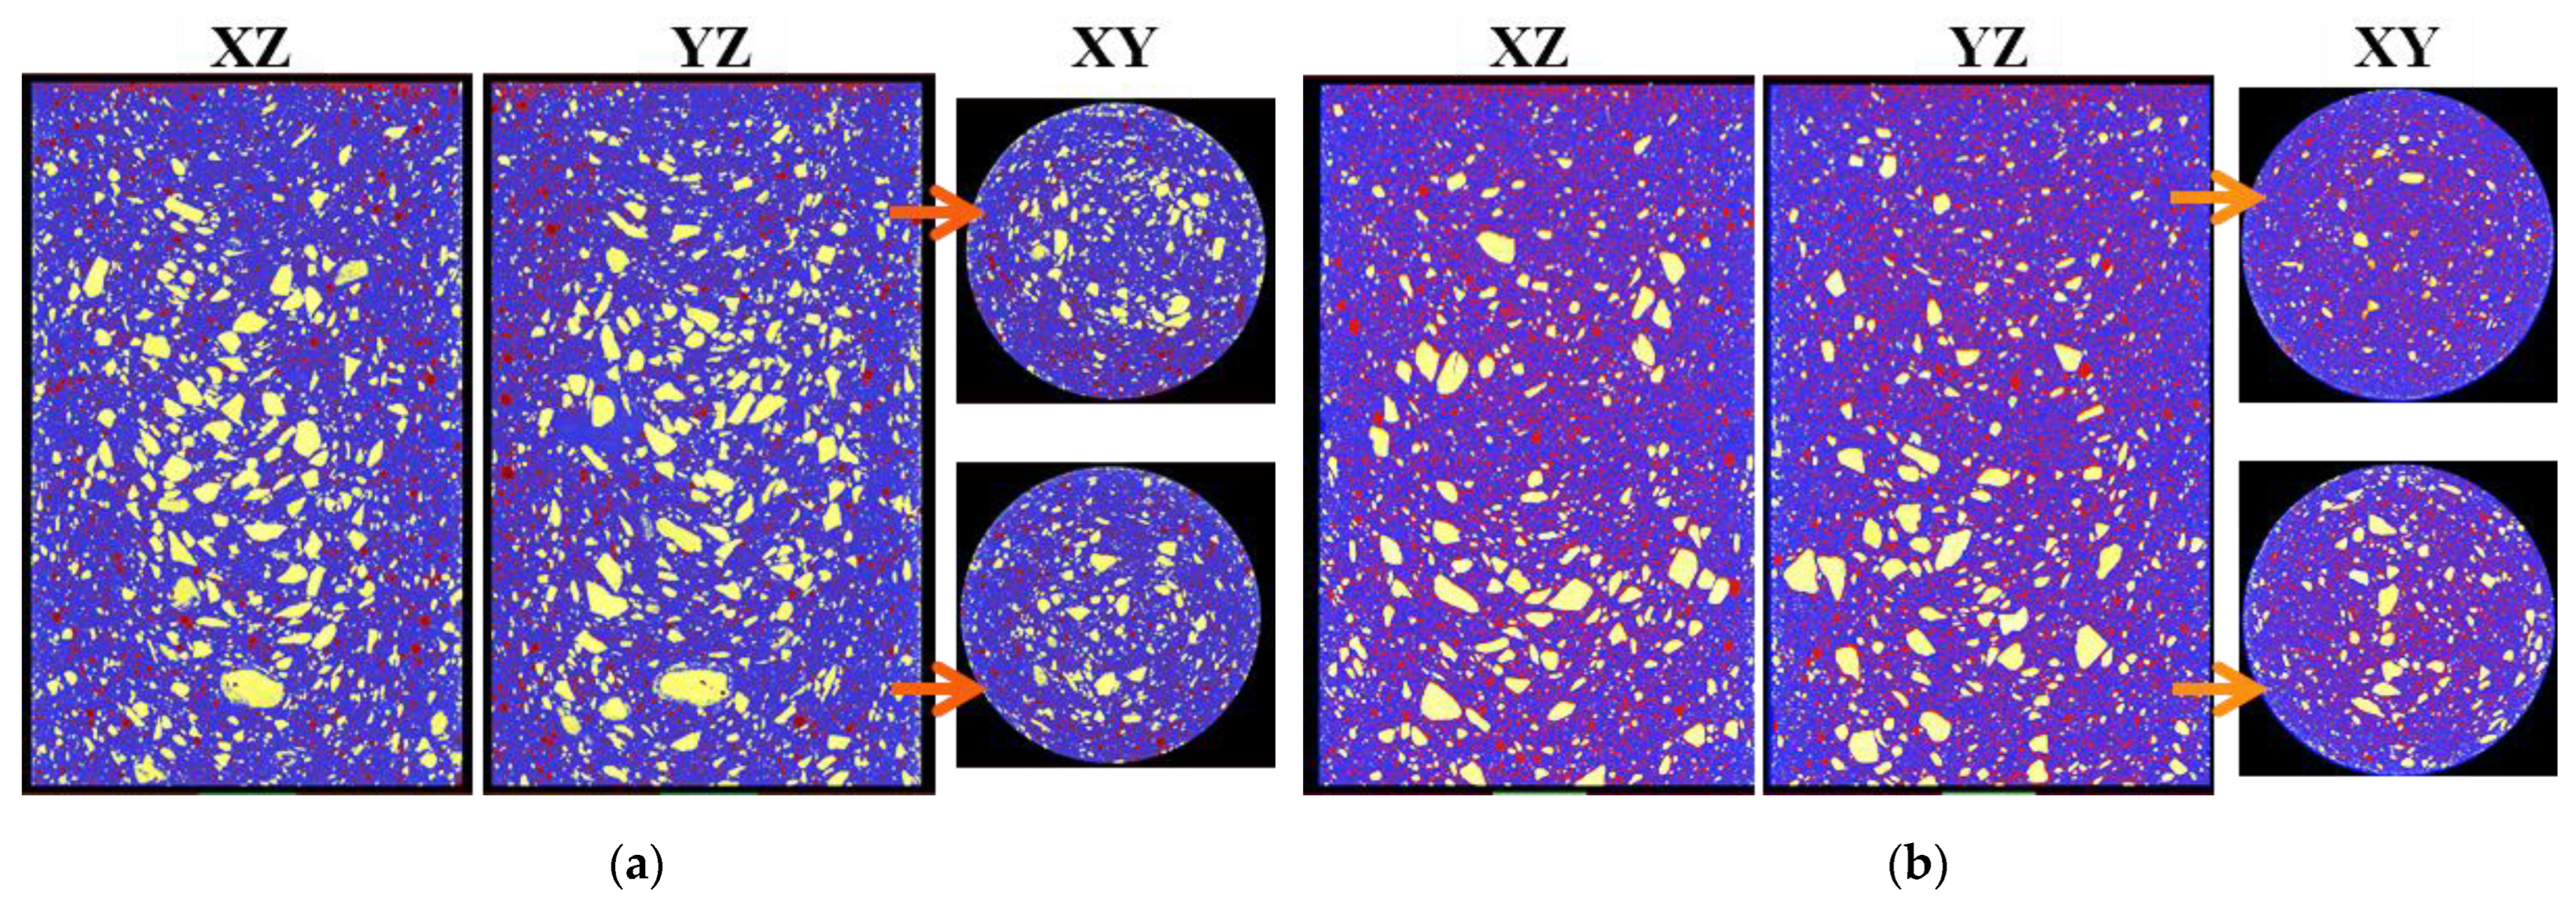
The CT images in Figure 11 offer intuitive observations of the CB and CFB specimens. Due to the resolution limit of the CT test mode, pores with diameters larger than 1 μm can be identified. The UCS is reported to be significantly affected by pore characteristics, especially large pore volume [16,18]. As shown in Figure 11a, a small quantity of large pores exists in W170 CB, which is mainly introduced by intensively stirring during preparation. Compared to W170, a considerable number of pores in W90H3.5 CFB with a quite uniform distribution in the matrix were observed. This provides direct evidence for the high efficiency and good uniformity of chemical foam employing H2O2 in cemented slurries.
In solid backfill, CG with a particle size less than 50 mm is generally used [45]. In cemented backfill, the CG size is usually less than 25 mm to reduce settlement during pipeline transportation [46]. In foam concrete, aggregate with a maximum size of 5 mm is allowed to form a stable and uniform porous material [47]. Herein, CG with a size less than 5 mm was used as the main aggregate to relieve the settlement in CFB. However, as shown in Figure 11b, the CG aggregate in W90H3.5 appears to be deposition to a slight extent, despite the floating effects of numerous bubbles. At this point, the aspect ratio is suggested to be considered in filling practice.
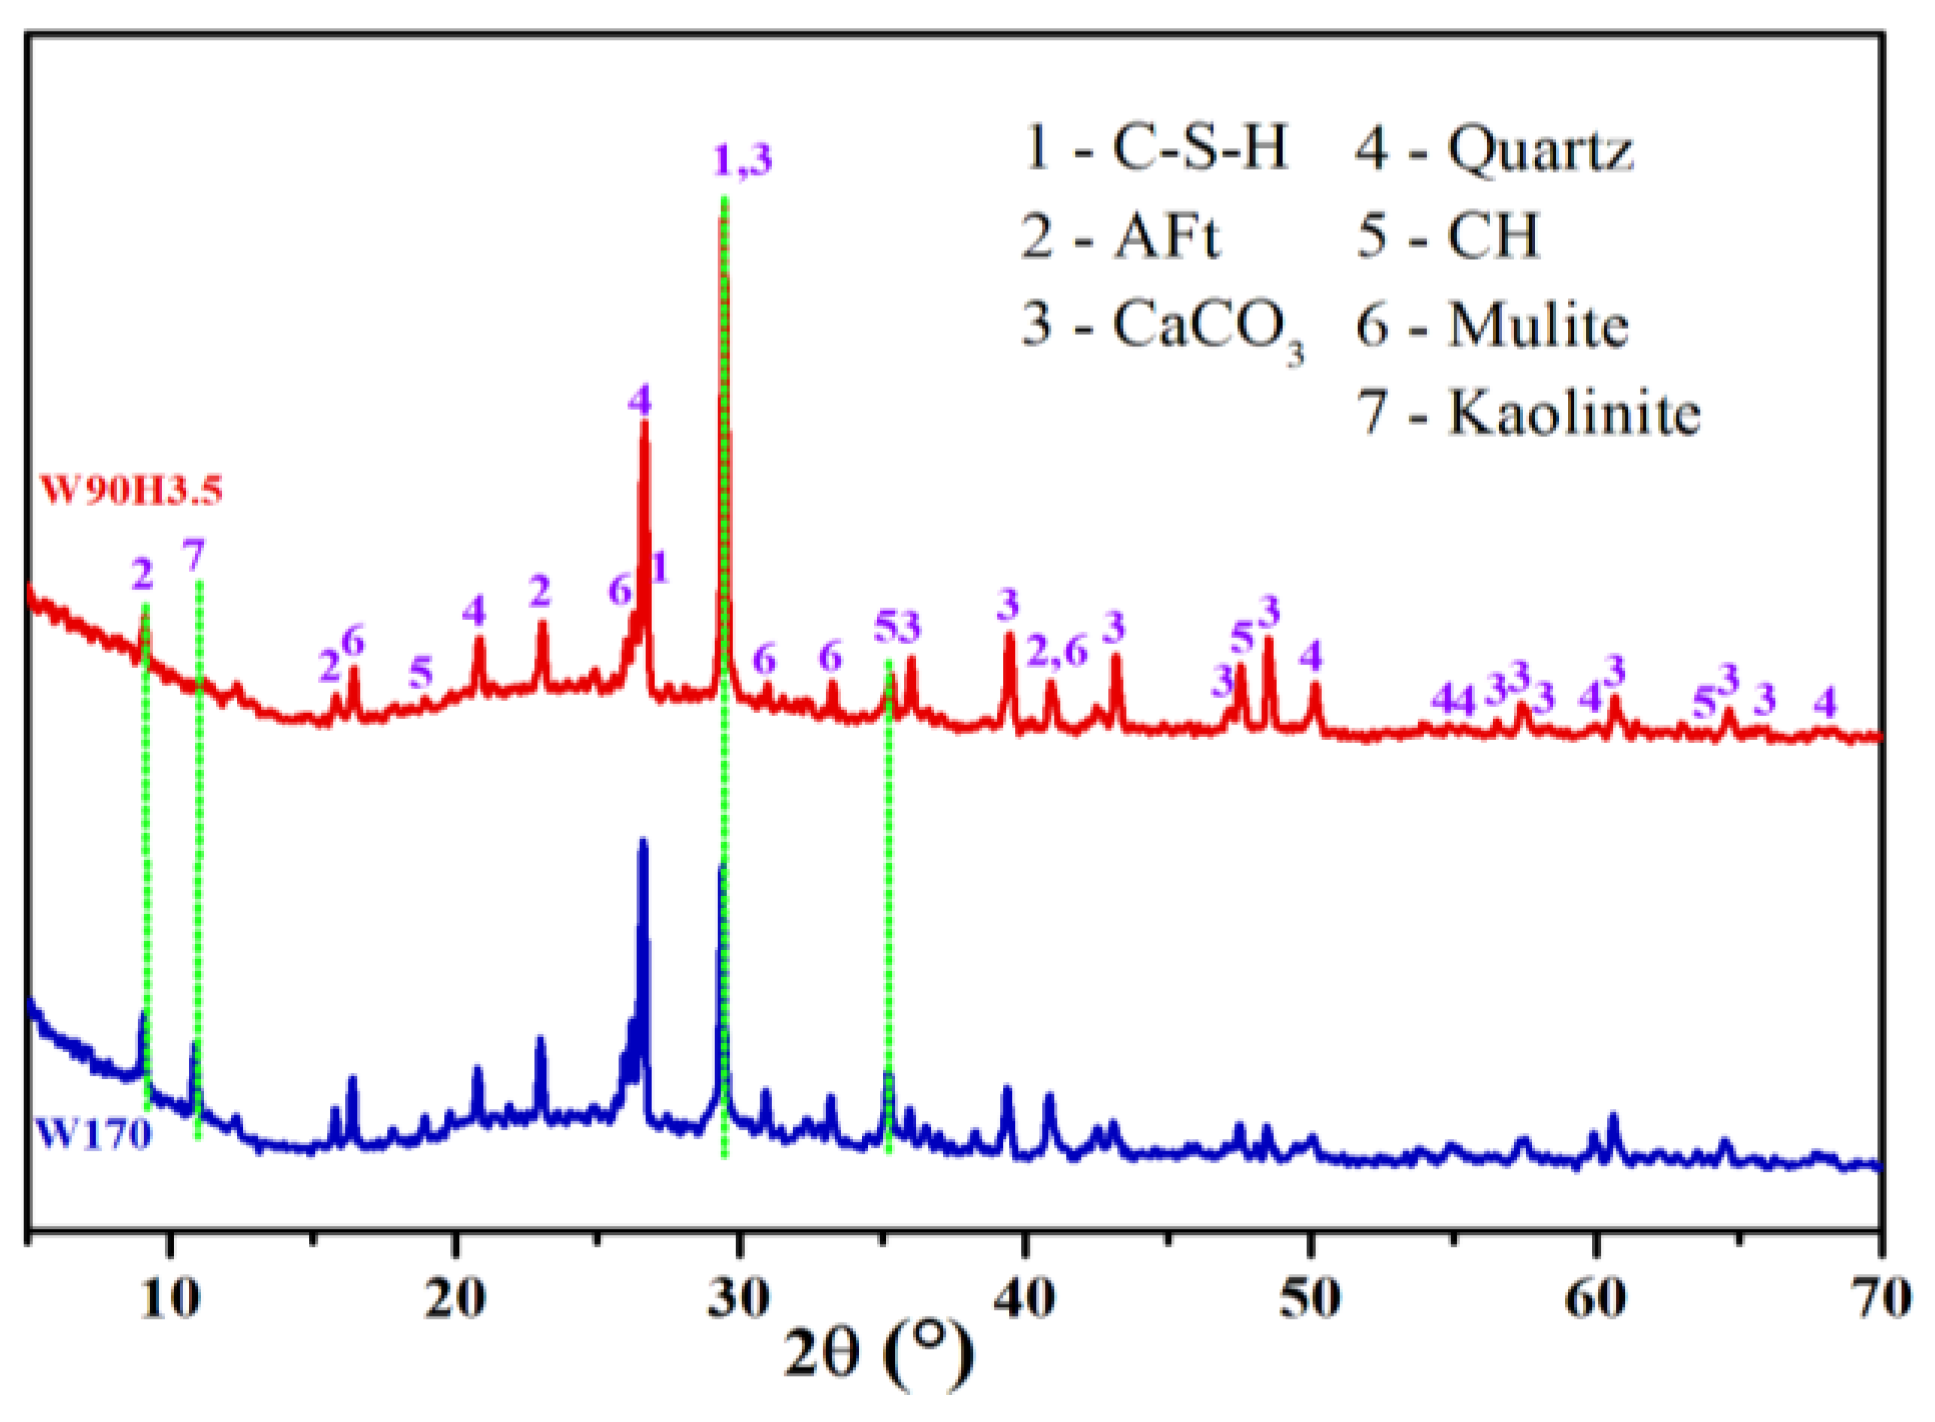
The XRD spectra of the W170 and W90H3.5 specimens cured for 28 days are given in Figure 12. The primary products from hydration reactions in both cases are calcium silicate hydrate (C-S-H), ettringite (AFt), and portlandite (CH). A moderate amount of quartz and mullite from CG and FA still remains in the specimens due to their relatively stable structures. It was reported that the H2O2 had no significant effects on the hydration of cement [16,18]. Herein, significantly different from W170 CB, the feature diffraction peak of kaolinite from CG almost disappears in W90H3.5 CFB. This might be caused by the intercalating or even destroying effect of H2O2 on kaolinite crystal for its fragile, layered structures [48]. Moreover, compared to W170, the decreases in AFt and CH, and simultaneous increase in calcium carbonate (CaCO3), imply that the W90H3.5 is more prone to carbonation under humid conditions, and is also averse to strength development [49].
CFB materials with a large expansion ratio as well as acceptable strength are highly desired in practical filling. Therefore, the CFB formula should be further optimized by enhancing the foaming efficiency and strength of the CFB matrix. Moreover, given the temperature and pressure directly influencing the volume expansion, the expanding process and performance of CFB on a large scale and aspect ratio under conditions simulating actual filling environments call for further studies.
4. Conclusions
Based on the typical CB materials utilizing CG and FA, a CFB formulation employing H2O2 as a chemical foaming agent is studied in this work. The CFB slurry exhibits expansion in volume immediately after being mixed with the H2O2 solution, resulting from generated oxygen with H2O2 decomposition. The foamed slurry finally forms a porous body via curing reactions. The conclusions can be drawn as follows.
- (1)
- The metallic compounds contained in CG, FA, and cement appear to offer efficient catalysts for H2O2 decomposition. However, the cement and FA show obvious inhibiting effects on volume expansion, possibly because the network formed by their hydrates limits the bubbles in the slurry. Therefore, moderately lower cement, FA, and solid concentrations are beneficial to improve the volume increment and prolong the duration of the expansion.
- (2)
- A foaming coefficient (k) is put forward, in theory, to evaluate the foaming efficiency of H2O2 under specific conditions. In practice, the k values can also be roughly determined by volume evolution experiments of CFB slurries, providing a calculation basis for the needed dosage of H2O2 solution targeting specific volume increments. The k values of the studied CFB slurries range from 21.43 to 64.29 cm3/g. The improvement of the k value offers a clear direction to optimize the CFB formula and filling operations.
- (3)
- According to the recommended range of H2O2 dosage afforded by the foaming coefficients of the slurries, the preparation of CFB specimens with a specific volume is demonstrated. CFB specimens with expanding ratios of 21%~103% and densities of 994~592 kg/cm3 were prepared, with an actual foaming coefficient of 52.40 cm3/g. The dosage of the H2O2 solution was 1.9%~11.3% of cement and 0.29%~1.67% of total solid materials by weight.
- (4)
- The UCS of the CFB specimens cured for 28 days is 0.32~0.55 MPa. The rich pores and carbonation contribute to UCS decline compared to CB. The porous structure of CFB made it prone to carbonation under humid conditions and averse to strength development.
Author Contributions
Conceptualization, X.W. and J.Z.; methodology, M.L., F.G. and B.H.; formal analysis, X.W., A.T., L.J. and B.H.; investigation, X.W. and L.J.; data curation, X.W., M.L. and J.Z.; writing—original draft preparation, X.W.; writing—review and editing, X.W. and A.T.; supervision, J.Z., A.T. and M.L.; project administration, X.W. and J.Z.; funding acquisition, X.W. All authors have read and agreed to the published version of the manuscript.
Funding
This research was financially supported by the National Science Foundation for Distinguished Young Scholars (51725403), National Natural Science Foundation of China (52130402), Natural Science Foundation of Jiangsu Province (BK20210501), the China Postdoctoral Science Foundation (2021M693418), and the Youth Science and Technology Foundation, CUMT (2022QN1001).
Institutional Review Board Statement
Not applicable.
Informed Consent Statement
Not applicable.
Data Availability Statement
Data is contained within the article.
Acknowledgments
The authors acknowledge the China University of Mining and Technology (CUMT) for providing the experimental platform, and the reviewers for their scientific comments and suggestions. The authors are grateful to Xufeng Wang and Nan Zhou for the instructions for topic selection, Qiang Zhang for kindly providing the CG materials, and Jun Chai and Yandong Zhang for their help in the experiments.
Conflicts of Interest
The authors declare no conflict of interest.
Abbreviations
| CB | cemented backfill |
| CFB | cemented foam backfill |
| CG | coal gangue |
| FA | fly ash |
| H2O2 | hydrogen dioxide |
| Wx | CB specimen, x represents the mass of water |
| WxHy | CFB specimen, x and y represent the mass of water and H2O2 solution |
| UCS | uniaxial compressive strength |
| XRD | X-ray diffraction |
| x-CT | X-ray computed tomography |
Appendix A
As shown in Table A1, the metallic ion concentrations in the mentioned tap water were determined by inductively coupled plasma–mass spectrometry (ICP-MS).

Table A1.
Metallic ion composition of the tap water used to prepare backfill.
| Ion | Na+ | Mg2+ | Ca2+ | K+ | Li+ |
|---|---|---|---|---|---|
| Content (mg/L) | 51.30 | 27.53 | 8.30 | 8.10 | 0.02 |
References
- Ma, D.; Zhang, J.; Duan, H.; Huang, Y.; Li, M.; Sun, Q.; Zhou, N. Reutilization of gangue wastes in underground backfilling mining: Overburden aquifer protection. Chemosphere 2021, 264, 128400. [Google Scholar] [CrossRef] [PubMed]
- Yang, K.; Zhao, X.; Wei, Z.; Zhang, J. Development overview of paste backfill technology in China’s coal mines: A review. Environ. Sci. Pollut. Res. 2021, 28, 67957–67969. [Google Scholar] [CrossRef] [PubMed]
- Zhang, J.; Li, B.; Zhou, N.; Zhang, Q. Application of solid backfilling to reduce hard-roof caving and longwall coal face burst potential. Int. J. Rock Mech. Min. Sci. 2016, 88, 197–205. [Google Scholar] [CrossRef]
- Chang, Q.; Chen, J.; Zhou, H.; Bai, J. Implementation of Paste Backfill Mining Technology in Chinese Coal Mines. Sci. World J. 2014, 2014, 821025. [Google Scholar] [CrossRef] [PubMed]
- Zhang, J.; Li, M.; Taheri, A.; Zhang, W.; Wu, Z.; Song, W. Properties and Application of Backfill Materials in Coal Mines in China. Minerals 2019, 9, 53. [Google Scholar] [CrossRef] [Green Version]
- Yin, Y.; Zhao, T.; Zhang, Y.; Tan, Y.; Qiu, Y.; Taheri, A.; Jing, Y. An Innovative Method for Placement of Gangue Backfilling Material in Steep Underground Coal Mines. Minerals 2019, 9, 107. [Google Scholar] [CrossRef] [Green Version]
- Qi, C.; Fourie, A. Cemented paste backfill for mineral tailings management: Review and future perspectives. Miner. Eng. 2019, 144, 106025. [Google Scholar] [CrossRef]
- Li, J.; Wang, J. Comprehensive utilization and environmental risks of coal gangue: A review. J. Clean. Prod. 2019, 239, 117946. [Google Scholar] [CrossRef]
- Behera, S.K.; Mishra, D.P.; Singh, P.; Mishra, K.; Mandal, S.K.; Ghosh, C.N.; Kumar, R.; Mandal, P.K. Utilization of mill tailings, fly ash and slag as mine paste backfill material: Review and future perspective. Constr. Build. Mater. 2021, 309, 125120. [Google Scholar] [CrossRef]
- Zhao, Y.; Taheri, A.; Karakus, M.; Chen, Z.; Deng, A. Effects of water content, water type and temperature on the rheological behaviour of slag-cement and fly ash-cement paste backfill. Int. J. Min. Sci. Technol. 2020, 30, 271–278. [Google Scholar] [CrossRef]
- Zhao, Y.; Soltani, A.; Taheri, A.; Karakus, M.; Deng, A. Application of Slag–Cement and Fly Ash for Strength Development in Cemented Paste Backfills. Minerals 2019, 9, 22. [Google Scholar] [CrossRef] [Green Version]
- Zhang, J.; Sun, Q.; Fourie, A.; Ju, F.; Dong, X. Risk assessment and prevention of surface subsidence in deep multiple coal seam mining under dense above-ground buildings: Case study. Hum. Ecol. Risk Assess. Int. J. 2019, 25, 1579–1593. [Google Scholar] [CrossRef]
- Zhou, N.; Li, M.; Zhang, J.; Gao, R. Roadway backfill method to prevent geohazards induced by room and pillar mining: A case study in Changxing coal mine, China. Nat. Hazards Earth Syst. Sci. 2016, 16, 2473–2484. [Google Scholar] [CrossRef]
- Cai, W.; Chang, Z.; Zhang, D.; Wang, X.; Cao, W.; Zhou, Y. Roof filling control technology and application to mine roadway damage in small pit goaf. Int. J. Min. Sci. Technol. 2019, 29, 477–482. [Google Scholar] [CrossRef]
- Zhao, Y.; Taheri, A.; Karakus, M.; Deng, A.; Guo, L. The Effect of Curing under Applied Stress on the Mechanical Performance of Cement Paste Backfill. Minerals 2021, 11, 1107. [Google Scholar] [CrossRef]
- Zhang, S.; Yang, L.; Qiu, J.; Hou, C.; Guo, Z. Fluidity and strength behaviors of cemented foam backfill: Effect of particle size distribution and foaming agent dosage. Bull. Eng. Geol. Environ. 2021, 80, 3177–3191. [Google Scholar] [CrossRef]
- Han, J.; Jia, D.; Yan, P. Understanding the shrinkage compensating ability of type K expansive agent in concrete. Constr. Build. Mater. 2016, 116, 36–44. [Google Scholar] [CrossRef]
- Qiu, J.; Guo, Z.; Li, L.; Zhang, S.; Zhao, Y.; Ma, Z. A Hybrid Artificial Intelligence Model for Predicting the Strength of Foam-Cemented Paste Backfill. IEEE Access 2020, 8, 84569–84583. [Google Scholar] [CrossRef]
- Zhou, N.; Zhang, J.; Ouyang, S.; Deng, X.; Dong, C.; Du, E. Feasibility study and performance optimization of sand-based cemented paste backfill materials. J. Clean. Prod. 2020, 259, 120798. [Google Scholar] [CrossRef]
- El Eraki, M.H.; El Lawindy, A.M.Y.; Hassan, H.H.; Mahmoud, W.E. The physical properties of pressure sensitive rubber composites. Polym. Degrad. Stab. 2006, 91, 1417–1423. [Google Scholar] [CrossRef]
- González Nava, M.; Cruz-Ramírez, A.; Suarez Rosales, M.Á.; Gutiérrez-Pérez, V.H.; Sánchez-Martínez, A. Fabrication of aluminum alloy foams by using alternative thickening agents via melt route. J. Alloys Compd. 2017, 698, 1009–1017. [Google Scholar] [CrossRef]
- Huang, Z.; Zhang, T.; Wen, Z. Proportioning and characterization of Portland cement-based ultra-lightweight foam concretes. Constr. Build. Mater. 2015, 79, 390–396. [Google Scholar] [CrossRef]
- Wang, Z.; Liu, L.; Zhou, J.; Zhou, C. Impacts of potassium permanganate (KMnO4) catalyst on properties of hydrogen peroxide (H2O2) foamed porous cement slurry. Constr. Build. Mater. 2016, 111, 72–76. [Google Scholar] [CrossRef]
- Chica, L.; Alzate, A. Cellular concrete review: New trends for application in construction. Constr. Build. Mater. 2019, 200, 637–647. [Google Scholar] [CrossRef]
- Xu, X.; Sun, X.; Yao, W.; Wu, P.; Qiu, J.; Guo, Z.; Liu, N. Strength and Ultrasonic Characteristics of Cemented Paste Backfill Incorporating Foaming Agent. Minerals 2021, 11, 681. [Google Scholar] [CrossRef]
- Zhang, S.; Yang, L.; Ren, F.; Qiu, J.; Ding, H. Rheological and mechanical properties of cemented foam backfill: Effect of mineral admixture type and dosage. Cem. Concr. Compos. 2020, 112, 103689. [Google Scholar] [CrossRef]
- Ma, S.-J.; Kang, E.-G.; Kim, D.-M. The study on devolopment of light-weight foamed mortar for tunnel backfill. Int. J. Mod. Phys. Conf. Ser. 2012, 06, 449–454. [Google Scholar] [CrossRef]
- Xu, S.; Suorineni, F.T.; Li, K.; Li, Y. Evaluation of the strength and ultrasonic properties of foam-cemented paste backfill. Int. J. Min. Reclam. Environ. 2017, 31, 544–557. [Google Scholar] [CrossRef]
- Wang, G.; Deng, Z.; Xu, H.; Wang, D.; Lu, Z. Application of Foamed Concrete Backfill in Improving Antiexplosion Performance of Buried Pipelines. J. Mater. Civ. Eng. 2021, 33, 04021052. [Google Scholar] [CrossRef]
- Hefni, M.; Hassani, F. Experimental Development of a Novel Mine Backfill Material: Foam Mine Fill. Minerals 2020, 10, 564. [Google Scholar] [CrossRef]
- Yang, X.; Qiu, Y.; Yang, J. Experimental Study on the Preparation of Foamed Backfill Block Based on Phosphate Tailings. Non-Met. Mines 2020, 43, 59–63. [Google Scholar]
- Oey, T.; Timmons, J.; Stutzman, P.; Bullard, J.W.; Balonis, M.; Bauchy, M.; Sant, G. An improved basis for characterizing the suitability of fly ash as a cement replacement agent. J. Am. Ceram. Soc. 2017, 100, 4785–4800. [Google Scholar] [CrossRef]
- Sang, G.; Zhu, Y.; Yang, G.; Zhang, H. Preparation and characterization of high porosity cement-based foam material. Constr. Build. Mater. 2015, 91, 133–137. [Google Scholar] [CrossRef]
- Zhang, J.; Deng, H.; Taheri, A.; Deng, J.; Ke, B. Effects of Superplasticizer on the Hydration, Consistency, and Strength Development of Cemented Paste Backfill. Minerals 2018, 8, 381. [Google Scholar] [CrossRef] [Green Version]
- Panchuk, V.; Yaroshenko, I.; Legin, A.; Semenov, V.; Kirsanov, D. Application of chemometric methods to XRF-data—A tutorial review. Anal. Chim. Acta 2018, 1040, 19–32. [Google Scholar] [CrossRef] [PubMed]
- Zhou, D.; Fang, L.; Tao, M.; Du, Z.; Cheng, F. Preparation, properties of foamed basic magnesium sulfate cements and their foaming mechanisms with different activators. J. Build. Eng. 2022, 50, 104202. [Google Scholar] [CrossRef]
- Zeineb, O.; Hedi, B.A.; Jeday, M.R.; Cheker, C. Kinetic study of the catalytic decomposition of H2O2 in phosphoric acid medium. Int. J. Hydrogen Energy 2015, 40, 1278–1282. [Google Scholar] [CrossRef]
- Pham, A.L.-T.; Doyle, F.M.; Sedlak, D.L. Kinetics and efficiency of H2O2 activation by iron-containing minerals and aquifer materials. Water Res. 2012, 46, 6454–6462. [Google Scholar] [CrossRef] [Green Version]
- Bruchon, J.; Coupez, T. A numerical strategy for the direct 3D simulation of the expansion of bubbles into a molten polymer during a foaming process. Int. J. Numer. Methods Fluids 2008, 57, 977–1003. [Google Scholar] [CrossRef]
- Yin, B.; Kang, T.; Kang, J.; Chen, Y.; Wu, L.; Du, M. Investigation of the hydration kinetics and microstructure formation mechanism of fresh fly ash cemented filling materials based on hydration heat and volume resistivity characteristics. Appl. Clay Sci. 2018, 166, 146–158. [Google Scholar] [CrossRef]
- Zhao, J.; Deng, Y.; Gao, P.; Lu, X.; Zhang, J.; Zong, J. Pore Structure, Morphology, and Strength of Self-Compacting Foam Material Backfilled Behind the Underground Pipe-Wall of Yellow River. Materials 2020, 13, 5724. [Google Scholar] [CrossRef] [PubMed]
- Wu, D.; Zhang, Y.; Liu, Y. Mechanical performance and ultrasonic properties of cemented gangue backfill with admixture of fly ash. Ultrasonics 2016, 64, 89–96. [Google Scholar] [CrossRef] [PubMed]
- Zhang, X.; Zhang, S. Experimental Investigation on Mechanical Properties of In Situ Cemented Paste Backfill Containing Coal Gangue and Fly Ash. Adv. Civ. Eng. 2020, 2020, 7964267. [Google Scholar] [CrossRef]
- Ma, L.; Wang, S.; Yu, Y.; Du, H. Technology and practice of continuous mining and backfilling with wall system for water conservation. J. Min. Saf. Eng. 2021, 38, 902–910. [Google Scholar]
- Li, M.; Zhang, J.; Li, A.; Zhou, N. Reutilisation of coal gangue and fly ash as underground backfill materials for surface subsidence control. J. Clean. Prod. 2020, 254, 120113. [Google Scholar] [CrossRef]
- Wang, Y.; Huang, Y.; Hao, Y. Experimental Study and Application of Rheological Properties of Coal Gangue-Fly Ash Backfill Slurry. Processes 2020, 8, 284. [Google Scholar] [CrossRef] [Green Version]
- Ni, K.; Shi, Y.; Hu, Z.; Zhang, Y.; Wan, P. Effect of Coal Gangue Grain Size on Strength of Foam Concrete. J. Phys. Conf. Ser. 2020, 1635, 012080. [Google Scholar] [CrossRef]
- Liu, T.; Qu, H.; Tian, J.; He, S.; Su, Y.; Su, H. Preparation of Organic-Free Two-Dimensional Kaolinite Nanosheets by In Situ Interlayer Fenton Reaction. ChemistrySelect 2019, 4, 11604–11608. [Google Scholar] [CrossRef]
- Qiu, Q. A state-of-the-art review on the carbonation process in cementitious materials: Fundamentals and characterization techniques. Constr. Build. Mater. 2020, 247, 118503. [Google Scholar] [CrossRef]
Figure 1.
Illustration of CB and CFB in mined-out areas.

Figure 2.
Particle size distribution of the (a) coal gangue, (b) fly ash, and (c) cement.

Figure 3.
XRD spectra of the (a) coal gangue, (b) fly ash, and (c) cement.

Figure 4.
Experimental diagram to monitor volume evolution of CFB slurry.

Figure 5.
Preparation procedure of CB and CFB samples.

Figure 6.
Volume increment evolution of foamed slurry at (a) 70 and (b) 74 wt%.

Figure 7.
Images for Wx specimens of different filling ratios from the side view.

Figure 8.
Volume increment of CFB specimens prepared at 70 wt%. The blue region represents the recommended range of H2O2 dosage acquired between two reference lines. The star patterns and red line represent the minimum dosages of H2O2 solution for CFB specimens with different volume increments and linear fitting line, respectively.

Figure 9.
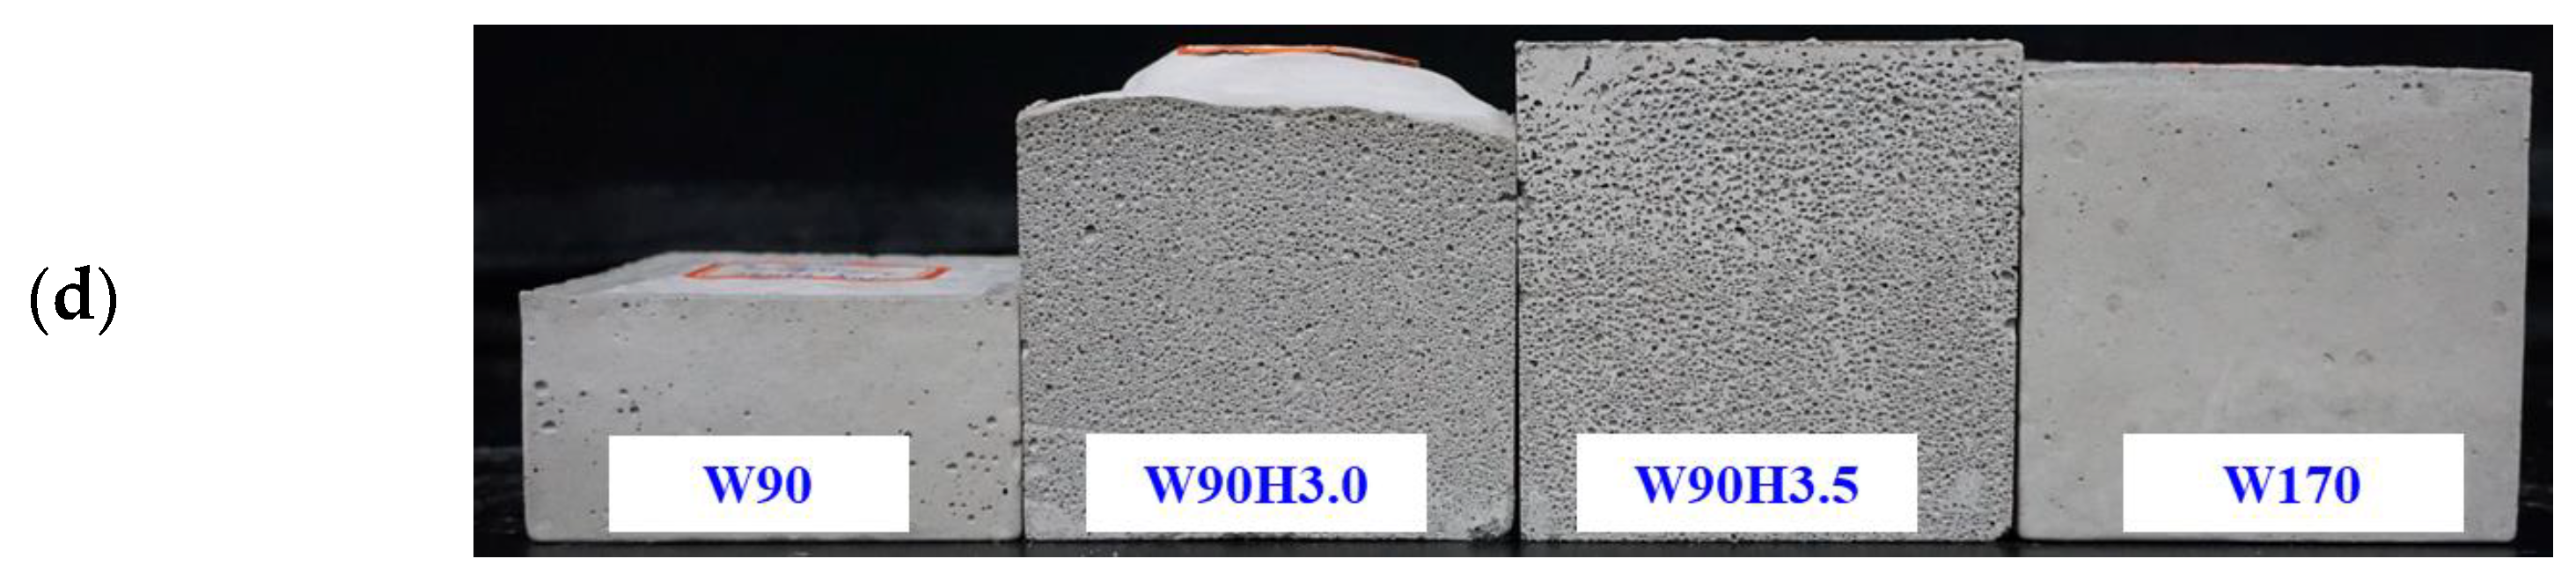
Images for specimens from the side view: (a) W150Hy, (b) W130Hy, (c) W110Hy, and (d) W90Hy series in comparison with W170.
Figure 9.
Images for specimens from the side view: (a) W150Hy, (b) W130Hy, (c) W110Hy, and (d) W90Hy series in comparison with W170.


Figure 10.
UCS curve of specimens versus expansion ratio.

Figure 11.
CT images of W170 (a) and W90H3.5 (b) specimens. The red, yellow, and blue regions represent pores, CG aggregates, and matrix, respectively.
Figure 11.
CT images of W170 (a) and W90H3.5 (b) specimens. The red, yellow, and blue regions represent pores, CG aggregates, and matrix, respectively.

Figure 12.
XRD spectra of W170 (bottom) and W90H3.5 (top) specimens.

Table 1.
Chemical components of the coal gangue, fly ash, and cement.
| Material | SiO2 | Al2O3 | Fe2O3 | CaO | K2O | TiO2 | MgO | Na2O | SO3 |
|---|---|---|---|---|---|---|---|---|---|
| CG | 64.6 | 23.9 | 4.19 | 2.73 | 2.05 | 1.00 | 0.70 | 0.62 | - |
| FA | 52.6 | 31.5 | 5.30 | 3.43 | 2.50 | 1.15 | 0.81 | 1.01 | 0.94 |
| Cement | 24.1 | 9.79 | 3.63 | 53.5 | 1.24 | 0.40 | 2.84 | 0.21 | 3.90 |
Table 2.
Foamed W90H3.5 slurry at 70 and 74 wt% for volume evolution.
| Concentration (wt%) | Water (g) | CG (g) | FA (g) | Cement (g) | HEC (g) | H2O2 Solution (g) |
|---|---|---|---|---|---|---|
| 70 | 90 | 93 | 86 | 31 | 0.62 | 3.5 |
| 74 | 90 | 116 | 102 | 38 | 0.76 | 3.5 |
Table 3.
Volume increments and foaming coefficients of W90H3.5 slurry at 70 and 74 wt%.
| Concentration (wt%) | Absent Material | ΔV (cm3) | kem (cm3/g) 1 |
|---|---|---|---|
| 70 | - | 95 | 27.14 |
| CG | 88 | 25.14 | |
| FA | 195 | 55.71 | |
| Cement | 225 | 64.29 | |
| 74 | - | 100 | 28.57 |
| CG | 75 | 21.43 | |
| FA | 165 | 47.14 | |
| Cement | 190 | 54.29 |
1 The foaming coefficients were calculated as: kem = ΔV/m(H2O2 solution) = ΔV/3.5.
Table 4.
CB and CFB samples prepared at 70 wt%.
| Samples | Water (g) | CG (g) | FA (g) | Cement (g) | HEC (g) | H2O2 Solution (g) | Height (mm) | Filling Ratio 1 | V (cm3) | ΔV (cm3) 2 | Expansion Ratio η 2 | Mass (g) 3 | Density (kg/m3) 3 |
|---|---|---|---|---|---|---|---|---|---|---|---|---|---|
| W170 | 170 | 176 | 156 | 59 | 1.18 | 0 | 67.6 | 96% | 338 | - | - | 414 | 1225 |
| W150 | 150 | 156 | 138 | 52 | 1.04 | 0 | 60.1 | 85% | 300 | - | - | - | - |
| W150H1.0 | 1.0 | 72.9 | >99% | 364 | 64 | 21% | 362 | 994 | |||||
| W130 | 130 | 135 | 120 | 45 | 0.90 | 0 | 51.6 | 73% | 258 | - | - | - | - |
| W130H1.9 | 1.9 | 72.8 | >99% | 364 | 106 | 41% | 315 | 865 | |||||
| W110 | 110 | 114 | 101 | 38 | 0.76 | 0 | 43.4 | 61% | 217 | - | - | - | - |
| W1102.8 | 2.8 | 71.5 | >99% | 357 | 140 | 64% | 268 | 751 | |||||
| W90 | 90 | 93 | 86 | 31 | 0.62 | 0 | 35.2 | 50% | 176 | - | - | - | - |
| W90H3.5 | 3.5 | 71.7 | >99% | 358 | 182 | 103% | 212 | 592 |
1 The filling ratio was determined by the ratio of specimen height to mold height (70.7 mm). 2 The expanded volume (ΔV) and ratio (η) of WxHy were calculated in comparison with corresponding Wx specimens without H2O2 solution in preparation. 3 The mass and apparent densities of CB and CFB specimens were determined after drying at 60 °C for 4 h [41].
Publisher’s Note: MDPI stays neutral with regard to jurisdictional claims in published maps and institutional affiliations. |
© 2022 by the authors. Licensee MDPI, Basel, Switzerland. This article is an open access article distributed under the terms and conditions of the Creative Commons Attribution (CC BY) license (https://creativecommons.org/licenses/by/4.0/).
Share and Cite
MDPI and ACS Style
Wang, X.; Zhang, J.; Li, M.; Gao, F.; Taheri, A.; Huo, B.; Jin, L. Expansion Properties of Cemented Foam Backfill Utilizing Coal Gangue and Fly Ash. Minerals 2022, 12, 763. https://doi.org/10.3390/min12060763
AMA Style
Wang X, Zhang J, Li M, Gao F, Taheri A, Huo B, Jin L. Expansion Properties of Cemented Foam Backfill Utilizing Coal Gangue and Fly Ash. Minerals. 2022; 12(6):763. https://doi.org/10.3390/min12060763
Chicago/Turabian StyleWang, Xiao, Jixiong Zhang, Meng Li, Feng Gao, Abbas Taheri, Binbin Huo, and Ling Jin. 2022. "Expansion Properties of Cemented Foam Backfill Utilizing Coal Gangue and Fly Ash" Minerals 12, no. 6: 763. https://doi.org/10.3390/min12060763
Note that from the first issue of 2016, this journal uses article numbers instead of page numbers. See further details here.