
Reduction Kinetics of Copper Slag by H2

1
School of Materials and Physics, China University of Mining and Technology, No. 1, Daxue Road, Xuzhou 221116, China
2
School of Metallurgy, Northeastern University, No. 3-11, Wenhua Road, Heping District, Shenyang 110819, China
*
Author to whom correspondence should be addressed.
Minerals 2022, 12(5), 548; https://doi.org/10.3390/min12050548
Submission received: 18 March 2022
/
Revised: 20 April 2022
/
Accepted: 25 April 2022
/
Published: 28 April 2022
(This article belongs to the Topic Recycling and Value-Added Utilization of Secondary Raw Materials)
Abstract
:In order to maximize the utilization value of copper slag, a process of smelting copper–iron alloy with copper slag is proposed here. The reduction kinetics of copper slag by H2 are studied in this paper. The main phases of the copper slag were Fe2SiO4 and Fe3O4. The suitable conditions of reduction were a temperature of 1373.15 K, a H2 partial pressure of 40%, and a calcium oxide addition amount of 30%. In these conditions, the metal reduction ratio was 85.12%. The copper slag, after reduction, was heated to 1773.15 K for 4 h. The content of iron in the metal was 85.11%, and the copper content was 10.40%. According to the unreacted nuclear model, the reduction process of copper slag is controlled by internal diffusion and chemical reaction. With the increase of the reduction ratio, internal diffusion is the main influencing factor. The activation energy of H2 reduction copper slag is 29.107~36.082 kJ/mol, which decreases gradually with the H2 partial pressure’s increase. The metal obtained by copper slag reduction contains a certain amount of sulfur, and a desulfurization process is required before it is used.
1. Introduction
In total, 1 metric ton of copper will generate 2 to 2.5 metric tons of copper slag, and a large amount of copper slag is produced in the world every year [1,2]. In 2020, the world’s copper production was about 23.55 million metric tons, and its copper slag production was more than 50 million metric tons. A large amount of copper slag creates economic, environmental and space problems; therefore, the government of China introduced policies to reduce copper slag emissions and enhance copper slag utilization [3].
Copper smelting slag contains a lot of valuable metal elements, more than 40% iron and 0.3% copper after dilution, which are close to or higher than the mining grade of industrial copper mines [4,5,6,7,8,9]. Some researchers have studied the recovery of copper or iron from copper slag. Nagasue et al. obtained iron ore that could be used for ironmaking from copper slag [10]. Reddv et al. used a two-step reduction method to limit the reduction of FeO, and the recovery ratio of metallic copper reached more than 85% [11]. Heo et al. investigated the effect of CaO addition on the reduction behavior of FeO, and the Fe recovery was the highest at about 90 wt.% [12]. Zhang et al. used a gas reductant to reduce copper slag, and analyzed the effect of different gas compositions on reduction [13]. Busolic et al. investigated the feasibility of Fe recovery from copper flash slag at 1723 K by adding excess coke [14]. They obtained Fe-Cu alloys, but they wanted to reduce the Cu content and only obtain iron. Zhang et al. used carbonaceous reductant to reduce copper slag and did a kinetic study [15]. The Fe grade reached 91.55%, and the Fe recovery ratio was 98.13%. Zuo et al. analyzed the migration behavior and trend of elements during the reduction of copper slag [16]. Zhang et al. used hydrogen to study the oxide system of iron and copper, analyzed the kinetics of gas–solid reduction, and obtained the general law of reduction of iron and copper oxides [17].
Few studies have focused on the simultaneous extraction of copper and iron from copper smelting slag. Recycling a certain metal or preparing building materials alone greatly reduces the comprehensive utilization value of copper slag, which affects the utilization of copper slag. The separation of copper and iron is difficult, but copper–iron alloys also can be used as raw materials for preparing copper–iron-based alloys, such as copper-containing antibacterial stainless steel, weathering steel and copper-containing high-chromium wear-resistant cast iron. At present, most of the recovery of copper and iron from copper slag is reduced by carbonaceous reducing agents, which introduces carbon into copper–iron alloys, and decarbonization is needed before its utilization. The process is long and the cost is high.
With the severe global warming and carbon emission restrictions, the research on hydrogen metallurgy continues to deepen. Hydrogen metallurgy can reduce carbon dioxide emissions, in addition to the generated water [18]. In this paper, H2 was used as the reducing agent to smelt copper-containing molten iron, which not only reduced CO2 emissions but also avoided the decarburization process after the reduction. The reduction kinetics of copper slag by H2 were studied. Kinetic research is an effective means to determine the suitable conditions for the reaction. The research on the kinetics of hydrogen reduction process can find the limiting link of hydrogen reduction of copper slag, and can determine the priority conditions for the improvement of the metal yield, which has guiding significance for the research of hydrogen reduction of copper slag.
2. Experiment
2.1. Raw Material
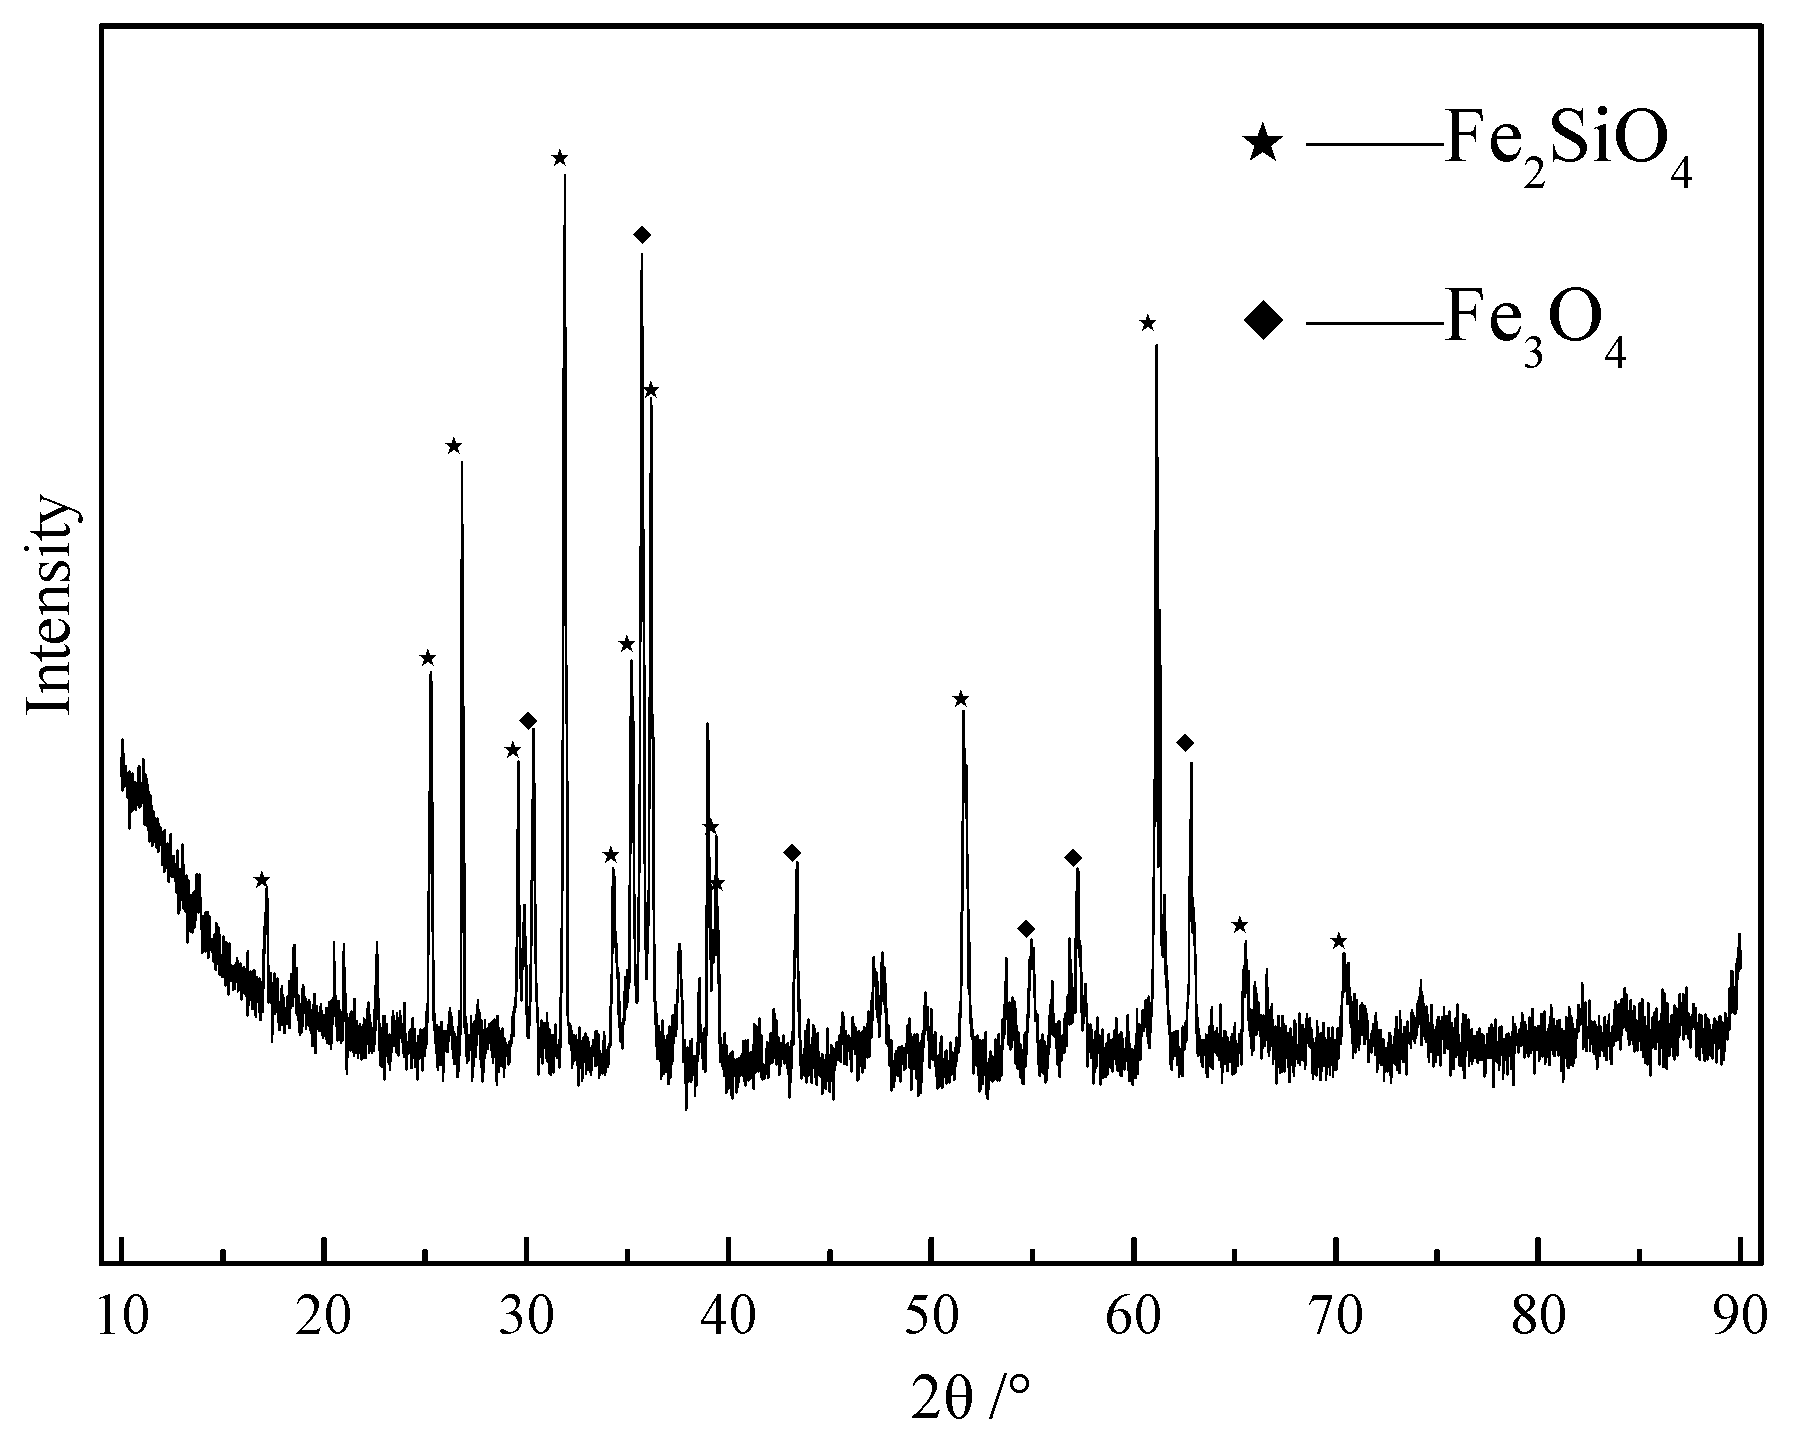
Copper slag is obtained from oxygen-rich bottom-blown smelting furnace, in which the copper and iron content is high. The composition of copper slag is shown in Table 1. The phase analysis results are shown in Figure 1. The morphological analysis is shown in Figure 2. It can be seen that the iron content is 44.73 wt.% and the copper content is 4.48 wt.%. The copper slag also contains a certain amount of valuable metal elements such as zinc and lead. The high sulfur content indicates that copper is mostly present in the form of matte in the slag. The main phase of copper slag is Fe3O4 and Fe2SiO4. Under the assumption that iron exists only in oxides and simple substances, it can be calculated that the slag contains 52.86% Fe2SiO4 and 20.14% Fe3O4.
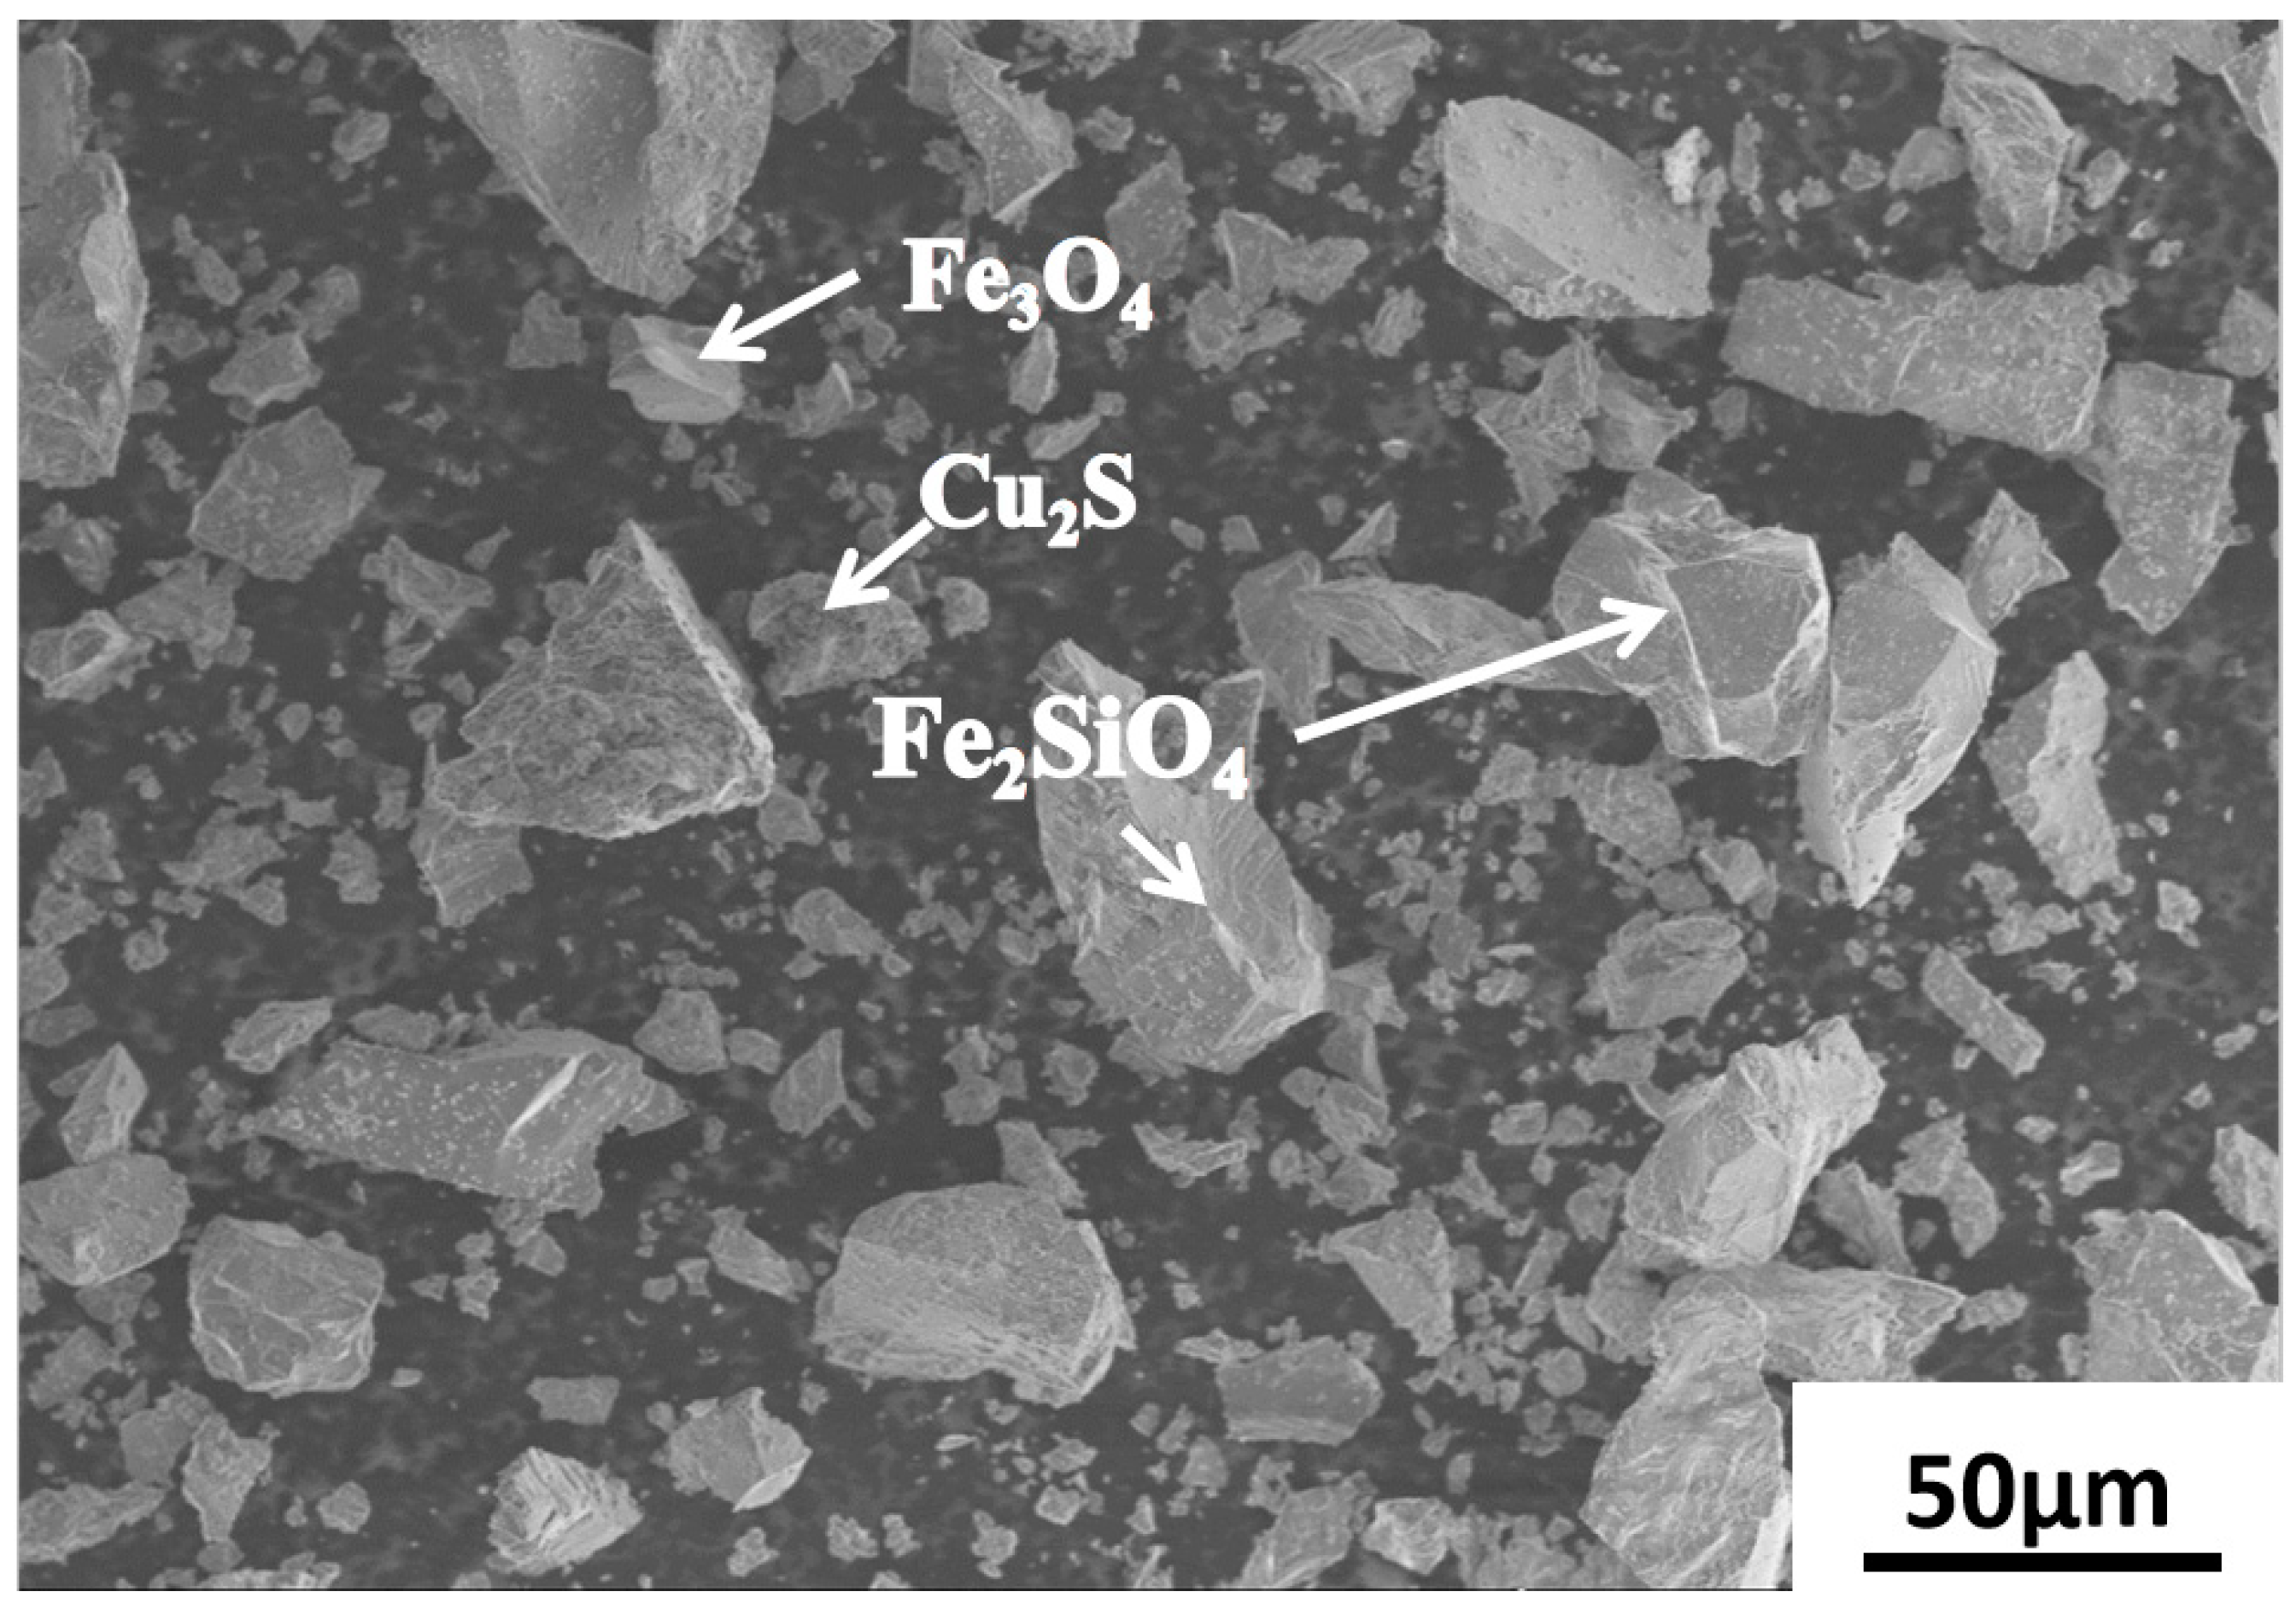
It can be seen from Figure 2 that iron is mainly present in the form of Fe3O4 and Fe2SiO4, and copper is present in the form of matte. The fayalite phase Fe2SiO4 in copper slag is difficult to reduce by hydrogen. CaO needs to be added to promote the decomposition of Fe2SiO4 and the dissociation of FeO, which can be more easily reduced by hydrogen.
2.2. Experimental Equipment
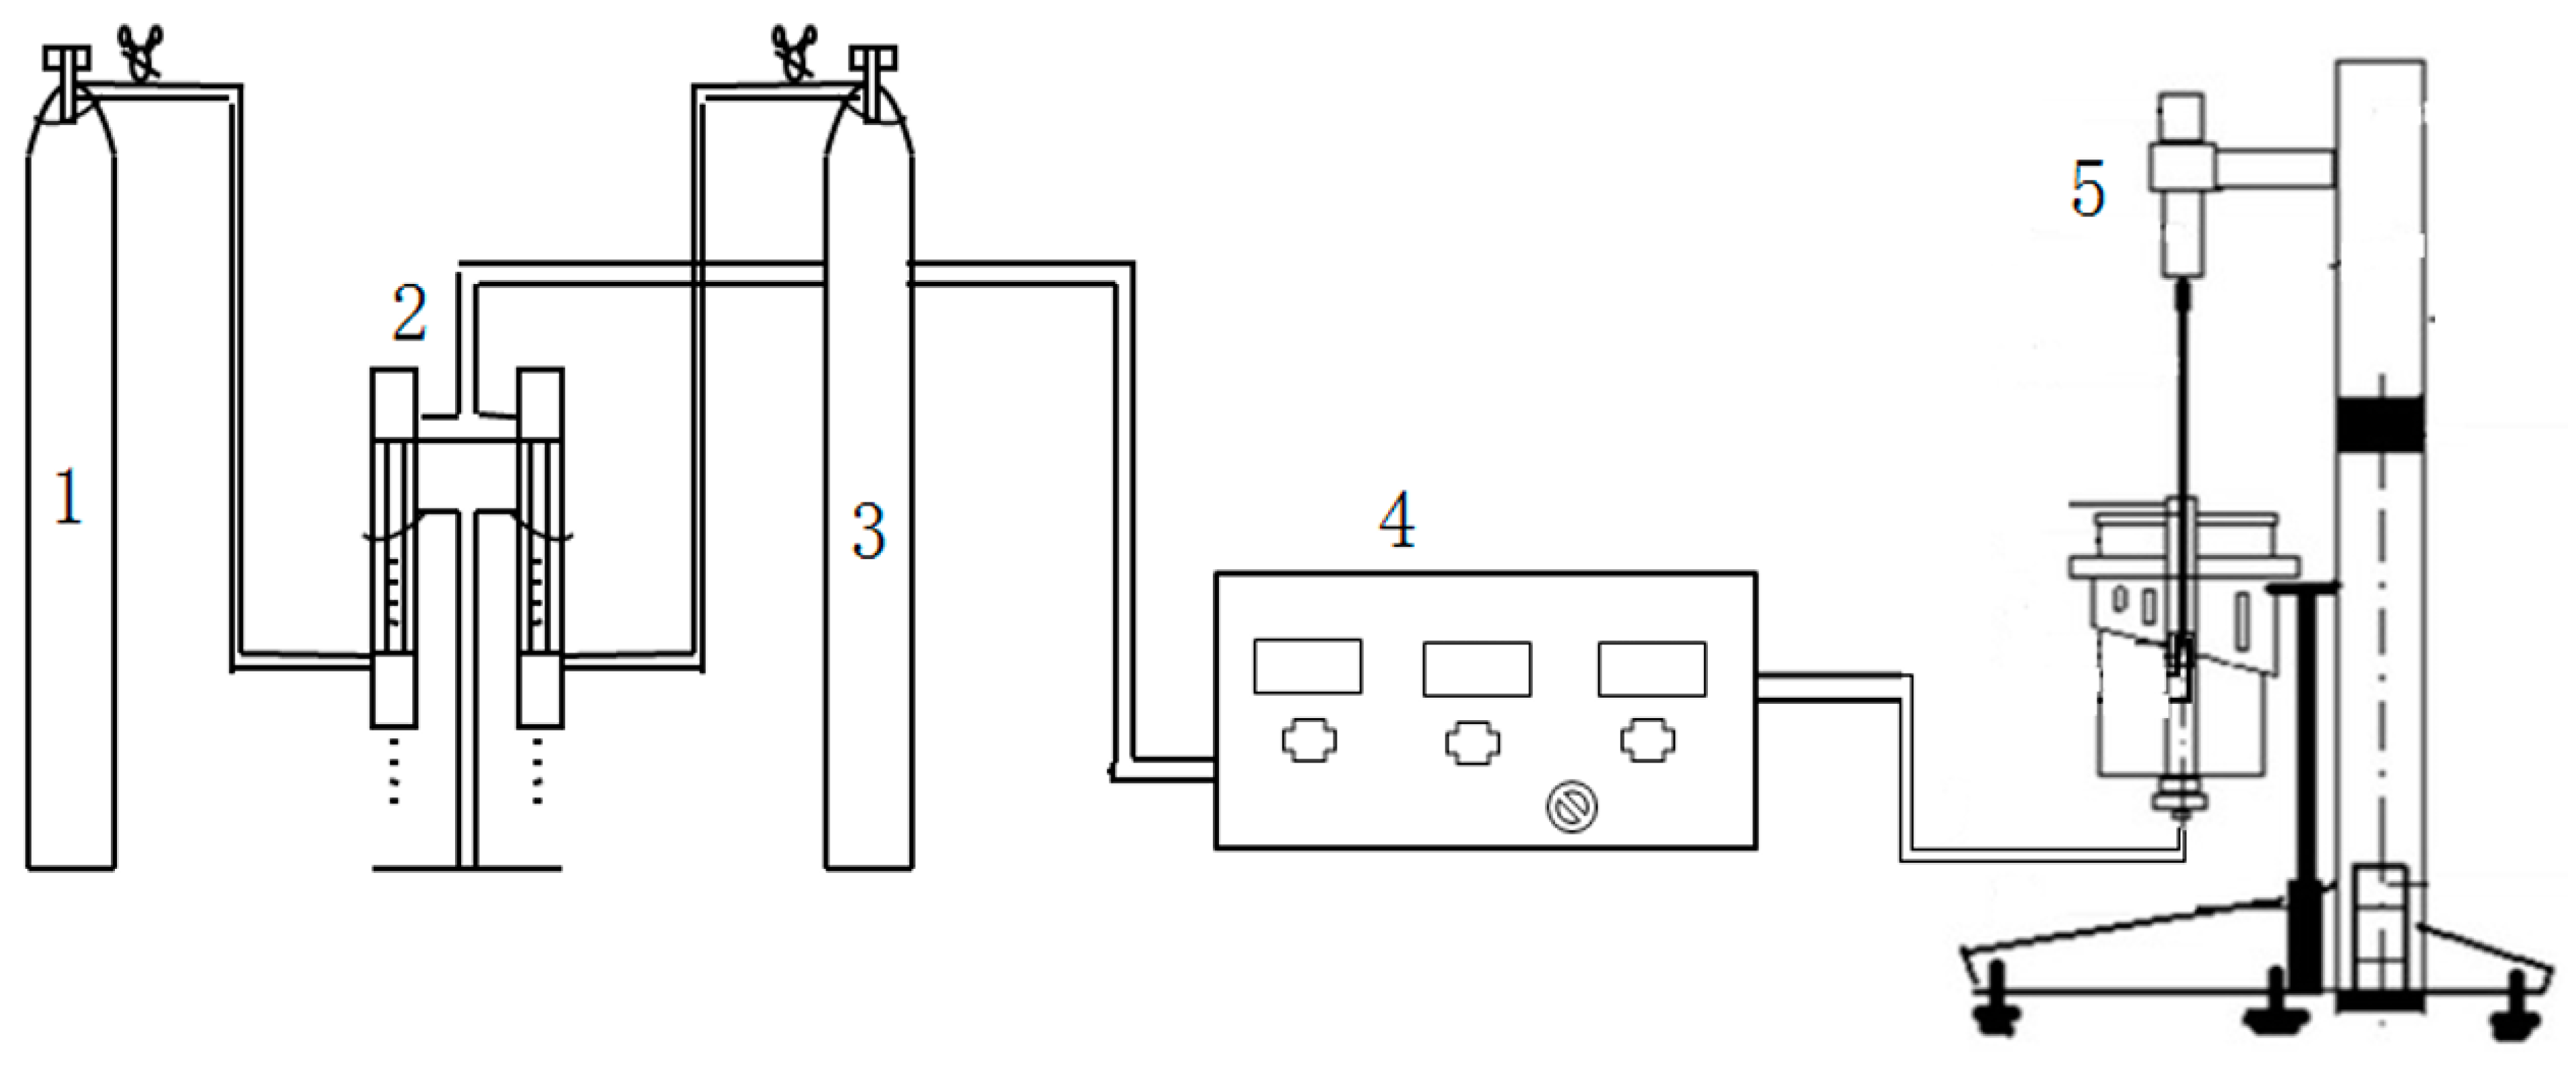
The experimental reaction equipment was a RTW-10 high-temperature melt physical property analyzer, and its structural schematic diagram is shown in Figure 3. The size of the corundum furnace tube was inner diameter, 51 mm; outer diameter, Φ60 mm; and length, 1000 mm.
In this experiment, H2 was injected from the bottom of the furnace. The corundum crucible was drilled to ensure that the H2 passes and reacts with the material. The size of the corundum crucible was 40 mm in its outer diameter and 36 mm in its inner diameter.
The thermogravimetric analysis method was used in the experiment. By continuously measuring the change of the sample mass with the reaction time, the reduction ratio was calculated. The measurement of the weight change in the sample during the experiment was performed on an electronic balance and a connected data output system.
The reduction ratio of copper slag can be expressed as:
where is the initial weight of the sample, g; is the weight of the sample when the reduction time is t, g; is the theoretical weight loss of the sample (when the sample is complete reduced), in g.
The reduction of the metals in copper slag is the reduction of iron and copper, which are present in the form of oxides and sulfides, respectively. The weight loss of the sample during reduction is the weight loss of oxygen and sulfur, and H2O and H2S will be generated during the reduction process. is 5.03 g when is 33 g.
2.3. Characterization Methods
The phases of the slags and matte samples were monitored using X-ray powder diffraction (XRD; D8, Bruker Ltd., Karlsruhe, Germany, Cu Kα1 radiation, increment 0.02) in the range of 10–90° (2θ). The compositions of the slag samples were detected using an atomic absorption spectrophotometer (SU-Z2700, Hitachi, Tokyo, Japan). The C and S contents in the slag and metal samples were detected using a carbon sulfur analyzer (G4 ICARUS, Bruker Ltd., Karlsruhe, Germany). The microstructures of the slag samples were monitored by SEM coupled with energy-dispersive X-ray spectroscopy (SU-8010, Hitachi, Tokyo, Japan).
2.4. Experimental Procedure
The copper slag was crushed into a granular powder with a diameter of less than 0.037 mm. The powder of the copper slag was thoroughly mixed with the calcium oxide according to a certain ratio, and the mixed raw materials were pressed into a cylinder with a diameter of 15 mm and a height of 15 mm. The pressure was 140 MPa.
The cylindrical sample was placed in the corundum hanging basket. The heating rate was 10 °C/min. Argon protection was applied during the heating process. After the specified temperature reached, the temperature was kept constant for 30 min, and the argon gas and the H2 gas were introduced into the reduction reaction with a certain ratio. The cooling rate was 10 °C/min, and argon protection was also used in the cooling process.
2.5. Experimental Results
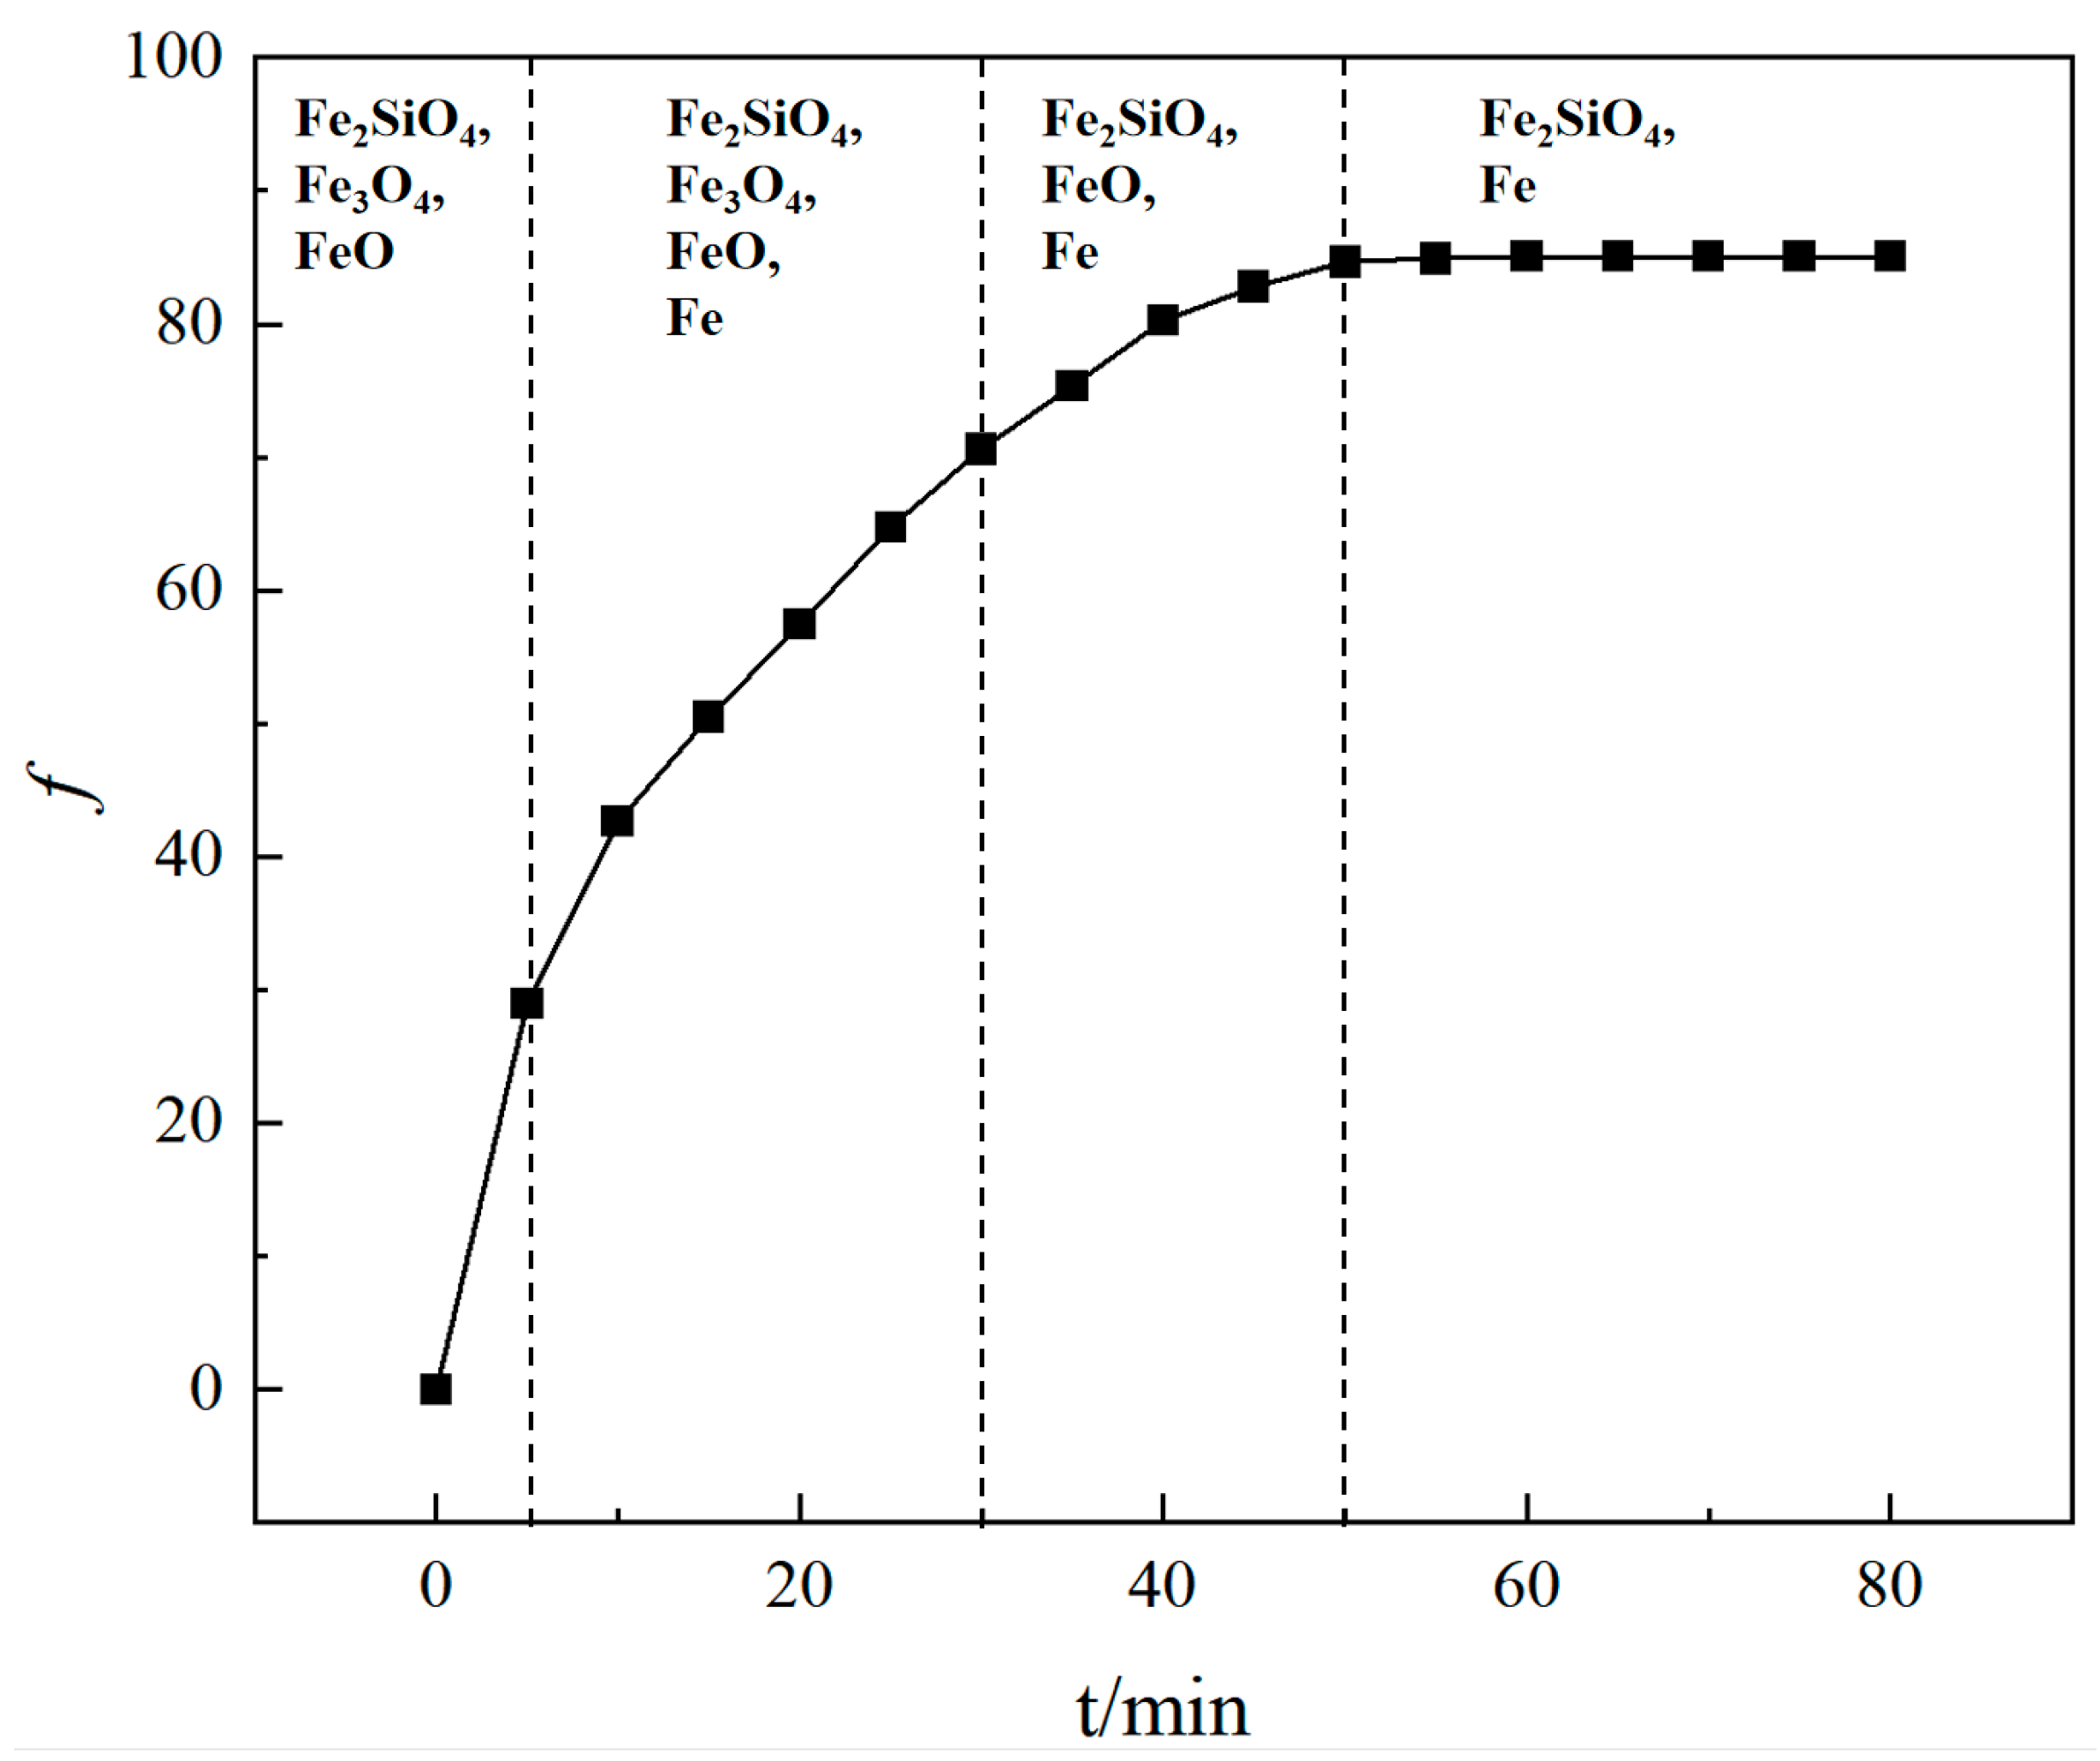
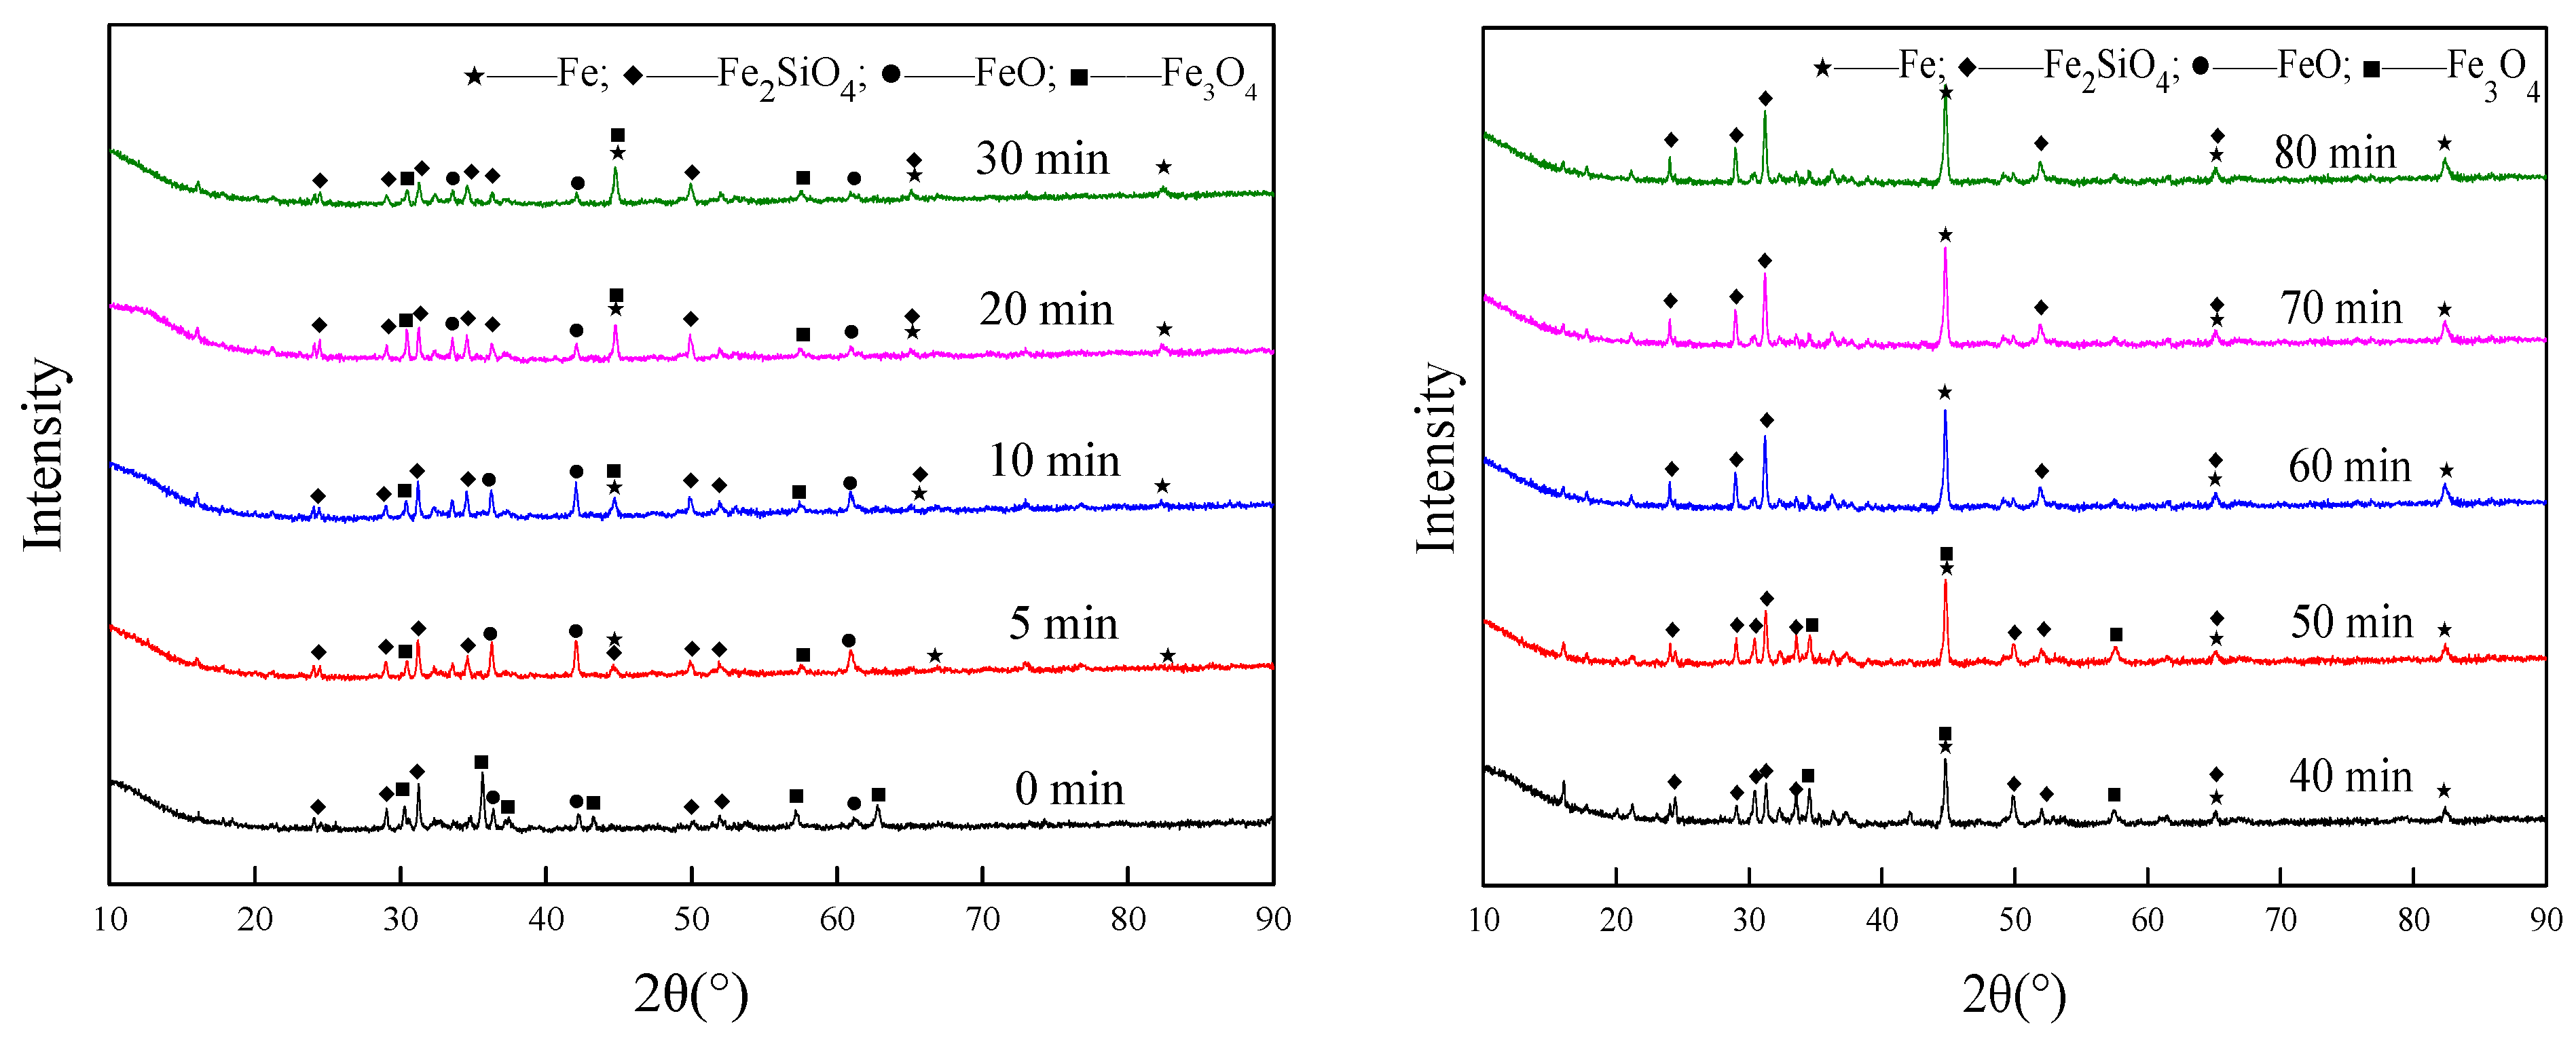
The basic conditions of the experiments were that the copper slag weighed 33 g, and the H2 flow was 4 L/min. In the suitable conditions, the CaO addition was 9.9 g, the temperature was 1373.15 K, the H2 partial pressure was 40%, and the reduction ratio was 85.04%. The experimental results are shown in Figure 4. The XRD pattern of the copper slag after reduction for different reaction times is shown in Figure 5.
In the beginning, the reduction speed is faster. With the increase of the reaction time, the peak of Fe gradually increases, and the peak of Fe2SiO4 is gradually weakened, indicating that the reduction time has an effect on the reduction effect. It can be seen from Figure 5 that the main components of the initial stage copper slag are Fe2SiO4 (fayalite) and Fe3O4 (magnetite). After 5 min, metal Fe appears. As the reaction time increases, the peak of Fe increases continuously. When the reaction time is 60 min, the reduction ratio reaches the maximum value. Then, the reduction ratio remains constant with the increase of the reaction time. The peak of Fe3O4 could not be detected at 30 min, and the peak of FeO could not be detected at 60 min.
The chemical composition of copper slag after reduction is shown in Table 2. The metal iron content in the slag greatly increases.
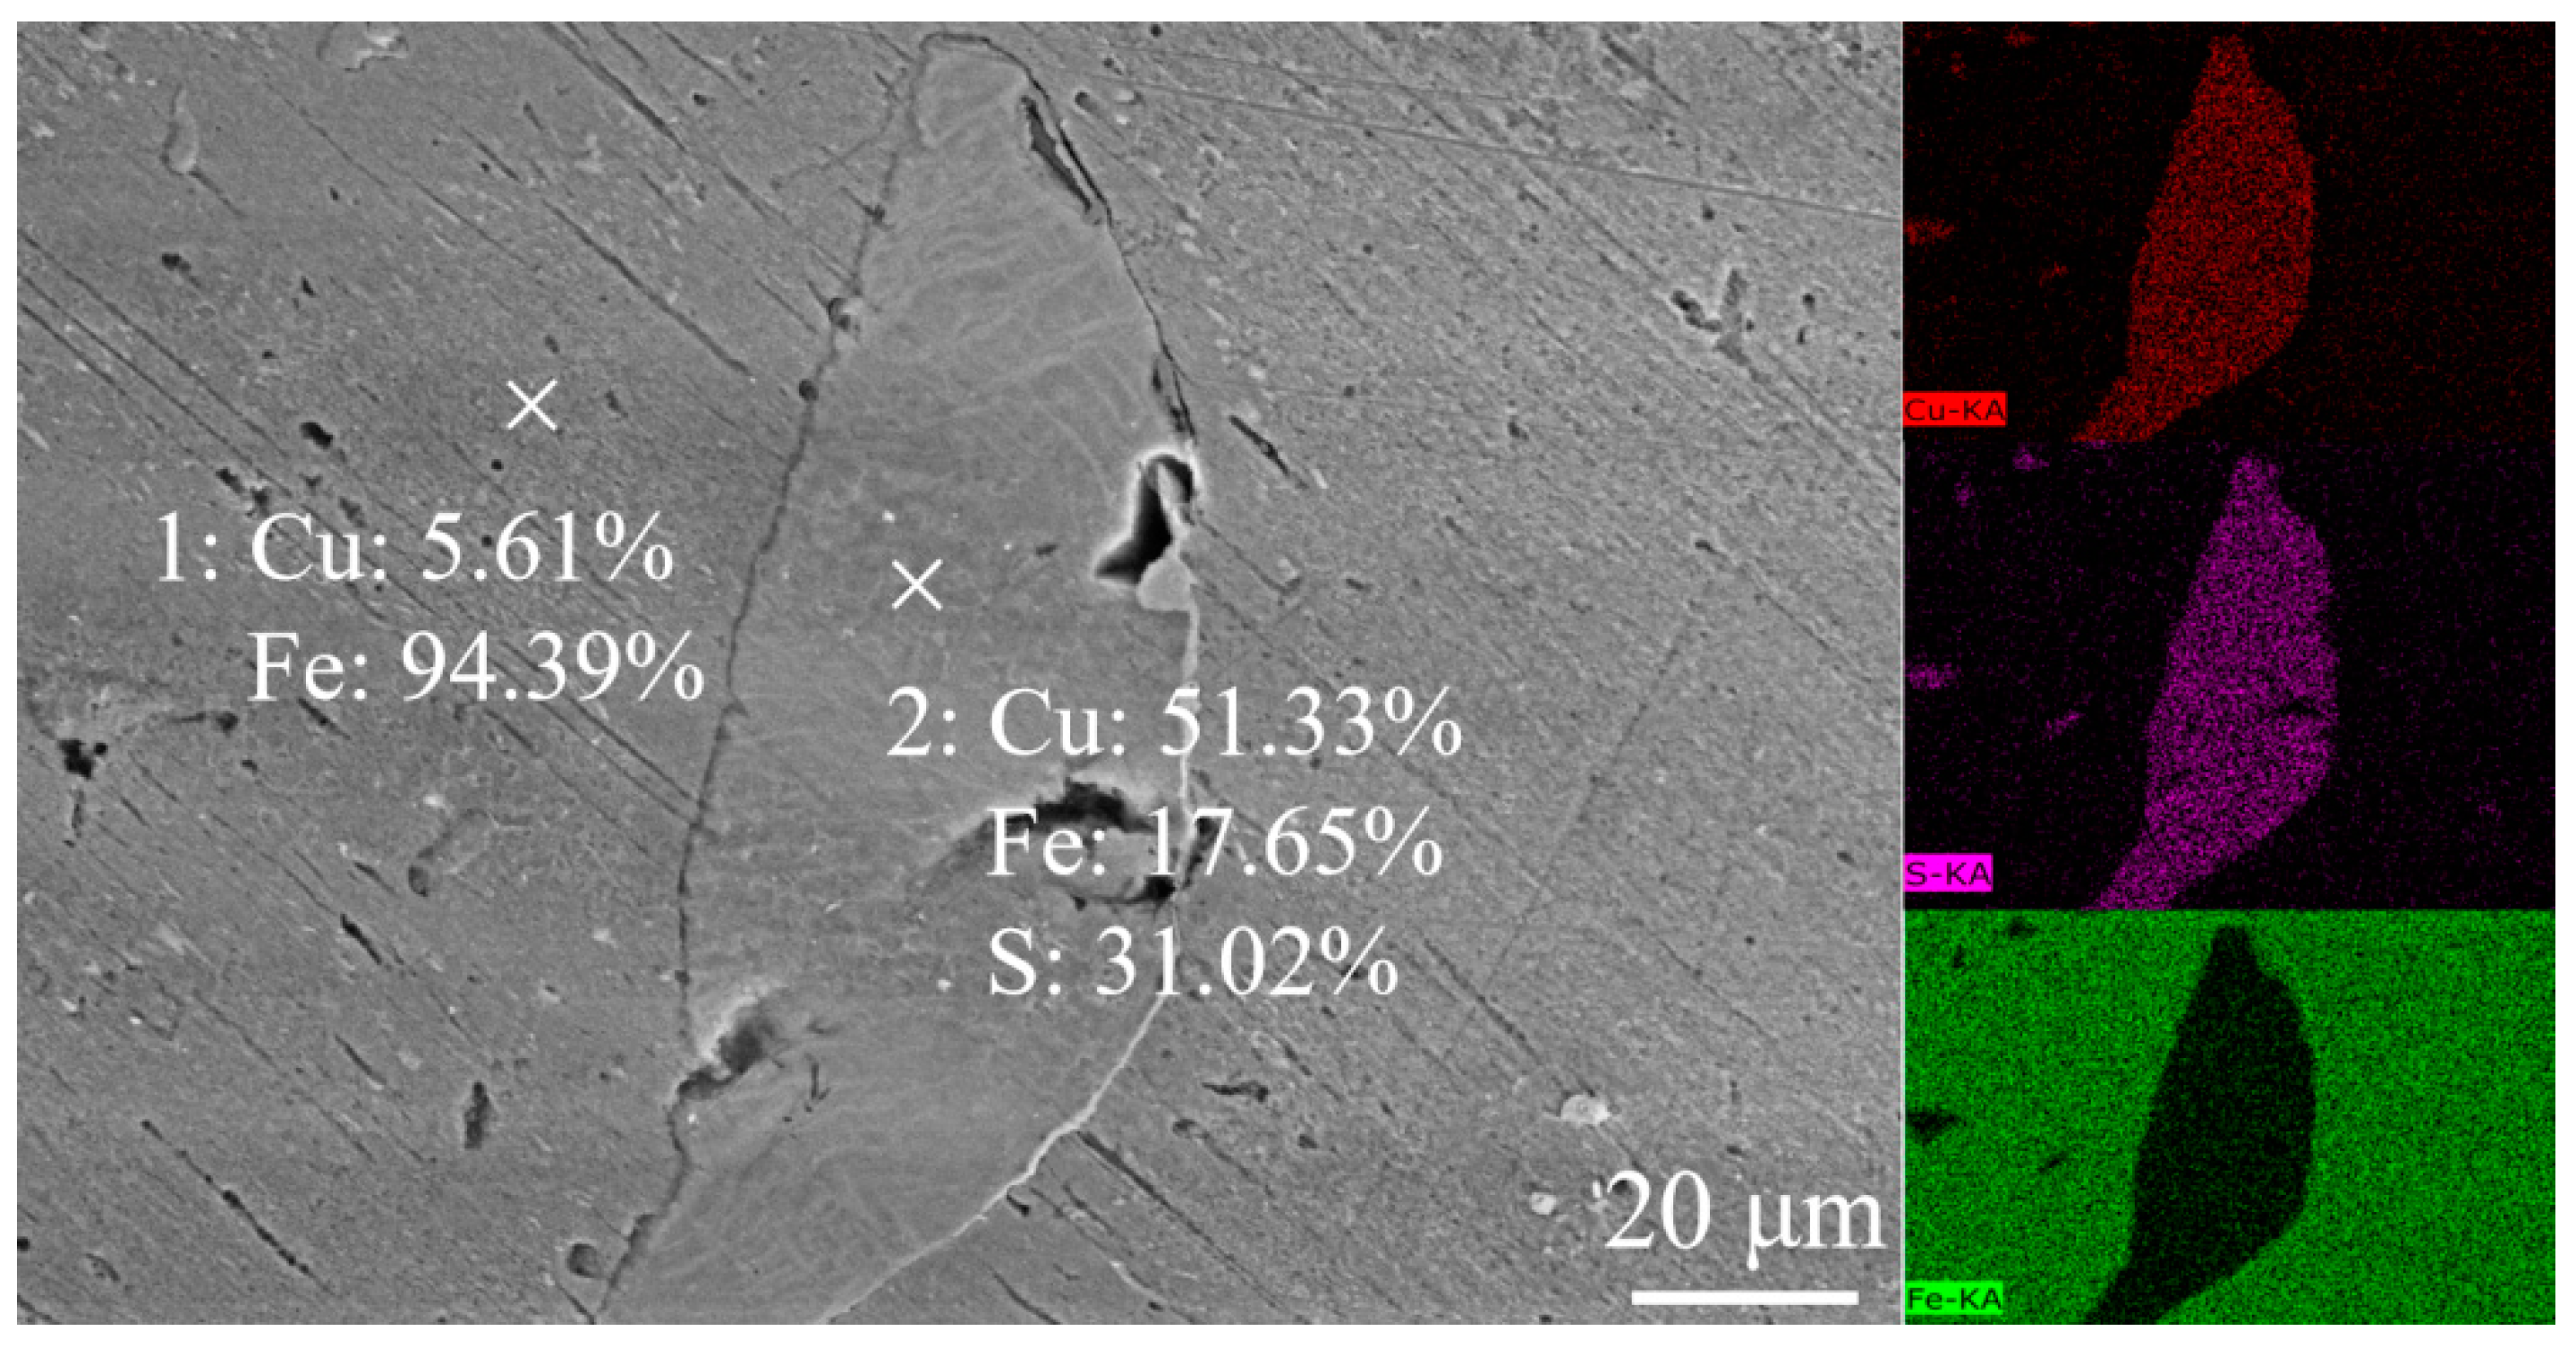
In total, 120 g slag after reduction was kept at 1773.15 K for 4 h. In total, 40 g metal and 82 g tailings were obtained. The SEM analysis result of the metal after melting is shown in Figure 6, and the composition of the metal is shown in Table 3. The main matrix of the metal is copper–iron alloy, and some copper matte is mixed. After melting and separation, the metal still contained some sulfur, indicating that H2 has a better effect on oxide reduction, and less effect on sulfide reduction. A desulfurization process is needed before steelmaking.
3. Analysis and Discussion
3.1. Reaction Kinetic Model
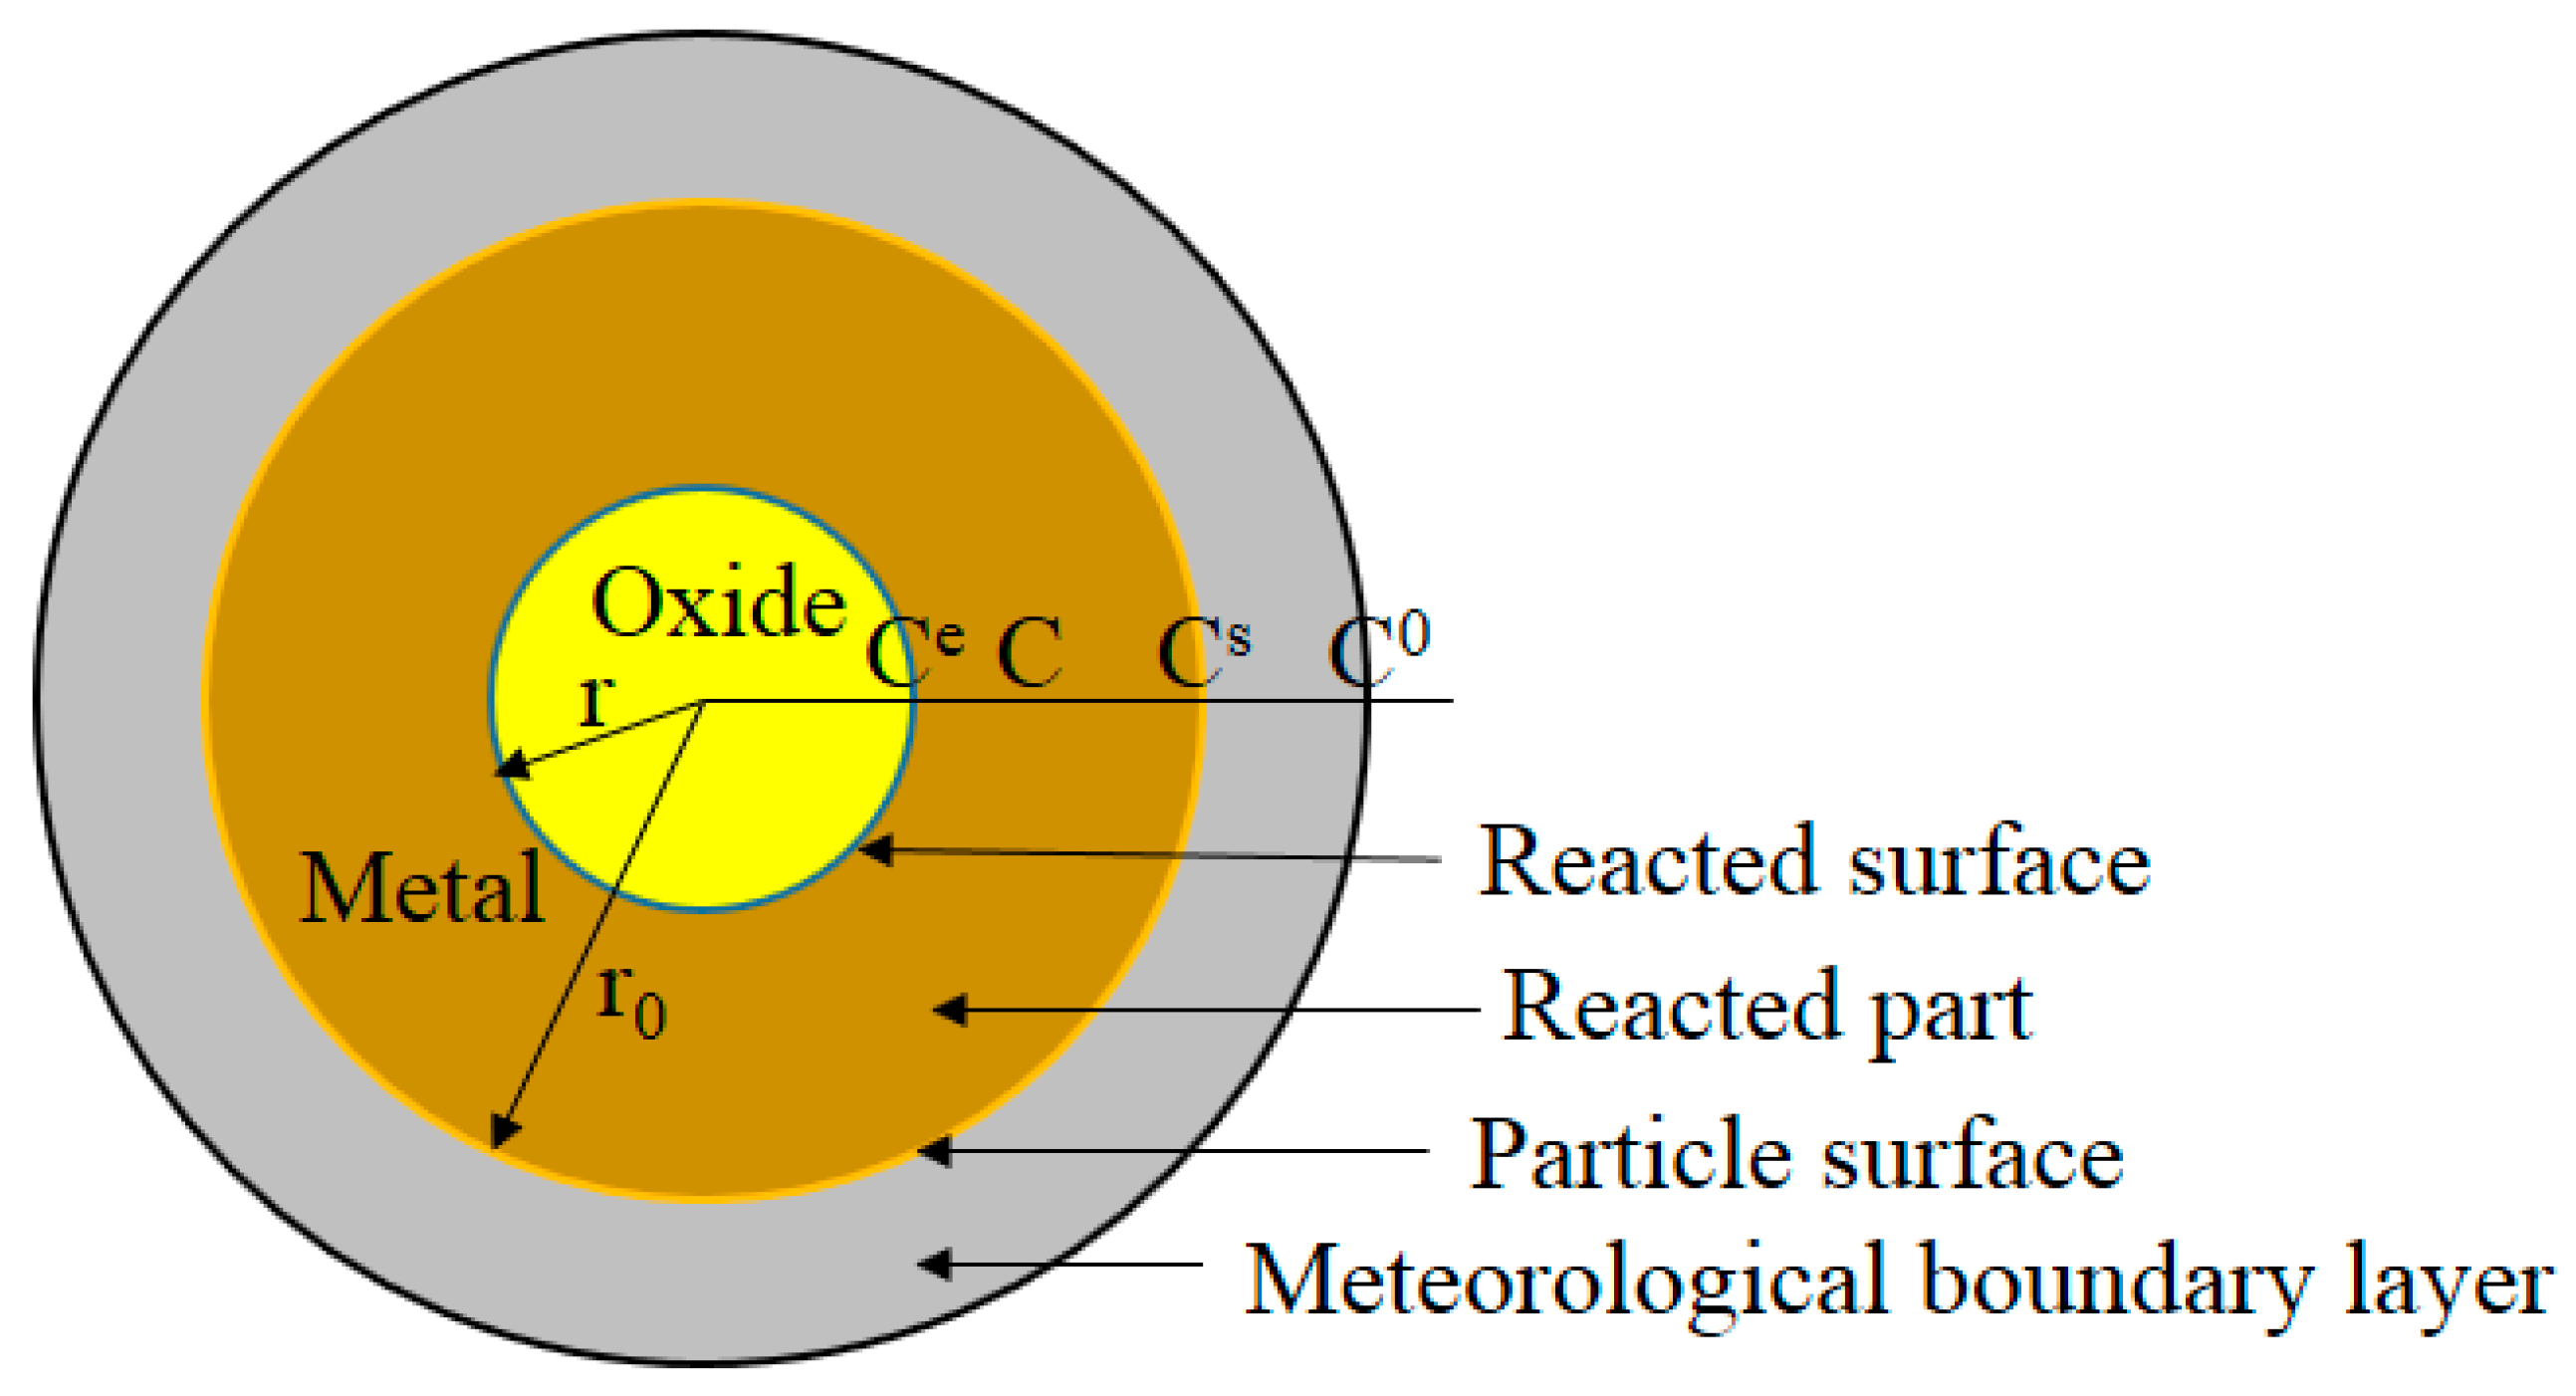
The reduction of copper slag pellets by H2 is a gas–solid interface reaction. The diameter of the copper slag used in the experiment was less than 0.037 mm. The pellets had porosity. During the hydrogen introduction, the reaction proceeds from the outside to the inside. A product layer is formed on the surface, and the inside is an unreacted layer. It can be applied to the unreacted nuclear model. In the model, the volume of the pellet does not change during the reduction process, the reduction is a reversible first-order reaction, the intermediate product layer is thin, and the process of chemical reaction has reaches a quasi-steady state [19]. As the reaction progresses, the product layer gradually thickens, and finally the reduction reaction stops. The reduction of copper slag is the reduction of oxides and sulfides, mainly the reduction of ferroferric oxide, iron olivine, and cuprous sulfide. The metal recovery ratio is determined according to the degree of weight loss.
In the unreacted nuclear model, the reaction process can be decomposed into five steps. The first step is external diffusion. The reducing gas moves through the gas phase boundary layer and then to the surface of the solid product. The second step is internal diffusion. That is, the reducing gas continues to diffuse to the chemical reaction interface, and the iron ions generated gradually diffuse through the solid product layer to the interior of the unreacted core. The third step is the interfacial chemical reaction, which is the chemical reaction of the reducing gas with the oxide on the interface, including the adsorption and desorption processes. The fourth step is a process in which the reducing gas product continues to diffuse through the product layer to the unreacted solid surface. The fifth step is a process in which the reduced product is diffused into the interior of the gas phase after leaving the solid surface. The model diagram is shown in Figure 7.
In the unreacted nuclear model, the total rate equation for the reduction of copper slag is Equation (2).
3.2. Effect of External Diffusion on H2 Reduction Process and Experiment Results
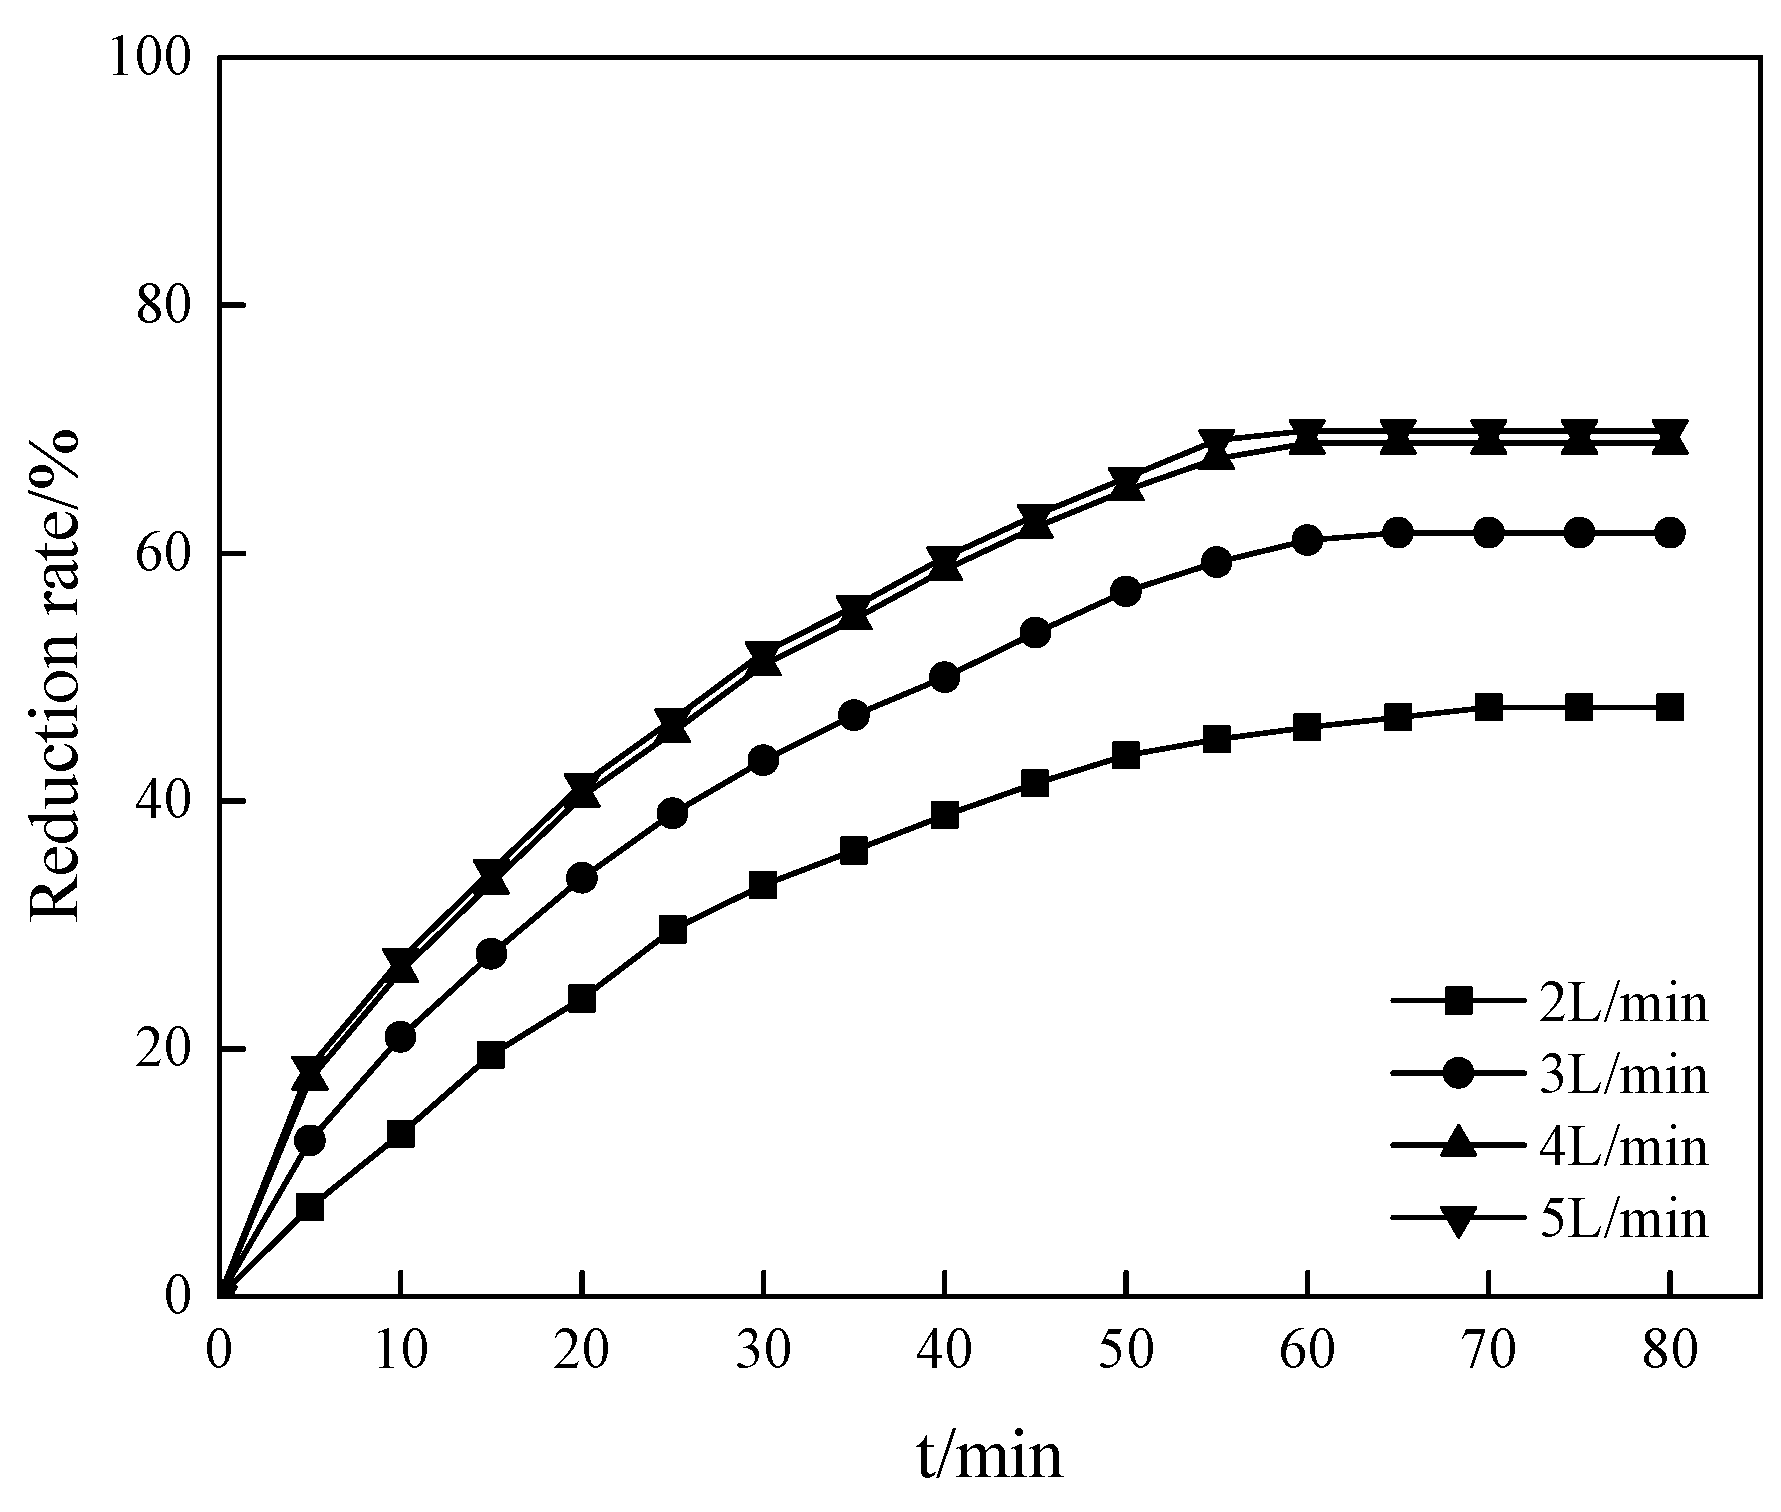
Before the reduction experiment of copper slag, the preliminary experiments are performed to eliminate the influence of the external diffusion on the experiment, and the flow rate of the critical reducing gas is determined. In the preliminary experiments, the gas component (10% H2, 90% Ar) is used, the reduction temperature is 1373.15 K, and the mixed gas flow rates are 2, 3, 4, and 5 L/min, respectively.
The experiments are carried out at a high temperature, and the reaction rate is relatively fast. When the flow rate of the reducing gas reaches the critical value, the external diffusion is not the control link in the reduction process. The influence of the temperature on the ratio of the reduction reaction is stronger than that of the external diffusion. The critical rate at a higher temperature can rule out the effects of external diffusion, and this critical rate is also applicable at relatively lower temperatures. Then, under the condition that the partial pressure of H2 is more than 10%, the influence of the external diffusion on the reduction process can certainly be excluded. Therefore, the experiments were carried out using a mixed gas with a low partial pressure of H2 (10% H2, 90% Ar) and a relatively high temperature of 1100 °C.
The experimental results are shown in Figure 8. It can be seen that as the flow rate of the gas increases continuously, the reduction ratio also increases. When the gas flow rate increases to 4 L/min, the reduction ratio remains unchanged even if the gas flow rate is increased again, indicating that 4 L/min is the critical value of the gas flow rate. Therefore, the reduction process is controlled with three situations, which are internal diffusion, interface chemical reaction control, and mixed control.
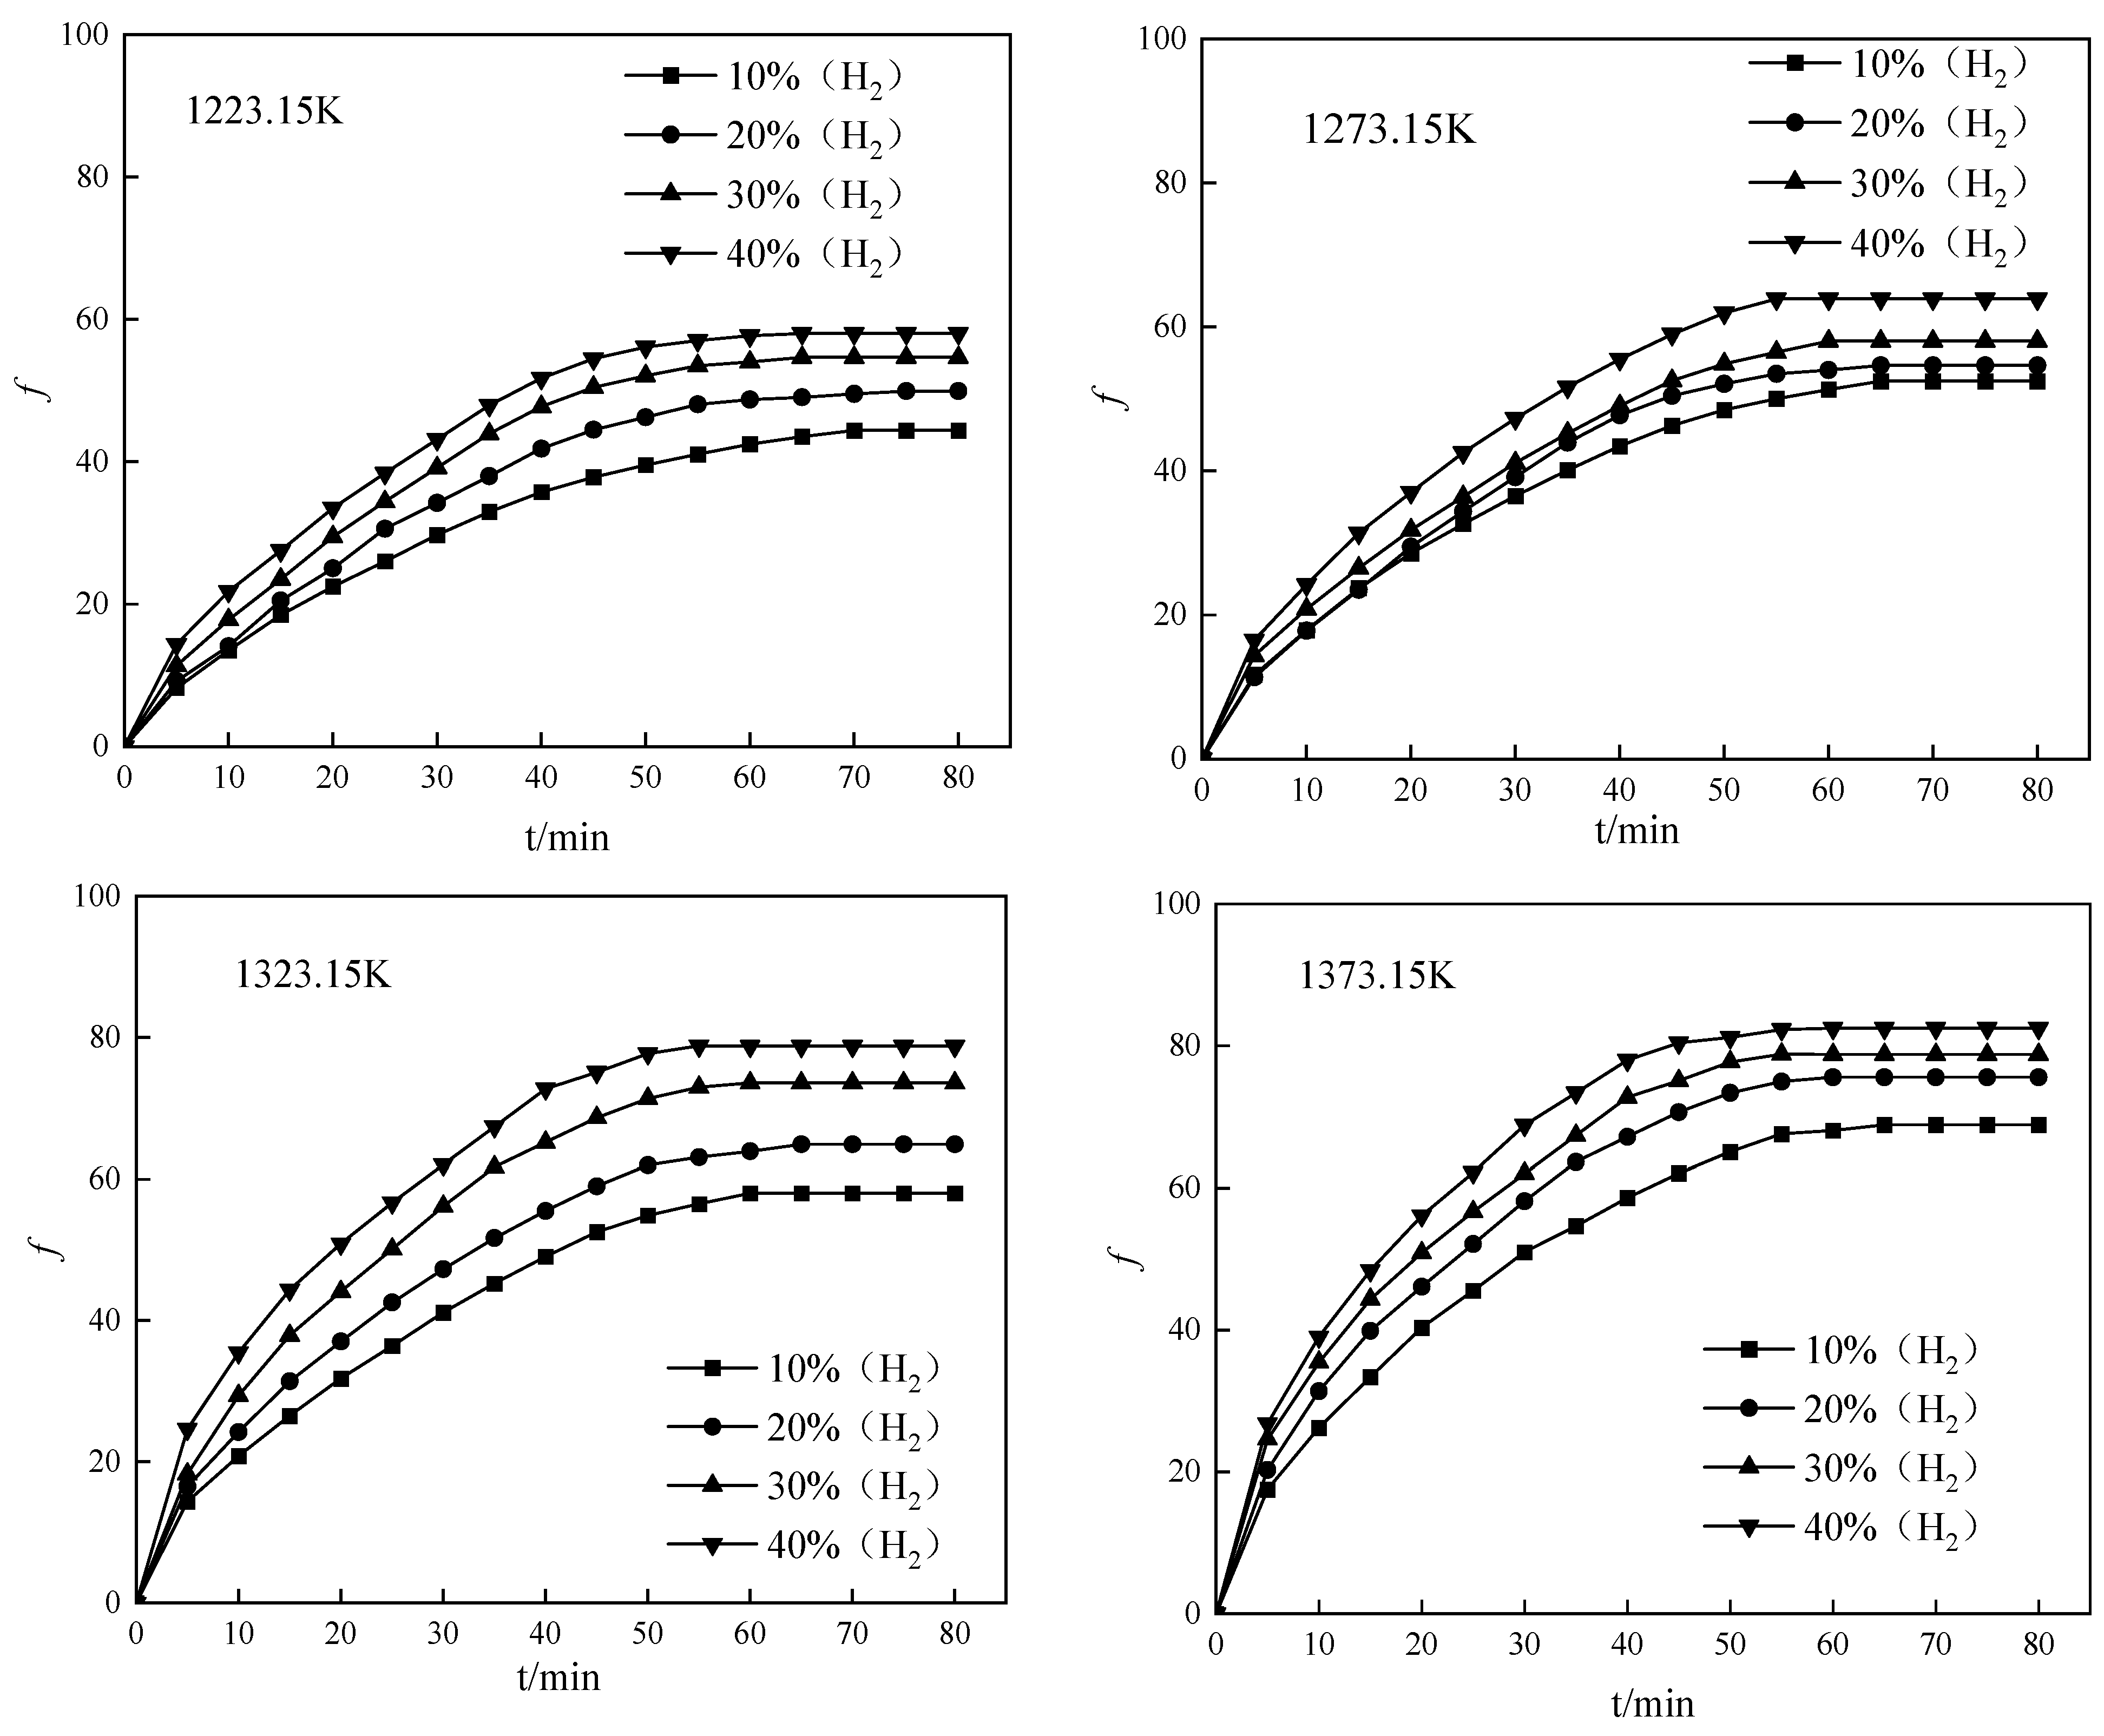
In the conditions that the gas flow rate was 4 L/min, the mass ratio of calcium oxide addition to slag was 25%, and the reaction time was 80 min, the experimental results at different temperatures and partial pressures are shown in Figure 9.
According to the results in Figure 9, the reaction law of copper slag reduction under different conditions is similar. At the beginning, the reduction speed is faster. As the reaction proceeds, the product layer becomes thicker, resulting in reduced gas diffusion and a reduced reaction ratio. The increase of the gas pressure can promote the diffusion of hydrogen, which can diffuse in the case of a thicker product layer, and can finally obtain a higher degree of reduction. Temperature promotes the diffusion of the gas, and also promotes the diffusion of the product layer. To a certain extent, the higher the temperature, the more hydrogen can diffuse and enter, which promotes the improvement of the reduction effect.
3.3. Effect of Internal Diffusion and the Chemical Reaction Interface on the Reduction Process
When the porosity of the solid product layer is relatively large, and the gas flow rate is rapid, the diffusion resistance in the gas phase boundary layer and the solid product layer is small, such that it can be ignored. Therefore, the H2 reduction process of the copper slag is controlled by the interface chemical reaction, and the rate equations are Equations (3) and (4).
When the resistance of the gas diffuse in the solid product layer is large, the resistance of the interfacial chemical reaction and the out-diffusion are negligible during this process. Therefore, it can be judged that the reduction process is controlled by internal diffusion, and the rate equations are Equations (5) and (6).
When the resistance of the interface chemical reaction and the internal diffusion are not negligible, the reduction process of the copper slag is controlled by the interfacial chemical reaction and the internal diffusion, and the rate equations are as follows:
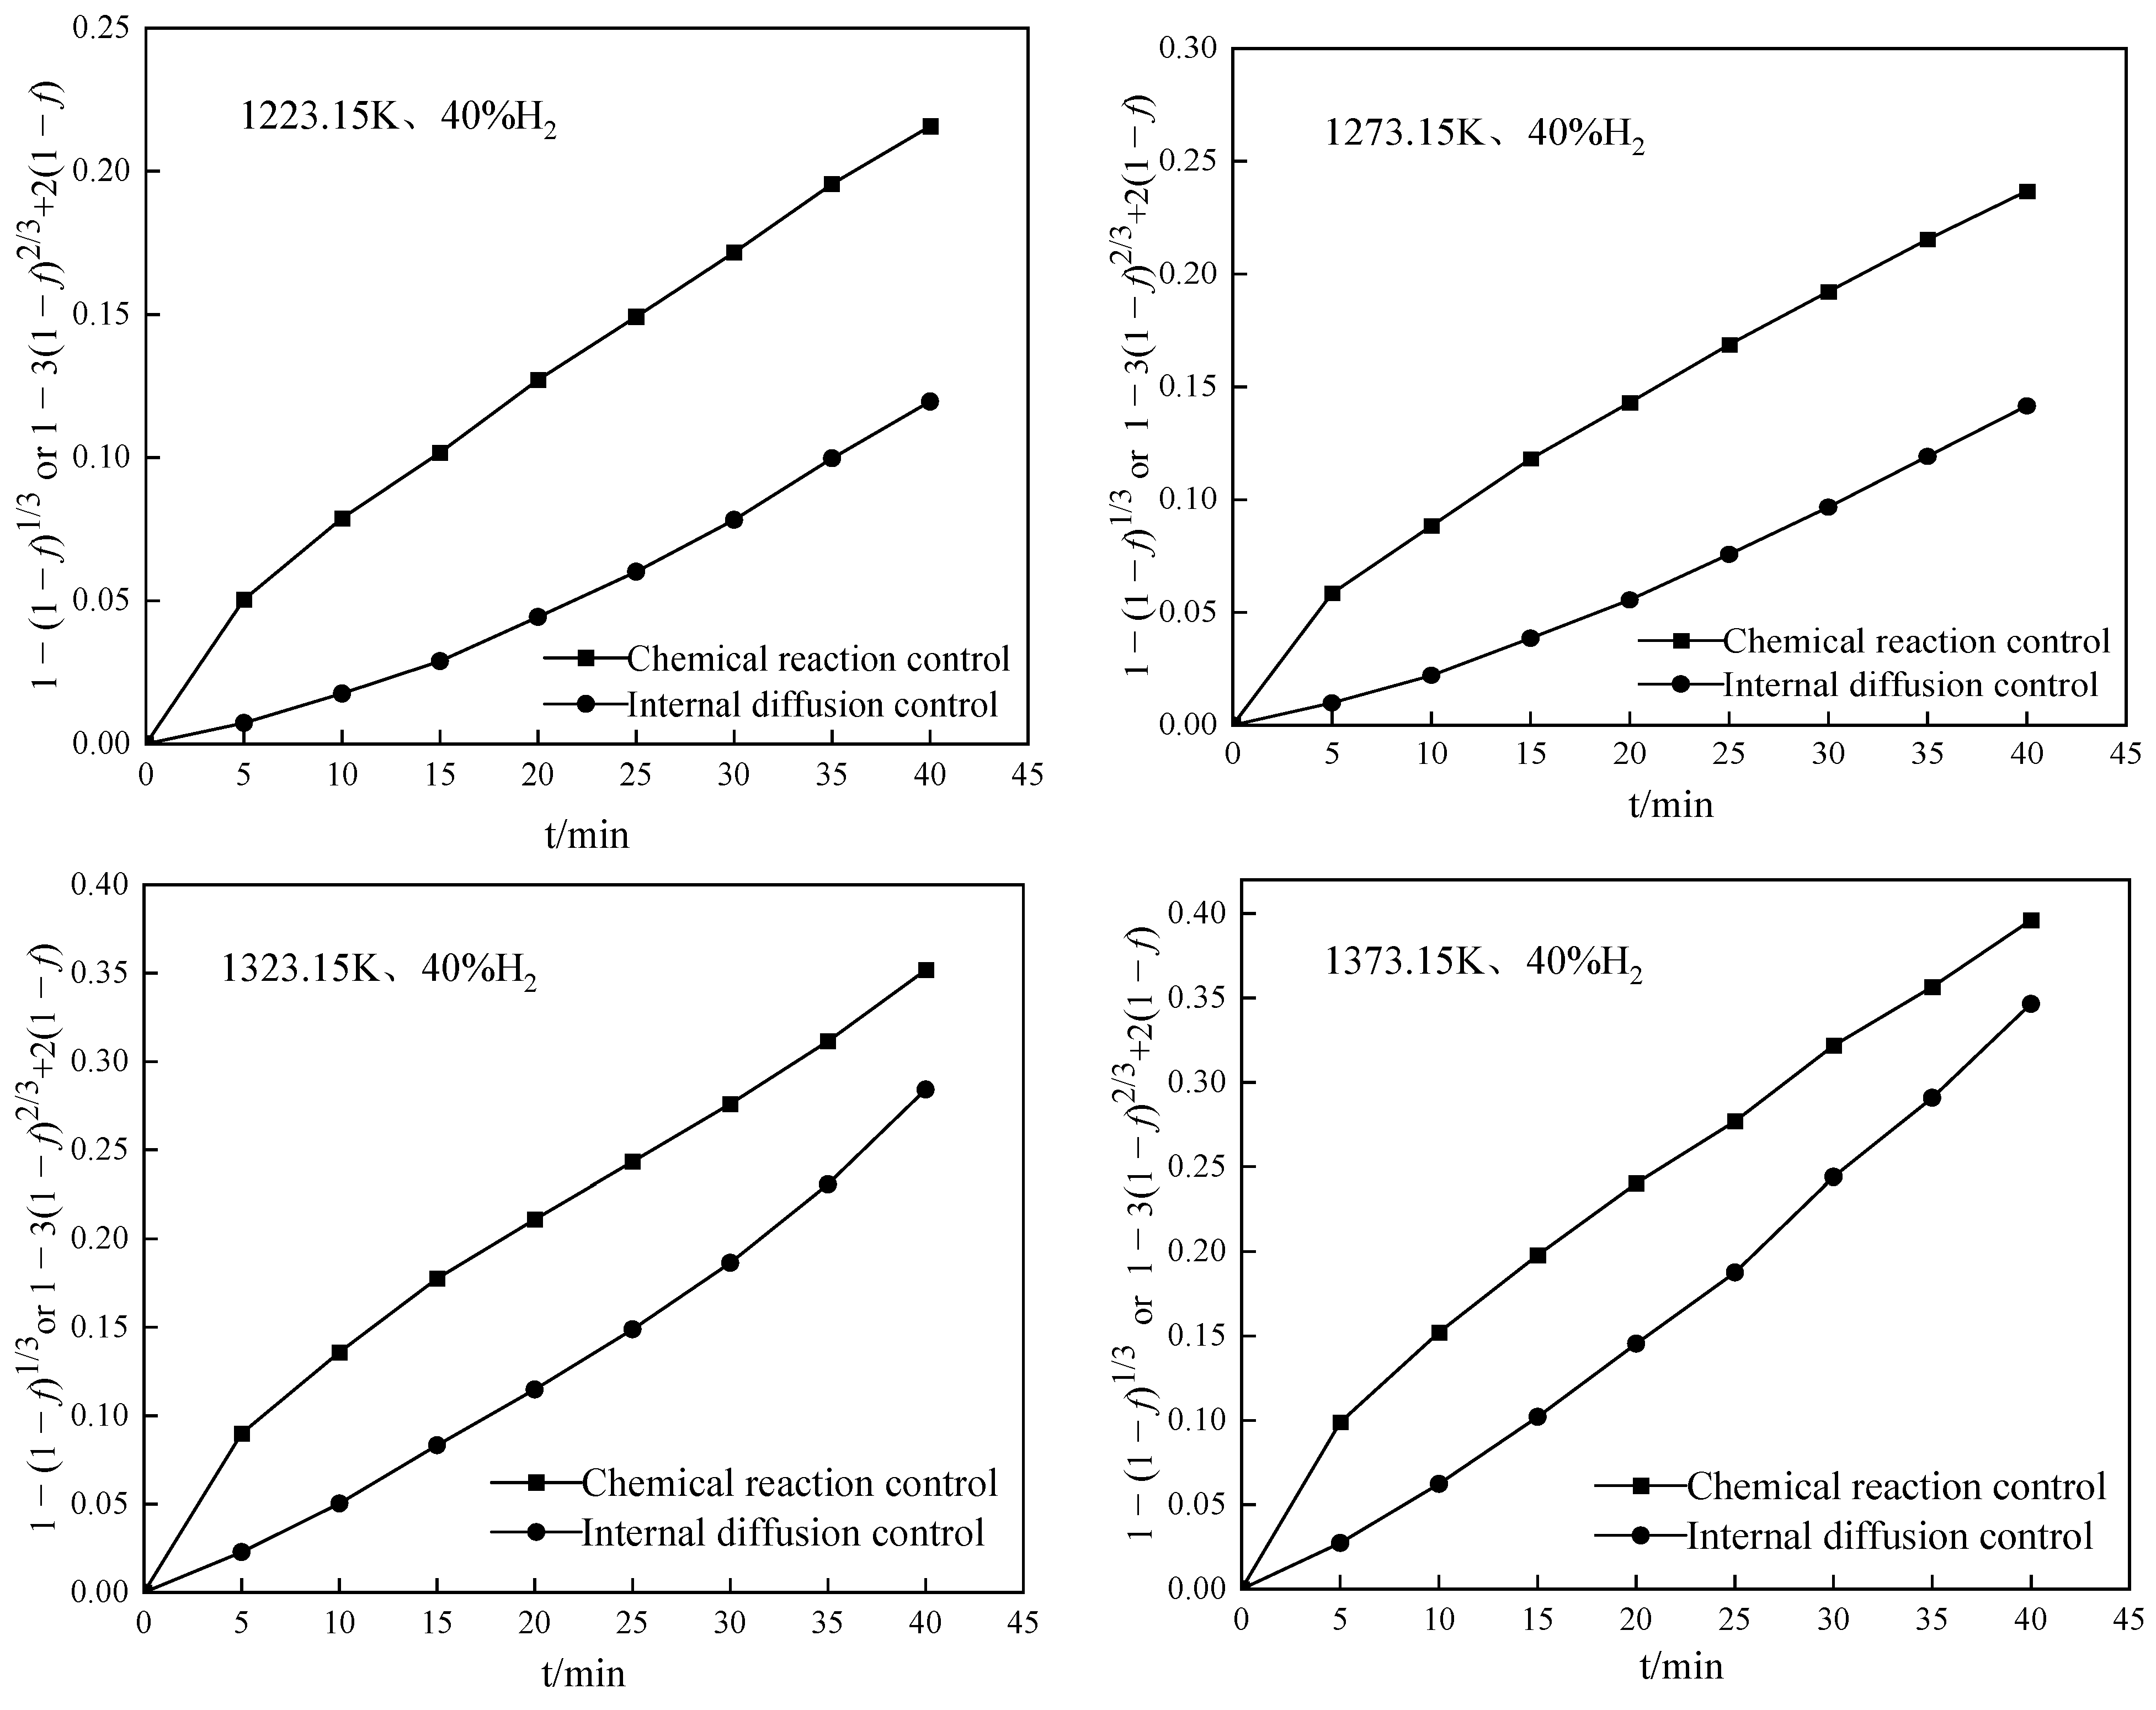
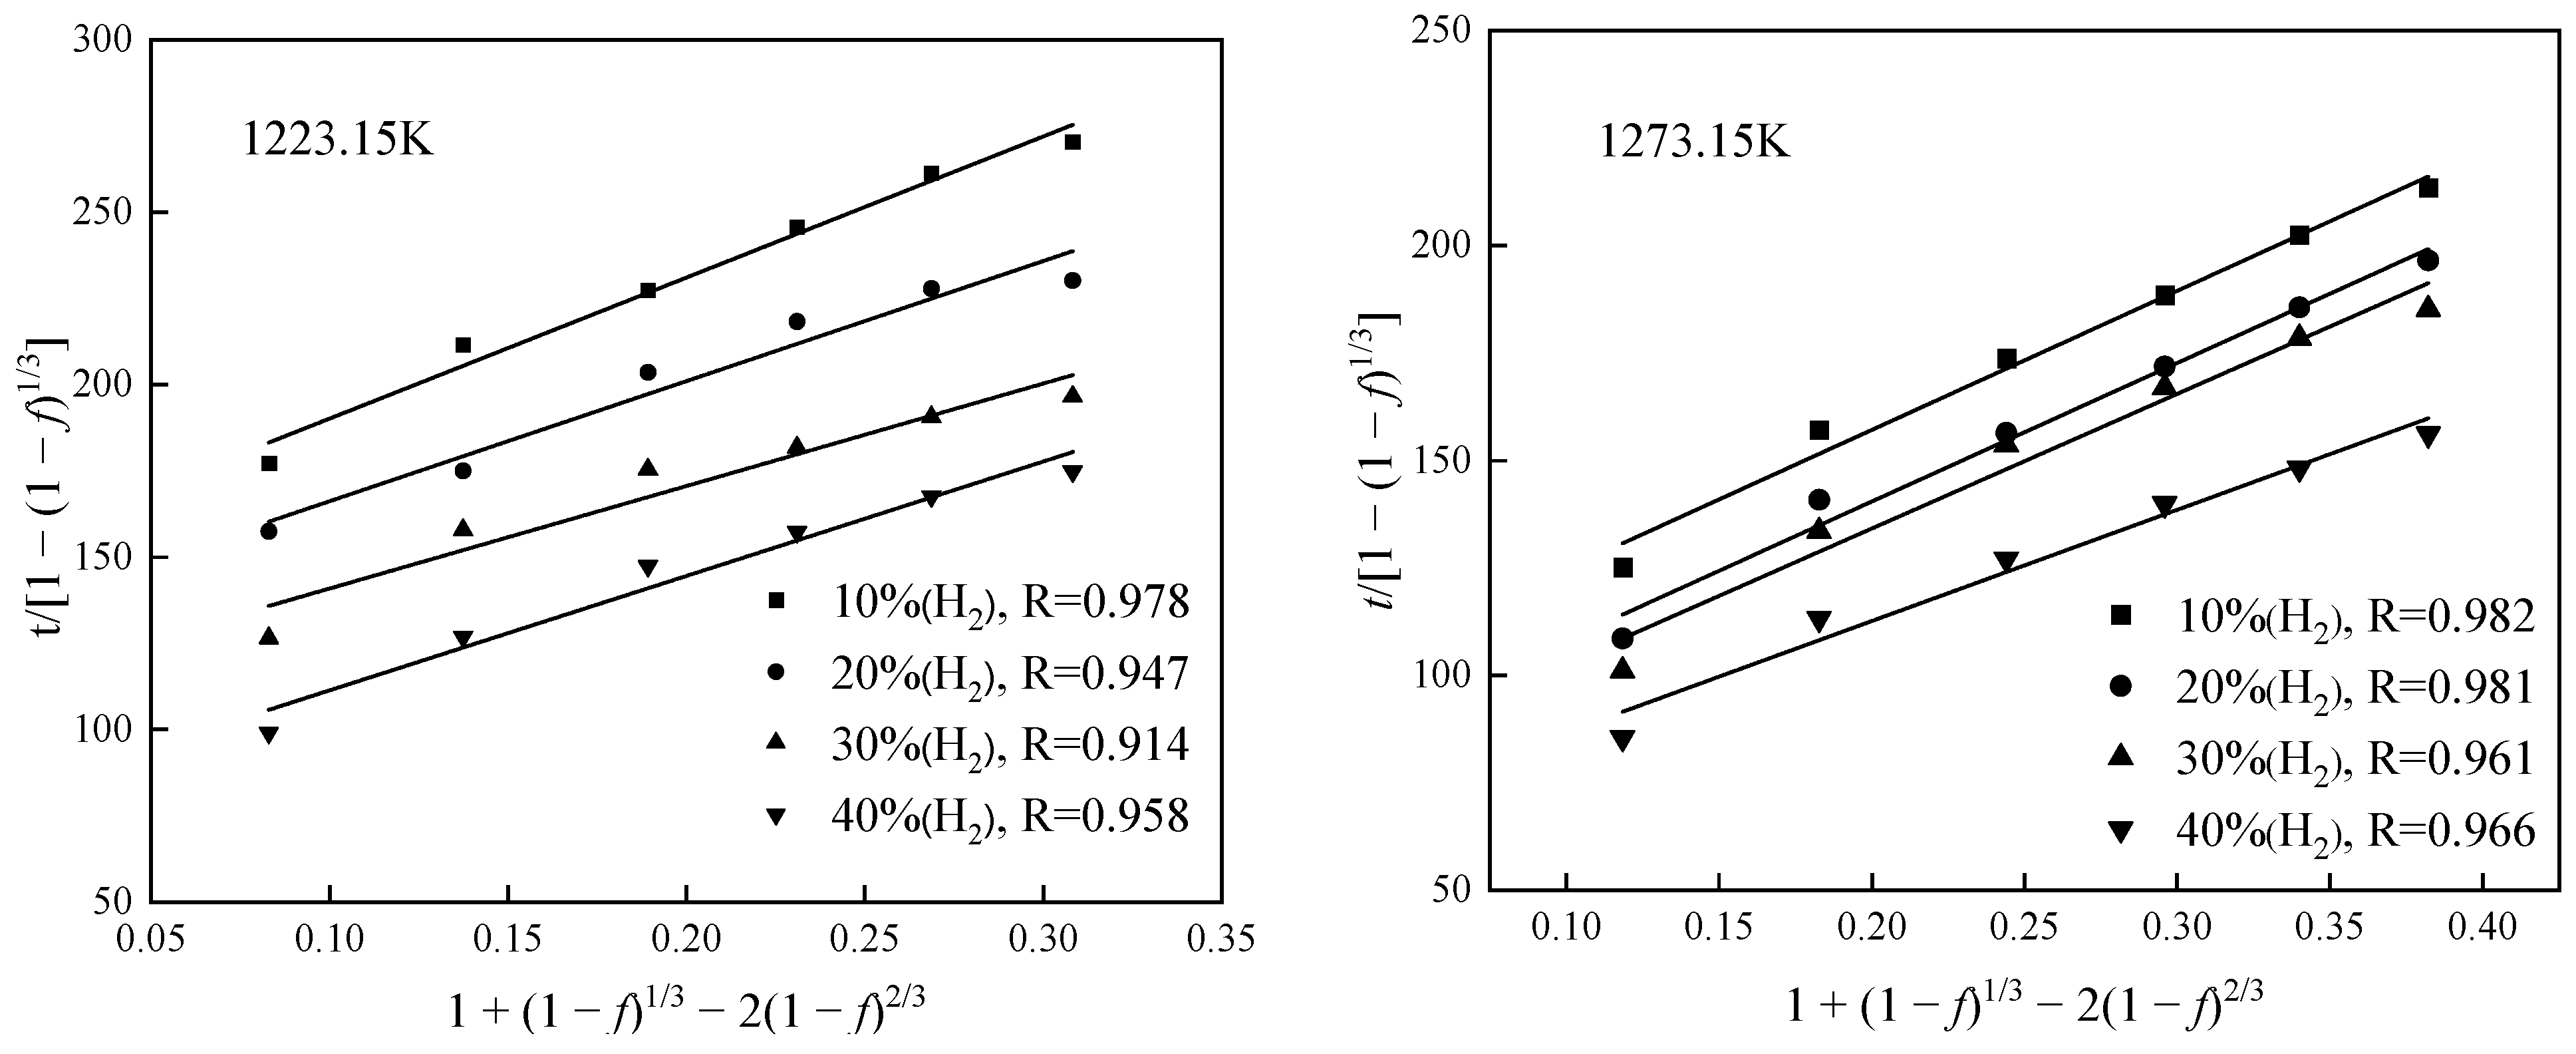
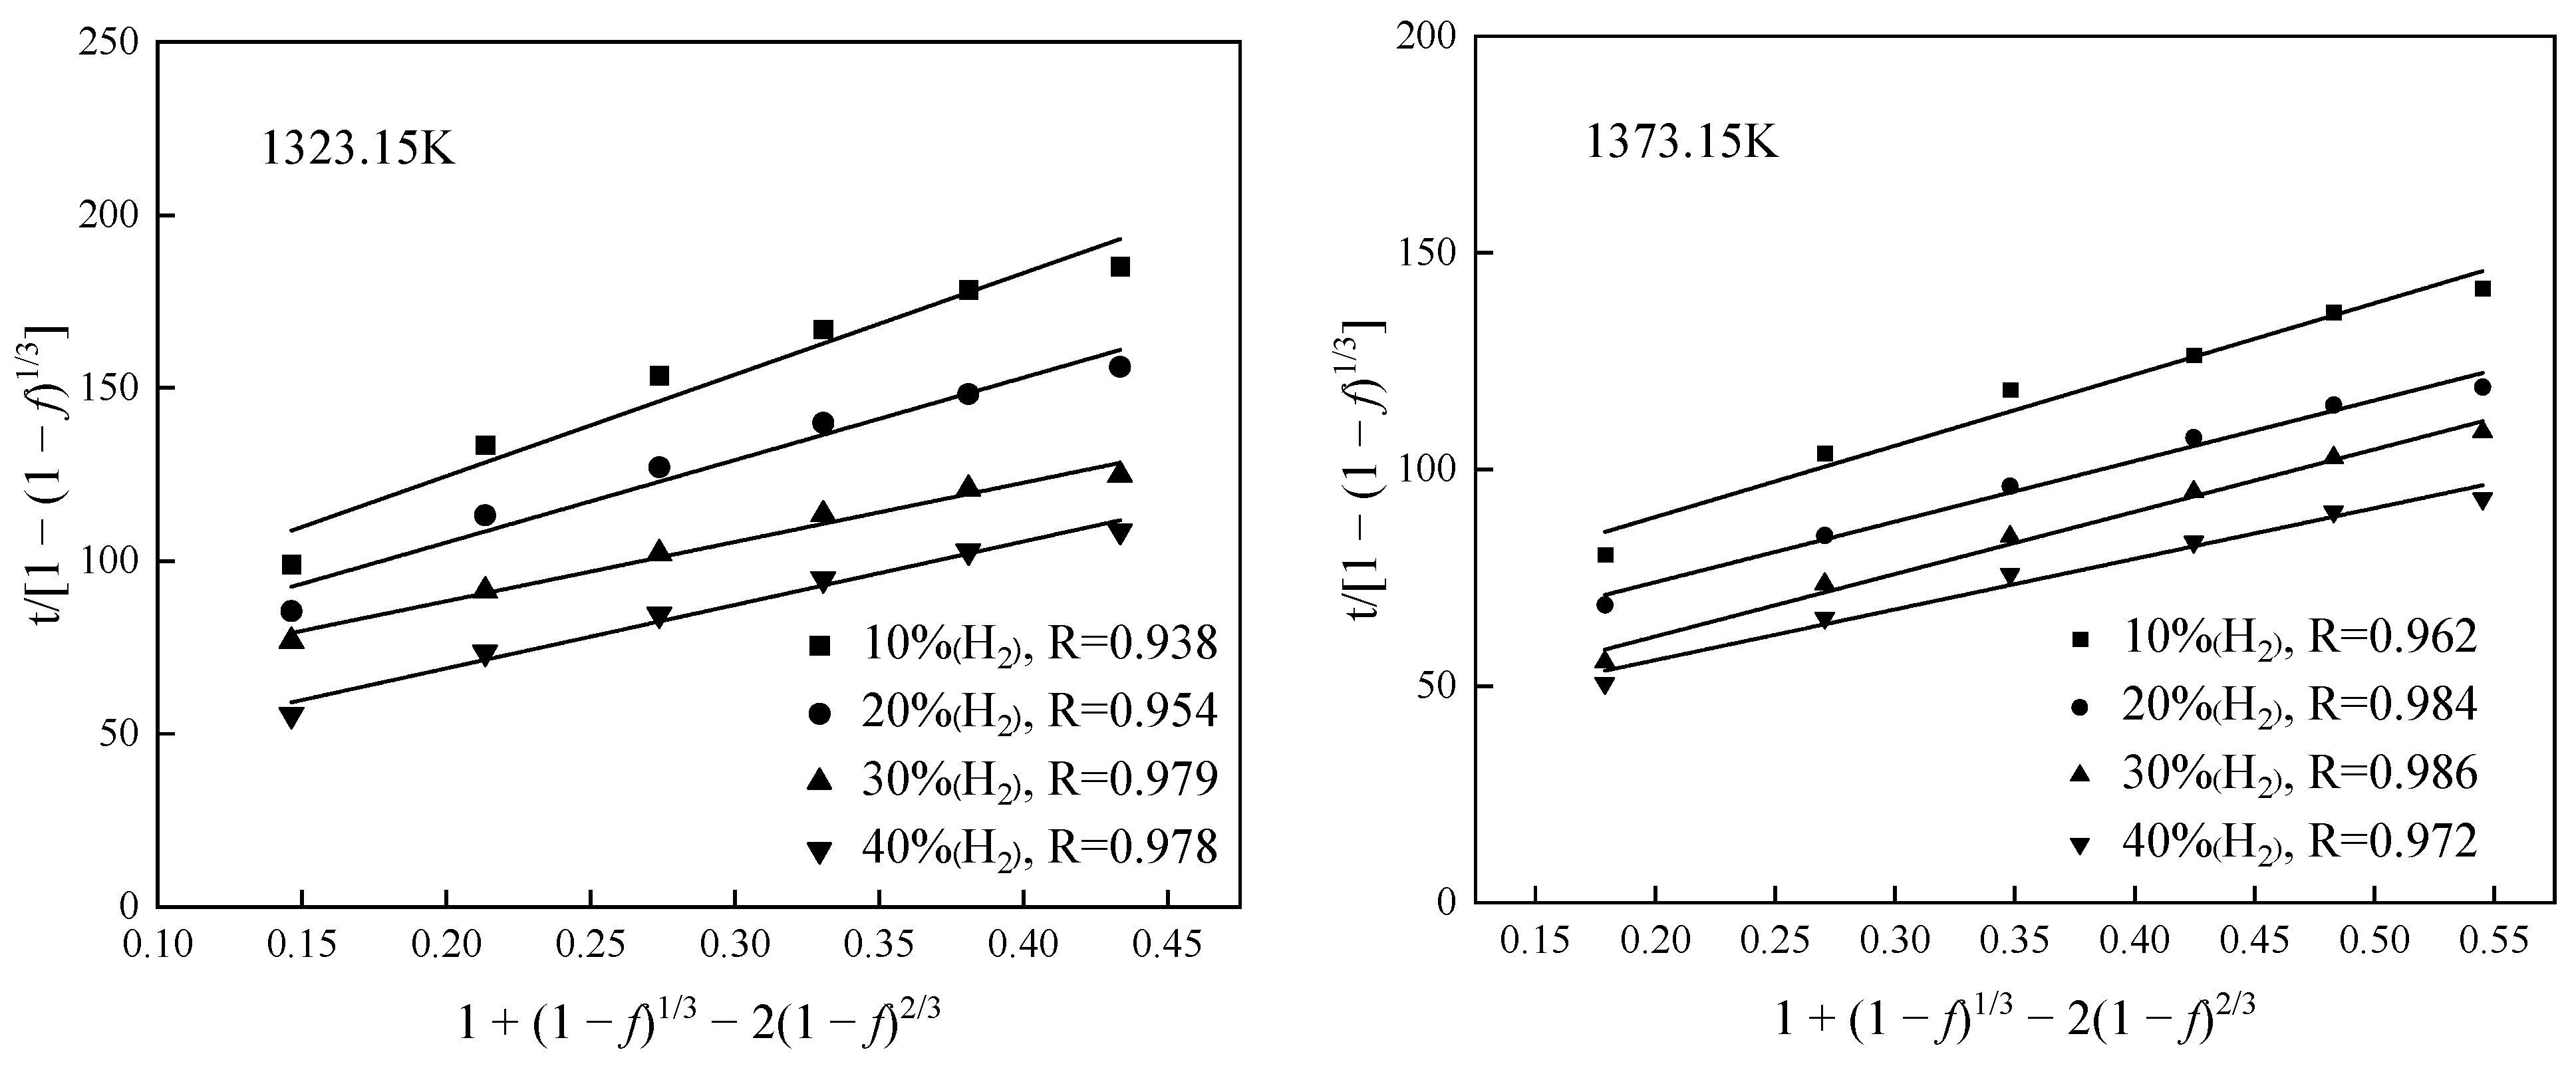
The relationship of [1 − (1 − f)1/3] and [1 − 3(1 − f)2/3 + 2(1 − f)] with t in different conditions is shown in Figure 10. It can be seen that the reaction time with the chemical reaction and the internal diffusion are nonlinear, such that the reduction reaction is controlled in multiple steps. The relationship of [1 − (1 − f)1/3] with [1 – 3(1 − f)2/3 + 2(1 − f)] is shown in Figure 11. There is a good linear relationship under different temperature conditions, indicating that the reduction of copper slag is controlled by a chemical reaction and internal diffusion.
3.4. The Calculation of the Apparent Chemical Reaction Rate Constant, Diffusion Coefficient and Apparent Activation Energy
The reaction rate constant can be obtained by taking the intercept of each straight line in Figure 11. The diffusion coefficient can be obtained by taking the slope of each straight line, and the results are shown in Table 4.
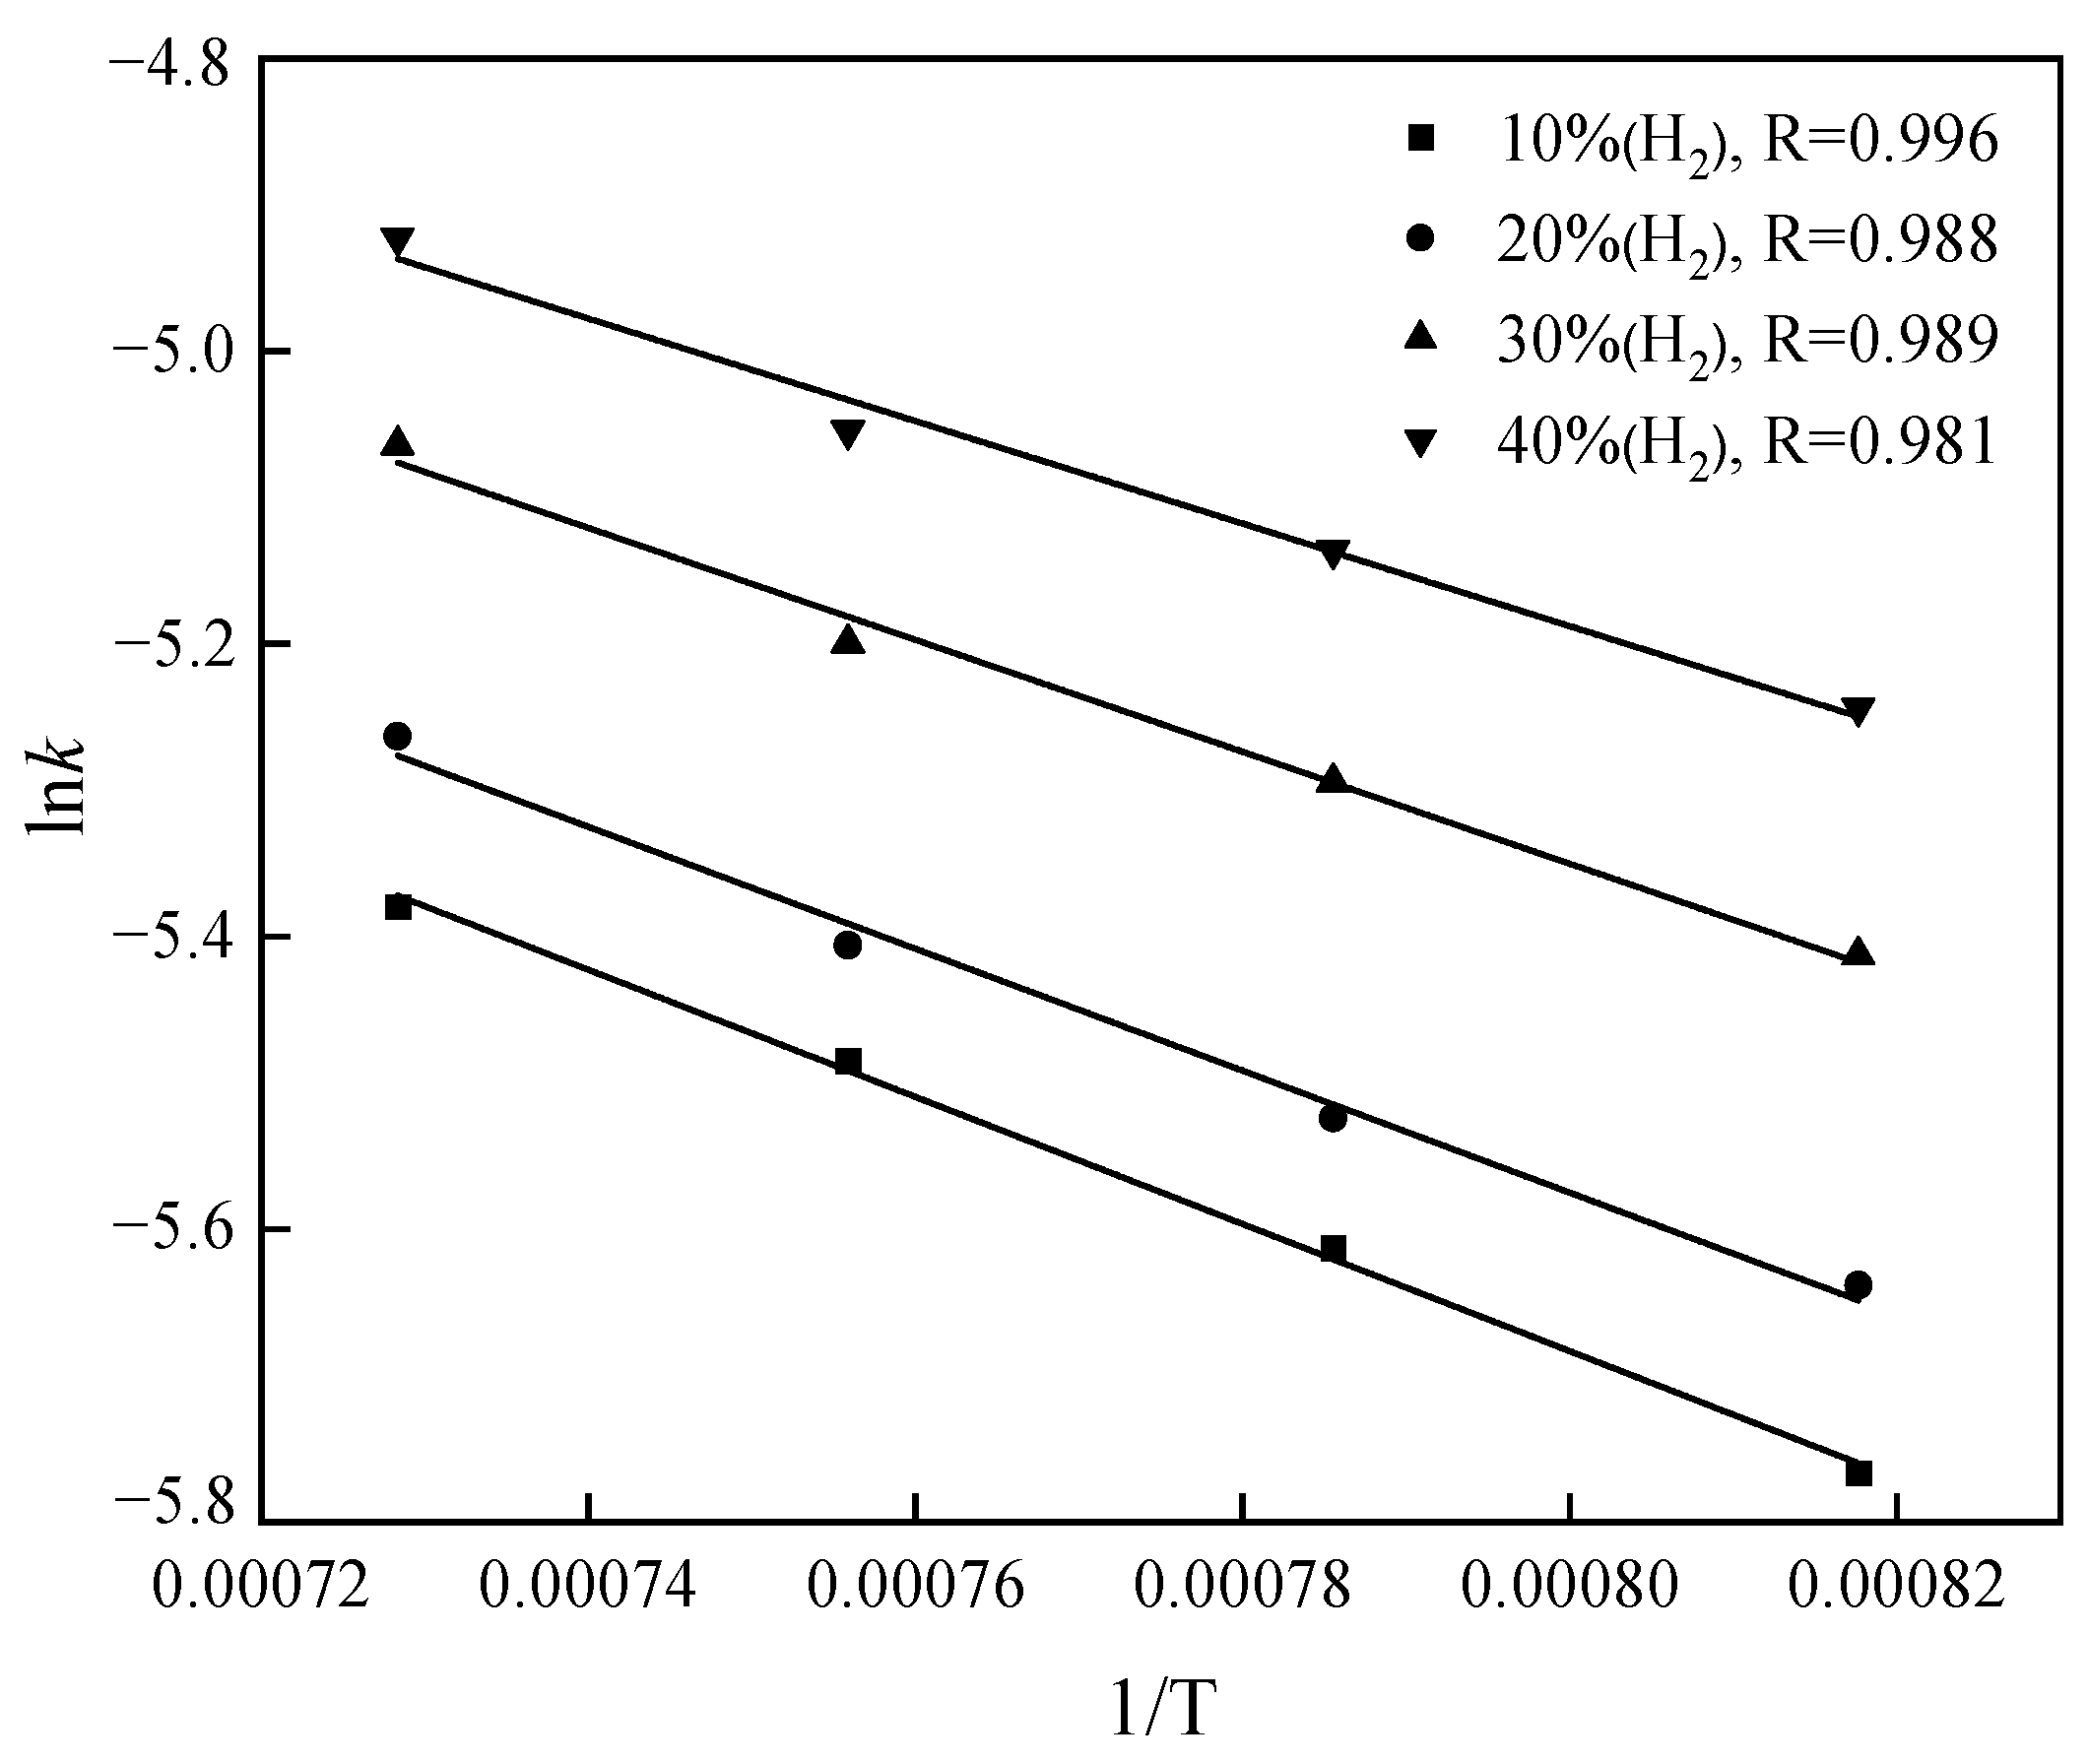
The apparent chemical reaction rate constant k is a function of temperature, and its calculation follows the Arrhenius Formula (12):
where k is the apparent rate constant, R is the gas constant, T is the thermodynamic temperature, K is the apparent activation energy, kJ/mol, and A is the frequency factor.
The values of and can be obtained from the slope and intercept of the line, respectively. The results are shown in Table 5.
The reduction of copper slag can be divided into two stages [15,17]. In the early stage, the reduction of Fe3O4 to FeO was the main reaction. At this time, the reaction was rapid and the weight loss rate was fast. With the progress of the reaction, the reduction of FeO occured, including FeO reduced from Fe3O4 and generated by the reaction of Fe2SiO4 and CaO. The reduction of FeO required a higher hydrogen partial pressure and temperature, and the reduction was slower than that of Fe3O4. As the reaction progressed, internal diffusion gradually became the limiting link. There was also a partial reduction of H2S at the end of the reduction. It is believed that the reduction rate of H2 was higher than that of CO [13]. With the increase of the H2 partial pressure, the activation energy decreased rapidly. The activation energy obtained in this experiment was lower than the reduction of other reducing gases, and it gradually decreased with the increase of H2 partial pressure [13].
3.5. Resistance Comparison of Internal Diffusion and Interfacial Chemical Reaction
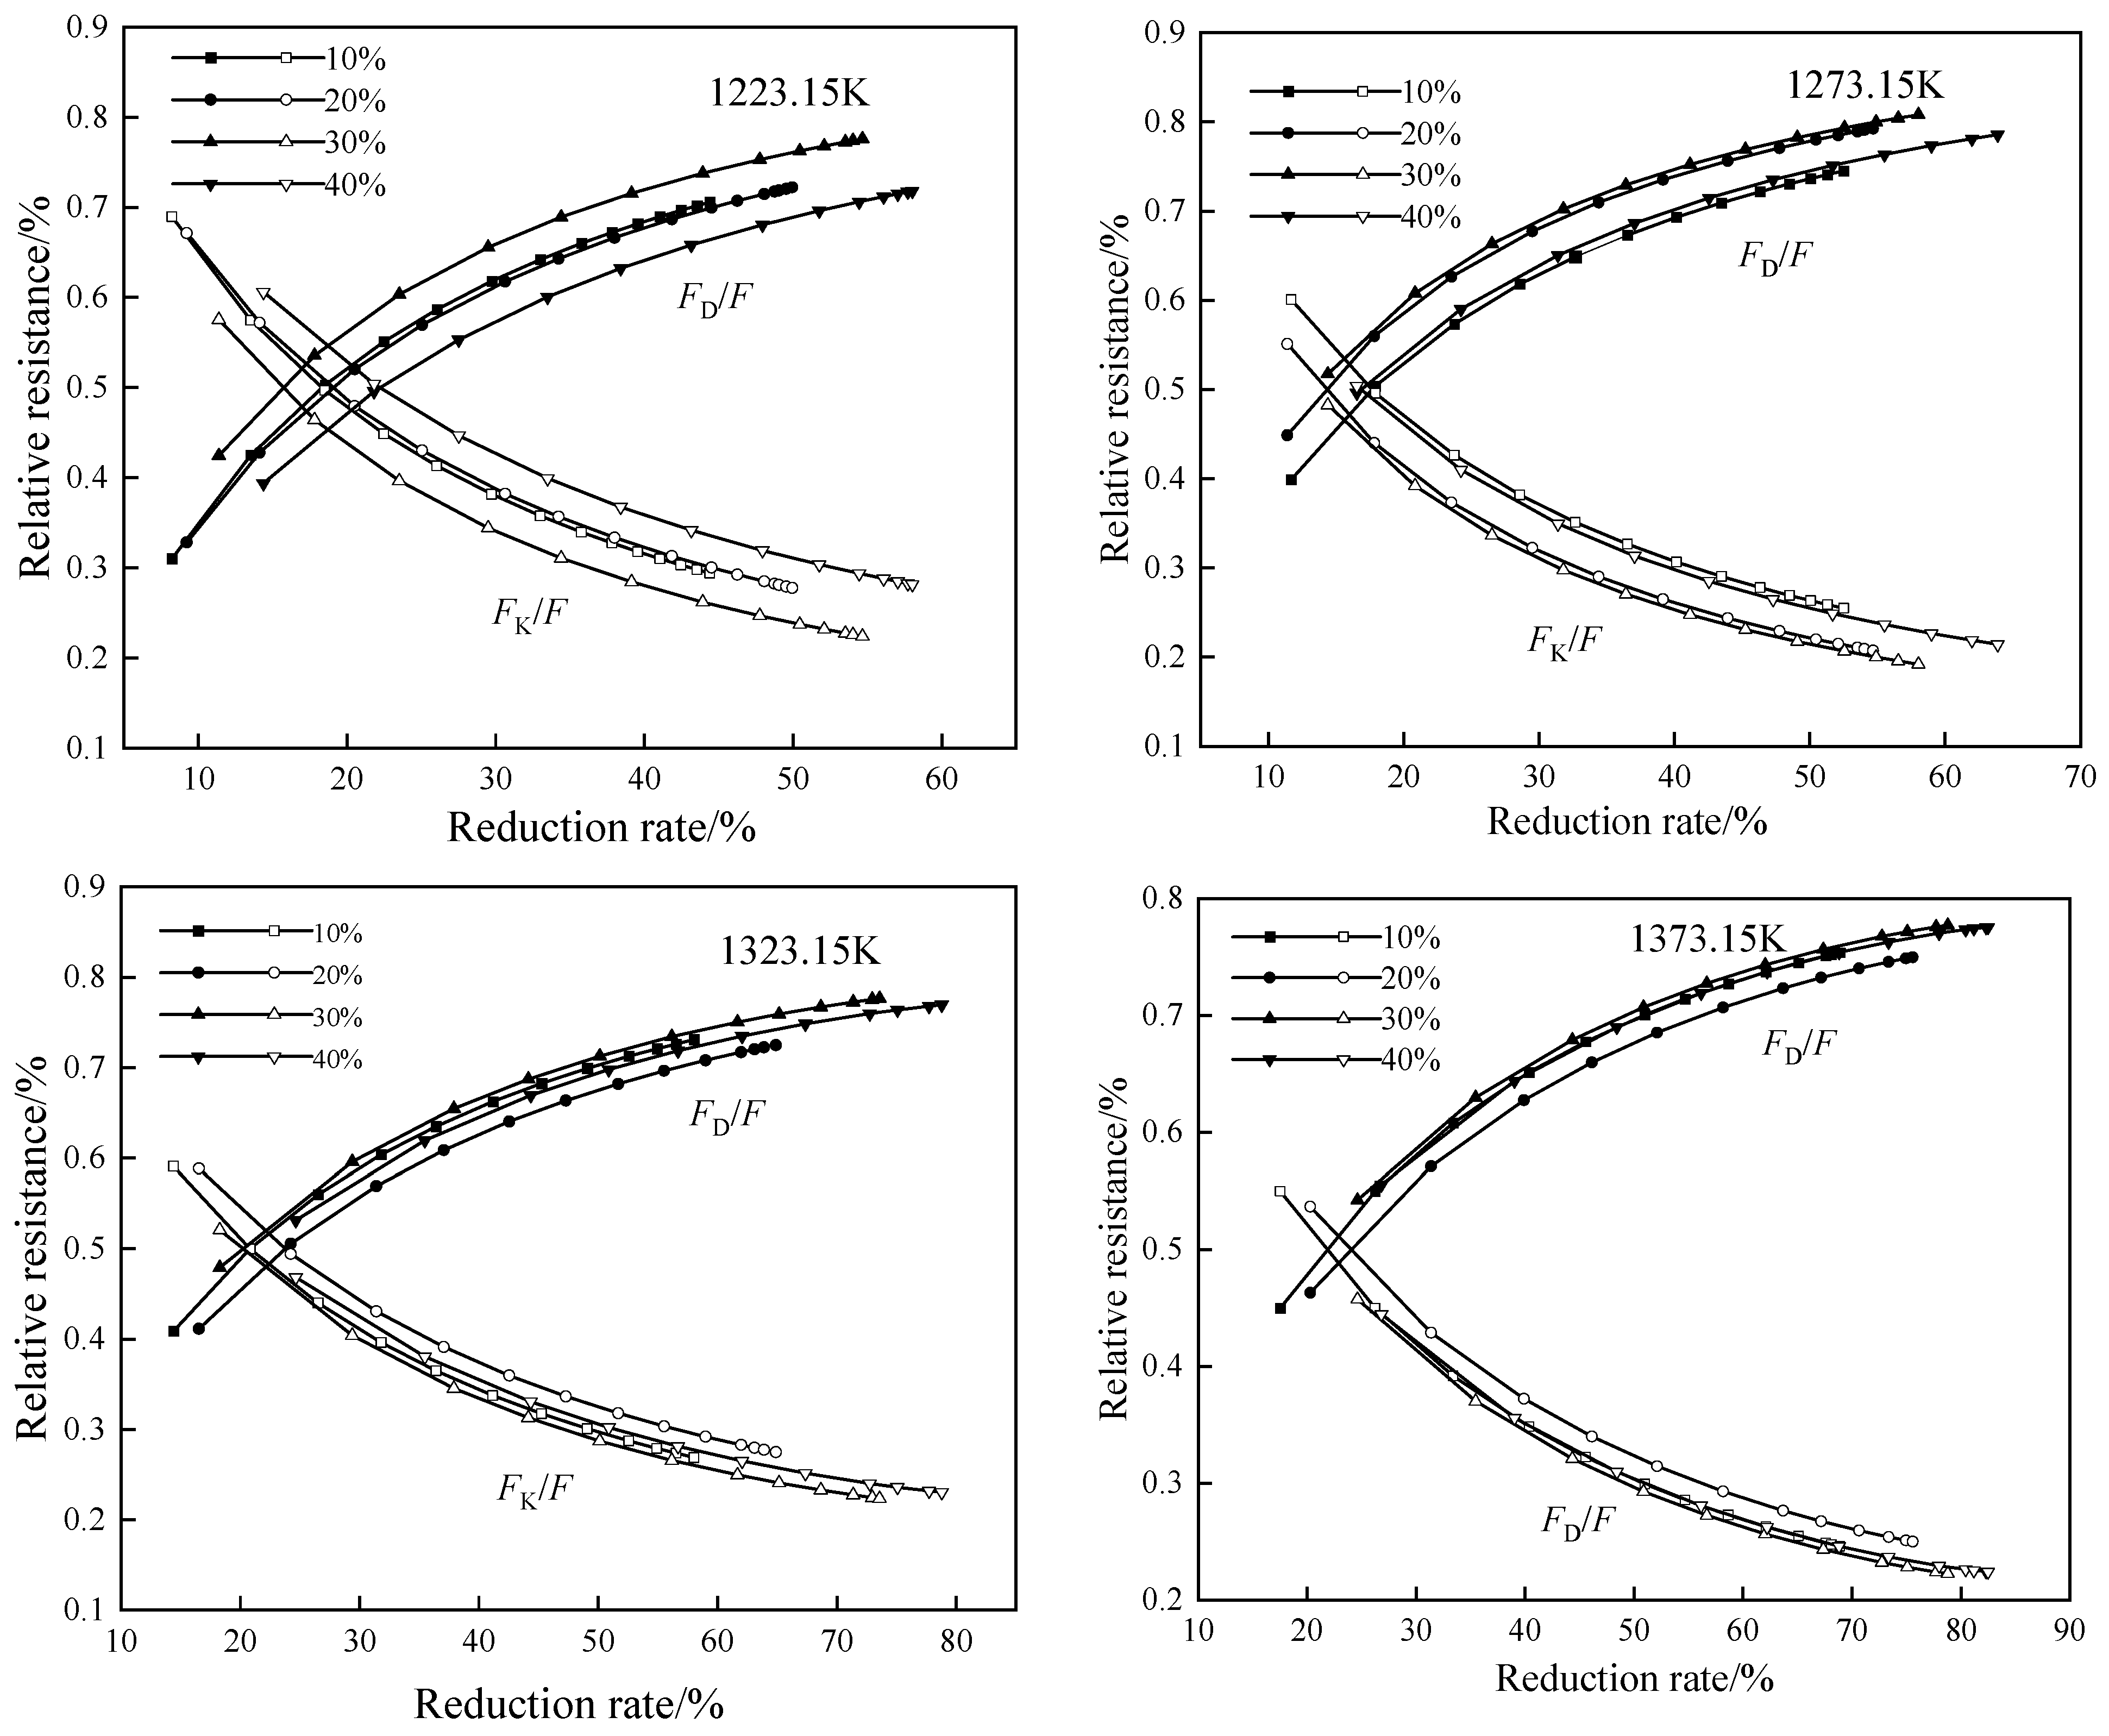
The internal diffusion resistance (FD) and the interfacial chemical reaction resistance (FK) are calculated using Equations (14) and (15). The total resistance is defined as F = FD + FK, where the relative resistance of the internal diffusion is expressed as FD/F, and the relative resistance of the interfacial chemical reaction is expressed as FK/F. The experimental results are shown in Figure 13. The results show that the trends of the two changes are probably the same. In the initial stage of copper slag reduction, the reduction process is controlled by internal diffusion and interfacial chemical reaction, and interface chemical reaction control is the main control link. In the reduction process of the reaction, the internal diffusion is a control link, while the internal diffusion gradually becomes dominant. Under the conditions of a high reduction temperature and a large H2 content, the low resistance of internal diffusion is favorable for the achievement of a high reduction ratio.
3.6. Comparison between Theoretical and Experimental Data
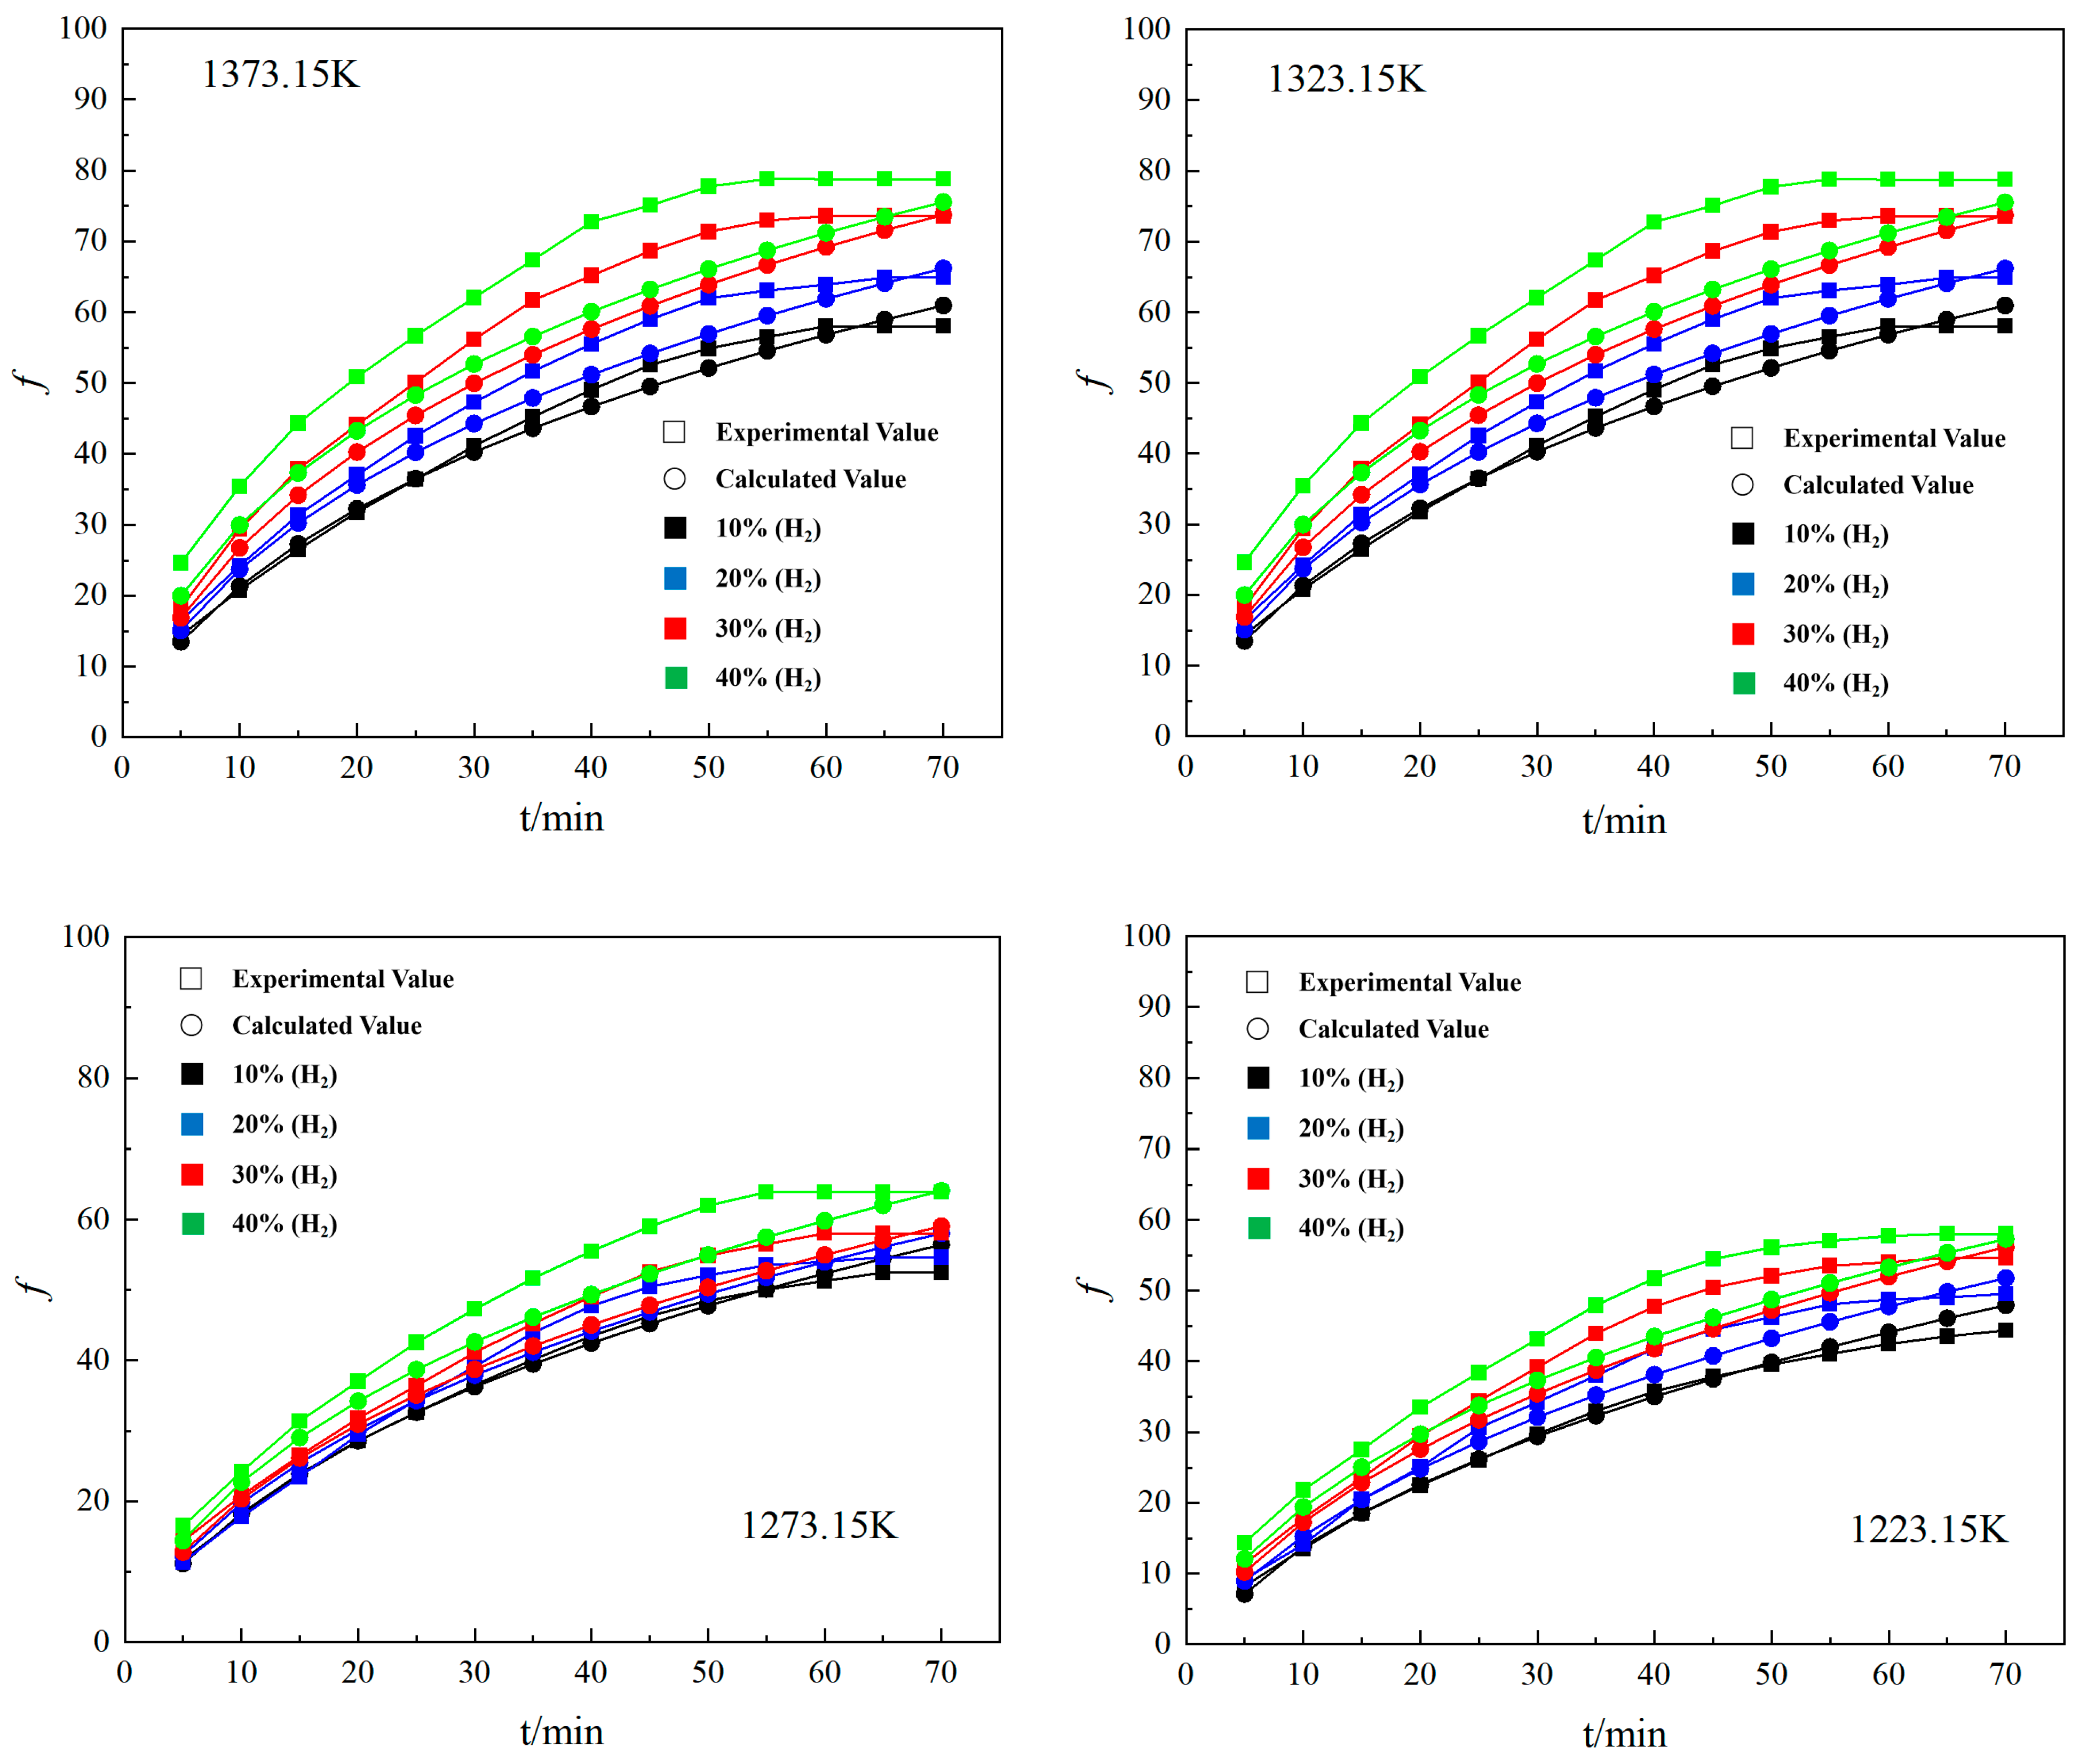
The accuracy and reliability of the model in this experiment were verified by comparing the theoretical and experimental values of the reduction ratio obtained by the calculation of the reduction ratio equation in the unreacted nuclear model.
A comparison of the theoretical and experimental values is shown in Figure 14. It can be seen that the theoretical value of the unreacted nuclear model fits well with the experimental value, which confirms the reliability of the model in this experiment.
4. Conclusions
In order to maximize the use value of copper slag, the process of copper slag reduction by H2 was proposed, and the kinetics of copper slag reduction were studied.
- (1)
- The main phases of copper slag are Fe2SiO4 and Fe3O4. The suitable condition of copper slag reduction by H2 uses a temperature of 1373.15 K, a H2 partial pressure of 40%, and a CaO addition amount of 30%. The reduction ratio is 85.04%. The melting test was carried out under the conditions of a temperature of 1773.15 K for 4 h. The content of Fe in the molten metal was 85.11%, the content of copper was 10.40%.
- (2)
- According to the unreacted nuclear mode, it can be concluded that the reduction process is controlled by internal diffusion and an interfacial chemical reaction. With the increase of the reduction ratio, internal diffusion is the main influencing factor. When the reaction temperature is between 950 °C and 1100 °C, the reaction ratio constant and diffusion coefficient is calculated, and the apparent activation energy is 29.107~36.082 kJ/mol, which gradually decreases as the partial pressure of H2 increases.
Author Contributions
Conceptualization, B.Z. and T.Z.; Funding acquisition, B.Z.; Investigation, B.Z. and C.Z.; Software, T.Z.; Writing—original draft, B.Z.; Writing—review and editing, B.Z. All authors have read and agreed to the published version of the manuscript.
Funding
This research was supported by the national natural science foundation of China (52004284), and the China Postdoctoral Science Foundation (2019M661979).
Data Availability Statement
Not applicable.
Conflicts of Interest
We declare that we do not have any commercial or associative interest that represents a conflict of interest in connection with the work submitted.
References
- Zhang, B.J.; Niu, L.P.; Zhang, T.A.; Li, Z.Q.; Zhang, D.L.; Zheng, C. Alternative reduction of copper matte in reduction process of copper slag. ISIJ Int. 2017, 57, 775–781. [Google Scholar] [CrossRef] [Green Version]
- Zhang, B.J.; Zhang, T.A.; Niu, L.P.; Liu, N.S.; Dou, Z.H.; Li, Z.Q. Moderate dilution of copper slag by natural gas. JOM 2018, 70, 47–52. [Google Scholar] [CrossRef]
- Coruh, S.; Ergun, O.N.; Cheng, T.W. Treatment of copper industry waste and production of sintered glass-ceramic. Waste Manag. Res. 2006, 24, 234–241. [Google Scholar] [CrossRef] [PubMed]
- Zhang, L.L.; Yue, Q.; Yang, H.W. Kinetics and mechanism of non-isothermal oxidation for FeO-SiO2-CaO ternary copper slag system. React. Kinet. Mech. Cat. 2021, 134, 903–916. [Google Scholar] [CrossRef]
- Li, L.; Hu, J.H.; Wang, H. Smelting oxidation desulfurization of copper slags. J. Iron Steel Res. Int. 2012, 19, 14–20. [Google Scholar] [CrossRef]
- Lei, T.Y.; Shu, J.C.; Deng, Y.L.; Hu, L.; Chen, S.Q.; Chen, M.J.; Huang, W.P. Enhanced recovery of copper from reclaimed copper smelting fly ash via leaching and electrowinning processes. Sep. Purif. Technol. 2021, 273, 118943. [Google Scholar] [CrossRef]
- Zhang, H.W.; Shi, X.Y.; Zhang, B.; Hong, X. Behaviors of the molten copper slags in the vertical electric field. ISIJ Int. 2013, 53, 1704–1708. [Google Scholar]
- Xu, S.H.; Qian, W.L.; Tan, J.K.; Zhang, H.B.; Cao, H.Z.; Zhou, J.; Zheng, G.Q. Formation and arsenic distribution of egg-type structure of matte droplets inside the copper smelting slag. Mater. Lett. 2022, 307, 131081. [Google Scholar] [CrossRef]
- Hou, X.; Xiao, G.Q.; Ding, D.H.; Zhang, N.X.; Gao, Y.Q. Effects of Cr2O3 content on viscosity and microstructure of copper converter slag. J. Non-Cryst. Solids 2021, 574, 121147. [Google Scholar] [CrossRef]
- Tian, H.Y.; Guo, Z.Q.; Pan, J.; Zhu, D.Q.; Yang, C.C.; Xue, Y.X.; Li, S.W.; Wang, D.Z. Comprehensive review on metallurgical recycling and cleaning of copper slag. Resour. Conserv. Recy. 2021, 168, 105366. [Google Scholar] [CrossRef]
- Reddy, R.G.; Prabhu, V.L.; Mantha, D. Recovery of valuable metals from copper blast furnace slag. Miner. Metall. Proc. 2004, 21, 125–132. [Google Scholar] [CrossRef]
- Heo, J.H.; Kim, B.S.; Park, J.H. Effect of CaO addition on iron recovery from copper smelting slags by solid carbon. Metall. Mater. Trans. B 2013, 44, 1352–1363. [Google Scholar] [CrossRef]
- Zhang, H.W.; Bao, L.; Chen, Y.F.; Xuan, W.D.; Yuan, Y.J. Efficiency improvements of the CO-H2 mixed gas utilization related to the molten copper slag reducing modification. Process Saf. Environ. 2021, 146, 292–299. [Google Scholar] [CrossRef]
- Gargul, K.; Boryczko, B.; Bukowska, A. Hydrometallurgical recovery of lead from direct-to-blister copper flash smelting slag. Arch. Civ. Mech. Eng. 2017, 17, 905–911. [Google Scholar] [CrossRef]
- Zhang, H.Q.; Hu, C.J.; Gao, W.J.; Lu, M.M. Recovery of iron from copper slag using coal-based direct reduction: Reduction characteristics and kinetics. Minerals 2020, 10, 973. [Google Scholar] [CrossRef]
- Zuo, Z.L.; Feng, Y.; Luo, S.Y.; Dong, X.J.; Li, X.T.; Ren, D.D.; Yu, Q.B.; Guo, J.X. Element distribution and migration behavior in the copper slag reduction and separation process. Front. Energy. Res. 2021, 9, 869. [Google Scholar] [CrossRef]
- Zhang, H.P.; Li, B.; Wei, Y.G.; Wang, H.; Yang, Y.D.; Mclean, A. Nonisothermal reduction kinetics in the Fe-Cu-O system using H2. JOM 2019, 71, 1813–1821. [Google Scholar] [CrossRef]
- Lee, D.H.; Lee, J.O.; Kim, K.T.; Song, Y.H.; Kim, E.; Han, H.S. Hydrogen in plasma-assisted hydrocarbon selective catalytic reduction. Int. J. Hydrogen Energy 2012, 37, 3225–3233. [Google Scholar] [CrossRef]
- Tang, J.; Chu, M.S.; Li, F.; Tang, Y.T.; Liu, Z.G.; Xue, X.X. Reduction mechanism of high-chromium vanadium–titanium magnetite pellets by H2-CO-CO2 gas mixtures. Int. J. Min. Met. Mater. 2015, 22, 562–572. [Google Scholar] [CrossRef]
Figure 1.
XRD analysis of copper slag.

Figure 2.
SEM analysis of copper slag.

Figure 3.
Schematic diagram of the experimental system. 1—H2, 2—gas flowmeter, 3—Ar, 4—gas mass flowmeter, 5—Resistance furnace.
Figure 3.
Schematic diagram of the experimental system. 1—H2, 2—gas flowmeter, 3—Ar, 4—gas mass flowmeter, 5—Resistance furnace.

Figure 4.
Experimental results under suitable conditions.

Figure 5.
XRD patterns of copper slag after reduction.

Figure 6.
SEM analysis result of metal after separation.

Figure 7.
Dynamic model diagram. C0, the boundary gas concentration; Cs, the mineral ball surface concentration; C, the chemical reaction interface concentration; Ce, the equilibrium concentration of the core interface.
Figure 7.
Dynamic model diagram. C0, the boundary gas concentration; Cs, the mineral ball surface concentration; C, the chemical reaction interface concentration; Ce, the equilibrium concentration of the core interface.

Figure 8.
Determination of the reducing gas flow.

Figure 9.
Experimental results under different conditions.

Figure 10.
Comparison curve of the chemical-controlled reduction with the diffusion-controlled reduction.
Figure 10.
Comparison curve of the chemical-controlled reduction with the diffusion-controlled reduction.

Figure 11.
The relationship of [1 − (1 − f)1/3] with [1 – 3(1 − f)2/3 + 2(1 − f)].


Figure 12.
The relationship of lnk-1/T.

Figure 13.
Relationship between the relative resistance and reduction.

Figure 14.
Comparison between the theoretical and experimental data for the reduction.


Table 1.
Element analysis results of copper slag (wt. %).
| TFe | FeO | MFe | Cu | Zn | Pb | S | CaO | SiO2 |
|---|---|---|---|---|---|---|---|---|
| 44.73 | 37.31 | 1.13 | 4.48 | 2.54 | 0.29 | 1.38 | 0.96 | 23.98 |
Table 2.
The chemical composition of copper slag after reduction under suitable conditions (wt. %).
| TFe | MFe | FeO | Cu | Pb | S | C | Zn |
|---|---|---|---|---|---|---|---|
| 42.51 | 36.15 | 9.48 | 3.40 | <0.01 | 0.781 | <0.004 | 0.44 |
Table 3.
Chemical composition of molten metal after separation (wt. %).
| TFe | Cu | Pb | Zn | S | C |
|---|---|---|---|---|---|
| 85.20 | 10.4 | 0.089 | 0.286 | 2.11 | <0.004 |
Table 4.
Reaction rate constant diffusion coefficient for various gas compositions and temperatures.
Table 4.
Reaction rate constant diffusion coefficient for various gas compositions and temperatures.
| H2 Partial Pressure | 10% | 20% | 30% | 40% | |
|---|---|---|---|---|---|
| reaction rate constant | 1223.15 K | 3.13 × 10⁻³ | 3.56 × 10⁻³ | 4.46 × 10⁻³ | 5.28 × 10⁻³ |
| 1273.15 K | 3.65 × 10⁻³ | 3.99 × 10⁻³ | 5.02 × 10⁻³ | 5.88 × 10⁻³ | |
| 1323.15 K | 4.15 × 10⁻³ | 4.49 × 10⁻³ | 5.52 × 10⁻³ | 6.38 × 10⁻³ | |
| 1373.15 K | 4.61 × 10⁻³ | 5.18 × 10⁻³ | 6.32 × 10⁻³ | 7.28 × 10⁻³ | |
| diffusion coefficient | 1223.15 K | 2.87 × 10⁻⁶ | 3.37 × 10⁻⁶ | 3.45 × 10⁻⁶ | 3.53 × 10⁻⁶ |
| 1273.15 K | 3.77 × 10⁻⁶ | 3.79 × 10⁻⁶ | 3.91 × 10⁻⁶ | 4.72 × 10⁻⁶ | |
| 1323.15 K | 4.33 × 10⁻⁶ | 5.34 × 10⁻⁶ | 5.50 × 10⁻⁶ | 6.93 × 10⁻⁶ | |
| 1373.15 K | 4.96 × 10⁻⁶ | 6.11 × 10⁻⁶ | 6.58 × 10⁻⁶ | 7.83 × 10⁻⁶ |
Table 5.
Relationship between lnk and 1/T in different reducing atmospheres.
| H2 Partial Pressure | Apparent Rate Response Equation | ||
|---|---|---|---|
| 10% | 36.082 | 0.110 | |
| 20% | 34.586 | 0.106 | |
| 30% | 31.784 | 0.101 | |
| 40% | 29.107 | 0.092 |
Publisher’s Note: MDPI stays neutral with regard to jurisdictional claims in published maps and institutional affiliations. |
© 2022 by the authors. Licensee MDPI, Basel, Switzerland. This article is an open access article distributed under the terms and conditions of the Creative Commons Attribution (CC BY) license (https://creativecommons.org/licenses/by/4.0/).
Share and Cite
MDPI and ACS Style
Zhang, B.; Zhang, T.; Zheng, C. Reduction Kinetics of Copper Slag by H2. Minerals 2022, 12, 548. https://doi.org/10.3390/min12050548
AMA Style
Zhang B, Zhang T, Zheng C. Reduction Kinetics of Copper Slag by H2. Minerals. 2022; 12(5):548. https://doi.org/10.3390/min12050548
Chicago/Turabian StyleZhang, Baojing, Tingan Zhang, and Chao Zheng. 2022. "Reduction Kinetics of Copper Slag by H2" Minerals 12, no. 5: 548. https://doi.org/10.3390/min12050548
Note that from the first issue of 2016, this journal uses article numbers instead of page numbers. See further details here.