Article

Interface Sampling and Indicator Minerals for Detecting the Footprint of the Lancefield North Gold Deposit under the Permian Glacial Cover in Western Australia

1
CSIRO Mineral Resources, Kensington, WA 6151, Australia
2
Duketon Mining Ltd., West Perth, WA 6005, Australia
*
Author to whom correspondence should be addressed.
Minerals 2021, 11(10), 1131; https://doi.org/10.3390/min11101131
Submission received: 29 July 2021 / Revised: 10 October 2021 / Accepted: 11 October 2021 / Published: 14 October 2021
(This article belongs to the Special Issue Mineral Exploration in Weathered and Covered Terrains)

Abstract

:
Areas under a thick Permian glacial cover in Western Australia formed as glaciers gouged fresh bedrock and deposited diamictites in disconnected valleys and basins. These areas now present the greatest challenge for mineral exploration in the northeast Yilgarn Craton. At the Lancefield North gold prospect, in the southern part of the Duketon Greenstone Belt, Permian diamictites on average 40 m thick cover unweathered basalt hosting gold mineralization. The basal Permian diamictites consist of fresh, very poorly sorted, angular to rounded, pebble- to boulder-sized, polymictic clasts supported by a matrix of coarse-grained sand and mud. The framework and matrix are cemented by calcite, dolomite, chlorite, and pyrite. These diamictites are stable under alkaline and reducing conditions below the water table. Detrital; fresh sulfides; gold; and opaque oxides, such as pyrite, pyrrhotite, chalcopyrite, sphalerite, arsenopyrite, gersdorffite, cobaltite, pentlandite, scheelite and galena, chromite, ilmenite, and magnetite, are identified in the framework and matrix of the fresh diamictites, and these are identical to those in the primary gold mineralization. Weathering of diamictites and oxidation of detrital and diagenetic sulfides above the water table produced several Fe- and Mn-rich redox fronts and secondary chalcocite and bornite. Interface sampling across the Archean–Permian unconformity shows Au, As, Zn, Ni, Co, and Cd anomalism over the mineralization compared to the background. However, these elements are low in concentration in the redox fronts, where Fe is correlated with As, Cu, Mo, and Sb and Mn is correlated with Co, Ni, and Ba. Gold shows elevated levels in the fresh basal diamictites and decreases in the weathered diamictites over the mineralization. A sampling at or near the Archean–Permian unconformity (interface sampling) only delineates gold mineralization, with no hydromorphic dispersion halo beyond the peripheries. At the Lancefield North prospect, the detrital indicator sulfides are mechanically dispersed up to 500 m to the east of the mineralization in the direction of ice flow. This dispersal distance is controlled by the rough topography of the Archean–Permian unconformity, and it may be greater, but the estimation of the actual distance of transport is limited by the distribution of drill hole locations.

1. Introduction

Mineral exploration carried out in weathered and covered terrains has given preference to geophysical and geochemical methods over mineralogical approaches. Airborne and ground geophysical surveys identify magnetic, electromagnetic, and gravitational anomalies and allow the rapid delineation of exploration targets. However, these methods do not indicate whether a target is mineralized or not. Geochemical exploration methods, based on the analysis of soils, vegetation, termites, or calcrete, are well established in areas under a shallow (<20 m) cover [1,2,3,4,5,6,7]. However, their present application in areas under a deep cover is limited.
Mineral explorers are interested in knowing the fertility of a mineral system, in minerals indicating the presence or absence of mineralization, and in vectors toward mineralization. The application of indicator mineral methods to mineral exploration has been significantly developed over the past three decades [8,9,10,11]. Such methods are now applied to a variety of sample media, including stream sediments, alluvium, colluvium, aeolian sediments, glacial sediments, and regolith in deeply weathered terrains, to explore for a broad spectrum of commodities [9,12]. Indicator minerals are those that suggest the presence of a deposit, alteration, or lithology. These minerals occur mainly in host rocks, are visually and chemically distinct, and survive both weathering and transport. They are characterized predominantly by silt and medium sand-sized (10–2000 µm) grains with a moderate to high density. Indicator minerals are sparse in unconsolidated sediments; thus, sediment samples must be concentrated so they can be recovered and examined. The different processing methods for the recovery of indicator minerals from sediments and rocks are reviewed by [13]. Indicator mineral suites have been identified for different commodities and types of ore deposits, including diamond, Au, Ni–Cu, PGE, volcanogenic massive sulfide, porphyry Cu, U, Sn, and W.
There are several advantages and benefits of using indicator mineral methods over traditional geochemical analysis in covered terrains [9]. These include (1) the ability of indicator minerals to detect haloes much larger than the mineralized target and the associated alteration, (2) the ability of indicator minerals to provide physical evidence of the presence of mineralization and information about the provenance and transport distance from the source rock that traditional geochemical methods cannot provide, (3) the ability to detect only a few grains of indicator minerals, equivalent to a ppb-level concentration of an element of interest that is below the detection level when using geochemical methods, (4) the ability to identify and remove contamination related to anthropogenic activities and drilling, and (5) the fact that with mechanical dispersion of indicator minerals, a broader sample spacing can be applied compared to geochemical sampling methods [14].
Indicator mineral methods have been thoroughly integrated into mineral exploration protocols in late Pleistocene glaciated terrains in Canada, the USA, and Fennoscandia [15,16,17,18,19,20,21]. Subglacial erosion of mineralization can produce a dispersal train of metal-rich debris that resembles the primary composition of the bedrock source [18,21,22,23]. In Australia, a transported cover commonly overlies deeply weathered paleolandscape dominated by lateritic residuum and saprolite [24,25]. Mineral exploration through a cover depends on hydromorphic metal dispersion from the anomalous weathering profile underneath or mechanical dispersion along unconformities between the cover and the weathered bedrock. Therefore, the application of indicator mineral methods to mineral exploration under a deep cover has received less attention.
In the northeast of the Yilgarn Craton, Permian glacial diamictites immediately overlie unweathered Archean bedrocks that have the potential to host gold and nickel mineralization [11]. In addition, the Permian glacial diamictites are unconformably overlain by younger Cenozoic sediments, on which soil may or may not form. This potentially limits the effectiveness of the near-surface exploration techniques, such as soil, termite, and vegetation sampling, when exploring areas covered by these diamictites.
Mineral exploration in Australia is increasingly moving toward areas under a deep (>30 m) transported cover as areas under a shallow cover become exhausted. Deep drilling and high-density sampling of the weathered or fresh basement beneath the Archean–Permian unconformity are costly. Instead, alternative exploration tools are required to explore areas under a deep cover. Indicator heavy mineral methods have not been applied in detail for mineral exploration in Australia [11], as in the more recently glaciated (late Pleistocene) areas in Canada and Fennoscandia [10,21,26,27,28].
Accordingly, we have undertaken a systematic stratigraphic, mineralogical, and geochemical study to determine whether the Permian diamictites over the Lancefield North gold deposit have properties that may help to identify mineralization in the underlying rocks. The present study aims to characterize the indicator minerals and the role of the paleolandscape in their mechanical dispersion. Our results show that the mineralogy of the Permian diamictite provides an indication of the gold mineralization potential in the underlying Archean rocks.

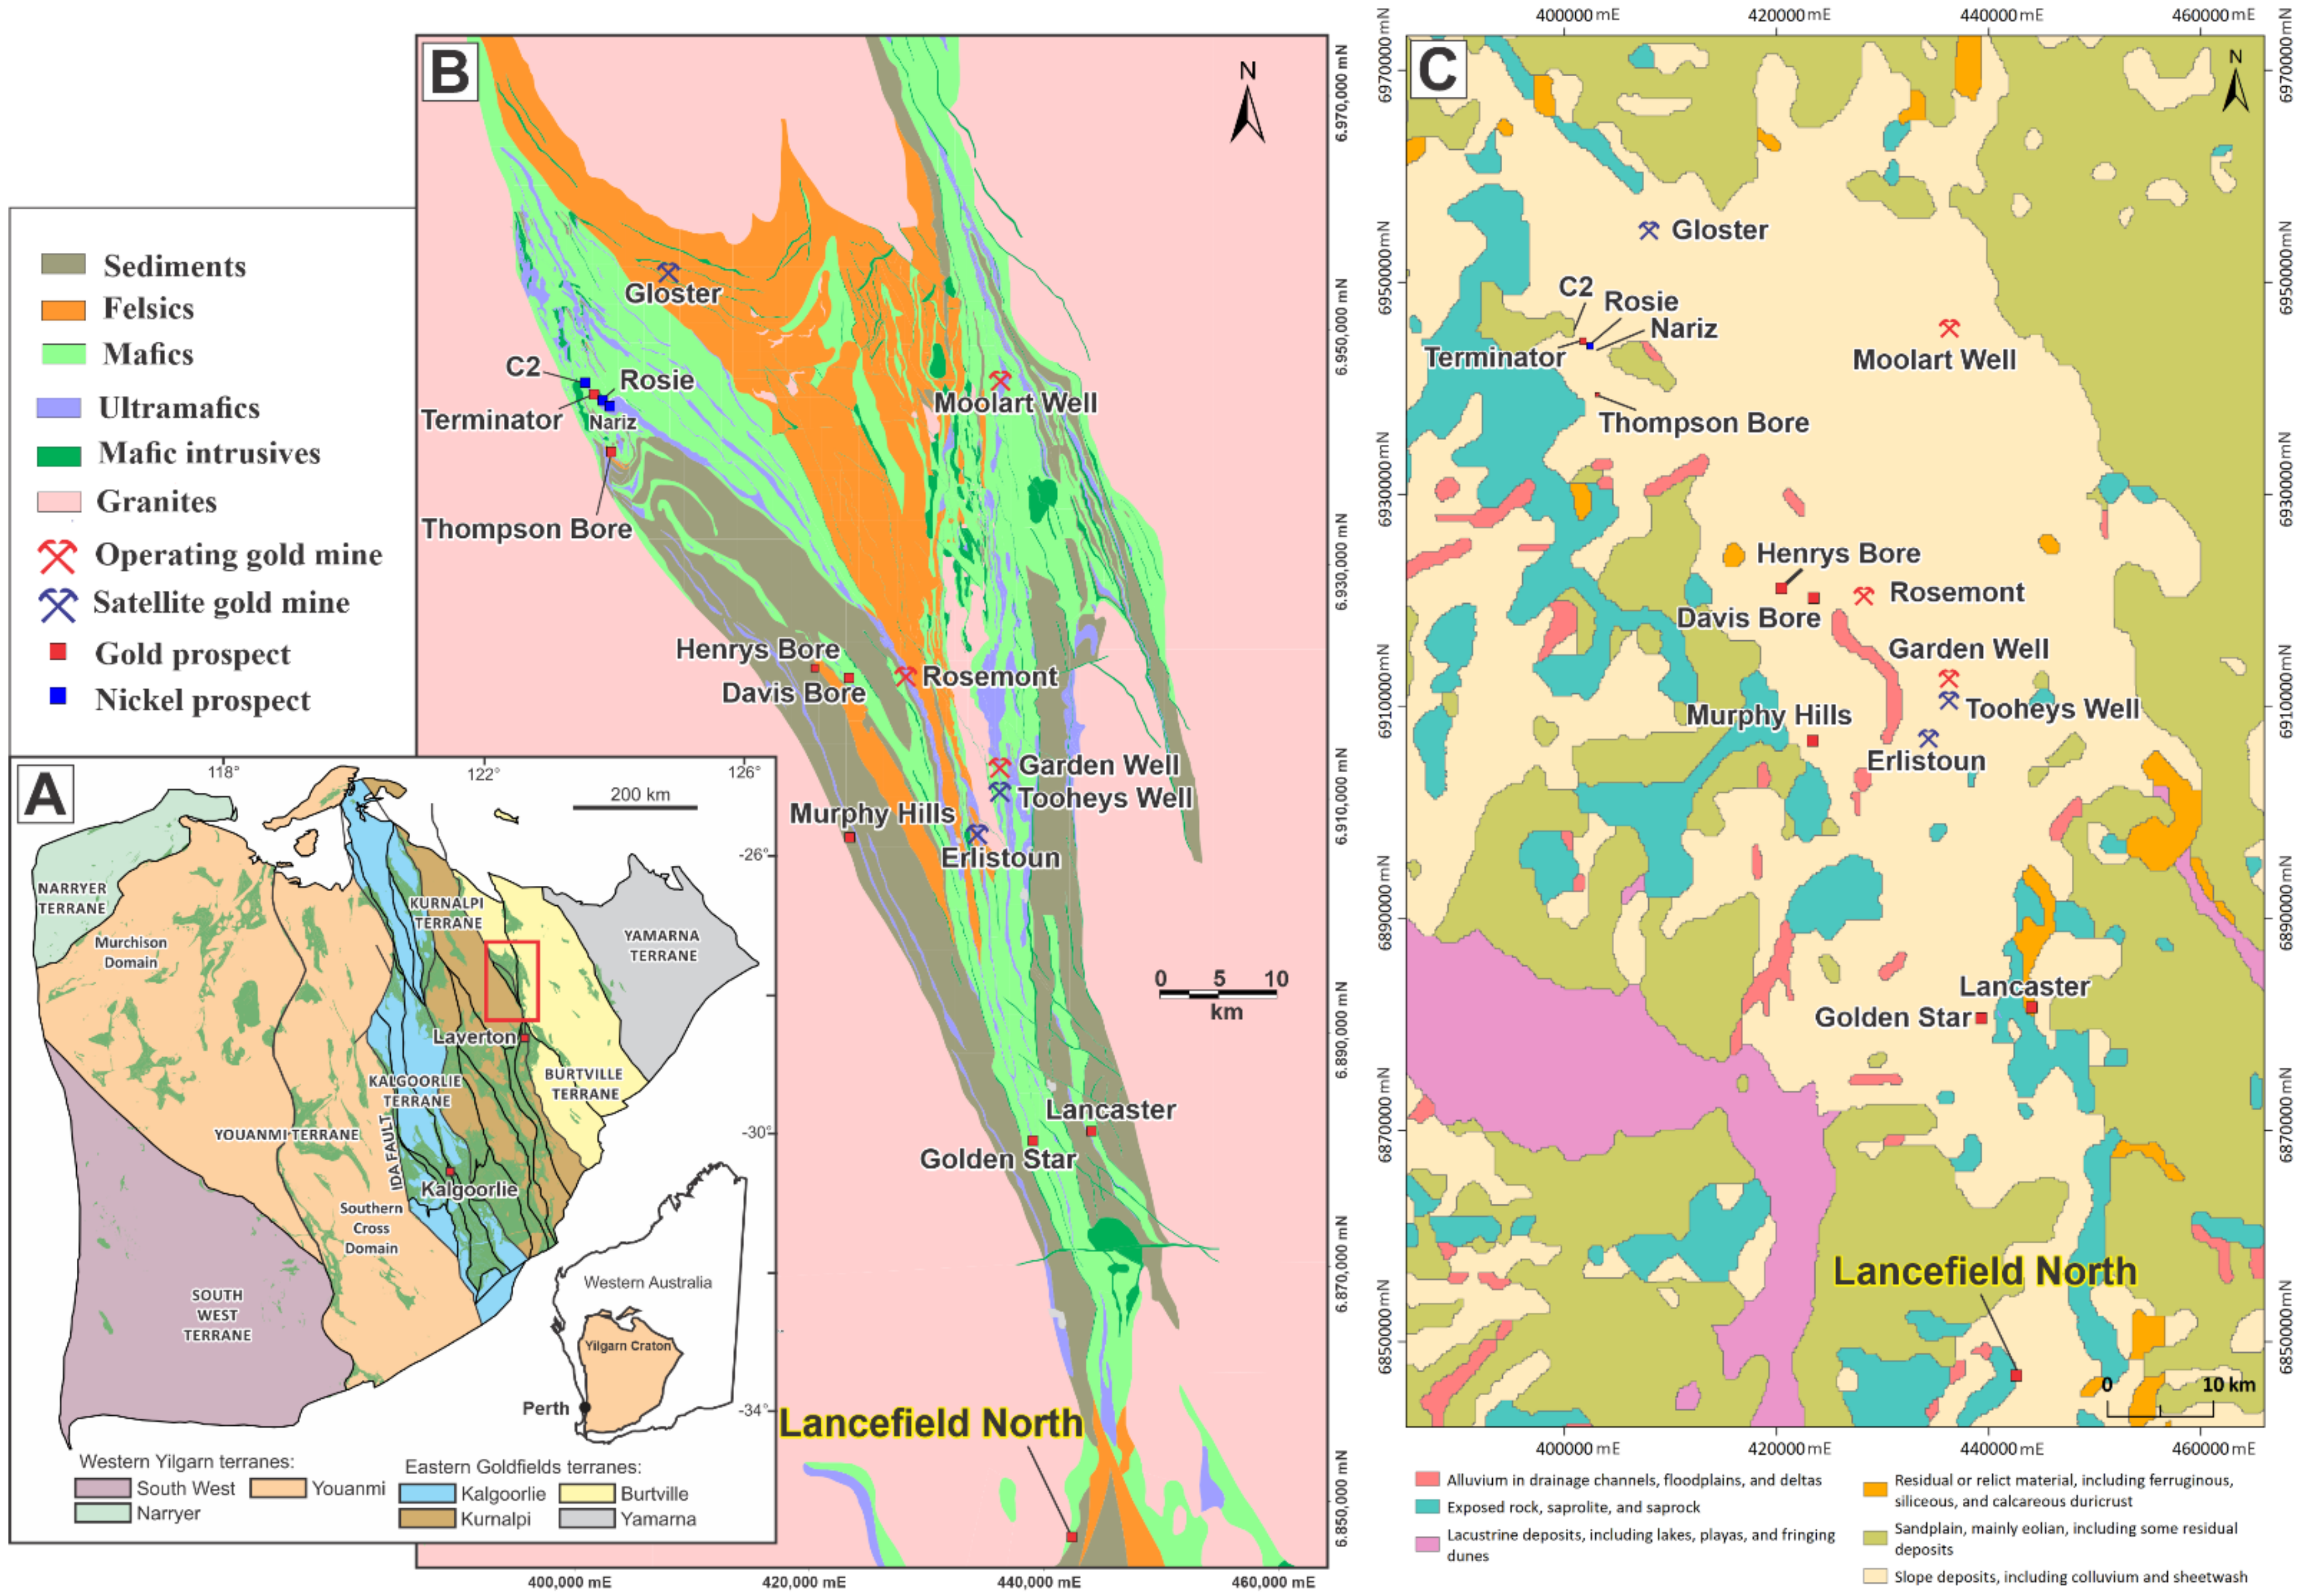
2. Geological Setting

The Kalgoorlie-Laverton area (Figure 1A,B) hosts nickel and gold deposits in highly deformed north northwest-south southeast-trending greenstone belts. These are dominated by metamorphosed Archean felsic and mafic volcanic, metasedimentary, and intrusive rocks that are intruded by variably deformed granitoids [29,30]. The present-day land surface is dominated by broad plateaus and wide shallow valleys containing chains of salt lakes.
The Duketon Greenstone Belt (Figure 1B) is a broad synform and has been divided into fault-bounded eastern, western, northern, and central domains [31,32,33,34]. The central domain of the Duketon Greenstone Belt is a fault-bound, intermediate to felsic, volcaniclastic and volcanic rock sequence. The western domain comprises metamorphosed sedimentary, ultramafic, and mafic rocks. The eastern domain comprises metamorphosed sedimentary rocks and felsic, mafic, and ultramafic volcanic rocks. The northern domain comprises metamorphosed sedimentary, mafic, and ultramafic rocks. The western domain of the Duketon Greenstone Belt contains numerous gold prospects, whereas the eastern domain of the greenstone belt has the Moolart Well, Garden Well, Rosemont, Tooheys Well, Erlistoun, and Gloser Au mines (Figure 1B). A folded and thickened sequence of ultramafic rocks (komatiites) in the northern part of the western domain hosts the Rosie and C2 nickel sulfide resources and the Nariz discovery.
The Lancefield North prospect is located at the southern end of the Duketon Greenstone Belt (Figure 1B) and at the northern end of the Laverton tectonic zone [35]. The prospect is located approximately 13 km north of Laverton and 5 km north of the historical Lancefield Gold Mine (approximately 2 Moz of gold pre-mined). Gold mineralization is hosted within a north to northeast-striking, 30–60° east-dipping sequence of ultramafic, mafic, and sedimentary rocks. Gold mineralization (lodes) at Lancefield North is associated with a series of stacked, brittle-ductile dextral reverse shear zones within a package of meta-basalt and graphitic chert-shale layers. These layers host most of the gold mineralization, which is associated with quartz–carbonate–sulfide veining and intense hydrothermal alteration.
Permian glacial sediments of the Paterson Formation cover parts of the Duketon Greenstone Belt [36,37]. The Permian sediments consist of poorly sorted diamictites with minor intercalations of flat and cross-bedded sandstones and siltstones. The Permian sediments are abundant in the southern part of the Duketon Greenstone Belt at Lancefield North and are absent in the central and northern parts of the belt. Tertiary paleochannel siltstones are common in the central and southern parts of the belt, whereas residual weathering profiles are either exposed or covered by thin veneers of Quaternary unconsolidated colluvium, alluvium, aeolian, and lacustrine sediments (Figure 1C) in the northern part of the Duketon Greenstone Belt [34].

3. Materials and Methods

A total of 86 samples from the Permian–Cenozoic cover and the underlying basalt were collected every 2 m from drill holes DKRC0050, DKRC0055, and DKRC0061 (Figure 2). Thirty-two samples were collected from drill hole DKRC0050 in the background area, 24 from drill hole DKRC0055, and 27 from drill hole DKRC0061 over the mineralization (Table S1).
Three samples from the Au mineralization were collected from DKRC0051 at 155–156 m, 156–157 m, and 157–158 m (Table S1). This drill hole is about 150 m to the east of the mineralization and was drilled down to a depth of 210 m at 60° to the west and intersected the east-dipping mineralization at 96–98 m, 128–131 m, and 156–160 m depth. These samples were selected after checking the chemical analyses provided by Duketon Mining Ltd., West Perth, Australia. Chemical analyses that showed the highest Au content in the mineralization. Forty-five samples were collected from redox fronts within the Permian weathered diamictites at different stratigraphic levels to characterize the hydromorphic dispersion. Thirty-five samples were collected from the interface (Permian–Archaean unconformity). Interface sampling refers to sampling at or across an unconformity, generally that between weathered or fresh basement and transported cover. Interface sampling is based on sampling the mixed meter interval across the unconformity when it is not possible to determine the unconformity in drill holes. Sediments at the base of the cover are more likely reworked from the underlying weathered or fresh rocks.
A sample was collected from each of 36 reverse circulation drill holes, 33 were collected from the lower 1 m of the Permian diamictites to separate the heavy mineral content, and 3 were collected from the mineralization (Figure 2; Table S1). Petrographic and mineralogical observations were conducted on 25 polished-thin sections from each regolith stratigraphic unit using a Zeiss Axiolmager polarizing microscope and a Zeiss Ultra-Plus field emission gun (FEG) scanning electron microscope (SEM) at CSIRO, Perth, Australia. The Zeiss SEM is coupled with a Bruker X-Flash EDX detector for elemental analyses. The SEM was operated with an accelerating voltage of 20 kV and a beam current of 3 nA.
The X-ray diffraction (XRD) analyses of 39 samples from the Permian–Cenozoic sedimentary cover and the gold mineralization at Lancefield North prospect were undertaken at the CSIRO-ARRC (Australian Resource Research Centre, Perth, Australia). The analyses were carried out using a Bruker D4 Endeavor ASX instrument operating with a Co X-ray tube. The XRD patterns were collected for the range of 2 θ from 5° to 90°, with an increment of 0.02° and a scan speed of 0.1 s per step. The obtained X-ray data were interpreted and semi-quantified using Eva diffraction software (version 2.1).
Heavy mineral analyses were performed on mineral concentrates extracted from 36 samples collected from the lowermost meter of the Permian sediments and three samples from the mineralization (Table S1). The total sample weight of each sample was approximately 500 g. Samples were sent to Western Geolabs, Perth, Western Australia. The total sample was dried at 110 °C for 5–8 h and then wetted and attritioned before being deslimed (removal of the <45 µm size fraction). The size of the heavy minerals targeted is between <45 µm and 1 mm. Samples were dried, weighed, and stirred into glass separation funnels containing tetrabromoethane with a specific gravity (SG) of 2.95 (tested daily by the lab via a hydrometer). The heavy minerals with SG > 2.95 were drained from the funnels into filter paper, washed with acetone, then dried and weighed.
Carbon-coated polished sections of 33 samples of grain mounts of heavy minerals from the base of the Permian cover were examined using a TESCAN Mira-3 FEG-SEM (Field Emission Gun Scanning Electron Microscope, Brno, Czech Republic) fitted with 3 EDAX Element 30 X-ray detectors and one Oxford X-Max 50 X-ray detector. The percentage and number of indicator minerals (sulfides and gold) in bulk samples were determined using the TESCAN Mira-3 FEG-SEM and TIMA (TESCAN Integrated Mineral Analyzer) software (version 2.4). The percentage of indicator minerals in the bulk samples is presented in sheet 1 of Table S3, while the number of indicator minerals was recalculated after normalization to 500 g of bulk samples (sheet 2 of Table S3). The numbers of indicator mineral particle counts include the free grains plus the mineral inclusions.
The system was operated in a high-vacuum mode at 25 kV and a beam current of 7 to 8 nA. Data were collected using a dot mapping technique with a 1 or 2 µm backscattered electron (BSE) image pixel size and an X-ray dot spacing of 9 to 14 µm (depending on feature size and time available). Additional, higher resolution data were acquired on selected areas of interest using BSE images and an X-ray resolution of 1 µm.
Chemical analyses were performed on samples that were dried, crushed, and pulverized using a low chrome LM1 bowl and puck mill at Labwest Minerals Analysis Pty Ltd. Perth, Australia. For Au, 25 g aliquots of the pulverized sample were analyzed using aqua-regia digest (Scheme Code: WAR-02 of the Labwest Minerals Analysis Pty Ltd.) with determination by ICP-MS to achieve high recovery and low detection limits (0.5 ppb).
For multi-element analyses, two methods were used:
Alkaline fusion analysis for major elements (oxides) SiO2, Al2O3, Fe2O3, MnO, CaO, MgO, Na2O, K2O, P2O5, and TiO2; rare earth elements (REEs) La–Lu and Y; high-field-strength elements (HFSEs) Zr, Hf, Nb, Ta, Sc, U, and Th; and other refractory minerals containing Sn, Pb, W, and Cr was performed by LabWest Minerals Analysis Pty Ltd., using their in-house method AF-02. This method gives a total recovery of the major rock-forming and refractory minerals. A 0.1 g portion of the sample was fused in Li metaborate/tetraborate flux at 1000 °C. The resulting bead was dissolved in dilute (2%) nitric acid. Solutions were then presented to inductively coupled plasma-optical emission spectrometry (ICP-OES; Perkin-Elmer Optima 7300DV) for determination of the desired analytes. Loss on ignition was performed gravimetrically, with the ignition of a separate 1 g sample portion at 1000 °C for 30 min. Elements were reported as oxides at percent-level concentrations.
Multiacid trace element analysis for Ag, As, Ba, Be, Bi, Cd, Co, Cs, Cu, Ga, Ge, Hg, In, Li, Mo, Ni, Rb, Re, S, Se, Sr, Te, Tl, V, and Zn was performed by LabWest Minerals Analysis Pty Ltd. using their in-house method, MMA-04 (four-acid digest). A 0.1 g sample was digested in a mixture of hydrofluoric, nitric, phosphoric, and hydrochloric acids in sealed digestion vessels for 60 min, using an Anton Paar MW3000 microwave digestion system. The digestion took place at a temperature of approximately 160 °C and 16-bar pressure. After the addition of boric acid to neutralize the remaining hydrofluoric acid, the solutions were made up to volume with deionized water. Internal standards were added to the solutions at the digestion stage. The solutions were then analyzed by inductively coupled plasma-mass spectrometry (ICP-MS; PerkinElmer NexION 300Q) and ICP-OES (PerkinElmer Optima 7300DV), Waltham, MA, USA. The quality assurance/quality control calculations performed on certified reference materials were OREAS (e.g., 100a, 131a, 23a, 24b, 252a, and 27), GLG (e.g., 305-1, 12-2, and 913-1), and duplicates (Table S1).

4. Results

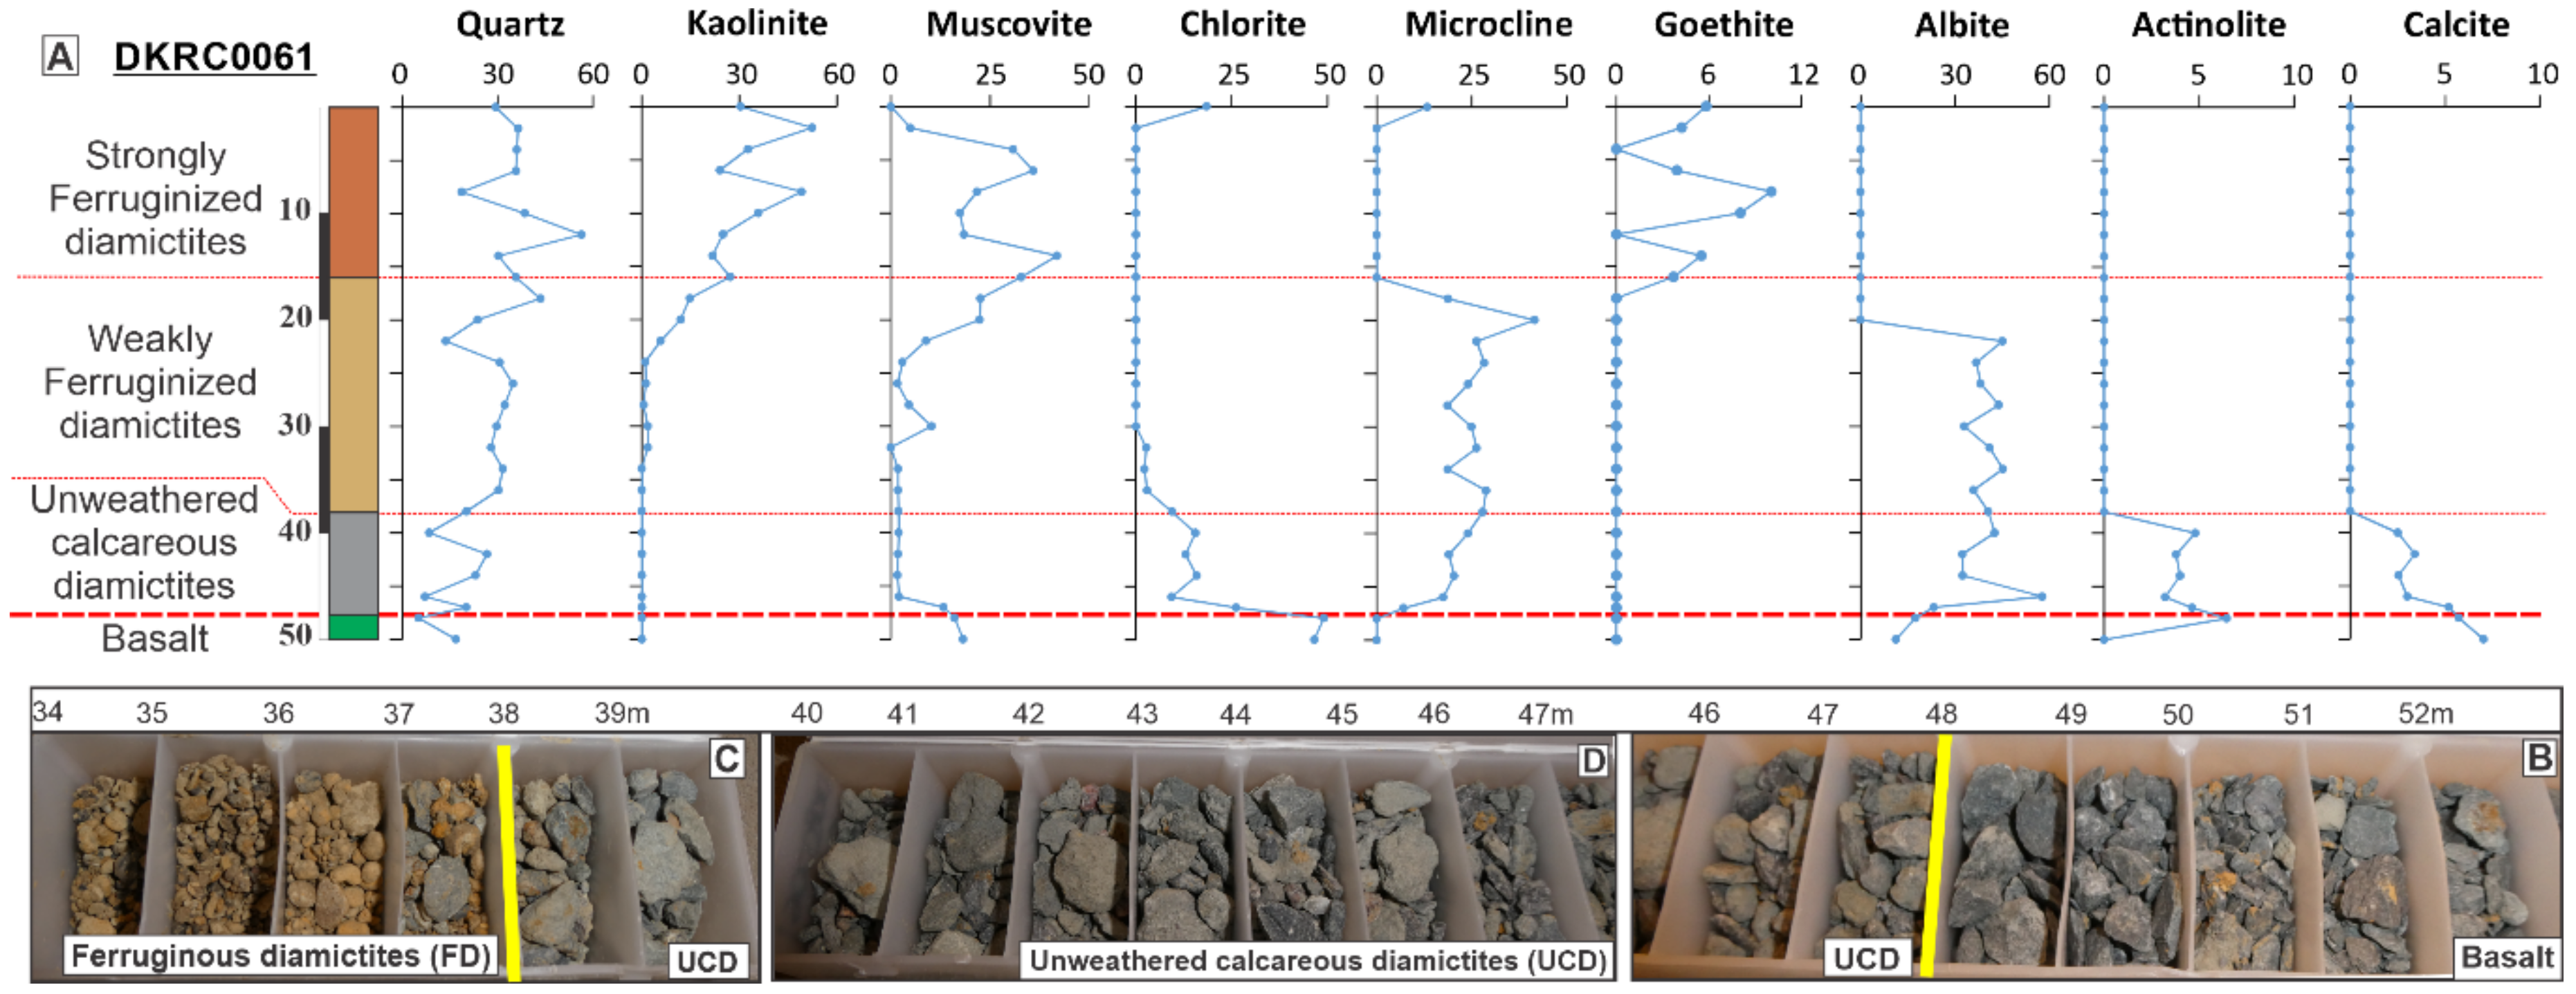
4.1. Stratigraphy and Landscape of the Permian Cover

Geological logging of the 33 reverse circulation and two diamond drill holes is presented in Figure S1. At the Lancefield North prospect, the Permian glacial sedimentary cover unconformably overlies unweathered Archean basalt (Figure 3 and Figure 4A–C; Figure S1). It varies in thickness from 22 to 54 m (average ~40 m). The depth to the Permian–Archean unconformity varies from 27 to 59 m from the surface, and this generates a rough paleotopography (Figure S1). The Permian cover occupies a topographic low above the Au mineralization that appears to follow the strike of the NNE–SSW shear zones (Figure 2 and Figure 3).
Two east–west cross sections of the Permian cover show that the Permian stratigraphic sequence at the Lancefield North prospect consists of glacial diamictite and rhythmite (Figure 3). Diamictites consist of poorly lithified, very poorly sorted, angular to rounded, pebble- to boulder-sized (up to 0.5 m in diameter as reported from drilling), polymictic clasts supported by a matrix of coarse-grained sand and mud (Figure 4A,C). The polymictic diamictite clasts are composed of basalt, pink and gray granites, quartzite, siltstones, sandstones, conglomerates, gabbro, and ultramafic rocks (Figure 4C,D). The diamictite in the basal part of the Permian sequence is unweathered and gray in color, and its clasts and matrix are cemented by calcareous and pyritic cement (Figure 4A). Conversely, the diamictite in the upper part of the Permian sequence is variably weathered and its clasts and matrix are cemented by ferruginous and manganiferous cement (Figure 4D).
The rhythmites are interbedded with diamictites and mainly occur to the west of the mapped NW–SE-trending fault cutting cross the Lancefield North gold mineralization (Figure 3 and Figure 4E). Figure 4E shows that the rhythmites consist of fine- to coarse-grained sandstones, siltstones, and claystones with wavy, flaser, graded-bedding, cross-bedding, and laminations. The boundary between sandstone and siltstone beds and laminae is sharp and erosive. Eroded siltstone clasts are preserved in the overlying sandstone beds. Sandstones and siltstones consist of well-sorted, grain-supported, subangular to subrounded quartz with dropstones (Figure 4E) and are cemented by calcareous, pyritic, and argillaceous cement. The sandstone interbeds and laminae are partly to completely ferruginized along bedding planes.
The Permian cover is unconformably overlain by Tertiary massive and varicolored siltstones and Quaternary silicified colluvium and alluvium and ferruginous soil (Figure 4F). The Quaternary sediments form the present-day, broadly flat landscape.

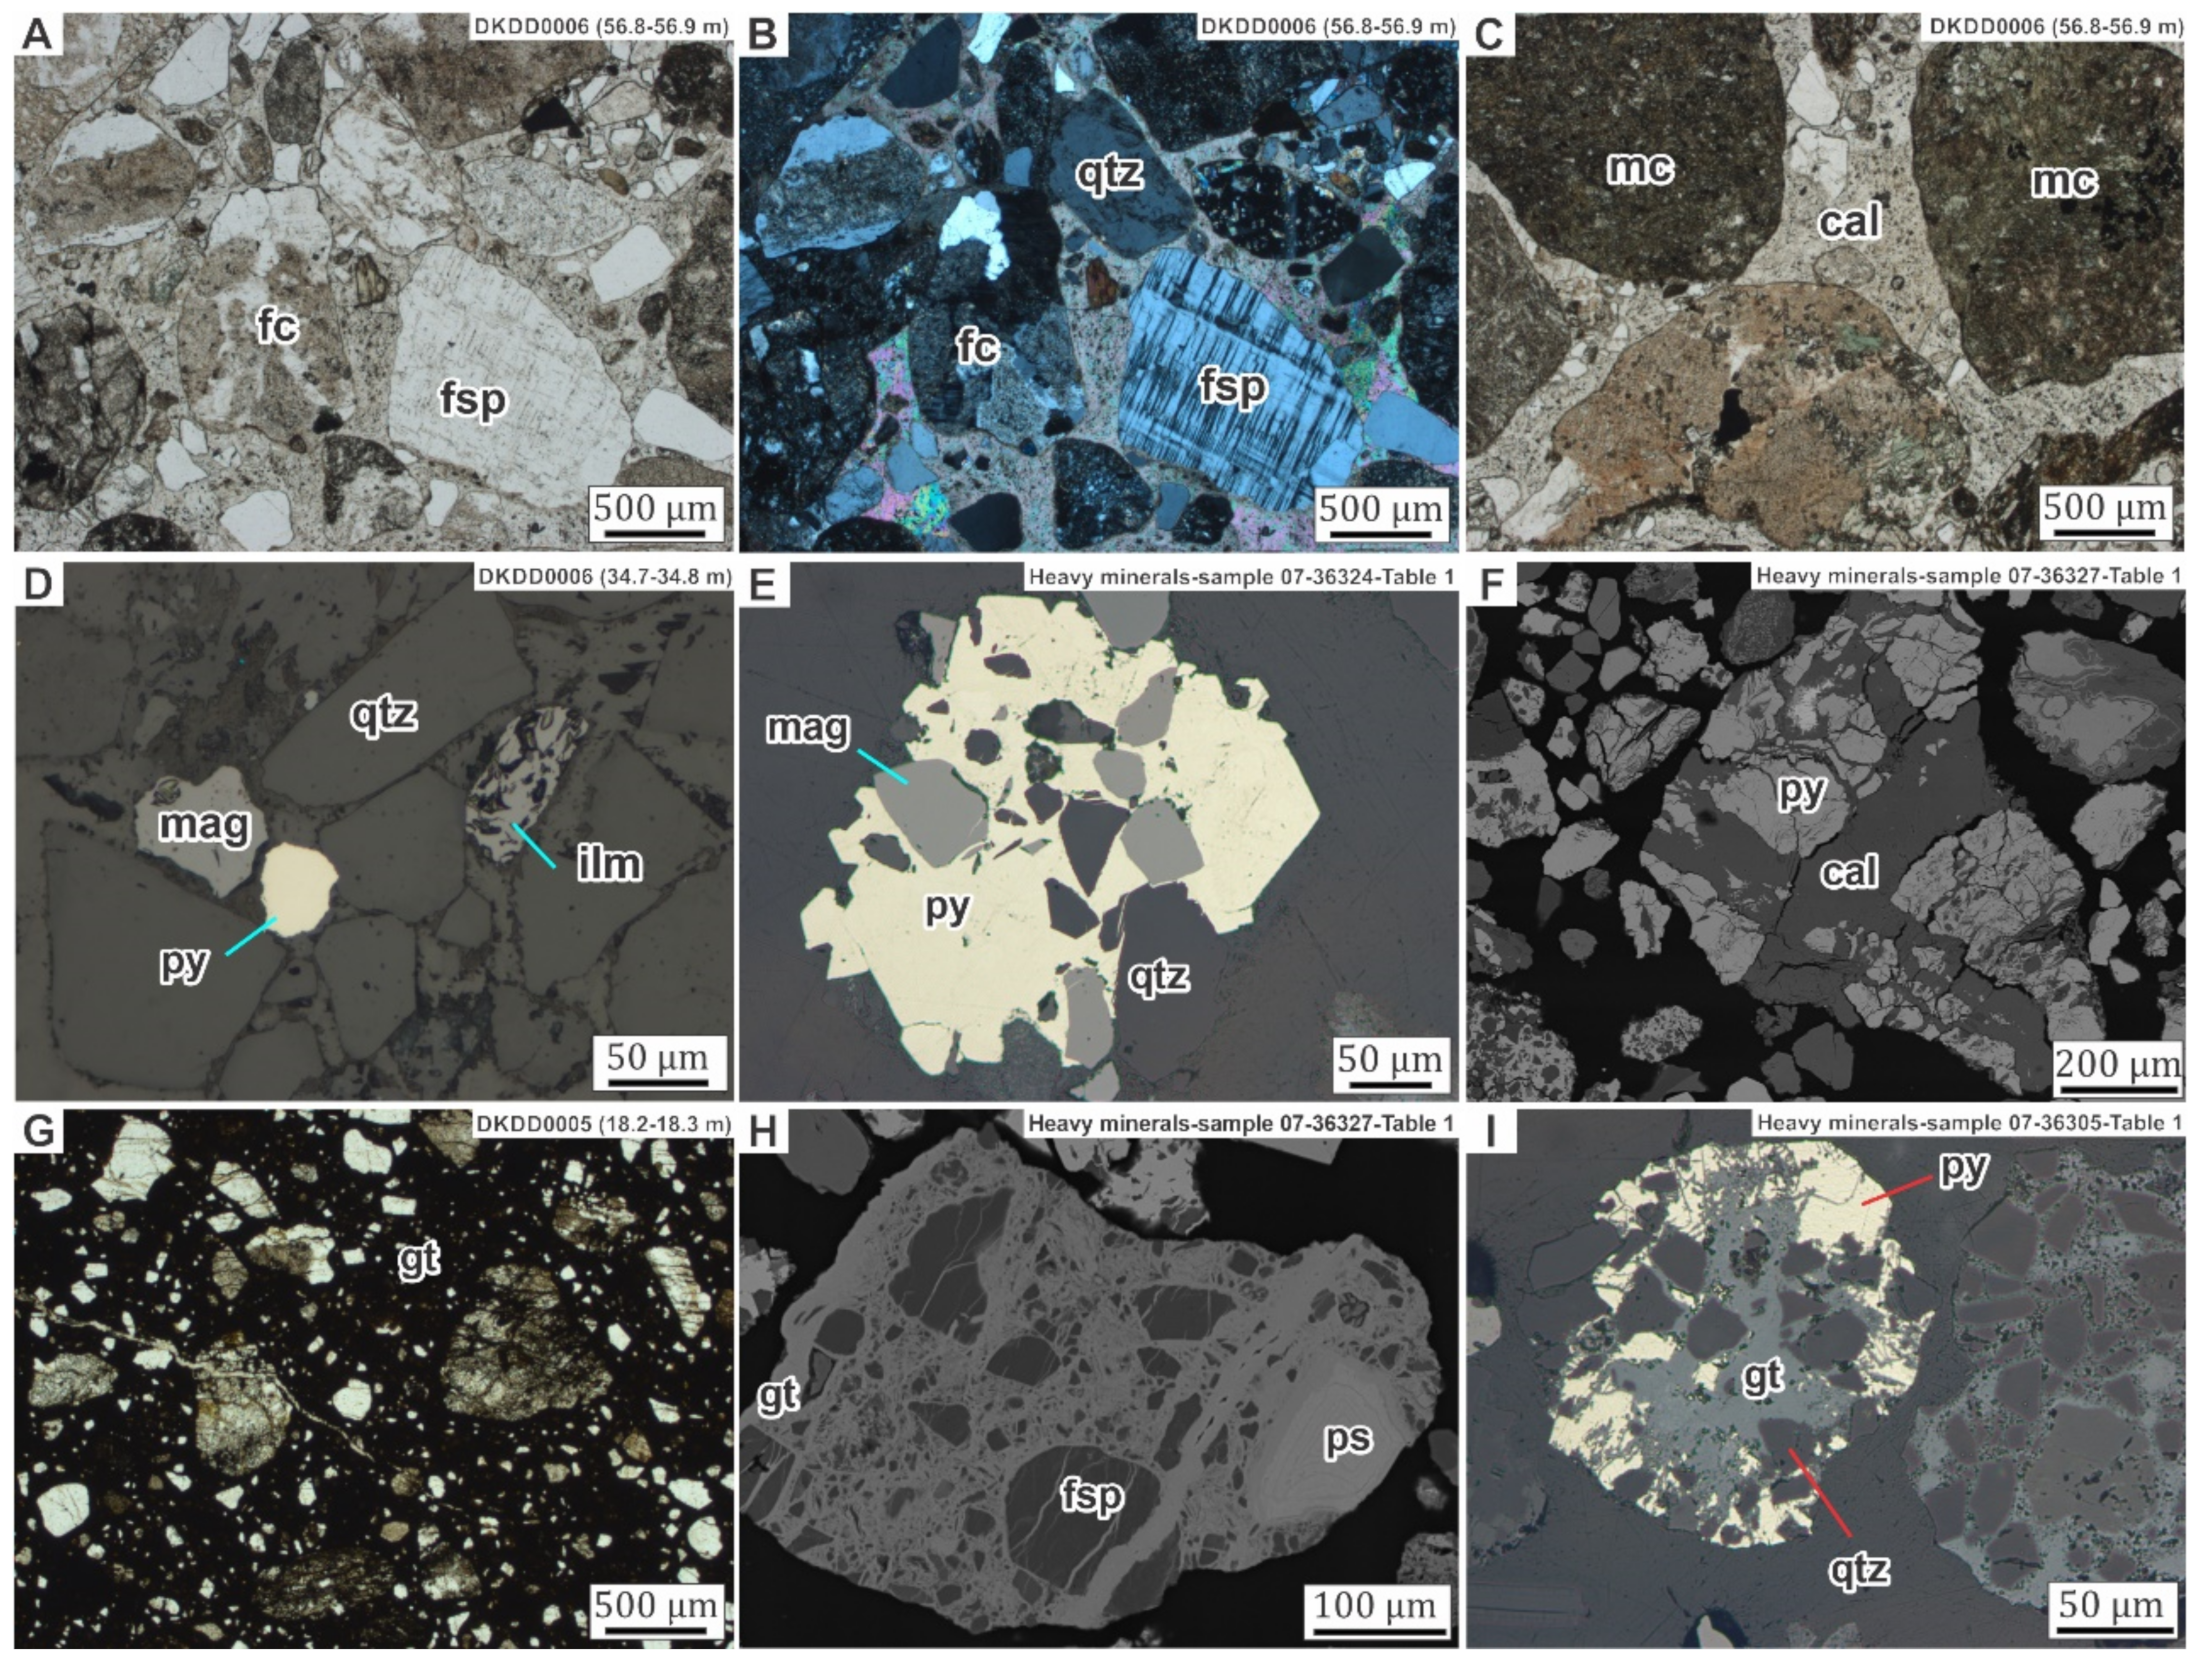
4.2. Petrography and Mineralogy of the Permian Cover

The matrix of diamictites is composed of angular and rounded quartz, feldspars, and ferromagnesian minerals (biotite, amphiboles, pyroxenes, and serpentine minerals (Figure 5A–C)). Opaque heavy minerals (e.g., pyrite, chalcopyrite and sphalerite, chromite, magnetite, and Mn-rich ilmenite) occur as free detrital grains (Figure 5D) or are hosted within mafic rock clasts, whilst non-opaque heavy minerals (e.g., zircon, apatite, monazite, and garnet) are hosted in felsic rock clasts. The framework and matrix components of the lower calcareous diamictites are cemented by chlorite and smectite, calcareous cement (zoned, euhedral or subhedral, rhombic ferroan dolomite, and ankerite), and sulfide cement (framboidal and massive pyrite) (Figure 5E,F).
The ferruginous diamictites are moderately to deeply weathered. Feldspars and ferromagnesian minerals form the framework, and the matrix components are partially to completely altered to authigenic clays (smectite and kaolinite) and ferruginous and manganiferous cement (Figure 5G,H). The ferruginous and manganiferous cement is precipitated as colloform goethite and psilomelane in cavities and parallel to, or cross-cutting, the bedding plane (Figure 5H). Carbonate cement is dissolved in the ferruginous diamictites. Detrital and cemented sulfides are oxidized and converted to goethite (Figure 5I).
Figure 6A–D and Table S2 show the semi-quantitative XRD analyses of the Permian sediments and the underlying basalt from drill dole DKRC0061. The quartz content ranges from approximately 5% to 55% in the Permian sediments.
Kaolinite reaches up to ~50% in the upper, strongly ferruginized diamictites; decreases to <1% in the lower, weakly ferruginized part of the weathered diamictites; and is absent in the fresh calcareous diamictites (Figure 6A). Goethite increases in the strongly ferruginous diamictites (up to 10%) and is absent in the calcareous diamictites and basalt. Muscovite is abundant (up to ~42%) in the ferruginous diamictites, decreases in the calcareous diamictites (up to 2%), and increases again along the unconformity and in the underlying basalt (up to ~18%). Chlorite, actinolite, and calcite are mainly concentrated in the fresh calcareous diamictites and the underlying basalt. Chlorite reaches up to ~50% at the base of the Permian sediments in contact with basalt, whereas actinolite and calcite are up to 6.5% and 7%, respectively. Plagioclase (albite) and alkali feldspars (microcline) are more abundant in the unweathered calcareous diamictites and the lower, weakly ferruginized part of the Permian diamictites. Both minerals are absent in the upper, strongly ferruginized diamictites. Microcline reaches up to ~41% in the upper part of the weakly ferruginized diamictites and is absent in basalt, whereas albite reaches up to ~58% near the base of the unweathered calcareous diamictites. The thinly laminated siltstones capping the Permian sediments consist mainly of quartz (~20%–40%), kaolinite (~5%–20%), muscovite (~30%–45%), and microcline (~10%–25%) (Table S2).

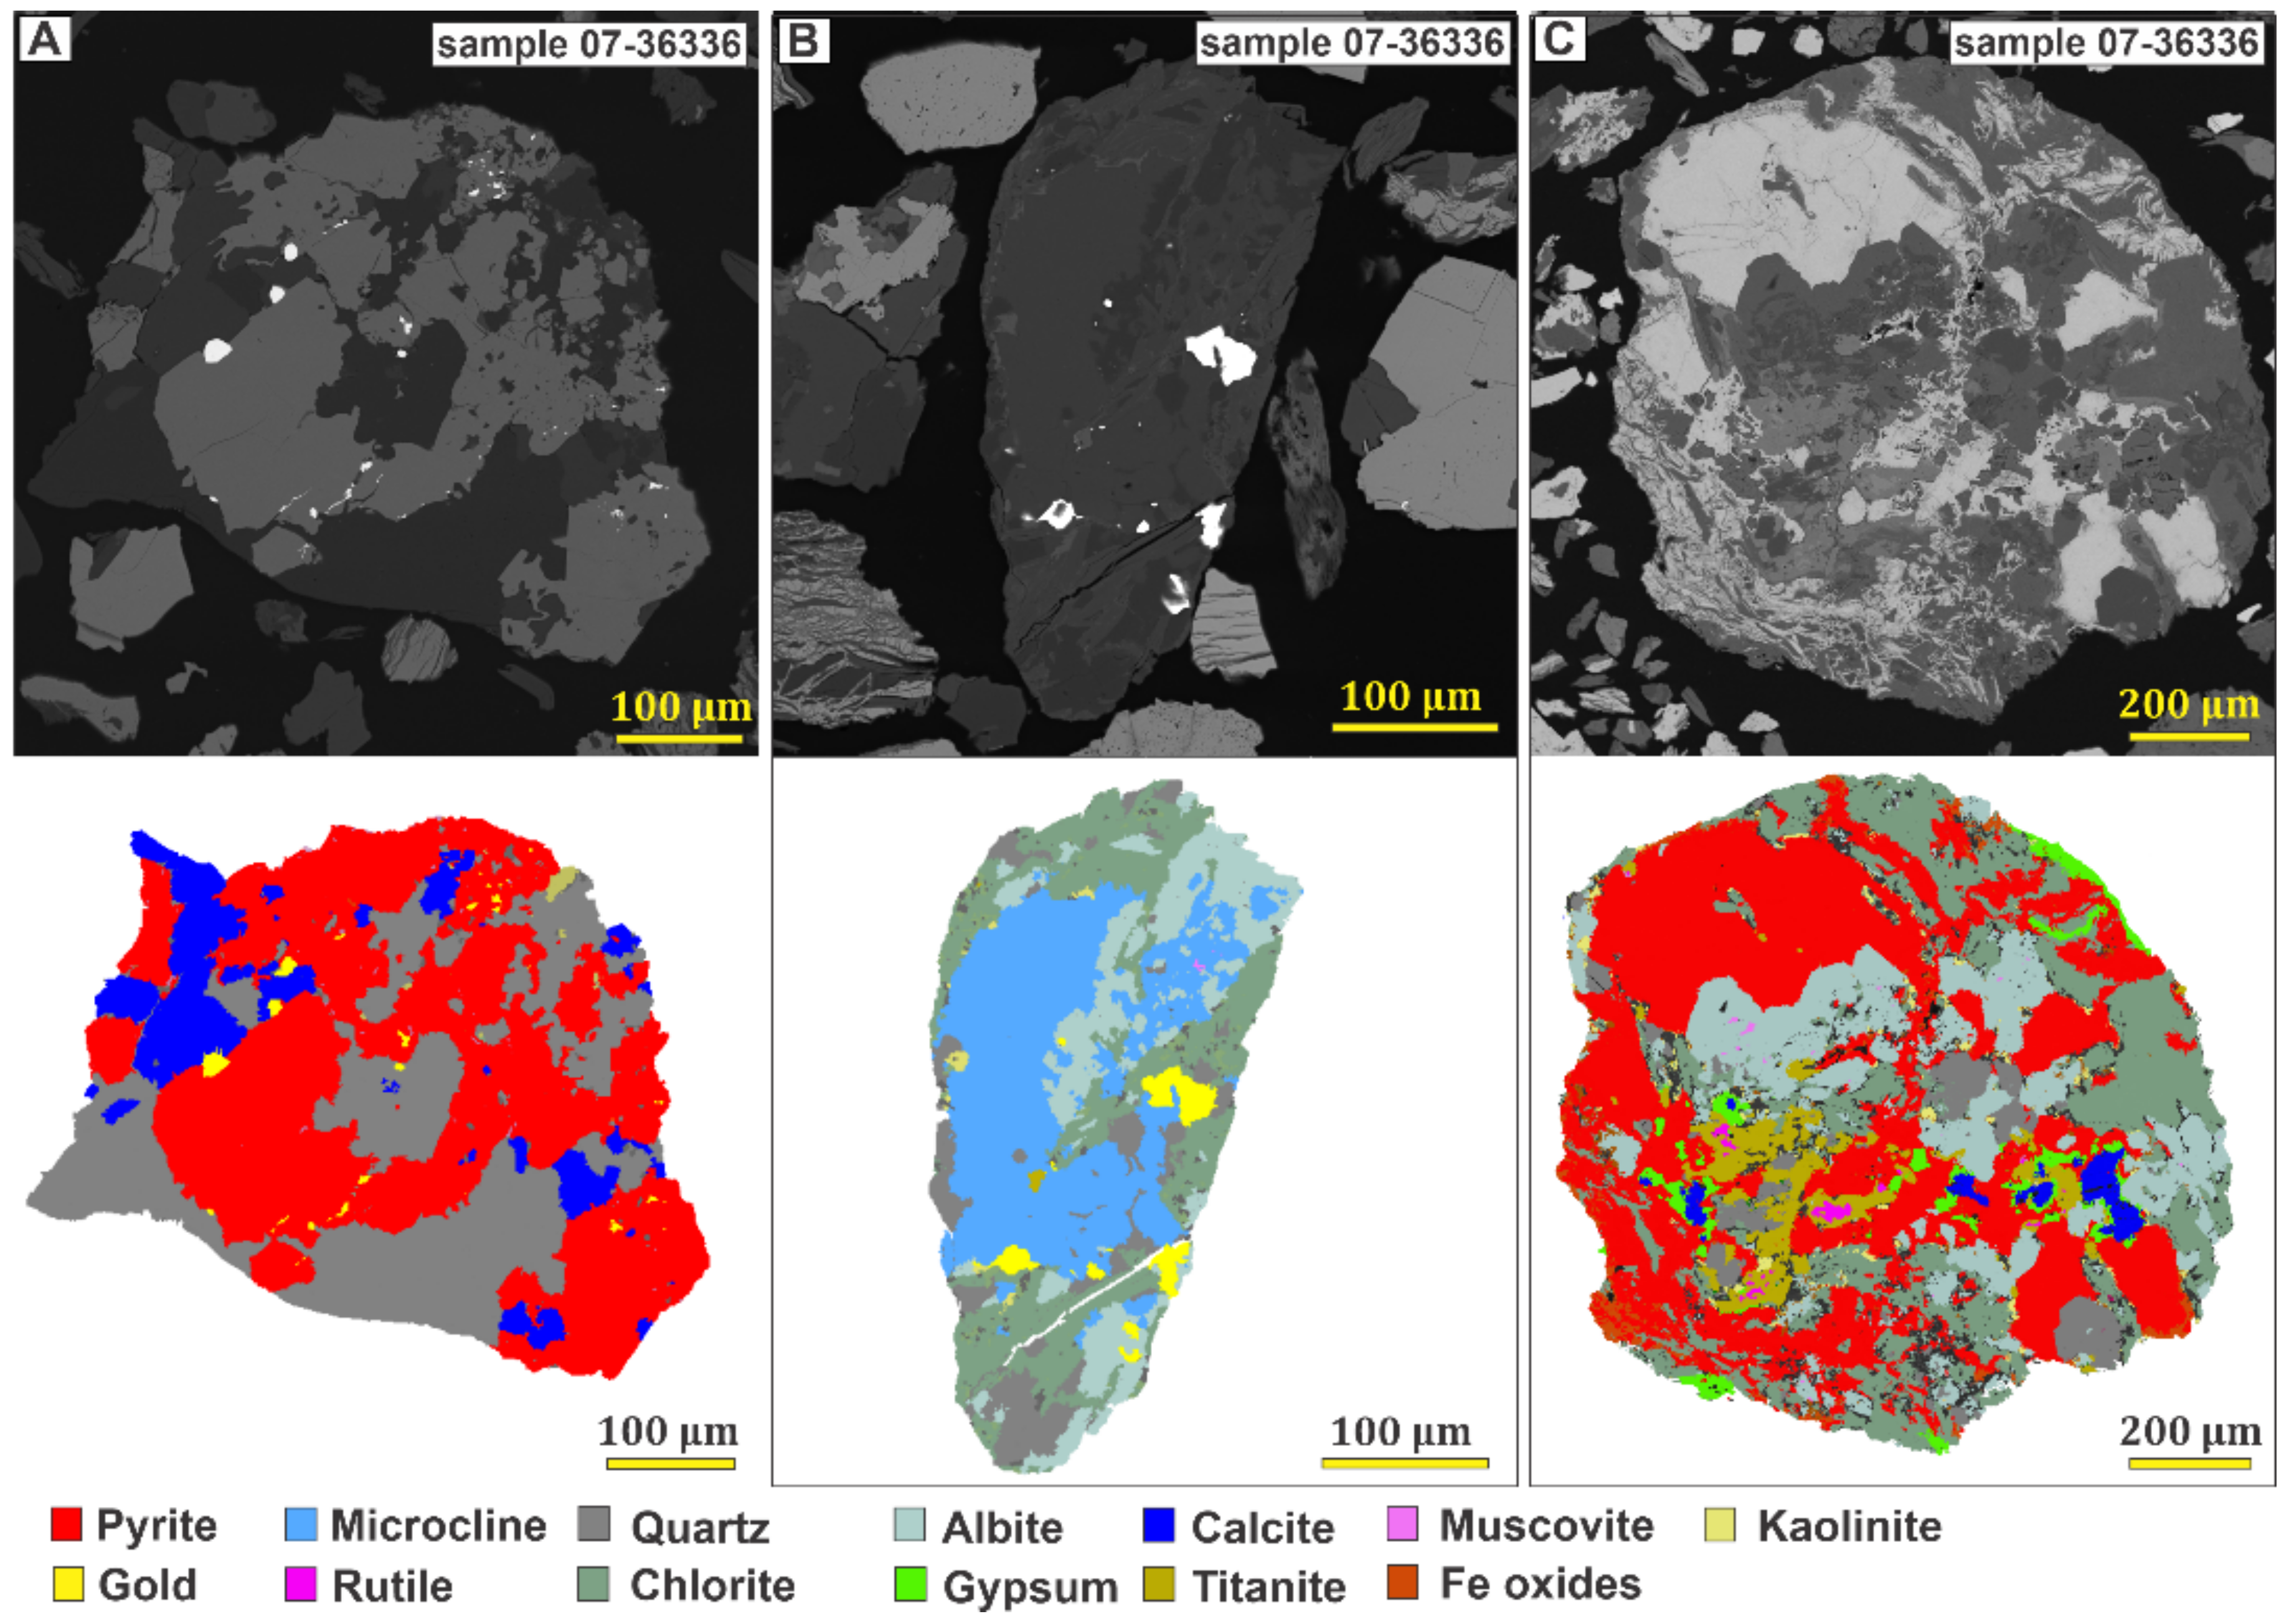
4.3. Mineralogy and Geochemistry of the Ore Zone

The XRD analyses of three bulk samples from the ore zone (drill hole DKRC0051; 155–158 m) showed that pyrite is the main sulfide mineral (up to 6.2%), whereas the main gangue minerals of the host basalt are quartz (19%–29%), chlorite (22%–35%), calcite (9%–25%), plagioclase (9%–23%), actinolite (1%–2%), microcline (3%–5%), and gypsum (1%–4.5%) (Table S2).
TIMA SEM mapping and semi-quantitative analyses of heavy minerals separated from these ore samples (07-36334, 07-36335, and 07-36336) are presented in Figure 7 and Figure 8 and Table S3, and the statistical analyses of the reported grain size are presented in Table 1. Sulfide minerals vary from ~50% to 75% and are dominated by pyrite (~20%–45%), pyrrhotite (~20%–35%), arsenopyrite (up to ~5%), chalcopyrite (~1%–2%), cobaltite (up to ~2.8%), and gersdorffite (up to ~1.3%) and traces (<0.5%) of galena, sphalerite, pentlandite, and scheelite (Table S3). Pyrite is mostly anhedral, and rarely subhedral or euhedral, in shape and up to ~980 µm (average 21 µm) in length (Figure 7 and Figure 8; Table S3; Table 1). Pyrite typically occurs as composite grains and is intimately associated with quartz, calcite, chlorite, rutile, titanite, and sericite (Figure 9A–C). Pyrrhotite and arsenopyrite occur as free euhedral or subhedral grains of up to 710 and 370 µm (average 6 and 51 µm) in length, respectively (Figure 7 and Figure 8; Table 1). Chalcopyrite is subhedral or anhedral in shape and exists as free grains and as composite grains with pyrite, gold, and pyrrhotite (Figure 7 and Figure 8). It reaches up to 306 µm (average 16 µm) in length (Table 1). Sphalerite is euhedral or subhedral in shape, up to 180 µm (average 14 µm), and occurs as free grains or intergrown with pyrite, chalcopyrite, albite, chlorite, quartz, and ilmenite (Figure 8). Galena is up to 6 µm (average 3 µm) and occurs in close association with pyrite and sphalerite (Figure 8). Pentlandite, cobaltite, and gersdorffite are mainly present in sample 07-36334 and are euhedral or subhedral (Figure 7C,D and Figure 8). Pentlandite is up to 60 µm (average 8 µm) and mainly exists as inclusions in, or intergrown with, pyrrhotite, pyrite, and chalcopyrite (Figure 8; Table 1). Cobaltite is up to ~140 µm (average 25 µm) and gersdorffite is up to ~100 µm (average 25 µm) in length (Figure 8; Table 1). Scheelite occurs as subhedral grains and is up to ~85 µm (average 37 µm) (Figure 8; Table 1).
Gold is <1% in the ore samples and occurs as rare free grains or as cavity and vein filling in pyrite and chalcopyrite (Figure 7 and Figure 8; Table S3). Gold is up to ~110 µm (average 7 µm; Table 1) and EDX shows that it contains <5% Ag.
The maximum concentrations measured in the bulk rock of these three samples are 28.1 ppm Au, 5.4% S, 365 ppm As, 282 ppm Zn, 402 ppm Cu, 271 ppm Cr, 18 ppm Ag, 219 ppm Ni, 83.8 ppm Co, and 11 ppm Pb (Table 2). However, the intersected Au mineralization in drill hole DKRC0062 contains high concentrations of As, Cu, Zn, Cd, Mo, Ag, W, and Pb (Figure 10). The correlation coefficient displays a positive correlation (r2 > 0.5) between Au and As, Cu, Zn, Cd, Mo, Ag, W, Hg, Te, In, S, Sb, and Se (Table S1).

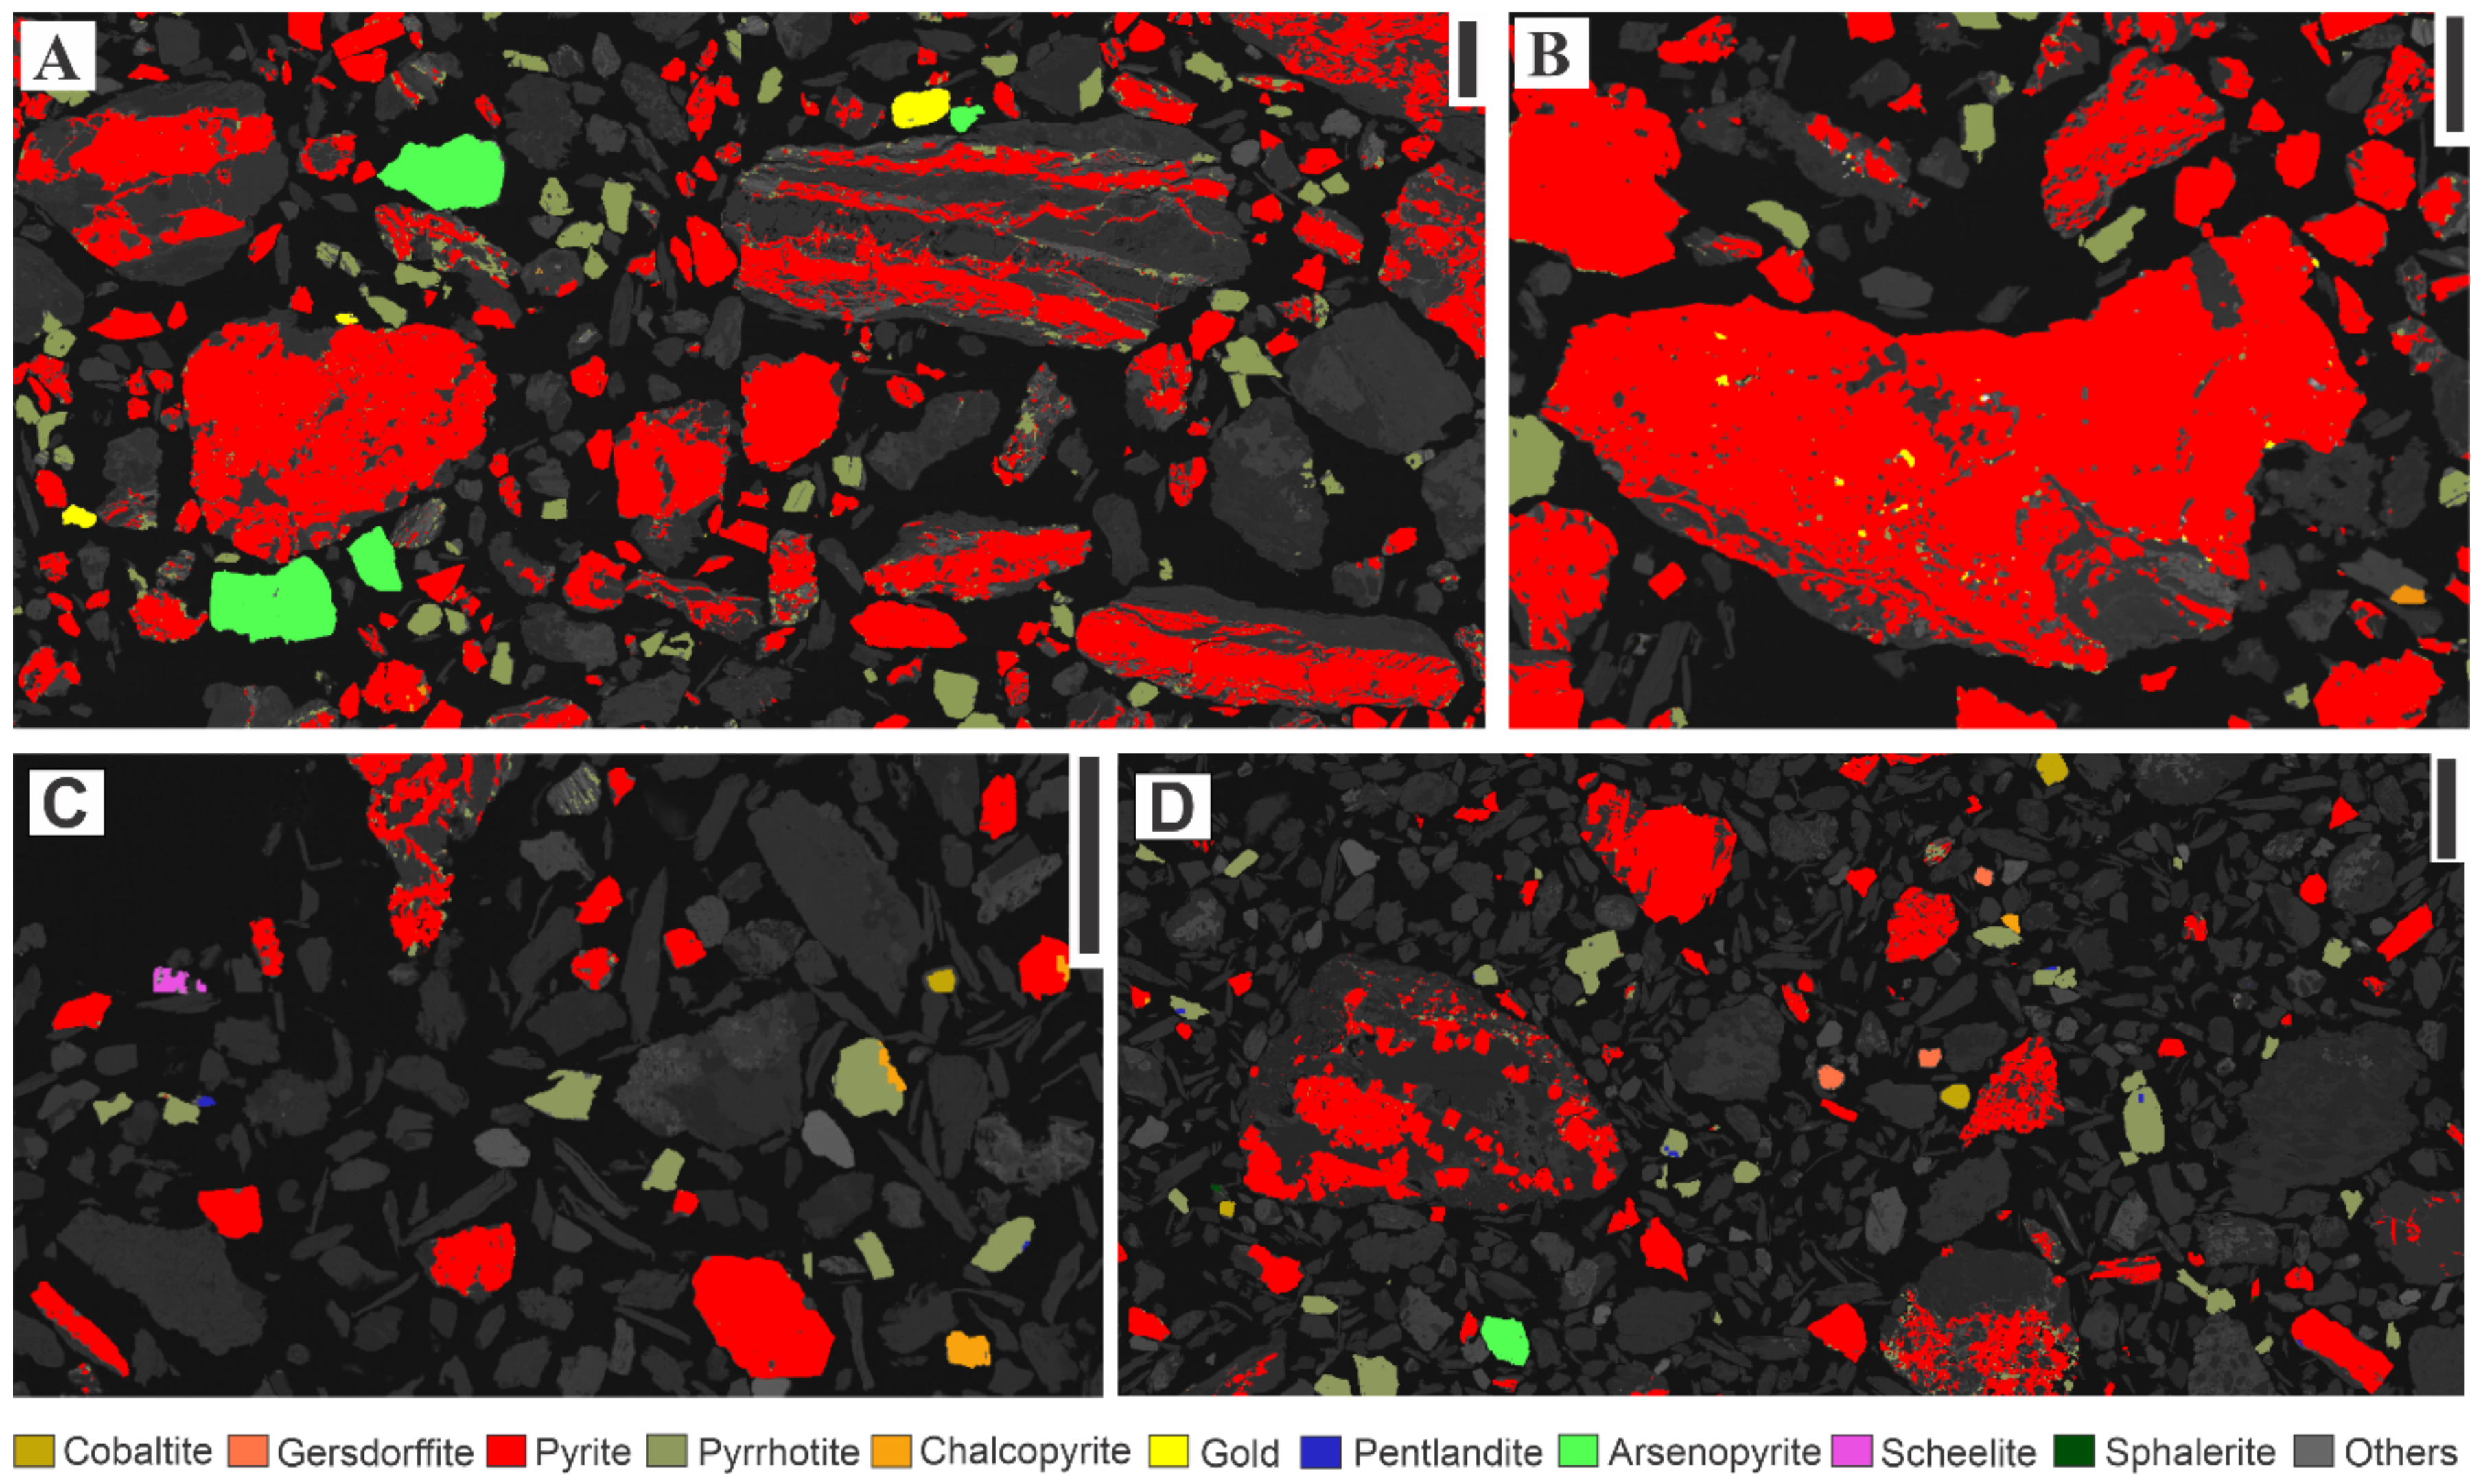
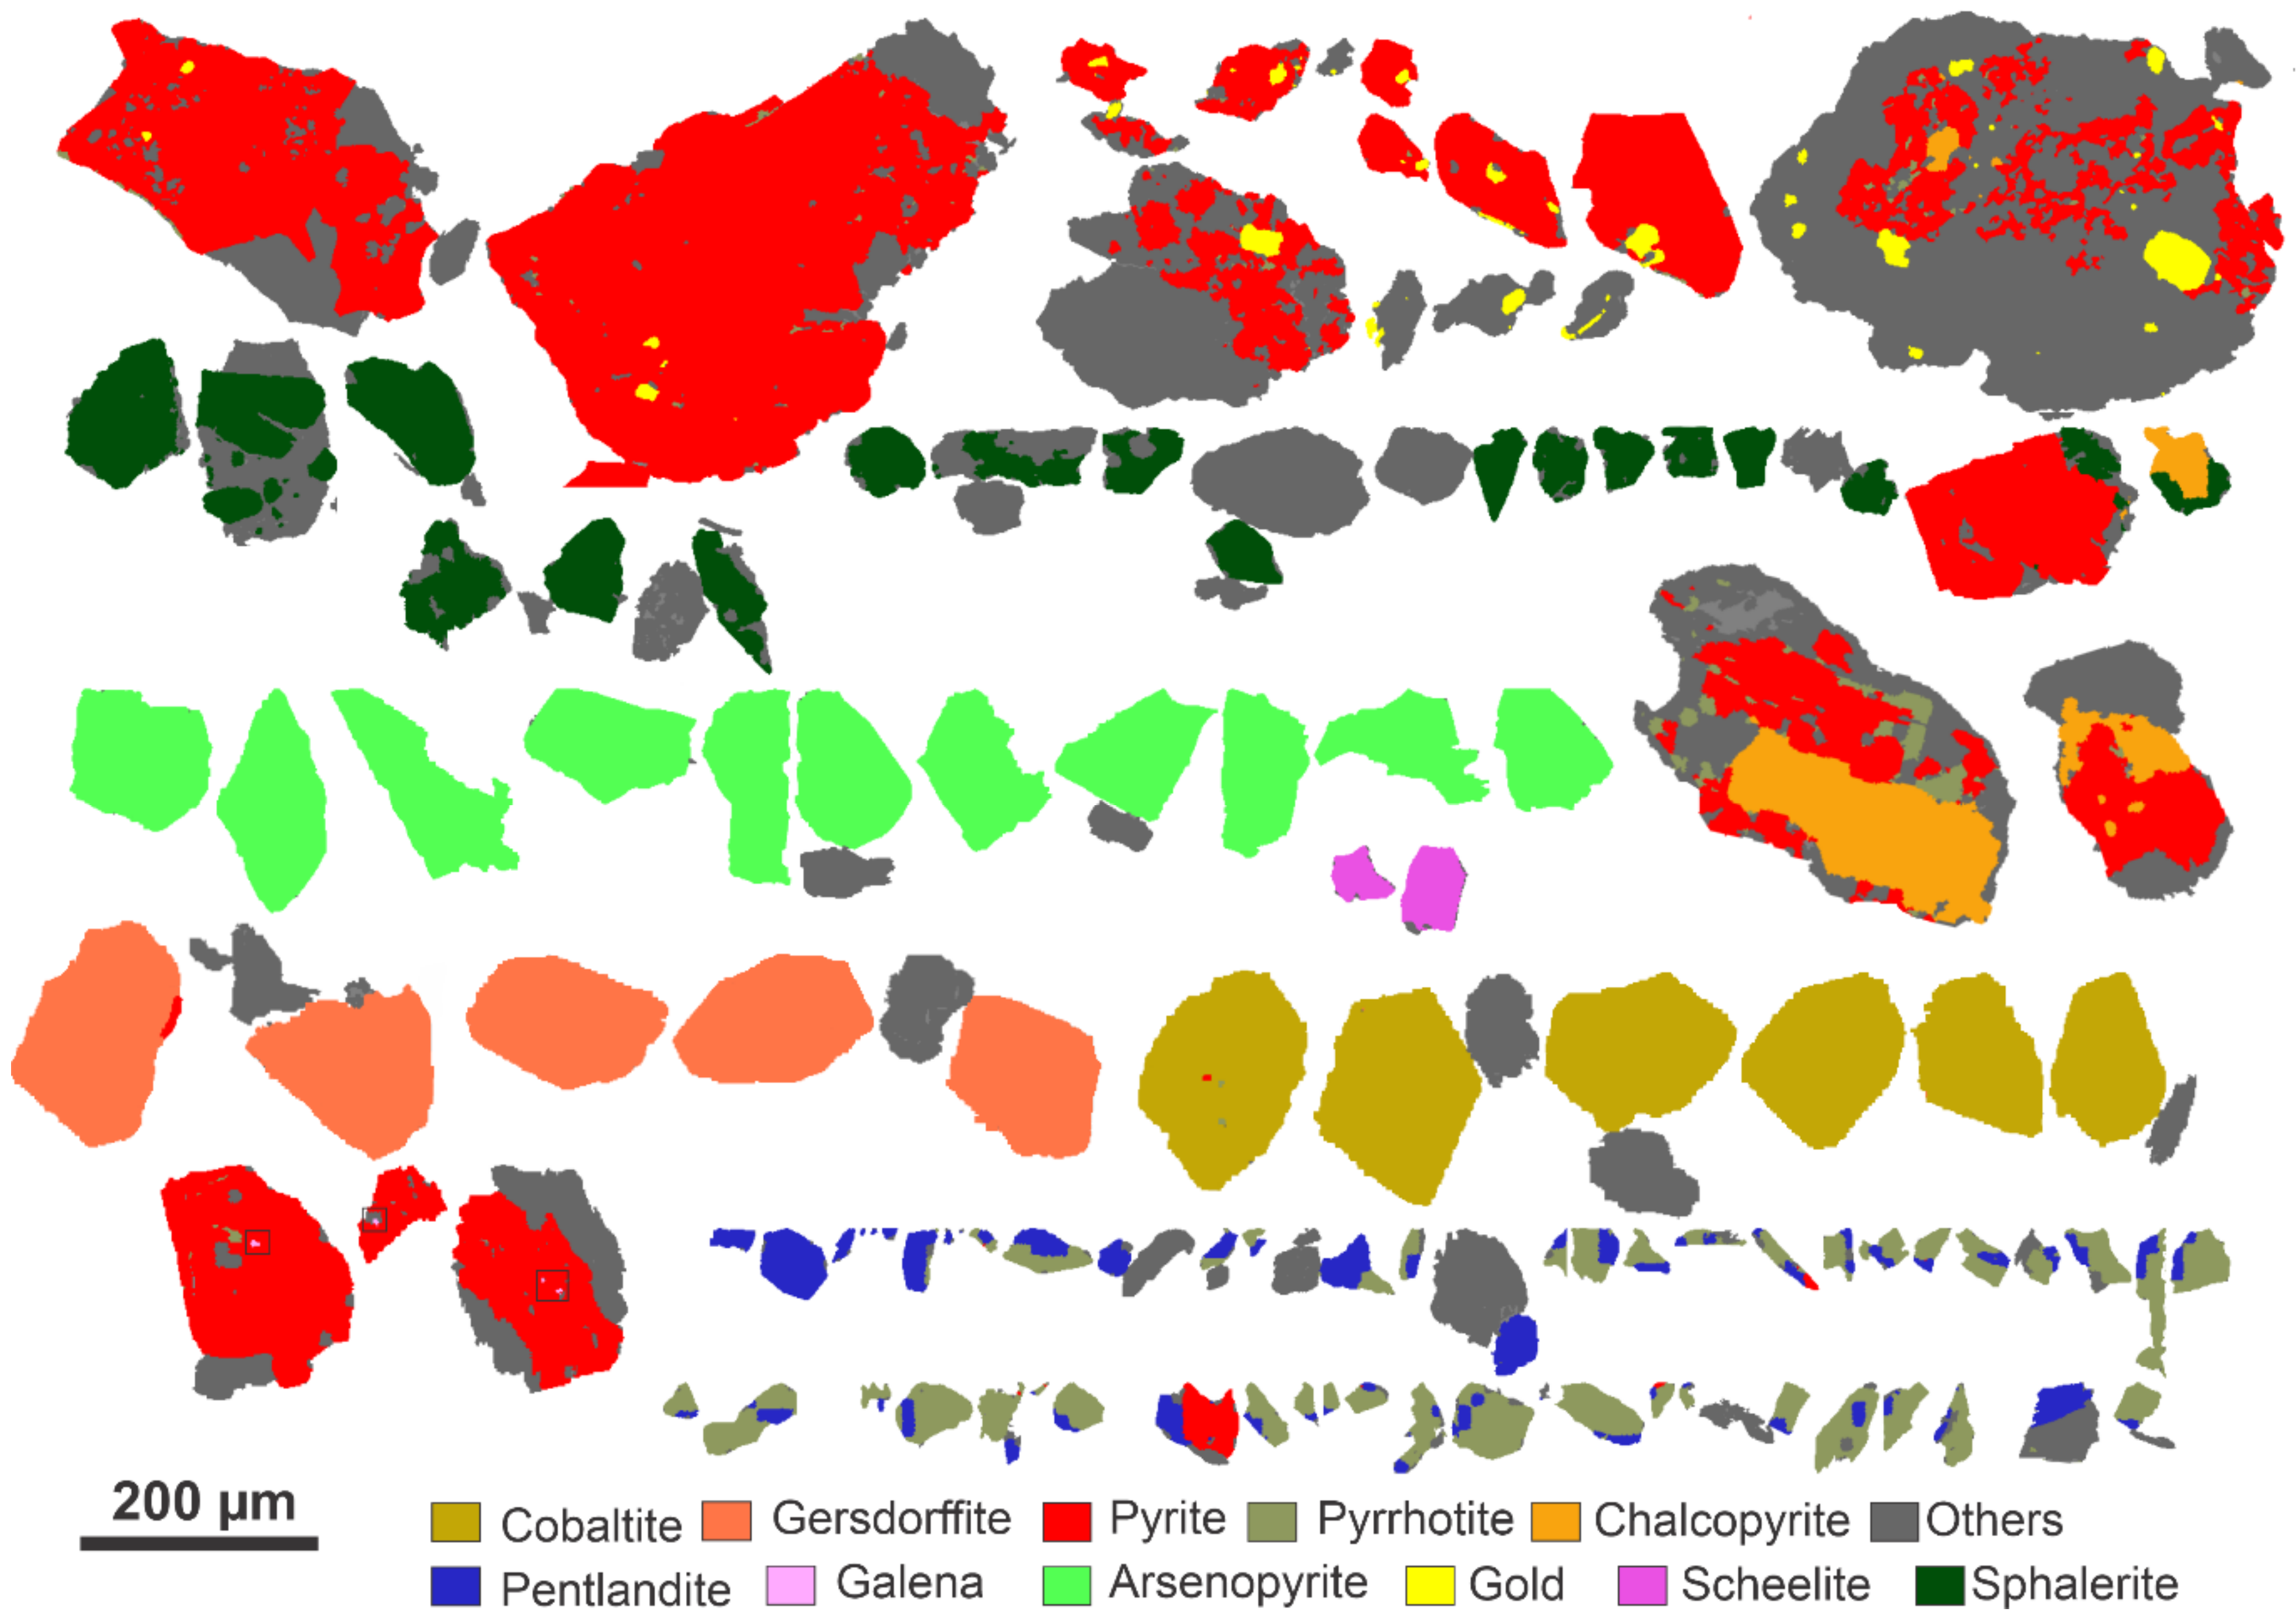
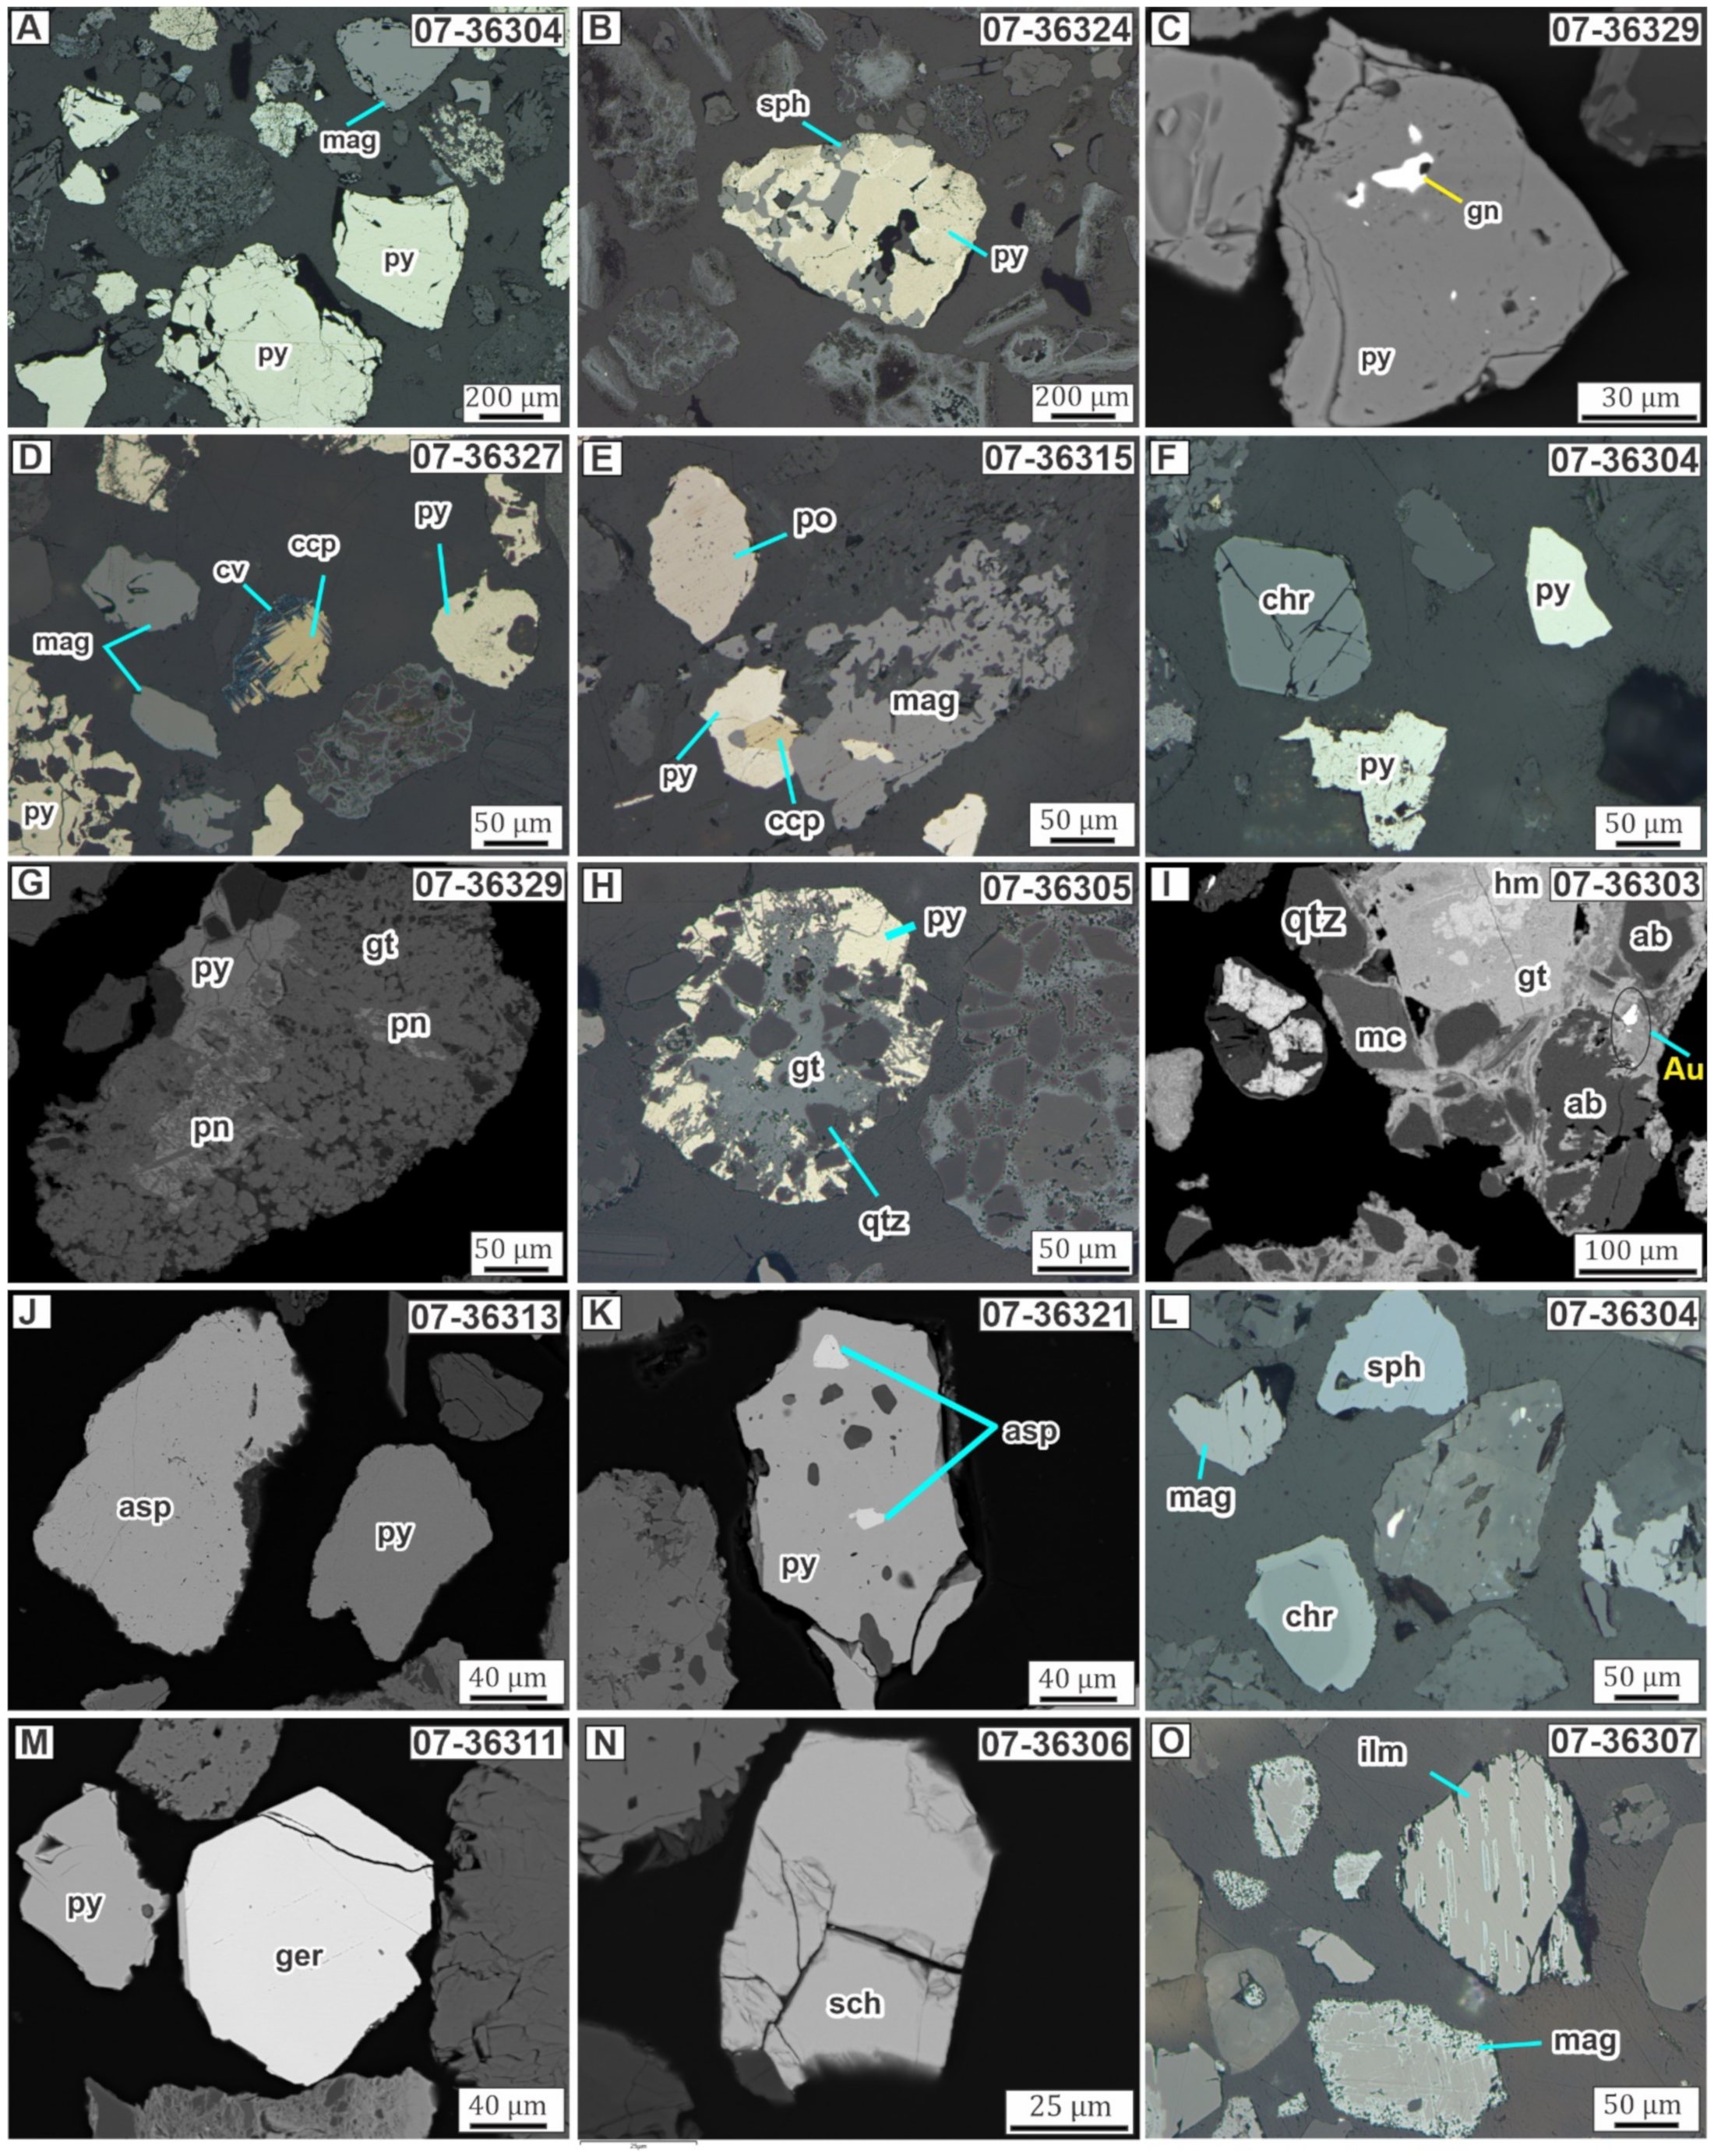
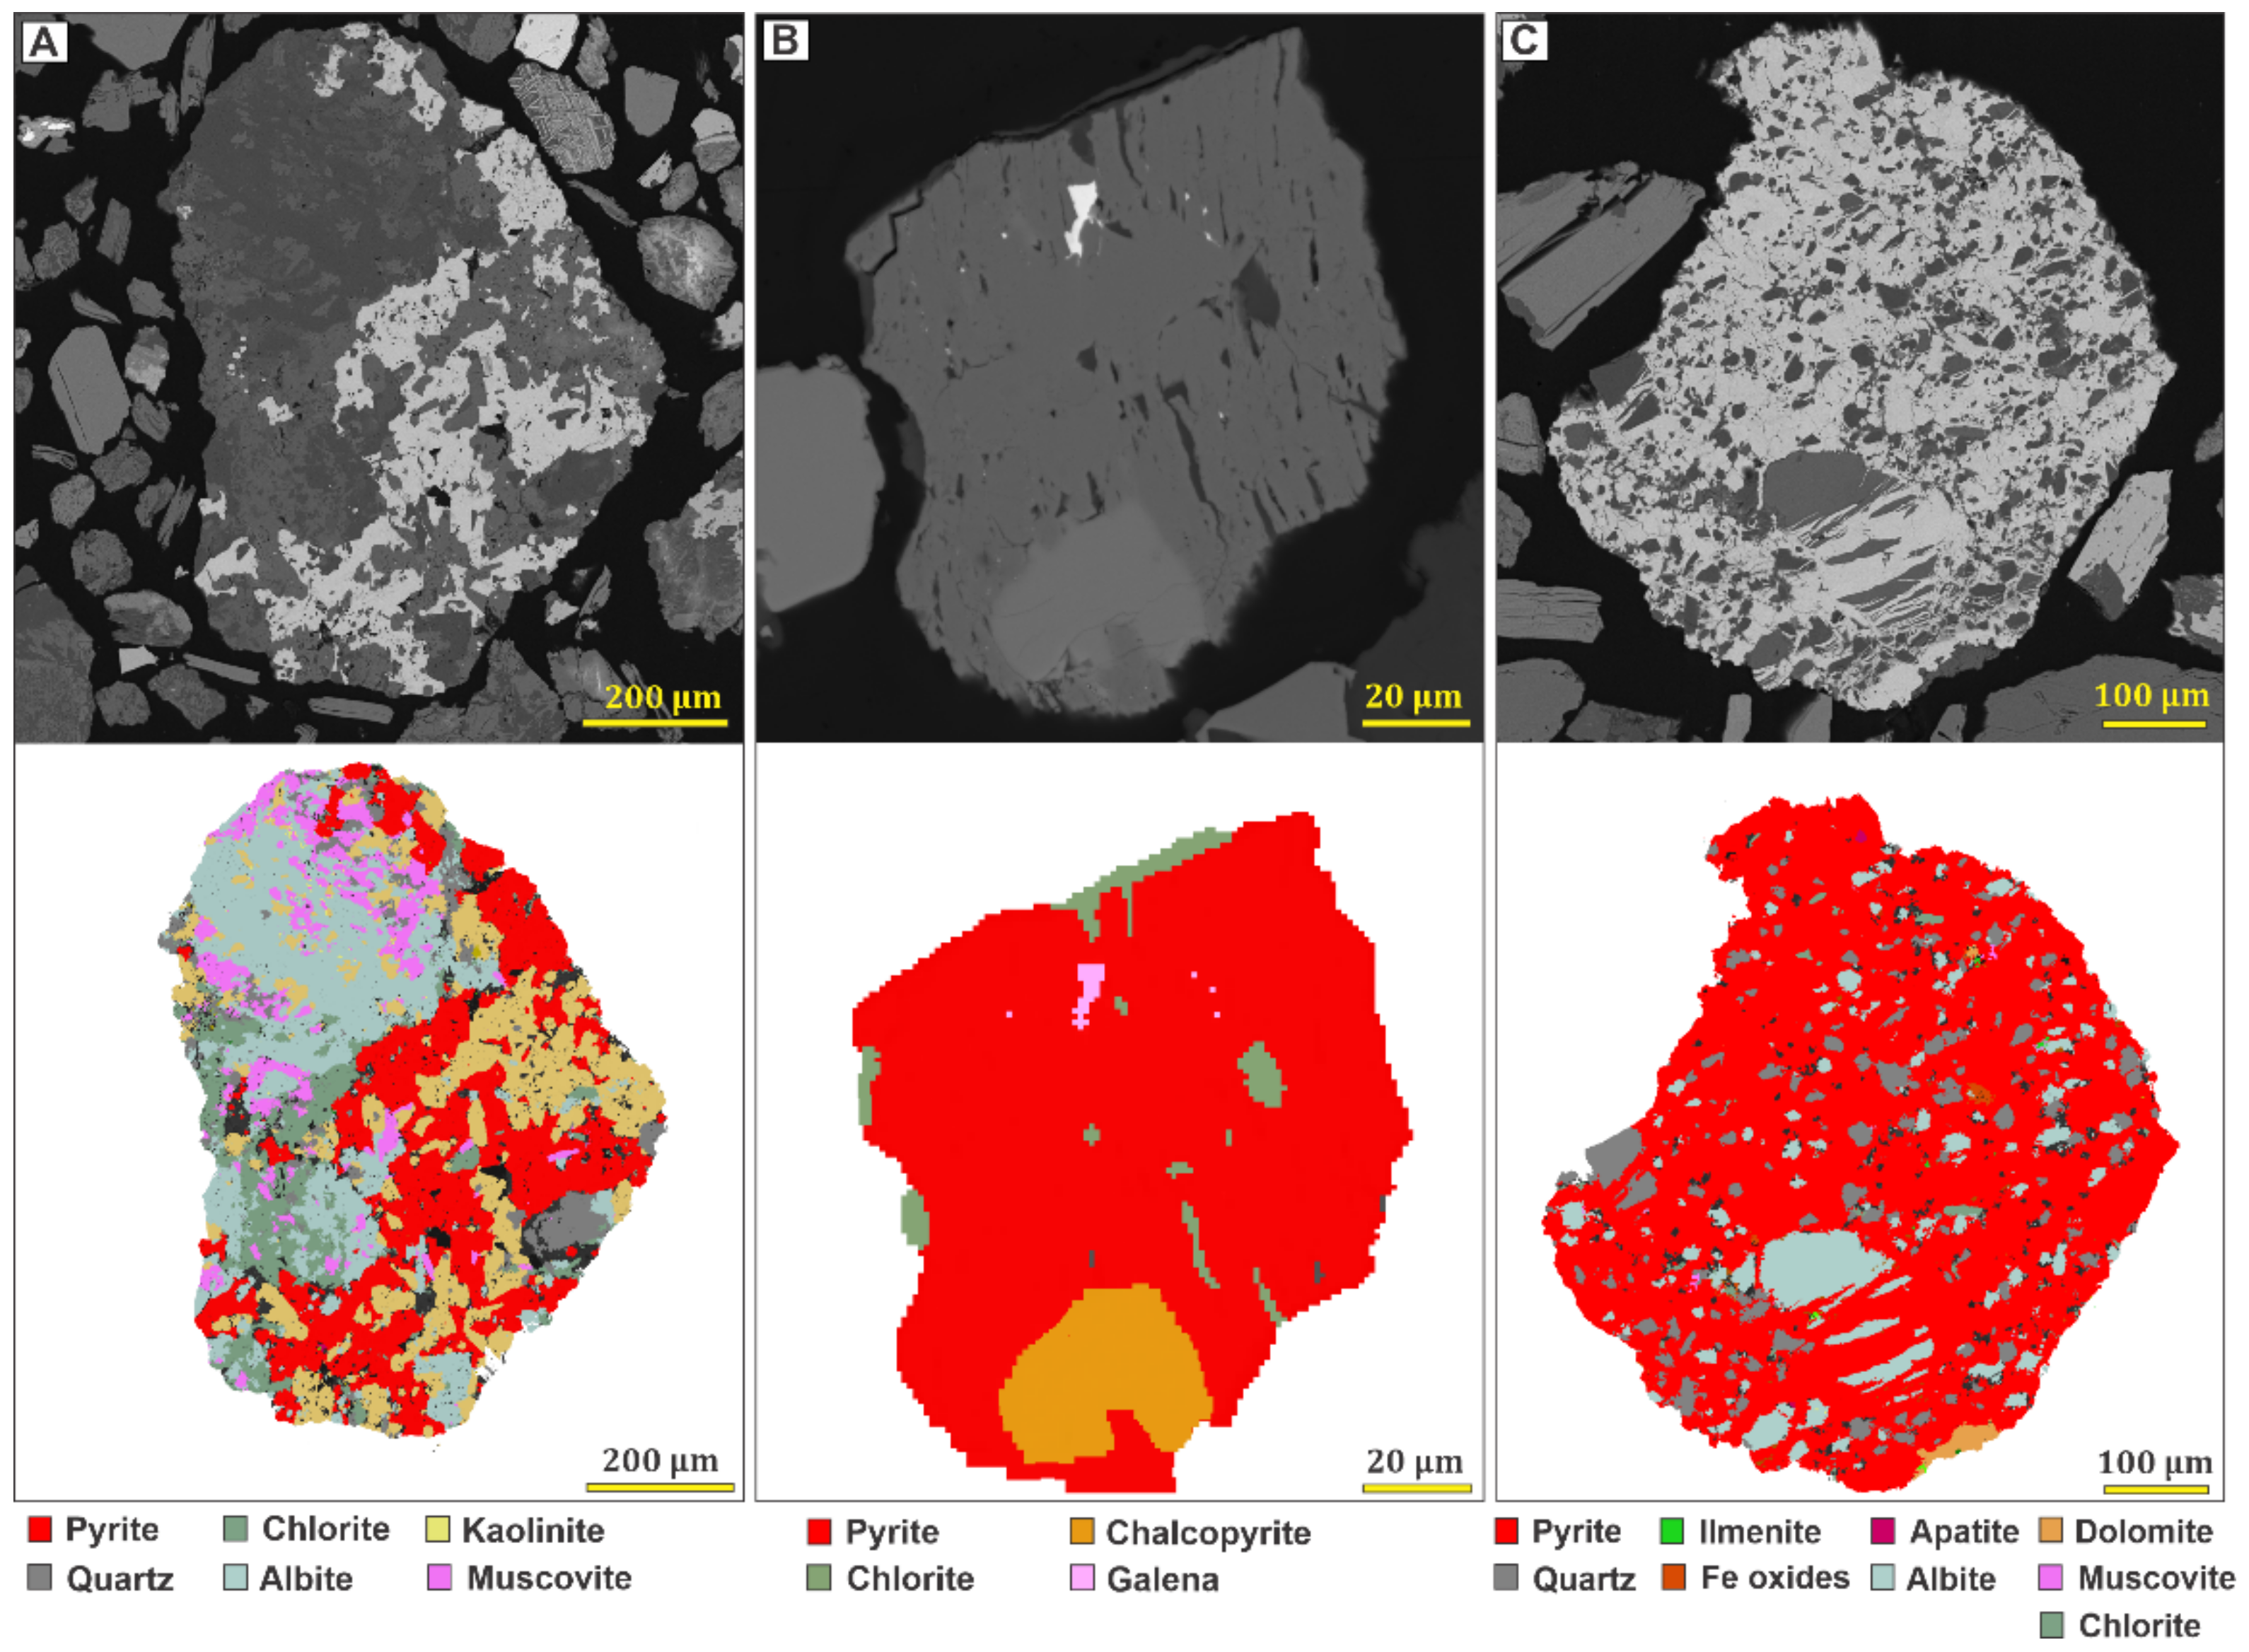
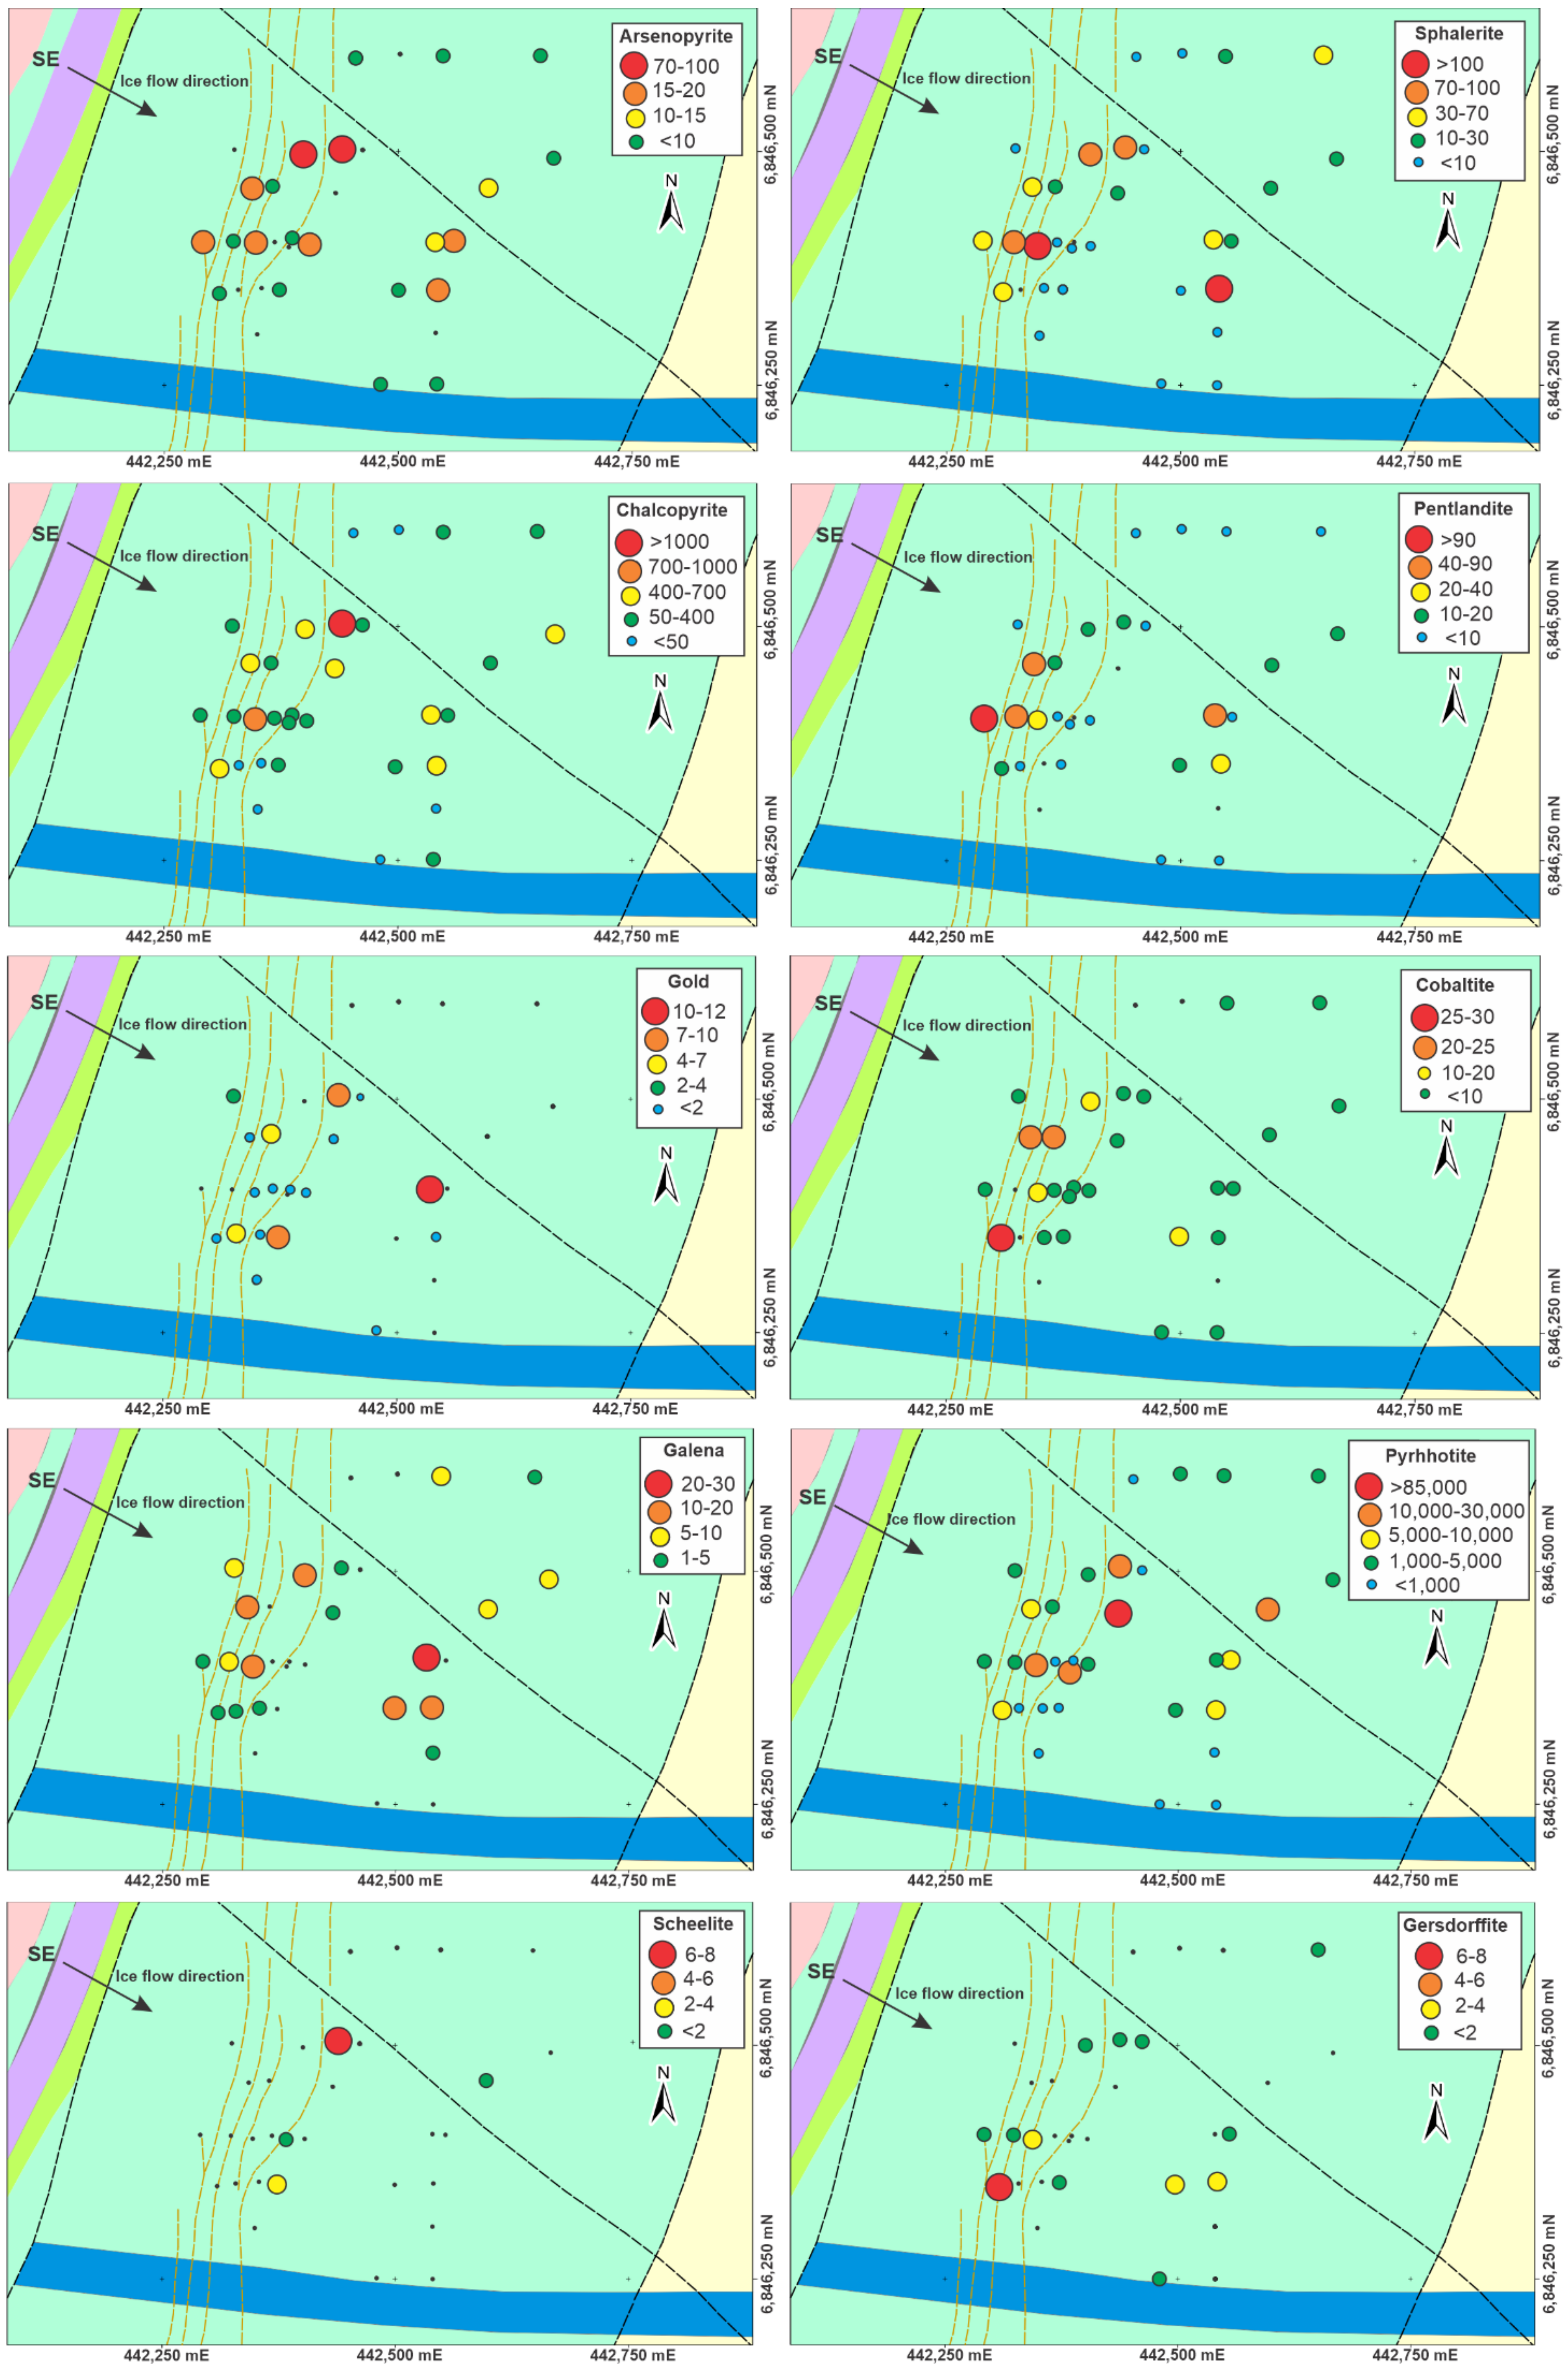
4.4. Heavy Minerals in the Permian Cover

Detrital sulfides are abundant in heavy mineral concentrates separated from the lowermost meter of the fresh calcareous diamictites, which occupy the topographic lows of the Permian–Archean unconformity under the water table. In topographic high areas of the Permian–Archean unconformity, where the water table is in direct contact with the basement rocks, diamictites are weathered (Figure 3). In oxidizing conditions, above the water table, detrital and diagenetic sulfides are altered to Fe and Mn oxides, and in reducing conditions, below the water table, they are altered to supergene sulfides, such as framboidal pyrite, bornite, covellite, and chalcocite.
The reported detrital sulfides and gold at the base of the Permian cover are similar in texture to those identified in the ore zone (Table 1). Pyrite and pyrrhotite are the most abundant sulfides in the cover and are present in all 33 samples (Table S3). Pyrite in the Permian diamictites is up to ~830 µm in length (average 18 µm) and mostly occurs as anhedral composite grains with pyrrhotite, chalcopyrite, quartz, calcite, and chlorite (Figure 11A–F, Figure 12 and Figure 13A,B; Table 1). Pyrite also occurs in a framboidal form and as a massive cement of detrital components, such as quartz and feldspars (Figure 13C). Pyrite is oxidized into goethite and hematite during weathering (Figure 11G–I). Pyrrhotite occurs mostly as liberated euhedral or subhedral grains of up to 305 µm in length (average 4 µm) (Figure 12; Table 1). It also occurs as composite grains with pyrite and chalcopyrite (Figure 12). Arsenopyrite occurs mostly as liberated euhedral or subhedral grains of up to ~230 µm in length (average 29 µm) (Figure 11J and Figure 12; Table 1). It rarely occurs as composite grains and inclusions in pyrite (Figure 11K). Chalcopyrite is up to 190 µm in length (average 9 µm), euhedral or subhedral in shape, and exists in both liberated and composite grains with pyrite, pyrrhotite, quartz, calcite, and sericite (Figure 11D,E and Figure 12; Table 1). Sphalerite is up to 180 µm in length (average 13 µm), euhedral or subhedral in shape, and exists in both liberated and composite grains with pyrite, chalcopyrite, galena, quartz, calcite, and sericite (Figure 11L and Figure 12; Table 1). Galena is up to ~25 µm in length (average 4 µm) and exists as euhedral or anhedral inclusions in pyrite, arsenopyrite, and sphalerite (Figure 11A, Figure 12 and Figure 13B; Table 1). Pentlandite is up to ~90 µm in length (average 6 µm), subhedral, and it occurs in composite grains within mafic clasts with pyrite, chalcopyrite, quartz, calcite, and chlorite (Figure 12; Table 1). Gersdorffite and cobaltite are up to ~55 and 100 µm in length (average 9 and 16 µm), respectively (Table 1). They mostly occur as liberated euhedral or subhedral grains (Figure 11M and Figure 12). Scheelite is up to ~85 µm in length and occurs mostly as liberated euhedral or subhedral grains (Figure 11N and Figure 12; Table 1). Gold is up to ~45 µm in length (average 4 µm) and occurs as inclusions in quartz and pyrite (Figure 11I and Figure 12; Table 1). Chalcocite, bornite, and covellite are secondary Cu sulfide minerals formed by the incipient alteration of chalcopyrite (Figure 11D and Figure 12; Table 1). Chalcocite and bornite are more common than covellite, and all are euhedral or subhedral in shape and exist in both liberated and composite grains with pyrite, pyrrhotite, quartz, calcite, and sericite.
Chromite, magnetite, and ilmenite are the main opaque oxide heavy minerals in the Permian diamictites displaying euhedral or subhedral shape (Figure 11A,D–F,L,O). These grains are liberated and in a composite form with ferromagnesian minerals in sulfide-bearing and sulfide-barren mafic–ultramafic clasts. The edges of magnetite are altered to hematite in the weathered diamictites, whereas ilmenite is altered to rutile and hematite. Chromite is stable in the unweathered and weathered diamictites and preserves metamorphic magnetite rims (Figure 11L). The non-opaque heavy minerals include zircon, apatite, monazite, and garnet and are hosted within the felsic rock clasts.
The spatial distribution of detrital gold and sulfides in heavy mineral concentrates in the Permian cover shows that gold, chalcopyrite, pyrrhotite, arsenopyrite, pentlandite, cobaltite, gersdorffite, sphalerite, and galena have elevated levels directly above the area of mineralization (Figure 14). The mineral particle counts include the free grains and the mineral inclusions (Figure 14). These values are normalized to the bulk sample weight (500–540 g) processed for heavy minerals, and the results are presented in Table S3. These minerals are also abundant to the southeast, in the down-ice direction, suggesting glacial dispersal in this direction (Figure 14). Scheelite in the Permian cover is concentrated at the eastern edge of the mineralization (Figure 14).

4.5. Whole-Rock Geochemistry of the Permian Cover

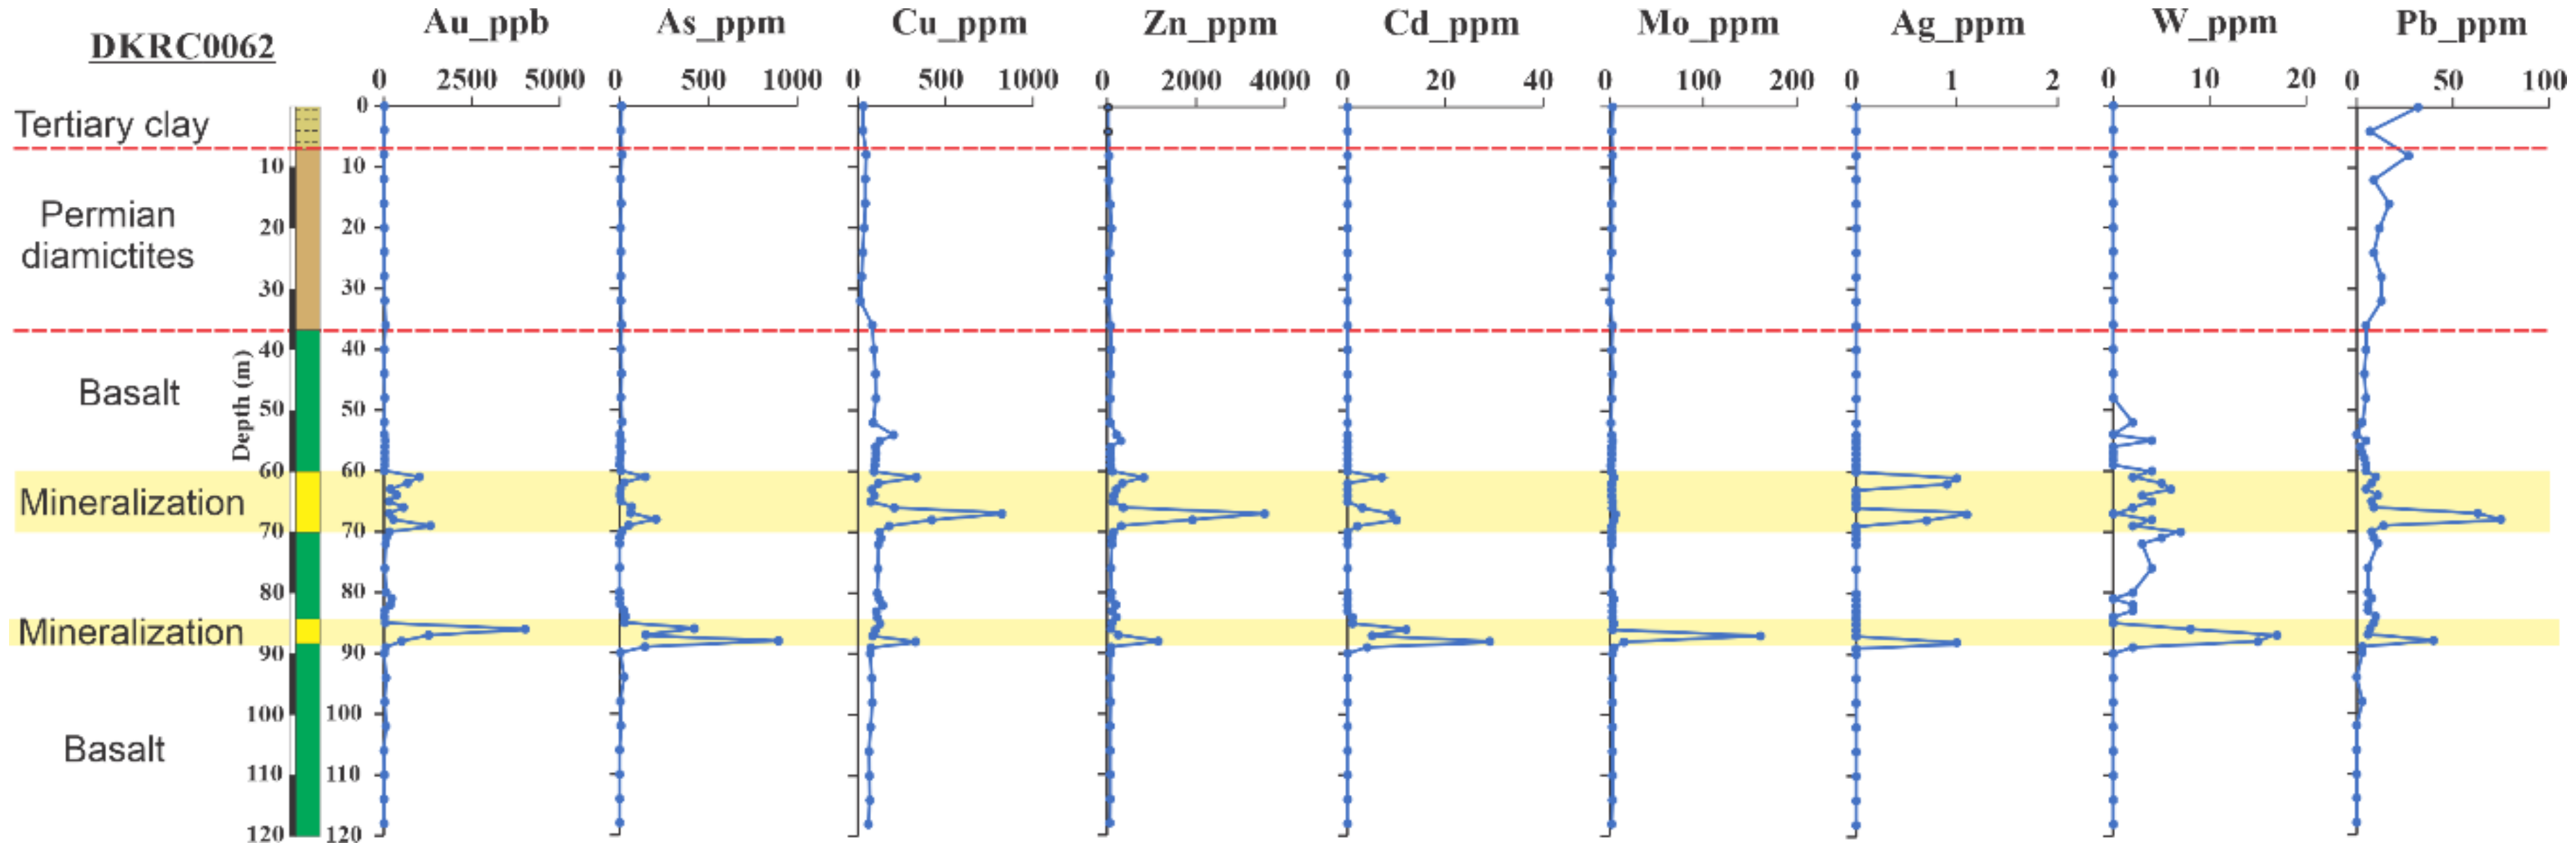
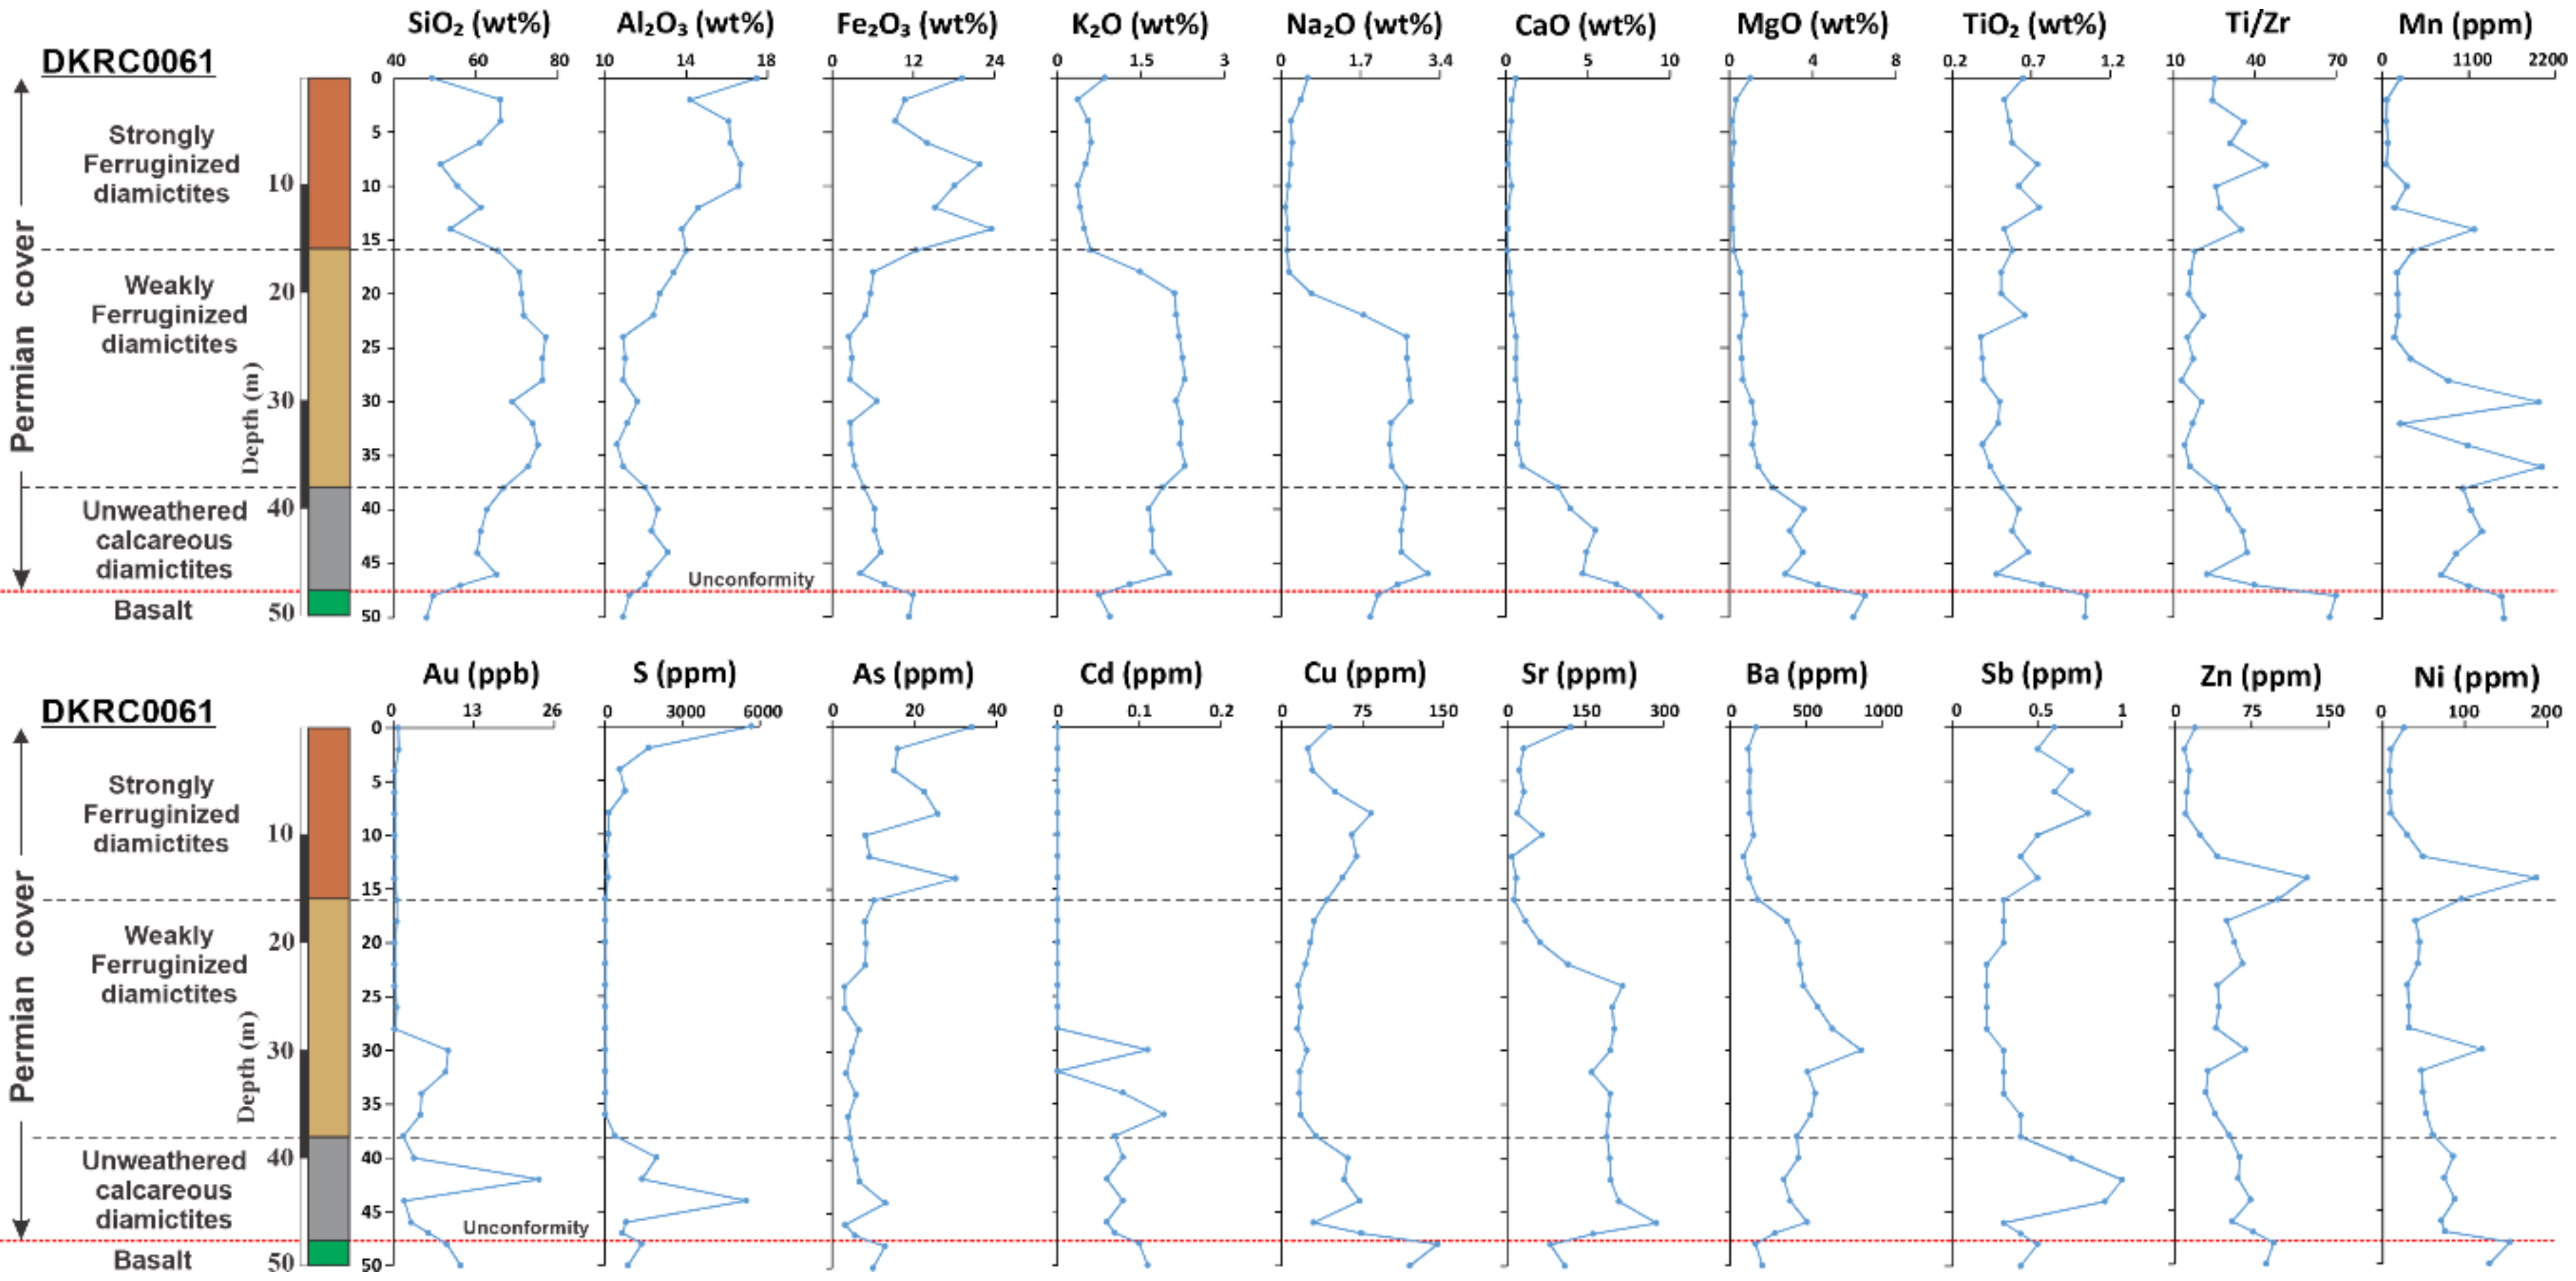
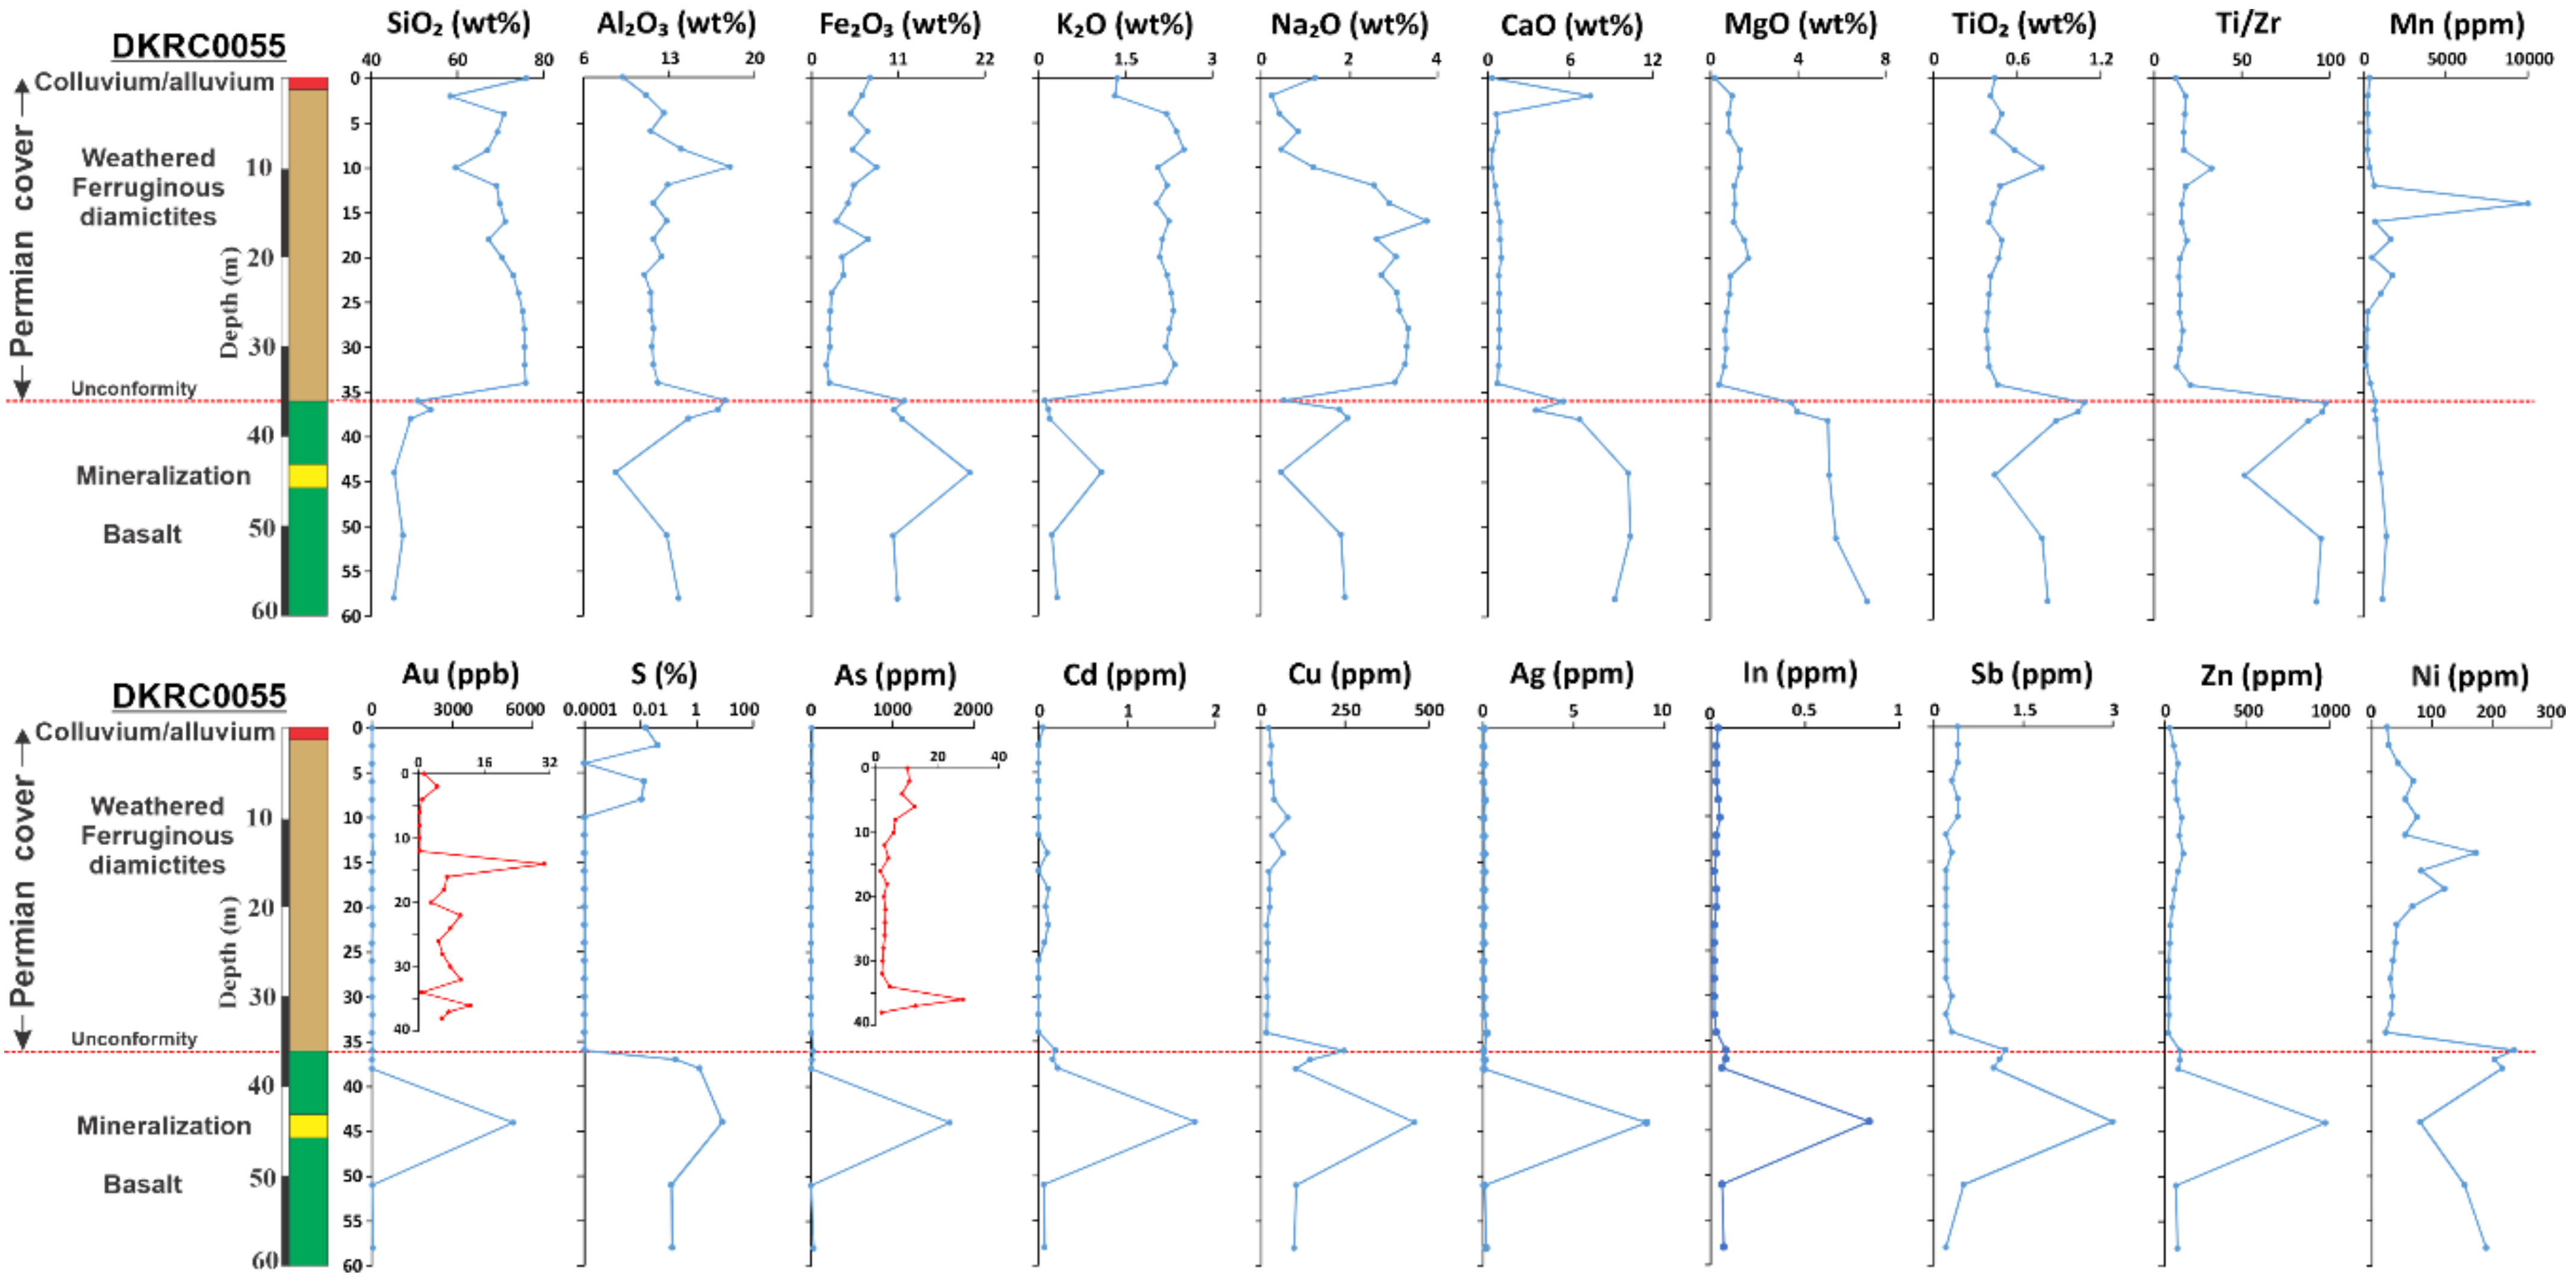
4.5.1. Vertical Variations

Three drill holes DKRC0055 and DKRC0061 (over mineralization) and DKRC0050 (over background; Figure 2) were analyzed for major and trace element concentrations (Figure 15 and Figure 16). The correlation coefficient differentiated the two major classes of the mafic–ultramafic and felsic clasts in the Permian cover (Table S1). There is a positive correlation between K2O and Si2O, Nb, Zr, Be, Cs, Rb, Sr, Tl, Ba, and Hf, indicating felsic source rocks, whereas a positive correlation between Fe2O3 and MgO, CaO, Ti2O, Cr, V, Sc, Ni, and Cu, indicating mafic–ultramafic source rocks for the clasts in the Permian diamictites (Table S1).
Figure 15 and Figure S2 show vertical chemical variations through the Permian cover of drill hole DKRC0061, which consists of the uppermost strongly and weakly weathered (ferruginized) and lower, unweathered calcareous diamictites over unweathered basalt. The strongly weathered diamictite has lower amounts of Si2O, Na2O, K2O, Rb, Cs, CaO, MgO, Ba, Sr, Y, Be, Zn, Au, Cd, and Eu/Eu* and higher amounts of Al2O3, Fe2O3, As, Cu, Sb, U, Mo, Pb, Sc, and S than the lower, weakly ferruginized diamictites. Zirconium, Cr, Ti, Th, and Se do not show any vertical variation in the Permian sediments, whereas Mn, Ni, Co, and REEs have elevated levels in redox zones within the ferruginous diamictites. The lower calcareous diamictites are characterized by elevated levels of Au, S, Cd, Sb, Ca, Mg, Mn, and Li. Gold and S reach up to 23.5 ppb and 0.55 wt% in the lower calcareous diamictites. Gold is also present in the lower part of the weakly ferruginous diamictites.
Figure 16 and Figure S2 show vertical chemical variations through the Permian cover of drill holes DKRC0055 and DKRC0050, which consist of ferruginized diamictites over unweathered basalt without the lower calcareous diamictites in drill hole DKRC0055 (Figure 16). In drill holes DKRC0055 and DKRC0050, Si2O, K2O, Na2O, Sr, Ba, Zr, Cs, Rb, Pb, U, Th, and light REEs increase dramatically above the unconformity between diamictites and unweathered basalt, whereas Fe2O3, CaO, MgO, S, Sb, Zn, Co, Ni, Cr, Cu, and Sc decrease. Aluminum and Ti remain preserved and do not show variations through the Permian cover. The mineralized interval of drill hole DKRC0055 contains 5.26 ppm Au, 1700 ppm As, 460 ppm Cu, 976 ppm Zn, up to 8.12% S, 14 ppm W, 12 ppm Pb, 9 ppm Ag, 8 ppm Se, 6 ppm Sn, 3.6 ppm Mo, 3 ppm Sb, 2.28 ppm Te, and 1.77 ppm Cd (Figure 16).
Gold increases up to ~30 ppb, whereas As is generally <20 ppm and increases to 28.5 ppm at the base of the Permian diamictites. Nickel, Co, Ba, Sr, Be, Y, and heavy REEs increase with Mn in the ferruginous diamictites (Figure 16; Figure S2). Calcium and S increase in the upper part of the ferruginized diamictites and thinly laminated siltstones in drill hole DKRC0050 (Figure S2).
In drill hole DKRC0050 (Figure S2), the Permian diamictites are overlain by thin Tertiary laminated siltstones. These two units are weakly ferruginized, and there is a sharp decrease in Na2O and Mn and a subtle increase in Al2O3, Fe2O3, K2O, Cs, Rb, Ti, Th, and light REEs above the unconformity between the Permian diamictites and the Tertiary siltstones. The Ti/Zr ratio decreases suddenly over the Permian–Archean unconformity and thus can be used effectively in locating the unconformity. Nickel, Co, Y, heavy REEs, Ba, and Be show a positive correlation with Mn in the weathered diamictites (Table S1). Gold is 10 ppb, and trace elements such as Cu, As, Sb, Cd, Zn, Mo, Se, and Pb are low in concentration (Figure S2). The cerium anomalies (Ce/Ce*) decrease in the Tertiary siltstones compared to the Permian diamictites, whereas there is no change in the Eu/Eu* (Figure S2).

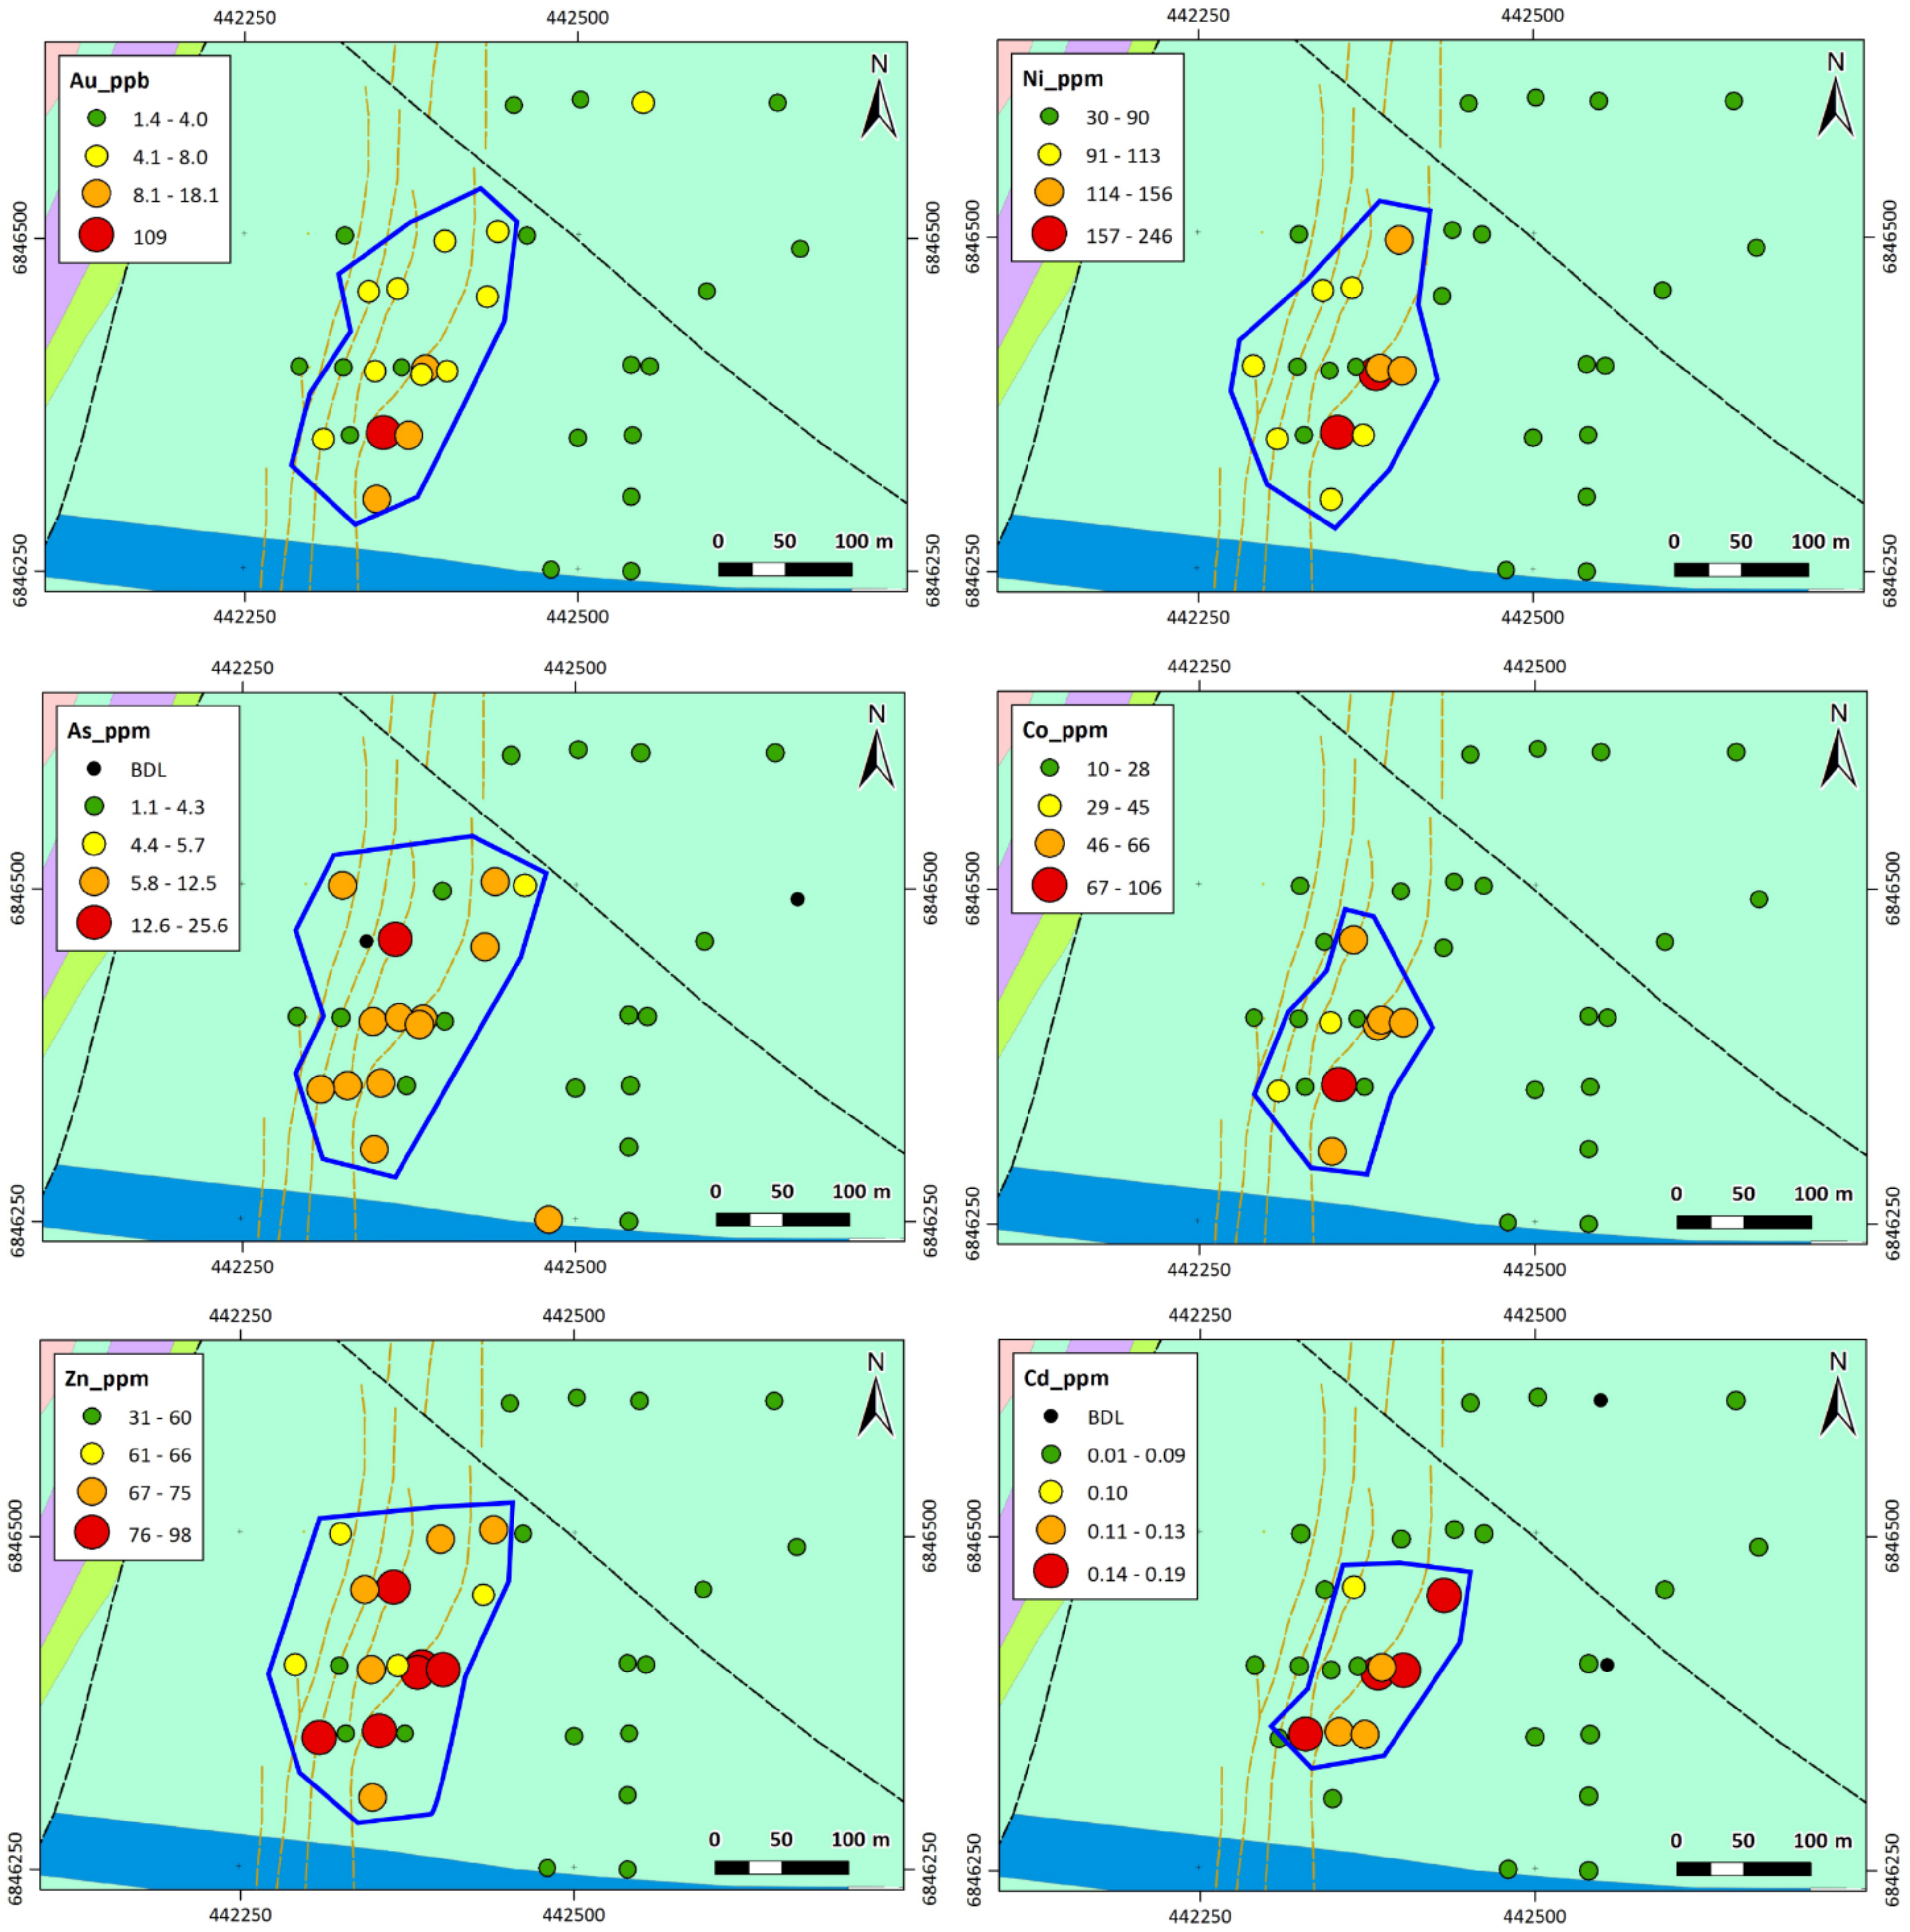
4.5.2. Interface and Redox Zone Geochemistry

Interface samples from 33 RC drill holes at Lancefield North show elevated concentrations of Au, As, Ni, Co, Zn, and Cd over the mineralization (Figure 17). Gold is between 4 and 18 ppb, with one value of 109 ppb in drill hole DKRC0062 over the mineralization compared to 2–3 ppb in the background (Figure 17). Arsenic varies between 4 and 26 ppb over the mineralization compared to <4 ppb in the background (Figure 17). Zinc varies between 61 and 98 ppb over the mineralization compared to <61 ppb in the background (Figure 17). Nickel, Co, and Cd are also anomalous over the mineralization relative to the background, but the high concentrations are heterogeneously distributed. Chemical analyses of samples collected from the dark-brown Fe-rich zones within the weathered (ferruginous) diamictites (redox zone) (Figure S1; Table S1) show elevated levels of Au, As, Ni, Co, Zn, and Cd over the mineralization and the background (Figure 18).

5. Discussion

5.1. Glacial Landscape Evolution

Late Paleozoic (Permo-Carboniferous) glaciated terrains of Gondwanaland (e.g., Australia, South America, Southern Africa, and Antarctica) and the more recent Pleistocene equivalent (e.g., Canada, the northern USA, northern Europe and Asia, and alpine areas of South America) are all characterized by a transported cover of consolidated or unconsolidated glacial sediments. Understanding the stratigraphy and textures of the Permian glacial cover, the paleotopography of the underlying basement rocks, and the paleo ice-flow directions is critical for mineral exploration and provenance assessment.
On the north and northeast margins of the Yilgarn Craton in Western Australia, the late Paleozoic sedimentary succession is weathered and occupies a network of glacially eroded valleys incised into the underlying basement rocks and buried beneath the Cenozoic sediments [11,24,25,38,39]. Apatite fission-track thermochronology suggests rapid burial in the early Permian period, followed by denudation of ~2.5 to 3 km from the early Permian to the mid-Jurassic/early Cretaceous period [40]. The paleotopography during the Permian glaciations, at the time the diamictites were deposited, has no surface expression on the present-day flat landscape. The Permian sedimentary succession and paleotopography is best studied in open mine pits and from drilling [11,38,41].
The distribution of the Permian cover in the Yilgarn Craton is shown in [11]. The Permian succession is up to 80 m thick near Laverton in the Eastern Goldfields, Western Australia [38]; up to 190 m thick at Agnew [11,39]; up to 50 m thick at Ockerburry Hill, 30 km south of Bronzewing Gold Mine [25]; and up to 20 m thick at Lancefield South Gold Mine [41]. At Lancefield North, the Permian cover varies from 22 to 54 m, which suggests it was deposited on rough paleotopography carved by glacier gouging of the Archean bedrock (Figure 19A). In the eastern Goldfields of the Yilgarn Craton, the Permian glacial cover are deposited in a poorly integrated network of narrow, deeply incised and steep-sided paleovalleys [38]. These paleovalleys follow the northeast-trending shear zones and the lithological boundary between basalt and granitoids at Lancefield North.
Although it is difficult to assess clast shape and orientation from drilling at the Lancefield North prospect, the good exposure at the Lancefield West Open Pit shows that the Permian diamictites are poorly lithified and matrix supported and are either massive or crudely lithified [38]. The diamictites contain many striated, bullet-shaped, and faceted clasts, which is typical of glacially transported materials [38]. No preferred clast orientation was observed [38]. The highly varied lithologies of the diamictite clasts, many of which do not correspond to the basement rocks in the Laverton Region, indicate distal source rocks [38]. The very poor sorting and the lack of clast orientation within diamictites at Laverton argue against direct deposition from the ice base, which gives rise to tills with preferred clast orientation associated with pavements [38]. Instead, the poorly sorted diamictites at the Lancefield North area were deposited when basal debris was deposited in situ by melting of ice followed by local transport, possibly by mass flow, toward the southeast [38].
We tentatively interpret the short distance (<1 km) of glacial transport to the southeast in the diamictites based on the preservation of the euhedral/subhedral sulfides and opaque oxide heavy minerals in the matrix; the abundance of potentially locally derived ferromagnesian minerals, such as chlorite and actinolite, along with basalt clasts; the abundance of clasts derived from the rock units that are present a few hundreds of meters to the northwest (granitoids, ultramafic, and volcanic rocks); and the reported heavy mineralogy of the diamictites derived from the local mineralization (Figure 14).
The fine-grained glaciolacustrine rhythmites are present mainly in the structurally controlled and topographically low areas to the east and southeast of the Lancefield North gold mineralization (Figure 3 and Figure 19B). The presence of rhythmites in this location may correspond to the location of a glacial lake at the margin of glaciers that formed where the drainage was blocked by ice. The rhythmites are most likely only present in the paleo-topographic low where the glacial lake was confined. The presence of rhythmites at the base of the Permian cover under diamictites may indicate that glacier ice was terminating and in contact with lake water [42].

5.2. Chemical and Mineralogical Evolution through the Permian Cover

Although much of Australia is now semi-arid to arid, the Permian to Cenozoic cover sequences experienced a long history of chemical weathering in warm and humid climate conditions between the late Cretaceous and late Paleogene periods [43,44]. The development of a water table within a transported cover sets up a redox gradient with oxidizing conditions prevailing at and above the water table and reducing conditions below [6,45]. The Eh gradient associated with the water table causes reduced ions (Fe2+, Mn2+) released from the weathering front to migrate upward to an oxidation front at or near the water table, resulting in ferrolysis with the generation of acidic conditions at the oxidation front [46]. Thus, high water tables in wet climates are likely to electrochemically transfer metals into the cover across an Eh gradient [45]. Anomalous zones are likely to be in water-table-associated redox zones, such as ferruginous nodules, pisoliths, and mottles [7]. A shift to a drier climate in the mid-Miocene period, coupled with erosion, would generally lower the water table to below the transported cover, but the old anomalous redox zone (Fe oxides) is likely to retain the geochemical signature of mineralization [6,7,45].
Weathering of the Permian glacial cover at the Lancefield North prospect produced two distinct chemostratigraphic units based on color, mineralogy, and geochemical variations (Figure 3 and Figure 4). These are shallow oxidized (brown) diamictites and reduced, gray, unweathered diamictites at a greater depth. Such color changes are also observed in the Quaternary till deposits in Canada [6,18], but at much shallower depths (tens of centimeters).
In the unweathered diamictites at the base of the Permian cover, ferromagnesian minerals (chlorite and actinolite) are mainly related to detrital mafic rock clasts that remain unweathered under the dominant alkaline and anoxic to euxinic conditions below the modern water table. Under such conditions, detrital gold, sulfides, and oxides (such as pyrite, pyrrhotite, chalcopyrite, arsenopyrite, sphalerite, galena, cobaltite, gersdorffite, pentlandite, and scheelite) are also stable in the unweathered calcareous diamictites. Quartz, albite, and muscovite are related to felsic rock clasts, whereas calcite is present as a cement of the diamictite clasts and matrix.
In the weathered diamictites, all chemical changes and mineral alterations are largely driven by redox reactions that play an important role in major and trace element mobility and hydromorphic metal dispersion as a function of the pH, Eh, temperature, and salinity of the ground water [47]. Oxidation–reduction, acid–base, hydrolysis, and dissolution processes are the main chemical changes occurring near and above the water table, which represent a redox boundary between the weathered and unweathered diamictites. Most of the rock-forming and labile heavy minerals are altered above the redox boundary. Feldspars are variably weathered through hydrolysis to form kaolinite (Figure 6A), where Ca2+, Na+, K+, Sr2+, Ba2+, Rb+, and Cs+ are carried away in solution (Figure 15 and Figure 16), whereas Al and Si are retained in kaolinite and silica minerals. Yttrium and HREEs, which are released during the weathering of REE-bearing minerals, are scavenged with Mn oxides (Figure S2). Feldspars are fresh and weakly altered in the lower part of the weathered diamictites, whereas they are completely altered to kaolinite in the upper part (Figure 6A).
Sulfides, together with carbonates, ferromagnesian, and opaque oxide heavy minerals, are easily oxidized and removed from the weathered diamictites above the redox boundary [11,24,47,48,49]. The released Fe2+, Mn2+, Ca2+, Mg2+, and SO42- combine with bicarbonate HCO3- and SO42- anions below the redox boundary to form diagenetic silicates (smectite and chlorite), carbonate (calcite and dolomite), and framboidal and massive pyrite cement. Higher sulfur content at the base of the unweathered diamictites indicates the presence of detrital and diagenetic sulfides. The framboidal pyrite was probably precipitated by the microbial reduction of detrital Fe3+ by sulfate-reducing bacteria during shallow burial [50] and the reaction of aqueous Fe2+ with H2S produced from the decay of organic matter [51]. Above the redox boundary, Fe2+ and Mn2+ cations form Fe and Mn oxides (Figure 11G–I) that absorb/adsorb the redox-sensitive trace elements, such as pisolites, Co, Cu, Ni, and Zn, released during the oxidation of detrital sulfides (Figure 15 and Figure 16).
The oxidation of the diagenetic pyrite cement indicates the lowering of the water table. Carbonates are dissolved above the redox boundary under oxidizing and acidic conditions. However, similar to alkali elements, Ca and Mg are partially retained in the weakly oxidized diamictites and completely leached from the strongly oxidized diamictites (Figure 15). This may indicate the presence of a pH gradient from neutral to weakly acidic at the base of the weathered diamictites to strongly acidic at the top.

5.3. Interface Sampling and Indicator Minerals

There are two types of interfaces (physical and chemical) that may be targeted to discover mineralization under any cover [6,7]. These interfaces are abundant and can be sampled either from near the surface or by shallow drilling.
Physical interface sampling is used in depositional regimes where there is no lateritic residuum or ferruginous duricrust on the underlying residual weathering profile, i.e., the profile has been truncated or the lateritic residuum never developed [25]. Interface sampling is based on the possibility of dispersion at or close to an unconformity between the transported cover and the underlying weathered and fresh rocks by (i) mechanical dispersion of remnants of weathering, such as ferruginous duricrust, indicator mineral grains, lithic, and gossan fragments, and (ii) hydromorphic dispersion after deposition of the transported cover by groundwater percolating through the coarse basal cover along the unconformity itself and/or the upper residual material [41,52,53,54,55,56]. These mechanisms result in lateral dispersion at the base of the cover without upward dispersion. The extent of lateral dispersion is governed by the topography of the unconformity [11].
At the Lancefield North prospect, two main physical interfaces are present: between the Permian cover and the underlying unweathered basalt and between the Permian and Cenozoic covers. The Permian cover is unweathered at the base, below the water table, and unconformably overlies unweathered basalt. Thus, the possibility of weathering and erosion of rock clasts and indicator minerals sourced from the truncated host rock can produce mechanical dispersion haloes larger than the mineralized targets themselves. Targeting indicator minerals in areas with a Permian cover that may reach up to 200 m thick in the northeastern Yilgarn Craton of Western Australia is a potential method for exploration targeting [11]. As it is impractical to sample the entire Permian cover, selective sampling of the meter interval crossing the unconformity that includes both basement and cover materials is ideal for interface sampling [25].
The base of the cover can be a simple, sharp, erosive unconformity or a complex mixture of saprolite and transported cover 1 m thick or greater. The base of the Permian glacial cover at Lancefield North is sharp and erosive unconformity and is easily identified only from diamond drill holes. However, in all RC drill holes where the samples are collected and analyzed, it was not possible to locate the unconformity by physical logging to the nearest meter, the meter interval crossing the unconformity that includes both basement and cover materials, which is ideal for interface sampling [25]. Because a mixed basement-cover sample cannot be identified according to [25], the adjacent meter intervals above and below the unconformity are collected and composited to ensure the unconformity is included.
Interface sampling has shown an elevated content of Au, As, Co, Ni, Zn, and Cd immediately above the mineralization compared to the background (Figure 17). The interface sampling method was used to test whether a mechanical dispersion halo, which forms during glacial weathering, exists around the Au mineralization. The composite 2 m samples across the unconformity, interface sampling, was used as an initial step to detect the mineralization footprint at a distance (~500 m) from narrow ore bodies and to reduce the number of samples and the cost of analyses. If a low level of Au concentration is detected, the lowermost meter of the cover and the uppermost meter of the basalt are planned to be analyzed separately to define the source of the anomaly. However, this step was not done at Lancefield North because the elevated concentrations of Au, As, Ni, Co, Zn, and Cd are only recorded over the mineralization and do not extend to the background. Therefore, the chemical signature from the interface sampling is mainly related to the mineralized basement. Here, interface sampling is successful in identifying the location of the mineralization. However, given the narrow width of the mineralization, drill spacing using the interface sampling should be narrow (~100 m).
Mineralogical and geochemical variations are used to identify this interface. Chemically, Si, K, Na, Sr, Ba, Rb, Cs, HFSE (Zr, Hf, Nb, Ta, U, Th), and REEs increase whereas Fe, Ti, Ca, Mg, Sc, Cu, Ni, Co, and Cr decrease above the interface. The Ti/Zr ratio decreases dramatically above the interface.
Mineral concentrates separated from the lowermost meter of the Permian cover contain fresh, detrital gold and Fe, Cu, As, Zn, Pb, Co, and Ni sulfides trapped in a paleotopographic low over the mineralization (Figure 14). However, the footprint (dispersal train) of the indicator minerals extends at least 250 m eastward from the mineralization (Figure 15). The actual width of the footprint is still unknown because our mapping of its lateral extent is limited by the location of drill holes.
Pyrite and pyrrhotite are the most abundant sulfides recorded from all cover samples. In the mineralization, pyrite is present with a hydrothermal mineral assemblage that includes quartz, chlorite, calcite, dolomite, alkali and plagioclase feldspars, muscovite, titanite, rutile, kaolinite, and gypsum. Conversely, pyrrhotite is mostly present as a separate phase with a smaller grain size than pyrite and may or may not occur with pyrite (Figure 12; Table 1). There is no major difference in the size of pyrite in the mineralization and the Permian cover, while pyrrhotite is becoming smaller in the cover compared to the mineralization (Table 1). This could be related to the variable hardness of pyrite (H = 6–6.5) and pyrrhotite (H = 3.5–4.5) and thus variable resistance to glacial comminution. Furthermore, pyrite in the cover is mainly present as composite grains and is locked in rock clasts compared to pyrrhotite, which occurs as liberated grains. This variation in fabric affects the resistance of each mineral during glacial erosion and transport.
Sulfides such as chalcopyrite (H = 3.5–4), arsenopyrite (H = 5.5–6), cobaltite (H = 5.5), and gersdorffite (H = 5.5) are mostly present in the Permian cover as liberated grains that are smaller in grain size than in the mineralization. Although sphalerite is softer (H = 3.5–4) than scheelite (H = 4.5–5), they do not show a large difference in grain size in the mineralization and the cover. Scheelite is exclusively present as liberated grains and is more resistant to both physical and chemical weathering than sphalerite. The resistance of sphalerite to glacial abrasion is mostly because it exists as composite grains intergrown with pyrite, chalcopyrite, albite, chlorite, quartz, and ilmenite. Galena is generally a soft mineral (H = 2–2.5) and tends to readily comminute during glacial transport to fine silt and clay size fractions (<63 μm) over a short distance from the mineralization [57]. The reported grain size of galena is <25 μm, which is less than the cut-off particle size (>45 μm) of the indicator minerals analyzed in the present study. This indicates that galena occurs mainly as inclusions in other minerals. Petrographic and mineral mapping show that galena is typically present as inclusions in pyrite (Figure 12) or intergrown with sphalerite and chalcopyrite in composite sulfide grains. Similar to galena, pentlandite is <25 μm in size and is mainly present as inclusions in mafic clasts. Supergene Cu sulfides, such as chalcocite, covellite, and bornite, are the oxidation products of chalcopyrite and are mainly present in the Permian cover above the redox boundary. Weathering of sulfides releases ore and pathfinder elements into the cover sediments, which are mainly scavenged by Fe and Mn oxides at paleoredox fronts [6]. These paleoredox fronts are chemical interfaces that define the stratigraphic positions and oscillation of the paleowater table within the Permian cover. The Permian sediments below the water table are unweathered and stable under reducing and alkaline conditions. Under these conditions, where secondary sulfides and carbonate cements form, the oxidation of Au mineralization in the basaltic host rock is prevented. Thus, any hydromorphic dispersion of metals in the cover is unlikely to be derived from the Au mineralization in the basaltic host rock, which acts as an aquiclude for groundwater flow. This is shown by the elevated Au, As, Zn, Cd, Ni, and Co levels in the redox zones within the weathered diamictites over the mineralization and the background (Figure 18). Displaced Cu and Zn anomalies unrelated to any proximal basement mineralization can also form at redox fronts in transported cover sequences [6].

6. Conclusions and Implications for Exploration

The Lancefield North prospect is one of several areas (e.g., Agnew) that are covered by Permian glacial and Cenozoic fluvial–lacustrine sedimentary sequences in the northeastern part of the Yilgarn Craton in Western Australia [11]. The Permian glacial cover is the oldest cover sequence that rests unconformably over fresh bedrock compared to other areas, where the cover is underlain by weathered (saprolite) bedrock. Mineral exploration in tropical to subtropical, weathered terrains depends mainly on identifying metal anomalies within the cover that are derived directly from a buried lateritic–saprolitic profile overlying mineralization and its host rock [24]. Metal transfer mechanisms through a transported cover in weathered terrains in tropics and subtropics are reviewed in [46]. These mechanisms are classified according to phreatic processes that involve groundwater flow, convection, dilatancy, bubbles, diffusion, and electromigration and vadose zone processes that involve capillary migration, gaseous transport, and biological transfer [45]. These metal transfer mechanisms are generally the least effective where the cover thickness is >30 m and the cover stratigraphy is variable (Permian–Cenozoic) and unweathered. Some of these mechanisms, such as gaseous transfer, diffusion, convection, and barometric pumping, could potentially work through a thick cover, but these mechanisms require that the cover be fractured, the sulfide ore be oxidized, and the region be neo-tectonically active [45]. None of these conditions are met at Lancefield North, where the cover consists of Permian poorly sorted and polymictic diamictites interlayered with rhythmites and overlain by Tertiary siltstones. In addition, the cover is unweathered and not fractured and at the base, the mineralization and the host rock are unweathered. Therefore, any hydromorphic dispersion of elements from the mineralization into the cover sediments is not expected to reflect the geochemical signature of the underlying mineralization in this environment. In addition, soil sampling in the present study is avoided because it is developed over Tertiary siltstones and in places eroded, making it inconsistent for identifying true anomalies at the surface.
The lateral variations in the thickness of the Permian cover indicates that glacial weathering and erosion have affected the underlying basement paleotopography. Sediments eroded during the denudation of paleotopographic highs are most likely to be deposited in the nearby paleotopographic lows. The preservation of detrital sulfides and their stability under alkaline and reducing conditions below the water table at the base of the Permian cover indicates mechanical dispersal of exposed or shallow gold mineralization. The subrounded and subangular liberated and composite forms of the detrital sulfides also confirm proximity to the source rock and mineralization. This is also supported by the similarity in texture and mineral association between the detrital composite sulfide clasts and the gold mineralization. In addition, the presence of chlorite, actinolite, and calcite compared to muscovite indicates the presence of mafic rock clasts, locally derived from the host rock of the mineralization and deposited in the topographic lows at the base of the Permian cover.
A sampling strategy for the Permian glacial cover at Lancefield North and other similar areas covered by glacial sediments in the Yilgarn Craton should involve targeting the basal Archean–Permian unconformity. This physical interface sampling has proven successful in delineating elevated Au, As, Zn, Co, Ni, and Cd concentrations over the mineralization at Lancefield North. These elevated metal concentrations are also consistent with the concentrations of detrital gold, pyrite, chalcopyrite, arsenopyrite, chalcocite, sphalerite, gersdorffite, and galena above the interface. The advantage of the indicator minerals over the chemical analyses of interface samples is the wider mechanical dispersion that reaches up to 500 m from the mineralization. Interface sampling identified the mineralization with no chemical dispersion halo in the cover. Given the narrow width of the mineralization, drill spacing should be narrow (~100 m) when using interface sampling. Conversely, the distal footprint can be detected using indicator minerals with a recommended drill spacing of 500 m. Because the drill holes at Lancefield North are close to the mineralization, wider drill spacing is possible subject to the dispersion of indicator minerals being identified at a greater distance from the mineralization.
Detrital sulfides are oxidized above the redox interface in the weathered diamictites; however, elevated contents of As, Zn, Cu, Co, Ni, and Cd are present over the mineralization and the background. Gold is also present through the oxidized diamictites but is most likely detrital in origin. Thus, it is not recommended to sample the Fe- and Mn-rich samples at redox fronts in an environment where the cover rests unconformably over fresh rock and is not affected by neotectonics. Soil is also not recommended for sampling and analysis because it is developed over Tertiary siltstones and exposed to erosion and mixing with colluvial and alluvial sediments. Therefore, physical examination of indicator minerals and chemical analysis of interface samples are highly recommended in areas under a Permian cover, where there is no surface expression of the buried mineralization.

Supplementary Materials

The following are available online at https://www.mdpi.com/article/10.3390/min11101131/s1: Table S1. The Excel file contains seven sheets: Sheet 1: Multielement analyses of three drill holes (DKRC0050, DKRC0051 and DKRC0061) and correlation coefficient. Sheet 2: Multielement analyses of interface samples. Sheet 3: Multielement analyses of redox samples. Sheet 4: Multielement analyses of ore samples. Sheet 5: Quality assurance and quality control (QA/QC) of the chemical analyses performed on duplicates. Sheet 6: Quality assurance and quality control (QA/QC) of the chemical analyses performed on certified reference materials (CRM). Sheet 7: Heavy minerals sample weight and depths. The quality assurance/quality control calculations performed on CRM and duplicates (sheets 5 and 6) used the half relative difference (HRD%) method, after [58]. This method calculates the mean relative difference between certified values of a given CRM against either individual or mean analysis of the CRM, expressed as a percentage, using the following equation: HRD (%) = (assay1 − assay2)/(assay1 + assay2) × 100. Errors less than 10% were considered acceptable, whereas those greater than 20% were not. Figure S1. Cover stratigraphy of 35 reverse circulation drill holes and the depths of the collected redox samples. Table S2. Semi-quantified XRD analysis of selected samples of the Permian cover and the gold mineralization of drill holes DKRC0050, DKRC0051 and DKRC0061. Table S3. The Excel file contains two sheets: Sheet 1: Semi-quantified TESCAN TIMA mineralogical analysis of heavy mineral concentrates. Each value represents the area percent (%) occupied by one mineral of the total area analyzed. The samples (N = 36) are from the base of the Permian cover, and three samples are from the gold mineralization. Sheet 2: Number of heavy minerals in black colors identified from 33 samples of the base of the Permian cover. These values are for mineral particle counts, which include the free grains and the mineral inclusions. The values of heavy minerals in red colors are normalized to the bulk sample weight collected for heavy mineral separation. Figure S2. Multielement analyses of three drill holes DKRC0061, DKRC0055 and DKRC0050.

Author Contributions

Conceptualization, W.S.; data curation, W.S. and M.V.; formal analysis, W.S. and M.V.; funding acquisition, W.S.; investigation, W.S.; methodology, W.S. and M.V.; project administration, W.S.; software, W.S. and M.V.; validation, W.S.; visualization, W.S.; writing–original draft, W.S.; writing–review and editing, W.S., M.V., K.C. and R.A. All authors have read and agreed to the published version of the manuscript.

Funding

This research was funded by CSIRO Mineral Resources, the Department of Industry, Science, Energy and Resources’ Entrepreneurs’ Programme, Australia; and Duketon Mining Ltd., Australia.

Acknowledgments

This work was supported by the CSIRO Mineral Resources, IC, and Duketon Mining Ltd. They are thanked for their financial and logistical support, without which this research project would not have been possible. Sample preparation was undertaken by Tenten Pinchand, polished sections were prepared by Derek Winchester, and Tania Ibrahimi prepared some of the figures. All this assistance is acknowledged with appreciation. The manuscript benefited greatly from detailed reviews and comments by Steve Barnes, Louise Schoneveld, and Helen McFarlane.

Conflicts of Interest

The authors declare no conflict of interest.

References

  1. Reid, N.; Hill, S.M.; Lewis, D.M. Spinifex biogeochemical expressions of buried gold mineralisation: The great mineral exploration penetrator of transported regolith. Appl. Geochem. 2008, 23, 76–84. [Google Scholar] [CrossRef]
  2. Petts, A.E.; Hill, S.M.; Worrall, L. Termite species variations and their importance for termitaria biogeochemistry: Towards a robust media approach for mineral exploration. Geochem. Explor. Environ. Anal. 2009, 9, 257–266. [Google Scholar] [CrossRef]
  3. Stewart, A.D.; Anand, R.R.; Balkau, J. Source of anomalous gold concentrations in termite nests, Moolart Well, Western Australia: Implications for exploration. Geochem. Explor. Environ. Anal. 2012, 12, 327–337. [Google Scholar] [CrossRef]
  4. Salama, W.; Gazley, M.; Bonnett, L. Geochemical exploration for supergene copper oxide deposits, Mount Isa Inlier, NW Queensland, Australia. J. Geochem. Explor. 2016, 168, 72–102. [Google Scholar] [CrossRef]
  5. Noble, R.R.P.; Anand, R.R.; Gray, D.; Cleverley, J. Metal migration at the DeGrussa Cu-Au sulphide deposit, Western Australia. Geochem. Explor. Environ. Anal. 2017, 17, 124–142. [Google Scholar] [CrossRef]
  6. Anand, R.R.; Salama, W. Gold dispersion in transported cover sequences especially in chemical (palaeoredox front) and physical (unconformity) interfaces linked to the landscape history of Western Australia. Explore Newslet. Assoc. Appl. Geochem. 2019, 183, 1–40. [Google Scholar]
  7. Salama, W.; Anand, R.R.; Schoneveld, L.; Noble, R.; Rogers, J. Significance of ferruginous pisoliths and interface sampling for gold exploration in the covered terrains. J. Geochem. Explor. 2021, 106794. [Google Scholar] [CrossRef]
  8. McMartin, I.; McClenaghan, M.B. Till geochemistry and sampling techniques in glaciated shield terrain: A review. In Drift Exploration in Glaciated Terrains; Geological Society Special Publications; McClenaghan, M.B., Bobrowsky, P.T., Hall, G.E.M., Cook, S.J., Eds.; Geological Society: London, UK, 2001; Volume 185, pp. 19–43. [Google Scholar]
  9. McClenaghan, M.B. Indicator mineral methods in mineral exploration. Geochem. Explor. Environ. Anal. 2005, 5, 233–245. [Google Scholar] [CrossRef] [Green Version]
  10. Sarala, P.; Pulkkinen, E.; Juhani Ojala, V.; Peltoniemi-Taivalkoski, A. Gold exploration using till at Petäjälehto, northern Finland. Geochem. Explor. Environ. Anal. 2009, 9, 247–255. [Google Scholar] [CrossRef]
  11. Salama, W.; Anand, R.R.; Verrall, M. Mineral exploration and basement mapping in areas of deep transported cover using indicator heavy minerals and paleoredox fronts, Yilgarn Craton, Western Australia. Ore Geol. Rev. 2016, 72, 485–509. [Google Scholar] [CrossRef]
  12. Friedrich, G.; Marker, A.; Kanig, M. Heavy mineral surveys in exploration of lateritic terrain. In Handbook of Exploration Geochemistry; Regolith Exploration Geochemistry in Tropical and Subtropical Terrains; Butt, C.R.M., Zeegers, H., Eds.; Elsevier: Amsterdam, The Netherlands, 1992; Volume 4, pp. 483–498. [Google Scholar]
  13. McClenaghan, M.B. Overview of common processing methods for recovery of indicator minerals from sediment and bedrock in mineral exploration. Geochem. Explor. Environ. Anal. 2011, 11, 265–278. [Google Scholar] [CrossRef]
  14. McClenaghan, M.B.; Parkhill, M.A.; Pronk, A.G.; Sinclair, W.D. Indicator mineral and till geochemical signatures of the Mount Pleasant W-Mo-Bi and Sn-Zn-In deposits, New Brunswick, Canada. J. Geochem. Explor. 2017, 72, 151–166. [Google Scholar] [CrossRef] [Green Version]
  15. Shilts, W.W. Till geochemistry in Finland and Canada. J. Geochem. Explor. 1984, 21, 95–117. [Google Scholar] [CrossRef]
  16. Hirvas, H. Application of glacial geological studies in prospecting in Finland. In Drift Prospecting; Paper 89-20; DiLabio, R.N.W., Coker, W.B., Eds.; Geological Survey of Canada: Ottawa, ON, Canada, 1989; pp. 1–12. [Google Scholar]
  17. Klassen, R.A. Glacial history and ice flow dynamics applied to drift prospecting and geochemical exploration. In Proceedings of the Exploration 97 (14–18 September 1997): Fourth Decennial International Conference on Mineral Exploration; Gubins, A.G., Ed.; Prospectors and Developers Association of Canada: Toronto, ON, Canada, 1997; pp. 221–232. [Google Scholar]
  18. McClenaghan, M.B.; Thorleifson, L.H.; DiLabio, R.N.W. Till geochemical and indicator mineral methods in mineral exploration. Ore. Geol. Rev. 2000, 16, 145–166. [Google Scholar] [CrossRef]
  19. McClenaghan, M.B.; Plouffe, A.; McMartin, I.; Campbell, J.E.; Spirito, W.A.; Paulen, R.C.; Garrett, R.G.; Hall, G.E.M. Till sampling and geochemical analytical protocols of the Geological Survey of Canada. Geochem. Explor. Environ. Anal. 2013, 13, 285–301. [Google Scholar] [CrossRef]
  20. Lougheed, H.D.; McClenaghan, M.B.; Layton-Matthews, D.; Leybourne, M.I.; Dobosz, A.N. Automated indicator mineral analysis of fine-grained till associated with the Sisson W-Mo deposit, New Brunswick, Canada. Minerals 2021, 11, 103. [Google Scholar] [CrossRef]
  21. Lehtonen, M.L.; Marmo, J.S.; Nissinen, A.J.; Johanson, B.S.; Pakkanen, L.K. Glacial dispersal studies using indicator minerals and till geochemistry around two eastern Finland kimberlites. J. Geochem. Explor. 2005, 87, 19–43. [Google Scholar] [CrossRef]
  22. McClenaghan, M.B.; Kjarsgaard, B.A. Indicator mineral and geochemical methods for diamond exploration in glaciated terrain in Canada. In Drift Exploration in Glaciated Terrains; Geological Society Special Publications; McClenaghan, M.B., Bobrowsky, P.T., Hall, G.E.M., Cook, S.J., Eds.; Geological Society: London, UK, 2001; Volume 185, pp. 83–123. [Google Scholar]
  23. Kjarsgaard, I.M.; McClenaghan, M.B.; Kjarsgaard, B.A.; Heaman, L.M. Indicator mineralogy of kimberlite boulders from eskers in the Kirkland Lake and Lake Timiskaming areas, Ontario, Canada. Lithos 2004, 77, 705–731. [Google Scholar] [CrossRef]
  24. Anand, R.R.; Paine, M. Regolith geology of the Yilgarn Craton, Western Australia: Implications for exploration. Aust. J. Earth Sci. 2002, 49, 3–162. [Google Scholar] [CrossRef]
  25. Anand, R.R.; Butt, C.R.M. A guide for mineral exploration through the regolith in the Yilgarn Craton, Western Australia. Aust. J. Earth Sci. 2010, 57, 1015–1114. [Google Scholar] [CrossRef]
  26. Averill, S.A. Viable indicator minerals in surficial sediments for two major base metal deposit types: Ni–Cu-PGE and porphyry Cu. Geochem. Explor. Environ. Anal. 2001, 11, 279–292. [Google Scholar] [CrossRef]
  27. Sarala, P.; Peuraniemi, V. Exploration using till geochemistry and heavy minerals in the ribbed moraine area of southern Finnish Lapland. Geochem. Explor. Environ. Anal. 2007, 7, 195–205. [Google Scholar] [CrossRef]
  28. Eppinger, R.G.; Fey, D.L.; Giles, S.A.; Grunsky, E.C.; Kelley, K.D.; Minsley, B.J.; Munk, L.; Smith, S.M. Summary of exploration geochemical and mineralogical studies at the giant pebble porphyry Cu–Au–Mo deposit, Alaska: Implications for exploration under cover. Econ. Geol. 2013, 108, 495–527. [Google Scholar] [CrossRef]
  29. Myers, J.S. Precambrian history of the West Australian craton and adjacent orogens. Ann. Rev. Earth Planet. Sci. 1993, 21, 453–485. [Google Scholar] [CrossRef]
  30. Hunter, W.M. Geology of the Granite-Greenstone Terrane of the Kalgoorlie and Yilmia 1:100,000 Sheets, Western Australia; GSWA Report Nr. 35; Geological Survey of Western Australia: Perth, Australia, 1993; 80p.
  31. Bunting, J.A.; Chin, R.J.; Duketon, W.A. Geological Survey of Western Australia 1:250,000 Geological Series Explanatory Notes; Geological Survey of Western Australia: Perth, Australia, 1979.
  32. Farrell, T.R.; Langford, R.L.; Duketon, W.A. Map Sheet 3342, 1st ed.; Geological Survey of Western Australia 1:100 000 Geological Series; Geological Survey of Western Australia: Perth, Australia, 1996.
  33. Harris, D.H.M.; Williams, P.R.; Newton-Smith, J.; Fitzgerald, L.G. Tectonic fabric development and mineralisation of the Duketon greenstone belt, Western Australia. Austral. J. Earth Sci. 1997, 44, 503–508. [Google Scholar] [CrossRef]
  34. Farrell, T.R.; Duketon, W.A. Western Australia Geological Survey, 2nd ed.; 1:250,000 Geological Series Explanatory Notes; Department of Minerals and Energy: Perth, Australia, 2001; p. 24.
  35. Henson, P.A.; Blewett, R.S.; Roy, I.G.; Miller, J.M.; Czarnota, K. 4D architecture and tectonic evolution of the Laverton region, eastern Yilgarn Caton, Western Australia. Precambrian. Res. 2010, 183, 338–355. [Google Scholar] [CrossRef]
  36. Langford., R.L.; Farrell, T.R. Geology of the Duketon 1:100,000 Sheet: Western Australia Geological Survey; I:100,000 Geological Series Explanatory Notes; Department of Minerals and Energy: Perth, Australia, 1998; 27p.
  37. Stewart, A.J. Geology of the De La Poer (3443) and Urarey (3343) 1:100,000 Sheet Areas, Yilgarn Block, Western Australia; Record 1999/033; Australian Geological Survey Organization: Canberra, Australia, 1999; 14p.
  38. Eyles, S.N.; De Broekert, P. Glacial tunnel valleys in the Eastern Goldfields of Western Australia cut below the Late Palaeozoic Pilbara ice sheet. Palaeogeogr. Palaeoclimatol. Palaeoecol. 2001, 171, 29–40. [Google Scholar] [CrossRef]
  39. Salama, W.; Anand, R.R. Reconstructing the pre-Quaternary landscape in Agnew-Lawlers area, Western Australia with emphasis on the Permo-Carboniferous glaciation and post-glacial weathering. Int. J. Earth Sci. 2017, 106, 311–339. [Google Scholar] [CrossRef]
  40. Weber, U.D.; Kohn, T.B.P.; Gleadow, A.J.W.; Nelson, D.R. Low temperature Phanerozoic history of the Northern Yilgarn Craton, Western Australia. Tectonophysics 2005, 400, 127–151. [Google Scholar] [CrossRef]
  41. Anand, R.R.; Robertson, I.D.M. The role of mineralogy and geochemistry in forming anomalies on interfaces and in areas of deep basin cover: Implications for exploration. Geochem. Explor. Environ. Anal. 2012, 12, 45–66. [Google Scholar] [CrossRef]
  42. Shilts, W.W. Geological Survey of Canada’s contributions to understanding the composition of glacial sediments. Can. J. Earth Sci. 1993, 30, 333–353. [Google Scholar] [CrossRef]
  43. Pillans, B. Geochronology of the Australian regolith. In Regolith Landscape Evolution Across Australia; Anand, R.R., de Broekert, P., Eds.; CRC LEME: Perth, Australia, 2005; pp. 41–61. [Google Scholar]
  44. Pillans, B. Pre-Quaternary landscape inheritance in Australia. J. Quat. Sci. 2007, 22, 439–447. [Google Scholar] [CrossRef]
  45. Anand, R.R.; Aspandiar, M.F.; Noble, R. A review of metal transfer mechanisms through transported cover with emphasis on the vadose zone within the Australian regolith. Ore Geol. Rev. 2016, 73, 394–416. [Google Scholar] [CrossRef]
  46. Mann, A.W. Hydrogeochemistry and weathering on the Yilgarn Block, Western Australia-ferrolysis and heavy metals of continental brines. Geochim. Cosmochim. Acta 1983, 47, 181–190. [Google Scholar] [CrossRef]
  47. McQueen, K.G.; Scott, K.M. Rock weathering and structure of the regolith. In Regolith Science; Scott, K.M., Pain, C.F., Eds.; CSIRO Publishing: Collingwood, Australia, 2008; pp. 105–126. [Google Scholar]
  48. Butt, C.R.M.; Lintern, M.J.; Anand, R.R. Evolution of regolith and landscapes in deeply weathered terrain: Implications for geochemical exploration. Ore Geol. Rev. 2000, 16, 167–183. [Google Scholar] [CrossRef]
  49. Weibel, R.; Friis, H. Alteration of opaque heavy minerals as a reflection of the geochemical conditions in depositional and diagenetic environments. In Heavy Minerals in Use; Mange, M.A., Wright, D.T., Eds.; Elsevier: Amsterdam, The Netherlands, 2007; Volume 58, pp. 277–303. [Google Scholar]
  50. Mozer, A. Authigenic pyrite framboids in sedimentary facies of the Mount Wawel Formation (Eocene), King George Island, West Antarctica. Pol. Polar Res. 2010, 31, 255–272. [Google Scholar] [CrossRef] [Green Version]
  51. Kirchner, J.G. Detrital and authigenic pyrite in an Illinoisan lacustrine silt, central Illinois. J. Sediment. Res. 1985, 55, 869–873. [Google Scholar]
  52. Anand, R.R.; Smith, R.E.; Phang, C.; Wildman, J.E.; Robertson, I.D.M.; Munday, T.J. Geochemical Exploration in Complex Lateritic Environments of the Yilgarn Craton, Western Australia; Restricted Report; CSIRO Division of Exploration Geoscience: Perth, Australia, 1993; 442R (Reissued as Open File Report 58 CRC LEME, Perth, 1998). [Google Scholar]
  53. Robertson, I.D.M.; Phang, C.; Munday, T.J. The Regolith Geology and Geochemistry of the Area around the Harmony Gold Deposit, (Baxter Mining Centre), Peak Hill, Western Australia; CSIRO Exploration and Mining Restricted Report; CSIRO: Perth, Australia, 1996; 194R (Reissued as Open File Report 94, CRC LEME, Perth, 2001). [Google Scholar]
  54. Anand, R.R. Regolith and geochemical synthesis of the Yandal greenstone belt. In Yandal Greenstone Belt; No. 32; Phillips, G.N., Anand, R.R., Eds.; Australian Institute of Geoscientists Bulletin: Crows Nest, Australia, 2000; pp. 79–111. [Google Scholar]
  55. Robertson, I.D.M.; King, J.D.; Anand, R.R. Regolith geology and geochemical exploration around the Stellar and Quasar gold deposits, Mt Magnet, Western Australia. Geochem. Explor. Environ. Anal. 2001, 1, 353–365. [Google Scholar] [CrossRef]
  56. Butt, C.R.M.; Scott, K.M.; Cornelius, M.; Robertson, I.D.M. Sample Media. In Regolith Expression of Ore Systems; Butt, C.R.M., Robertson, I.D.M., Scott, K.M., Cornelius, M., Eds.; CRCLEME: Perth, Australia, 2005; pp. 53–79. [Google Scholar]
  57. McClenaghan, M.B.; Peter, J.M.; Layton-Matthews, D. Overview of VMS exploration in glaciated terrain using indicator minerals, till geochemistry, and boulder tracing: A Canadian perspective. In Targeted Geoscience Initiative 4: Contributions to the Understanding of Volcanogenic Massive Sulphide Deposit Genesis and Exploration Methods Development; Open File 7853; Peter, J.M., Mercier-Langevin, P., Eds.; Geological Survey of Canada: Ottawa, ON, Canada, 2015; pp. 81–99. [Google Scholar]
  58. Stanley, C.R.; Lawie, D. Average relative error in geochemical determinations: Clarification, calculation, and a plea for consistency. Explor. Min. Geol. 2007, 16, 267–275. [Google Scholar] [CrossRef]
Figure 1. (A) The tectonic map of the Yilgarn Craton (bottom left) shows the location of the Duketon Greenstone Belt in the Burtville Terrain. (B) A geological map of the Duketon Greenstone Belt showing the main geological units, Au mines, and Ni resources (Rosie, Nariz, and C2). The map is provided by Duketon Mining Ltd. (C) A regolith map (Geological Survey of Western Australia, 1:500,000) showing the distribution of the Cenozoic cover over the Duketon Greenstone Belt. The Permian cover is not outcropped in the map.
Minerals 11 01131 g001
Figure 2. A geological map showing the main Archean rock units, faults, and mineralized horizon and the locations of RC (blue color), diamond (red color), and AC (black) drill holes. Black arrows show the ice flow direction. The three holes highlighted in red are selected for chemical analyses (Figure S2).
Minerals 11 01131 g002
Figure 3. Two stratigraphic cross sections (Figure 2) showing the lateral and vertical variations in the Permian–Cenozoic cover and the basement paleotopography at the Lancefield North prospect. The two cross sections are drawn to the true thickness, with no vertical exaggeration.
Minerals 11 01131 g003
Figure 4. Diamond drill core samples from drill holes DKDD0006 and DKDD0005. (A) The unconformity (erosive contact) between the unweathered Permian glacial cover and the underlying basement (Archean basalt) in drill hole DKDD0006. (B) Sulfides in gold-mineralized sheared basalt in drill hole DKDD0006. (C) The unconformity between the unweathered Permian glacial cover and the underlying basement in drill hole DKDD00065. (D) Weathered Permian diamictites with fresh polymictic boulders. (E) Rhythmites consist of fresh and oxidized sandstone and siltstone layers. The yellow box shows the presence of dropstones. (F) Weathered Tertiary siltstone and Quaternary ferruginous soil.
Minerals 11 01131 g004
Figure 5. Petrography of the Permian diamictites (AC) from drill holes DKDD0006 and DKDD0005 and heavy mineral concentrates. (AC) Unweathered diamictites consist of quartz (qtz) and partially altered and fresh feldspars (fsp) in liberated grains and felsic clasts (fc) and mafic clasts (mc) in a matrix of quartz and calcite (cal) cement. (D) Opaque minerals pyrite (py), ilmenite (ilm), and magnetite (mag) in the diamictite matrix. (E) Pyrite (py) cementing quartz (qtz) and magnetite (mag). (F) Pyrite (py) and calcite (cal) cement of the unweathered calcareous diamictite. (GI) Weathered diamictites with Fe oxide (goethite: gt) and Mn oxide (psilomelane: ps) cement replacing feldspars (fsp) and pyrite (py) cement (I).
Minerals 11 01131 g005
Figure 6. (A) XRD analysis of 27 samples from drill hole DKRC0061. (BD) The Permian cover consists of unweathered calcareous diamictites (UCD) and ferruginized diamictites (FD) over unweathered basalt. Chlorite, actinolite, calcite, albite, and microcline dominate in the basalt and the unweathered diamictites. Albite and microcline resist weathering the weakly ferruginized diamictites. Kaolinite, muscovite, and goethite dominate the strongly ferruginized diamictites.
Minerals 11 01131 g006
Figure 7. TIMA mineral map showing gold and sulfides in the mineralization. (A) Gold occurs mainly as free grains with pyrite, pyrrhotite, arsenopyrite, and with hydrothermal mineral association shown in Figure 8 and Figure 9A,B. (B) Gold occurs as inclusions in pyrite. (C,D) the mineralization contains pyrite, pyrrhotite, pentlandite, scheelite, arsenopyrite, chalcopyrite, cobaltite, and gersdorffite. The vertical scale bars in all images are 250 µm.
Minerals 11 01131 g007
Figure 8. TIMA SEM mineral map of gold- and sulfide-containing particles in the mineralization. Gold and galena occur as small inclusions (black squares in the bottom-left pyrite grains) in pyrite. Pentlandite is associated mainly with pyrrhotite.
Minerals 11 01131 g008
Figure 9. BSE image and the corresponding TIMA mineral maps of gold and pyrite with a hydrothermal mineral association in the mineralization. (A) Gold and pyrite are associated with calcite, quartz, and kaolinite. (B) Gold is associated with chlorite, albite, microcline, and quartz. (C) Pyrite is associated with quartz, albite, chlorite, calcite, muscovite, kaolinite, gypsum, Fe oxides, rutile, and titanite.
Minerals 11 01131 g009
Figure 10. Vertical chemical variations from the bedrock to the surface in drill hole DKRC0062 showing that the mineralization coincides with elevated levels of Au, As, Cu, Zn, Cd, Mo, Ag, W, and Pb.
Minerals 11 01131 g010
Figure 11. Reflected light (A,B,DH,L,O) and BSE-SEM images of detrital (C,G,J,K,M,N) and diagenetic (H) sulfides, gold (Au in (I)), and opaque oxide minerals in the Permian cover. Mineral abbreviations: py = pyrite, mag = magnetite, sph = sphalerite, gn = galena, ccp = chalcopyrite, cv = covellite, po = pyrrhotite, sch = scheelite, asp = arsenopyrite, ger = gersdorffite, qtz = quartz, pn = pentlandite, gt = goethite, ilm = ilmenite, chr = chromite, Au = gold.
Minerals 11 01131 g011
Figure 12. TIMA SEM mineral map of gold- and sulfide-containing particles at the base of the Permian cover. Gold (black circles) and sulfides exist mainly in angular composite grains and subhedral and euhedral liberated grains.
Minerals 11 01131 g012
Figure 13. BSE images and the corresponding TIMA mineral maps of detrital sulfides (A,B) and diagenetic pyrite (C) at the base of the Permian cover. (A) Detrital pyrite is associated with a hydrothermal mineral assemblage including quartz, albite, microcline, chlorite, calcite, muscovite, kaolinite, gypsum, rutile, and titanite. (B) Detrital pyrite contains inclusions of chalcopyrite, galena, and chlorite. (C) Diagenetic pyrite and dolomite cementing quartz, albite, chlorite, muscovite, ilmenite, kaolinite, apatite, and Fe oxides.
Minerals 11 01131 g013
Figure 14. Bubble plot of the number of indicator minerals separated from the lowermost 1 m of the Permian cover of 32 RC drill holes (Figure 2) showing the mineral particle counts, which include the free grains and the mineral inclusions of gold, chalcopyrite, pyrrhotite, arsenopyrite, pentlandite, cobaltite, gersdorffite, sphalerite, and galena. These particles are identified using TESCAN SEM and TIMA software, and the number of indicator mineral counts are normalized to 500 g bulk samples (sheet 2 of Table S3). Indicator minerals have elevated levels over the mineralization and to the southeast, i.e., in the down-ice direction, which suggests glacial dispersal. Scheelite shows elevated levels mainly near the eastern edge of the mineralization.
Minerals 11 01131 g014
Figure 15. Vertical chemical variations in major oxides and trace elements in the bedrock and the Permian cover logged from drill hole DKRC0061.
Minerals 11 01131 g015
Figure 16. Vertical chemical variations in major oxides and selected trace elements in the Permian diamictites and the underlying basalt in drill hole DKRC0055. The inset profiles for Au and As show the distribution of concentrations in the diamictites and the top part of the basalt above the mineralization.
Minerals 11 01131 g016
Figure 17. Bubble plot of interface samples collected from 32 RC drill holes (Figure 2) showing elevated contents of Au, As, Ni, Co, Zn, and Cd over the mineralization compared to the background. The anomaly appears to be the smallest for Co, and Cd and the largest for Au, Ni, As, and Zn.
Minerals 11 01131 g017
Figure 18. Bubble plot of Fe-rich redox samples collected from 32 RC drill holes (Figure 2) showing elevated contents of Au, As, Ni, Co, Zn, and Cd over the mineralization and the background.
Minerals 11 01131 g018
Figure 19. Conceptual model of (A) the pre-Permian paleolandsurface and (B) the Permian–Cenozoic landscape evolution at the Lancefield North prospect. It shows the pre-Permian irregular topography, denudation of paleohighs, and deposition in the nearby paleolows. Fresh detrital Fe, Cu, As, Zn, Pb, Co, and Ni sulfides are trapped in a paleolow that runs parallel to the strike of the hydrothermally altered, shear zone-hosted gold mineralization. Diagenetic sulfides and Fe–Mn oxides are formed during diagenesis and weathering of the Permian cover under alkaline and oxidizing pH conditions related to the oscillation of the underlying water table.
Minerals 11 01131 g019
Table 1. Statistical analysis (minimum, maximum, average, and standard deviation) of the grain size of gold and individual sulfide mineral in the ore zone and the base of the Permian cover. A total of 33 samples were collected from the Permian cover and 3 samples from the ore zone. The column “Nr. samples” indicates how many of these samples contain grains of a particular mineral. The column “Nr. grains” indicates how many grains of a particular mineral in these samples. Chacocite, covellite and bornite is not identified in the ore zones and given the symbol “-“.
GrainGrain Size (in µm) of Heavy Minerals in the
Ore Zone
Grain Size (in µm) of Heavy Minerals in the
Permian Cover
StatisticsNr. SamplesNr. GrainsMinMaxAvgStdNr. SamplesNr. GrainsMinMaxAvgStd
Pyrite3334,2171983214133 536,37118301831
Arsenopyrite3784136651502336712322933
Chalcopyrite34501130616213010,7471190913
Sphalerite35141179141927103111801320
Pyrrhotite3257,8001714646033233,628130646
Gersdorffite3401110224231329157913
Gold21337110979196714646
Galena15216312015312343
Pentlandite2664160862768518967
Scheelite2628637344131833231
Cobaltite3361114126282519411001620
Chalcocite------2175418868
Covellite------9281531
Bornite------26103911342
Table 2. Multi-element chemical analyses completed on the bulk rock of three samples from the mineralization intersected in drill hole DKRC0051 at a depth between 155 and 158 m.
Hole NumberDKRC0051Hole NumberDKRC0051
Depth (m)155–156156–157157–158Depth (m)155–156156–157157–158
Sample Nr.07-3621207-3621307-36214Sample Nr.07-3621207-3621307-36214
SiO2 (%)44.1348.0947.54Te (ppm)0.111.951.78
Al2O3 (%)13.18.713V (ppm)222165266
Fe2O3 (%)10.6917.5315.57Zr (ppm)464869
K2O (%)0.650.230.76Hf (ppm)112
Na2O (%)1.671.062.21Nb (ppm)223
MgO (%)6.965.266.63Ta (ppm)<0.5<0.5<0.5
CaO (%)10.2910.736.46Th (ppm)0.30.40.3
MnO (%)0.150.140.14U (ppm)0.070.130.1
TiO2 (%)0.740.691.14Y (ppm)161823
P2O5 (%)0.040.060.12Ga (ppm)12.911.315.2
LOI (%)11.587.516.4Sc (ppm)342035
Au (ppb)36.139,400281,000Cs (ppm)0.90.50.8
As (ppm)88.2313365Li (ppm)32.920.630.2
S (%)0.25.44.33Rb (ppm)11.9412.9
Zn (ppm)106282125Sr (ppm)60.326.546.3
Cu (ppm)105.2401.8349.7Tl (ppm)0.20.30.7
Cr (ppm)271140189Ba (ppm)17030106
Ag (ppm)0.052.618La (ppm)2.73.63.7
Co (ppm)60.167.983.8Ce (ppm)7.19.210.2
Ni (ppm)2197592Pr (ppm)1.121.41.64
P (ppm)11110Nd (ppm)5.16.47.9
S (ppm)134Sm (ppm)1.82.12.8
W (ppm)295Eu (ppm)0.70.971.1
Be (ppm)0.70.70.6Gd (ppm)2.312.653.54
Bi (ppm)<0.10.40.4Tb (ppm)0.460.510.7
Cd (ppm)0.110.23<0.05Dy (ppm)2.783.134.22
Ge (ppm)0.530.820.95Ho (ppm)0.60.680.91
Hg (ppm)<0.050.060.61Er (ppm)1.812.092.72
In (ppm)0.080.220.13Tm (ppm)0.260.30.42
Mo (ppm)0.82.31.4Yb (ppm)1.71.92.6
Sb (ppm)0.31.72.7Lu (ppm)0.270.30.39
Se (ppm)0.774.483.64
Publisher’s Note: MDPI stays neutral with regard to jurisdictional claims in published maps and institutional affiliations.

