
Quantifying the Porosity of Crystalline Rocks by In Situ and Laboratory Injection Methods
by
Andreas Möri
1,*,†, 
Martin Mazurek
1,
Kunio Ota
2,
Marja Siitari-Kauppi
3,
Florian Eichinger
1,‡ and
Markus Leuenberger
4 1
Rock-Water Interaction, Institute of Geological Sciences, University of Bern, 3012 Bern, Switzerland
2
Geological Isolation Research and Development Directorate, Japan Atomic Energy Agency (JAEA), Tokai 319-1194, Ibaraki, Japan
3
Laboratory of Radiochemistry, Department of Chemistry, University of Helsinki, 00014 Helsinki, Finland
4
Climate and Environmental Physics, Physics Institute and Oeschger Centre for Climate Change Research, University of Bern, 3012 Bern, Switzerland
*
Author to whom correspondence should be addressed.
†
Present Address: Swisstopo, 3084 Wabern, Switzerland.
‡
Present Address: Hydroisotop GmbH, 85301 Schweitenkirchen, Germany.
Minerals 2021, 11(10), 1072; https://doi.org/10.3390/min11101072
Submission received: 6 August 2021
/
Revised: 10 September 2021
/
Accepted: 21 September 2021
/
Published: 29 September 2021
(This article belongs to the Special Issue The Hydro-Mechanics of Crystalline Rocks)
Abstract
:The porosity and pore geometry of rock samples from a coherent granodioritic rock body at the Grimsel Test Site in Switzerland was characterised by different methods using injection techniques. Results from in situ and laboratory techniques are compared by applying innovative in situ resin impregnation techniques as well as rock impregnation and mercury injection under laboratory conditions. In situ resin impregnation of the rock matrix shows an interconnected pore network throughout the rock body, consisting mainly of grain-boundary pores and solution pores in magmatic feldspar, providing an important reservoir for pore water and solutes, accessible by diffusion. Porosity and pore connectivity do not vary as a function of distance to brittle shear zones. In situ porosity was found to be about 0.3 vol.%, which is about half the porosity value that was determined based on rock samples in the laboratory. Samples that were dried and impregnated in the laboratory were affected by artefacts created since core recovery, and thus showed higher porosity values than samples impregnated under in situ conditions. The extrapolation of laboratory measurements to in situ conditions requires great care and may not be feasible in all cases.
1. Introduction
Matrix pore space, typically water-saturated under in situ conditions, represents a large water reservoir even in low-porosity crystalline rocks and thus plays an important role in solute transport and retention over long times (see for example [1,2,3]). In many concepts quantifying mass transfer in fractured media, advective-dispersive transport is thought to be limited to fractures, whereas transport into/out of the adjacent microporous matrix is dominated by diffusion [4,5,6]. In this dual-porosity concept, considered in several programmes for radioactive waste disposal, matrix porosity offers a large storage volume for radionuclides (e.g., [7,8,9,10]). It follows that a good understanding of in situ matrix porosity, its connectivity and spatial variability is required to quantify the degree to which matrix diffusion affects contaminant transport in crystalline rocks.
The potential capability of the matrix porosity to attenuate contaminant fluxes in fractures is the motivation for our study targeted at the characterisation of rock-matrix porosity, with special attention paid to potential artefacts of sampling and analysis methods. The case is strengthened by the use of a number of alternative methods pertinent to the quantification of porosity. In particular, methods characterising in situ porosity, i.e., the pore space in the undamaged and saturated rock matrix under natural stress, were compared to laboratory determinations of samples that may have been affected to some degree by artefacts of sampling, desaturation and stress release. On-site work was performed at the Grimsel Test Site (GTS), the underground rock laboratory of Nagra (National Cooperative for the Disposal of Radioactive Waste, Switzerland) in the Swiss Alps, where various experiments aiming at the characterisation of crystalline rock are carried out (e.g., [11,12]).
Most existing porosity determinations are based on laboratory methods, i.e., they were performed on core samples that were drilled at a specific depth. Given the potential mechanical damage caused by the stress release as well as by the drilling and sampling process, the extrapolation of these determinations to in situ conditions remains uncertain unless the artefacts can be quantified. Such artefacts may include an expansion of the pore space as well as increased pore connectivity.
Previous studies on porosity profiles and thin-section evaluations on granitic drillcore samples from the Grimsel Test Site by [13] suggested that the mineral grains directly exposed on the core surface (studied core diameters from 56 to 86 mm) show increased frequency of intragranular microcracks in comparison to the interior of the cores. The conclusion was that only the outermost several millimetres of the core were affected by drilling damage. Furthermore, a simple evaluation of the maximum tangential stresses around a borehole under the stress conditions at the GTS and comparison with the shear strength of the granodiorite revealed that no mechanical failure is expected at the borehole walls (maximum stress related to overburden of 450 m). This still holds true when the compressive strength of the rock is reduced by a factor of three due to the potential presence of microcracks ([14]). Both findings point to a minor influence of mechanical damage on laboratory measurements as long as the outermost parts of the drillcores are avoided. Nevertheless, the fact remains that laboratory samples experienced stress release since excavation, with potential effects on porosity and pore connectivity.
Analogous findings were made in the Äspö Hard Rock Laboratory in Sweden by [15] and at the Forsmark site by [16] for drillcore samples. No increase in pore space in terms of newly formed microcracks was observed in drillcores derived from granitic rocks. The core material at the Forsmark site was retrieved from 559 to 574 m depth, and the drilling fluid used for this depth interval was traced with iodide (I−). The core samples were then subjected to out-diffusion experiments in the laboratory. Given the negligible I− concentration in the natural pore water, the I− inventory obtained from these experiments was attributed to contamination by drilling fluid. The mass-balance calculation indicated that about 2.4% of the total water content of the samples was due to contamination, indicating a possible uptake of drilling fluid by the expansion of the pore space due to instant stress release and/or drilling damage because some of the I− entered the sample by diffusion during drilling. Additional long-term effects on porosity at later stages of sample preparation were not considered in this study.
While the case studies presented above tend to suggest that the mechanical damage due to the drilling process may have limited effects on the pore network of the drillcores, questions remain pertinent to the combined effects of mechanical damage and stress release. In low-porosity rocks, even minor effects caused by artefacts may result in a substantial relative contribution to the porosity values measured in the laboratory. Based on this situation, the main objectives of our work are (i) to compare laboratory-derived porosity data, obtained using a suite of different techniques, with those obtained under in situ conditions, (ii) to study matrix porosity at different distances from a water-conducting fracture in order to identify possible effects of matrix damage adjacent to shear zones, and (iii) to quantify the disturbing effects of drilling, sampling and drying on porosity and pore connectivity and so to provide a basis for the extrapolation of laboratory data to in situ conditions.
2. Geological Evolution
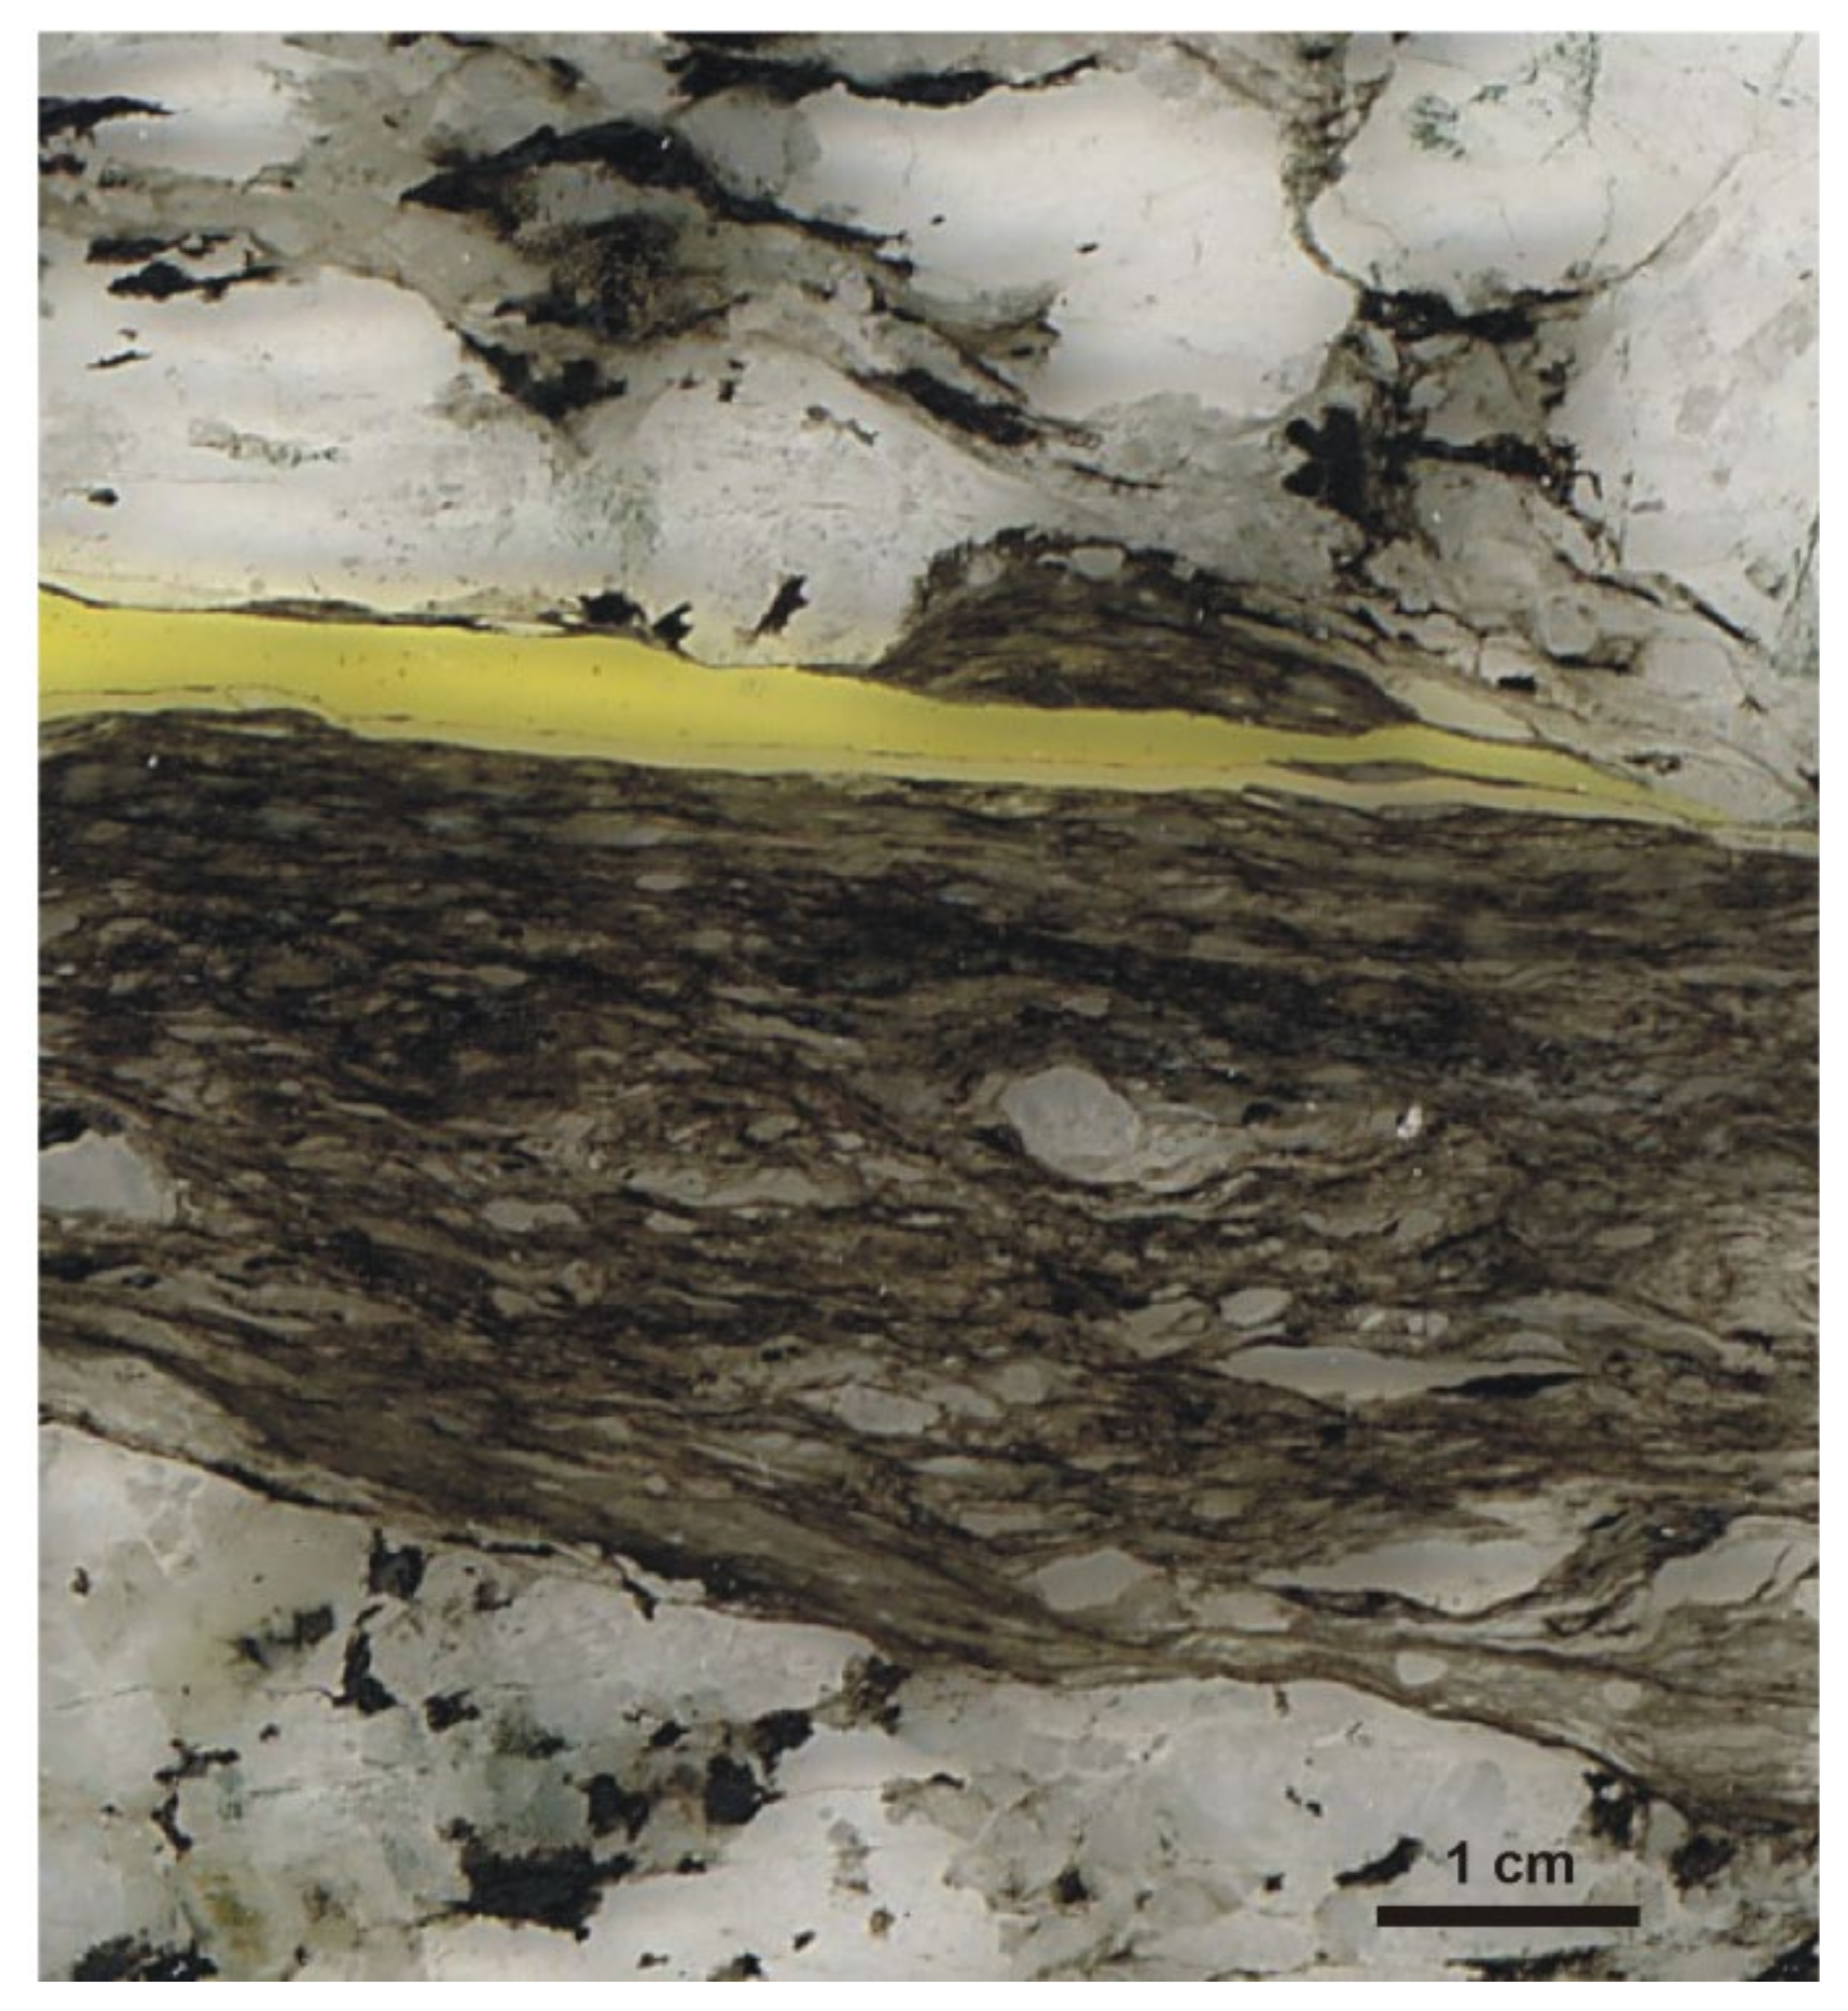
The Grimsel Test Site (GTS) is located at 1710 m a.s.l. in the Aar-Massiv (Swiss Alps), which consists of a metasedimentary envelope intruded by Hercynian granitoids, such as the Central Aar Granite and the Grimsel Granodiorite (320–280 Ma; [17,18]). Due to Alpine deformation (~25 Ma), the plutonic rocks were affected by greenschist facies metamorphism (400 °C, 2.5–3 kbar; [19]). This event resulted in a near-penetrative foliation of the rocks and in the formation of discrete, near-vertical mylonitic shear zones characterised by reduced grain sizes and major effects on mineralogical composition. In particular, the mylonites, with typical thicknesses in the range of centimetres to decimetres, are rich in micas but depleted in feldspars when compared to the surrounding rock. Post-metamorphic regional uplift resulted in the formation of brittle shear zones and fractures, frequently containing fault gouges several millimetres in thickness. Brittle deformation frequently reactivated the pre-existing mylonitic shear zones. Shear zones with gouge materials are typically located at the interface between mylonite and rock unaffected by ductile deformation. These shear zones have been used for a large number of in situ tests targeted at flow and transport in fractured media (e.g., [10,11,12]). Figure 1 shows a dark mylonitic shear zone bordered by bright granodioritic matrix rock. The fluoresceine-doped yellow resin at the transition between mylonite and granodiorite was injected in situ in order to preserve and visualise the structure.
3. Petrography and Pore Space Distribution
Weakly foliated granodiorite contains quartz (23 vol.%) and mostly albitised K-feldspar (20 vol.%), with a maximum grain size of about 2 cm. As a consequence of the greenschist facies metamorphism, quartz grains are elongated and consist of polygonal subgrain arrays or ribbons. Plagioclase (23 vol.%) was saussuritised and albitised during metamorphism. Biotite (14 vol.%) is either randomly distributed or, in zones affected by ductile deformation, accumulated in fine-grained mylonite bands. It is frequently chloritised, in particular along shear zones. The fine-grained mylonitic wallrock material along shear zones contains the same minerals as the surrounding granodiorite, but partially or completely re-crystallised and with higher contents of biotite and albite at the expense of K-feldspar and quartz [8,20].
As in other crystalline rocks, the dominant pore type in the Grimsel Granodiorite is grain-boundary pores, occurring mainly along quartz and K-feldspar grains. Maximum apertures visible under the microscope are in the micrometre range [21,22]. Additional pore types are microcracks penetrating single quartz and feldspar grains or pores within biotite aggregates, as well as solution pores in K-feldspar, which originate from the albitisation during metamorphism (see also [23,24,25]). Based on microtextural evidence and in situ resin impregnation (see for example Figure 5 below), all these pore types are connected. Isolated pores occur as fluid inclusions in minerals, but are volumetrically negligible and therefore not further considered here. The pore space in the rock matrix at the Grimsel Test Site is water-saturated. This is supported, among others, by observations reported in [10,26], where the bulk mass of core samples used for out-diffusion tests did not change over the experimental period of 4 months. In the case of unsaturated conditions, a measurable increase in mass would have been expected in such tests.
4. Samples and Methods
4.1. Samples
Samples for this study were all taken from different boreholes drilled from the galleries at the Grimsel Test Site into the Grimsel Granodiorite. Rock-matrix samples were selected at different distances from shear zones, typically reactivated mylonitic shear zones. For laboratory porosity determinations, the drillcores were heat-sealed in plastic bags immediately after recovery.
4.2. Porosity Determination of Matrix Rock by In Situ Impregnation
4.2.1. In Situ Impregnation
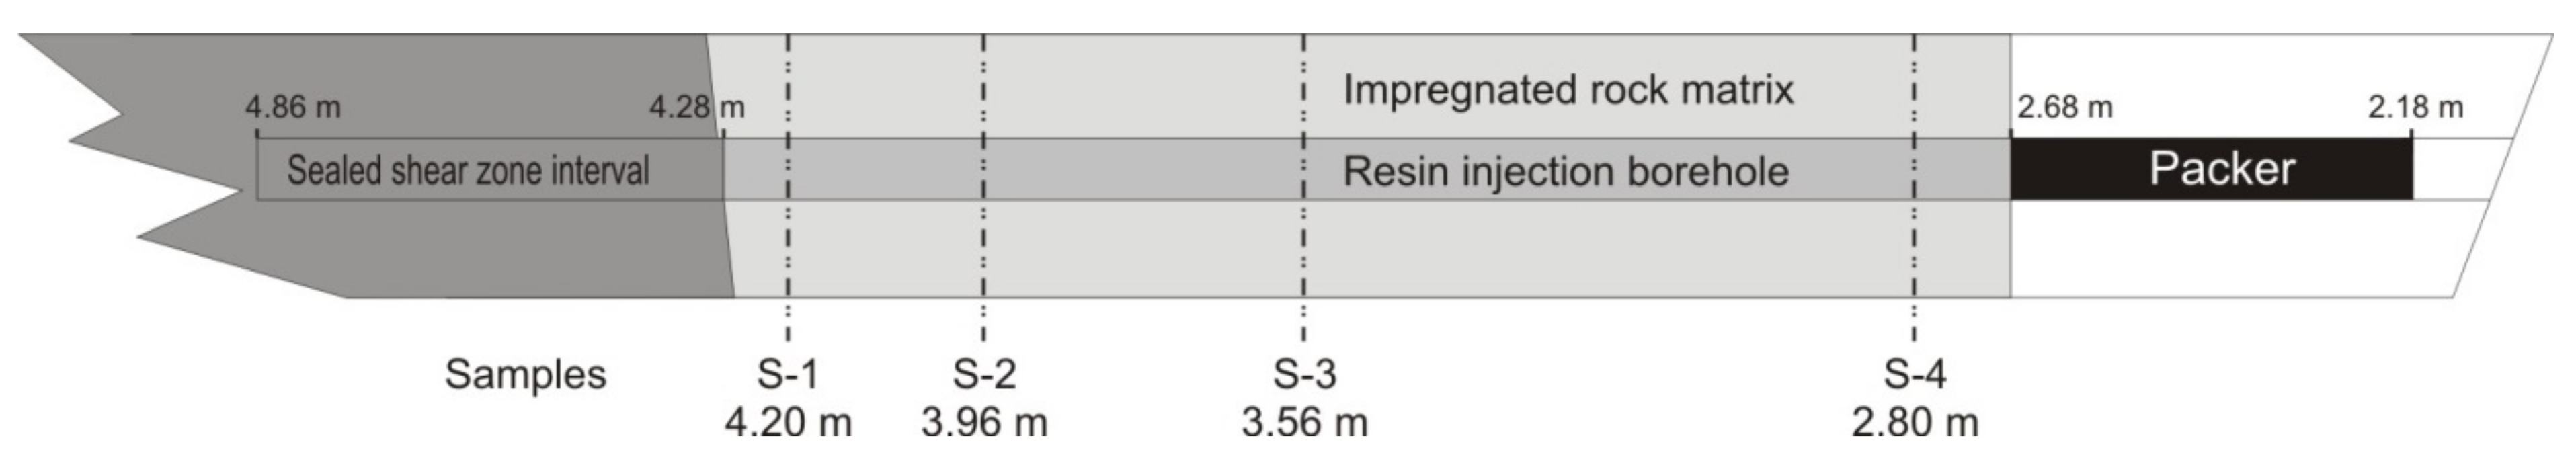
In situ impregnation of the granodiorite was achieved by injecting resin from an injection borehole with a diameter of 56 mm into the surrounding rock matrix. A brittle shear zone, located within a mylonitic shear zone at the bottom of the injection borehole, was sealed by epoxy resin to avoid any loss of impregnation resin into this transmissive structure (see Figure 2). Subsequently, a 1.60 m-long section of the injection borehole was packed off with a single packer. A purpose-made acrylic resin, called NHC-9 (the resin was developed by Nagra and Sika AG under the Nagra-JAEA Radionuclide Migration Programme at GTS and is not available as a commercial product), was used for in situ impregnation. It is completely miscible with water, and its viscosity is similar to that of water. The molecular size of only a few nanometres in the unpolymerised state is close to that of water (0.193 nm), so it is assumed that the resin accesses the same pore volume that is accessible to water. Resin polymerisation is triggered by heat and starts at temperatures above 40 °C, allowing injection times of several months under the given rock temperatures at the GTS (~14 °C). The fluorescent dye eosine was added to the resin for pore visualisation under UV light in the macro- and microscale. Shrinkage of the NHC-9 resin during polymerisation is limited, as the density change is only about 4% (liquid density is 1.07 kg dm−3 and the density of the polymerised resin is 1.12 kg dm−3).
The acrylic resin was injected with a maximum injection pressure of 630 kPa, which is higher than the in situ pore-water pressure of about 450 kPa allowing the resin to replace the pore water. The injection lasted 113 days, and a total mass of 1.1 kg of resin was injected into the rock matrix. Resin polymerisation in the rock matrix was achieved by a borehole heating system which was installed in the injection borehole, applying a maximum temperature of 125 °C during about 3 weeks. The impregnated rock volume was subsequently retrieved by overcoring, using a 300 mm single core barrel equipment.
4.2.2. Porosity Determination with a Carbon-Nitrogen-Sulfur (CNS) Analyser
After retrieval, four rock slices with a thickness of 4 cm were cut from the overcore (samples S-1 to S-4 in Figure 2). Samples of 50 to 60 cm3 (covering about 14 cm2 of the slab surface) were ground to a grain size of <2 µm. The mass fraction of resin in the impregnated rock samples was quantified by measuring their carbon content, assuming that all carbon originates from resin (the pure polymerised resin contains 55 wt.% C).
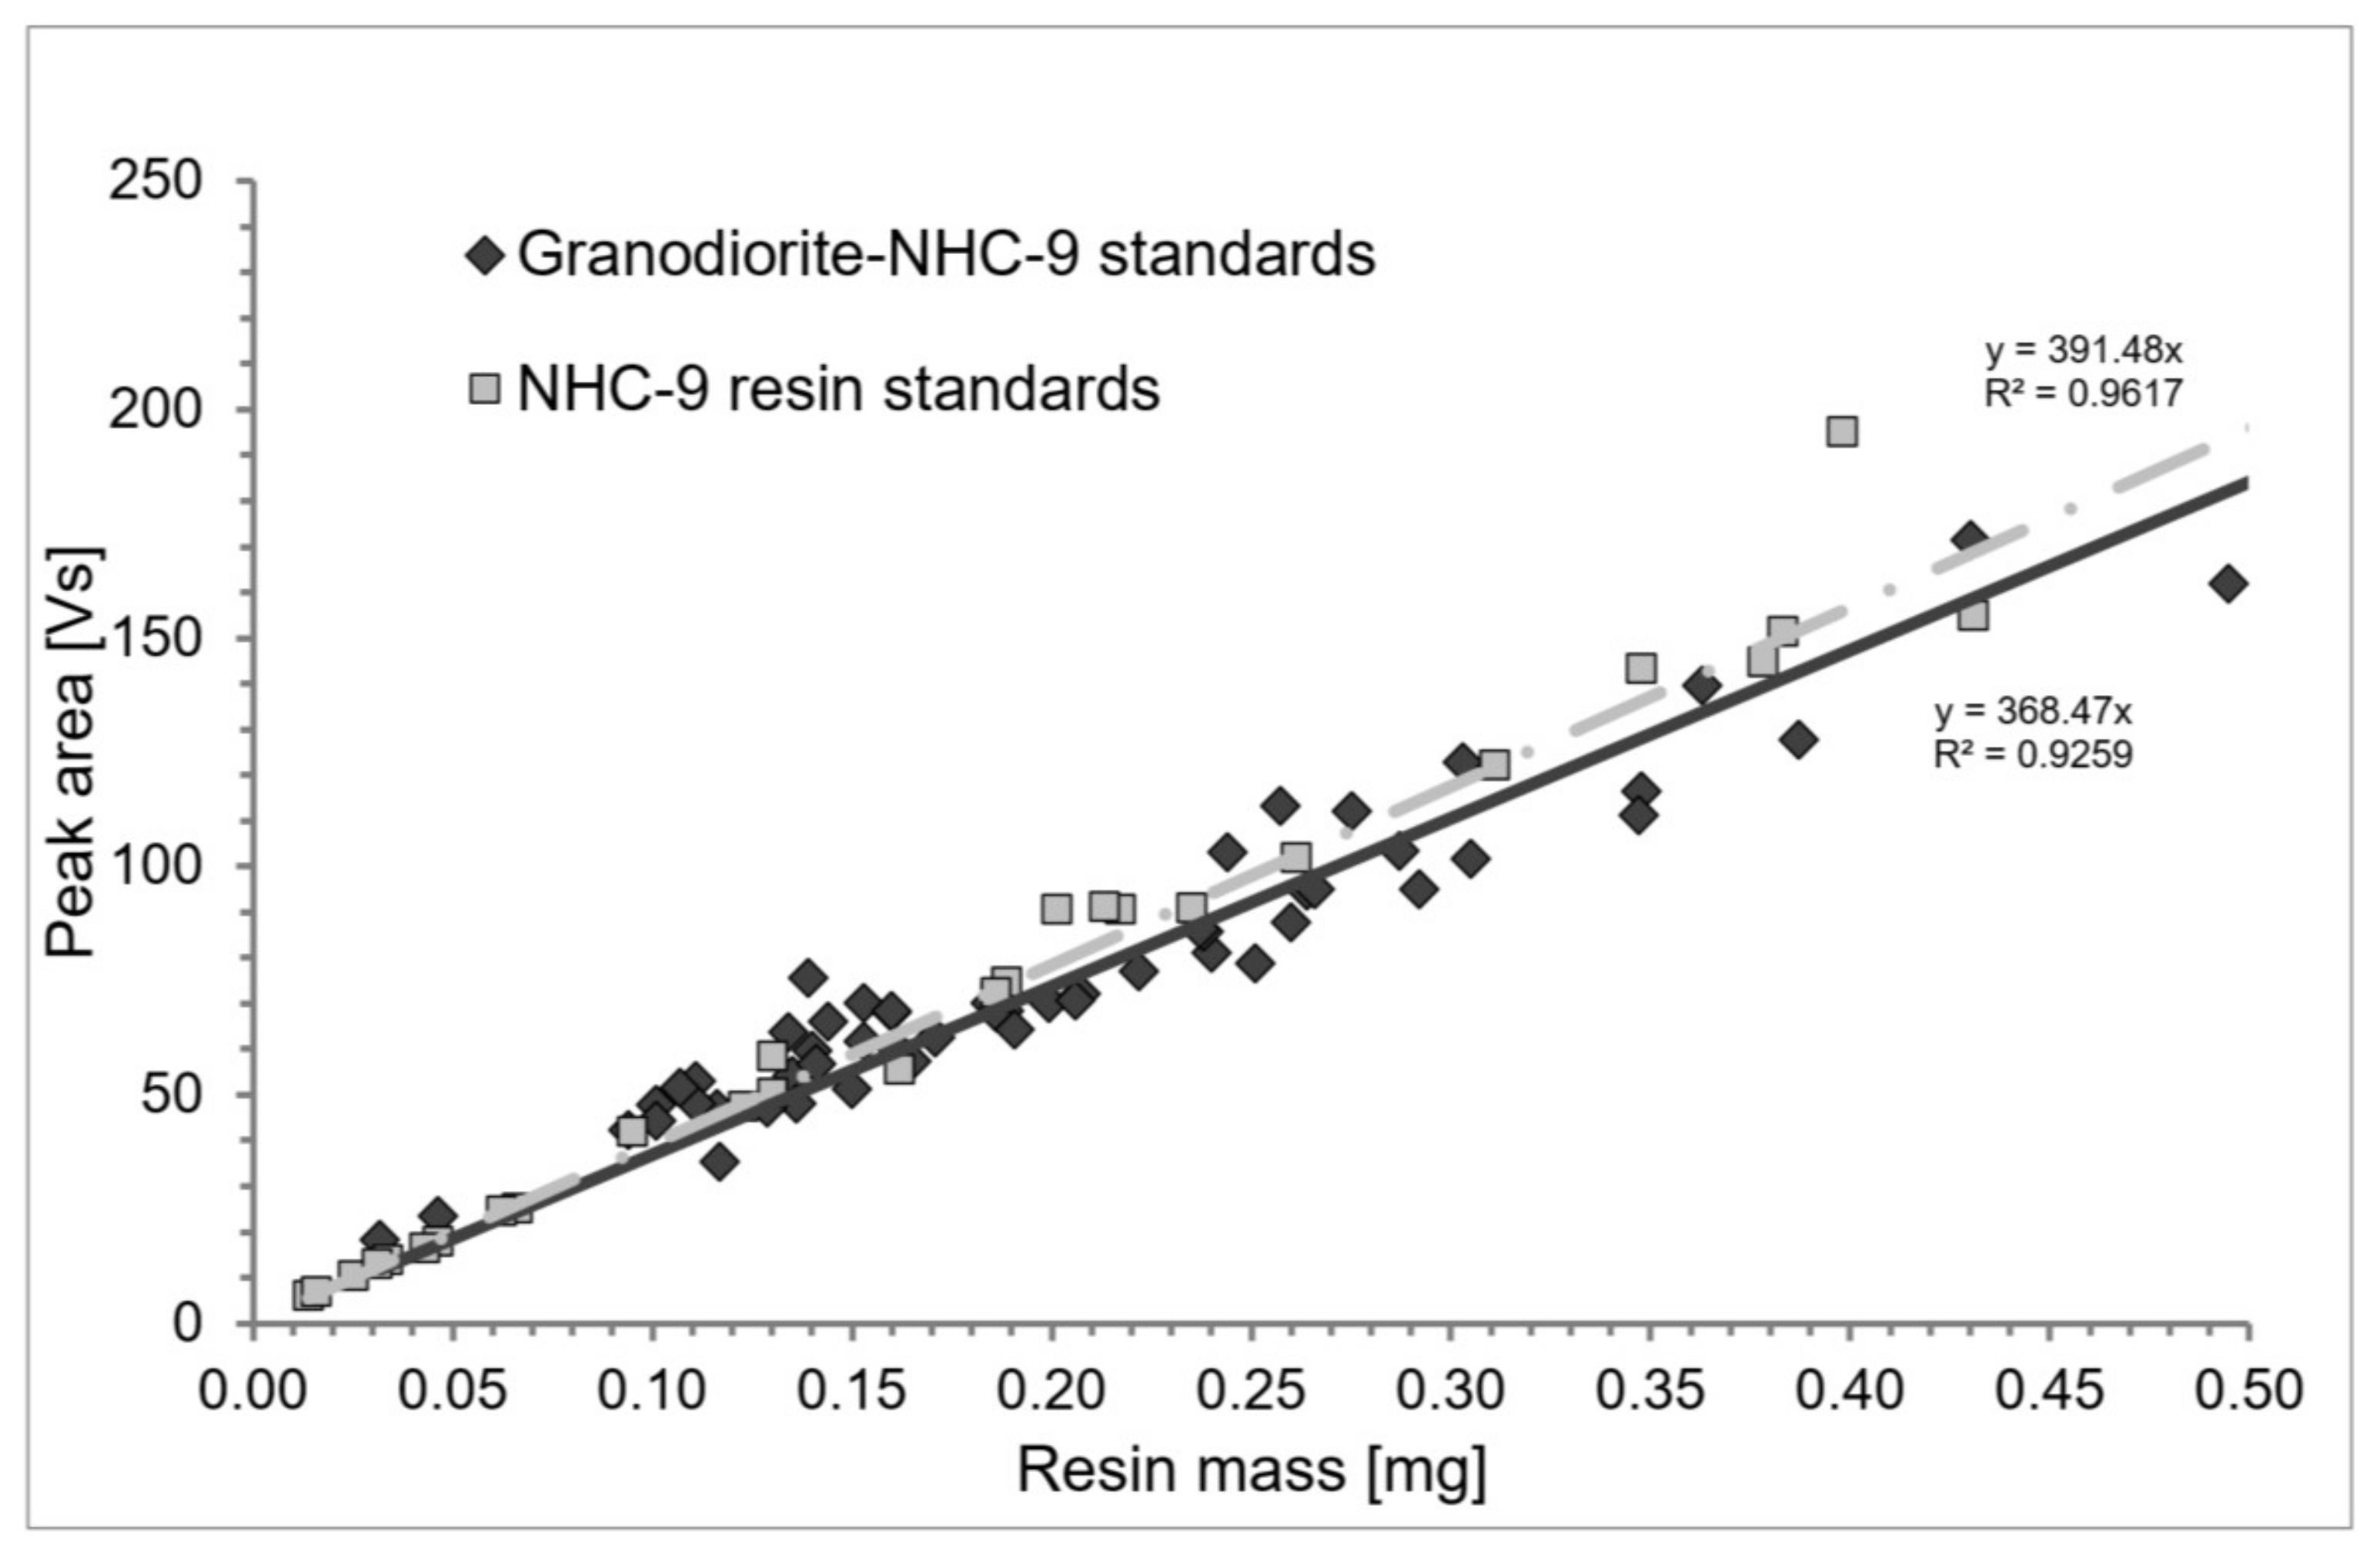
Forty-six samples were analysed from the in situ impregnated matrix rock, in addition to 20 samples of unimpregnated granodiorite matrix. Triplicates of 90–160 mg of the ground material were analysed with a carbon-nitrogen-sulphur element analyser (NC 2500, Carlo Erba, Italy) after controlled and instantaneous sample combustion at 1100 °C (dynamic flash combustion). Merck cellulose standards were measured in order to determine the efficiency of the analyser and to identify instrument drift. Unimpregnated rock samples, pure resin samples as well as artificial resin-rock mixtures were regularly measured, in order to detect memory effects within the analyser. Carbon contents of the samples were determined with a ThermoFisher Scientific Deltaplus mass spectrometer (Delta Plus XL, ThermoFisher Scientific, Bremen, Germany) (see [27] for details). Background carbon contents in unimpregnated granodiorite were found to be low, in the order of 0.015% of the carbon content in the pure resin. Standards consisting of pure resin and of artificial mixtures of rock and resin show a linear correlation between resin mass and peak area (Figure 3). Errors are given as the standard deviation of multiple measurements on 34 pure resin samples and are ±8%.
From the mass of injected resin and the total sample mass, the impregnated porosity was calculated using the following equations:
where m is the mass (g), δresin is the density of solid resin (g cm−3), δgrain is the grain (skeletal rock) density (g cm−3), Volmin is the volume of the mineral grains and n represents porosity (vol.%).
4.2.3. Porosity Determination by Infrared Light Absorption
The method was based on the same principle as the method above but includes another analytical approach to determine the carbon content in granodioritic rock samples (for details see [28]). It was applied to obtain a small-scale profile (10 samples within a distance of 2 cm) of the carbon content in a granodiorite sample impregnated in situ by NHC-9 resin.
Triplicates of 50–55 mg rock powder with a mixed reaction accelerator including tungsten (1.5 g) and tin (2 pellets) were placed in a ceramic crucible for combustion at 1350 °C in purified oxygen flow for 41–52 s in a high-frequency induction furnace. A Horiba EMIA-920V carbon/sulphur analyser was employed for the analysis and allowed appropriate combustion control and real-time simultaneous detection of CO, CO2 and SO2. The errors of carbon analysis were estimated by replicate analyses of the standard material with a standard deviation of 2.8%. Porosity calculation was performed according to the equations described above.
4.3. Porosity Determination of Matrix Rock by Impregnation in the Laboratory
4.3.1. 14C-PMMA Porosity Determination
The 14C-PMMA porosity method was developed at the University of Helsinki and is described in [29,30,31,32,33]. The method allows for visualising and quantifying the spatial distribution of pore spaces in the rock at the micrometre to centimetre scale by evaluating autoradiographs of rock samples after impregnation with a 14C-doped methyl-methacrylate (MMA) resin.
Four core samples (diameter 4.3 cm; height 2 cm) were taken at different distances from a mylonitic shear zone (see Figure 2). The samples were dried in a vacuum at 100 °C for 8 days. The 14C-PMMA with an activity of 518 kBq mL−1 was added directly into the cooled vacuum chamber. Impregnation lasted for 11 days. For polymerisation, samples were irradiated with a 60Co source in sealed containers with a total dose of 70 kGy. Impregnated samples were sawn and polished with silicon carbide (mesh 400) and heated to 120 °C for three hours to remove luminescence effects (which would leave a signal on the film and so would disturb the signal of 14C in the resin) from quartz and feldspars caused by irradiation. The polished surfaces were contacted with KODAK BioMax MR Film for 7 to 14 days and then digitised. The optical densities were calibrated using standard resins covering a suite of known 14C contents. The error for the method is ±10%. The spatial resolution of the method depends mainly on the path length of the electron emitted during the decay of 14C and is about 60 µm.
4.3.2. Mercury Porosimetry Measurements
Three samples were analysed by mercury porosimetry for complementary measurements on impregnated and unimpregnated rock material. Porosimetry measurements were carried out using a Porotec Pascal 140 + 440 instrument (ThermoFisher Scientific, Bremen, Germany) working with a maximum injection pressure of 300 MPa. Sample size was technically limited to a sample diameter of 7.8 mm, and 5.8 to 7.0 g of rock were used for the measurements. Measurements were carried out on two granodiorite samples as well as on a sample from a mylonite. One granodiorite sample was previously impregnated in situ with the NHC-9 resin in order to quantify porosity that was potentially created after the sample was recovered.
5. Results
5.1. Visualisation of Matrix Pores
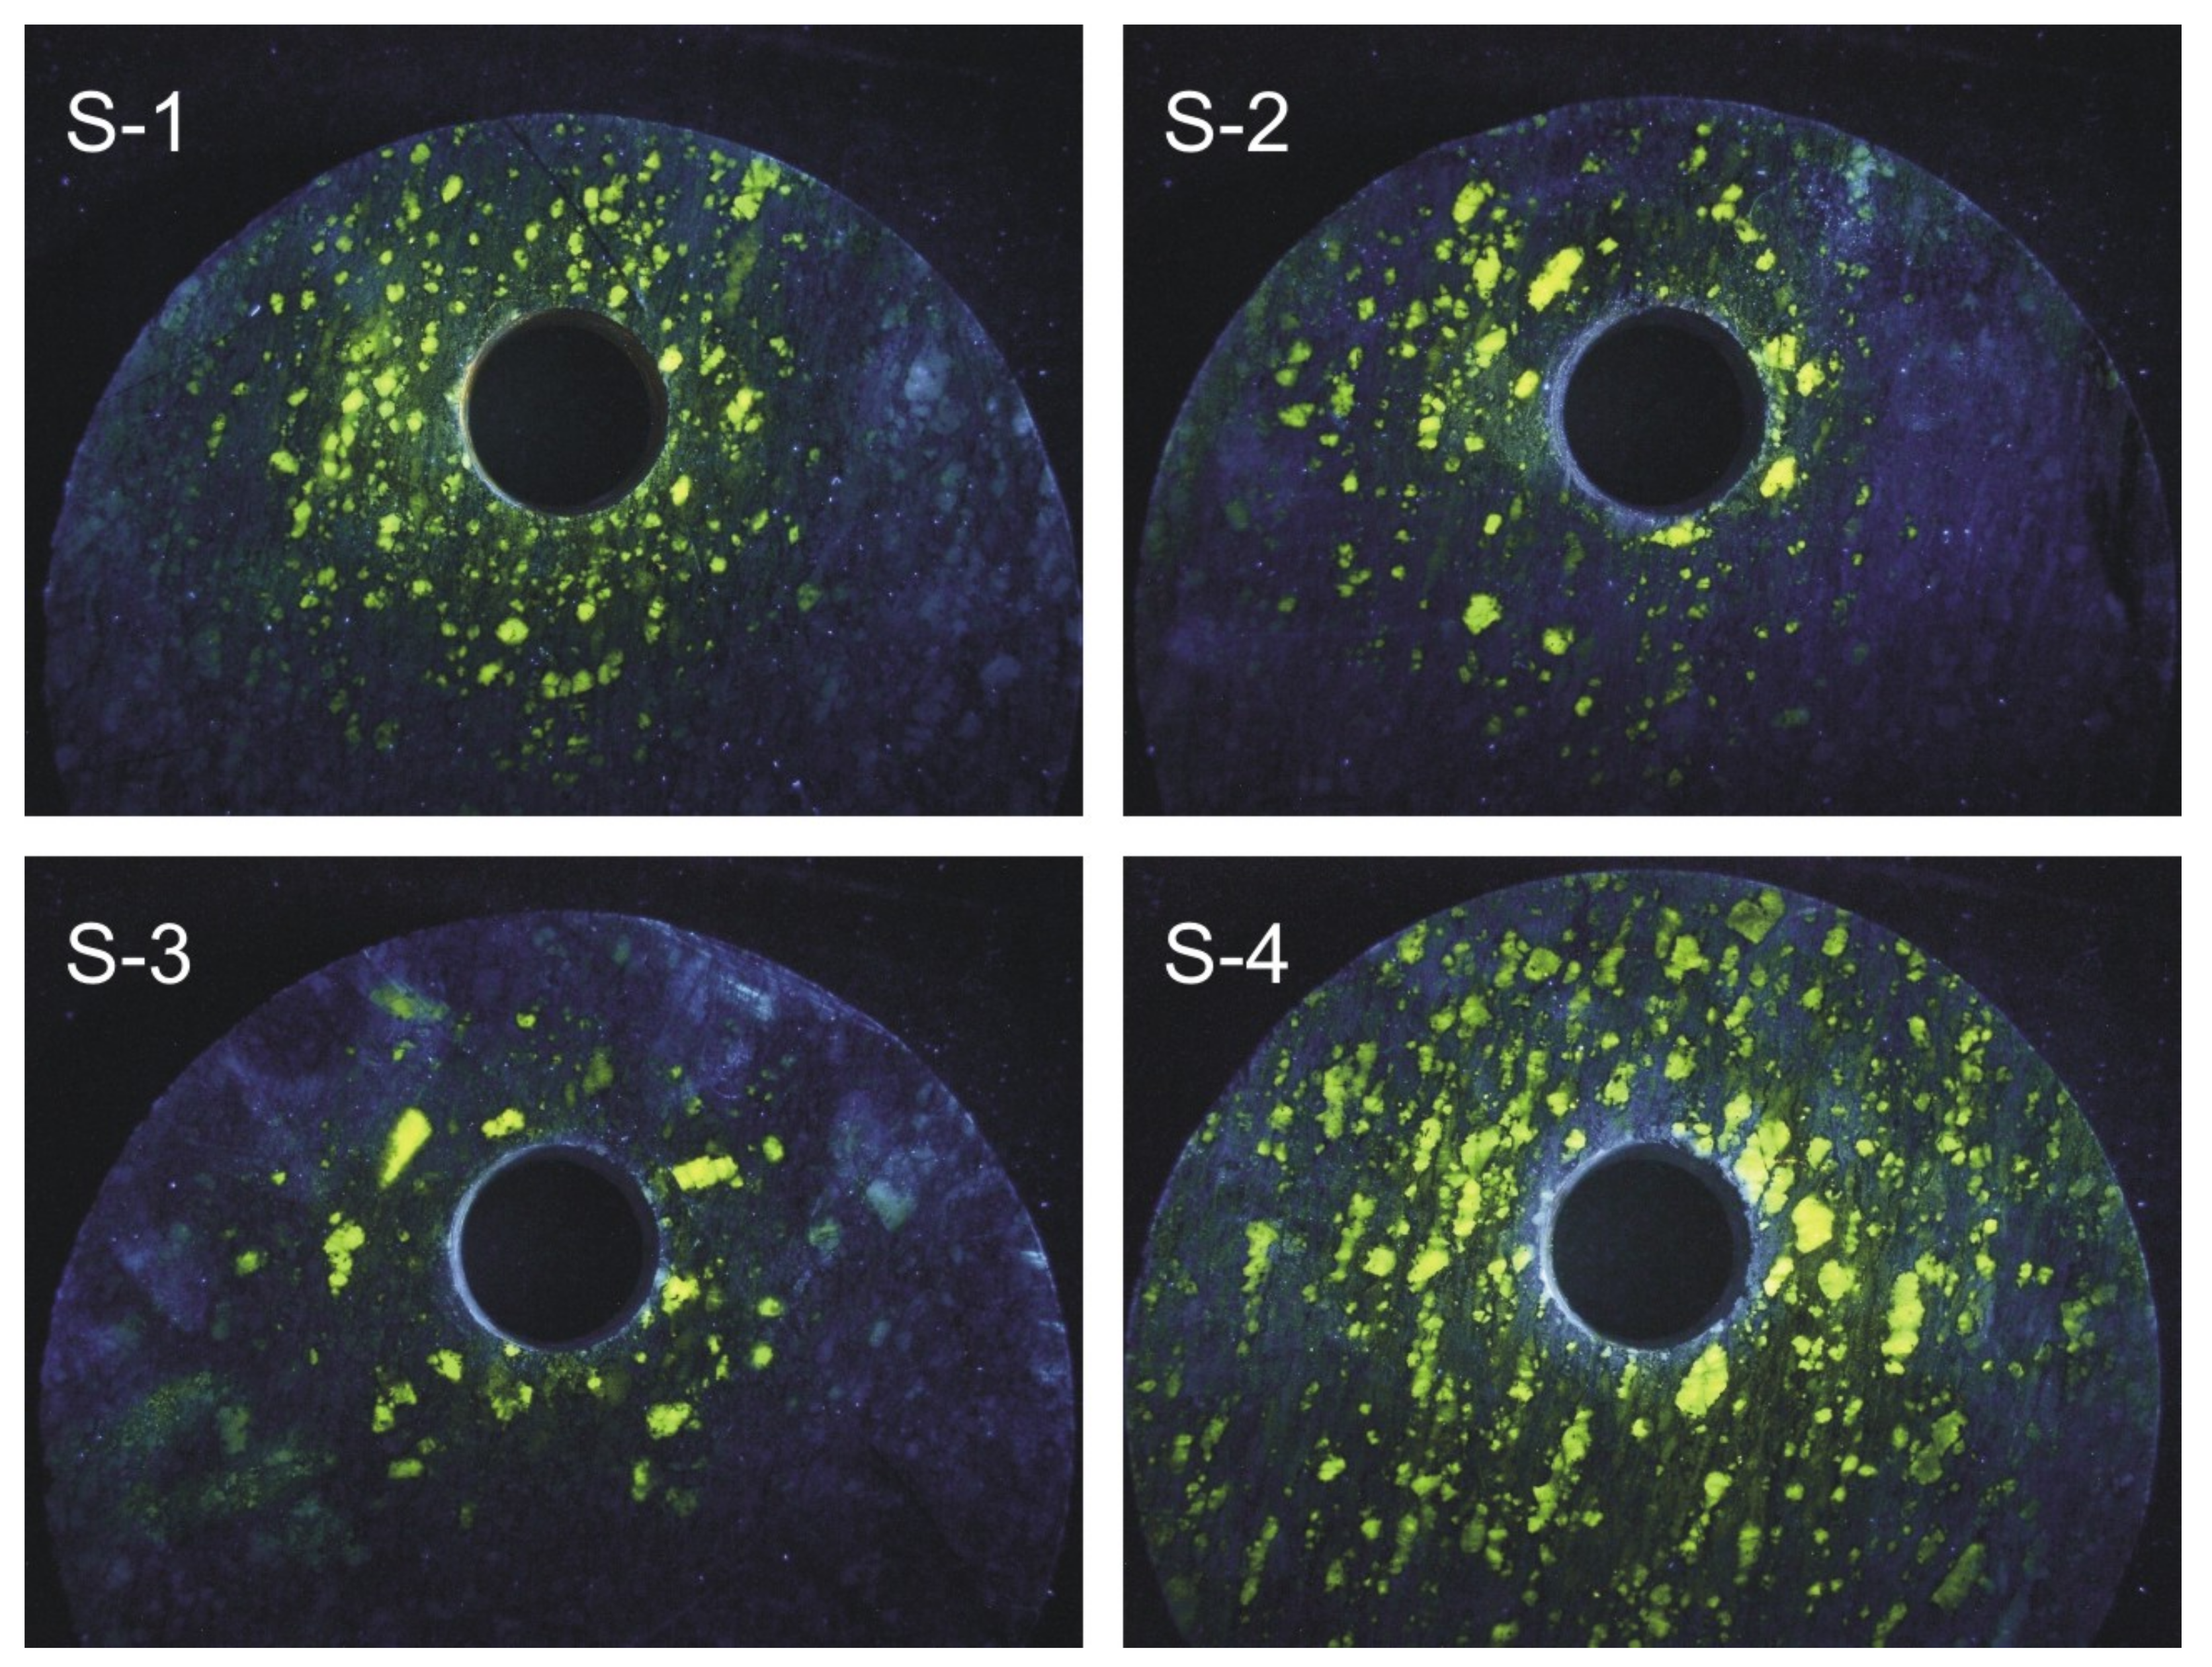
In Figure 4, the resin injected in situ into rock slabs S-1 to S-4 (localisation in Figure 2) is visualised under UV light. The resin penetrated the granodiorite matrix to distances of several cm, in one case beyond 15.8 cm away from the injection borehole (i.e., beyond the outer surface of the overcore). The anisotropic impregnation halos around the injection borehole penetrate more deeply in the direction parallel to foliation, with a mean aspect ratio for impregnation depth parallel and normal to foliation of about 1.3. The depth of resin penetration well exceeds the zone in which drilling-induced damage of the fabric can be expected (a few millimetres around the injection borehole). Figure 4 shows four slab surfaces from the impregnated interval under UV light at distances of 8 cm, 32 cm, 72 cm and 148 cm away from the shear zone. The degree and depth of matrix rock impregnation do not depend on the distance of the samples from the shear zone.
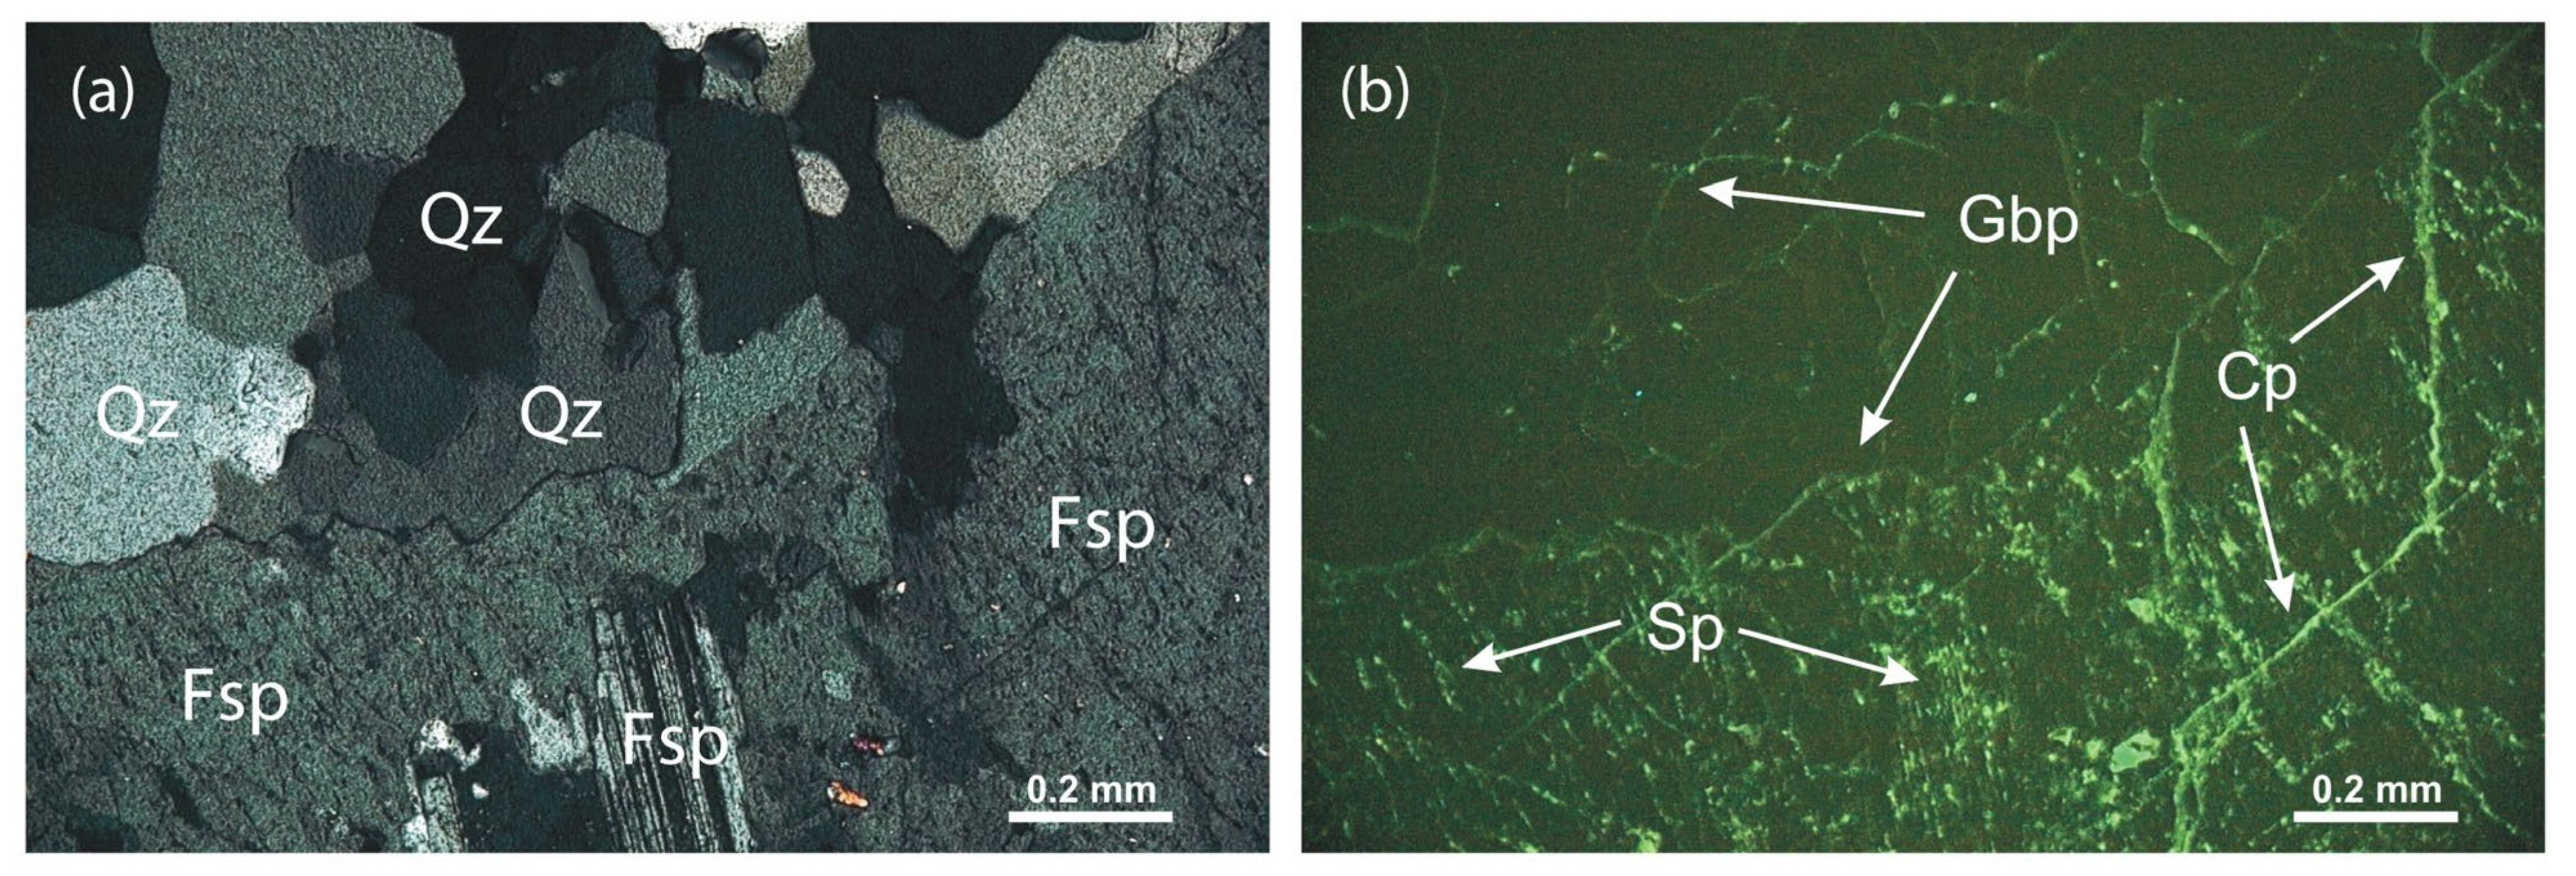
Microscopic inspection of the in situ impregnated drillcore (Figure 5) shows the conspicuous impregnation of large feldspar grains, whose porosity originates from albitisation during Alpine metamorphism and essentially represents solution pores and transgranular microfractures (crack pores). A network of grain-boundary pores provides good connection to the feldspar grains, which together build the connected pore-water reservoir in the rock matrix.
5.2. Porosity of the Rock Matrix Based on In Situ Resin Impregnation
5.2.1. CNS Analyser Measurements
Porosity values for slabs S-1 to S-4, obtained by quantifying the carbon (and therefore pore-filling resin) content using the CNS analyser, are shown in Table 1. Each porosity value of a sub-sample itself represents the average of three to five measurements of rock powder. Mean in situ porosity values for massive granodiorite are between 0.21 and 0.31 vol.%. Slightly higher values between 0.31 and 0.46 vol.% were found for weakly foliated granodiorite.
5.2.2. Small-Scale Porosity Profile Determined by Infrared Light Absorption
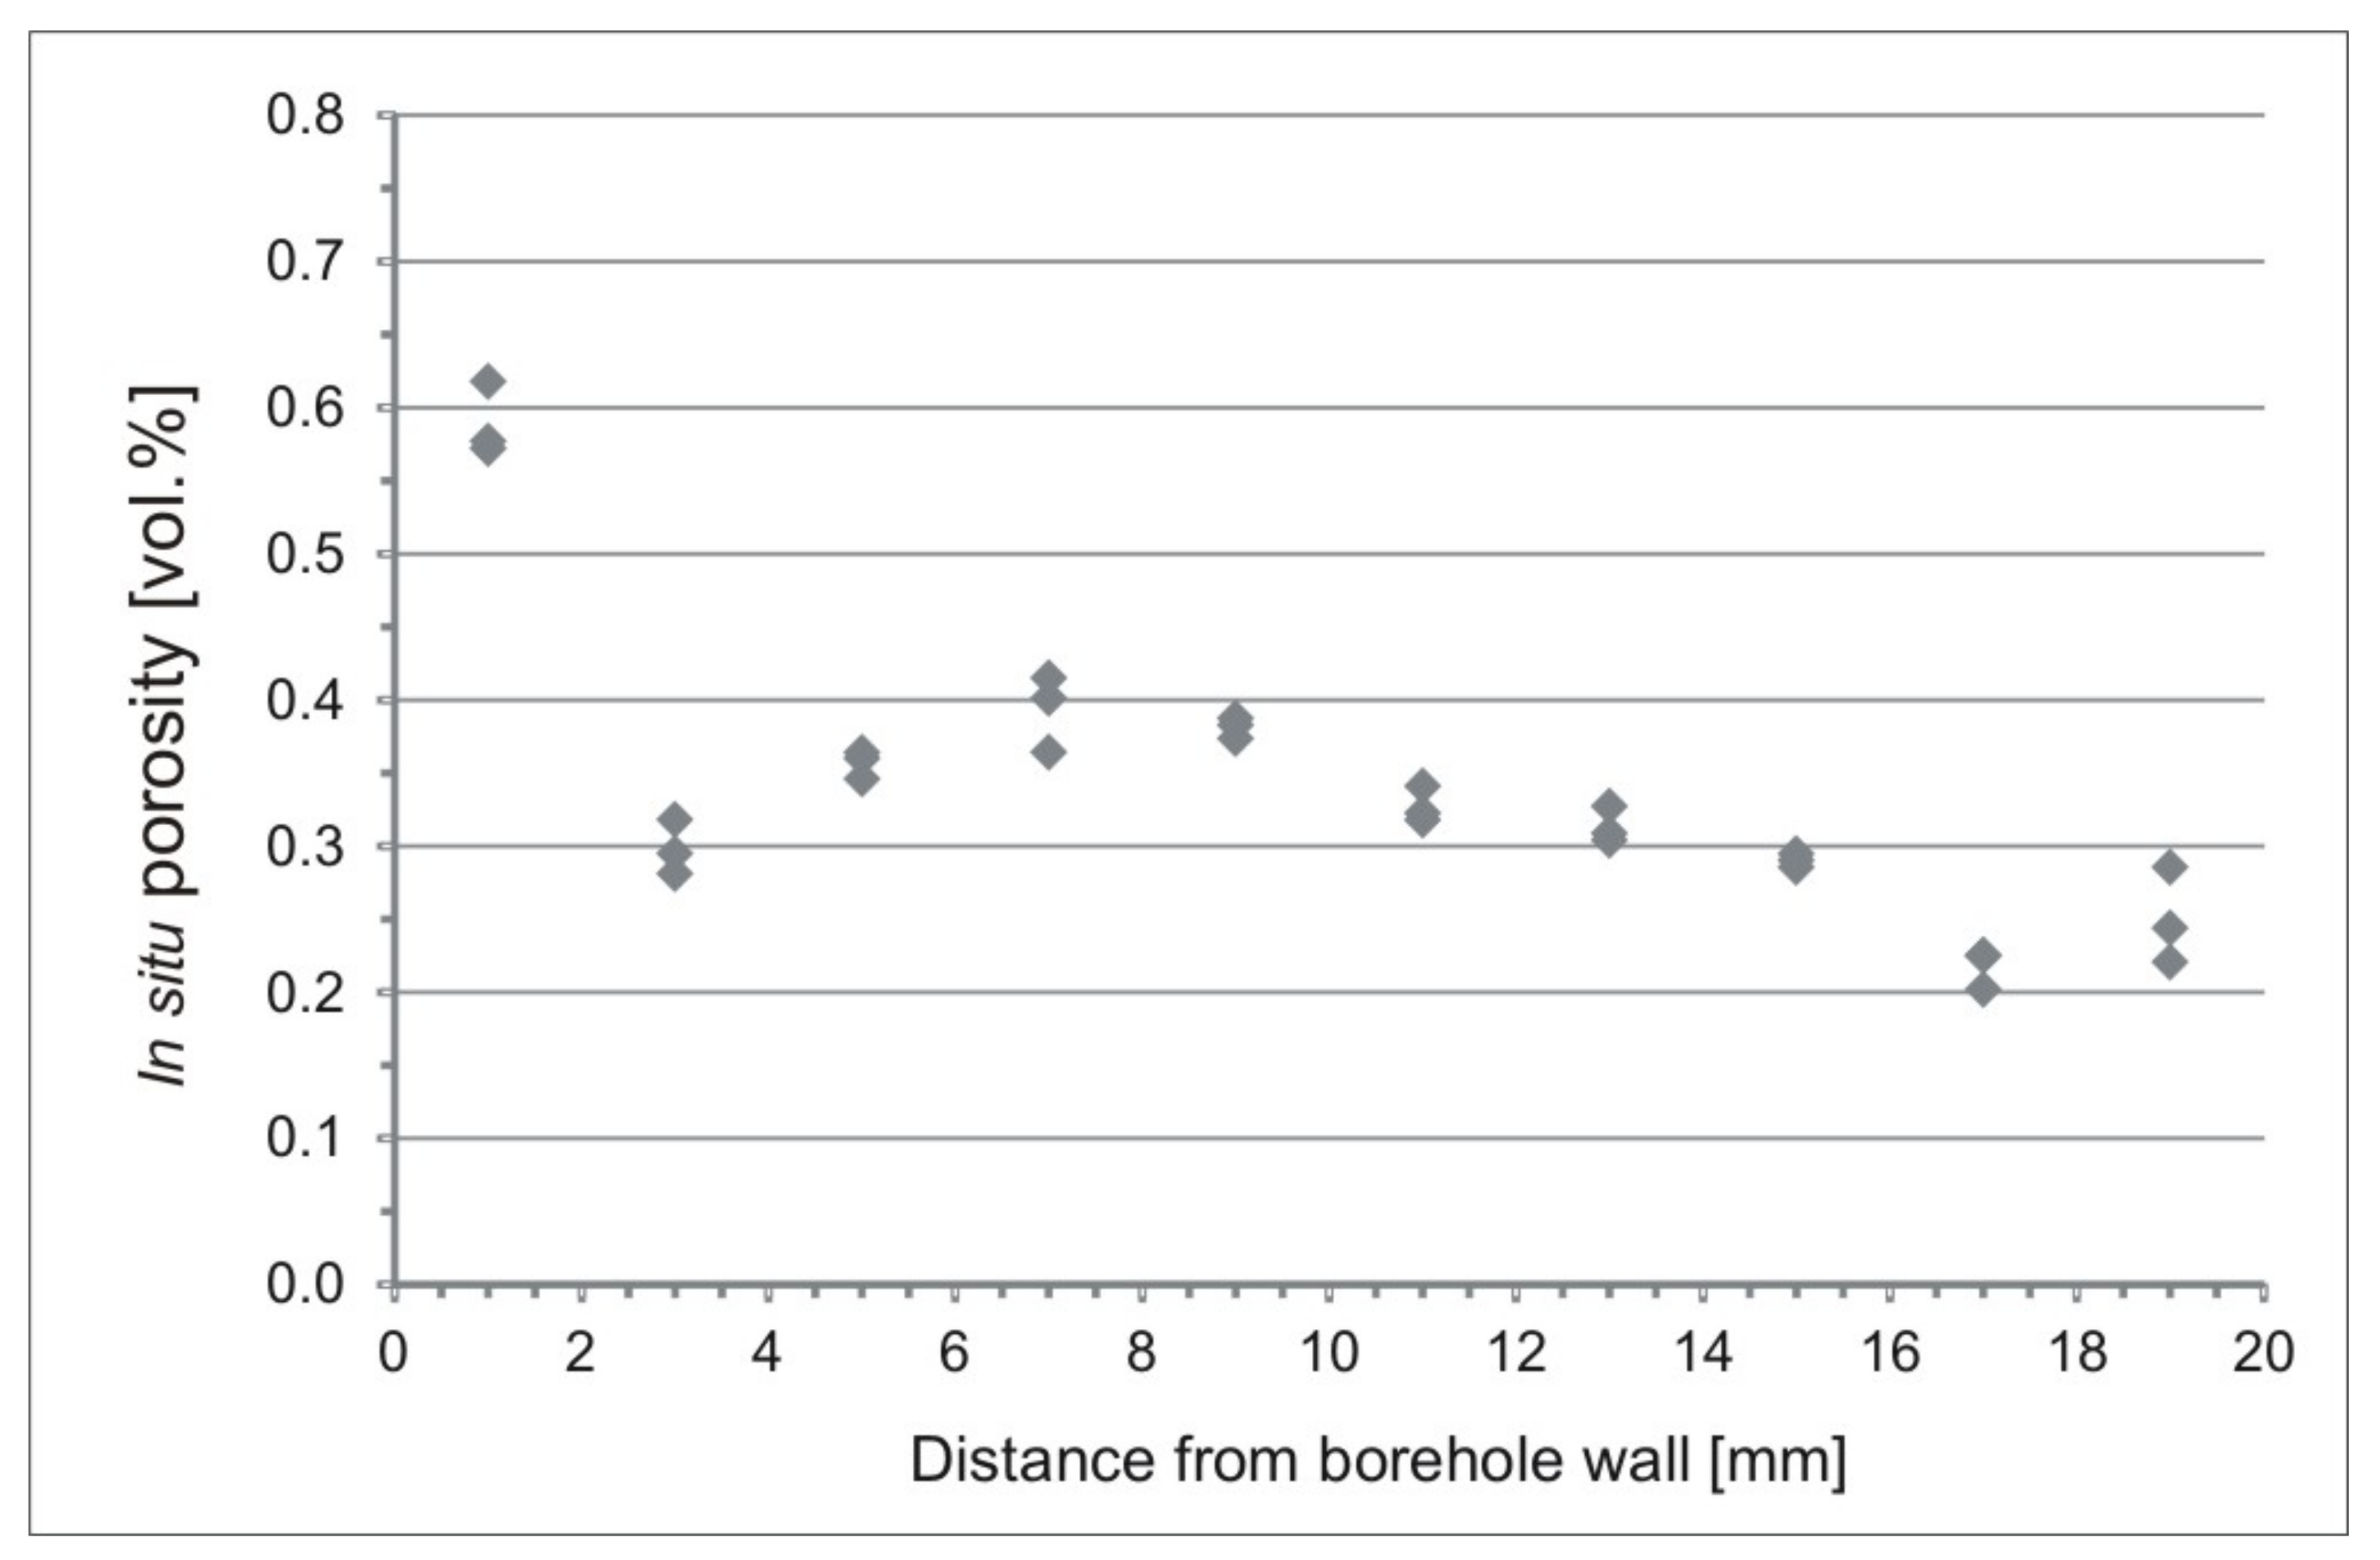
The porosity values from 10 sub-samples taken in massive granodiorite within the first 2 cm away from the injection borehole are presented in Table 2 and in Figure 6. The rock matrix in the first sub-sample adjacent to the borehole wall has an elevated in situ porosity of 0.59 vol.%, while at distances ≥3 mm, the values are lower (0.22 to 0.39 vol.%) and do not show any systematic dependence on the distance to the borehole wall.
5.3. Porosity of the Rock Matrix Based on Rock Impregnation in the Laboratory
5.3.1. Porosity Determined by 14C-PMMA Rock Impregnation in the Laboratory
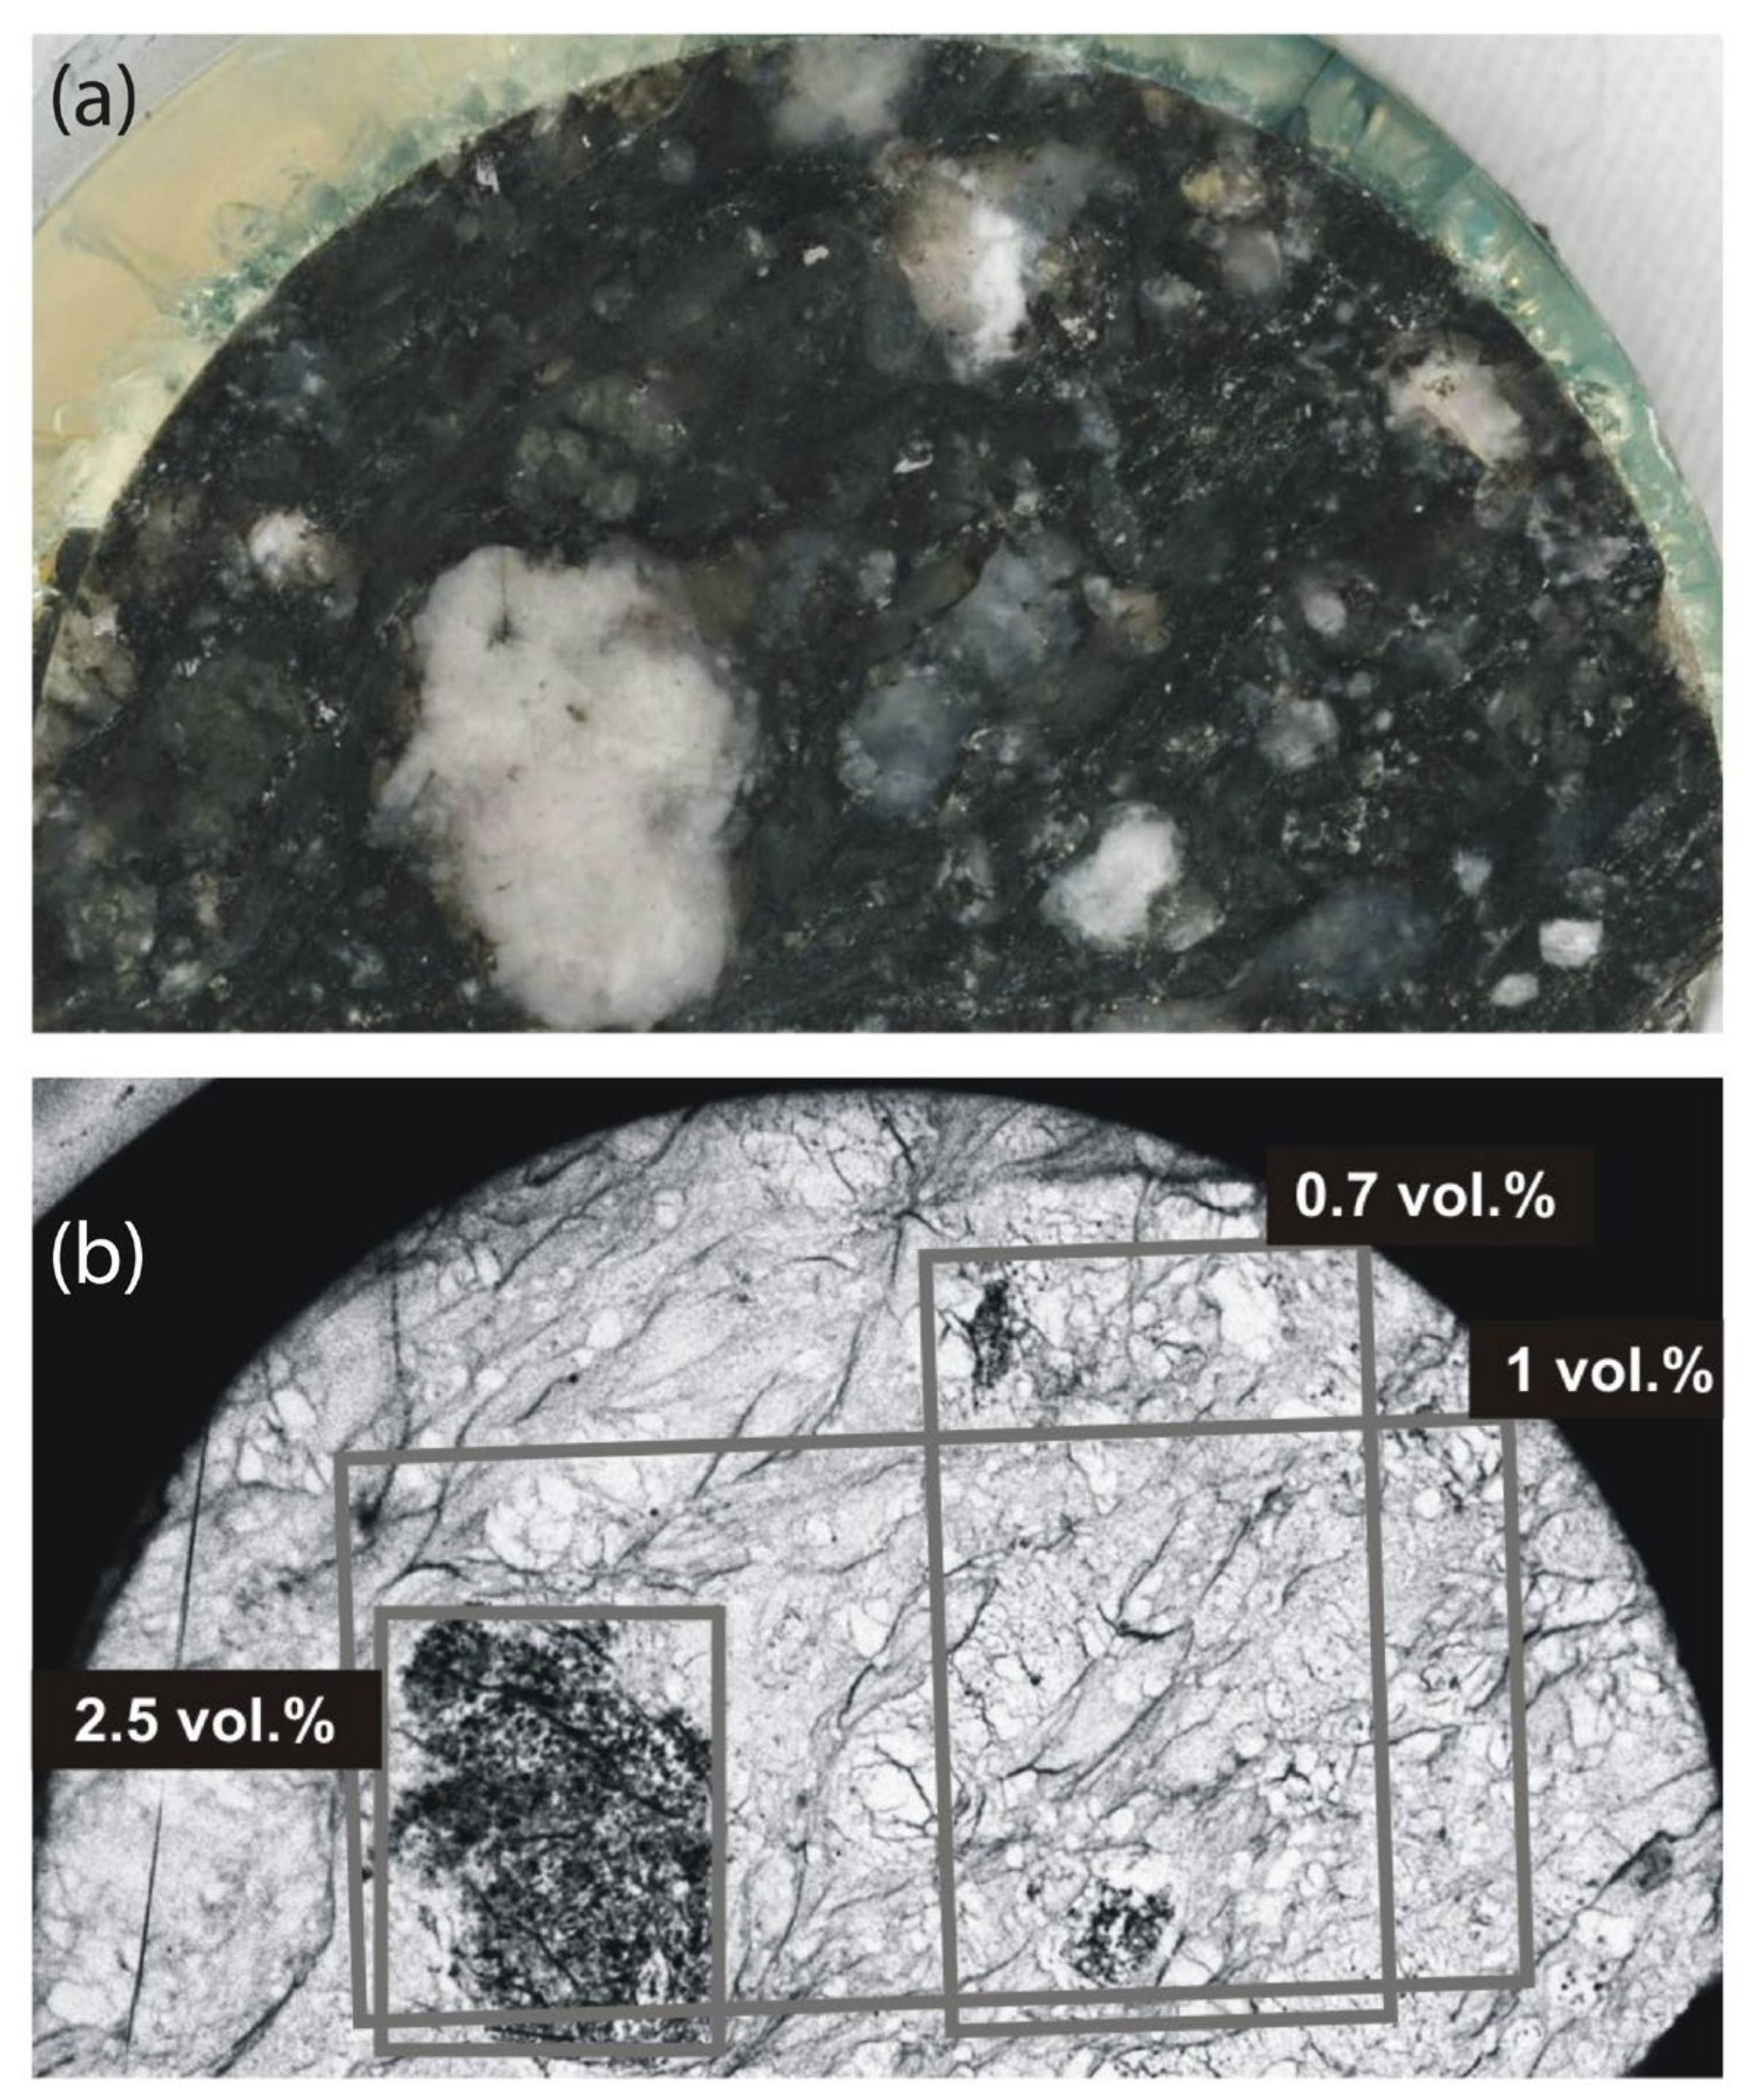
The porosity of massive to weakly foliated granodiorite obtained from rock samples impregnated in the laboratory by 14C-PMMA varies between 0.6 and 1.1 vol.% (Table 3). Single feldspar grains show increased porosity, with values of up to 2.5 vol.% (Figure 7), due to the alteration of magmatic feldspars during metamorphic overprint. Figure 7 also illustrates the pore geometry on a scale of centimetres, in particular an interconnected network of grain-boundary pores and transgranular microfractures (crack pores) and the porous feldspar grains (solution pores).
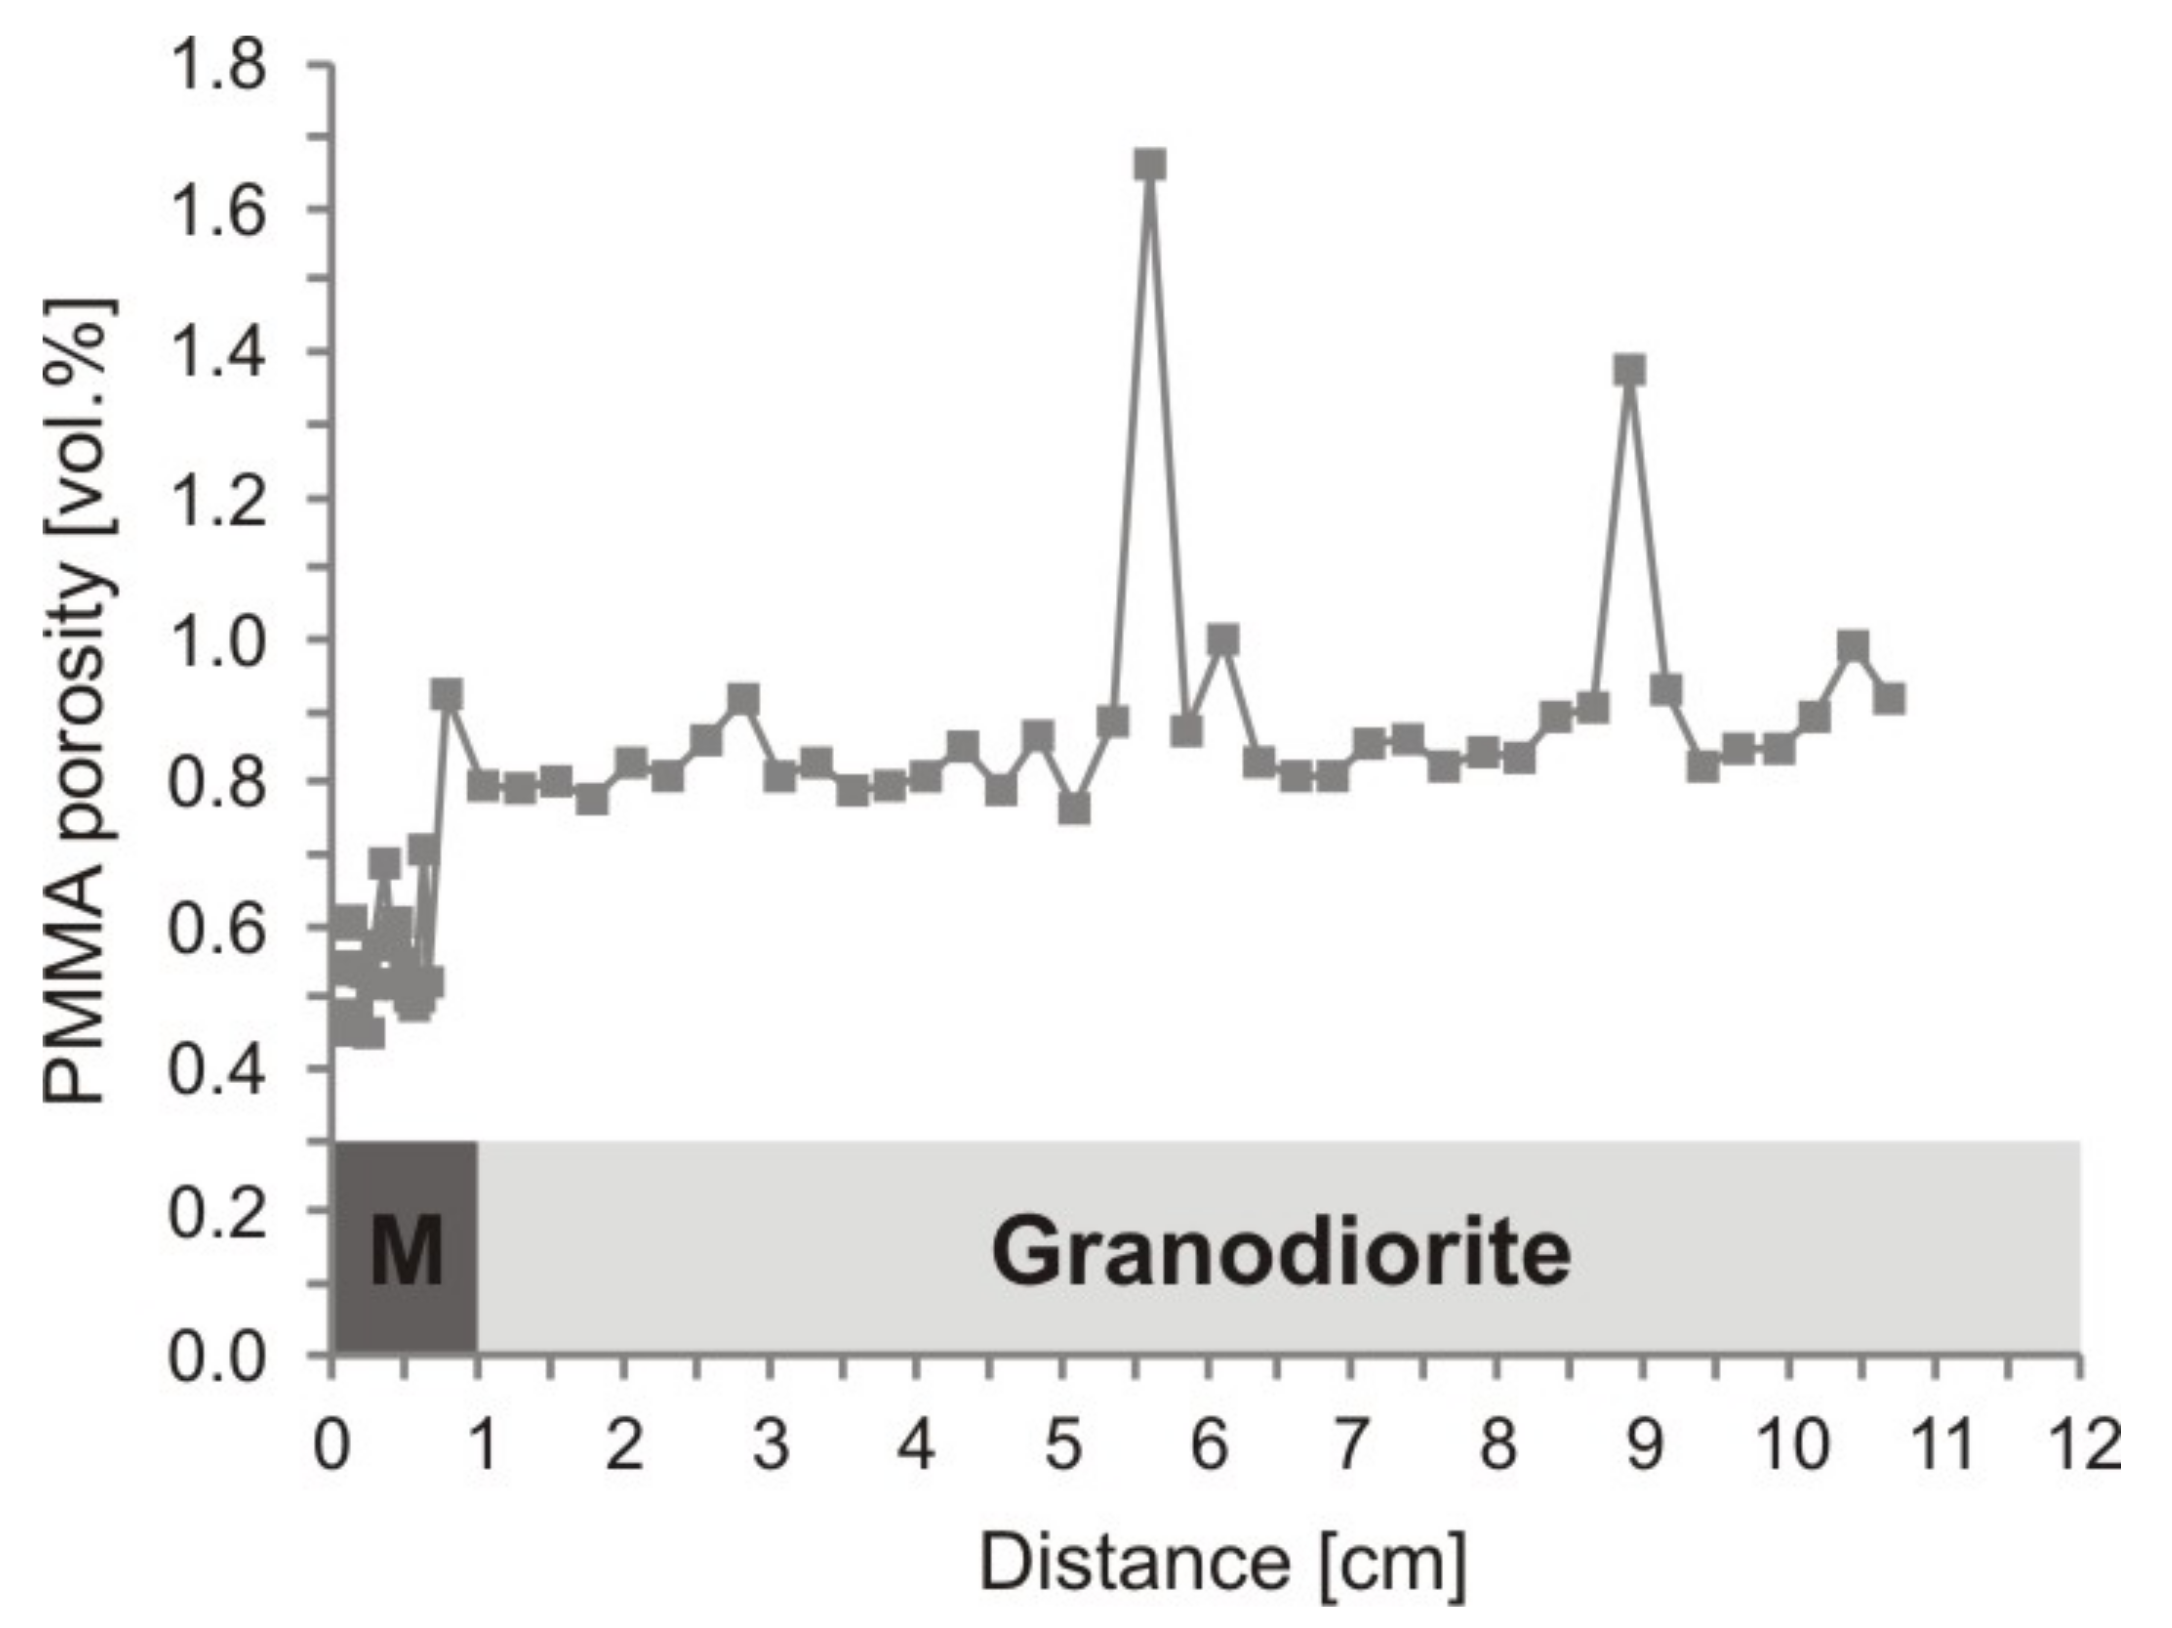
A porosity profile was acquired from a brittle shear zone lined by a thin mylonite band into granodiorite (Figure 8). The mean porosity in the fine-grained and strongly foliated mylonite in the first centimetre of the sample is 0.55 ± 0.06 vol.%, which is distinctly lower than in undeformed granodiorite, which shows a mean porosity of 0.8 vol.%. The outliers with values higher than 1 vol.% are related to mineralogical heterogeneities (feldspar grains) as described above.
5.3.2. Mercury Injection Porosimetry
Mercury injection measurements (Table 4) were carried out on massive granodiorite samples from slab S-1 as well as on a mylonite sample from the shear zone. The porosity of the unimpregnated granodiorite is 0.75 vol.%. and the mylonite sample shows a significantly lower porosity of 0.43 vol.%. Sample S-1i, which was selected from the in situ impregnated part of slab S-1, yields 0.31 vol.%. The in situ impregnated granodiorite follows the pore size distribution of the unimpregnated massive granodiorite. It is remarkable that measurable mercury-injection porosity is obtained for a sample that was already impregnated in situ.
6. Discussion
6.1. Integration of Porosity Data
Table 5 integrates porosity data obtained by the different injection methods and from different lithologies (massive or weakly foliated granodiorite, mylonite). An internally consistent picture emerges when distinguishing values interpreted to represent (i) in situ porosity, (ii) porosity under laboratory conditions, and (iii) porosity created since core recovery (laboratory methods applied on samples that were already impregnated in situ). There is also a systematic pattern when considering the different lithologies, i.e., different degrees of ductile deformation, extending from massive granodiorite to mylonite.
6.2. Pore Types and Lithological Effects
The dominating pore network within the granodiorite consists of grain-boundary pores extending around the main mineral components, such as quartz and feldspar grains. However, a considerable contribution to total porosity was also found in solution pores within feldspar grains. Autoradiographs from 14C-PMMA-impregnated rock samples offer the possibility to study mineral-specific porosity variations in the rock matrix. Porosity may reach up to 2.4 vol.% in feldspar phenocrysts. Magmatic feldspars are unstable during greenschist-grade metamorphism and tend to react to albite. In massive granodiorite, this process is incomplete, whereas it is more extensive in foliated granodiorite, where a higher degree of deformation and fluid–rock interaction takes place during metamorphism. This explains the slightly higher porosities in weakly foliated rock when compared to massive granodiorite.
More intense ductile deformation occurred in mylonitic shear zones, which are characterised by systematically lower porosities when compared to massive or weakly foliated granodiorite. This is explained by the intense dynamic recrystallisation, during which the thermodynamically unstable (and therefore porous) magmatic minerals were replaced by a greenschist-grade metamorphic mineral assemblage. Values derived from 14C-PMMA impregnation and resaturation/water content measurement of dried samples are between 0.43 and 0.6 vol.%, which is about 30% less than for the massive to weakly foliated granodiorite studied using the same method.
6.3. In Situ Porosity
The four studied slabs that were impregnated in situ show resin-filled matrix pore spaces over several centimetres away from the injection borehole, in some places up to >15.8 cm, which marked the outer rim of the overcore. This observation demonstrates that the matrix has a connected pore network under in situ stress conditions, and this also means that diffusive transport of contaminants between the fracture- and matrix-water reservoirs is a process that needs to be considered when quantifying contaminant migration in crystalline-rock systems (see for example [1,10,34,35]).
Porosity values derived from in situ impregnated rock samples by CNS analyser as well as by infrared absorption provide porosity values in the range of 0.21–0.39 vol.% for massive granodiorite (see Table 5), which are in agreement with earlier in situ data obtained in the same host rock where porosity values between 0.27 and 0.40 vol.% were obtained [22].
Complete resin impregnation of matrix pores is indicated by the fact that the NHC-9 resin used has very low viscosity (<10 mPa·s), very low surface tension, small molecular size of a few nm and hydrophilic nature. Direct evidence for full impregnation is also given by the fact that constant porosity values over the entire rock matrix beyond the mylonite were measured, as well as by SEM examination, where impregnated pores of only several tens of nanometres in size were identified ([22]). These findings were further confirmed by element mapping, where specifically carbon as a major constituent of the resin was traced using energy dispersive X-ray spectroscopy (SEM-EDS) and field emission scanning electron microscopy (FE-SEM). Thus, porosity values determined from in situ resin injection are considered to represent the full in situ porosity.
In situ porosity determinations were performed at different distances (0.08–1.48 m) to a ductile shear-zone and a brittle shear zone that reactivates the former. There are no evident trends in porosity or depth penetration of the resin as a function of distance to the shear zone. It is concluded that deformation along the shear zone did not lead to an enhancement of porosity in its immediate vicinity (damage zone), and that the matrix contains an interconnected pore network irrespective of the proximity of a shear zone (see also [10]).
6.4. Porosity Determined on Samples Impregnated in the Laboratory
Sample drying in the laboratory took weeks to months, depending on sample geometry. The porosity of dried samples was then characterised by replacing air in the pore space by the injection of mercury or by 14C-PMMA impregnation. For massive granodiorite, these porosities were found to be in the range of 1.00–1.10 vol.% and thus systematically higher than those obtained by methods considered to be representative of in situ conditions (Table 5). 14C-PMMA porosity values of weakly foliated granodiorite at surface conditions are clearly increased (0.60–1.00 vol.%) compared to in situ values (0.31–0.46 vol.%). Mean values for porosities representing surface conditions are approximately double those of the porosity derived from in situ impregnated samples. This indicates that rock excavation and sample preparation considerably influence laboratory-derived porosity values (see below).
6.5. Direct Determination of Porosity Created since Core Recovery
One sample impregnated in situ was dried after core excavation, and mercury injection porosity was measured, indicating that there is new, connected pore space of 0.31 vol.% which was generated since core recovery (Table 5). The sum of in situ porosity values and those interpreted as the porosity generated since core recovery results in the same range of porosity values as those derived from dried laboratory samples (“Porosity representative of samples at surface conditions” in Table 5). In principle, the porosity of in situ impregnated samples measured by Hg injection could also be attributed to incomplete impregnation during the in situ experiment. However, this is considered highly unlikely, given the fact that, unlike Hg, the acrylic resin is a wetting, low-viscosity liquid. It is difficult to conceive that Hg accessed pores that were not accessible to the resin.
Comparable observations were made in the same massive granodiorite by [22,28,36], who obtained in situ resin impregnation porosity between 0.27 and 0.44 vol.% and resin impregnation porosity from dried laboratory samples between 0.6 and 0.8 vol.%. A recent in situ experiment in Grimsel granodiorite at the GTS provided in situ 14C-PMMA porosity of about 0.4 vol.%, and the drillcore of the respective injection borehole, impregnated in the laboratory at surface conditions, showed porosity values of about 1.0 vol.%. Samples impregnated in situ were also dried in the laboratory, and porosity values obtained by mercury injection and resaturation/water-content measurements were found to be in the range of 0.51 to 0.68 vol.%. Again, this porosity is interpreted as being created since core recovery.
Porosity created since drilling can be related to stress release of the samples, to the drying process where heating and suction stresses may lead to an increase in porosity, and/or to any kind of damage during sample preparation (e.g., sawing). This additional porosity is expected to take place along existing weak zones within the rock matrix. In the granodiorite matrix, such zones are mainly grain-boundary pores observed around quartz, feldspar and mica grains and crack pores showing both good impregnation with the resin (Figure 5). In situ impregnation with the NHC-9-resin revealed the same types of pores and microstructures as the laboratory impregnation with the 14C-PMMA resin. The effect was more developed in massive granodiorite than in the weakly foliated rock type, which can be related to slightly changed pore geometries due to ductile deformation.
Measurements of acoustic emission and P-wave velocities on drillcores [37] indicate a correlation between in situ stresses (i.e., depth below surface) and the magnitude of new porosity, suggesting that the in situ stress state plays a major role in the formation of artificial porosity. These observations were interpreted as being related to the propagation and opening of grain-boundary pores, and it was found that this relaxation takes places within the first days after core extraction. This discrepancy becomes more significant with sample depth (and therefore higher in situ stress), again indicating that the changes in the stress state, in conjunction with the heating and drying of the sample materials, are important.
6.6. Borehole Disturbed Zone and Sample Size
The in situ porosity profile away from the wall of an injection borehole into matrix rock, as shown in Figure 6, indicates a clear increase in porosity close to the borehole. This increase is only observed in the first sample analysed, covering the distance range of ≤3 mm from the borehole. At larger distances, porosity does not show any clear trend with distance from the borehole. Other effects, such as changes in the existing pore space further away from the injection borehole, were neither observed nor measured. With regard to in situ porosity measurements, these findings indicate that in situ impregnated samples beyond the first 2 to 3 mm from the injection borehole are not significantly influenced by the drilling process.
In the present work, the samples for porosity determination with impregnation techniques cover rock volumes of 50–60 cm3 for NHC-9 resin-impregnated samples and a surface of 15 cm2 for the optical density measurements on 14C-PMMA impregnated rock samples. These sample sizes allow the selection of representative rock volumes in this rock type. However, for the mercury porosimetry, the sample volume is limited to drillcores of 7.8 mm in diameter, which requires careful sample selection and an increased number of measurements on different rock samples. As the granodiorite is either massive or weakly foliated, there is no considerable difference in the heterogeneity of grains size in the vertical and lateral directions.
7. Conclusions
The present study provides porosity values in crystalline rock pertinent to in situ conditions, obtained from a coherent granodioritic rock body at the Grimsel Test Site (GTS) in the Swiss Alps. Matrix rock samples impregnated with resin in situ as well as in the laboratory were studied, and there is direct evidence demonstrating the presence of an interconnected pore network under both in situ stress and surface conditions in the rock matrix. Porosity as well as pore connectivity do not depend on the proximity of the studied samples to a brittle shear zone, meaning that there is no enhancement of porosity due to mechanical damage of the matrix near the shear zone.
Even though there was only a limited number of samples studied in this work, there are clear differences in porosity between the rock types studied (massive granodiorite, weakly foliated granodiorite and mylonite) as well as between methods that represent in situ porosity and methods that were applied on samples at surface condition. The different resin injection porosity determination methods reveal a best estimate for in situ porosity of Grimsel granodiorite of 0.3 vol.% with a variability of about ±0.05 vol.%. Rock deformation influences porosity values in the granodiorite. Massive granodiorite has lower porosity than weakly foliated granodiorite. With ongoing ductile deformation and the formation of mylonite the porosity is reduced again, related to recrystallisation of minerals. Porosity measurements in the Grimsel granodiorite are also affected by sample size due to the presence of highly porous, large feldspar grains, which leads to a local increase in the matrix porosity and has to be considered in the sampling and measurement strategy.
There is also evidence that in situ porosity values are generally lower than values derived with injection methods in the laboratory. The in situ porosity values determined in this study are about half of the porosity values determined on the same type of rock samples through laboratory analyses. This means that porosity quantified by such analyses may not be representative of in situ conditions because artificial pore spaces were created in the samples prior to the laboratory measurements since the time of drillcore recovery. This additional porosity has its origin in the expansion of existing grain-boundary and crack pores.
It is concluded that the interconnected pore network in the rock matrix extends throughout the whole rock body, irrespective of the proximity of a brittle structure. Brittle reactivated shear zones acting as water conducting features in the granodioritic rock body are the main flow paths and thus the main transport paths for contaminants. The mobile water is connected to the pore water in the rock matrix, which represents a major reservoir even in crystalline rocks. Contaminants migrating through shear zones will access the matrix pore space via diffusion, which leads to a dilution and therefore retardation of contaminant transport. However, laboratory measurements may overestimate matrix porosity and therefore the retarding effect of matrix diffusion.
Author Contributions
Conceptualization, A.M. and M.M.; methodology, A.M., M.M., K.O., and M.S.-K.; validation, F.E. and M.L.; formal analysis, A.M., K.O. and M.S.-K.; writing—original draft preparation, A.M.; writing—review and editing, M.M., A.M., K.O., M.S.-K., F.E. and M.L.; supervision, M.M. All authors have read and agreed to the published version of the manuscript.
Funding
CNS analyzer measurements were funded by SNF-R’equip, grant number 51620 and by SNF, grant number 116540.
Acknowledgments
This work was supported by the partners of the Long-Term Diffusion (LTD) experiment at the Grimsel Test Site (GTS): JAEA (Japan), University of Helsinki (Finland), NRI (Czech Republic), AIST (Japan) and Nagra (Switzerland). Gratefully acknowledged are Peter Nyfeler (University of Bern) for his support in the determination of carbon contents for impregnation porosity determination and Michael Plötze (ETHZ) for performing mercury porosity measurements.
Conflicts of Interest
The authors declare no conflict of interest.
References
- OECD-NEA. Radionuclide Retention in Geologic Media. In Proceedings of the Workshop Proceedings, Oskarshamn, Sweden, 7–9 May 2001.
- Mazurek, M.; Jakob, A.; Bossart, P. Solute transport in crystalline rocks at Aspö-I: Geological basis and model calibration. J. Contam. Hydrol. 2003, 61, 157–174. [Google Scholar] [CrossRef]
- Anovitz, L.M.; Cole, D.R. Characterization and Analysis of Porosity and Pore Structures. Rev. Miner. Geochem. 2015, 80, 61–164. [Google Scholar] [CrossRef] [Green Version]
- Waber, H.; Smellie, J. Characterisation of pore water in crystalline rocks. Appl. Geochem. 2008, 23, 1834–1861. [Google Scholar] [CrossRef]
- Waber, H.N.; Gimmi, T.; Smellie, J.A.T. Porewater in the Rock Matrix. Site Descriptive Modelling, SDM Site Forsmark; Svensk Kärnbränslehantering AB, SKB: Stockholm, Sweden, 2009; p. 107. [Google Scholar]
- Waber, H.N.; Gimmi, T.; Smellie, J.A.T. Reconstruction of palaeoinfiltration during the Holocene usingporewater data (Laxemar, Sweden). Geochim. Cosmochim. Acta 2012, 94, 109–127. [Google Scholar] [CrossRef]
- Neretnieks, I. Diffusion in the rock matrix: An important factor in radionuclide retardation? J. Geophys. Res. Space Phys. 1980, 85, 4379–4397. [Google Scholar] [CrossRef] [Green Version]
- Mazurek, M. Geological and hydraulical properties of water-conducting features in crystalline rocks. In Hydrogeology of Crystalline Rocks; Stober, I., Bucher, K., Eds.; Kluwer Academic Publishers: Amsterdam, The Netherlands, 2000; pp. 3–26. [Google Scholar]
- Sardini, P.; Kuva, J.; Siitari-Kauppi, M.; Hellmuth, K.-H.; Paul, S.; Jukka, K.; Marja, S.-K.; Karl-Heinz, H. A simplified simulation approach for estimating crack aperture using 14C-PMMA method. J. Coupled Syst. Multiscale Dyn. 2014, 2, 244–255. [Google Scholar] [CrossRef]
- Eichinger, F.; Gimmi, T.; Möri, A.; Rüedi, J. Profiles of chloride in matrix porewater as natural tracer for matrix diffusion in crystalline rocks. Appl. Geochem. 2020, 118, 104635. [Google Scholar] [CrossRef]
- Kickmaier, W.; Alexander, W.R.; Vomvoris, S.; McKinley, I.G. Grimsel 2000-Status of international projects at the Grimsel Test Site (GTS)—Scientific basis for nuclear waste management 24. In Proceedings of the MRS Symposium Proceedings, Sydney, Australia, 27–31 August 2000; Materials Research Society: Warrendale, PA, USA, 2001; Volume 663, pp. 893–900. [Google Scholar]
- Blechschmidt, I.; Vomvoris, S. Underground Research Facilities and Rock Laboratories for The Development of Geological Disposal Concepts and Repository Systems. Chapter 4.—Geological Repository Systems for Safe Disposal of Spent Nu-Clear Fuels and Radioactive Waste; Woodhead Publishing Series in Energy: Number, 9, Ahn, J., Apted, M.J., Eds.; Woodhead Publishing Limited: Oxford, UK, 2010; pp. 82–118. [Google Scholar]
- Möri, A. GTS Phase VI–Pore Space Geometry (PSG) Experiment. In Situ Impregnation of Matrix Pores in Granitic Rock–Study of A Potential Borehole Disturbed Zone (BDZ); Nagra Arbeitsbericht NAB 05-19, Nagra: Wettingen, Switzerland, 2005. [Google Scholar]
- Diederichs, M.S. Manuel Rocha Medal Recipient Rock Fracture and Collapse Under Low Confinement Conditions. Rock Mech. Rock Eng. 2003, 36, 339–381. [Google Scholar] [CrossRef]
- Winberg, A.; Hermanson, J.; Tullborg, E.-L.; Staub, I. Äspö Hard Rock Laboratory–Long Term Diffusion Experiment: Structural Model of the LTD Site and Detailed Description of the Characteristics of the Experimental Volume Including Target Structure and Rock Section; SKB: Stockholm, Sweden, 2003. [Google Scholar]
- Waber, H.N.; Gimmi, T.; Smellie, J.A.T. Effects of drilling and stress release on transport properties and pore water chemistry of crystalline rocks. J. Hydrol. 2011, 405, 316–332. [Google Scholar] [CrossRef]
- Labhart, T.P. Aarmassiv und Gotthardmassiv. Sammlung Geologischer Führer; Gebrüder Borntraeger: Berlin/Stuttgart, Germany, 1977; p. 173. [Google Scholar]
- Abrecht, J. Geologic units of the Aar massif and their pre-Alpine rock associations: A critical review. Schweiz. Mineral. Petrogr. Mitt. 1994, 74, 5–27. [Google Scholar] [CrossRef]
- Steck, A. The Alpine structures in the central Aar granite of the western part of the Aar massif. Eclogae Geol. Helv. 1968, 61, 19–48. [Google Scholar]
- Meyer, J.; Mazurek, M.; Alexander, W.R. Petrographic and mineralogical characterisation of fault zones AU96 and AU126. Chapter 2. In Grimsel Test Site–Laboratory Investigations in Support of the Migration Ex-Periments. Nagra Technical Report NTB 88-23; Bradbury, M.H., Ed.; Nagra: Wettingen, Switzerland, 1989; Chapter 12. [Google Scholar]
- Bossart, P.; Mazurek, M. Grimsel Test Site–Structural Geology and Water Flow Paths in the Migration Shear Zone. Nagra Technical Report NTB 91-12; Nagra: Wettingen, Switzerland, 1991. [Google Scholar]
- Möri, A.; Schild, M.; Siegesmund, S.; Vollbrecht, A.; Adler, M.; Mazurek, M.; Ota, K.; Haag, P.; Ando, T.; Alexander, W.R. Grimsel Test Site: The Nagra-JAEA In Situ Study of Safety Relevant Radionuclide Retardation In Fractured Crystalline Rock IV: The In Situ Study of Matrix Porosity in the Vicinity of A Water-Conducting Fracture. Nagra Technical Report NTB 00-08; Nagra: Wettingen, Switzerland, 2003. [Google Scholar]
- Montgomery, C.W.; Brace, W.F. Micropores in plagioclase. Contrib. Miner. Pet. 1975, 52, 17–28. [Google Scholar] [CrossRef]
- Chernis, P.J. Comparison of the Pore-Microcrack Structure of Shallow and Deep Samples of the Lac Du Bonnet Granite; Atomic Energy of Canada Limited: Chalk River, ON, Canada, 1984. [Google Scholar]
- Sardini, P.; Siitari-Kauppi, M.; Beaufort, D.; Hellmuth, K.-H. On the connected porosity of mineral aggregates in crystalline rocks. Am. Miner. 2006, 91, 1069–1080. [Google Scholar] [CrossRef]
- Eichinger, F. Matrix pore water–fracture groundwater interaction in crystalline bedrock based on natural tracers: An archive of long-term hydrogeological evolution. Ph.D. Thesis, University of Bern, Bern, Switzerland, 2009. [Google Scholar]
- Möri, A. Diffusion in crystalline rocks: An experimental approach. Ph.D. Thesis, Institute of Geological Sciences, University of Bern, Switzerland, 2009. [Google Scholar]
- Ota, K.; Möri, A.; Alexander, W.; Frieg, B.; Schild, M. Influence of the mode of matrix porosity determination on matrix diffusion calculations. J. Contam. Hydrol. 2003, 61, 131–145. [Google Scholar] [CrossRef]
- Hellmuth, K.-H.; Siitari-Kauppi, M.; Lindberg, A. Study of Porosity and Migration Pathways in Crystalline Rock by Impregnation With 14C-Methyl Methacrylate. J. Contam. Hydrol. 1993, 13, 403–418. [Google Scholar] [CrossRef]
- Hellmuth, K.-H.; Lukarinen, S.; Siitari-Kauppi, M. Rock matrix studies with Carbon-14- Poly-Methyl Methacrylate (PMMA): Method development and applications. Isotopenpraxis Isot. Environ. Health Stud. 1994, 30, 47–60. [Google Scholar] [CrossRef]
- Siitari-Kauppi, M.; Flitsiyan, E.S.; Klobes, P.; Meyer, K.; Hellmuth, K.-H. Progress in physical rock matrix characterization: Structure of the pore space. In Proceedings of the Scientific Basis for Nuclear Waste Management XXI, Materials Research Society Symposium Proceedings, Davos, Switzerland, 28 September–3 October 1997; Volume 506, pp. 671–678. [Google Scholar]
- Voutilainen, M.; Miettinen, A.; Sardini, P.; Parkkonen, J.; Sammaljärvi, J.; Gylling, B.; Selroos, J.-O.; Yli-Kaila, M.; Koskinen, L.; Siitari-Kauppi, M. Characterization of spatial porosity and mineral distribution of crystalline rock using X-ray micro computed tomography, C-14-PMMA autoradiography and scanning electron microscopy. Appl. Geochem. 2019, 101, 50–61. [Google Scholar] [CrossRef]
- Bonnet, M.; Sardini, P.; Billon, S.; Siitari-Kauppi, M.; Kuva, J.; Fonteneau, L.; Caner, L. Determining Crack Aperture Distribution in Rocks Using the 14C-PMMA Autoradiographic Method: Experiments and Simulations. J. Geophys. Res. Solid Earth 2020, 125, e2019JB018241. [Google Scholar] [CrossRef]
- Jokelainen, L.; Meski, T.; Lindberg, A.; Soler, J.M.; Siitari-Kauppi, M.; Martin, A.; Eikenberg, J. The determination of 134Cs and 22Na diffusion profiles in granodiorite using gamma spectroscopy. J. Radioanal. Nucl. Chem. 2012, 295, 2153–2161. [Google Scholar] [CrossRef]
- Kuva, J.; Sammaljärvi, J.; Parkkonen, J.; Lehtonen, M.; Turpeinen, T.; Timonen, J.; Voutilainen, M.; Siitari-Kauppi, M. Imaging connected porosity of crystalline rock by contrast agent-aided X-ray microtomography and scanning electron microscopy. J. Microsc. 2017, 270, 98–109. [Google Scholar] [CrossRef] [PubMed] [Green Version]
- Kelokaski, M.; Siitari-Kauppi, M.; Kauppi, I.; Hellmuth, K.-H.; Möri, A.; Biggin, C.; Kickmaier, W.; Inderbitzin, L.; Martin, A.J. Characterisation of Pore Space Geometry by 14C-PMMA Impregnation; Nagra Technical Report Series, NTB 05-03; Nagra: Wettingen, Switzerland, 2010. [Google Scholar]
- Montoto, M. Petrophysics at the Rock Matrix Scale: Hydraulic Properties and Petrographic Interpretation; Publicaciones Técnicas 11/2003; IAEA: Vienna, Austria, 2003. [Google Scholar]
Figure 1.
Mylonitic shear zone within granodioritic matrix. The yellow area indicates the resin-filled fracture porosity generated by brittle deformation and enhanced by the drilling process.
Figure 1.
Mylonitic shear zone within granodioritic matrix. The yellow area indicates the resin-filled fracture porosity generated by brittle deformation and enhanced by the drilling process.

Figure 2.
Set-up of the resin-injection borehole with matrix- and shear zone section and localisation of impregnated rock samples (S-1 to S-4).
Figure 2.
Set-up of the resin-injection borehole with matrix- and shear zone section and localisation of impregnated rock samples (S-1 to S-4).

Figure 3.
Correlation of weighed resin mass with CNS-peak areas derived from granodiorite-resin mixtures and pure NHC-9 resin standards (standard measurements and regression lines).
Figure 3.
Correlation of weighed resin mass with CNS-peak areas derived from granodiorite-resin mixtures and pure NHC-9 resin standards (standard measurements and regression lines).

Figure 4.
Slab surfaces of in situ impregnated matrix rock photographed under UV light (diameter of slab: 28 cm).
Figure 4.
Slab surfaces of in situ impregnated matrix rock photographed under UV light (diameter of slab: 28 cm).

Figure 5.
Micrograph of in situ impregnated matrix rock under crossed polars at daylight (a) and under UV light (b) showing a connected pore network of grain-boundary pores (Gbp) around quartz (Qz) and feldspar grains (Fsp), solution pores (Sp) within the feldspar and crack pores (Cp).
Figure 5.
Micrograph of in situ impregnated matrix rock under crossed polars at daylight (a) and under UV light (b) showing a connected pore network of grain-boundary pores (Gbp) around quartz (Qz) and feldspar grains (Fsp), solution pores (Sp) within the feldspar and crack pores (Cp).

Figure 6.
Porosity profile in matrix rock away from the borehole wall based on in situ resin impregnation.
Figure 6.
Porosity profile in matrix rock away from the borehole wall based on in situ resin impregnation.

Figure 7.
Photograph of a 14C-PMMA-impregnated sample surface of sample P-2 (a) with the corresponding autoradiograph (b). Sample width: 4.3 cm.
Figure 7.
Photograph of a 14C-PMMA-impregnated sample surface of sample P-2 (a) with the corresponding autoradiograph (b). Sample width: 4.3 cm.

Figure 8.
14C-PMMA porosity profile away from a shear zone into mylonitic wallrock (M) and massive granodiorite.
Figure 8.
14C-PMMA porosity profile away from a shear zone into mylonitic wallrock (M) and massive granodiorite.


Table 1.
In situ impregnation porosity data obtained from CNS analyser.
| Slab | Sub-Sample | Distance to Shear Zone | Sample Description | Porosity | σporosity * | Mean Porosity | σporosity ** |
|---|---|---|---|---|---|---|---|
| [cm] | [vol.%] | [vol.%] | [vol.%] | [vol.%] | |||
| S-1 | S1-1 | Granodiorite, weakly foliated | 0.30 | 0.02 | 0.31 | 0.01 | |
| S1-2 | 8 | 0.32 | 0.01 | ||||
| S1-3 | 0.30 | 0.03 | |||||
| S-2 | S2-1 | Granodiorite, massive | 0.31 | 0.02 | 0.31 | 0.10 | |
| S2-2 | 32 | 0.42 | 0.04 | ||||
| S2-3 | 0.21 | 0.001 | |||||
| S-3 | S3-1 | Granodiorite, massive | 0.22 | 0.01 | 0.21 | 0.01 | |
| S3-2 | 72 | 0.20 | 0.01 | ||||
| S3-3 | 0.22 | 0.01 | |||||
| S-4 | S4-1 | Granodiorite, weakly foliated | 0.48 | 0.05 | 0.46 | 0.04 | |
| S4-2 | 148 | 0.48 | 0.03 | ||||
| S4-3 | 0.40 | 0.11 |
* Standard deviation of 3–5 measurements conducted on aliquots of rock powder from the same sub-sample (analytical error). ** Standard deviation of three sub-samples (error related to heterogeneity).
Table 2.
Porosity based on infrared absorption along a small-scale profile.
| Distance from Borehole Wall | Sample Description | Porosity | σporosity * |
|---|---|---|---|
| [mm] | [vol.%] | [vol.%] | |
| 1 | 0.59 | 0.03 | |
| 3 | Granodiorite, massive | 0.30 | 0.03 |
| 5 | 0.36 | 0.02 | |
| 7 | 0.39 | 0.03 | |
| 9 | 0.38 | 0.02 | |
| 11 | 0.33 | 0.02 | |
| 13 | 0.31 | 0.02 | |
| 15 | 0.29 | 0.02 | |
| 17 | 0.22 | 0.02 | |
| 19 | 0.25 | 0.03 |
* Standard deviation of three measurements conducted on aliquots of rock powder from the same sample.
Table 3.
Summary of 14C-PMMA porosity data from drillcore samples (error ±10% relative).
| Sample | Sample Description | Bulk Porosity | Area for Bulk Porosity | Porosity of Single Feldspar Grains |
|---|---|---|---|---|
| [vol.%] | [cm2] | [vol.%] | ||
| P-1 | Granodiorite, weakly foliated | 0.8 | 4.4 | 1.7; 2.2 * |
| P-2 | Granodiorite, weakly foliated | 0.7 | 2.3 | - |
| Granodiorite, weakly foliated incl. large feldspar grain | 1.0 | 6.2 | 2.5 | |
| P-3 | Granodiorite, massive | 1.1 | 7.7 | 1.5 * |
| Granodiorite, massive | 1.0 | 3.2 | - | |
| P-4 | Granodiorite, weakly foliated incl. large feldspar grain | 0.8 | 6.1 | 2.3 |
| Granodiorite, weakly foliated | 0.7 | 4.2 | - | |
| Granodiorite, weakly foliated | 0.6 | 2.9 | - |
* not taken into account for bulk porosity determination.
Table 4.
Porosity derived from mercury porosimetry.
| Sample | Sample Description | Sample Volume | Porosity | Porosity Determined on In Situ Impregnated Sample |
|---|---|---|---|---|
| [g] | [vol.%] | [vol.%] | ||
| S-1 | Granodiorite, massive | 6.2 | 0.75 | - |
| S-1i | Granodiorite, massive; in situ impregnated | 6.1 | - | 0.31 |
| M | Mylonite from shear zone | 7.1 | 0.43 | - |
Table 5.
Summary and integration of measured porosity values.
| Method | Lithology | Porosity [vol.%] and Interpretation of Measurements | ||
|---|---|---|---|---|
| In Situ Porosity | Porosity Representative of Samples at Surface Conditions | Porosity Created since Core Recovery | ||
| In situ impregnation, porosity obtained from C-analysis by CNS analyser | Granodiorite, massive | 0.21–0.31 | - | - |
| Granodiorite, weakly foliated | 0.31–0.46 | - | - | |
| In situ impregnation, porosity obtained from C-analysis by infrared absorption | Granodiorite, massive | 0.22–0.39 | - | - |
| 14C-PMMA | Granodiorite, massive | - | 1.00–1.10 | - |
| Granodiorite, weakly foliated | - | 0.60–1.00 | - | |
| Mylonite | - | 0.45–0.70 | - | |
| Mercury injection | Granodiorite, massive | - | 0.75 | 0.31 |
| Mylonite | - | 0.43 | - | |
Publisher’s Note: MDPI stays neutral with regard to jurisdictional claims in published maps and institutional affiliations. |
© 2021 by the authors. Licensee MDPI, Basel, Switzerland. This article is an open access article distributed under the terms and conditions of the Creative Commons Attribution (CC BY) license (https://creativecommons.org/licenses/by/4.0/).
Share and Cite
MDPI and ACS Style
Möri, A.; Mazurek, M.; Ota, K.; Siitari-Kauppi, M.; Eichinger, F.; Leuenberger, M. Quantifying the Porosity of Crystalline Rocks by In Situ and Laboratory Injection Methods. Minerals 2021, 11, 1072. https://doi.org/10.3390/min11101072
AMA Style
Möri A, Mazurek M, Ota K, Siitari-Kauppi M, Eichinger F, Leuenberger M. Quantifying the Porosity of Crystalline Rocks by In Situ and Laboratory Injection Methods. Minerals. 2021; 11(10):1072. https://doi.org/10.3390/min11101072
Chicago/Turabian StyleMöri, Andreas, Martin Mazurek, Kunio Ota, Marja Siitari-Kauppi, Florian Eichinger, and Markus Leuenberger. 2021. "Quantifying the Porosity of Crystalline Rocks by In Situ and Laboratory Injection Methods" Minerals 11, no. 10: 1072. https://doi.org/10.3390/min11101072
Note that from the first issue of 2016, this journal uses article numbers instead of page numbers. See further details here.